journal of geophysical research: planets
TRANSCRIPT
Lunar Cold Spots and Crater Production on the MoonJ.-P. Williams1 , J. L. Bandfield2 , D. A. Paige1, T. M. Powell1, B. T. Greenhagen3, S. Taylor1,P. O. Hayne4, E. J. Speyerer5, R. R. Ghent6, and E. S. Costello7,8
1Earth, Planetary, and Space Sciences, University of California, Los Angeles, CA, USA, 2Space Science Institute, Boulder, CO, USA,3Applied Physics Laboratory, Johns Hopkins University, Laurel, MD, USA, 4Department of Astrophysical & Planetary Sciences,University of Colorado, Boulder, Boulder, CO, USA, 5School of Earth and Space Exploration, Arizona State University, Tempe, AZ,USA, 6Earth Sciences, University of Toronto, Toronto, ON, Canada, 7Department of Geology and Geophysics, University ofHawai’i at Mānoa, Honolulu, HI, USA, 8Hawaii Institute of Geophysics and Planetology, Honolulu, HI, USA
Abstract Mapping of lunar nighttime surface temperatures has revealed anomalously low nighttimetemperatures around recently formed impact craters on the Moon. The thermophysically distinct “coldspots” provide a way of identifying the most recently formed impact craters. Over 2,000 cold spot sourcecraters were measured with diameters ranging from 43 m to 2.3 km. Comparison of the crater size-frequencydistribution with crater chronology models and crater counts of superposed craters on the ejecta of thelargest cold spot craters constrains the retention time of the cold spots to no more than ~0.5–1.0 Myr withsmaller cold spots possibly retained for only few hundred kyr. This would suggest a relatively rapid impactgardening rate with regolith overturn depths exceeding ~5 cm over this time scale. We observe alongitudinal heterogeneity in the cold spot distribution that reflects the Moon’s synchronous rotation with ahigher density of cold spots at the apex of motion. The magnitude of the asymmetry indicates the cratersformed from a population of objects with low mean encounter velocities ~8.4 km/s. The larger cold spots(D > 800 m) do not follow this trend, and are concentrated on the trailing farside. This could result from ashorter retention time for larger cold spots on the leading hemisphere due to the greater number of smaller,superposed impacts. Alternatively, the abundance of large cold spots on the trailing farside resultedfrom a swarm of 100-m-scale impactors striking the Moon within the last ~0.5 Myr.
Plain Language Summary Impact craters on the Moon modify the surfaces around them, resultingin patches of colder nighttime surface temperatures. These “cold spots” fade over time. Using the coldspots as markers to identify the most recent impacts that have occurred on the Moon, we measured thediameters of all the craters with cold spots. Comparing the population of these craters with the expectedimpact rate, we estimate that the cold spots fade over a few hundred thousand years. The cold spots are alsoconcentrated on the western hemisphere due to the Moon’s synchronous rotation where the westernhalf of the Moon always faces toward the direction of motion of the Moon orbiting the Earth. This suggeststhat a relatively slow population of objects impacted the Moon in the last few hundred thousand years.The largest cold spots, however, are concentrated on the trailing hemisphere. This could result either frommore small impacts on the leading hemisphere destroying larger cold spots and leaving a highernumber of large cold spots on the trailing hemisphere, or a swarm of 100-m-sized objects colliding on thetrailing side during this time period.
1. Introduction
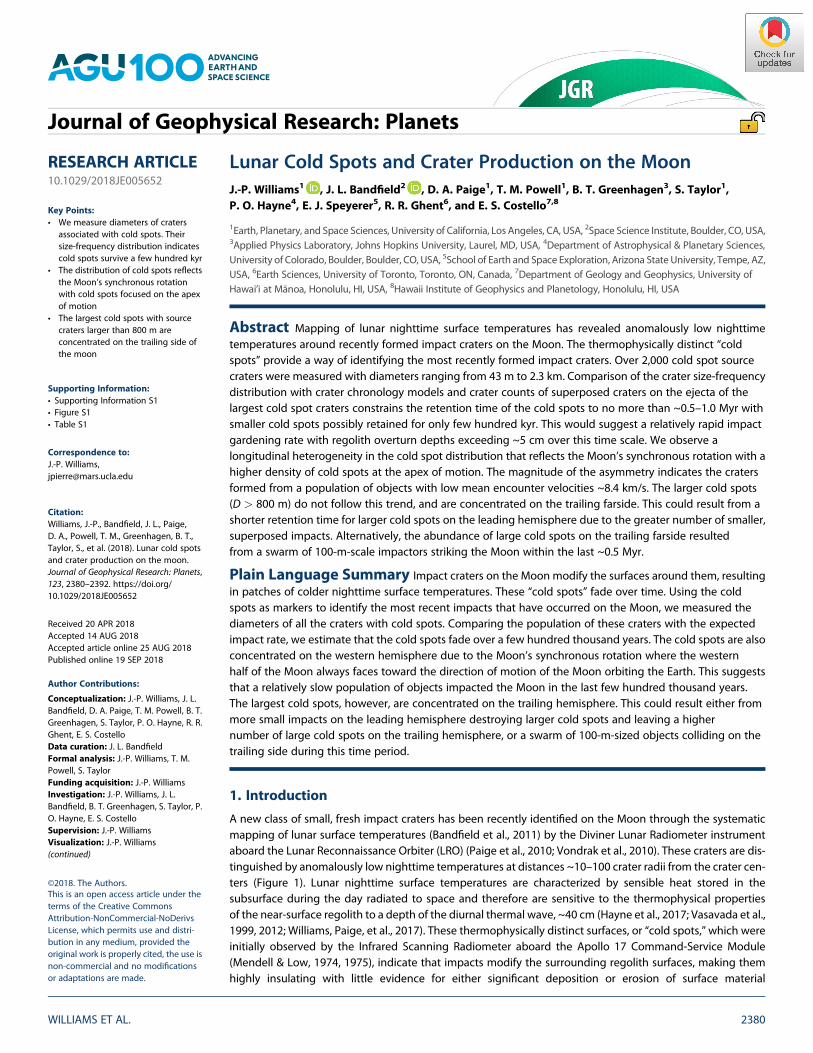
A new class of small, fresh impact craters has been recently identified on the Moon through the systematicmapping of lunar surface temperatures (Bandfield et al., 2011) by the Diviner Lunar Radiometer instrumentaboard the Lunar Reconnaissance Orbiter (LRO) (Paige et al., 2010; Vondrak et al., 2010). These craters are dis-tinguished by anomalously low nighttime temperatures at distances ~10–100 crater radii from the crater cen-ters (Figure 1). Lunar nighttime surface temperatures are characterized by sensible heat stored in thesubsurface during the day radiated to space and therefore are sensitive to the thermophysical propertiesof the near-surface regolith to a depth of the diurnal thermal wave, ~40 cm (Hayne et al., 2017; Vasavada et al.,1999, 2012; Williams, Paige, et al., 2017). These thermophysically distinct surfaces, or “cold spots,”which wereinitially observed by the Infrared Scanning Radiometer aboard the Apollo 17 Command-Service Module(Mendell & Low, 1974, 1975), indicate that impacts modify the surrounding regolith surfaces, making themhighly insulating with little evidence for either significant deposition or erosion of surface material
WILLIAMS ET AL. 2380
Journal of Geophysical Research: Planets
RESEARCH ARTICLE10.1029/2018JE005652
Key Points:• We measure diameters of craters
associated with cold spots. Theirsize-frequency distribution indicatescold spots survive a few hundred kyr
• The distribution of cold spots reflectsthe Moon’s synchronous rotationwith cold spots focused on the apexof motion
• The largest cold spots with sourcecraters larger than 800 m areconcentrated on the trailing side ofthe moon
Supporting Information:• Supporting Information S1• Figure S1• Table S1
Correspondence to:J.-P. Williams,[email protected]
Citation:Williams, J.-P., Bandfield, J. L., Paige,D. A., Powell, T. M., Greenhagen, B. T.,Taylor, S., et al. (2018). Lunar cold spotsand crater production on the moon.Journal of Geophysical Research: Planets,123, 2380–2392. https://doi.org/10.1029/2018JE005652
Received 20 APR 2018Accepted 14 AUG 2018Accepted article online 25 AUG 2018Published online 19 SEP 2018
Author Contributions:
Conceptualization: J.-P. Williams, J. L.Bandfield, D. A. Paige, T. M. Powell, B. T.Greenhagen, S. Taylor, P. O. Hayne, R. R.Ghent, E. S. CostelloData curation: J. L. BandfieldFormal analysis: J.-P. Williams, T. M.Powell, S. TaylorFunding acquisition: J.-P. WilliamsInvestigation: J.-P. Williams, J. L.Bandfield, B. T. Greenhagen, S. Taylor, P.O. Hayne, E. S. CostelloSupervision: J.-P. WilliamsVisualization: J.-P. Williams(continued)
©2018. The Authors.This is an open access article under theterms of the Creative CommonsAttribution-NonCommercial-NoDerivsLicense, which permits use and distri-bution in any medium, provided theoriginal work is properly cited, the use isnon-commercial and no modificationsor adaptations are made.
(Bandfield et al., 2014). Cold spots appear to be common to all recent impacts and degrade relatively rapidlyin the lunar space environment. Therefore, cold spots provide a means of uniquely identifying the mostrecent impact craters on the Moon, and thus yield information on the recent production of lunar impactcraters.
2. Data and Methods
Cold spots were identified and cataloged by Bandfield et al. (2014) using 128-ppd rock-free nighttimeregolith temperature maps (Bandfield et al., 2011) derived from gridded brightness temperatures ofDiviner’s thermal infrared spectral observations (Williams et al., 2016). Cold spot identification was lim-ited to latitudes equatorward of ±50° as sloped surfaces at high latitudes, especially in the highlandterrains, have significant temperature variations resulting from variable solar heating of the surface thatrender the identification of cold spots difficult. We surveyed this catalog containing 2,060 cold spotlocations for source craters. A total of 2,282 craters associated with cold spots were identified including222 new cold spots that were not in the Bandfield et al. (2014) study (Table S1). The crater diameterswere measured using Lunar Reconnaissance Orbiter Camera (LROC) Narrow Angle Camera (NAC) andWide-Angle Camera (WAC) images (Robinson et al., 2010). Approximately 6.7% of the craters eitherlacked NAC coverage or existing NAC images possessed low incidence angles, making the locationof the crater rim difficult to discern within the immature, high reflectance material excavated by theimpact event. Crater diameter estimates in these locations were based on WAC images or constrainedbased on the areal extent of the bright, immature regolith. Additionally, five cold spots, representing0.22% of the cold spots surveyed, had potential source craters entirely within shadowed areas withinNAC images and could not be directly measured. These craters were too small to be reliably identifiedin WAC images and were approximated indirectly from the size of their cold spot assuming their coldspot extended 20 crater radii from the crater. The results are insensitive to these craters as they arefew in number and small in size.
Since the initial survey of cold spots published by Bandfield et al. (2014), Hayne et al. (2017) have globallymapped the thermophysical properties of the regolith fines of the Moon at 128 ppd, showing spatial varia-tions. Modeling by Vasavada et al. (2012) found that the cooling rate of nighttime brightness temperaturesobserved by Diviner were closely fit with an exponentially increasing density and thermal conductivity withdepth characterized by an average e-folding scale H~6 cm where the density with depth z is modeled as
ρ(z) = ρd � (ρd � ρs)e�z/H, where ρs is the density at the surface and ρd is the density at depth z ≫ H.
Mapping of variations in the modeled H parameter value by Hayne et al. (2017) showed local and regionaldifferences in regolith properties where lower values of H indicate a regolith column with higher thermalinertia material closer to the surface and a higher H values indicate more insulating material near the surface.The model included a slope correction to account for the influence of topography on temperatures, and as aresult, the H parameter mapping reveals the cold spots in greater detail than the regolith temperatures. Forthis reason, we additionally use this map to survey the largest population of cold spots with sourcecraters D ≥ 800 m.
The formation ages of the large craters were constrained using crater counts of the smaller crater populationssuperposed on their continuous ejecta. Counts were conducted using Arcmap with the Cratertools plugin(Kneissel et al., 2011). LROC NAC images were calibrated and map-projected using ISIS (IntegratedSoftware for Imagers and Spectrometers) with appropriate incidence angles for measuring crater diameterswhere optimal incidence angles are ~58° to ~77° (e.g., Antonenko et al., 2013; Ostrach et al., 2011). Because ofthe relatively young age of the ejecta, only craters with diameters generally no larger than a few tens ofmeters have had time to accumulate. The Neukum production function (NPF) (Neukum et al., 2001) onlyextends down to 10 m, and we therefore use the Williams et al. (2014) production function to derive modelages for the craters with the Craterstats2 program (Michael & Neukum, 2010) used to bin and fit to the cratersize-frequency distributions (CSFDs). Williams et al. (2014) modeled lunar crater production down to a meterusing the observed flux of objects colliding with the terrestrial atmosphere reported by Brown et al. (2002)and found model ages comparable to Neukum et al. (2001) with differences between the absolute modelages <15% for young surfaces.
10.1029/2018JE005652Journal of Geophysical Research: Planets
WILLIAMS ET AL. 2381
Writing - original draft: J.-P. WilliamsWriting – review & editing: J. L.Bandfield, D. A. Paige, T. M. Powell, P. O.Hayne, R. R. Ghent, E. S. Costello
3. Cold Spot Crater Population
Cold spot source craters have diameters ranging from 43 to 2,315 m (Figure 2). The CSFD of the total popula-tion (Figure 3) does not generally conform to the model Neukum production function (Neukum et al., 2001)with no single crater-age isochron describing the entire range of diameters. Diameters between 300 and800 m are well approximated by an ~150-ka age isochron. Below D~300 m, the CSFD power law slope shal-lows with respect to the NPF and decreases substantially below D~100 m. Above D~800 m, craters are morenumerous than predicted by a 150-ka isochron.
There is no indication that any of the cold spots result from secondary impacts. The source craters appear asfresh, isolated craters with no clustering or alignment and lack any of the morphologic features typically asso-ciated with secondary cratering such as shallow, irregular shapes, or asymmetric ejecta patterns in radialalignment with a primary source crater (McEwen & Bierhaus, 2006; Oberbeck & Morrison, 1973;Shoemaker, 1962).
The density of cold spots that have been identified diminishes with increasing latitude. The number ofimpacts is predicted to decline with latitude due to a higher probability of low inclination encounters, though
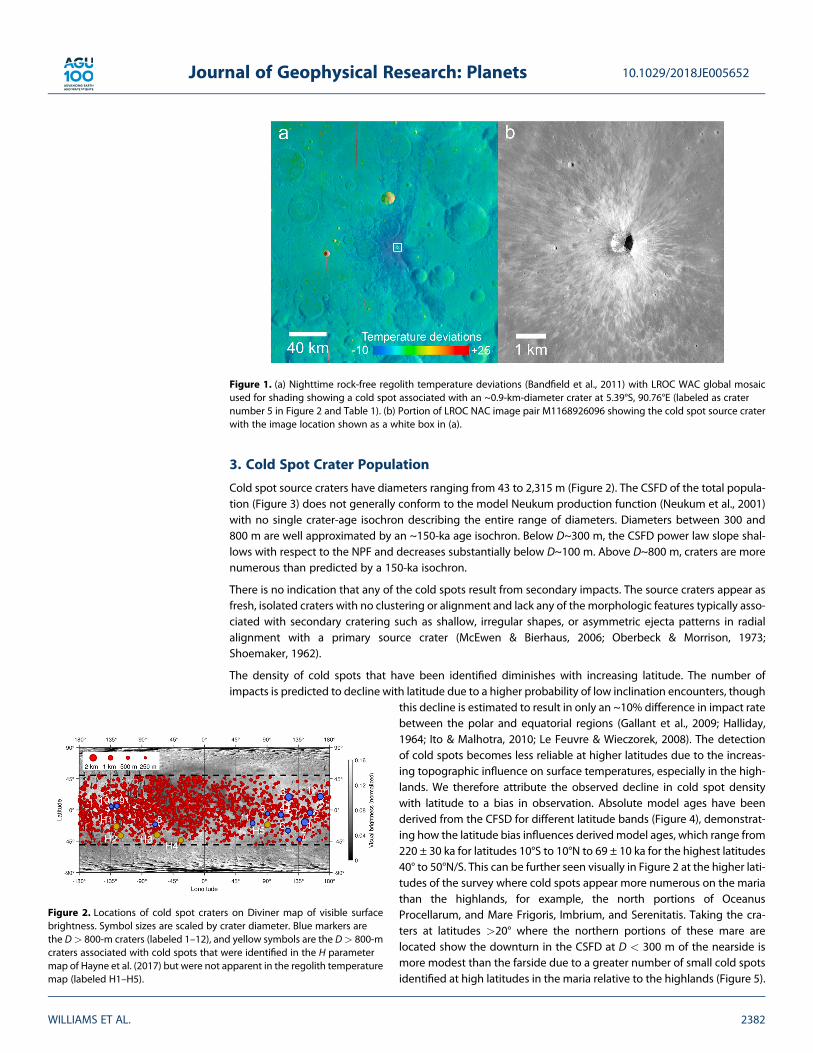
this decline is estimated to result in only an ~10% difference in impact ratebetween the polar and equatorial regions (Gallant et al., 2009; Halliday,1964; Ito & Malhotra, 2010; Le Feuvre & Wieczorek, 2008). The detectionof cold spots becomes less reliable at higher latitudes due to the increas-ing topographic influence on surface temperatures, especially in the high-lands. We therefore attribute the observed decline in cold spot densitywith latitude to a bias in observation. Absolute model ages have beenderived from the CFSD for different latitude bands (Figure 4), demonstrat-ing how the latitude bias influences derivedmodel ages, which range from220 ± 30 ka for latitudes 10°S to 10°N to 69 ± 10 ka for the highest latitudes40° to 50°N/S. This can be further seen visually in Figure 2 at the higher lati-tudes of the survey where cold spots appear more numerous on the mariathan the highlands, for example, the north portions of OceanusProcellarum, and Mare Frigoris, Imbrium, and Serenitatis. Taking the cra-ters at latitudes >20° where the northern portions of these mare arelocated show the downturn in the CSFD at D < 300 m of the nearside ismore modest than the farside due to a greater number of small cold spotsidentified at high latitudes in the maria relative to the highlands (Figure 5).
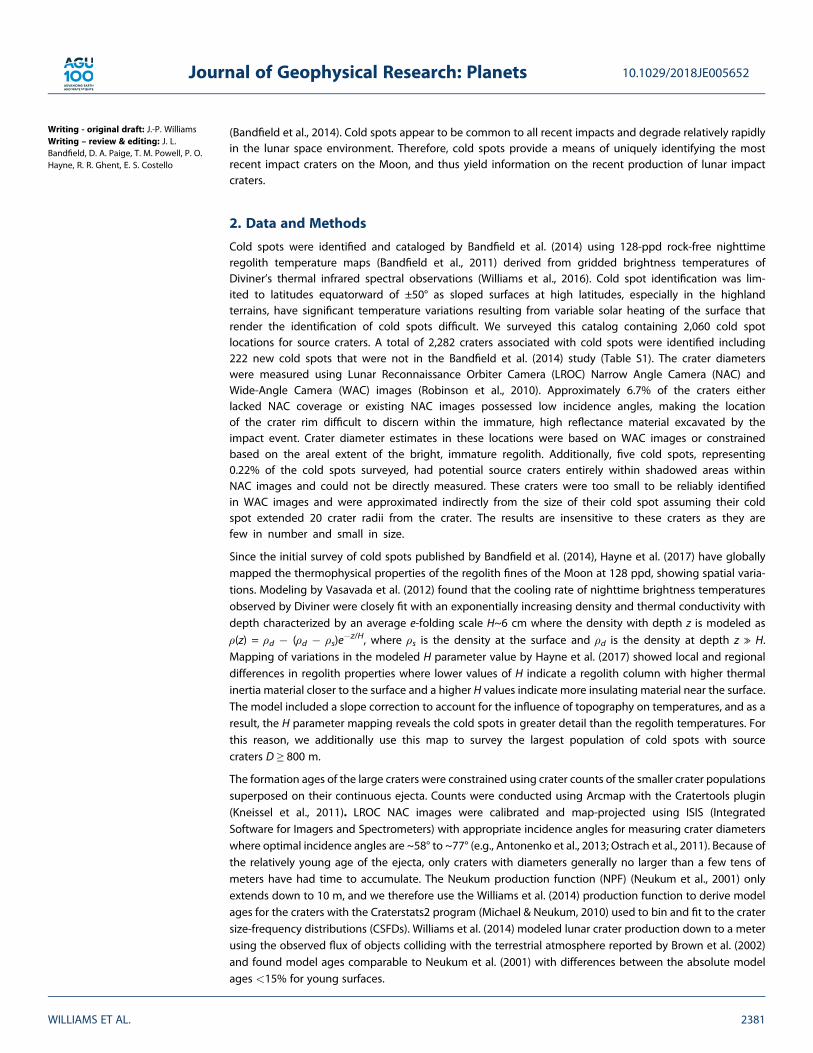
Figure 2. Locations of cold spot craters on Diviner map of visible surfacebrightness. Symbol sizes are scaled by crater diameter. Blue markers arethe D> 800-m craters (labeled 1–12), and yellow symbols are the D> 800-mcraters associated with cold spots that were identified in the H parametermap of Hayne et al. (2017) but were not apparent in the regolith temperaturemap (labeled H1–H5).
Figure 1. (a) Nighttime rock-free regolith temperature deviations (Bandfield et al., 2011) with LROC WAC global mosaicused for shading showing a cold spot associated with an ~0.9-km-diameter crater at 5.39°S, 90.76°E (labeled as craternumber 5 in Figure 2 and Table 1). (b) Portion of LROC NAC image pair M1168926096 showing the cold spot source craterwith the image location shown as a white box in (a).
10.1029/2018JE005652Journal of Geophysical Research: Planets
WILLIAMS ET AL. 2382

This suggests that the greater topographic variability of the highlandsmakes detection of smaller cold spots more difficult at higher latitudesrelative to the maria and further suggest that the downturn in the CSFDis a result of incomplete cold spot detection at smaller sizes.
Additional heterogeneities are observed in the distribution of cold spots.In addition to the variation with latitude discussed above, the density ofcold spots varies with longitude (Figure 6) with a maximum around90°W and a minimum around 90°E. These longitudes correspond to thecenters of the leading and trailing hemispheres, respectively (apex andantapex of motion) for the synchronously rotating Moon. The cold spotdensity declines with angular distance from the apex and the relativechange in density is approximated by a best fit sinusoid[1 + 0.125cos(β)]2.74, a relationship derived by Zahnle et al. (2001) for a syn-chronous moon in an isotropic impactor population where β is the angulardistance from the apex.
The largest cold spot craters, however, do not follow this trend, but insteadshow a higher abundance of craters D > 800 m on the farside of the trail-ing hemisphere. The survey of cold spots found 12 source cratersD > 800 m with all but three occurring between 65°E and 180°E (labeled1–12 in Figure 2). An equatorial survey (±10° latitude) of cold spots by
Powell et al. (2018), using the H parameter map of Hayne et al. (2017), found a greater number of cold spotsthan identified by regolith nighttime temperatures alone. Cold spots with more subtle temperature contrastsare more apparent in the H parameter map (Powell et al., 2018) in part, because the H parameter map has theinfluence of slopes modeled out, and as a result, cold spots stand out against the background more clearly,especially at higher latitudes. We therefore additionally surveyed the H parameter map between ±50° lati-tude for all cold spots with source craters D ≥ 800 m. This revealed an additional five cold spots that arenot identifiable in nighttime regolith temperatures. The temperature anomalies of these craters are small,all with a temperature contrast of less than 2.5 K from the background; however, cold slopes in the surround-ing areas vary ~4–10 K, and therefore, these cold spots are only apparent in the H parameter map. These cra-ters are denoted in Figure 2 by yellow markers and labeled H1–H5.
The cold spot CSFD overlaps the NPF for surface ages of several hundred ka (Figures 3 and 4), providing anestimate of the length of time cold spots endure. The crater counts on the ejecta of the largest cold spotsource craters (D > 800 m) further constrain the ages of cold spots. Counts were conducted on the ejectaon all but two craters (numbered 8 and 10 in Figure 2) as these craters occur on the inner walls of larger cra-ters where slopes are high and crater counts could not be reliably conducted. The absolute model ages are
Figure 3. (a) The CSFD of the survey of source craters of cold spots identifiedin the regolith temperature map of Bandfield et al. (2011). (b) The CSFD of thesurvey excluding longitudes 65°E–180°E where the majority of large coldspots occur. The gray curve is the Neukum production function (Neukumet al., 2001) for a 150-ka age surface.
Figure 4. The CSFD of cold spot craters for latitudes. (a) 0°–10°N/S. (b) 10°–20°N/S. (c) 20°–30°N/S. (d) 30°–40°N/S. (e) 40°–50°N/S. The model ages for cratersD > 300 m for each latitude range (color curves) and 10-ka, 100-ka, and 1-Ma model age isochrons (gray curves) using the NPF are shown.
10.1029/2018JE005652Journal of Geophysical Research: Planets
WILLIAMS ET AL. 2383

summarized in Table 1 and Figures 7 and S1 and vary between 220 ka and1.3 Ma. Seven of the 10 large cold spots identified in the nighttime regolithtemperature map are younger than 500 ka. The five cold spots that werenot apparent in the regolith temperature map, but were identified usingthe H parameter map, are all older than 500 ka. Evidence of self-secondarycratering has been noted (Williams, van der Bogert, et al., 2018; Zanettiet al., 2017) and we were careful to avoid areas where craters were clus-tered and/or appeared as part of a boulder track, that is, a linear distribu-tion of craters, often elliptical, aligned downslope. The inclusion ofunknown self-secondaries would increase the apparent age, and as such,these ages would represent an upper limit.
4. Discussion4.1. Cold Spot CSFD
Cosmic-ray exposure ages of Apollo 16 samples constrain the age of SouthRay crater (D = 680 m) to 2 ± 0.2 Ma (Drozd et al., 1974; Eugster, 1999;Stöffler & Ryder, 2001). South Ray crater does not have a definitive coldspot associated with it, providing evidence that cold spots do not survivebeyond this age and are relatively ephemeral features on the lunar surface.Applying the idealized crater retention age to the cold spot source craterdistribution provides an estimate of the typical retention time of the coldspots detectible in the regolith nighttime temperature data. Diametersbetween 300 and 800 m are well approximated by a 150-ka isochron,though, as noted in section 3, using only the craters within ±10° of theequator where the observations are not biased by latitude, and therefore,cold spot detection is likely more robust, are better fit by a 220-ka isochron
(Figure 4). Deviations between the measured distribution and the model distributions could indicate varia-tions in retention times for differing cold spot sizes. Additionally, the shallower CSFD slope observed at smal-
ler diameters may result from the incomplete identification of cold spots atsmaller sizes as the ability to discern cold spots from slope effects andother temperature heterogeneities becomes more difficult as notedabove, or there may be additional factors in cold spot formation at smallerimpact energies that influence the expression of cold spots and the mag-nitude of the associated thermal anomalies (i.e., a lower limit to cold spotformation). The apparent increase in crater abundance above that pre-dicted by the NPF for diameters above ~800 m results from a populationof larger craters in the eastern hemisphere farside (Figure 2). The CSFDof the cold spot craters excluding longitudes 65°E–180°E are betterapproximated by a single isochron for all diameters ≳300 m (Figure 3b).
New impacts that have formed during the lifetime of the LROmission havebeen detected by LROC NAC temporal (“before and after”) image pairs(Speyerer et al., 2016). The number of new craters with diameters ≥10 mis modestly higher (33%) than the rate of crater production predicted bythe NPF, but well within the uncertainty often ascribed to the crater age-dating technique (see recent papers by Fassett, 2016; Hartmann &Daubar, 2017; Williams, van der Bogert, et al., 2018, and referencestherein). Broad zones of reflectance changes associated with the fresh cra-ters may be related to surface-bound jetting processes and extend fromtheir source craters at a similar scale to cold spots observed at larger sizesresolvable by the Diviner instrument. It is important to note that thesereflectance changes are only visible in “phase ratio” images formed bycomparing before and after images with specific geometry; therefore,the reflectance changes associated with these extended zones are not
Figure 5. The CSFDs of cold spot craters for latitudes >20°N split into near-side and farside populations.
Figure 6. Distribution of the relative cold spot crater density as a function ofangular distance from the apex of lunar orbital motion for the nearside(circles) and farside (triangles). The density of craters averaged over anangular distance of 30° is plotted every 10°. Solid curve is a least squares fitsinusoid [1 + 0.125cos(β)]2.74 And dashed gray curve is the predictedrelative cratering rate for crater diameters larger than 1 km of Le Feuvre andWieczorek (2011) for the entire moon.
10.1029/2018JE005652Journal of Geophysical Research: Planets
WILLIAMS ET AL. 2384

generally identifiable for small craters without preimpact imagery. If thesezones of modified reflectance are related to cold spots, then it implies thatcold spot production does in fact extend to smaller size craters at a ratemore consistent with NPF and the down turn in the cold spot CSFD atsmaller diameters is due to more rapid fading of small cold spots or thereliability of cold spot detection by Diviner diminishing below diameters~300 m (or both).
The smallest cold spot in the survey has a diameter of 43 m. Several of thelargest new craters identified by LROC NAC temporal pairs, diameters 73,50, and 43 m, with before and after Diviner coverage show the appearanceof cold spots associated with the formation of these craters (Figure 8).Several smaller new craters with diameters 35, 34, and 30 m, also withbefore and after Diviner coverage, did not have identifiable cold spots,providing an indication that cold spot detection by Diviner is limited tocraters above these sizes. Impact craters generated by the Rangerspacecraft and the Apollo S-IVB boosters have been identified in LROCNAC images, and formed ~15- and ~35-m craters, respectively (Plesciaet al., 2016; Wagner et al., 2017). These did not generate identifiable coldspots. As additional postimpact data are acquired, further analyses ofnew cold spots may enable a better understanding of the temporal
evolution of the smallest cold spots.
4.2. Spatial Distribution
Impacts are expected to preferentially impact on the leading hemisphere of a synchronously rotating satellitewith the highest rate of impacts occurring at the apex of motion at 90°W and the frequency of impacts drop-ping with longitude toward the center of the trailing hemisphere at 90°E (Gallant et al., 2009; Horedt &
Neukum, 1984; Ito & Malhotra, 2010; Le Feuvre & Wieczorek, 2011;Morota & Furumoto, 2003; Morota et al., 2005, 2008; Shoemaker & Wolfe,1982; Wood, 1973; Zahnle et al., 1998, 2001). The magnitude of the asym-metry will depend on the orbital velocity of the satellite relative to themean impactor encounter velocity, and therefore, the leading/trailingasymmetry in the distribution of cold spots has potential implications forthe dynamical origins of the small D = 1–100-m projectiles that createdthem. If the relative velocities between the impactors and the Moon-Earth system are similar, the cratering asymmetry will be morepronounced. The ratio of cold spot craters between the apex and antapexof motion is nearly 2 (Figure 6). This precludes an impactor source popula-tion predominately composed of objects with high encounter velocitiessuch as comets (Hughes & Williams, 2000).
A survey of rayed craters using Clementine 750-nm mosaic images withdiameters 5 km and larger found an apex-antapex ratio of ~1.65 with smal-ler ratios for larger craters (Morota & Furumoto, 2003). Morota et al. (2005),using the approximate analytic cratering asymmetry estimate of Zahnleet al. (2001), inferred impact velocities to be 12–16 km/s from this asym-metry. The larger leading-trailing asymmetry we observe in the cold spotsis similar to the asymmetry identified in the spatial distribution of impactsites determined by Apollo seismic data (1.8 ± 0.5) (Morota et al., 2011),implying even lower average impact velocities of ~8–9 km/s. However,estimates of mean Earth-Moon encounter velocities are higher.Dynamical modeling of near-Earth asteroids predicts impact velocities~19–22 km/s, which results in more modest predicted leading/trailingratios of ~1.3 (Gallant et al., 2009; Ito & Malhotra, 2010; Le Feuvre &Wieczorek, 2011). A more extensive search for rayed craters down to
Figure 7. (a) The absolute model ages derived from crater counts on theejecta of the large (D > 800 m) cold spot craters where blue markers arecold spots observed in regolith nighttime temperatures and yellow markersare cold spots only observed in H parameter maps as in Figure 2 (see alsoTable 1). Error bars are statistical uncertainties in crater counts. Verticaldashed line denotes 0.5-Ma age. (b) Selection of lunar meteorites withavailable ejection ages between 0 and 1.4 Ma (for references, see Lorenzettiet al., 2005).
Table 1Summary of D > 800-m Cold Spot Source Craters (See Figure 2 for MapLocations) With Absolute Model Ages (AMAs) From Williams et al. (2014)
Crater no. Longitude Latitude Diameter (m) Model age (ka)
1 144.40 �17.68 2315 990 ± 402 151.68 �4.08 1442 220 ± 103 121.31 18.68 2112 420 ± 704 109.91 �6.74 1143 480 ± 305 90.76 �5.39 898 230 ± 206 120.12 �29.73 1051 380 ± 407 136.80 �42.16 886 770 ± 608 �70.92 �20.62 1053 -9 �126.00 5.82 1085 420 ± 7010 �134.10 4.60 816 -11 69.14 �18.92 1140 270 ± 2012 166.64 19.38 1714 1100 ± 100H1 �126.64 �23.60 1739 810 ± 80H2 �120.37 �36.75 1538 1200 ± 50H3 �68.07 �35.89 1750 590 ± 40H4 �33.81 �43.62 1277 620 ± 40H5 80.73 �21.09 1670 1300 ± 200
10.1029/2018JE005652Journal of Geophysical Research: Planets
WILLIAMS ET AL. 2385

diameters as small as 500 m found the spatial distribution of rayed crater densities correlate with model-predicted distributions when hemispherically averaged. However, averaging over a 30° window reveals apatchy distribution of crater densities that do not conform well to model predictions, including highercrater densities at high latitudes, contradicting expectations (Werner & Medvedev, 2010).
The slower than predicted impact velocities of<12 km/s implied by the asymmetry of the lunar rayed cratersreported byMorota and Furumoto (2003), led Ito andMalhotra (2010) to speculate that an unobserved slowerthan average population of objects with heliocentric orbits close to the Earth-Moon system may exist. Theasymmetry of the cold spots supports the existence of a population of low-velocity objects with mean velo-cities relative to the Earth of only v∞~5–6 km/s, accounting for the acceleration due to gravity of the Earth-Moon system assuming an escape velocity
vesc ¼ffiffiffiffiffiffiffiffiffiffiffiffiffiffiffiffiffiffiffiffiffiffiffiffiffiffiffiffiffiffiffiffiffiffiffiffiffiffiffiffiffiffi2G
MEarth
DMoonþMMoon
RMoon
� �s(1)
where G is the gravitational constant; MEarth and MMoon are the masses of the Earth and Moon, respectively;DMoon is the lunar distance from Earth; and RMoon is the radius of the Moon. Such slow objects would benearly co-orbiting the Earth, making them potential candidates for in situ resource utilization and suitable tar-gets for NASA’s Asteroid Redirect Mission (ARM) as objects for such missions need to be accessible with lowΔv (Abell et al., 2009; Binzel et al., 2004; Mainzer et al., 2011; Schunová-Lilly et al., 2017).
The mean collision lifetime of low encounter velocity asteroids in near-Earth orbits is short. Objects just ableto get from Venus or Mars have a collisional lifetime of only about a million years with shorter time scales forslower objects (Harris & D’Abramo, 2015). Additionally, numerous secular perturbations and resonances inthe orbital zones of the terrestrial planets can pump up the velocities of small bodies (Michel & Froeschlé,1997). Such slow objects would therefore need to be continuously resupplied. A tidal disruption event of alarger low-v∞ asteroid during a close encounter with Earth could have increased the population of smallerobjects in Earth-like orbits and contributed to the asymmetry of cold spot formation. These objects tend toreturn to reimpact the Earth and Moon, causing a spike in the impact rate within 105 years following the
Figure 8. Diviner temperature data collected before and after some new impacts show the creation of new cold spots.(a) LROC WAC image of central Mare Humorium and (b) Diviner Ch 8 (50–100 μm) nighttime brightness temperaturedata collected before and (c) after the formation of an ~70-m crater identified using LROC temporal pair NAC imagery(Speyerer et al., 2016). Boxes show locations of subframes (d) and (f) highlighting the new ~2.8-km cold spot. Boxes in(d) and (f) are location of subframes (c) and (e) showing a portion of (c) LROC NAC image m114213813 acquired on30 November 2009 and (d) image m1249810950 acquired on 5 May 2017 before and after the crater formed, respectively.
10.1029/2018JE005652Journal of Geophysical Research: Planets
WILLIAMS ET AL. 2386
disruption event (Schunová et al., 2014). Alternately, impacts on the Mooncould provide a population of low-v∞ near-Earth asteroids. The lunarmeteorites provide evidence for the viability of lunar impact ejecta as sucha source. Studies of the dynamical evolution of lunar fragments ejectedfrom the Moon find a fraction of the fragments that escape the Earth-Moon system into heliocentric orbits return to reimpact in tens of thou-sands of years (Gladman et al., 1995). These scenarios could also explaina size dependence we observe in the leading/trailing asymmetry(Figure 9) as the mass of low-v∞ material would be distributed as smallercollisional debris.
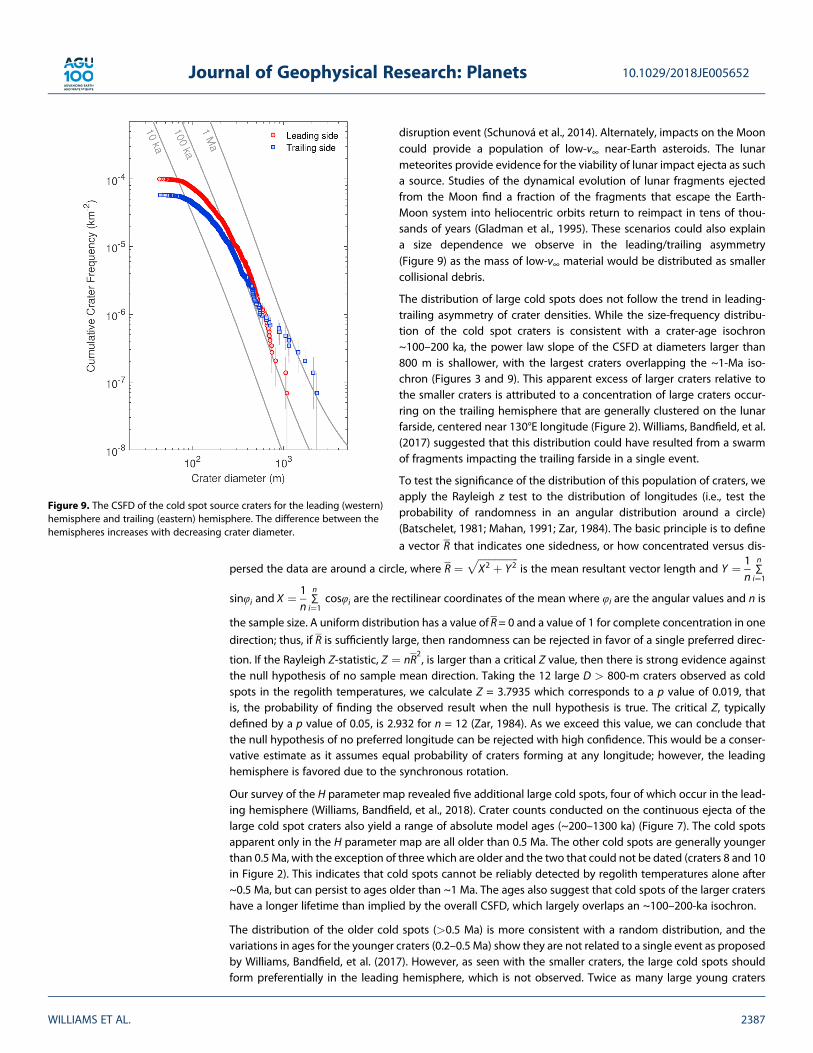
The distribution of large cold spots does not follow the trend in leading-trailing asymmetry of crater densities. While the size-frequency distribu-tion of the cold spot craters is consistent with a crater-age isochron~100–200 ka, the power law slope of the CSFD at diameters larger than800 m is shallower, with the largest craters overlapping the ~1-Ma iso-chron (Figures 3 and 9). This apparent excess of larger craters relative tothe smaller craters is attributed to a concentration of large craters occur-ring on the trailing hemisphere that are generally clustered on the lunarfarside, centered near 130°E longitude (Figure 2). Williams, Bandfield, et al.(2017) suggested that this distribution could have resulted from a swarmof fragments impacting the trailing farside in a single event.
To test the significance of the distribution of this population of craters, weapply the Rayleigh z test to the distribution of longitudes (i.e., test theprobability of randomness in an angular distribution around a circle)(Batschelet, 1981; Mahan, 1991; Zar, 1984). The basic principle is to define
a vector R that indicates one sidedness, or how concentrated versus dis-
persed the data are around a circle, where R ¼ffiffiffiffiffiffiffiffiffiffiffiffiffiffiffiffiX2 þ Y2
pis the mean resultant vector length and Y ¼ 1
n∑n
i¼1
sinφi and X ¼ 1n∑n
i¼1cosφi are the rectilinear coordinates of the mean where φi are the angular values and n is
the sample size. A uniform distribution has a value ofR= 0 and a value of 1 for complete concentration in one
direction; thus, if R is sufficiently large, then randomness can be rejected in favor of a single preferred direc-
tion. If the Rayleigh Z-statistic, Z ¼ nR2, is larger than a critical Z value, then there is strong evidence against
the null hypothesis of no sample mean direction. Taking the 12 large D > 800-m craters observed as coldspots in the regolith temperatures, we calculate Z = 3.7935 which corresponds to a p value of 0.019, thatis, the probability of finding the observed result when the null hypothesis is true. The critical Z, typicallydefined by a p value of 0.05, is 2.932 for n = 12 (Zar, 1984). As we exceed this value, we can conclude thatthe null hypothesis of no preferred longitude can be rejected with high confidence. This would be a conser-vative estimate as it assumes equal probability of craters forming at any longitude; however, the leadinghemisphere is favored due to the synchronous rotation.
Our survey of the H parameter map revealed five additional large cold spots, four of which occur in the lead-ing hemisphere (Williams, Bandfield, et al., 2018). Crater counts conducted on the continuous ejecta of thelarge cold spot craters also yield a range of absolute model ages (~200–1300 ka) (Figure 7). The cold spotsapparent only in the H parameter map are all older than 0.5 Ma. The other cold spots are generally youngerthan 0.5 Ma, with the exception of three which are older and the two that could not be dated (craters 8 and 10in Figure 2). This indicates that cold spots cannot be reliably detected by regolith temperatures alone after~0.5 Ma, but can persist to ages older than ~1 Ma. The ages also suggest that cold spots of the larger cratershave a longer lifetime than implied by the overall CSFD, which largely overlaps an ~100–200-ka isochron.
The distribution of the older cold spots (>0.5 Ma) is more consistent with a random distribution, and thevariations in ages for the younger craters (0.2–0.5 Ma) show they are not related to a single event as proposedby Williams, Bandfield, et al. (2017). However, as seen with the smaller craters, the large cold spots shouldform preferentially in the leading hemisphere, which is not observed. Twice as many large young craters
Figure 9. The CSFD of the cold spot source craters for the leading (western)hemisphere and trailing (eastern) hemisphere. The difference between thehemispheres increases with decreasing crater diameter.
10.1029/2018JE005652Journal of Geophysical Research: Planets
WILLIAMS ET AL. 2387
(<0.5 Ma) occur on the trailing side as on the leading side and several have overlapping model ages.Therefore, a multiimpact event from a small binary or triple near-Earth asteroid (e.g., Margot et al., 2015)on the trailing farside forming several near-simultaneous craters within the last 0.5 Ma cannot be ruled outas a possible explanation for the distribution of the large cold spots.
Alternatively, the destruction rate of the large cold spots could be enhanced on the leading hemisphere. Theformation and destruction of cold spots is not well understood, making this scenario difficult to assess.Smaller impacts, down to the limit of Diviner spatial resolution, also appear to create cold spots, and it isnot clear how their destruction results from the superposition of additional impacts. A comparison of theCSFD of the cold spot craters on the leading and trailing hemispheres shows that the leading-trailing asym-metry is largest for the smallest cold spots (Figure 9). This could result from slower mean impact velocities forthe smaller impactors, consistent with the asymmetry observed in impact events detected by the ApolloPassive Seismic Experiment which represent craters 1–50 m in diameter (Morota et al., 2011; Oberst et al.,2012). The velocity distribution for impactors forming the meter-scale craters may therefore differ from thoseforming the kilometer-scale craters. If true, the leading-trailing asymmetry will be size dependent and couldresult in a more rapid destruction of larger cold spots on the leading hemisphere and explain why the CSFDsof the leading and trailing hemispheres cross over at diameters ~800 m. Further, Powell et al. (2018) find evi-dence that cold spots initially degrade rapidly, with degradation rates slowing as they become more faint,and thus, the younger large cold spots would be most sensitive to an asymmetric degradation rate, explain-ing why the younger,<0.5 Ma, large cold spots are concentrated on the trailing side. Similarly, the contradict-ing observation of a higher frequency of bright-rayed craters at high latitudes by Werner and Medvedev(2010) could result from enhanced micrometeorite bombardment at equatorial latitudes, which acceleratesthe maturation of the ray materials. Since cold spots are more difficult to detect at higher latitudes, we areunable to explore any latitude dependence on cold spots with any confidence.
4.3. Source of Lunar Meteorites
Lunar meteorites represent fragments of the lunar near-surface crust ejected from the Moon by meteoroidimpacts. The precise provenance on the lunar surface of the meteorites is unknown and they likely representa sampling from both the nearside and farside. Meteorites for which cosmic-ray exposure data are availableshow that all of the meteorites were launched from the Moon within the last 20 Myr, with most being ejectedin the last 0.5 Myr (Eugster et al., 2006; Korotev, 2005; Lorenzetti et al., 2005) (Figure 7). Because of the diver-sity of compositions and exposure ages, the meteorites likely derive from many craters, and the young ejec-tion ages constrain the source craters to less than a few kilometers in diameter as there are not enough largercraters young enough to account for the diversity of meteorites (Basilevsky et al., 2010; Warren, 1994).Therefore, many of the known lunar meteorites likely originated from craters with cold spots.
Hydrocode simulations find impact events forming craters with diameters as small 1.1 km can produceenough sizable fragments with lunar escape velocities (2.38 km/s) to account for the largest meteorite sam-ples (Head, 2001). No cold spot craters larger than 800 m were found in the maria; thus, the basaltic meteor-ites sourced from mare with ejection ages of less than a few hundred kyr must have been launched byimpacts forming craters smaller than 800 m. This is supported by generally shallow, less than a few meters,meteorite source depths and a large fraction of the meteorites being composed of regolith breccias formedwithin the regolith layer (Basilevsky et al., 2010; Lorenzetti et al., 2005). Therefore, cold spot craters larger thanseveral hundred meters are candidate source craters for the meteorites and the ejection ages of many of themeteorites overlap with the formation ages of the largest cold spots (Figure 7).
We note that the proposed D ~1.4-km source crater on the floor of Schickard crater for the meteoritesYamato-793169, Asuka-881757, MIL 05035, and MET 01210, which are suggested to be launch paired (Araiet al., 2010), does not have an identifiable cold spot in either the regolith temperatures or H parameter.However, the CRE ages, indicating launch ages around 1 Ma, would be approximately consistent with theage of the oldest cold spots we have been able to identify, and thus, it is possible that this crater formed acold spot that is no longer detectable.
4.4. Impact Gardening Rates
The persistence of cold spot thermal signatures throughout the lunar night implies that the layer of modifiedregolith extends to a depth at least 5 cm and possibly several tens of centimeters for themost prominent cold
10.1029/2018JE005652Journal of Geophysical Research: Planets
WILLIAMS ET AL. 2388

spot surfaces (Bandfield et al., 2014; Hayne et al., 2017). How cold spots are removed is not clear; however, thepreservation time scale for the cold spots suggests that cold spots are reworked into background regolith tothese depths over ~105�106 years.
Analytic modeling of regolith overturn and mixing rates generated by the present-day impact flux (e.g.,Brown et al., 2002) predict a depth of regolith overturn with time that is slower by several orders of magni-tude than implied by the cold spots (Costello et al., 2017; Gault et al., 1974; Lucey et al., 2018). Costelloet al. (2018) found that the present-day population of impactors only overturns the regolith to a depth of acouple millimeter in 5 Myr. Studies of Apollo drill cores however find that vertical mixing of nanophaseFeO, cosmic-ray tracks, cosmogenic radionuclides, and other products of regolith maturation that accumu-late at the surface (e.g., Blanford, 1980; Fruchter et al., 1977; Morris, 1978) require much higher overturn rates.Secondary craters, craters formed by fragments ejected by the original primary impact event, have been sug-gested to form a substantial fraction of the total population of craters (e.g., Bierhaus et al., 2018; McEwenet al., 2005; Shoemaker, 1965; Williams, 2018), and Costello et al. (2018) find that estimates of regolithoverturn-depth rates that include secondary cratering are in good agreement with the analysis of theApollo cores. This model estimates that in 300 kyr, there is a 99% chance of the regolith being overturnedone or more times to a depth of ~12 cm and a 99% chance of the regolith being overturned 100 or moretimes at a depth of 5 cm, which is broadly consistent with our estimates of the cold spot lifetimes of less than~1 Myr (i.e., 5 cm to >10 cm overturned in a few hundred kiloyear). Further, this is also consistent with theformation rate of “splotches,” reflectance changes associated with the new craters formed during the LROmission (Speyerer et al., 2016). These features, identified by LROC NAC temporal image pairs, indicate thatthe top 2–3 cm of regolith are modified on a time scale of ~80,000 years. This collectively suggests that sec-ondary cratering is the predominant mechanism of mixing of the top meter of the lunar regolith.
5. Conclusions
Cold spots last a few 100 ka as estimated from fitting the NPF to the cold spot source craters’ size-frequencydistribution. Larger cold spots may persist longer as they are in greater abundance than predicted given theCSFD at smaller crater diameters, and crater counts on the ejecta of the largest craters (D > 0.8 km) yieldabsolute model ages that range from ~200 ka to ~1.1 Ma. Five large cold spots, not identifiable in the regolithtemperatures, but apparent in the H parameter map, are all older than 0.5 Ma, indicating that weak, fadedcold spots can persist for >0.5 Ma but are not reliably detected by temperatures alone. The survival timeof these features requires a relatively rapid regolith overturn rate consistent with secondary cratering playinga predominate role.
An asymmetry in the distribution of the cold spots reflects the synchronous rotation of the Moon, with a lar-ger number of cold spots occurring on the leading hemisphere. The ratio of the crater density at the apex ofmotion versus the antapex of motion is nearly 2, requiring the impactor population forming these craters tobe slower on average than typically predicted and slower than estimated for the rayed craters. The leading-trailing asymmetry is greatest for the smaller diameter craters and the trend is inverted for craters larger than~800 m, with a greater density of craters in the trailing hemisphere. This could mean that the distribution ofencounter velocities is lower for smaller impactors and could result from a population of small, meters-to-tensof meters, slow objects in heliocentric orbits close to the Earth-Moon system. Additionally, the higher rate ofsmaller impacts on the leading hemisphere could contribute to the destruction of cold spots, resulting in amore rapid fading of larger cold spots on the leading side. Deviations in the rayed crater distribution froman idealized production function have similarly been suggested to indicate a size-dependent retention time(Werner & Medvedev, 2010). Alternatively, a multiimpact event from a swarm of ~100-m-scale meteoroidsimpacting on the trailing farside in the last 0.5 Myr could explain the overabundance of larger cold spotsin this part of the Moon.
ReferencesAbell, P. A., Korsmeyer, D. J., Landis, R. R., Jones, T. D., Adamo, D. R., Morrison, D. D., et al. (2009). Scientific exploration of near-Earth objects via
the Orion Crew exploration vehicle. Meteoritics and Planetary Science, 44(12), 1825–1836. https://doi.org/10.1111/j.1945-5100.2009.tb01991.x
10.1029/2018JE005652Journal of Geophysical Research: Planets
WILLIAMS ET AL. 2389
AcknowledgmentsWe would like to thank two anonymousreviewers for their helpful commentsand Jaahnavee Venkatraman for thehelpful edits. We also would like tothank the LRO, LROC, and Divineroperations teams for the collection ofthe high-quality data sets used in thiswork. The data used in this study arepublicly available via the GeosciencesNode of the Planetary Data System(http://pdsgeosciences.wustl.edu/missions/lro/diviner.htm) and the LROCData Node (http://lroc.sese.asu.edu/).The contributions of J.-P. Williams werefunded by a NASA Solar SystemWorkings grant 80NSSC18K0010. Part ofthis work was supported by the NASALunar Reconnaissance Orbiter project.
Antonenko I., Robbins S. J., Gay P. L., Lehan C., & Moore J. (2013). Effects of incidence angle on crater detection and the lunar isochron system:Preliminary results from the Cosmoquest Moonmappers citizen science project. Lunar and Planetary Science Conference, 44
th, abstract
#2705.Arai, T., Hawke, B. R., Giguere, T. A., Misawa, K., Miyamoto, M., & Kojima, H. (2010). Antarctic lunar meteorites Yamato-793169, Asuka-881757,
MIL 05035, and MET 01210 (YAMM): Launch pairing and possible cryptomare origin. Geochimica et Cosmochimica Acta, 74(7), 2231–2248.https://doi.org/10.1016/j.gca.2009.11.019
Bandfield, J. L., Ghent, R. R., Vasavada, A. R., Paige, D. A., Lawrence, S. J., & Robinson, M. S. (2011). Lunar surface rock abundance and regolithfines temperatures derived from LRO Diviner radiometer data. Journal of Geophysical Research, 116, E00H02. https://doi.org/10.1029/2011JE003866
Bandfield, J. L., Song, E., Hayne, P. O., Brand, B. D., Ghent, R. R., Vasavada, A. R., & Paige, D. A. (2014). Lunar cold spots: Granular flow featuresand extensive insulating materials surrounding young craters. Icarus, 231, 221–231. https://doi.org/10.1016/j.icarus.2013.12.017
Basilevsky, A. T., Neukum, G., & Nyquist, L. (2010). The spatial and temporal distribution of lunar mare basalts as deduced from analysis ofdata for lunar meteorites. Planetary and Space Science, 58(14-15), 1900–1905. https://doi.org/10.1016/j.pss.2010.08.020
Batschelet, E. (1981). Circular Statistics in Biology. New York, NY: Academic Press.Bierhaus, E. B., McEwen, A. S., Robbins, S. J., Singer, K. N., Dones, L., Kirchoff, M. R., & Williams, J.-P. (2018). Secondary craters and ejecta across
the solar system: Populations and effects on impact-crater based chronologies.Meteoritics & Planetary Science, 53(4), 638–671. https://doi.org/10.1111/maps.13057
Binzel, R. P., Perozzi, E., Rivkin, A. S., Rossi, A., Harris, A. W., Bus, S. J., et al. (2004). Dynamical and compositional assessment of near-Earthobject mission targets. Meteoritics and Planetary Science, 39(3), 351–366. https://doi.org/10.1111/j.1945-5100.2004.tb00098.x
Blanford, G. (1980). Cosmic ray production curves below reworking zones. Lunar and Planetary Science Conference Proceedings, 11,1357–1368.
Brown, P., Spalding, R. E., ReVelle, D. O., Tagliaferri, E., & Worden, S. P. (2002). The flux of small near-Earth objects colliding with the Earth.Nature, 420, 294–296. https://doi.org/10.1038/nature01238
Costello, E. S., Ghent, R. R., & Lucey, P. G. (2017). A refreshed model for the mixing rate of lunar regolith. Lunar and Planetary ScienceConference, 48
th, abstract #1672.
Costello, E. S., Ghent, R. R., & Lucey, P. G. (2018). The mixing of lunar regolith: Vital update to a canonical model. Icarus, 314, 327–344. https://doi.org/10.1016/j.icarus.2018.05.023
Drozd, R. J., Hohenberg, C. M., Morgan, C. J., & Ralston, C. E. (1974). Cosmic-ray exposure history at the Apollo 16 and other lunar sites: Lunarsurface dynamics. Geochimica et Cosmochimica Acta, 38(10), 1625–1642. https://doi.org/10.1016/0016-7037(74)90178-1
Eugster, O. (1999). Chronology of dimict breccias and the age of south ray crater at the Apollo 16 site.Meteoritics and Planetary Science, 34(3),385–391. https://doi.org/10.1111/j.1945-5100.1999.tb01347.x
Eugster, O., Herzog, G. F., Marti, K., & Caffee, M. W. (2006). Irradiation records, cosmic-ray exposure ages, and transfer times of meteorites. In D.S. Lauretta, & H. Y. McSween (Eds.), Meteorites and the Early Solar System II, (pp. 829–851). Tucson, AZ: Univ. of Arizona Press.
Fassett, C. I. (2016). Analysis of impact crater populations and the geochronology of planetary surfaces in the inner solar system. Journal ofGeophysical Research: Planets, 121, 1900–1926. https://doi.org/10.1002/2016JE005094
Fruchter, J., Rancitelli, L., Laul, J., & Perkins, R. (1977). Lunar regolith dynamics (Pembroke, Ont.) based on analysis of the cosmogenicradionuclides
22Na,
26Al, and
53Mn. Lunar and Planetary Science Conference Proceedings, 8, 3595–3605.
Gallant, J., Gladman, B., & Ćuk, M. (2009). Current bombardment of the earth-moon system: Emphasis on cratering asymmetries. Icarus,202(2), 371–382. https://doi.org/10.1016/j.icarus.2009.03.025
Gault, D. E., Hörz, F., Brownlee, D. E., & Hartung, J. B. (1974). Mixing of the lunar regolith. In Lunar and Planetary Science Conference Proceedings,5, 2365–2386.
Gladman, B. J., Burns, J. A., Duncan, M. J., & Levinson, H. F. (1995). The dynamical evolution of lunar impact ejecta. Icarus, 118(2), 302–321.https://doi.org/10.1006/icar.1995.1193
Halliday, I. (1964). The variation in the frequency of meteorite impact with geographic latitude. Meteoritics, 2(3), 271–278. https://doi.org/10.1111/j.1945-5100.1964.tb01433.x
Harris, A. W., & D’Abramo, G. (2015). The population of near-Earth asteroids. Icarus, 257, 302–312. https://doi.org/10.1016/j.icarus.2015.05.0040019-1035
Hartmann, W. K., & Daubar, I. J. (2017). Martian cratering 11. Utilizing decameter scale crater populations to study Martian history.Meteoriticsand Planetary Science, 52(3), 493–510. https://doi.org/10.1111/maps.12807
Hayne, P. O., Bandfield, J. L., Siegler, M. A., Vasavada, A. R., Ghent, R. R., Williams, J. P., et al. (2017). Global regolith thermophysical properties ofthe moon from the Diviner Lunar Radiometer Experiment. Journal of Geophysical Research, 122, 2371–2400. https://doi.org/10.1002/2017JE005387
Head, J. N. (2001). Lunar meteorite source crater size: Constraints from impact simulations. Lunar and Planetary Science Conference, 32nd,
abstract #1768.Horedt, G. P., & Neukum, G. (1984). Cratering rate over the surface of a synchronous satellite. Icarus, 60(3), 710–717. https://doi.org/10.1016/
0019-1035(84)90175-1Hughes, D. W., & Williams, I. P. (2000). The velocity distributions of periodic comets and stream meteoroids. Monthly Notices of the Royal
Astronomical Society, 315(3), 629–634. https://doi.org/10.1046/j.1365-8711.2000.03435.xIto, T., & Malhotra, R. (2010). Asymmetric impacts of near-Earth asteroids on the moon. Astronomy and Astrophysics, 519, A63. https://doi.org/
10.1051/0004-6361/200912901Kawamura, T., Morota, T., Kobayashi, N., & Tanaka, S. (2011). Cratering asymmetry on the moon: New insight from the Apollo passive seismic
experiment. Geophysical Research Letters, 38, L15201. https://doi.org/10.1029/2011GL048047Kneissel, T., van Gasselt, S., & Neukum, G. (2011). Map-projection-independent crater size–frequency determination in GIS environments—
New software tool for ArcGIS. Planetary and Space Science, 59(11-12), 1243–1254. https://doi.org/10.1016/j.pss.2010.03.015Korotev, R. L. (2005). Lunar geochemistry as told by lunar meteorites. Chemie der Erde, 65(4), 297–346. https://doi.org/10.1016/j.
chemer.2005.07.001Le Feuvre, M., & Wieczorek, M. A. (2008). Nonuniform cratering of the terrestrial planets. Icarus, 197(1), 291–306. https://doi.org/10.1016/j.
icarus.2008.04.011Le Feuvre, M., & Wieczorek, M. A. (2011). Nonuniform cratering of the moon and a revised crater chronology of the inner solar system. Icarus,
214(1), 1–20. https://doi.org/10.1016/j.icarus.2011.03.010Lorenzetti, S., Busemann, H., & Eugster, O. (2005). Regolith history of lunar meteorites. Meteoritics and Planetary Science, 40(2), 315–327.
https://doi.org/10.1111/j.1945-5100.2005.tb00383.x
10.1029/2018JE005652Journal of Geophysical Research: Planets
WILLIAMS ET AL. 2390
Lucey, P. G., Costello, E. S., Ghent, R. R., & Li, S. (2018). Ice distribution at the poles of the Moon and Mercury: The role of regolith overturn.Lunar and Planetary Science Conference, 49
th, abstract #1678.
Mahan, R., (1991). Circular statistical methods: Applications in spatial and temporal performance analysis. Special report, U.S. Army ResearchInstitute for the Behavioral and Social Sciences.
Mainzer, A., Grav, T., Bauer, J., Masiero, J., McMillan, R. S., Cutri, R. M., et al. (2011). NEOWISE observations of near-Earth objects: Preliminaryresults. The Astrophysical Journal, 743(2), 156. https://doi.org/10.1088/0004-637X/743/2/156
Margot, J.-L., Pravec, P., Taylor, P., Carry, B., & Jacobson, S. (2015). Asteroid systems: Binaries, triples, and pairs. In P. Michel, F. E. DeMeo,& W. F. Bottke (Eds.), Asteroids IV, (pp. 335–374). Tucson, AZ: Univ. of Arizona Press. https://doi.org/10.2458/azu_uapress_9780816532131-ch019
McEwen, A. S., & Bierhaus, E. B. (2006). The importance of secondary cratering to age constraints on planetary surfaces. Annual Review ofEarth and Planetary Sciences, 34(1), 535–567. https://doi.org/10.1146/annurev.earth.34.031405.125018
McEwen, A. S., Preblich, B. S., Turtle, E. P., Artemieva, N. A., Golombek, M. P., Hurst, M., et al. (2005). The rayed crater Zunil and interpretationsof small impact craters on Mars. Icarus, 176(2), 351–381. https://doi.org/10.1016/j.icarus.2005.02.009
Mendell, W. W., & Low, F. J. (1974). Preliminary results of the Apollo 17 infrared scanning radiometer. The Moon, 9(1-2), 97–103. https://doi.org/10.1007/BF00565396
Mendell, W. W., & Low, F. J. (1975). Infrared orbital mapping of lunar features. Lunar and Planetary Science Conference Proceedings, 9,2711–2719.
Michael, G. G., & Neukum, G. (2010). Planetary surface dating from crater size–frequency distribution measurements: Partial resurfacingevents and statistical age uncertainty. Earth and Planetary Science Letters, 294(3-4), 223–229. https://doi.org/10.1016/j.epsl.2009.12.041
Michel, P., & Froeschlé, C. (1997). The location of linear secular resonances for semimajor axes smaller than 2 AU. Icarus, 128(1), 230–240.https://doi.org/10.1006/icar.1997.5727
Morota, T., & Furumoto, M. (2003). Asymmetrical distribution of rayed craters on the moon. Earth and Planetary Science Letters, 206(3-4),315–323. https://doi.org/10.1016/S0012-821X(02)01111-1
Morota, T., Haruyama, J., Honda, C., Yokota, Y., Ohtake, M., & Furumoto, M. (2008). Lunar apex antapex cratering asymmetry as an impactorrecorder in the Earth moon system. Advances in Space Research, 42(2), 285–288. https://doi.org/10.1016/j.asr.2007.05.055
Morota, T., Ukai, T., & Furumoto, M. (2005). Influence of the asymmetrical cratering rate on the lunar cratering chronology. Icarus, 173(2),322–324. https://doi.org/10.1016/j.icarus.2004.08.016
Morris, R. V. (1978). In situ reworking (gardening) of the lunar surface: Evidence from the Apollo cores. Lunar and Planetary Science ConferenceProceedings, 9, 1801–1811.
Neukum, G., Ivanov, B. A., & Hartmann, W. K. (2001). Cratering records in the inner solar system in relation to the lunar reference system.Space Science Reviews, 96(1/4), 55–86. https://doi.org/10.1023/A:1011989004263
Oberbeck, V. R., & Morrison, R. M. (1973). On the formation of the lunar herringbone pattern. Proceedings of the Lunar Science Conference, 4,107–123.
Oberst, J., Christou, A., Suggs, R., Moser, D., Daubar, I. J., McEwen, A. S., et al. (2012). The present-day flux of large meteoroids on the lunarsurface—A synthesis of models and observational techniques. Planetary and Space Science, 74(1), 179–193. https://doi.org/10.1016/j.pss.2012.10.005
Ostrach L. R., Robinson M. S., Denevi B. W., & Thomas P. C. (2011). Effects of incidence angle on crater counting observations. Lunar andPlanetary Science Conference, 42
nd, abstract #1202.
Paige, D. A., Foote, M. C., Greenhagen, B. T., Schofield, J. T., Calcutt, S., Vasavada, A. R., et al. (2010). The Lunar Reconnaissance Orbiter DivinerLunar Radiometer Experiment. Space Science Reviews, 150(1-4), 125–160. https://doi.org/10.1007/s11214-009-9529-2
Plescia, J. B., Robinson, M. S., Wagner, R., & Baldridge, R. (2016). Ranger and Apollo S-IVB spacecraft impact craters. Planetary and SpaceScience, 124, 15–35. https://doi.org/10.1016/j.pss.2016.01.002
Powell, T. M., Greenhagen, B. T., Taylor, S., Williams, J.-P., Hayne, P. O., & Paige, D. A. (2018). Lunar cold spot properties and degradation. Lunarand Planetary Science Conference, 49
th, abstract #1829.
Robinson, M. S., Brylow, S. M., Tschimmel, M., Humm, D., Lawrence, S. J., Thomas, P. C., et al. (2010). Lunar Reconnaissance Orbiter Camera(LROC) instrument overview. Space Science Reviews, 150(1-4), 81–124. https://doi.org/10.1007/s11214-010-9634-2
Schunová, E., Jedicke, R., Walsh, K. J., Granvik, M., Wainscoat, R. J., & Haghighipour, N. (2014). Properties and evolution of NEO families createdby tidal disruption at Earth. Icarus, 238, 156–169. https://doi.org/10.1016/j.icarus.2014.05.006
Schunová-Lilly, E., Jedicke, R., Vereš, P., Denneau, L., & Wainscoat, R. J. (2017). The size-frequency distribution of H> 13 NEOs and ARM targetcandidates detected by pan-STARRS1. Icarus, 284, 114–125. https://doi.org/10.1016/j.icarus.2016.11.010
Shoemaker, E. M. (1962). Interpretation of lunar craters. In Z. Kopal (Ed.), Physics and Astronomy of the Moon, (pp. 283–359). New York, NY:Academic Press.
Shoemaker, E. M. (1965). Preliminary analysis of the fine structure of the lunar surface in Mare Cognitum. In W. N. Heiss, D. R. Menzel, & J. A.O’Keefe (Eds.), The nature of the lunar surface, (pp. 23–77). Baltimore, Maryland: Johns Hopkins Univ. Press.
Shoemaker, E. M., & Wolfe, R. A. (1982). Cratering timescales for the Galilean satellites. In D. Morrison (Ed.), Satellites of Jupiter, (pp. 277–339).Tucson, AZ: Univ. of Arizona Press.
Speyerer, E. J., Povilaitis, R. Z., Robinson, M. S., Thomas, P. C., & Wagner, R. V. (2016). Quantifying crater production and regolith overturn onthe moon with temporal imaging. Nature, 538(7624), 215–218. https://doi.org/10.1038/nature19829
Stöffler, D., & Ryder, G. (2001). Stratigraphy and isotope ages of lunar geologic units: Chronological standard for the inner solar system. SpaceScience Reviews, 96(1/4), 9–54. https://doi.org/10.1023/A:1011937020193
Vasavada, A. R., Bandfield, J. L., Greenhagen, B. T., Hayne, P. O., Siegler, M. A., Williams, J.-P., & Paige, D. A. (2012). Lunar equatorial surfacetemperatures and regolith properties from the Diviner Lunar Radiometer Experiment. Journal of Geophysical Research, 117, E00H18.https://doi.org/10.1029/2011JE003987
Vasavada, A. R., Paige, D. A., & Wood, S. E. (1999). Near-surface temperatures on mercury and the moon and the stability of polar ice deposits.Icarus, 141(2), 179–193. https://doi.org/10.1006/icar.1999.6175
Vondrak, R., Keller, J., Chin, G., & Garvin, J. (2010). Lunar Reconnaissance Orbiter (LRO): Observations for lunar exploration and science. SpaceScience Reviews, 150(1-4), 7–22. https://doi.org/10.1007/s11214-010-9631-5
Wagner, R. V., Nelson, D. M., Plesia, J. B., Robinson, M. S., Speyerer, E. J., & Mazarico, E. (2017). Coordinates of anthropogenic features on themoon. Icarus, 283, 92–103. https://doi.org/10.1016/j.icarus.2016.05.011
Warren, P. (1994). Lunar and Martian meteorite delivery service. Icarus, 111(2), 338–363. https://doi.org/10.1006/icar.1994.1149Werner, S. C., & Medvedev, S. (2010). The lunar rayed-crater population—Characteristics of the spatial distribution and ray retention. Earth
and Planetary Science Letters, 295(1-2), 147–158. https://doi.org/10.1016/j.epsl.2010.03.036
10.1029/2018JE005652Journal of Geophysical Research: Planets
WILLIAMS ET AL. 2391

Williams, J.-P. (2018). Modification of the Martian surface by impact cratering. In R. Soare, S. Conway, & S. Clifford (Eds.), Dynamic Mars: Recentand Current Landscale Evolution of the Red Planet, (pp. 363–386). Amsterdam, Netherlands: Elsevier. https://doi.org/10.1016/B978-0-12-813018-6.00012-1
Williams, J.-P., Bandfield, J. L., Paige, D. A., Greenhagen, B. T., Speyerer, E. J., & Ghent, R. R., (2017). A recent, large multi-impact event on theMoon. Lunar and Planetary Science Conference, 48
th, abstract #2637.
Williams, J.-P., Bandfield, J. L., Paige, D. A., Powell, T. , Taylor, S., Hayne, P. O., et al. (2018). Large lunar cold spots: Ages and distribution. Lunarand Planetary Science Conference, 49
th, abstract #2275.
Williams, J.-P., Paige, D. A., Greenhagen, B. T., & Sefton-Nash, E. (2017). The global surface temperatures of the moon as measured by theDiviner Lunar Radiometer Experiment. Icarus, 283, 300–325. https://doi.org/10.1016/j.icarus.2016.08.012
Williams, J.-P., Pathare, A. V., & Aharonson, O. (2014). The production of small primary craters on Mars and the moon. Icarus, 235, 23–36.https://doi.org/10.1016/j.icarus.2014.03.011
Williams, J.-P., Sefton-Nash, E., & Paige, D. A. (2016). The temperatures of Giordano Bruno crater observed by the Diviner Lunar RadiometerExperiment: Application of an effective field of view model for a point-based data set. Icarus, 273, 205–213. https://doi.org/10.1016/j.icarus.2015.10.034
Williams, J.-P., van der Bogert, C. H., Pathare, A. V., Michael, G. G., Kirchoff, M. R., & Hiesinger, H. (2018). Dating very young planetary surfacesfrom crater statistics: A review of issues and challenges. Meteoritics and Planetary Science, 53(4), 554–582. https://doi.org/10.1111/maps.12924
Wood, J. A. (1973). Bombardment as a cause of the lunar asymmetry. The Moon, 8(1-2), 73–103. https://doi.org/10.1007/BF00562751Zahnle, K., Dones, L., & Levinson, H. F. (1998). Cratering rates on the Galilean satellites. Icarus, 136(2), 202–222. https://doi.org/10.1006/
icar.1998.6015Zahnle, K., Schenk, P., Sobieszczyk, S., Dones, L., & Levison, H. F. (2001). Differential cratering of synchronously rotating satellites by ecliptic
comets. Icarus, 153(1), 111–129. https://doi.org/10.1006/icar.2001.6668Zanetti, M., Stadermann, A., Jolliff, B., Hiesinger, H., van der Bogert, C. H., & Plescia, J. (2017). Evidence for self-secondary cratering of
Copernican-age continuous ejecta deposits on the moon. Icarus, 298, 64–77. https://doi.org/10.1016/j.icarus.2017.01.030Zar, J. (1984). Biostatistical Analysis. Englewood Cliffs, NJ: Prentice-Hall, Inc.
10.1029/2018JE005652Journal of Geophysical Research: Planets
WILLIAMS ET AL. 2392