journal of financial economics - tsinghua university · a mcdonough school of business, ... journal...
TRANSCRIPT

Contents lists available at ScienceDirect
Journal of Financial Economics
Journal of Financial Economics 115 (2015) 189–209
http://d0304-40
☆ WeBorisov,editor),seminarAssociaAssociameetingsupportedges refrom In
n Corrsity, US
E-myifmao@bawolfe
journal homepage: www.elsevier.com/locate/jfec
Does banking competition affect innovation?$
Jess Cornaggia a, Yifei Mao b, Xuan Tian b,c,n, Brian Wolfe d
a McDonough School of Business, Georgetown University, USAb Kelley School of Business, Indiana University, USAc PBC School of Finance, Tsinghua University, Chinad School of Management, State University of New York at Buffalo, USA
a r t i c l e i n f o
Article history:Received 25 September 2012Received in revised form9 July 2013Accepted 13 August 2013Available online 8 September 2014
JEL classifications:G21G28G34O16O31
Keywords:Banking competitionInnovationAccess to financeMergers and acquisitions
x.doi.org/10.1016/j.jfineco.2014.09.0015X/& 2014 Elsevier B.V. All rights reserved.
thank Viral Acharya (our referee), MattheMichael Fuerst, Daniel Paravisini, Philip StrahJason Sturgess, Krishnamurty Subramanianand conference participants at Indiana U
tion of Financial Economics meetings, the 20tion meetings, and the 2012 Financial Mans for helpful comments. Jess Cornaggia ackfrom the Anderson Faculty Excellence Fundsearch support from the Mary Jane Geyer Cadiana University. All errors belong to the auesponding author at: Kelley School of BusinA.ail addresses: [email protected] (J. Coindiana.edu (Y. Mao), [email protected] ([email protected] (B. Wolfe).
a b s t r a c t
We exploit the deregulation of interstate bank branching laws to test whether bankingcompetition affects innovation. We find robust evidence that banking competitionreduces state-level innovation by public corporations headquartered within deregulatingstates. Innovation increases among private firms that are dependent on external financeand that have limited access to credit from local banks. We argue that bankingcompetition enables small, innovative firms to secure financing instead of being acquiredby public corporations. Therefore, banking competition reduces the supply of innovativetargets, which reduces the portion of state-level innovation attributable to publiccorporations. Overall, these results shed light on the real effects of banking competitionand the determinants of innovation.
& 2014 Elsevier B.V. All rights reserved.
1. Introduction
What drives innovation? Understanding the determi-nants of innovation is important because innovations
w Billett, Alexanderan, Bill Schwert (the, Gregory Udell, andniversity, the 201413 Western Financeagement Associationnowledges financial. Xuan Tian acknowl-in Faculty Fellowshipthors.ess, Indiana Univer-
rnaggia),. Tian),
establish companies' competitive advantages (Porter, 1992)and are important drivers of economic growth (Solow,1957). A growing literature takes up this task, document-ing positive and negative empirical links between innova-tion and various company and market characteristics.However, this literature contains few empirical studiesexamining the link between capital market developmentand innovation output. We contribute to this nascentliterature by examining the effects of state-level bankingcompetition on innovation.
A major challenge facing the empirical innovationliterature is that innovation is likely endogenous withcompany and market characteristics, including state-levelbanking competition. Thus, a correlation between bankingcompetition and innovation may tell us little about thecausal effect of banking competition on innovation. Wealleviate endogeneity concerns by exploiting the staggeredderegulation of interstate bank branching laws in the

J. Cornaggia et al. / Journal of Financial Economics 115 (2015) 189–209190
United States. The U.S. Congress passed the InterstateBanking and Branching Efficiency Act (IBBEA) in 1994.In addition to allowing unrestricted interstate banking, theIBBEA legalized interstate branching across the U.S. start-ing in 1997. As Rice and Strahan (2010, p. 861) explain,“Allowing interstate branching was the watershed event ofIBBEA.” Rice and Strahan show that, when states relaxbank branching restrictions, more bank branches open andcompete with one another. This increase in competitionexpands the availability of credit within a state and lowersthe cost of capital therein.
We construct tests using these deregulatory events asplausibly exogenous increases in the supply of state-levelfinance. Given the economic effects documented by Riceand Strahan (2010), we expect state-level innovation toincrease following deregulation because companies head-quartered within deregulating states could take advantageof the greater supply of finance to increase innovationoutput. Surprisingly, however, we find robust evidencethat increases in banking competition cause states' inno-vation outputs to decline. We find that states that arecompletely open to interstate branching generate a total of30.8% fewer patents (i.e., 920 fewer patents) three yearsafter branching deregulation than states with the mostrestrictions on interstate branching. We find a similarresult when we use patent citations as a proxy forinnovation: States that are completely open to interstatebranching generate patents that receive a total of 23.2%fewer citations (i.e., 9,068 fewer citations) three years afterbranching deregulation than states with the most restric-tions on interstate branching. These results are robust tocontrolling for state-level and state-industry-level laborforce concentration, banking deregulatory events thatprecede IBBEA, state fixed effects, and year fixed effects.
To gain a clearer understanding of this result, wedecompose state-level patents into patents produced bypublic corporations and private firms.1 Private firms couldbe more sensitive to local banking conditions than publiccorporations, so the effects of state-level banking competi-tion could be different for these two groups. Indeed, wefind the overall negative effect of deregulatory events onstate-level innovation is driven by corporations headquar-tered within deregulating states. In contrast, relative tocorporations, private firms experience increases in innova-tion output following deregulatory events. (We find nodirect effect of deregulation on private firms' innovationoutputs.) These findings support the notion that small,private firms take advantage of the improved credit con-ditions to finance innovative projects.
Although the staggered deregulation of interstate bankbranching laws provide exogenous changes to bankingcompetition, Kroszner and Strahan (1999) argue thatstate-level factors that manifest differently across statescould have affected the timing of deregulation in differentstates. Therefore, it is possible that our results are driven
1 To aid in distinction, we use the word “corporation” throughout theremainder of the paper to designate Compustat-reported entities. Wereserve the word “firm” for private firms whose stocks are not listed onstock exchanges. We use the word “company” as a general term for eitherpublic corporations or private firms.
by reverse causality, whereby differences in innovationintensities across states triggered deregulation. Weemploy the methodology of Bertrand and Mullainathan(2003) to address this concern. We examine the dynamicsof innovation surrounding the deregulatory events and wefind no prior trend in innovation output. This findingindicates reverse causality does not explain our mainresults.
Another potential explanation for our results is that anomitted variable coinciding with branching deregulationcould be the true underlying cause of changes in innova-tion. If this is the case, then the changes in innovation weattribute to branching deregulation reflect mere associa-tions rather than a causal effect. Our baseline identificationstrategy employs shocks that affect different states atdifferent times. It is unlikely that an omitted variableunrelated to branching deregulation would fluctuate everytime (or even most of the time) a deregulatory eventoccurs. Therefore, our strategy of using multiple shocksdue to staggered banking deregulation across states miti-gates the omitted variables concern.
Still, we address this possibility by conducting placebotests. We begin by obtaining an empirical distribution ofyears when states deregulated from Rice and Strahan(2010). Next, we randomly assign states into each of thesederegulation years (without replacement) following theempirical distribution. This approach maintains the dis-tribution of deregulatory years from our baseline specifi-cation, but it disrupts the proper assignment ofderegulation years to states. Therefore, if an unobservableshock occurs at approximately the same time as thederegulation events in the mid-1990s, it should still residein the testing framework, and thus have an opportunity todrive the results. However, if no such shock exists, thenour incorrect assignments of deregulatory years to statesshould weaken our results when we re-estimate thebaseline tests. Indeed, we find these falsely assumedderegulatory events have no effect on innovation. Thesenon-results corroborate the notion that the paper's mainresults are not driven by an omitted variable.
After demonstrating that there is an aggregate decreasein patents and patent citations following increased bank-ing competition from the IBBEA, we examine three possi-ble channels to explain this result. First, we test whethercompanies' external finance dependence affects the waytheir innovation outputs respond to changes in state-levelbanking competition. We expect that banking competitionrelaxes financing constraints for private firms, mainly inexternal-finance-dependent industries. Therefore, theseprivate firms should experience increases in innovationoutput. This is precisely what we find. We use the measureof external finance dependence developed by Duchin,Ozbas, and Sensoy (2010) and find external-finance-dependent private firms located in states that are com-pletely open to interstate branching generate a total of7.6% more patents and 6.4% more citations three yearsafter branching deregulation than firms in states with themost restrictions on interstate branching. This result isrobust to a variety of alternative proxies for externalfinance dependence. We partition the data by companysize, age, and bank dependence following Acharya, Imbs,

J. Cornaggia et al. / Journal of Financial Economics 115 (2015) 189–209 191
and Sturgess (2011) and by the size-age (SA) indexfollowing Hadlock and Pierce (2010), and we observequalitatively similar results. In contrast, we observe noeffect or a negative effect of banking deregulation onprivate firms with below-median dependence on externalfinance.
Second, companies' banking relationships prior toderegulatory events provide another way to test how theneed for external finance interacts with changes in bank-ing competition. As banking competition increases, weexpect the innovation output of companies with existingloans from in-state banks to react differently compared tocompanies with loans from out-of-state banks. Wehypothesize that in-state banking relationships are evi-dence that companies are able to satisfy their demand forexternal finance from nearby banks. However, if compa-nies borrow from out-of-state banks, it indicates that theyare unable to satisfy their demand for finance from nearbybanks. If banking competition expands access to finance,and if companies use it to finance innovative projects, thenthe innovation output of the latter group of companiesshould increase following increases in banking competi-tion. Indeed, we observe an increase in the innovationoutput of private firms with high pre-existing out-of-statebank loans after deregulatory events and no change in theinnovation output of public corporations and private firmswith prior in-state banking relationships. Like the externalfinance dependence results, these results provide evidencethat companies that are most likely to benefit fromexpanded access to bank finance take advantage of state-level banking competition to improve their innovativeoutput.
Finally, we test a mergers and acquisitions-basedexplanation for the negative effect of branching deregula-tion on corporate innovation. Because proximal bankingconditions matter for small firms (Petersen and Rajan,2002), changes in state-level banking competition couldalter the market for target firms in corporations' head-quarter states.2 Given founder-managers' private benefitsof control, the owners of small firms prefer to securefinancing while giving away as little control as possible tothe financiers (Bolton and Von Thadden, 1998). On theother hand, Erel, Jang, and Weisbach (forthcoming) findthat M&As significantly ease financial constraints of targetfirms and Sevilir and Tian (2012) show that a significantportion of corporations' innovation output derives fromacquisitions of innovative targets. Together, these paperssuggest that increases in state-level banking competitioncould allow small, innovative firms to secure bank finan-cing to fund innovative projects and remain independentinstead of being acquired by corporations. This effect couldlead to a dearth of willing targets which would generate areduction in corporate innovation.
Consistent with our conjecture that corporations' abil-ities to acquire small, innovative target firms are impairedafter bank branching deregulation, we find the overallnegative effects of banking competition on innovation are
2 We document the largest proportion of acquiring firms' targetsreside in the acquiring firms' headquarter states (i.e., 22%).
particularly strong among corporations that are frequentacquirers and have high M&A expenditures before dereg-ulatory events. Further, for a given corporation, we find theaverage innovativeness of the targets it acquires declinesafter banking competition increases in its headquarterstate. This result indicates that the pool of potential targetswithin a state contains less innovative firms after dereg-ulation. Finally, we find the ratio of target firms thatproduce at least one patent in a year to total private firmslocated within a state declines after banking competitionincreases. All of these results suggest that a reduction inthe supply of innovative targets is a possible mechanismthat helps explain the overall negative relation betweenstate-level banking competition and corporate innovation.Further, the finding that target firms seek bank financingafter deregulation supports the view that banking wasrepressed in the United States until branching deregula-tion was enacted.
The rest of the paper proceeds as follows. Section 2describes how this paper relates to existing literature.Section 3 describes the data and variable construction.Section 4 presents the baseline results and endogeneitytests. Section 5 discusses the underlying mechanisms ofour baseline results and Section 6 concludes.
2. Relation to existing literature
Our paper contributes to two strands of literature. First,our paper is related to the literature that examines the realeffects of banking deregulation. This literature begins withJayaratne and Strahan (1996), who show intrastate branch-ing deregulation significantly increases the rates of realper capita growth in income and output. Following thisstudy, a large literature has examined various conse-quences of the intrastate branching and interstate bankingderegulation events that occurred in the U.S. in the 1970sand 1980s. These studies find that deregulation spursentrepreneurship (Black and Strahan, 2002), makes statebusiness cycles smaller and more alike (Morgan, Rime, andStrahan, 2004), allows firm entry and access to bank credit(Cetorelli and Strahan, 2006), promotes creative destruc-tion (Kerr and Nanda, 2009), and increases personal bank-ruptcy rates (Dick and Lehnert, 2010). Rice and Strahan(2010) show that the interstate branching deregulation thatoccurred in the U.S. in the mid-1990s expands creditsupply by reducing the cost of credit but has no effect onthe amount borrowed by small firms. We examine theeffects of the same deregulatory event as Rice and Strahan(2010). We advance this line of inquiry by showing that thereduced cost of credit allows private, external-finance-dependent firms to secure bank financing to fund innova-tive projects.
Second, our paper contributes to the emerging literatureon finance and innovation. This literature shows relationsbetween innovation and market characteristics includingcompetition (Aghion, Bloom, Blundell, Griffith, and Howitt,2005), bankruptcy laws (Acharya and Subramanian, 2009),labor laws (Acharya, Baghai, and Subramanian, 2013, 2014),corporate venture capital (Chemmanur, Loutskina, and Tian,2014), and investors' attitudes toward failure (Tian andWang, 2014), as well as firm characteristics including

J. Cornaggia et al. / Journal of Financial Economics 115 (2015) 189–209192
corporate governance (Meulbroek, Litchell, Mulherin,Netter, and Poulsen, 1990), stock liquidity (Fang, Tian, andTice, 2014), firm boundaries (Seru, 2014), analyst coverage(He and Tian, 2013), and institutional ownership (Aghion,Van Reenen, and Zingales, 2013). Few empirical studiesexamine the link between capital market developmentand firm innovation. Benfratello, Schiantarelli, andSembenelli (2008) show that local banking developmentincreases the “process innovation” (but not necessarilythe “product innovation”) of Italian manufacturing firms.Hsu, Tian, and Xu (2014) find that industries that are moredependent on external finance and that are more high-tech intensive exhibit a higher innovation level in coun-tries with better developed equity markets, but the devel-opment of credit markets appears to discourageinnovation in industries with these characteristics, usinga sample of 32 developed and emerging countries.
Our study is related to three contemporaneous papers.Amore, Schneider, and Zaldokas (2013) find that interstatebanking deregulation in the 1980s has a positive effect onthe innovative performance of public corporations. Chava,Oettl, Subramanian, and Subramanian (2013) show con-trasting effects of intrastate branching and interstatebanking deregulation on innovation by private firms.These authors find that interstate banking deregulationincreases innovation by young, private firms but intrastatebranching deregulation decreases innovation by thesefirms. Hombert and Matray (2013) examine the samederegulatory events as the above two papers and findthe number of innovators decreases after these twoderegulatory events. Unlike these three studies that exam-ine the effects of deregulatory events that occurred in the1970s and 1980s, we focus on the effects of interstatebranching deregulation which occurred in the mid-1990s.We find that interstate branching deregulation caused adecrease in the innovation output of corporations, but anincrease in the innovation output of external-finance-dependent private firms. We also show that declinedacquisition of small, innovative firms by public corpora-tions is an underlying mechanism that drives the reduc-tion in corporate innovation post-deregulation.
3 We use a patent's application year instead of its grant year becausethe application year better captures the actual time of innovation(Griliches, Pakes, and Hall, 1988).
4 For robustness, we exclude self-citations when counting the num-ber of citations. We find qualitatively similar results to those throughoutthe paper.
3. Sample selection and summary statistics
3.1. Sample selection
The sample includes U.S.-listed corporations and pri-vate firms during the period of 1976 to 2006. We compileour data set from several databases. We collect annualpatent and citation information from the latest version ofthe National Bureau of Economic Research (NBER) PatentCitation database. We obtain merger and acquisition(M&A) information from the Securities Data Company(SDC) M&A database, bank loan data from the ThomsonReuters DealScan database, and the number of privatenon-farm businesses from the U.S. Census Bureau. Toconstruct corporation-level control variables, we collectfinancial statement items from Compustat IndustrialAnnual Files.
3.2. Variable measurement
3.2.1. Measuring innovationWe construct the innovation variables from the latest
version of the NBER Patent Citation database initiallycreated by Hall, Jaffe, and Trajtenberg (2001). The databaseprovides detailed information on more than three millionpatents granted by the United States patent and trademarkoffice (USPTO) from 1976 to 2006. The patent databaseprovides annual information on patent assignee (owner)names, the number of patents, the number of citationsreceived by each patent, a patent's three-digit technologyclass, a patent's application year, and a patent's grant year.
Based on the information available in the NBER data-base, we construct two measures for a company-year'sinnovation output. The first measure is a company'snumber of patent applications filed in a year that areeventually granted.3 Although straightforward to compute,this measure cannot distinguish groundbreaking innova-tions from incremental discoveries. To further assess apatent's influence, we construct a second measure ofcompany innovation output by counting the number ofcitations the companies' patents receive in subsequentyears. Hence, the number of patents captures the quantityof innovation output while the number of citations cap-tures the importance and quality of innovation output.4
To reflect the long-term nature of investment in innova-tion, we consider the total innovation output generated inthe next three years in the future. This approach mitigatesthe influence of idiosyncratic shocks that could distortinnovation output in any particular year.
Following the existing innovation literature, we adjustthe innovation output measures to address two types oftruncation problems associated with the NBER database.The first truncation problem arises as patents appear inthe database only after they are granted. In fact, weobserve a gradual decrease in the number of patentapplications that are eventually granted as we approachthe last few years in the sample period (i.e., 2005 and2006). This truncation occurs because the lag between apatent's application year and its grant year is significant(about two years on average) and many patent applica-tions filed during these years were still under review andhad not been granted by 2006. To adjust the truncationbias in patent counts, following Hall, Jaffe, and Trajtenberg(2001), we adjust patent counts using the “weight factors”computed from the application-grant empirical distribu-tion. The second type of truncation problem is regardingthe citation counts, because patents keep receiving cita-tions over a long period of time, but we observe at bestonly the citations received up to 2006. Following Hall,Jaffe, and Trajtenberg (2001), we correct for the truncationin citation counts by estimating the shape of the citation-lag distribution.

J. Cornaggia et al. / Journal of Financial Economics 115 (2015) 189–209 193
To gauge public corporations' innovation productivity,we merge the NBER patent data with the Compustat firmsample using a bridge file provided by the NBER databasein which GVKEY is the common identifier. For casesin which the corporate headquarters is different fromthe assignee state, we use the headquarter state of thecorporation. To measure private firms' innovation output,we classify a firm as private if it does not have a GVKEY andtherefore cannot be matched with the Compustat data-base. We cross check this information with the UnitedStates Patent and Trademark Office (USPTO) (available athttp://www.uspto.gov/) and exclude assignees that areeither governments, universities, or individuals. Followingthe innovation literature, we set the number of patents tozero for companies that have no patent informationavailable from the NBER database.
In the baseline analysis, we aggregate patents gener-ated by corporations and firms to the state level and ourtests are based on state-year observations. In later tests inwhich we examine the economic mechanisms underlyingthe baseline analysis, we conduct tests at the companylevel. The distribution of patent grants in the sample isright-skewed. Therefore, we use the natural logarithm ofthe total number of weight-factor adjusted patent countsand the natural logarithm of the citation-lag adjustedcitations for patents generated in the subsequent threeyears, LnPat and LnCite, as the main innovation measuresin our analysis. To avoid losing observations with zeropatents or zero citations, we add one to the actual valueswhen calculating the natural logarithm.
3.2.2. Measuring banking competition and control variablesWe follow Rice and Strahan (2010) to construct an
index of interstate branching restrictions, RSindex. Asdescribed in Rice and Strahan (2010), the Interstate Bank-ing and Branching Efficiency Act (IBBEA) allowed states toemploy a variety of means to erect out-of-state entrybarriers from the time of enactment in 1994 until thebranching trigger date of June 1, 1997. Specifically, statescould set regulations on interstate branching with regardto four provisions: (i), the minimum age of the targetinstitution; (ii), de novo interstate branching; (iii), theacquisition of individual branches; and (iv) a statewidedeposit cap. When a state adds any of the above fourbarriers, we add one to the RSindex. Therefore, the RSindexranges from zero to four with zero indicating the mostopen stance toward interstate entry and four indicatingthe most restrictive stance toward interstate entry. SeeRice and Strahan (2010) for a detailed discussion on theinstitutional background and construction of the index.
In our baseline state-level analysis, we follow Morgan,Rime, and Strahan (2004) and compute the state-levellabor force composition for eight different industry seg-ments: Mining, Construction, Manufacturing, Transporta-tion, Trade, Finance, Service, and Government. We includethese measures in the baseline analysis. We also controlfor state-level labor force concentration and nominal grossproduct. To control for the effects of other banking dereg-ulatory events which occurred early in our sample period(i.e., the 1970s and 1980s), we construct two dummyvariables: Intra that equals zero the years before the focal
state pursued intrastate branching deregulation and oneotherwise (Jayaratne and Strahan, 1996), and Inter thatequals zero the years before the focal state pursuedinterstate banking deregulation and one otherwise (Blackand Strahan, 2002).
We conduct tests with corporation-year level data laterin the paper to better understand the mechanisms under-lying our baseline findings. In this analysis, we control fora vector of corporation and industry characteristics thatmay affect a corporation's future innovation output. Fol-lowing the innovation literature, we compute all variablesfor corporation i over its fiscal year t. Control variablesinclude investments in intangible assets (research anddevelopment expenditures divided by total assets), profit-ability (return on assets), asset tangibility (net propertyplant and equipment divided by total assets), leverage,capital expenditures (capital expenditures divided by totalassets), industry concentration (Herfindahl index based onsales), growth opportunities (Tobin's Q), corporation size(the natural logarithm of book value assets), and corpora-tion age. To mitigate nonlinear effects of product marketcompetition on innovation output (AghionBloom, Blundell,Griffith, and Howitt, 2005), we include the squared Her-findahl index in our baseline regressions. To minimize theeffect of outliers, we winsorize all variables that have thepotential to be unbounded at the 1st and 99th percentilesof their empirical distributions.
3.3. Summary statistics
Table 1 provides summary statistics of the variablesused in this study. Panel A provides information in theaggregate state-year level. On average, a state in oursample has 2,988 granted patents in the subsequent threeyears and these patents receive a total of 39,085 citations.Among them, 1,962 patents are generated by publiccorporations and 1,026 patents are produced by privatefirms. The average value of RSindex is 3.5 in the pooledsample. In Panels B and C, we separately report descriptivestatistics for public corporations and private firms, respec-tively. As reported in Panel B, at the corporation-year level,an average corporation generates five patents and 58citations over three years, has an external finance depen-dence (EFD) value of �0.27, has an R&D-to-assets ratio of4%, ROA of 2%, PPE-to-assets ratio of 32%, leverage of 31%,capital expenditure-to-assets ratio of 7%, Tobin's Q of 2.1,book value assets of $1.02 billion, and is 20 years old sinceits founding date. Panel C reports summary statistics forprivate firms. At the firm-year level, an average firmgenerates 0.7 patent and seven citations per year, has anEFD value of �0.31, borrows $0.04 million from in-statelenders, and borrows $0.36 million from out-of-statelenders.
Fig. 1 displays the time series of the total number ofpatents in the aggregate state-level produced by all com-panies across all states, by public corporations only, and byprivate firms only. We show that the aggregate level ofpatents has steadily increased since 1976. Although publiccorporations always generate more patents than privatefirms, the fraction of patents produced by public corpora-tions appears to decline relative to those produced by

Table 1Summary statistics.
This table reports summary statistics for the state-year, public corporation-year, and private firm-year observations in this paper's sample, includingdependent, independent, and control variables. Corporation and patent data come from Compustat and the NBER patent database from 1976–2006. Weobtain data from DealScan to construct banking relationship measures from 1987–2006 and data from SDC to construct acquisition measures from 1976–2006. Definitions of the variables are in Appendix A.
Panel A: State-year observations
Variable p25 Median Mean p75 S.D. N
RSindex 4 4 3.5 4 1.11 1,426Pat (state) 157 798 2,988 3,166 6,199 1,426Pat (corporation) 32 305 1,962 1,643 4,483 1,426Pat (firm) 106 388 1,026 1,209 1,852 1,426Cite (state) 1,379 7,521 39,085 36,277 95,369 1,426Cite (corporation) 250 2,531 26,778 18,767 69,552 1,426Cite (firm) 913 3,848 12,307 13,623 27,510 1,426Mining (%) 0.16 0.56 3.42 2.56 7.16 1,426Construction (%) 3.90 4.44 4.62 5.13 1.40 1,426Manufacturing (%) 12.0 17.2 17.2 23.1 8.0 1,426Transportation (%) 2.75 3.43 3.64 4.11 1.83 1,426Trade (%) 13.8 15.3 14.8 16.4 2.6 1,426Finance (%) 4.28 5.11 5.96 6.38 3.41 1,426Services (%) 13.4 16.6 17.6 21.1 5.8 1,426Government (%) 11.2 13.3 14.3 15.8 5.0 1,426Concentration (%) 11.5 12.5 13.1 13.8 2.9 1,426Gross product (billion) 25.4 58.0 113.9 136.8 158.4 1,426
Panel B: Public corporation-year observations
Variable p25 Median Mean p75 S.D. N
Pat 0 0 4.97 2 15.38 114,937Cite 0 0 57.76 22.53 178.73 114,937EFD �0.63 �0.38 �0.27 �0.11 0.78 114,728In-state loan (millions) 0 0 7 0 150 79,101Out-of-state (millions) 0 0 33 0 288 79,101Assets (millions) 20 99 1,018 625 2,157 84,902Age 8 17 20.10 31 14.30 88,986SA index �15.27 �9.36 �10.58 �5.49 6.08 84,902R&DAssets 0 0 0.04 0.03 0.10 133,643ROA 0.02 0.11 0.02 0.17 0.40 133,643PPEAssets 0.12 0.26 0.32 0.48 0.25 133,643Leverage 0.11 0.26 0.31 0.41 0.3 133,643CapexAssets 0.02 0.05 0.07 0.09 0.08 133,643Hindex 0.11 0.18 0.23 0.30 0.18 133,643TobinQ 0.99 1.3 2.1 2.0 3 133,643Dollar volume (millions) 0 0 4.1 0 36.2 119,843Number of deals 0 0 0.21 0 0.84 119,843Dollars per deal 0 0 0.02 0 0.41 119,843
Panel C: Private firm-year observations
Variable p25 Median Mean p75 S.D. N
Pat 0 0 0.73 1 0.92 463,831Cite 0 0 7.02 9.25 12.03 463,831EFD �0.73 �0.47 �0.31 �0.19 0.91 462,672In-state loan (millions) 0 0 0.04 0 3.38 342,524Out-of-state (millions) 0 0 0.36 0 24.01 342,524TargetCount 0 0 0.33 0 21.1 119,843TargetCountPerAcq 0 0 0.21 0 11.7 119,843
J. Cornaggia et al. / Journal of Financial Economics 115 (2015) 189–209194
private firms towards the end of the sample when theinterstate branching deregulation took place.
4. Empirical results
4.1. Baseline specification and results
As we discussed in the introduction, a major challengeof our study is the identification of the causal effects of
banking competition on innovation, due to both omittedvariables and reverse causality concerns. First, unobserva-ble industry or state characteristics related to both localbanking competition and innovation could remain in theresidual term of regressions. These unobservable charac-teristics make it difficult to draw correct statistical infer-ences from standard Ordinary least squares (OLS)regressions. Second, there is an old debate on the directionof causality between finance and economic growth. [See

0
20,000
40,000
60,000
80,000
100,000
Tota
l pat
ents
1976 1980 1984 1988 1992 1996 2000 2004
Year
State total number ofpatents for public corporations
State total number ofpatents for privatefirms
State total number of patents
Fig. 1. Patent production through time for corporations and private firms. This figure shows, for each year from 1976–2004, the total number of patentsproduced by U.S. corporations, the total number of patents produced by private firms in the U.S., and the sum of the two. We identify a patent as beingproduced by a corporation if it matches to a firm in the Compustat database. We assume a private firm produces the patent if it does not match to a firm inCompustat. We remove from the sample patents produced by universities, governments, and foreign companies.
J. Cornaggia et al. / Journal of Financial Economics 115 (2015) 189–209 195
Butler and Cornaggia (2011) for a recent review of thisliterature.] A large literature starting from Schumpeter(1911) argues that finance leads to economic growth[innovation is an important driver of economic growth(Solow, 1957)], while another large literature followsRobinson (1952, p. 86) who famously argues that “whereenterprise leads finance follows.” Our identification strat-egy is to exploit the staggered deregulation of interstatebank branching laws in the U.S., which generate plausiblyexogenous variation in states' banking competition envir-onments, following Rice and Strahan (2010). One keyadvantage of this identification strategy is that there aremultiple shocks that affect different states at differenttimes, which allows us to overcome a common difficultyfacing studies with a single shock: the potential existenceof omitted variables coinciding with the shock that affecteconomic outcomes (innovation, in our case).
Specifically, to assess how banking competition affectsinnovation, we estimate the following model:
LnPati;tþ1 to tþ3 ¼ αþβ RSindexi;tþγZi;tþYeartþStateiþεi;t ;
ð1aÞwhere i indexes state and t indexes time. The dependentvariable in Eq. (1a) is the natural logarithm of the totalnumber of patents generated in a state in the followingthree years. We measure the banking competition variable,RSindex, for state i in year t. Z is a vector of controls thatincludes state-level labor force composition for eightdifferent industry segments, labor force concentration,gross product, and dummies for other early bankingderegulatory events. Yeart and Statei capture year and statefixed effects, respectively. We cluster standard errors byyear in our baseline tests.
We include state fixed effects in the baseline regression.This approach addresses the concern that unobservable
variables omitted from Eq. (1a) that generate variation in astate's stance toward openness to interstate branching mightbe correlated with innovativeness, rendering our findingsspurious. For example, if states with vibrant economic activ-ities and strong growth opportunities are more likely toderegulate, then the state-level economic activities andgrowth opportunities are unobservables that correlate withboth innovativeness and RSindex, which could bias ourcoefficient estimate of RSindex downward. Including statefixed effects will strip out any persistent differences acrossstates. We report the OLS regression results estimating Eq.(1a) in column 1 of Table 2 Panel A.
The coefficient estimates of RSindex are positive andsignificant at the 1% level. This finding suggests that anincrease in banking competition due to deregulation (i.e., adecrease in RSindex) leads to a decrease in the number ofpatents in the first three subsequent years. To be moreconcrete, based on the coefficient estimate of RSindex incolumn 1, states that are completely open to interstatebranching generated a total of 30.8% (¼4�0.077) fewerpatents in the subsequent three years post-branchingderegulation than states with the most restrictions oninterstate branching three years after deregulation.
The effect of banking competition on patent quantity islarge: The above reduction translates to a drop of 920patents over the three years after a deregulatory event.(Table 1 Panel A shows the average number of patentsproduced in a state over the three years after a dereg-ulatory event is 2,988. The product of 2,988 and 30.8% is920.) This reduction in patent quantity is also large relativeto the variability of patent production over time. We makethis comparison by taking the average of state-level patentproduction in each of the 31 years of our sample. Thestandard deviation of these 31 observations is 449 patents.Therefore, because a reduction of 920 patents per state over

Table 2Baseline regressions.
This table reports OLS regression estimates for baseline regressions. Panel A reports the OLS regression estimates of Eqs. (1a) and (1b). The dependentvariable in columns 1–3 is the natural logarithm of one plus the sum of the patents generated in a state in the next three years. The dependent variable incolumns 4–6 is the natural logarithm of one plus the number of citations for patents generated in a state in the next three years. Panel B reports the OLSregression estimates of Eqs. (1a) and (1b). The dependent variable in columns 1–3 is the patent generality score for patents generated in the next threeyears. The dependent variable in columns 4–6 is the patent originality score generated in the next three years. Definitions of control variables are inAppendix A. Robust standard errors clustered by year are reported in parentheses. Significance at the 1%, 5%, and 10% level is indicated by nnn, nn, and n,respectively. Observations are at the state-year level from 1976–2003.
Panel A: Patents and patent citations
LnPat LnCite
Total Public Private Total Public Private(1) (2) (3) (4) (5) (6)
RSindex 0.077nnn 0.102nnn 0.030 0.058nnn 0.066nn 0.041(0.016) (0.021) (0.018) (0.019) (0.028) (0.024)
Mining 0.013 0.031nn 0.001 0.013 0.098nnn 0.000(0.008) (0.015) (0.006) (0.013) (0.028) (0.010)
Construction �0.012 0.055n �0.028nn �0.004 0.115nn �0.023(0.008) (0.029) (0.010) (0.010) (0.050) (0.014)
Manufacturing 0.016 0.023 �0.001 0.014 0.077nnn �0.000(0.010) (0.020) (0.007) (0.014) (0.023) (0.011)
Transportation �0.063nn �0.139n �0.034n �0.082nn �0.190 �0.042n
(0.029) (0.077) (0.019) (0.031) (0.113) (0.022)Trade 0.122nnn 0.116nnn 0.090nnn 0.125nnn 0.172nnn 0.077nnn
(0.015) (0.035) (0.014) (0.024) (0.058) (0.022)Finance �0.005 �0.027 0.048nnn �0.017 �0.010 0.037nnn
(0.009) (0.016) (0.007) (0.011) (0.022) (0.009)Service �0.090nnn �0.103nnn �0.083nnn �0.104nnn �0.060nn �0.106nnn
(0.010) (0.023) (0.008) (0.016) (0.025) (0.014)Government �0.045nnn �0.069nnn �0.058nnn �0.045nn �0.039 �0.058nnn
(0.010) (0.022) (0.010) (0.017) (0.037) (0.018)Concentration 0.002 0.075nnn �0.028n 0.009 0.060nn �0.043nn
(0.017) (0.020) (0.015) (0.020) (0.026) (0.019)Gross product �0.000 �0.000 0.000 0.000 �0.000 0.000
(0.000) (0.000) (0.000) (0.000) (0.000) (0.000)Intra �0.226nnn �0.402nnn �0.058nnn �0.253nnn �0.468nnn �0.098nn
(0.040) (0.060) (0.020) (0.038) (0.067) (0.039)Inter �0.095nn �0.084 �0.045 �0.166nnn �0.216nn �0.091n
(0.035) (0.055) (0.038) (0.044) (0.087) (0.046)Constant 2.548nnn �0.003 3.512nnn 4.764nnn �1.876 6.068nnn
(0.455) (1.232) (0.471) (0.683) (1.572) (0.682)State FE Yes Yes Yes Yes Yes YesYear FE Yes Yes Yes Yes Yes YesObservations 1,426 1,426 1,426 1,426 1,426 1,426Adjusted R2 0.966 0.927 0.971 0.954 0.901 0.954
Panel B: Generality and originality
Generality Originality
Total Public Private Total Public Private(1) (2) (3) (4) (5) (6)
RSindex �0.002 �0.005 �0.002 �0.002 �0.003 �0.002(0.002) (0.005) (0.003) (0.003) (0.005) (0.003)
Mining �0.001 0.001 �0.001 �0.000 �0.001 �0.000(0.002) (0.003) (0.002) (0.002) (0.005) (0.002)
Construction �0.001 �0.000 �0.002 �0.001 �0.003 �0.002(0.002) (0.006) (0.002) (0.004) (0.005) (0.004)
Manufacturing �0.000 0.002 �0.001 �0.001 �0.004 �0.002(0.001) (0.003) (0.002) (0.002) (0.004) (0.002)
Transportation �0.001 �0.004 0.004 �0.000 0.005 0.001(0.003) (0.009) (0.005) (0.007) (0.012) (0.006)
Trade �0.000 0.006 0.001 �0.001 �0.007 �0.000(0.003) (0.007) (0.004) (0.004) (0.008) (0.004)
Finance �0.004nnn 0.000 �0.006nnn �0.003 �0.005 �0.004nn
(0.001) (0.003) (0.002) (0.002) (0.004) (0.002)Service �0.001 0.009 �0.002 �0.000 0.001 �0.002
(0.003) (0.006) (0.003) (0.002) (0.006) (0.002)
J. Cornaggia et al. / Journal of Financial Economics 115 (2015) 189–209196

Table 2 (continued )
Panel A: Patents and patent citations
LnPat LnCite
Total Public Private Total Public Private(1) (2) (3) (4) (5) (6)
Government 0.001 0.003 0.001 �0.004 �0.005 �0.003(0.002) (0.004) (0.002) (0.003) (0.004) (0.003)
Concentration 0.008nnn 0.003 0.005nn 0.005nn 0.006 0.004n
(0.002) (0.005) (0.002) (0.003) (0.006) (0.002)Gross product �0.000nn �0.000 �0.000nn �0.000 �0.000 �0.000
(0.000) (0.000) (0.000) (0.000) (0.000) (0.000)Intra �0.006 0.002 �0.008 0.004 0.019 0.004
(0.006) (0.013) (0.006) (0.007) (0.013) (0.006)Inter �0.001 �0.010 �0.005 �0.006 0.000 �0.014n
(0.008) (0.015) (0.008) (0.007) (0.014) (0.008)Constant 0.313nnn 0.086 0.278nn 0.192 0.235 0.182
(0.097) (0.184) (0.122) (0.145) (0.234) (0.138)State FE Yes Yes Yes Yes Yes YesYear FE Yes Yes Yes Yes Yes YesObservations 1,417 1,312 1,414 1,418 1,324 1,417Adjusted R2 0.913 0.802 0.893 0.895 0.725 0.901
J. Cornaggia et al. / Journal of Financial Economics 115 (2015) 189–209 197
three years implies a reduction of 307 patents per state-year,this comparison shows that the reduction in patent quantityas a result of branching deregulation is equal to 68.4% of thevariability of patent production over time. (The quotient of307 patents and 449 patents is 68.4%).5
Although our evidence in column 1 suggests thatbranching deregulation adversely affects innovation bycompanies headquartered in the state, the negative effectcould be different for public corporations and privatefirms. In particular, private firms could be more sensitiveto local banking conditions than public corporations. In thenext two columns, we separate patents generated bypublic corporations and those generated by private firmsto examine whether banking competition affects innova-tion by these two types of companies differently. Weestimate Eq. (1a) separately for public corporations andprivate firms and report regression results in columns 2and 3, respectively. The coefficient estimate of RSindex inthe sample of patents generated by public corporations ispositive and significant at the 1% level, while that in thesample of patents produced by private firms is not statis-tically significant. The evidence suggests that the negativeeffect of banking competition due to deregulation onpatent counts is driven by public corporations. This testuncovers no effect of deregulation on patent quantity ofprivate firms.6
5 In an untabulated analysis, we examine the effect of bankingderegulation on the number of patents generated in individual years(i.e., one, two, and three years) after deregulation. Consistent with ourresults in Table 2 Panel A, we find that an increase in banking competi-tion due to deregulation leads to a decrease in the number of patents ineach of the first three subsequent years.
6 In an untabulated analysis, we further explore the different effectsof deregulation on innovation by public corporations and private firms byreplacing the dependent variable with the raw difference between thenumber of patents produced by these two types of companies as well asthe ratio of patents produced by these two types of companies. We find
Next, we examine the effect of banking competition onpatent quality by replacing the dependent variable withour innovation quality proxy, the natural logarithm ofpatent citations, and estimate the following model:
LnCitei;tþ1 to tþ3 ¼ αþβ RSindexi;tþγZi;tþYeartþStatei
þεi;t : ð1bÞ
We report the results in columns 4–6. These testsparallel the first three columns in Panel A. In column 4,we find that the coefficient estimate of RSindex is positiveand significant at the 1% level, suggesting that an increasein banking competition due to deregulation results in adecrease in the quality of patents generated by thecompanies headquartered in the state in the subsequentthree years. To gauge the economic significance, based onthe coefficient estimate of RSindex in column 4, states thatare completely open to interstate branching generated atotal of 23.2% (¼4�0.058) fewer citations for patentsgenerated in the subsequent three years post-branchingderegulation than states with the most restrictions oninterstate branching three years after deregulation.
The effect of banking competition on patent quality islarge: The above reduction translates to a drop of 9,068citations per state for patents generated over the threeyears after a deregulatory event. (Table 1 Panel A shows theaverage number of citations on patents produced in a stateover the three years after a deregulatory event is 39,085.The product of 39,085 and 23.2% is 9,068.) This reduction inpatent quality is also large relative to the variability ofpatent citations over time. We make this comparison bytaking the average of citations on state-level patents in eachof the 31 years of our sample. The standard deviation ofthese 31 observations is 8,486 citations. Therefore, because
(footnote continued)that the gap in patent output between public corporations and privatefirms decreases in the three years following deregulation.

J. Cornaggia et al. / Journal of Financial Economics 115 (2015) 189–209198
a reduction of 9,086 patent citations over three yearsimplies a reduction of 3,022 citations per state-year, thiscomparison shows that the reduction in patent quality as aresult of branching deregulation is equal to 35.6% of thevariability of patent citations over time. (The quotient of3,022 citations and 8,486 citations is 35.6%).
In the next two columns, we once again separatepatents generated by public corporations and those gen-erated by private firms and estimate Eq. (1b) to evaluatewhether banking competition affects patent quality bythese two types of firms differently. We continue toobserve a positive and significant coefficient estimate ofRSindex in the sample of patents generated by publiccorporations but an insignificant estimate of RSindex inthe sample of patents generated by private firms. Consis-tent with our findings from patent counts, the evidencesuggests that the negative effect of banking competitionon patent quality is driven by public corporations.
Although a larger number of patent citations is typicallyinterpreted as the patent having greater impact, thedistribution of citations is also important. Hence, weconstruct two more patent-based measures, patent origin-ality and generality, following Hall, Jaffe, and Trajtenberg(2005). We then examine the effect of banking competi-tion on these two measures that capture the underlyingnature of innovation being patented. Patents that cite awider array of technology classes of patents are viewed ashaving greater originality. We define a patent's originalityscore as one minus the Herfindahl index of the three-digittechnology class distribution of all the patents it cites.Therefore, the higher a patent's originality score, the morethe patent draws upon a diverse array of existing knowl-edge. In a similar spirit, patents being cited by a widerarray of technology classes of patents are considered ashaving greater generality. We define a patent's generalityscore as one minus the Herfindahl index of the three-digittechnology class distribution of all the patents that cite it.The higher a patent's generality score, the more that thepatent is being draw upon by a more diverse array ofsubsequent patents. We then average the individualpatents' originality and generality scores at the state level.For states that generate no patents in a year, their patentsgenerality and originality scores are undefined and there-fore treated as missing.
We replace the dependent variable with patent origin-ality and generality in Eq. (1a) and report the regressionresults in Panel B. Like before, we evaluate the effect ofbanking competition on patent originality and generalitygenerated by both types of companies, by public corpora-tions only, and by private firms only in columns 1–3 andcolumns 4–6, respectively. The coefficient estimates ofRSindex are statistically insignificant in all columns, sug-gesting that while banking deregulation negatively affectspatent quantity and quality as we documented before,it does not directly affect the underlying nature of innova-tion being patented.7 Therefore, in the rest of the paper,
7 Because both patent originality and generality scores are boundedbetween zero and one, we use a Tobit model and find qualitatively similarresults.
we focus on the analyses that examine the effect of bankingcompetition on innovation quantity and quality measuredby patent counts and citations.
We undertake a rich set of robustness tests for ourbaseline results and discuss the details of these tests in theInternet Appendix. We find that our baseline results arerobust to alternative ways of clustering standard errors,alternative econometric models that address the certainfeatures of innovation variables (i.e., right-skewed, non-negative discrete variable), alternative subsamples, andseveral specifications designed to rule out reverse caus-ality concerns arising from companies' decisions on whereto establish or relocate their headquarters. Overall, ourbaseline results suggest that an exogenous increase inbanking competition due to staggered interstate branchingderegulation results in a lower state-level innovation out-put in subsequent years. This reduction in innovationoutput is driven by public corporations.
4.2. Additional endogeneity tests
As discussed above, although the staggered deregula-tion of interstate branching laws in the U.S. representsan exogenous shock to banking competition, Kroszner andStrahan (1999) argue that state-level factors that mani-fest differently across states could have affected the timingof deregulation in different states. A reverse causalityconcern may arise if the states also differ in their innova-tion intensities and such differences triggered the dereg-ulation. Our robustness tests reported in the InternetAppendix mitigate such concerns. Specifically, we restrictour state-level analysis to patents produced by corpora-tions that do not relocate their headquarters any timeduring the sample period or corporations that are head-quartered within a state at least three years before anychanges in bank branching laws and find robust results.To further explore the possibility of reverse causality,we follow Bertrand and Mullainathan (2003) to examinethe dynamics of innovation surrounding deregulatoryevents. If reserve causality is indeed present, we shouldobserve changes in innovation prior to deregulatoryevents.
To check the pre-existing trends in innovation, werestrict our sample to a 21-year window surrounding state-deregulation years (ten years before and ten years after). Wedecompose each of the four components of the RSindexinto four dummy variables associated with four periodsaround the deregulation year: all years up to and includingtwo years prior to deregulation, one year prior to dereg-ulation, one year post-deregulation, and two years or morepost-deregulation. We then sum over the four componentsof the RSindex to obtain four new variables, Before2þ ,Before1, After1, and After2þ , corresponding to the four timeperiods around each deregulation. The deregulation year isthe reference year in this setting. The coefficient estimatesof Before2þ and Before1 are especially important becausetheir significance and magnitude would indicate whetherthere is any relation between innovation and deregulatoryevents before interstate branching laws were changed. We

Table 3Endogeneity tests.
This table reports OLS regression estimates of Eq. (2). We truncate the state-year panel to a 7 ten-year window around deregulatory events. Definitionsof variables are in Appendix A. Robust standard errors clustered by year are reported in parentheses. Significance at the 1%, 5%, and 10% level is indicated bynnn, nn, and n, respectively.
LnPat LnCite
Total Public Private Total Public Private(1) (2) (3) (4) (5) (6)
Before2þ 0.033 0.060 �0.006 0.014 �0.026 0.066(0.058) (0.037) (0.052) (0.035) (0.073) (0.047)
Before1 �0.103 �0.031 �0.111 �0.067 �0.094 �0.019(0.095) (0.032) (0.089) (0.057) (0.131) (0.073)
After1 �0.086n �0.081nn �0.063 �0.028 �0.056 0.001(0.050) (0.030) (0.049) (0.049) (0.124) (0.036)
After2þ �0.130n �0.091nnn �0.100 �0.075nn �0.169n �0.045(0.070) (0.029) (0.065) (0.031) (0.083) (0.040)
Constant 0.627nnn 0.573nnn 0.012 2.351nnn 2.432nnn �0.132(0.117) (0.075) (0.105) (0.070) (0.146) (0.095)
State FE Yes Yes Yes Yes Yes YesYear FE Yes Yes Yes Yes Yes YesObservations 910 910 910 910 910 910Adjusted R2 0.936 0.925 0.924 0.940 0.893 0.937
J. Cornaggia et al. / Journal of Financial Economics 115 (2015) 189–209 199
estimate the following model:
LnPati;tðLnCitei;tÞ ¼ αþβ1 Bef ore2þi;e þβ2 Bef ore
1i;t
þβ3 Af ter1i;tþβ4 Af ter
2þi;t þYeartþStateiþεi;t ; ð2Þ
where i indexes state and t indexes time.In Table 3 we report the regression results estimating
Eq. (2). In column 1, we report the results for patentsgenerated by both public corporations and private firms.The coefficient estimates of Before2þ and Before1 are notsignificant, suggesting that state-level innovation showsno significant change prior to interstate branching dereg-ulation. The coefficient estimates of After1 and After2þ arenegative and significant, consistent with our baselinefindings. In column 2, we focus on patents generated bypublic corporations and find similar results: The coeffi-cient estimates of Before2þ and Before1 are not significantwhile those of After1 and After2þ are negative and sig-nificant. We report results for patents generated by privatefirms in column 3. None of Before2þ , Before1, After1, andAfter2þ is statistically significant. This non-result indicatestrends in innovation by private firms do not reverse-causebranching deregulation. In columns 4–6, we repeat thesetests with patent citations as the dependent variable andwe observe a similar pattern around the deregulation year.The evidence for patent citations is slightly weaker thanwhat we find for patent production, but the results showthat patent citations decline only after branching dereg-ulation. Overall, the results presented in Table 3 suggestthat, whether we consider all companies, or public cor-porations and private firms separately, there is not a pre-existing trend in innovation before interstate branchingderegulation. These results mitigate concerns about reversecausality.
Another concern that prevents us drawing a causalinterpretation of banking competition on innovation fromour baseline regressions is an omitted variables problem:Unobservable shocks or variables that are omitted from
our analysis but coincide with state-level deregulatoryevents could drive our results. To address this concern,we conduct placebo tests to check whether our resultsdisappear whenwe artificially (i.e., incorrectly) assume thederegulation occurs in years other than the actual dereg-ulation year. We do this by first obtaining an empiricaldistribution of years when states deregulated from Riceand Strahan (2010). We then randomly assign states intoeach of these deregulation years (without replacement)following the empirical distribution. This approach main-tains the distribution of deregulatory years from ourbaseline specification, but it disrupts the proper assign-ment of deregulation years to states. Therefore, if anunobservable shock occurs at approximately the sametime as the deregulation events in the mid-1990s, it shouldstill reside in the testing framework, and thus have anopportunity to drive the results. However, if no such shockexists, then our incorrect assignments of deregulatoryyears to states should weaken our results when we re-estimate our baseline regressions in Eqs. (1a) and (1b). Wereport the results in Table 4. The coefficient estimates ofRSindex are statistically insignificant and not different fromzero in all columns.
Overall, the various tests for reverse causality andomitted variables reported in this subsection support thenotion that banking competition due to deregulationappears to have a causal, negative effect on state-levelinnovation output, which is mainly driven by publiccorporations.
5. Mechanisms
Our evidence so far shows a robust, negative effect ofstate-level banking competition on innovation by publiccorporations, which does not appear to be driven by a pre-existing trend in innovation output prior to deregulationnor omitted shocks coinciding with the deregulation.However, our tests reveal no effect of banking competition

Table 4Randomization of deregulations.
This table reports OLS regression estimates of Eqs. (1a) and (1b) with randomized state deregulations. The dependent variable in columns 1–3 is thenatural logarithm of one plus the sum of the patents generated in the next three years. The dependent variable in columns 4–6 is the natural logarithm ofone plus the number of citations for patents generated in the next three years. Definitions of control variables are in Appendix A. Robust standard errorsclustered by year are reported in parentheses. Significance at the 1%, 5%, and 10% level is indicated by nnn, nn, and n, respectively. Observations are at thestate-year level from 1976–2003.
LnPat LnCite
Total Public Private Total Public Private(1) (2) (3) (4) (5) (6)
RSindex 0.002 �0.028 0.020 �0.007 �0.091 0.019(0.038) (0.070) (0.027) (0.041) (0.095) (0.033)
Mining 0.011 0.030 0.001 0.012 0.098n �0.000(0.032) (0.048) (0.027) (0.033) (0.053) (0.028)
Construction �0.009 0.059 �0.027 �0.002 0.118 �0.022(0.037) (0.068) (0.023) (0.043) (0.080) (0.033)
Manufacturing 0.017 0.025 0.000 0.015 0.076 0.001(0.026) (0.044) (0.023) (0.028) (0.054) (0.023)
Transportation �0.069 �0.144 �0.037 �0.086 �0.190 �0.046(0.068) (0.151) (0.038) (0.072) (0.214) (0.041)
Trade 0.130nn 0.126 0.093nn 0.131n 0.177 0.082(0.061) (0.109) (0.041) (0.072) (0.137) (0.054)
Finance �0.004 �0.025 0.047n �0.016 �0.004 0.037(0.028) (0.046) (0.027) (0.028) (0.058) (0.026)
Service �0.101nnn �0.117n �0.088nn �0.112nn �0.067 �0.112nnn
(0.038) (0.067) (0.038) (0.045) (0.084) (0.041)Government �0.043 �0.066 �0.057nn �0.043 �0.038 �0.057
(0.036) (0.071) (0.027) (0.049) (0.095) (0.041)Concentration 0.009 0.084 �0.026 0.014 0.066 �0.040
(0.042) (0.067) (0.033) (0.046) (0.088) (0.037)Gross product �0.000 �0.000 0.000 0.000 �0.000 0.000
(0.000) (0.000) (0.000) (0.000) (0.000) (0.000)Intra �0.200 �0.373 �0.044 �0.235 �0.465 �0.081
(0.123) (0.246) (0.061) (0.163) (0.325) (0.100)Inter �0.068 �0.052 �0.032 �0.147nnn �0.207 �0.074
(0.043) (0.096) (0.068) (0.047) (0.134) (0.096)Constant 10.433nnn 8.331n 10.781nnn 9.013nnn 4.421 10.252nnn
(2.298) (4.939) (1.429) (2.674) (6.466) (1.755)State FE Yes Yes Yes Yes Yes YesYear FE Yes Yes Yes Yes Yes YesObservations 1,426 1,426 1,426 1,426 1,426 1,426Adjusted R2 0.966 0.926 0.971 0.954 0.901 0.954
J. Cornaggia et al. / Journal of Financial Economics 115 (2015) 189–209200
on innovation by private firms. In this section, we explorepossible underlying mechanisms through which bankingcompetition may affect companies' innovation output.Specifically, we examine whether external finance depen-dence, prior banking relationships, and acquisitions ofprivate, innovative firms by public corporations are possi-ble underlying economic mechanisms through whichbanking competition affects innovation. To facilitate theexploration of mechanisms, we expand the state-yearsample used in the baseline tests in Section 4 tocorporation-year and private firm-year samples in thissection. To save space, we suppress the coefficient esti-mates of all controls in the tables reported in this section.
5.1. External finance dependence
Although we show banking competition has a negativeeffect on public corporations' innovation and has no effecton private firms' innovation, the reduced cost of capitalwithin states due to bank branching deregulation (Rice andStrahan, 2010) may still relax financing constraints for these
firms. Therefore, it is possible that public corporations aswell as private firms that are in external-finance-dependentindustries could take advantage of state-level bankingcompetition to improve their innovative output. In thissection, we examine whether companies' dependence onexternal finance is an underlying mechanism.
If banking competition directly affects the access tocredit of corporations and firms, which increases theirinnovativeness as suggested by the literature showingfinance creates growth, we expect that corporations andfirms that are external-finance-dependent should havean increase, instead of a decrease, in innovation outputafter banking competition increases. Using the measureof external finance dependence developed by Duchin,Ozbas, and Sensoy (2010), we construct a dummy variable,Dependencet, which equals one for corporation-yearsbelow the industry median external finance dependence(EFD) value (i.e., less external-finance-dependent) and zerofor corporation-years above the industry median externalfinance dependence value (i.e., more external-finance-dependent). To capture private firms' external financedependence, we first define a private firm's industry

Table 5External financial dependence.
This table reports OLS regression estimates of Eq. (3). We consider companies with EFD values above the median EFD (Dependence¼0) in year t to befinancially dependent. Definitions of control variables are in Appendix A. Robust standard errors clustered by year are reported in parentheses. Significanceat the 1%, 5%, and 10% level is indicated by nnn, nn, and n respectively. Observations are at the firm-year level from 1976–2003.
Private firms Public corporations
LnPat LnCite LnPat LnCite(1) (2) (3) (4)
RSindex �0.019nnn �0.016nn �0.021 �0.060(0.003) (0.007) (0.029) (0.047)
Dependence �0.228nnn �0.315nnn �0.460n �0.605n
(0.013) (0.028) (0.232) (0.307)RSindex�Dependence 0.046nnn 0.049nnn 0.136nn 0.194nn
(0.004) (0.007) (0.062) (0.094)Constant 1.256nnn 2.749nnn 0.256nn 0.347nn
(0.134) (0.361) (0.112) (0.166)Controls Yes Yes Yes YesState FE Yes Yes Yes YesYear FE Yes Yes Yes YesIndustry FE Yes Yes Yes YesObservations 223,655 223,655 76,015 76,015Adjusted R2 0.199 0.085 0.129 0.154
8 Because the coefficient estimate of RSindex is not statisticallysignificant, the coefficient estimate of the interaction term captures themarginal effect of RSindex for corporations that are less external-finance-dependent.
J. Cornaggia et al. / Journal of Financial Economics 115 (2015) 189–209 201
membership based on the technology classifications ofpatents which it files. We use a mapping file provided byBrian Silverman (available at http://www-2.rotman.utoronto.ca/�silverman/ipcsic/documentation_IPC-SIC_concordance.htm) which links the International Patent Code (IPC)assigned to each patent by USPTO to a distribution ofthree-digit standard industrial classification (SIC) codes.We then impute EFD numbers from public corporations inindustry j in year t to private firms in the same industryand year. For each private firm-year, we then compute theaverage EFD and carry this value forward for private firm-years in which no patents are generated. Similarly, weconstruct a dummy variable, Dependencet, for privatefirms, which equals one for firm-years below the industrymedian EFD value and zero for firm-years above theindustry median external finance dependence value.
To examine how a company's external finance depen-dence alters the marginal impact of banking competitionon its innovation output, we estimate the following model:
LnPati;tþ1 to tþ3ðLnCitei;tþ1 to tþ3Þ¼ αþβ1 RSindexk;tþβ2 Dependencei;tþβ3 RSindexk;t
�Dependencei;tþγZi;k;tþ IndustryjþYeartþStatekþεi;t ;
ð3Þwhere i indexes company, t indexes time, j indexesindustry, and k indexes state. The dependent variablecaptures company innovation outcomes and is eitherpatent counts or patent citations. We add the new variable,Dependencet, and the interaction term between RSindexand Dependencet. The coefficient estimate of RSindex cap-tures the effect of banking competition on innovation forcompanies that are more external-finance-dependent. Thecoefficient on the interaction term reflects the differenteffects of banking competition on innovation for compa-nies that are less external-finance-dependent. If our con-jecture is correct, i.e., if more external-finance-dependentcompanies take advantage of banking competition and
improve their innovation output, then we expect β1 to benegative and significant.
We report the results estimating Eq. (3) in Table 5.In columns 1 and 2, we present the regressions for privatefirms. The coefficient estimates of RSindex are negative inboth specifications and significant at the 1% or 5% level,which suggests that banking competition has a positiveeffect on innovation output by private firms that are moredependent on external finance. Based on the coefficientestimate reported in column 1, more external-finance-dependent firms located in states that are completely opento interstate branching generate a total of 7.6% (¼4�0.019) more patents in the first three years post-branchingderegulation than firms in states with the most restric-tions on interstate branching. These findings suggest thatbanking competition enhances innovation by moreexternal-finance-dependent private firms.
Columns 3 and 4 present the results for public corpora-tions. The coefficient estimates of RSindex are negative butinsignificant, suggesting that an increase in banking com-petition (i.e., a decrease in RSindex) does not appear toaffect innovation output for corporations that are moredependent on external finance. Based on the coefficientestimate of the interaction term reported in column 3, themarginal effect of RSindex for corporations that are lessexternal-finance-dependent is 0.136.8 The evidence sug-gests that although deregulation adversely affects publiccorporations' innovation on average, this effect mainlycomes from the group of corporations that are lessexternal-finance-dependent. For external-finance-dependentcorporations, deregulation does not adversely affect theirinnovation output.

Table 6External financial dependence with alternative proxies: Assets, age, bank-dependences and SA index.
This table reports OLS regression estimates of Eq. (3). Panel A defines companies with asset values below the median asset value in year t as financiallydependent (Dependence¼0). Panel B defines companies with age below the median age value in year t as financially dependent (Dependence¼0). Panel Cdefines companies with accumulative bank loans (both in-state and out-of-state) above the median accumulative bank loans in year t as financiallydependent (Dependence¼0). Panel D defines companies with SA index below the median SA index in year t as financially dependent (Dependence¼0),where SA index¼�0.737� Ln (assets)þ0.043� Ln (assets)2�0.04� age). Definitions of control variables are in Appendix A. Robust standard errorsclustered by year are reported in parentheses. Significance at the 1%, 5%, and 10% level is indicated by nnn, nn, and n respectively. Observations are at thefirm-year level from 1976–2003.
Panel A: Assets Panel B: Age Panel C: Bank dependence Panel D: SA index
LnPat LnCite LnPat LnCite LnPat LnCite LnPat LnCite(1) (2) (3) (4) (5) (6) (7) (8)
RSindex �0.009nnn �0.017nn �0.012nn 0.004 �0.018nnn �0.033nnn �0.012nnn 0.004(0.003) (0.007) (0.006) (0.012) (0.003) (0.008) (0.004) (0.007)
Dependence �0.288nnn �0.517nnn �0.053nn 0.043 �0.560nnn �1.043nnn �0.064nnn 0.019(0.013) (0.027) (0.026) (0.065) (0.030) (0.060) (0.014) (0.026)
RSindex�Dependence 0.030nnn 0.055nnn 0.029nnn 0.010 0.076nnn 0.137nnn 0.029nnn 0.012n
(0.003) (0.007) (0.007) (0.017) (0.017) (0.035) (0.004) (0.007)Constant 1.263nnn 2.795nnn 1.198nnn 2.586nnn 1.464nnn 3.191nnn 1.201nnn 2.609nnn
(0.143) (0.364) (0.210) (0.733) (0.149) (0.399) (0.135) (0.358)Controls Yes Yes Yes Yes Yes Yes Yes YesState FE Yes Yes Yes Yes Yes Yes Yes YesYear FE Yes Yes Yes Yes Yes Yes Yes YesIndustry FE Yes Yes Yes Yes Yes Yes Yes YesObservations 223,655 223,655 223,655 223,655 223,655 223,655 223,655 223,655Adjusted R2 0.205 0.089 0.198 0.084 0.211 0.094 0.198 0.072
J. Cornaggia et al. / Journal of Financial Economics 115 (2015) 189–209202
We examine the robustness of this finding by splittingour sample according to a variety of alternative partitionvariables that are proxies for external finance dependence,following Acharya, Imbs, and Sturgess (2011) and Hadlockand Pierce (2010). Specifically, we partition our samplebased on company size, age, bank-dependence, and the SAindex. We follow the same procedure described above forthe EFD measure to impute these alternative partitionvariables from public corporations in industry j in year t toprivate firms in the same industry and year. We also defineDependencet for these alternative partition variablesthe same way as before, i.e., it equals one for the firm-years (corporation-years) that are considered to be lessexternal-finance-dependent and zero for firm-years (corpora-tion-years) that are considered to be more external-finance-dependent. For brevity, we focus our attention on privatefirms in this robustness analysis and report the results inTable 6. Untabulated results from public corporations arequalitatively similar to those reported in Table 5.
Panel A presents the results when we use assets asthe partition variable. Panel B reports the findings if weuse age to slice the sample. Panel C presents the resultsbased on bank dependence. We define a sector as bank-dependent if the cumulative dollar value of loans bor-rowed by companies in the sector up to a given year isgreater than the median in the year. Finally, in Panel D, wereport the results when the sample is partitioned by the SAindex. We observe the coefficient estimates of RSindex areall negative and significant except for columns 4 and 8,suggesting that banking competition has a positive effecton both patent quantity and quality by private firms thatare more dependent on external finance. The evidence isconsistent with the findings reported in Table 5.
Overall, the evidence reported in this section indicatesthat banking competition relaxes financial constraints forprivate firms that are more dependent on external finance.As a consequence, these firms generate more patents andtheir patents receive more citations after deregulation.Therefore, dependence on external finance appears to beone underlying mechanism through which banking com-petition affects innovation.
5.2. Prior banking relationships
Next, we examine whether companies' prior bankingrelationships interact with changes in banking competi-tion to affect their innovation output. We hypothesize thatin-state banking relationships prior to deregulatory eventsare evidence that companies are able to satisfy theirdemand for capital from nearby banks. However, if com-panies borrow from out-of-state banks prior to deregula-tory events, it indicates that such companies are unable tosatisfy their demand for capital from nearby banks. There-fore, if banking competition due to interstate branchingderegulation expands access to finance and if companiesuse it to finance their innovative projects, then the innova-tion output of companies that borrow more from out-of-state banks prior to deregulation should increase followingincreases in banking competition.
To make the distinction between in-state and out-of-state banking relationships, we collect information fromDealScan about the physical locations of banks fromwhichcompanies take loans. DealScan reports the state in whicha lender is located. In the case that multiple lenders arereported for a particular loan (facility), we select the leadarranger as the representative lender for a particular loan.

J. Cornaggia et al. / Journal of Financial Economics 115 (2015) 189–209 203
In the case that multiple lenders are identified as the leadarranger, we use the lead arranger with the largestpercentage share in the loan.9 Using the data on banklocation, we then calculate the cumulative dollar amountof loans a company has borrowed up to year t from in-stateand out-of-state banks, separately. We set cumulativeloans to zero if the company does not have any bank loansprior to the deregulatory event. We then construct anindicator variable, BankLoans, which equals one if the cumu-lative dollar value of loans borrowed by a company up to agiven year is smaller than the median in that year and zerootherwise. We then estimate the following model:
LnPati;tþ1 to tþ3ðLnCitei;tþ1 to tþ3Þ¼ αþβ1 RSindexk;tþβ2 BankLoansi;tþβ3 RSindexk;t
�BankLoansi;tþγZi;k;tþ IndustryjþYeartþStatekþεi;t ;
ð4Þwhere i indexes company, t indexes time, j indexes industry,and k indexes state. The interaction term in Eq. (4) is the keyvariable of interest in this analysis. If the data support ourconjecture, then the coefficient estimate of RSindex, β1, will benegative and significant for out-of-state banking relationships.Furthermore, compared to public corporations, private firmsare more likely to rely on financing from local banks. There-fore, if the data support our conjecture, the distinctionbetween how prior in-state and out-of-state banking relation-ships interact with banking competition to affect innovationshould be more pronounced for private firms than for publiccorporations.
We report the regression results estimating Eq. (4)in Table 7. In Panel A, we focus on the sample of privatefirms. None of the coefficient estimates of RSindex issignificant in columns 1 and 2, in which in-state bankloans are used as a proxy for prior bank relationships.In contrast, in columns 3 and 4, in which we consider out-of-state loans, we observe negative and significant coefficientestimates of RSindex. In addition, these coefficients arelarger in economic magnitude compared to their counter-parts in columns 1 and 2. Consistent with our conjecture,this result suggests that in-state banking relationshipsindicate that a firm is able to successfully raise capitalfrom nearby banks prior to any deregulatory events. Thesefirms are insensitive to changes in the in-state bankingenvironment because they have pre-existing banking rela-tionships. However, firms relying more on out-of-statebank credit before deregulation benefit most from thederegulation because it allows them to access credit fromin-state banks. These firms appear to take advantage ofexpanded access to in-state bank finance in the sense thatthey generate a larger number of patents after deregula-tion, consistent with our conjecture.
In Panel B, we turn our attention to the sample ofpublic corporations. The coefficient estimates of RSindexare insignificant irrespective of whether in-state bankloans or out-of-state loans are used as a proxy for prior
9 In rare cases in which multiple lead arrangers share the largestpercentage of the facility, we retain those observations where all the leadarrangers reside in the same state and discard the remainingobservations.
bank relationships. These results suggest that the mechan-ism of prior banking relationships plays a role only forprivate firms that are more likely to rely on financing fromlocal banks.
Overall, the evidence presented in this section suggeststhat an increase in access to credit due to banking dereg-ulation positively affects firms' innovation output if theymainly obtain loans from out-of-state banks before thederegulatory event.
5.3. Acquisitions of private firms by public corporations
Our evidence so far shows that state-level bankingcompetition has a positive effect on innovation byexternal-finance-dependent private firms and a negativeeffect on innovation by public corporations. In this section,we explore a possible mechanism—the acquisitions ofsmall, innovative firms—that might explain why bankingcompetition negatively affects corporations' innovationoutput. Sevilir and Tian (2012) show that U.S. publiclytraded corporations enhance their innovativeness throughacquisitions of small, innovative firms (that are usuallyprivately held) and that acquisitions play at least asimportant a role as R&D expenditures in promotinginnovation. If interstate branching deregulation expandsthe availability of credit to small, innovative firms at alower cost, these firms could be more likely to takeadvantage of bank lending to finance themselves andremain independent instead of agreeing to an acquisitionto ease their financial constraints.10 Put differently, bank-ing competition may affect corporations' innovation out-put as these corporations become less able to acquireinnovative target firms after interstate branching dereg-ulation. We test this hypothesis from two perspectives.
We first examine this hypothesis from the demand(acquirer) side by studying whether corporations are lesslikely to acquire innovative target firms after deregulation.It is natural to believe that, based on the findings in Sevilirand Tian (2012), corporations that make many acquisitions(frequent acquirers) have greater willingness or ability toenhance innovation through acquisitions compared tocorporations that make acquisitions less frequently orcorporations that never make acquisitions. If bankingcompetition affects corporate innovation output throughimpaired abilities of corporations to acquire small, inno-vative target firms, we should expect that the negativeeffect of banking competition on corporate innovationoutput is more pronounced for frequent acquirers.
To test this conjecture, we conduct our analyses at thecorporation level for a sample of publicly traded corporations.We assign the value of RSindex based on the corporation'sheadquarter state. We estimate the following model:
LnPati;tþ1 to tþ3 ¼ αþβ1 RSindexk;tþβ2 Acquisitioni;t
þβ3 RSindexk;t � Acquisitioni;t
þγZi;k;tþ IndustryjþYeartþStatekþεi;t ;
ð5Þ
10 Erel, Jang, and Weisbach (forthcoming) find that mergers andacquisitions significantly ease financial constraints of target firms.

Table 7Banking relationships.
This table reports OLS regression estimates of Eq. (4). Panel A shows the results for private firms and Panel B shows the results for public corporations.BankLoans is an indicator taking a value of one if the cumulative dollar value of loans borrowed by company i up to year t is greater than the median in thatyear. We set cumulative loans to zero for companies that do not have any bank loans prior to the passage of any legislation enforcing IBBEA changes in thecompanies' headquarters states. In columns 1–2 we consider only the loans borrowed by company i by banks located in the same state as company i'sheadquarters. In columns 3–4 we consider only the loans borrowed by company i from banks outside company i's headquarter state. Definitions of controlvariables are in Appendix A. Robust standard errors clustered by year are reported in parentheses. Significance at the 1%, 5%, and 10% level is indicated bynnn, nn, and n, respectively. Observations are at the firm-year level from 1976–2003.
Panel A: Private firms
In-state Out-of-state
LnPat LnCite LnPat LnCite(1) (2) (3) (4)
RSindex �0.003 0.002 �0.021nnn �0.040nnn
(0.002) (0.007) (0.003) (0.008)BankLoans �0.381nnn �0.652nnn �0.561nnn �1.050nnn
(0.020) (0.056) (0.031) (0.061)RSindex�BankLoans 0.036nnn 0.038 0.079nnn 0.148nnn
(0.011) (0.025) (0.016) (0.033)Constant 1.377nnn 3.038nnn 1.465nnn 3.179nnn
(0.145) (0.386) (0.147) (0.394)Controls Yes Yes Yes YesState FE Yes Yes Yes YesYear FE Yes Yes Yes YesIndustry FE Yes Yes Yes YesObservations 223,655 223,655 223,655 223,655Adjusted R2 0.207 0.092 0.211 0.094
Panel B: Public corporations
In-state Out-of-state
LnPat LnCite LnPat LnCite
(1) (2) (3) (4)RSindex 0.020 0.009 0.009 �0.020
(0.017) (0.032) (0.015) (0.021)BankLoans �0.130n �0.184n �0.745nnn �1.077nnn
(0.073) (0.104) (0.040) (0.087)RSindex�BankLoans 0.028 0.036 0.050nnn 0.085nnn
(0.021) (0.032) (0.011) (0.022)Constant 1.019nnn 2.428nnn 1.436nnn 3.022nnn
(0.167) (0.282) (0.162) (0.269)Controls Yes Yes Yes YesState FE Yes Yes Yes YesYear FE Yes Yes Yes YesIndustry FE Yes Yes Yes YesObservations 44,702 44,702 44,702 44,702Adjusted R2 0.130 0.162 0.148 0.173
J. Cornaggia et al. / Journal of Financial Economics 115 (2015) 189–209204
where i indexes corporation, t indexes time, j indexesindustry, and k indexes state. We de-mean both variablesof the interaction term for ease of the interpretation of β3.To create an acquisition measure, we use the transactionvalue in SDC that is reported for each deal. In the case thata transaction value is not reported we replace the transac-tion value with zero. We construct three proxies for acorporation's acquisition volume: Dollar volume, which isthe corporation's total dollar amount spent on mergersand acquisitions (M&As) divided by corporation assets;Number of deals, which is the total number of M&As acorporation undertakes in a year; and Dollar per deal,which is the total dollar amount of M&A spending dividedby corporation assets and the number of M&A deals. Z is avector of corporation and industry characteristics that
includes investments in intangible assets (R&D/totalassets), profitability (ROA), asset tangibility (net PPE/totalassets), leverage, capital expenditures (capital expendi-tures/total assets), industry concentration (Herfindahlindex based on sales), growth opportunities (Tobin's Q),corporation size (the natural logarithm of book valueassets), and corporation age. The key variable of interestis β3, the coefficient estimate of the interaction term. If ourconjecture is correct, we expect to observe a positive andsignificant coefficient estimate of β3.
Table 8 reports the regression results from estimatingEq. (5). The coefficient estimates of the interaction termsare positive and statistically significant at the 5% level incolumns 1 and 3, suggesting that the negative effects ofbanking competition on corporation innovation output are

Table 8Dollar volume of acquisitions.
This table reports OLS regression estimates from Eq. (5) using thenatural logarithm of one plus the sum of the patents generated in thenext three years as the dependent variable. The acquisition measure,Acquisition, for column 1 is the dollar volume spent on acquisitions forcorporation i in year t, divided by the corporation's total assets in year t.In column 2 Acquisition is the number of acquisitions made by corpora-tion i in year t. In column 3 Acquisition is the dollar volume spent onacquisitions for corporation i in year t divided by total assets ofcorporation i in year t and the number of acquisitions made by corpora-tion i in year t. We de-mean both RSindex and the Acquisition measuresfor ease of interpretation. Definitions of control variables are in AppendixA. Robust standard errors clustered by year are reported in parentheses.Significance at the 1%, 5%, and 10% level is indicated by nnn, nn, and n,respectively. The sample includes Compustat firms from 1976–2003 andthe observations are at the firm-year level.
Dollarvolume
Number ofdeals
Dollar perdeal
(1) (2) (3)
RSindex 0.008n 0.007 0.008n
(0.004) (0.004) (0.004)Acquisition 0.008 0.115nnn �0.000
(0.014) (0.020) (0.016)Acquisition�RSindex 0.040nn 0.015 0.044nn
(0.018) (0.010) (0.021)Constant �2.259nnn �2.263nnn �2.258nnn
(0.071) (0.072) (0.071)Controls Yes Yes YesState FE Yes Yes YesYear FE Yes Yes YesIndustry FE Yes Yes YesObservations 72,093 72,093 72,093Adjusted R2 0.420 0.421 0.420
12 We round this variable to the nearest integer to facilitate ourestimation of Eq. (3) in the zero-inflated negative binomial model. Wediscuss these results below.
13 When we begin matching the NBER patent data to the list of SDCacquisition deals, there are 10,955 target-acquirer pairs in SDC. Of theseacquisition deals, approximately 21% (2,359) involve a target firm thatgenerates at least one patent during the sample period. Because anacquiring corporation can transact multiple deals in a single year, weaggregate the deals to the acquiring corporation-year level and merge thedata with the corporation data in Compustat. There are 15,700 corpora-tions in the main sample. Nine percent (1,454) of the corporationsacquire a target that produces patents. However, because acquiringcorporations tend to have a shorter life span than non-acquiringcorporations in our sample period, the overall number of corporation-year observations with non-zero patents from acquisitions is very small.In fact, of the 133,792 corporation-year observations, only 1.63% (2,185)
J. Cornaggia et al. / Journal of Financial Economics 115 (2015) 189–209 205
more pronounced for corporations that are frequentacquirers. For example, based on the coefficient estimatereported in column 1, the marginal effect of bankingcompetition on corporations' innovativeness is 0.008 (p-value¼0.077) if a corporation's acquisition amount is atthe sample mean. If a corporation's acquisition amount isabove the sample mean by one standard deviation (0.548),then the marginal effect of banking competition on inno-vation output in the next three years increases by 2.3%(0.008þ0.040�0.548¼0.023).11 These results indicatethat frequent acquirers experience a decrease in theirpost-deregulation innovation output, which is consistentwith our conjecture.
Next, we test whether small, innovative firms' improvedaccess to credit allows them to stay independent, whichindirectly hurts public corporations' innovation output. Weconstruct two measures that capture the innovativeness ofthe target firms acquired by corporations in our sample.(We refer to these two measures as TargetInnov in Eq. (6)below.) The first measure is the total number of patentsgenerated during the entire sample period by all targetfirms acquired in year t (TargetCount). The second measureis the total number of patents generated during the entire
11 The standard deviation of dollars used in acquisitions each year is$36.2 million. However, in Eq. (5), we standardize the independentvariable Acquisitioni,t by a corporation's total assets in year t. The standarddeviation of this variable is 0.548.
sample period by all target firms acquired in year t normal-ized by the number of target firms acquired in a year(TargetCountPerAcq).12 To construct the two measures, webegin by matching patent filings from the NBER database toeach target firm in SDC and sum the number of patentseach target generates over the course of the sample period.Next we merge the M&A deal data in SDC to acquiringcorporations in Compustat.13 For states with multipleregulation changes, we repeat the observations from thatstate for every regulation change reported in Rice andStrahan (2010). Because both of these measures are highlyright-skewed, we use a zero-inflated negative binomialmodel to estimate the following equation:
TargetInnovi;t ¼ αþβ RegChgi;tþγZi;tþFirmiþYeartþεi;t ;ð6Þ
where i indexes corporation and t indexes time.14 RegChg isa dummy that equals one if a deregulation occurs in thestate in which the corporation is headquartered and zerootherwise. The above specification is essentially thedifference-in-differences approach used by Bertrand andMullainathan (2003). The year fixed effects control foraggregate fluctuations in target innovativeness, and by de-meaning the independent variables we control for anytime-invariant differences between treatment corporations(corporations located in states where deregulation occurs)and control corporations (corporations located in stateswhere deregulation does not occur). The key variable ofinterest is RegChg, and β is the differences-in-differencesestimator.
We present the regression results in Table 9. We reportthe marginal effects of independent variables because thecoefficients of the negative binomial model are difficult tointerpret. The coefficient estimates of RegChg are negativeand significant in both columns, suggesting the innova-tiveness of target firms acquired by corporations is lowerafter deregulation. The marginal effect at the mean forcolumn 1 of Table 9 is �0.07. Considering the mean valueof the sample in Table 9 is 0.33 patents per corporation-year, the magnitude of RegChg suggests that the targets
have non-zero patents from acquisitions.14 We conduct the overdispersion test and Vuong test for zero
inflation and both are statistically significant at the 1% level, whichsuggests that the zero-inflated negative binomial model is best suited forour data compared to the Poisson model and the standard negativebinomial model.
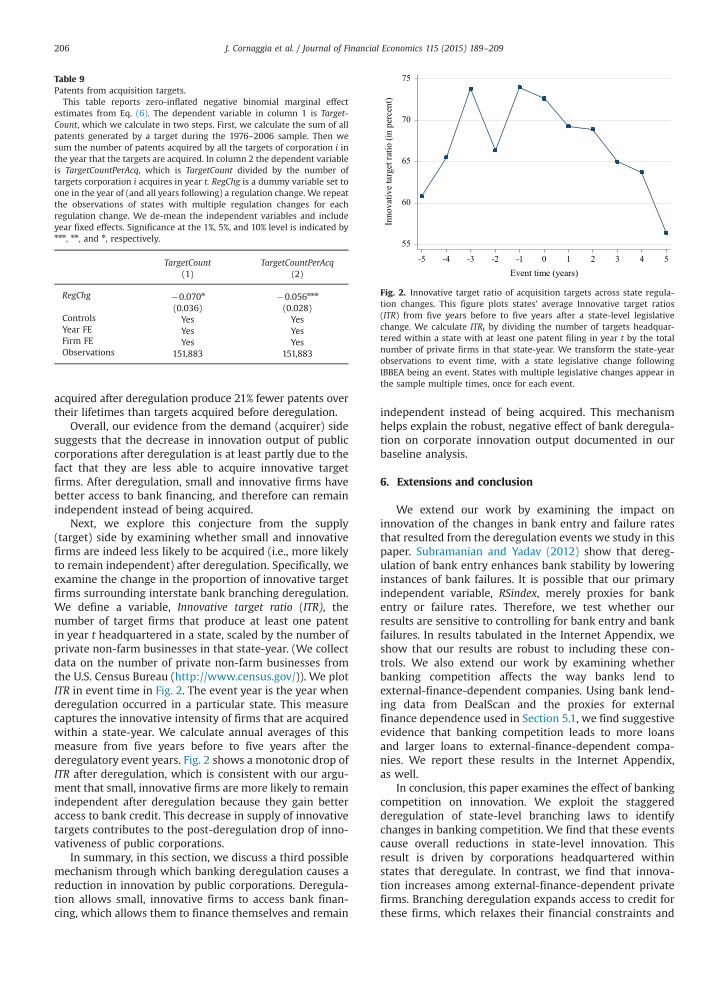
Table 9Patents from acquisition targets.
This table reports zero-inflated negative binomial marginal effectestimates from Eq. (6). The dependent variable in column 1 is Target-Count, which we calculate in two steps. First, we calculate the sum of allpatents generated by a target during the 1976–2006 sample. Then wesum the number of patents acquired by all the targets of corporation i inthe year that the targets are acquired. In column 2 the dependent variableis TargetCountPerAcq, which is TargetCount divided by the number oftargets corporation i acquires in year t. RegChg is a dummy variable set toone in the year of (and all years following) a regulation change. We repeatthe observations of states with multiple regulation changes for eachregulation change. We de-mean the independent variables and includeyear fixed effects. Significance at the 1%, 5%, and 10% level is indicated bynnn, nn, and n, respectively.
TargetCount TargetCountPerAcq(1) (2)
RegChg �0.070n �0.056nnn
(0.036) (0.028)Controls Yes YesYear FE Yes YesFirm FE Yes YesObservations 151,883 151,883
55
60
65
70
75
Inno
vativ
e ta
rget
ratio
(in
perc
ent)
-5 -4 -3 -2 -1 0 1 2 3 4 5Event time (years)
Fig. 2. Innovative target ratio of acquisition targets across state regula-tion changes. This figure plots states' average Innovative target ratios(ITR) from five years before to five years after a state-level legislativechange. We calculate ITRt by dividing the number of targets headquar-tered within a state with at least one patent filing in year t by the totalnumber of private firms in that state-year. We transform the state-yearobservations to event time, with a state legislative change followingIBBEA being an event. States with multiple legislative changes appear inthe sample multiple times, once for each event.
J. Cornaggia et al. / Journal of Financial Economics 115 (2015) 189–209206
acquired after deregulation produce 21% fewer patents overtheir lifetimes than targets acquired before deregulation.
Overall, our evidence from the demand (acquirer) sidesuggests that the decrease in innovation output of publiccorporations after deregulation is at least partly due to thefact that they are less able to acquire innovative targetfirms. After deregulation, small and innovative firms havebetter access to bank financing, and therefore can remainindependent instead of being acquired.
Next, we explore this conjecture from the supply(target) side by examining whether small and innovativefirms are indeed less likely to be acquired (i.e., more likelyto remain independent) after deregulation. Specifically, weexamine the change in the proportion of innovative targetfirms surrounding interstate bank branching deregulation.We define a variable, Innovative target ratio (ITR), thenumber of target firms that produce at least one patentin year t headquartered in a state, scaled by the number ofprivate non-farm businesses in that state-year. (We collectdata on the number of private non-farm businesses fromthe U.S. Census Bureau (http://www.census.gov/)). We plotITR in event time in Fig. 2. The event year is the year whenderegulation occurred in a particular state. This measurecaptures the innovative intensity of firms that are acquiredwithin a state-year. We calculate annual averages of thismeasure from five years before to five years after thederegulatory event years. Fig. 2 shows a monotonic drop ofITR after deregulation, which is consistent with our argu-ment that small, innovative firms are more likely to remainindependent after deregulation because they gain betteraccess to bank credit. This decrease in supply of innovativetargets contributes to the post-deregulation drop of inno-vativeness of public corporations.
In summary, in this section, we discuss a third possiblemechanism through which banking deregulation causes areduction in innovation by public corporations. Deregula-tion allows small, innovative firms to access bank finan-cing, which allows them to finance themselves and remain
independent instead of being acquired. This mechanismhelps explain the robust, negative effect of bank deregula-tion on corporate innovation output documented in ourbaseline analysis.
6. Extensions and conclusion
We extend our work by examining the impact oninnovation of the changes in bank entry and failure ratesthat resulted from the deregulation events we study in thispaper. Subramanian and Yadav (2012) show that dereg-ulation of bank entry enhances bank stability by loweringinstances of bank failures. It is possible that our primaryindependent variable, RSindex, merely proxies for bankentry or failure rates. Therefore, we test whether ourresults are sensitive to controlling for bank entry and bankfailures. In results tabulated in the Internet Appendix, weshow that our results are robust to including these con-trols. We also extend our work by examining whetherbanking competition affects the way banks lend toexternal-finance-dependent companies. Using bank lend-ing data from DealScan and the proxies for externalfinance dependence used in Section 5.1, we find suggestiveevidence that banking competition leads to more loansand larger loans to external-finance-dependent compa-nies. We report these results in the Internet Appendix,as well.
In conclusion, this paper examines the effect of bankingcompetition on innovation. We exploit the staggeredderegulation of state-level branching laws to identifychanges in banking competition. We find that these eventscause overall reductions in state-level innovation. Thisresult is driven by corporations headquartered withinstates that deregulate. In contrast, we find that innova-tion increases among external-finance-dependent privatefirms. Branching deregulation expands access to credit forthese firms, which relaxes their financial constraints and

J. Cornaggia et al. / Journal of Financial Economics 115 (2015) 189–209 207
allows them to pursue innovative projects. Consistent withthis result, we find evidence that the drop in corporateinnovation is at least partly due to a reduction in thesupply of innovative target firms. After branching dereg-ulation, private firms are able to secure bank financing tosecure innovative projects instead of agreeing to beacquired by corporations. This finding supports the view
Table A1Variable definitions.
Variable
Measures of innovationLnPat (state) Natural logarithm of one plus state j's total number of paLnCite (state) Natural logarithm of one plus state j's total number of cit
years tþ1 through tþ3.LnPat (corporation) Natural logarithm of one plus corporation i's total numbeLnCite(corporation)
Natural logarithm of one plus corporation i's total numbegranted) in years tþ1 through tþ3.
LnPat (firm) Natural logarithm of one plus firm i's total number of patLnCite (firm) Natural logarithm of one plus firm i's total number of cita
years tþ1 through tþ3.Generality (state) One minus the Herfindahl index of the three-digit techno
then take the average for all patents generated by the staOriginality (state) One minus the Herfindahl index of the three-digit techno
then take the average for all patents generated by the staTargetCount TargetCount is a measure of the patents corporation i rece
calculate the sum of all patents generated by a target durgenerated by all the targets of corporation i in year t, wh
TargetCountPerAcqt TargetCountPerAcq is a measure of the patents corporationthe sum of all patents generated by a target during the 197the targets of corporation i in year t, which is the year thaacquired by corporation i in year t.
Measure of deregulation and control variables used in baseline specificationsRSindext Rice-Strahan index of interstate banking deregulation b
four (highly regulated) based on regulation changes inIntra An indicator variable that takes the value of zero prior
described in Jayaratne and Strahan (1996). The indicatoonward.
Inter An indicator variable that takes the value of zero prior toBlack and Strahan (2002). The indicator takes the value o
Assetst Natural logarithm of the book value of total assets (at)Before1 A variable that takes the value of 1� (ΔRSindext) the ye
magnitude of the change in RSindext during a deregulaBefore2þ A variable that takes the value of 1� (ΔRSindext) from
change and zero otherwise. ΔRSindext is the magnitudeAfter2þ A variable that takes the value of 1� (ΔRSindext) in the
zero otherwise. ΔRSindext is the magnitude of the chanAfter1 A variable that takes the value of 1� (ΔRSindext) in the y
magnitude of the change in RSindext during a deregulaR&DAssetst Research and development expenditure (xrd) divided by
to zero if missing.Aget Company i's age. It equals the number of years the corp
data set.ROAt Return-on-assets ratio defined as operating income bef
measured at the end of fiscal year t.PPEAssetst Property, Plant & Equipment (net, ppent) divided by boLeveraget Corporation i's leverage ratio, defined as book value of
the end of fiscal year t.CapexAssetst Capital expenditure (capx) scaled by book value of totaTobinQt Corporation i's market-to-book ratio during fiscal year t,
assets (at) minus book value of equity (ceq) minus balanvalue of assets (at).
Hindext Herfindahl index of four-digit SIC industry j of corpora
Measure of other variablesDollar volumet The dollar volume in millions of private acquisition deNumber of dealst The natural log of one plus the number of private acquDollars per dealt The dollar volume of private acquisition deals from SDC
divided by the number of private acquisition deals of c
that banking was repressed in the United States untilbranching deregulation was enacted.
Appendix A
See Table A1.
Definition
tents filed (and eventually granted) in years tþ1 through tþ3.ations received on the firm's patents filed (and eventually granted) in
r of patents filed (and eventually granted) in years tþ1 through tþ3.r of citations received on the firm's patents filed (and eventually
ents filed (and eventually granted) in years tþ1 through tþ3.tions received on the firm's patents filed (and eventually granted) in
logy class distribution of all the patents that cite a given patent. Wete.logy class distribution of all the patents that a given patent cites. Wete.ives from acquiring targets and is calculated in two steps. First, weing the 1976–2006 sample. Then we sum the number of patentsich is the year that the targets are acquired.i receives per target and is calculated in three steps. First, we calculate6–2006 sample. Then we sum the number of patents generated by allt the targets are acquired. Finally, we divide by the number of targets
ased on Rice and Strahan (2010). It ranges from zero (deregulated) toa state.to intrastate deregulation during the 1970s, 1980s, and 1990s asr takes the value of one from the year of intrastate deregulation
interstate deregulation during the 1980s and 1990s as described inf one from the year of interstate deregulation onward.measured at the end of fiscal year t.ar prior to a regulatory change and zero otherwise. ΔRSindext is thetory event.the beginning of the window up to two years prior to a regulatoryof the change in RSindext during a deregulatory event.
second year following a deregulation until the end of the window andge in RSindext during a deregulatory event.ear following a regulatory change and zero otherwise. ΔRSindext is thetory event.book value of total assets (at) measured at the end of fiscal year t, set
oration has existed since the founding year obtained from Jay Ritter's
ore depreciation (oibdp) divided by book value of total assets (at),
ok value of total assets (at) measured at the end of fiscal year t.debt (dlttþdlc) divided by book value of total assets (at) measured at
l assets (at) measured at the end of fiscal year t.calculated as [market value of equity (prcc_f� csho) plus book value ofce sheet deferred taxes (txdb, set to zero if missing)] divided by book
tion i, measured at the end of fiscal year t based on sales.
als from SDC data for corporation i in year t.isition deals from SDC data for corporation i in year t.data for corporation i in year t, scaled by its total assets (at) at time torporation i in year t.

Table A1 (continued )
Variable Definition
Mining (Construction,Manufacturing,Transportation,Trade, Finance,Services,Government)
The labor share of state i in year t in mining (construction, manufacturing, transportation, trade, finance, services,government). The labor share is defined as the fraction of gross product in state i in year t that is from mining (construction,manufacturing, transportation, trade, finance, services, government) industries. Industry is defined by North Americanindustry classification system (NAICS) category from 1998–2006, and SIC code from 1976–1997.
Concentration The labor force concentration of state i in year t. The labor force concentration is defined as the sum of the squared laborshares for state i in year t.
Gross product The nominal gross product in state i in year t.Dependencet A dummy variable indicating low (high) External Finance Dependence (EFD) of company i measured at the end of fiscal year t.
In the case of a patenting firm-year, we draw the EFD calculation from the firm's patent portfolio. For non-patenting firm-years, we carry forward the EFD from the previous year for private firms or directly calculate it from Compustat data for publicfirms. To calculate a patenting firm-year level EFD, we classify each patent by its four-digit IPC and link it to a distribution ofthree-digit SIC codes. Each of these three-digit SIC codes then matches to an EFD calculated from public corporations in thatyear. External Finance Dependence for each three-digit SIC is calculated by first calculating each firm's EFD in year t within aspecific three-digit SIC as [Capital Expenditures (capx)�Funds From Operations (fopt)]/(Capital Expenditures (capx)). Whenfopt is missing, Funds From Operations is defined as fopt¼ [Income Before xtraordinary Items (ibc) plus Depreciation andAmortization (dpc) plus Deferred Taxes (txdc) plus (Equity in Net Loss)/Earnings (esubc) plus Sale of Property, Plant, andEquipment and Investments gain/loss (sppiv) plus Funds from Operations Other (fopo)]. The industry-level, three-digit SIC isannually taken as the median firm EFD for each three-digit SIC.
BankLoanst (In-state) The cumulative dollar value ($ millions) of loans (facilities) as reported in DealScan for company i in year t granted by lendersfrom the same state as company i's headquarter state. The cumulative dollar value is scaled by the total assets of company i inyear t. For companies with zero cumulative loans in the first year of the headquarters' state deregulation, all subsequent yearsare set to zero.
BankLoanst (Out-of-state)
The cumulative dollar value ($ millions) of loans (facilities) as reported in DealScan for company i in year t granted by lendersnot located in the same state as company i's headquarter state. The cumulative dollar value is scaled by the total assets ofcompany i in year t. For companies with zero cumulative loans in the first year of the headquarters' state deregulation, allsubsequent years are set to zero.
J. Cornaggia et al. / Journal of Financial Economics 115 (2015) 189–209208
References
Acharya, V., Baghai, R., Subramanian, K., 2013. Labor laws and innovation.Journal of Law and Economics 56, 997–1037.
Acharya, V., Baghai, R., Subramanian, K., 2014. Wrongful discharge lawsand innovation. Review of Financial Studies 27, 301–346.
Acharya, V., Imbs, J., Sturgess, J., 2011. Finance and efficiency: do bankbranching regulations matter? Review of Finance 15, 135–172.
Acharya, V., Subramanian, K., 2009. Bankruptcy codes and innovation.Review of Financial Studies 22, 4949–4988.
Aghion, P., Bloom, N., Blundell, R., Griffith, R., Howitt, P., 2005. Competi-tion and innovation: an inverted-U relationship. Quarterly Journal ofEconomics 120, 701–728.
Aghion, P., Van Reenen, J., Zingales, L., 2013. Innovation and institutionalownership. American Economic Review 103, 227–304.
Amore, M., Schneider, C., Zaldokas, A., 2013. Credit supply and corporateinnovation. Journal of Financial Economics 109, 835–855.
Benfratello, L., Schiantarelli, F., Sembenelli, A., 2008. Banks and innova-tion: microeconometric evidence on Italian firms. Journal of FinancialEconomics 90, 197–217.
Bertrand, M., Mullainathan, S., 2003. Enjoying the quiet life? Corporategovernance and managerial preferences. Journal of Political Economy111, 1043–1075.
Black, S., Strahan, P., 2002. Entrepreneurship and bank credit availability.Journal of Finance 57, 2807–2833.
Bolton, P., Von Thadden, E.L., 1998. Blocks, liquidity, and corporatecontrol. Journal of Finance 53, 1–25.
Butler, A., Cornaggia, J., 2011. Does access to external finance improveproductivity? Evidence from a natural experiment. Journal of Finan-cial Economics 99, 184–203.
Cetorelli, N., Strahan, P., 2006. Finance as a barrier to entry: bankcompetition and industry structure in local U.S. markets. Journal ofFinance 61, 437–461.
Chava, S., Oettl, A., Subramanian, A., Subramanian, K., 2013. Bankingderegulation and innovation. Journal of Financial Economics 109,759–774.
Chemmanur, T., Loutskina, E., Tian, X., 2014. Corporate venture capital,value creation, and innovation. Review of Financial Studies 27,2434–2473.
Dick, A., Lehnert, A., 2010. Personal bankruptcy and credit marketcompetition. Journal of Finance 65, 655–686.
Duchin, R., Ozbas, O., Sensoy, B., 2010. Costly external finance, corporateinvestment, and the subprime mortgage credit crisis. Journal ofFinancial Economics 97, 418–435.
Erel, I., Jang, Y., Weisbach, M., 2013. Do acquisitions relieve target firms'financial constraints? Journal of Finance. (forthcoming).
Fang, V., Tian, X., Tice, S., 2014. Does stock liquidity enhance or impedefirm innovation? Journal of Finance 69, 2085–2125.
Griliches, Z., Pakes, A., Hall, B., 1988. The value of patents as indicators ofinventive activity. NBER working paper no. 2083.
Hadlock, C., Pierce, J., 2010. New evidence on measuring financialconstraints: moving beyond the KZ index. Review of Financial Studies23, 1909–1940.
Hall, B., Jaffe, A., Trajtenberg, M., 2001. The NBER patent citation data file:lessons, insights and methodological tools. NBER working paper no.8498.
Hall, B., Jaffe, A., Trajtenberg, M., 2005. Market value and patent citations.RAND Journal of Economics 36, 16–38.
He, J., Tian, X., 2013. The dark side of analyst coverage: the case ofinnovation. Journal of Financial Economics 109, 856–878.
Hombert, J., Matray, A., 2013. The real effects of hurting lending relation-ships: evidence from banking deregulation and innovation. Unpub-lished working paper. HEC, Paris.
Hsu, P., Tian, X., Xu, Y., 2014. Financial development and innovation: Crosscountry evidence. Journal of Financial Economics 112, 116–135.
Jayaratne, J., Strahan, P., 1996. The finance-growth nexus: evidence frombank branch deregulation. Quarterly Journal of Economics 111,639–670.
Kerr, W., Nanda, R., 2009. Democratizing entry: banking deregulations,financing constraints, and entrepreneurship. Journal of FinancialEconomics 94, 124–149.
Kroszner, R., Strahan, P., 1999. What drives deregulation? Economics andpolitics of the relaxation of bank branching restrictions. QuarterlyJournal of Economics 114, 1437–1469.
Meulbroek, L., Litchell, M., Mulherin, H., Netter, J., Poulsen, A., 1990. Sharkrepellents and managerial myopia: an empirical test. Journal ofPolitical Economy 98, 1108–1117.
Morgan, D., Rime, B., Strahan, P., 2004. Bank integration and statebusiness cycles. Quarterly Journal of Economics 119, 1855–1885.
Petersen, M., Rajan, R., 2002. Does distance still matter? The informationrevolution in small business lending. Journal of Finance 57,2533–2570.

J. Cornaggia et al. / Journal of Financial Economics 115 (2015) 189–209 209
Porter, M., 1992. Capital disadvantage: America's failing capital invest-ment system. Harvard Business Review 70, 65–82.
Rice, T., Strahan, P., 2010. Does credit competition affect small-firmfinance? Journal of Finance 65, 861–889.
Robinson, J., 1952. The generalization of the general theory, The Rate ofInterest and Other Essays. MacMillan, London.
Schumpeter, J., 1911. The Theory of Economic Development. HarvardUniversity Press, Cambridge, MA.
Seru, A., 2014. Firm boundaries matter: evidence from conglomerates andR&D activity. Journal of Financial Economics 111, 381–405.
Sevilir, M., Tian, X., 2012. Acquiring innovation. Unpublished workingpaper. Indiana University.
Solow, R., 1957. Technological change and the aggregate productionfunction. Review of Economics and Statistics 39, 312–320.
Subramanian, K., Yadav, A., 2012. Deregulation of bank entry and bankfailures. Unpublished working paper. Indian School of Business,Hyderabad.
Tian, X., Wang, T., 2014. Tolerance for failure and corporate innovation.Review of Financial Studies 27, 211–255.