journal of financial economics - new york university...
TRANSCRIPT

ARTICLE IN PRESS
Contents lists available at ScienceDirect
Journal of Financial Economics
Journal of Financial Economics 93 (2009) 15–36
0304-40
doi:10.1
$ We
many h
Douglas
Narasim
Jeffrey
Anna S
Wahal,
Rutgers
for Fina
Financia
Behavio
ence, th
Confere
edges
Researc
and mk� Cor
E-m
mkacpe
journal homepage: www.elsevier.com/locate/jfec
The price of sin: The effects of social norms on markets$
Harrison Hong a,�, Marcin Kacperczyk b
a Princeton University, Princeton, NJ 08540, USA and NBERb New York University, New York, NY 10012, USA and NBER
a r t i c l e i n f o
Article history:
Received 6 March 2007
Received in revised form
30 April 2008
Accepted 16 September 2008Available online 8 April 2009
JEL classification:
G11
D71
Keywords:
Expected stock returns
Institutional ownership
Social norms
Sin stocks
5X/$ - see front matter & 2009 Elsevier B.V.
016/j.jfineco.2008.09.001
thank Malcolm Baker (referee) and an ano
elpful comments. We also thank Antti Petajis
Diamond, Kenneth French, Lorenzo Garla
han Jegadeesh, Lisa Kramer, Alan Kraus, Arv
Kubik, Owen Lamont, Kai Li, Andrew Metrick
cherbina, Jeremy Stein, Andrei Ukhov, Ross
Jialin Yu, and seminar participants at the A
, Simon Fraser, Society of Quantitative Analyst
ncial Research, the European Finance Associat
l Economics and Accounting Annual Confere
ral Finance Symposium, the NBER Behavior
e Pacific Northwest Finance Conference, and
nce for a number of helpful comments. Ka
research support from the Social Science
h Council of Canada. Address inquiries to hh
responding author.
ail addresses: [email protected] (H. Hong
[email protected] (M. Kacperczyk).
a b s t r a c t
We provide evidence for the effects of social norms on markets by studying ‘‘sin’’
stocks—publicly traded companies involved in producing alcohol, tobacco, and gaming.
We hypothesize that there is a societal norm against funding operations that promote
vice and that some investors, particularly institutions subject to norms, pay a financial
cost in abstaining from these stocks. Consistent with this hypothesis, we find that sin
stocks are less held by norm-constrained institutions such as pension plans as compared
to mutual or hedge funds that are natural arbitrageurs, and they receive less coverage
from analysts than do stocks of otherwise comparable characteristics. Sin stocks
also have higher expected returns than otherwise comparable stocks, consistent with
them being neglected by norm-constrained investors and facing greater litigation
risk heightened by social norms. Evidence from corporate financing decisions and
the performance of sin stocks outside the US also suggest that norms affect stock prices
and returns.
& 2009 Elsevier B.V. All rights reserved.
1. Introduction
Many social scientists believe that social norms areimportant in shaping economic behavior and market
All rights reserved.
nymous referee for
to, Murray Carlson,
ppi, Rob Heinkel,
ind Krishnamurthy,
, Jose Scheinkman,
en Valkanov, Sunil
FA, Emory, McGill,
s, Swedish Institute
ion Conference, the
nce, the Maryland
al Finance Confer-
the UBC Summer
cperczyk acknowl-
s and Humanities
),
outcomes, overriding at times even the profit motive.1
An early articulation of this viewpoint in economics isBecker (1957) model of discrimination. In his model,agents (e.g., employers) with discriminatory tastes arisingfrom community norms pay for those tastes by bearingfinancial costs from their decisions to not interact withparticular types of people. Arrow (1972) points out that acomplete theory of discrimination also must explain whyentrepreneurs without discriminatory tastes cannot makeprofits by hiring labor cheaply from the groups discrimi-nated against by other employers. Subsequent theories ofsocial norms (e.g., Akerlof, 1980; Romer, 1984) providesufficient conditions under which social customs that aredisadvantageous to the individual nevertheless maypersist if individuals are sanctioned by loss of reputationfor disobedience of the custom.2 Empirical work on the
1 There are various definitions of the concept of a social norm or
custom. Following Akerlof (1980), we define a social norm or custom as
an act whose utility to the agent performing it depends in some way on
the beliefs or actions of other members of the community.2 See Elster (1989) for a review of social norms and economic theory.

ARTICLE IN PRESS
H. Hong, M. Kacperczyk / Journal of Financial Economics 93 (2009) 15–3616
effects of social norms on markets has traditionallyfocused upon measuring the extent of discrimination inthe labor market.3 A related literature points out thatsocial interactions (or peer effects) more generally areimportant for a variety of economic outcomes (see, e.g.,Glaeser and Scheinkman, 2003).4
In this paper, we provide new evidence on the marketeffects of social norms in the novel setting of the stockmarket. Specifically, we study the investing environmentof ‘‘sin’’ stocks, i.e., publicly traded companies involved inthe production of alcohol, tobacco, and gaming. This is anideal setting in which to study the effects of social normson markets for several reasons. First, there is clearly asocietal norm against funding operations that promotehuman vice, and consequently many investors may notwant themselves or others to support these companies byinvesting in their stocks. Anecdotal evidence supportingthis premise can be found in the embrace of sociallyresponsible investing (SRI) by managers of institutionssuch as pension funds and endowments who screen theirinvestments to rule out sinful stocks such as alcohol,tobacco, and gaming companies. The Social InvestmentForum estimates that about $2.34 trillion dollars in 2001or roughly 12% of the total assets under management inthat year undergo some kind of social screens (see Geczy,Stambaugh, and Levin, 2003), which suggests a potentiallysizeable effect of socially responsible investing on theprices of sin stocks. This figure has remained fairlyconstant ever since the Social Investment Forum startedmaking these estimates in the mid-1990s. Second, thestock market provides us with a rich set of data oninvestor behavior, stock pricing, and firm behavior, whichallows us to discriminate more finely among alternativehypotheses than do existing empirical studies of socialnorms.
A third reason why the stock market is ideally suitedfor an investigation of market effects from social norms isthat there can be significant financial costs associatedwith norm-constrained investing, i.e., investors pay fortheir discriminatory tastes a la Becker. To begin with,there is the cost of being unable to diversify into publiclytraded sin companies, although this cost is small sincethere are few of these firms relative to the universe ofstocks. More importantly, as we show below, sin stockstend to be relatively cheap (i.e., with low price-to-book orprice-to-earnings ratios) when benchmarked againstcomparables. Finally, Geczy, Stambaugh, and Levin(2003) find that from the perspective of an investor whoseeks to create an optimal portfolio from mutual funds,
3 For a survey of this literature, see Altonji and Blank (1999); and for
a recent summary of this work, see Levitt (2004). Many papers have
developed clever empirical approaches to identifying the extent of racial
discrimination in the labor market. However, the evidence to date
supporting taste-based discrimination (as opposed to rational informa-
tion-based theories) has been mixed.4 A growing body of empirical research speaks to the importance of
peer effects in a variety of contexts (e.g., Case and Katz, 1991; Glaeser,
Sacerdote, and Scheinkman, 1996). Recent work on social interaction and
financial markets focuses primarily on investor behavior (see, e.g., Hong,
Kubik, and Stein, 2004). There are few papers on whether peer effects
have price implications.
limiting oneself to funds that include social objectives intheir investment policies can be very costly. For instance,an investor who believes that returns are generated by amultifactor pricing model can incur a certainty-equivalentcost of 30 basis points per month, while an investor whobelieves in managerial skill can incur a cost of more than100 basis points per month. Importantly, these calcula-tions take as given that there are few publicly traded sinstocks in the marketplace. In reality, the number of sinstocks is likely to be endogenous, depending on the degreeto which investors shun them because of social norms.
We begin our investigation of social norm effects oninvestments in sin stocks by looking at who owns thesestocks. First, we hypothesize that the shares of sin stocksshould be held in smaller proportions by institutionssubject to social norm pressures. These include institu-tions whose positions in stocks are public information,institutions with diverse constituents, and institutionsthat can be readily exposed to public scrutiny (e.g.,picketing by an unhappy minority). Examples includepension funds, universities, religious organizations, banks,and insurance companies. This hypothesis further impliesthat sin stocks should be less followed by sell-sideanalysts who produce financial reports and analyses oncompanies, since these analysts tend to cater to institu-tional investors. In contrast to institutional investors,individual investors can keep their stock positions out ofthe view of enforcers of societal norms, and therefore, weexpect individual investors to be more willing thaninstitutional investors to hold sin stocks. Mutual fundsand hedge funds represent another class of investorswhom we expect to be willing to invest in sin stocks, sincethey are natural arbitrageurs in the marketplace. Whileeven mutual funds and hedge funds may be increasinglysubject to social norm pressures as witnessed by therecent growth of the socially responsible investment class,we expect some of them to flout social conventions andbuy sin stocks if those stocks are neglected by otherinvestors and priced cheaply.5
Consistent with these predictions, we find that sinstocks have less institutional ownership, as compared tostocks of otherwise comparable characteristics during theperiod of 1980–2006 for which data are available. Ouridentification strategy throughout comes from judging sinstock outcomes (e.g., institutional ownership, stock re-turns, etc.) relative to carefully chosen industry compar-ables and controls of stock characteristics, i.e., our effectsare coming from sin status as opposed to unobservedheterogeneity related to industry or other stock character-istics. Using our most conservative estimates, the sin stockcomparables, defined as those with similar Fama andFrench (1997) industry groupings as our sin stocks have onaverage about 28% of their shares held by institutions. Incontrast, sin stocks have about 23% of their shares held byinstitutions, which is approximately an 18% lower institu-tional ownership ratio than that of their comparables.
5 An example of such a fund is the VICE mutual fund, which openly
promotes holding vice stocks; however, these examples are rare and
typically small in size.

ARTICLE IN PRESS
H. Hong, M. Kacperczyk / Journal of Financial Economics 93 (2009) 15–36 17
In addition, sin stocks receive less analyst coverage duringthe period of 1976–2006 for which data are available. Thetypical sin stock comparable in our sample receivescoverage from about 1.7 analysts. Sin stocks on averageare followed by 1.3 analysts, representing a 21% decline incoverage relative to the mean. These figures haveremained relatively stable throughout our sample.
When we break down this analysis by types ofinstitutions (banks, insurance companies, mutual funds,independent investment advisors, and others, such aspension plans and universities), we find that shares of sinstocks are not held in smaller proportions by mutualfunds and independent investment advisors, who are thenatural arbitrageurs among these institutions.6 This set ofdisaggregated results suggests that the low institutionalownership of sin stocks cannot be explained by a story inwhich institutions are smarter than individuals, since theresult does not hold for the mutual funds and hedge fundsthat are likely to be the smartest investors among theseinstitutions.
Next, we formulate our predictions about the effects ofsocial norms on the returns to investing in sin stocks.From the work of Merton (1987) on neglected stocks andsegmented markets, there are at least two reasons why sinstocks should be cheaper than other stocks and henceoutperform comparables, even after accounting for well-known predictors of stock returns. First, the neglect of sinstocks by an important set of investors, such as institu-tions, means that the prices of those stocks will bedepressed relative to their fundamental values because oflimited risk sharing and hence, sin stocks should havehigher expected returns than comparables. Second, be-cause of neglect or limited risk sharing, Merton shows thatthe CAPM no longer holds and idiosyncratic risk and notjust beta matters for pricing. As a result, the increasedlitigation risk associated with the products of sincompanies, which is further heightened by social norms,should further increase the expected returns of sin stocks.For example, tobacco companies faced substantial litiga-tion risk until their settlement with state governments in1997. Moreover, many practitioners believe that investorsmay simply underestimate the value of sin stocks. Forinstance, Berman (2002) writes that ‘‘ysin stocks comewith other advantages besides stability. Most of thesestocks have lower valuations than the overall market.Some of them also offer excellent dividends. yFinally, sinstocks tend to benefit from very conservative accountingbecause their industries fall under considerable scrutinyfrom regulators’’.7
Implicit in the neglect-effect hypothesis are twoassumptions. The first is limited arbitrage, i.e., not enougharbitrage capital is brought to bear on sin stocks becauseof a set of constraints and risks articulated by Shleifer and
6 The category of independent investment advisor is a hodge-podge
of different institutions that includes hedge funds. Accordingly, it makes
sense for us to include them with mutual funds as natural arbitrageurs.7 See /http://www.moneysense.ca/shared/print.jsp?content=20021127_
154845_3424S to retrieve the article.
Vishny (1997) and others.8 The second is that the neglectof sin stocks by institutional investors has been relativelystable over our sample.9 These assumptions seem reason-able in light of our evidence on institutional holdings.
We test our predictions of sin stocks outperformingcomparables by analyzing both prices and returns. Firstand most conventionally, using time-series regressionsduring the period of 1965–2006, we find that a portfoliolong sin stocks and short their comparables has a return of26 basis points per month after adjusting for a four-factormodel comprising the three Fama-French factors and themomentum (returns) factor. Second, using cross-sectionalregressions controlling for firm characteristics (data onlyavailable from 1965 to 2006), we find that sin stocksoutperform their comparables by 29 basis points amonth—again a statistically and economically sizeablemagnitude—even after accounting for well-known deter-minants of expected returns in cross-sectional regressionssuch as market size, past return, and market-to-bookratio. Our results are robust to the exclusion of tobaccostocks, which arguably might be driving some of thesehigh returns due to both litigation risk and perhapsunexpectedly positive results from litigation. The sinstocks, net of tobacco, have a significant 21 basis pointsa month of outperformance or 2.5% per year.10
Third, we compare the valuation ratios (e.g., market-to-book) of sin stocks to those of other stocks. Thevaluation ratios of sin stocks are on average about15–20% lower than those of other companies aftercontrolling for differences in other stock characteristics,an economically and statistically significant effect duringthe period of 1965–2006. These valuation ratios, using aGordon growth model calibration, imply excess returns ofabout 2% a year. These implied annual return numbers arenot statistically different from the return figures obtainedfrom our most conservative cross-sectional regressions.Our analysis of sin stock prices using price ratios is moreconservative than our analysis of returns, since therealized returns of certain sin stocks (tobacco) may beinfluenced by unexpectedly good cash flow news over oursample period.
We then consider a number of robustness checks. Mostimportantly, we extend our analysis of sin stocks outsideof the US to the seven large markets in Europe and toCanada. These countries have similar attitudes towardssin stocks. We find that sin stocks in these markets dooutperform other stocks by about 2.5% a year, very similarto our conservative estimates in the US and the result issignificant at the 10% level of significance. This providesstrong out-of-sample support for our hypothesis.
We also relate our empirical findings to calibrationsdone by Petajisto (2009) and a model adapted from
8 In other words, Arrow (1972) is right to point out the opportunity
for entrepreneurial investors to exploit the discriminatory tastes of other
investors, but there are not enough entrepreneurial investors to
completely eliminate the impact of discriminatory tastes on stock prices.9 We thank the referees for pointing this out to us.10 One caveat is that even this might not be conservative enough
since one could also argue that the gaming industry might have had
unexpectedly good news during our sample period.

ARTICLE IN PRESS
H. Hong, M. Kacperczyk / Journal of Financial Economics 93 (2009) 15–3618
Heinkel, Kraus, and Zechner (2001), henceforth HKZ, whodevelop a model to consider the price implications ofethical investing that excludes companies that pollute. Inour context, it is companies that produce sin. Petajisto andHKZ develop models in the spirit of Merton that look atthe price implications of limited risk sharing due toneglect induced by social norms or ethical investing. Theirprice implications are precisely the ones tested here. Ourempirical findings match well with their calibrationresults, which we describe in more detail below.
We further validate our characterization of the prices ofsin stocks as being influenced by social norms by looking atthe corporate decisions of sin companies. And as aconsequence of stock underpricing due to social norms, wepredict that sin companies should finance their operationsusing relatively more debt than equity, since debt marketstend to be less transparent than equity markets as we arguebelow. Using data from 1962 to 2006, we confirm that sincompanies have significantly higher leverage after account-ing for the usual predictors of capital structure.
Our findings on the effects of social norms in thecontext of the stock market strongly support the view-point that social norms can have important consequencesfor markets. Indeed, our results most likely representlower bounds on the effects of social norms in the stockmarket, since many companies operating in sin industriesmay not become public precisely because they areshunned by many investors.
Our paper is related to the work of Teoh, Welch, andWazzan (1999), who examine the effect of the shareholderboycott of South Africa’s apartheid regime. They find thatfor all the visibility associated with the boycott, there waslittle discernible effect either on the valuations of banksand corporations with South African operations or on theSouth African financial markets, because corporate in-volvement in South Africa was small in the first place.However, they do find some weak evidence that institu-tional shareholdings in corporations with South Africaninvestments increased when those corporations divested.
The rest of our paper proceeds as follows. In Section 2,we provide a background history of sin stocks anddescribe how we identify these stocks in our analysis. InSection 3, we complete the description of our data set andspecify the variables for our regression models. In Section4, we report the empirical results from our regressionanalyses. We conclude in Section 5. And details on ourcalibration exercises are in Appendix A.
11 The following material on tobacco is drawn from a CNN web site
profiling the tobacco industry, /http://edition.cnn.com/US/9705/tobacco/
historyS.12 For more information regarding this report and discussion of
legislative changes in gaming, see Chen and Bin (2001).13 See, for instance, surveys reported in a Congressional report on
gaming that may be found online at /http://www.library.ca.gov/CRB/97/
03/S.
2. Background on and selection of sin stocks
Our analysis of social norm effects on the stock marketfocuses on the industries collectively known as the ‘‘Triumvi-rate of Sin’’, namely alcohol, tobacco, and gaming. Today, allthree of these consumer product groups are viewed as sinfulby many individuals and social groups in the United Statesand other countries, due to their addictive properties andundesirable social consequences when consumed excessively.While the sinful aspects of alcohol and gaming have longbeen recognized by societies into which they have beenintroduced, tobacco has been the subject of negative social
norms only as recently as the past four decades. Our analysiswill exploit the time variation in the social norms governingtobacco consumption to test various predictions of socialnorm effects in financial markets.
Tobacco consumption has been viewed as sinful foronly a relatively short period since its introduction toEurope in the mid-16th century.11 This is because theadverse individual and public health consequences ofsmoking tobacco were not widely known until the mid-1960s. Indeed, most early European physicians subscribedto the Native American belief that tobacco might be aneffective medicine. As cigarette smoking grew in pre-valence during the early 20th century, however, articlesaddressing the adverse health effects of smoking began toappear in scientific and medical journals. Studies begin-ning in 1930 led the American Cancer Society to warn by1947 (when other reports began to surface) about the illeffects of smoking, though most of the public remainedunaware of the statistical correlation between smokingand cancer. This changed, however, in 1952 when Reader’sDigest published an article entitled ‘‘Cancer by theCarton’’, which detailed the dangers of smoking.
Although the tobacco industry responded with market-ing and studies of their own, thus managing to stave offnegative public opinion for another decade, this battlecame to an end in the early 1960s with the formation ofthe Surgeon General’s Advisory Committee on Smokingand Health. Convened in response to political pressuresand a growing body of scientific evidence, the committeereleased a 387-page report in 1964 unequivocally con-cluding that cigarette smoking is causally related to lungcancer. In 1965, Congress passed the Federal CigaretteLabeling and Advertising Act requiring surgeon general’swarnings on all packages, and in 1971, all broadcastadvertising of tobacco products was banned.
Like alcohol, gambling has long been considered a viceand a sinful activity that corrupts society. In mostsocieties, gambling is heavily regulated because of con-cerns about criminal involvement. Since the mid-to-late1990s, however, a number of states in the United Stateshave deregulated casino gaming to legalize its productionoutside of Native American casinos, under pressure fromboth political referendums and budget concerns. Accord-ing to a report from the National Gambling Commission,by 1999, 26 states had joined Nevada and Atlantic City(New Jersey) in legalizing casino-style gaming.12 Hence,one could argue that gaming has become more sociallyacceptable in recent years, though many surveys ofindividuals across various states indicate that publicopinion still regards gambling as sinful behavior.13
Based upon the Triumvirate of Sin described above, weidentify sin stocks from the universe of stocks in the

ARTICLE IN PRESS
Table 1Profile of sin stocks.
This table reports summary statistics about the sin stocks. In Panel A,
we report year-by-year the number of sin stocks that fall into the three
subgroups of tobacco, alcohol, and gaming. In Panel B, we report market
betas calculated using value-weighted monthly returns on 48 Fama and
French (1997) industry portfolios along with our 49th gaming portfolio.
The data span the period of 1926–2006.
Panel A: Distribution by year
Year All Tobacco Alcohol Gaming
1926 18 15 3 0
1927 21 18 3 0
1928 20 17 3 0
1929 21 17 4 0
1930 21 17 4 0
1931 21 17 4 0
1932 21 17 4 0
1933 22 16 6 0
1934 22 16 6 0
1935 23 16 7 0
1936 25 16 9 0
1937 25 16 9 0
1938 25 16 9 0
1939 25 16 9 0
1940 25 16 9 0
1941 23 14 9 0
1942 23 14 9 0
1943 23 14 9 0
1944 23 14 9 0
1945 24 14 10 0
1946 26 14 12 0
1947 27 14 12 1
1948 27 13 13 1
1949 26 12 13 1
1950 25 11 13 1
1951 25 11 13 1
1952 24 11 12 1
1953 25 11 13 1
1954 25 11 13 1
1955 25 11 13 1
1956 25 11 13 1
1957 24 10 13 1
1958 23 9 13 1
1959 23 10 12 1
1960 23 10 12 1
1961 23 10 12 1
1962 23 10 12 1
1963 25 10 13 2
1964 26 11 13 2
1965 26 11 13 2
1966 26 11 13 2
1967 27 11 14 2
1968 27 11 14 2
1969 30 11 16 3
1970 32 12 16 4
1971 32 12 16 4
1972 38 12 20 6
1973 41 12 22 7
1974 41 12 22 7
1975 42 12 23 7
1976 42 12 23 7
1977 42 12 23 7
1978 45 12 23 10
1979 48 12 23 13
1980 50 12 24 14
1981 55 12 24 19
1982 56 12 25 19
H. Hong, M. Kacperczyk / Journal of Financial Economics 93 (2009) 15–36 19
following manner. We start with the Fama and French(1997) classification of stocks based upon their SIC codesinto 48 industries. Stocks in Fama-French industry group 4(beer or alcohol) and industry group 5 (smoke or tobacco)are classified as sin stocks. Stocks with SIC codes2100–2199 belong to the beer group, and those with SICcodes of 2080–2085 are in the smoke group. Unfortu-nately, the Fama-French classification scheme does notseparate gaming stocks from hotel stocks or otherentertainment stocks. To this end, we need to use theNAICS classification, which identifies gaming stocks asthose bearing the following NAICS codes: 7132, 71312,713210, 71329, 713290, 72112, and 721120. In sum, sinstocks in our analysis comprise the union of the Fama andFrench (1997) industry groups 4 and 5 along with theNAICS group for gaming. We work with this expanded 49-industry group throughout our analysis.
We then augment this list by searching acrosscompanies at the segment level, as follows.
We utilize the Compustat Segments data, availablefrom 1985 to 2006, which contain information on the SICand NAICS codes of the different segments of a company.We identify a company as a sin stock if any of its segmentshas an SIC code in either the beer or the smoke group oran NAICS code in the gaming group, as defined above.Accordingly, our final list of sin stocks is the union of twoscreening procedures—one applying the Fama and French(1997) and NAICS classifications at the company level andthe second applying the same classifications at thesegment level using Compustat Segments data. The latterscreen on company segment information is essential forobtaining an accurate list of sin stocks, since manycompanies such as Philip Morris, now known as Altria,have diversified operations. We are unable to implementthe augmented search for stocks no longer in existence by1985, since the segments data are available only after1985. For stocks listed before 1985 and still in existenceafter 1985, we back-fill this augmentation procedure—i.e.,a stock identified as sinful using the segments data will becharacterized as sinful throughout its history.
A list of the sin stocks identified through the abovescreening procedure, containing Center for Research inSecurity Prices (CRSP) PERMNO, company name, and thetime period of coverage in our data set, can be obtainedfrom the authors’ Web sites. The list contains many well-known names such as Altria, Anheuser Busch Co., Bacardi,Bally, Caesars, Loews, Mandalay, and Trump Hotels. We alsoperformed some cross-checks of this list with searches ofpopular books on sin investing (e.g., Ahrens, 2004; Waxler,2004) and various online sources, to confirm the accuracyof this list. By and large, our screening procedure appears toyield an accurate and comprehensive list of stocks in thealcohol, tobacco, and gaming industries.
Table 1 provides a more systematic year-by-year lookat our data set of sin stocks beginning in 1926 and endingin 2006.14 There are a total of 193 distinct names,comprised of 36 distinct tobacco companies, 62 distinct
1983 58 11 26 21
1984 62 12 27 23
1985 62 11 27 24
1986 60 9 26 25
1987 59 9 24 26
14 Importantly, in our time-series tests that span a longer horizon,
tobacco stocks are considered sinful only in the post-1965 period.

ARTICLE IN PRESS
Table 1 (continued )
Panel A: Distribution by year
Year All Tobacco Alcohol Gaming
1988 60 9 24 27
1989 61 9 25 27
1990 64 9 23 32
1991 67 10 23 34
1992 70 11 21 38
1993 90 11 23 56
1994 98 11 22 65
1995 106 13 25 68
1996 110 15 30 65
1997 116 16 32 68
1998 107 13 31 63
1999 98 13 32 53
2000 82 11 29 42
2001 73 9 26 38
2002 69 7 25 37
2003 65 7 23 35
2004 63 8 21 34
2005 56 8 17 31
2006 56 8 17 31
Total 193 36 62 95
Panel B: Industry market betas: 1926–2006
Industry Beta Industry Beta
Agriculture 0.92 Guns 0.84
Food 0.74 Gold 0.65
Soda 0.82 Mines 0.93
Beer 0.94 Coal 0.79
Smoke 0.63 Oil 0.86
Toys 1.22 Utilities 0.80
Fun 1.39 Telecommunication 0.64
Books 1.07 Personal services 1.07
Household 0.93 Business services 0.94
Clothes 0.78 Computers 1.10
Healthcare 1.18 Chips 1.37
Medical equipment 0.84 Laboratory equipment 0.99
Drugs 0.85 Paper 1.42
Chemicals 1.02 Boxes 0.94
Rubber 1.07 Transport 1.14
Textiles 1.15 Wholesalers 1.10
Building materials 1.13 Retailers 0.96
Construction 1.35 Meals 0.97
Steel 1.33 Banks 1.02
Fabricated products 1.08 Insurance 1.11
Machinery 1.23 Real estate 1.24
Electrical equipment 1.28 Financials 1.26
Autos 1.22 Other 1.05
Aero 1.32 Gaming 1.12Ships 1.13
15 Note that in calculating these betas, we have not excluded the
gaming stocks from the Fama and French portfolios. This is unlikely to
bias the estimates of beta for the different industries by a significant
amount, since there are so few gaming stocks.16 Two public companies with large sex operations, according to
practitioners, are Playboy Enterprises and the Barcelona-based Private
Media Group. However, many other large entertainment conglomerates
profit off sex on cable television through holdings in various subsidiaries
that are difficult to track down.17 Another screen sometimes used in empirical analyses over the
universe of stocks is to drop firms with book values of o$10 million. We
have replicated our analyses below using this additional screen and
found similar results.
H. Hong, M. Kacperczyk / Journal of Financial Economics 93 (2009) 15–3620
alcohol companies, and 95 distinct gaming companies.There are not a lot of sin stocks—only 56 even in2006—relative to the thousands of stocks in the universe.While the numbers of tobacco and alcohol stocks havestayed relatively constant through the years, the numberof gaming stocks increased significantly in the 1990s withthe ongoing deregulation of the gaming industry. As wementioned earlier, this recent trend suggests that gamingmay be gaining more widespread social acceptance. As wealso indicated, however, there are a number of otherfactors underlying this trend.
We further characterize these sin stocks in Panel B ofTable 1 by calculating the market betas for the period of1926–2006 of the different industry portfolios, using datafrom Fama and French (1997). The market betas arecalculated using the time-series of monthly returns on the49 (value-weighted) industry portfolios (the original 48Fama and French, 1997, industries plus gaming).15 Thethree portfolios of interest (beer, smoke, and gaming) havebetas of 0.94, 0.63, and 1.12, respectively. As suggested bypractitioners, beer and smoke appear to have somewhatlower betas than other industries during the period of1926–2006 whereas gaming stocks have betas compar-able to those of many other industries.
While we focus on the so-called Triumvirate of Sin(alcohol, tobacco, and gaming), two other classes of stocksare sometimes thought of as sinful. The first is the sexindustry. However, there are very few publicly tradedcompanies with heavy operations in sex.16 Therefore,omitting these companies will not affect our results in anysignificant way. The second is the defense industry. Wehave decided against including defense as a sin industry inour main analysis because it is not clear that defense isconsidered a sin by many Americans. As a robustnessexercise, however, we later broaden our definition of sinstocks to include stocks in Fama and French (1997)industry grouping 26 (guns).
3. Data
Having described our procedure for identifying sinstocks, we now characterize our data collection on theuniverse of stocks. Our data on US firms come from CRSPand Compustat. From CRSP, we obtain daily closing stockprices, daily shares outstanding, and daily dollar tradingvolumes for NYSE, Amex, and Nasdaq stocks over theperiod of 1962–2006. From Compustat, we obtain annualinformation on a variety of accounting variables duringthe same period. To be included in our sample, a firmmust have the requisite financial data from both CRSP andCompustat. We follow other studies in focusing oncompanies with CRSP share codes of 10 or 11 andexcluding firms with one-digit SIC codes of 6, whichbelong to the financial services industry.17
Our data on ownership structures come from the CDASpectrum Database of 13-F filings by institutional inves-tors, defined as those managing at least $100 million inassets. This database reports holdings of a particular stockin terms of shares held by various classes of institutional

ARTICLE IN PRESS
Table 2Summary statistics.
This table reports summary statistics for the variables used for the six
sets of regressions. Panel A reports the summary statistics (time-series
averages of cross-sectional means and standard deviations) for the
institutional ownership regressions. Institutional ownership (IO) is the
fraction of shares of a firm held by institutions. LOGSIZE is the logarithm
of the market capitalization of the company. LOGMB is the logarithm of
the market-to-book variable. STD is the daily stock return standard
deviation during the past year. BETA is the firm’s industry market beta.
PRINV is the inverse of the stock price. RET is the arithmetic average of
the last year’s monthly returns. These variables are calculated at the end
of the year. Panel B reports the similar summary statistics for the analyst
coverage regressions. LOGCOV is the log of one plus the number of
analyst estimates issued on a company at the end of the year. The other
variables in Panel B are constructed in the same way as in Panel A except
over a different time period. Panel C reports the summary statistics for
the time-series return regressions. EXCOMP is the excess monthly return
net of the risk-free rate for an equal-weighted portfolio of sin stocks net
of comparable stocks. EXSINP is the excess monthly return net of the risk-
free rate for an equal-weighted portfolio of sin stocks. MKTPREM is
the excess monthly return of the value-weighted CRSP index. SMB is the
return of a portfolio long small stocks and short large stocks. HML is the
return of a portfolio long high book-to-market stocks and short low
book-to-market stocks. MOM is the return of a portfolio long past
12-month return winners and short past 12-month return losers. Panel D
reports the summary statistics for the cross-sectional return regressions.
EXMRET is the monthly return of a stock net of the risk-free rate. LOGSIZE,
LOGMB, TURN, and RET are now calculated at the end of each month. BETA
is just the firm’s industry beta, which is now calculated at the end of
each month using the past 36-months of data. TURN, calculated at the
end of month, is the daily share turnover during the past 12-months.
LOGAGE is the natural logarithm of the firm’s age, measured by the
number of years available in the CRSP/Compustat data. BLEV is book
leverage. Panel E reports the summary statistics for the price-to-book
regressions. LOGPE is the log of the price-to-earnings ratio. LOGPEBITDA is
the log of price-to-earnings before taxes and after depreciation ratio. ROE
is return on equity. RDSALES is the fraction of research and development
expenditures to firm sales. Panel F reports the statistics for the financing
decision regressions. MLEV is market leverage. CASH is cash balances.
DIVPAY is the dividend payout ratio. REP is share repurchases. PAYOUT is
the overall firm payout ratio. TOBQ is Tobin’s Q, which is market value of
equity plus assets minus book value of equity over assets. TANG is firm
tangibility defined as net plant, property, and equipment divided by total
assets. PROFIT is earnings before interest, taxes, and depreciation divided
by total assets. LOGSALES is the log of net sales.
Panel A: Institutional ownership regressions: 1980–2006
Variable Time-series average of
means
Time-series average of
standard deviations
IO 0.28 0.29
LOGSIZE (‘000) 11.80 2.28
BETA 1.24 0.45
LOGMB 0.74 0.89
PRINV 0.32 0.80
STD (%) 3.75 2.45
RET (%) 1.25 5.65
Panel B: Analyst coverage regressions: 1976–2006
Variable Time-series average of
means
Time-series average of
standard deviations
H. Hong, M. Kacperczyk / Journal of Financial Economics 93 (2009) 15–36 21
investors. The five institution types are banks, insurancecompanies, mutual funds, independent investment advi-sors (which includes hedge funds), and others (includinguniversities, pension plans, and employee ownershipplans). While the 13-F filing is available quarterly, mostcompanies only file timely reports on a semi-annual basis,at the end of June and at the end of December. Ouranalysis will focus on the end-of-year filings. Our data onanalyst coverage come from the Institutional BrokersEstimates System (IBES) database, which reports thenumber of analyst estimates of earnings issued on a stockat various points in time (typically quarterly).
3.1. Variables in ownership regressions
Institutional ownership (IOit) is the fraction of theshares of company i held by institutions in the CDASpectrum Database at the end of year t. IO is calculated byaggregating the shares held by all five types of institutionsat the end of the year and then dividing this amount byshares outstanding at the end of the year (Item 25 inCompustat). LOGSIZEit is the natural logarithm of firm i’smarket capitalization (price times shares outstanding) atthe end of year t. LOGMBit is the natural logarithm of firmi’s market cap divided by its book value at the end of yeart. STDit is the standard deviation of daily (simple, raw)returns during year t. BETAit is the beta of firm i’s industry,among the 49 industries listed in Table 1, in year t. PRINVit
is the inverse of firm i’s share price at the end of year t.
RETit is the average monthly return on stock i duringyear t.
The summary statistics for these variables are providedin Panel A of Table 2. The time-series average of the cross-sectional means of IO is 0.28, and the time-series averageof the cross-sectional standard deviations of IO is 0.29. Inother words, in a typical year, a typical firm has about 28%of its shares held by institutions, and the standarddeviation of institutional ownership in a typical cross-section is 29%. The other variables are standard and do notmerit discussion, except to report that their summarystatistics are similar to those found in earlier studies.
3.2. Variables in analyst coverage regressions
Our measure of analyst coverage is LOGCOVit, defined asthe natural logarithm of one plus the number of analystscovering firm i at the end of year t. As in earlier studies,stocks that do not appear in IBES are assumed to have noanalyst estimates.18 The other variables used in theseregressions are constructed in the same way as those inthe ownership regressions. The summary statistics forthese variables over the period of 1976–2006 are reportedin Panel B of Table 2. Note that the time-series average of
LOGCOV 0.99 1.05
LOGSIZE (‘000) 11.21 2.19
BETA 1.14 0.38
LOGMB 0.61 0.93
PRINV 0.37 0.86
STD (%) 3.91 2.56
RET (%) 1.34 5.95
18 If a stock does not have an analyst estimate at the end of the year,
we look backwards through the year to find the most recent estimate and
use this as the measure of analyst coverage for the firm during the year.
Alternatively, we also have experimented with using October 1 as a
cutoff date. In other words, if a stock does not have any analyst estimates
in the last quarter, then it is recorded as having zero analyst estimates for
the year.

ARTICLE IN PRESS
Panel C: Time-series return regressions: 1965–2006
Variable Mean Standard deviation
EXCOMP (%) 0.25 2.57
EXSINP (%) 0.96 5.62
MKTPREM (%) 0.46 4.45
SMB (%) 0.28 3.27
HML (%) 0.45 2.94
MOM (%) 0.83 4.07
Panel D: Cross-sectional return regressions: 1965–2006
Variable Time-series average of
means
Time-series average of
standard deviations
EXMRET (%) 0.87 18.17
LOGSIZE (‘000) 11.27 2.11
BETA 1.13 0.37
TURN (%) 0.36 0.58
LOGMB 0.55 0.90
RET (%) 1.35 4.82
LOGAGE 2.23 0.99
BLEV (%) 30.92 24.08
Panel E: Valuation regressions: 1965–2006
Variable Time-series average of
means
Time-series average of
standard deviations
LOGMB 0.41 0.84
LOGPE 2.73 0.98
LOGPEBITDA 2.11 1.02
ROE (%) 4.21 35.24
RDSALES (%) 10.55 92.98
Panel F: Corporate financing decisions regressions: 1965–2006
Variable Time-series average of
means
Time-series average of
standard deviations
BLEV 0.34 0.31
MLEV 0.27 0.25
CASH 0.17 0.28
PAYOUT 0.28 1.28
DIVPAY 0.16 0.45
REP 0.12 0.91
TOBQ 1.92 2.08
TANG 0.32 0.24
PROFIT 0.07 0.26
LOGSALES �0.06 0.94
Table 2 (continued)
H. Hong, M. Kacperczyk / Journal of Financial Economics 93 (2009) 15–3622
the cross-sectional means of LOGCOV is 0.99, and the time-series average of the cross-sectional standard deviations is1.05. Thus, in a typical year, a typical firm has about 1.7analysts with a standard deviation of about 1.9 analysts.The summary statistics for the other variables in Panel Bdiffer slightly from those in Panel A because of theirdifferent sample periods.
3.3. Variables in time-series return regressions
In our time-series return regressions, the dependentvariable EXCOMP (SINPt–COMPt) is the monthly return ofan equal-weighted portfolio of sin stocks in month t, netof the monthly return of an equal-weighted portfolio of
comparable stocks that belong to the Fama and French(1997) industry groups 2 (food), 3 (soda), 7 (fun), and 43(meals and hotels). EXSINP is the monthly return of the sinportfolio net of the risk-free rate. MKTPREMt is themonthly return of the CRSP value-weighted portfolio inmonth t, net of the risk-free rate. SMBt, HMLt, and MOMt
are well-known portfolio return series downloaded fromKen French’s Web site. SMB is the monthly return of aportfolio that is long on small stocks and short on largestocks. HML is the monthly return of a portfolio that islong on high book-to-market stocks and short on lowbook-to-market stocks. MOM is the monthly return of aportfolio that is long on past one-year return winners andshort on past one-year return losers. The summarystatistics for the various portfolio returns are presentedin Panel C of Table 2.
3.4. Variables in cross-sectional return regressions
Our empirical analyses of sin stock returns employmonthly measures of returns as dependent variables. Inour cross-sectional return regressions, the dependentvariable EXMRETit is the monthly return of an individualstock i in month t net of the risk-free rate. LOGSIZEit isdefined as in Panel A, except that we now calculateLOGSIZEit on a monthly as opposed to annual basis. BETAit
is the time-varying beta of the industry to which firm i
belongs, calculated over the most recent three years ofmonthly data leading up to and including month t. TURNit
is the average of daily share turnover in stock i—definedas shares traded divided by shares outstanding—duringmonth t. LOGMBit is the natural logarithm of the market-to-book ratio of stock i at the end of month t. RETit is theaverage of the most recent 12 months of returns on stock i
leading up to and including month t. Finally, LOGAGE is thenatural logarithm of the firm’s age, measured by thenumber of years available in the CRSP/Compustat data.BLEV is the book leverage of the company, which isdefined more precisely below. The summary statistics ofthese variables are reported in Panel D of Table 2.
3.5. Variables in valuation regressions
LOGMBit is the natural logarithm of firm i’s market-to-book ratio measured at the end of year t. LOGPEit is thenatural logarithm of the firm’s price-to-earnings ratio atthe end of the year. LOGPEBITDAit is the natural logarithmof the firm’s price-to-EBITDA (earnings before interest,tax, depreciation, and amortization). ROEit is firm i’s returnon equity in year t. ROE is calculated as the ratio ofearnings during year t over the book value of equity at theend of year t. Earnings are calculated as income beforeextraordinary items available to common stockholders(Item 237), plus deferred taxes from the income statement(Item 50), plus investment tax credit (Item 51). RDSALESit
is the fraction of firm i’s research and developmentexpenditures (Item 46) to firm sales (Item 12) in year t.We also introduce RDMISSit, which is a dummy variablethat equals one if firm i’s R&D expenditures observation inyear t is missing. SP500it is a dummy variable equal to one

ARTICLE IN PRESS
H. Hong, M. Kacperczyk / Journal of Financial Economics 93 (2009) 15–36 23
if company i is part of the S&P 500 index in year t. Thetime-series average of the cross-sectional means ofLOGMB is 0.41, and the time-series average of the cross-sectional standard deviations is 0.84. Thus, in a typicalyear, a typical firm in our sample has a market-to-bookratio of 1.51 with a standard deviation of about 2.32. Thesummary statistics for these variables are reported inPanel E of Table 2.
3.6. Variables in corporate financing decision regressions
The book leverage of firm i in year t, denoted by BLEVit,is total debt divided by the sum of total debt and bookequity ((Item 9+Item 34)/(Item 9+Item 34+Item 216)),measured at fiscal year-end. We also use market leverage,denoted by MLEVit, which is the same as BLEV except thatwe replace Item 216 with the firm’s market capitalization(the average of firm i’s market capitalization over calendaryear t). CASHit is firm i’s cash balances (Item 1) divided bybook assets at the start of year t (Item 6). For firm i in yeart, PAYOUTit is calculated as Compustat Item 115 minuspreferred stock reduction plus Item 21, all divided by netincome (Item 172), where the preferred stock reduction isthe maximum between zero and the difference betweenthe previous year’s Item 10 and the current year’s Item 10.We then break down this payout variable into itsconstituent parts. DIVPAYit is firm i’s dividend payoutratio in year t, namely Item 21 divided by Item 172. REPit
is firm i’s repurchases divided by net income in year t
(Item 115 minus preferred stock reduction, all divided byItem 172).
Tobin’s Q, TOBQit, is the market value of equity (pricetimes shares outstanding from CRSP) plus assets minusthe book value of equity (Item 60+Item 74), all divided byassets, measured at the end of year t. Asset tangibility,TANGit, is defined as firm i’s net plant, property, andequipment (Item 8) divided by total assets at the end ofyear t (Item 6) and expressed in percentage terms.Profitability, PROFITit, is defined as earnings before inter-est, taxes, and depreciation (Item 13) divided by totalassets at the end of year t and expressed in percentageterms. Finally, LOGSALESit is the natural logarithm of netsales of firm i in year t (Item 12).
19 For evidence related to predictors of institutional ownership, see
Del Guercio (1996) and Gompers and Metrick (2001).
4. Results
4.1. Institutional ownership
In this section, we test whether the shares of sin stocksare less held by institutions that are subject to social normpressures, while controlling for a host of other firmcharacteristics such as firm size and stock beta. Wehypothesize that institutions such as pension funds,universities, religious organizations, banks, and insurancecompanies are less willing than other types of investors tohold sin stocks due to the public nature of theirinvestments, their diverse constituencies, and their ex-posure to public scrutiny (e.g., picketing by an unhappyminority).
Our empirical objective is to determine whether sinstocks have a different institutional investor followingthan do other stocks. Our task is complicated by the factthat sin stocks will differ from other stocks along anumber of other dimensions such as firm size and firmbeta. Indeed, earlier research has identified some key firmcharacteristics that are correlated with institutional own-ership.19 For example, one reason why firm size iscorrelated with ownership by institutions is that institu-tions tend to avoid small stocks because of liquidityissues. In this paper, we remain agnostic about whycertain firm characteristics tend to be correlated withownership by institutions. Our strategy is to soak up asmuch of the cross-sectional variation as possible so thatwe can better identify the differential effect of sin stockscompared to non-sin stocks.
To this end, we estimate the following regressionmodel:
IOit ¼ a0 þ a1 SINDUMit þ a2Xit þ �it ; i ¼ 1; . . . ;N, (1)
where SINDUM equals one if the stock is a sin stock andzero otherwise, Xit is a vector of firm characteristics, and eit
is measurement error. Xit includes various permutations ofthe following variables defined earlier: LOGSIZE, BETA,LOGMB, PRINV, STD, and RET. Also included in the set ofcontrol variables are NASD, a dummy that equals one if thestock is listed on Nasdaq and zero otherwise; and SP500, adummy variable that equals one if the stock is part of theS&P 500 index and zero otherwise. The coefficient ofinterest is a1, which measures whether sin stocks have adifferent ownership structure than do other stocks,controlling for the other firm characteristics contained inXit. The null hypothesis is that a1 equals zero, whereas ourprediction is that it will be significantly o0.
In order to interpret the coefficient on the sin stockdummy variable, SINDUM, as a test of social norm effects,we must address the possibility that it might pick upother effects associated with the industries in which oursin stocks reside. In particular, our sin stocks tend to beconsumer goods, and it is possible that consumer goodsdiffer from other industries in terms of attracting institu-tional ownership. To eliminate this potentially confound-ing interpretation, we create two new control variables.The first and more straightforward one is ONEDIGDUM,which equals one if a stock resides in the same one-digitSIC code industry as any of our sin stocks and zerootherwise. With the inclusion of ONEDIGDUM, ourSINDUM effect cannot be interpreted in terms of institu-tions favoring certain one-digit SIC code industries overothers.
A more subtle and potentially more conservative wayto address the issue of related industry effects oninstitutional ownership is to find comparables for oursin stocks. Conveniently, the Fama and French (1997)industry groups 2 (food), 3 (soda), 7 (fun), and 43 (mealsand hotels) provide natural comparables to our sin stocks.Indeed, in some other industry classification schemes,

ARTICLE IN PRESS
22 The cross-sectional relationships between ownership and the
various firm characteristics examined in this section are also very stable
across years. (A table that reports this cross-sectional regression year by
H. Hong, M. Kacperczyk / Journal of Financial Economics 93 (2009) 15–3624
beer is often lumped together with soda, as is tobacco orsmoke with food, and gaming with fun and meals.Accordingly, we create the dummy variable GDUM, whichequals one if a stock resides in the set of Fama and French(1997) industry classifications 2 (food), 3 (soda), 4 (beer),5 (smoke), 7 (fun), 43 (meals), and our 49th industry(gaming), and zero otherwise. With GDUM as a controlvariable, our sin stock effect cannot be interpreted interms of institutions favoring other industries over theconsumer industries included in the definition of GDUM.This careful matching of sin stocks to industry compar-ables and other stock characteristics is the core of ouridentification strategy.
We estimate our regression model using the ultra-conservative method of running a pooled (panel) regres-sion and calculating standard errors by clustering at theindustry level (using our 49 industry groupings). Thisapproach addresses the concern that the errors, condi-tional on the independent variables, are correlated withinindustry groupings (e.g., Moulton, 1986). One reason whythis may occur is that if an institution decides to invest ina stock in a particular industry, it may also invest incomparables in the same industry for reasons of liquidityor diversification. We also have estimated our model usingthe Fama and MacBeth (1973) methodology with Neweyand West (1987) standard errors, and we obtain similarresults. We report our findings from the estimation withindustry-clustered standard errors because this methodmakes fewer assumptions about how the errors arecorrelated over time, and thus, it is likely to give us moreconservative standard errors.20
Our results from estimating various specifications ofEq. (1) are reported in Panel A of Table 3. In column 1, wereport our estimates of a model that includes asindependent variables SINDUM, ONEDIGDUM, LOGSIZE,BETA, NASD, and SP500. We find that the coefficient infront of SINDUM is �0.0672 and is statistically significantat the 1% level of significance. The coefficient in front ofONEDIGDUM is negative but tiny and statistically insig-nificant. The mean institutional ownership in our sampleis 28%. There is no difference in institutional ownershipbetween sin stock comparables in the same one-digit SICcode and the rest of the sample. In contrast, sin stocks onaverage have about 21% of their shares held by institu-tions, which represents about a 24% shortfall relative tothe mean. Both LOGSIZE and BETA attract positive andstatistically significant coefficients, suggesting that insti-tutions seem to favor big firms and firms from industrieswith high market betas. Finally, Nasdaq stocks and stocksin the S&P 500 index have less institutional ownership ascompared to other stocks.21
In column 2, we replace ONEDIGDUM with GDUM. Theestimated coefficient on GDUM bears a negative sign(�0.0209), suggesting that institutions may shy awayfrom consumer goods relative to other industries, but it isstatistically insignificant. However, including GDUM
20 Where appropriate, we also performed Tobit regressions. The
results of the tests remain qualitatively similar.21 Falkenstein (1996) reports similar findings for a sample of mutual
funds.
rather than ONEDIGDUM reduces the economic effect ofour SINDUM variable. The coefficient in front of SINDUM isnow �0.0487, but it remains statistically significant at the10% level of significance. Despite its reduction in magni-tude in this version of our model, the economic effect ofsin stocks on institutional ownership is still sizeable. Thesin stock comparables, defined as those with similar Famaand French (1997) industry groupings as our sin stocks,have on average about 28% of their shares held byinstitutions. In contrast, sin stocks have about 23% oftheir shares held by institutions, which is approximatelyan 18% lower institutional ownership ratio than theircomparables.
In columns 3–6, we successively experiment withdifferent permutations of control variables to illustratethe robustness of our finding. In column 3, we includeLOGMB as an additional control; in column 4, we substitutePRINV for LOGMB since these two variables are highlycorrelated, as both are scaled by price. In column 5, we addin STD (standard deviation of stock return) and find that itattracts a negative coefficient and is statistically signifi-cant, indicating that institutions tend to favor low variancestocks. Finally in column 6, we add in the average monthlyreturn over the past 12 months (RET). RET attracts anegative coefficient and is also statistically significant. Thekey observation to make across all of these alternativespecifications is that the coefficient in front of SINDUM
remains statistically significant throughout at the 10% levelof significance (except for column 3), with economiceffects that are similar to that reported in column 2. Forinstance, in column 6, sin stocks are still estimated to havea 16% lower institutional ownership ratio than theircomparables.22
Next, we re-specify the ownership regression todisaggregate the effects of sin stocks on holdings bydifferent classes of institutions. Note that for theseregressions the data run only from 1980 to 1997.23 Asdescribed earlier, our data set disaggregates ownershipinformation into five types of institutions: type 1representing banks, type 2 insurance companies, type 3mutual funds, type 4 independent investment advisors,and type 5 all other institutions, including universities,employee stock ownership plans, etc. We expect types 3and 4 institutions to be less constrained by social normsas compared to the other three types of institutions, sincetypes 3 and 4 are the natural arbitrageurs in the market.Accordingly, we divide the institutions in our data set intotwo subgroups, placing types 1, 2, and 5 in one group andtypes 3 and 4 in another group. We then create two newdependent variables for the regression specificationreported in column 6 of Panel A, Table 3. The first of
year is available upon request.)23 The truncation of our sample is necessitated by vendor–
distributor compatibility issues in the data on institution types after
1997. After 1997, many institutions in the data are erroneously labeled as
type 5 institutions. For completeness, we also estimated a pooled
regression that includes data after 1997 and found similar results.

ARTICLE IN PRESS
Table 3Institutional ownership and analyst coverage of sin stocks.
In Panel A, the dependent variable is institutional ownership (IO), which is calculated at the end of each year. SINDUM equals one if a stock is a sin stock
(alcohol, gaming, or tobacco) and zero otherwise. GDUM equals one if a stock is a sin stock or comes from the Fama and French (1997) industry groupings:
2 (food), 3 (soda), 7 (fun), and 43 (meals), and zero otherwise. LOGSIZE is the logarithm of the market capitalization of the company. BETA is the firm’s
industry rolling market beta calculated over the last 36 months. LOGMB is the logarithm of the market-to-book variable. PRINV is the inverse of the stock
price. STD is the daily stock return standard deviation during the past year. RET is the average monthly return during the past year. NASD equals one if the
stock is listed on Nasdaq and zero otherwise. SP500 equals one if the stock is in the S&P 500 index and zero otherwise. These variables are calculated at the
end of the year. Panel A reports the results of a pooled regression with Moultons (1986) standard errors clustered at the 49-industry groupings. The
ownership data cover the period 1980–2006. Panel B reports the results, in which the dependent variable is ownership by two subgroups. In the first
column, the dependent variable is the fraction of shares held by type 1 (banks), type 2 (insurance companies), and type 5 (others including pension plans,
endowments, and employee-ownership plans) institutions. In the second column, the dependent variable is shares held by type 3 (mutual funds) and type
4 (independent investment advisors) institutions. T-test of the difference of the coefficients in front of SINDUM across these two regressions is provided
(Greene, 2000). The data for Panel B run only from 1980–1997. In Panel C, the dependent variable is analyst coverage, calculated as a log of one plus the
number of analyst estimates issued on a stock at the end of the year (LOGCOV). The analyst data are from the period 1976–2006. Panel D reports the results
from specification (6) in Panel A for different subperiods. All regressions include one-digit SIC industry fixed effects. *** 1% significance; ** 5% significance;
and * 10% significance.
Panel A: Institutional ownership: 1980–2006
Variable (1) (2) (3) (4) (5) (6)
SINDUM �0.0672*** �0.0487* �0.0421 �0.0489* �0.0449* �0.0448*
(0.0095) (0.0269) (0.0275) (0.0271) (0.0252) (0.0254)
ONEDIGDUM �0.0024
(0.0122)
GDUM �0.0209 �0.0216 �0.0209 �0.0253 �0.0257
(0.0279) (0.0278) (0.0280) (0.0263) (0.0265)
LOGSIZE 0.0819*** 0.0818*** 0.0950*** 0.0831*** 0.0765*** 0.0781***
(0.0031) (0.0031) (0.0039) (0.0030) (0.0026) (0.0028)
BETA 0.1204*** 0.1194*** 0.1362*** 0.1209*** 0.1311*** 0.1322***
(0.0367) (0.0376) (0.0431) (0.0372) (0.0383) (0.0387)
LOGMB �0.0406***
(0.0040)
PRINV 0.0063* 0.0172*** 0.0148***
(0.0035) (0.0022) (0.0025)
STD �1.4783*** �1.3974***
(0.1339) (0.1241)
RET �0.1904***
(0.0261)
NASD �0.0111* �0.0113* 0.0065 �0.0113* �0.0023 �0.0005
(0.0066) (0.0064) (0.0068) (0.0064) (0.0066) (0.0066)
SP500 �0.0415*** �0.0414*** �0.0929*** �0.0445*** �0.0380*** �0.0422***
(0.0101) (0.0102) (0.0108) (0.0098) (0.0095) (0.0098)
Panel B: Pooled regressions by different types of institutions: 1980–1997
Variable (Type 1+2+5) (Type 3+4)
SINDUM �0.0270** �0.0111
(0.0124) (0.0134)
GDUM �0.0035 �0.0177
(0.0101) (0.0142)
LOGSIZE 0.0270*** 0.0465***
(0.0010) (0.0023)
BETA 0.0237 0.1213***
(0.0152) (0.0270)
PRINV 0.0064*** 0.0026*
(0.0006) (0.0013)
STD �0.4492*** �0.3164***
(0.0563) (0.0907)
RET �0.1432*** 0.0019
(0.0094) (0.0186)
NASD �0.0202*** 0.0187***
(0.0023) (0.0032)
SP500 0.0388*** �0.0441**
(0.0050) (0.0066)
t-Test of difference of coefficients in front of SINDUM �0.0159***
(0.0064)
H. Hong, M. Kacperczyk / Journal of Financial Economics 93 (2009) 15–36 25
ARTICLE IN PRESS
Panel C: Analyst coverage: 1976–2006
Variable (1) (2) (3) (4) (5) (6)
SINDUM �0.1650** �0.1395 �0.1578 �0.1425* �0.1443* �0.1400*
(0.0777) (0.0880) (0.1139) (0.0835) (0.0834) (0.0846)
ONEDIGDUM 0.0169
(0.0207)
GDUM �0.0187 �0.0207 �0.0187 �0.0171 �0.0212
(0.0485) (0.0434) (0.0492) (0.0499) (0.0492)
LOGSIZE 0.3637*** 0.3637*** 0.4060*** 0.3830*** 0.3857*** 0.4037***
(0.0079) (0.0078) (0.0079) (0.0081) (0.0084) (0.0084)
BETA 0.1066* 0.1058* 0.1584*** 0.1326** 0.1276** 0.1414**
(0.0559) (0.0537) (0.0452) (0.0561) (0.0578) (0.0568)
LOGMB �0.1476***
(0.0094)
PRINV 0.0872*** 0.0824*** 0.0547***
(0.0074) (0.0059) (0.0047)
STD 0.6350** 1.6675***
(0.2895) (0.3276)
RET �2.2039***
(0.0709)
NASD �0.0849*** �0.0841*** 0.0207 �0.0839*** �0.0879*** �0.0633**
(0.0292) (0.0295) (0.0294) (0.0301) (0.0298) (0.0298)
SP500 0.3089*** 0.3097*** 0.2471*** 0.2680*** 0.2654*** 0.2250***
(0.0325) (0.0326) (0.0310) (0.0321) (0.0325) (0.0326)
Panel D: Ownership regressions by subperiods
Variable 1980–1984 1985–1989 1990–1994 1995–1999 2000–2006
SINDUM �0.0660*** �0.0163 �0.0305* �0.0513** �0.0638
(0.0137) (0.0175) (0.0170) (0.0227) (0.0606)
GDUM 0.0041 �0.0220 �0.0375** �0.0151 �0.0325
(0.0175) (0.0155) (0.0166) (0.0247) (0.0589)
LOGSIZE 0.0581*** 0.0631*** 0.0708*** 0.0734*** 0.0889***
(0.0039) (0.0025) (0.0035) (0.0037) (0.0046)
BETA 0.0416 0.0921*** 0.0698** 0.0489 0.0311
(0.0374) (0.0326) (0.0337) (0.0427) (0.0189)
PRINV 0.0136*** 0.0062*** 0.0075*** �0.0033 �0.0386**
(0.0024) (0.0016) (0.0019) (0.0126) (0.0150)
STD �1.3000*** �0.8690*** �0.5989*** �1.3479*** �1.8796***
(0.2547) (0.1376) (0.0957) (0.2004) (0.3205)
RET �0.0799* �0.2751*** �0.1176*** �0.2177*** �0.2314***
(0.0428) (0.0347) (0.0241) (0.0235) (0.0595)
NASD �0.0222*** �0.0351*** �0.0192*** �0.0126 0.0257***
(0.0051) (0.0051) (0.0065) (0.0081) (0.0094)
SP500 0.0467*** 0.0159 �0.0028 �0.0058 �0.1164***
(0.0128) (0.0096) (0.0112) (0.0135) (0.0179)
Table 3 (continued)
H. Hong, M. Kacperczyk / Journal of Financial Economics 93 (2009) 15–3626
these is the fraction of shares held by types 1, 2, and 5institutions, and the second is the fraction of shares of acompany held by types 3 and 4 institutions.
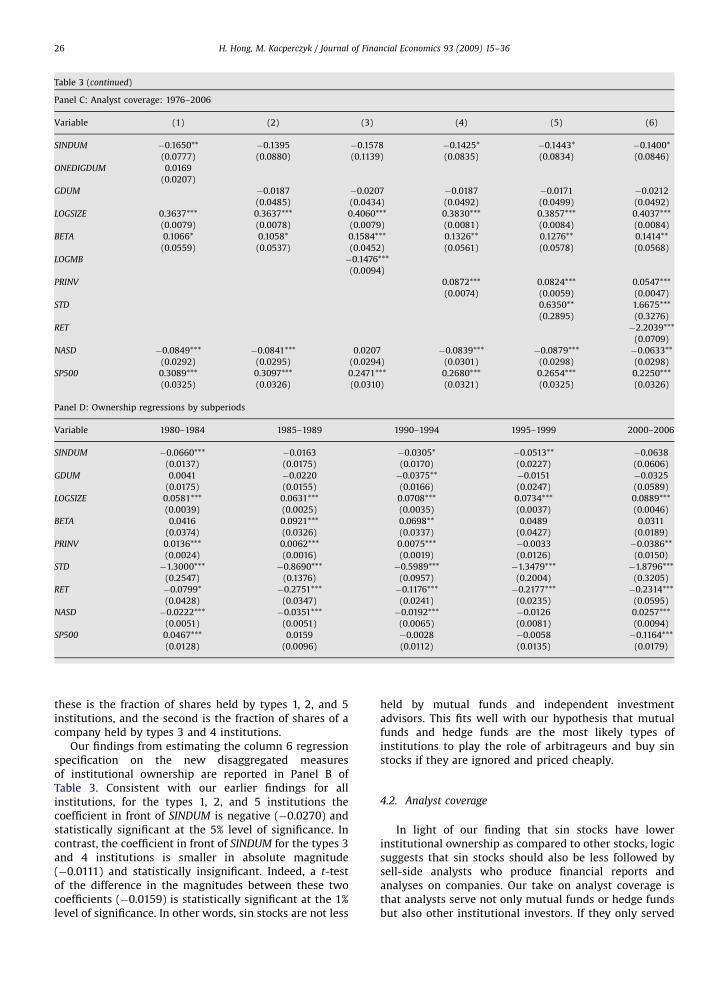
Our findings from estimating the column 6 regressionspecification on the new disaggregated measuresof institutional ownership are reported in Panel B ofTable 3. Consistent with our earlier findings for allinstitutions, for the types 1, 2, and 5 institutions thecoefficient in front of SINDUM is negative (�0.0270) andstatistically significant at the 5% level of significance. Incontrast, the coefficient in front of SINDUM for the types 3and 4 institutions is smaller in absolute magnitude(�0.0111) and statistically insignificant. Indeed, a t-testof the difference in the magnitudes between these twocoefficients (�0.0159) is statistically significant at the 1%level of significance. In other words, sin stocks are not less
held by mutual funds and independent investmentadvisors. This fits well with our hypothesis that mutualfunds and hedge funds are the most likely types ofinstitutions to play the role of arbitrageurs and buy sinstocks if they are ignored and priced cheaply.
4.2. Analyst coverage
In light of our finding that sin stocks have lowerinstitutional ownership as compared to other stocks, logicsuggests that sin stocks should also be less followed bysell-side analysts who produce financial reports andanalyses on companies. Our take on analyst coverage isthat analysts serve not only mutual funds or hedge fundsbut also other institutional investors. If they only served

ARTICLE IN PRESS
H. Hong, M. Kacperczyk / Journal of Financial Economics 93 (2009) 15–36 27
mutual funds or hedge funds, then one might not expectto see an effect on analyst coverage. To test this prediction,we utilize the same methodology as developed above forour analysis of institutional ownership. This methodologymay also be viewed as an extension of earlier studies onthe determinants of analyst coverage, such as Hong, Lim,and Stein (2000).
In this section, we estimate the following cross-sectional regression specification:
LOGCOVit ¼ b0 þ b1 SINDUMit þ b2Xit þ �it ; i ¼ 1; . . . ;N,
(2)
where SINDUM equals one if the stock is a sin stock andzero otherwise; Xit is a vector of firm characteristics, andeit is measurement error. The components of Xit and theestimation methodology are the same as described abovefor regression specification (1).
The results are presented in Panel C of Table 3, whoselayout parallels that of Panel A above. Accordingly, we areable to quickly summarize our key findings. Notice that thecoefficient in front of SINDUM is negative and statisticallysignificant across four out of the six columns representingalternative specifications of our model. The coefficient infront of GDUM is tiny and statistically insignificant. Incolumn 6, again our most conservative specification, thecoefficient in front of SINDUM is �0.14 and is statisticallysignificant at the 10% level of significance.24 In terms of theabsolute number of analysts, the typical firm has about 1.7analysts covering it, whereas a sin stock has about 1.3(about one-half fewer analysts or a 23% decline relative tothe mean). As for the other variables, they attractcoefficients that are similar to what already has beenshown in Hong, Lim, and Stein (2000).
One potential alternative explanation for these findingsis that sin stocks are mature companies that do littleequity issuance and hence, attract little analyst coverage.To disentangle this effect, we construct from the SDCEquity Issuance Database the annual amount of equityissuances done by companies and include this as a controlvariable. Adding this variable does not change our results,and therefore we omit the results from this augmentedspecification for brevity.
In Panel D, we calculate the average coefficient forSINDUM using the specification from column 6 of Panel Afor different sub-periods, 1980–1984, 1985–1989,1990–1994, 1995–1999, and 2000–2006. In other words,rather than averaging across all the years which is how wegot the coefficient in Panel A, we want to see how thiscoefficient has varied over these years. The idea is to seewhether the shunning of sin stocks has been fairly stableover these years, as this will inform us as to the pricingimplications we might expect from this neglect. Noticethat the coefficient for 1980–1984 is �0.0660 while thecoefficient at the end of the sample is of a comparable
24 In column 3, using LOGMB as a control rather than PRINV yields a
larger point estimate on SINDUM (�0.1578), but weakens its statistical
significance. The convention in the literature is to use PRINV which we
follow here for comparability. When we include the other controls as in
the later columns, then we still obtain a statistically significant estimate
on SINDUM even when using LOGMB rather than PRINV as a control.
magnitude �0.0638. In the intervening periods, thecoefficient bounces around these two values. So theredoes not appear to be a trend in terms of sin stocks beingmore shunned by institutions over this period.
These results are consistent with estimates from theSocial Investment Forum, which produces reports on theirestimates of the fraction of private portfolios that arescreened based on these sin measures. Interestingly, goingback to their 1990s reports, the fraction of screeneddollars has been quite stable over the last 15 years.Importantly, they also establish similar figures for Europe.
In sum, we have obtained compelling evidence that sinstocks are less held or followed by certain institutions andanalysts who discriminate against sin stocks for socialnorm rationales; and in their absence, arbitrageurscomprised of mutual funds and hedge funds (andindividuals) are willing to buy these stocks. Moreover,these patterns have been fairly stable over the last twodecades. These findings are consistent with both Becker’stheory of racial discrimination by employers and Arrow’ssubsequent remark on arbitrage by employers who arewilling to flout social convention to take advantage ofunemployed, talented labor.
In our investigation of social norms in the stockmarket, the question that remains is whether socialnorms affect the prices of sin stocks, i.e., is there enougharbitrage capital to completely eliminate any norm-induced price effects?
4.3. Implications for stock prices
To address this question, we examine the returnperformance of sin stocks. If sin stocks are neglected andfaced litigation risk heightened by social norms (in astable manner) for the last few decades, as we claim, andthere are limits to arbitrage, then we ought to find that sinstocks outperform comparables over this period.
We employ a number of methodologies to study thepotential price effects of social norms on sin stocks. First,we employ the methodology of analyzing the time seriesof the returns of a sin stock portfolio, net of comparables,for evidence of any excess returns, after adjusting forvarious well-known predictors of stock returns such as themarket portfolio. The first model we estimate is theCAPM:
EXCOMPt ¼ aþ bVWRFt þ �t ; t ¼ 1; . . . ; T , (3)
where EXCOMPt is the return on SIN–COMP, an equal-weighted portfolio long sin stocks and short theircomparables; VWRF is the value-weighted market portfo-lio; and et represents a generic error term that isuncorrelated with all other independent variables. Thecoefficient of interest is a, representing the excess returnof the sin stock portfolio. We also consider threeadditional performance models by adding the portfolioreturns SMB, HML, and MOM as independent variables inspecification (3). Our most conservative specification,thus, is given by the following four-factor model:
EXCOMPt ¼ aþ b1VWRFt þ b2SMBt þ b3HMLt
þ b4MOMt þ �t ; t ¼ 1; . . . ; T , (4)

ARTICLE IN PRESS
H. Hong, M. Kacperczyk / Journal of Financial Economics 93 (2009) 15–3628
where EXCOMPt again denotes the return on the portfoliolong sin stocks and short comparables, a is the excessreturn of that portfolio, bi’s are loadings on the otherportfolios that are used to predict EXCOMPt, and et is ageneric error term that is uncorrelated with all otherindependent variables. The loadings of our sin portfolio onthe four factors are time varying. As such, we estimatethese regressions on rolling three-year periods and thenaverage the coefficients across these periods to obtain theresults.
The results for the various specifications are presentedin Panel A of Table 4. We first estimate the regressionmodels using the period of 1965–2006. This is ourbenchmark period as we can obtain data to estimatecross-sectional return regression models and we knowthat all the stocks are steadily shunned during thissample. For completeness, we also estimate our resultsover the longer period, going back to 1926, though thecaveat here is that tobacco has not always been con-sidered a sin stock (see discussion in Section 4.7). TheCAPM yields an alpha of 25 bps a month, which isstatistically significant at the 10% level. For the two-factormodel (market and SMB), the alpha is slightly higher at30 bps a month with a 5% level of significance. When wesubsequently include HML, the alpha goes down to 26 bpsa month. When we add in MOM, our most conservativefigure is 26 bps a month for the outperformance of sinstocks relative to their comparables, with significance atthe 5% level. In Panel A, we also report these regressionresults estimated over the longer sample going back to1926. Here, we find similar outperformance figures ofaround 30 bps a month and significance at the 5% level. So,in sum, our time-series results tell a consistent story thatsin stocks outperform their comparables even afteradjusting for standard factors in the literature.
We use cross-sectional variation to investigate whethersin stocks outperform other comparable stocks. Weestimate the following return forecasting specification:
EXMRETit ¼ c0 þ c1SINDUMit�1c2Xit�1 þ �it; i ¼ 1; . . . ;N,
(5)
where EXMRET is the return of stock i, net of the risk-freerate; SINDUM equals one if the stock is a sin stock and zerootherwise; Xit�1 is a vector of firm characteristics; and eit ismeasurement error. Xit�1 includes various permutations ofvariables that have been defined earlier, including LOGSIZE,RET, and LOGMB. Since we now are estimating forecastingregression models, BETA represents the time-varyingindustry beta estimated using the past three years ofmonthly returns. Data on firm characteristics only begin in1962. Accordingly, the sample for our estimation of Eq. (5)starts in 1965.
The coefficient of interest is c1, which measureswhether sin stocks have an abnormal return performancecontrolling for a host of other firm characteristics. The nullhypothesis is that it is zero, whereas our prediction is thatit will be significantly 40. c2 is the vector of loadings onthe control variables. We then take the estimates fromthese monthly regressions and follow Fama and MacBeth(1973) in taking their time-series means and standarddeviations, using Newey and West (1987) standard errors,
to form our overall estimates of the effects of being a sinstock on return performance.
The results are presented in Panel B of Table 4. Whilewe present various permutations of the regressionspecification (5), the main one to focus on is thespecification described in column 6 that includes beta,size, past returns, past turnover, market-to-book, GDUM,and the log of the age of the firm (LOGAGE) as controls.GDUM picks up the effect due to comparables and LOGAGE
has been shown to forecast firm profitability. In thisspecification, the coefficient in front of SINDUM is 0.0029and is statistically significant at the 5% level of signifi-cance. In other words, sin stocks outperform othercomparable stocks by about 30 basis points per monthor about 3.5% per year. As earlier papers have also found,BETA is statistically insignificant in these cross-sectionalregressions. LOGSIZE has a negative effect (big stocksunderperform small stocks), past returns positively pre-dict future returns (i.e., there is momentum over shorthorizons but not over long horizons), and turnover andmarket-to-book negatively forecast returns.
As we relax the controls, the coefficients get progres-sively weaker, though there is still statistical significancein column 4 (28 bps monthly excess performance at the 5%level of significance) when we control for size, market-to-book, momentum, and GDUM (the industry comparabledummy). Our results are telling us that one needs toadequately control for other characteristics that arecorrelated with a stock’s sin status to capture a pure sin(neglect) effect. Controlling for GDUM (a comparablesdummy) is especially important if we are to distinguishour sin effect from a more general industry effect. Here,the broader industries to which the sin stocks belongmight have lower returns for other reasons. As such, weview the 28 bps figure obtained roughly from columns4–6 with 5% level of significance as being the rightmeasure of our sin effect on returns and being verystatistically significant. There is also little change in theresults from columns 4–6, which is telling us that thesefour characteristics (size, market-to-book, momentum,and GDUM) are all that is essential to estimate the pure sineffect. Moreover, these cross-sectional regression resultsare giving us a nearly identical answer as the time-seriesregressions in Panel A estimated over the same sampleperiod.
Finally, we compare the valuation ratios of sin stocks totheir counterparts using the following specificationadapted from Hong, Kubik, and Stein (2008):
VALUTIONit ¼ d0 þ d1 SINDIUMit þ d2Xit þ �it ; i ¼ 1; . . . ;N,
(6)
where VALUATION can be either LOGMB, LOGPE, orLOGPEBITDA. SINDUM equals one if the stock is a sin stockand zero otherwise. Xit is a vector of firm characteristicsincluding return-on-equity (ROE) as well as the next threeyear’s ROEs (FROE, F2ROE, F3ROE), research and develop-ment expenditures as a fraction of sales (RDSALES), adummy variable if the firm is missing R&D data (RDMISS),an S&P 500 dummy (SP500), and our GDUM dummycapturing sin stocks and sin stock comparables (food,soda, fun, meals, and hotels). eit is measurement error.

ARTICLE IN PRESS
Table 4Price and return performance of sin stocks.
Panel A reports the average coefficients obtained from the time-series regressions of a portfolio (SIN–COMP) that is long SIN (the monthly return for an
equal-weighted portfolio of sin stocks—alcohol, gaming, and tobacco) and short COMP (the monthly return for an equal-weighted portfolio of comparable
stocks) on a host of well-known factors. Each regression is estimated using a 36-month window of data for the period of 1965–2006 as well as for the
period of 1926–2006. MKTPREM is the excess monthly return of the value-weighted CRSP index. SMB is the return of a portfolio long small stocks and
short large stocks. HML is the return of a portfolio long high book-to-market stocks and short low book-to-market stocks. MOM is the return of a portfolio
long past 12-month return winners and short past 12-month return losers. Standard errors are adjusted for serial correlation using the Newey-West
correction. Panel B reports the results of Fama and MacBeth (1973) cross-sectional regressions for the period of 1965–2006 of EXMRET, the monthly return
of a stock net of the risk-free rate on the lagged (previous month) values of a set of well-known predictors of stock returns. SINDUM equals one if a stock is
a sin stock and zero otherwise. LOGSIZE, LOGMB, and RET are now calculated at the end of each month. BETA is just the firm’s industry beta, which is now
calculated at the end of each month using the past 36-months of data. TURN, calculated at the end of month, is the daily share turnover during the past 12
months. EXMRET at month t is regressed on the previous month values of LOGSIZE, LOGMB, RET, BETA, TURN, and BLEV which are denoted by LOGSIZE1,
LOGMB1, RET1, BETA1, TURN1, and BLEV1. LOGAGE1 is the log of the age of the company. GDUM equals one if a stock is a sin stock or comes from the Fama
and French (1997) industry groupings: 2 (food), 3 (soda), 7 (fun), and 43 (meals), and zero otherwise. Panel C reports the results for a Fama-MacBeth OLS
regression of the log of a stock’s market-to-book ratio (LOGMB), log price-to-earnings ratio (LOGPE), and log price-to-EBITDA ratio (LOGPEBITDA) on a host
of explanatory variables for the period 1965–2006. SINDUM equals one if a stock is a sin stock and zero otherwise. ROE is firm’s return on equity, FROE is
next year’s ROE. RDSALES is the ratio of a firm’s research and development expenditures to firm sales, RDMISS equals one if a firm is missing R&D
expenditure data and zero otherwise. SP500 equals one if the stock is in the S&P 500 index and zero otherwise. Column 1 of Panel D mirrors column 6 of
Panel B, but the monthly returns are calculated without considering the three days around each earnings announcement. Column 2 additionally includes
BLEV, and column 3 excludes tobacco and its comparable (food) from the specification. Panel E uses the same setting as Panel C, but the sin portfolio
excludes the tobacco industry and its comparable (food). *** 1%; ** 5%; and * 10% significance.
Panel A: Time-series return regressions (net of comparables)
1965–2006
ALPHA MKTPREM SMB HML MOM
SIN–COMP 0.0025* �0.0060
(0.0014) (0.0399)
SIN–COMP 0.0030** 0.0233 �0.0944***
(0.0015) (0.0341) (0.0347)
SIN–COMP 0.0026* 0.0358 �0.0993*** 0.0832**
(0.0014) (0.0365) (0.0342) (0.0410)
SIN–COMP 0.0026** 0.0442 �0.1058*** 0.0733* �0.0101
(0.0013) (0.0401) (0.0362) (0.0447) (0.0406)
1926–2006
ALPHA MKTPREM SMB HML MOM
SIN–COMP 0.0030** �0.1397***
(0.0015) (0.0397)
SIN–COMP 0.0033** �0.0912** �0.2482***
(0.0014) (0.0366) (0.0621)
SIN–COMP 0.0028** �0.0325 �0.2256*** �0.0343
(0.0014) (0.0280) (0.0587) (0.0620)
SIN–COMP 0.0031** �0.0190 �0.2390*** �0.0309 0.0063
(0.0014) (0.0293) (0.0607) (0.0501) (0.0410)
Panel B: Cross-section regressions: 1965–2006
Variable (1) (2) (3) (4) (5) (6)
SINDUM 0.0021 0.0015 0.0018 0.0028** 0.0028** 0.0029**
(0.0016) (0.0015) (0.0014) (0.0013) (0.0013) (0.0013)
LOGSIZE1 �0.0026*** �0.0015*** �0.0014*** �0.0014*** �0.0015*** �0.0013***
(0.0005) (0.0005) (0.0005) (0.0005) (0.0005) (0.0005)
LOGMB1 �0.0109*** �0.0114*** �0.0114*** �0.0112*** �0.0114***
(0.0011) (0.0009) (0.0009) (0.0009) (0.0008)
RET1 0.0411** 0.0400*** 0.0510*** 0.0500***
(0.0192) (0.0191) (0.0179) (0.0178)
GDUM �0.0019 �0.0021* �0.0020*
(0.0012) (0.0011) (0.0011)
BETA1 0.0002 0.0001
(0.0020) (0.0020)
TURN1 �0.0368 �0.0465
(0.1930) (0.1889)
LOGAGE1 �0.0006
(0.0005)
H. Hong, M. Kacperczyk / Journal of Financial Economics 93 (2009) 15–36 29

ARTICLE IN PRESS
Panel C: Valuation regressions: 1965–2006
Variable LOGMB LOGPE LOGPEBITDA
SINDUM �0.1540*** �0.1508*** �0.2035***
(0.0136) (0.0220) (0.0452)
ROE 0.7834** �0.8027*** �0.4454***
(0.3132) (0.1097) (0.1089)
RDSALES 4.7701*** 5.9278*** 7.9579***
(1.4821) (1.2760) (0.8626)
RDMISS �0.0793 �0.0048 0.0278
(0.0604) (0.0386) (0.0328)
SP500 0.2486*** 0.0972** 0.0516
(0.0626) (0.0464) (0.0435)
GDUM 0.0944*** 0.1031*** 0.0746***
(0.0274) (0.0241) (0.0253)
FROE 0.4542** 0.0216 �0.0336
(0.1986) (0.0790) (0.0311)
F2ROE 0.1318*** �0.0454 �0.0149
(0.0482) (0.0524) (0.0440)
F3ROE 0.0937 �0.0619 �0.1312*
(0.0655) (0.0509) (0.0696)
Panel D: Additional cross-section regressions: 1965–2006
Variable Excl. announcement return Book leverage Excluding tobacco
SINDUM 0.0030** 0.0032** 0.0021*
(0.0012) (0.0013) (0.0013)
LOGSIZE1 �0.0012** �0.0013*** �0.0013***
(0.0005) (0.0005) (0.0005)
LOGMB1 �0.0094*** �0.0115*** �0.0114***
(0.0007) (0.0008) (0.0008)
RET1 0.0223 0.0494*** 0.0500***
(0.0170) (0.0181) (0.0177)
GDUM �0.0020** �0.0019* �0.0018
(0.0010) (0.0011) (0.0013)
BETA1 �0.0004 �0.0001 0.0002
(0.0018) (0.0019) (0.0020)
TURN1 0.2057 0.0358 �0.0488
(0.1797) (0.2019) (0.1893)
LOGAGE1 �0.0005 �0.0007 �0.0006
(0.0004) (0.0005) (0.0005)
BLEV1 �0.0027*
(0.0014)
Panel E: Valuation regressions excluding tobacco: 1965–2006
Variable LOGMB LOGPE LOGPEBITDA
SINDUM �0.1652*** �0.1212*** �0.2044***
(0.0325) (0.0414) (0.0495)
ROE 0.7838** �0.8068*** �0.4463***
(0.3132) (0.1102) (0.1096)
RDSALES 4.7811*** 5.9382*** 8.0037***
(1.4858) (1.2802) (0.8759)
RDMISS �0.0809 �0.0068 0.0266
(0.0595) (0.0375) (0.0319)
SP500 0.2470*** 0.0955** 0.0489
(0.0626) (0.0467) (0.0432)
GDUM 0.1531*** 0.1776*** 0.1578***
(0.0441) (0.0390) (0.0280)
FROE 0.4558** 0.0241 �0.0324
(0.1991) (0.0781) (0.0317)
F2ROE 0.1334*** �0.0424 �0.0125
(0.0486) (0.0512) (0.0446)
F3ROE 0.0941 �0.0610 �0.1306*
(0.0658) (0.0509) (0.0700)
Table 4 (continued)
H. Hong, M. Kacperczyk / Journal of Financial Economics 93 (2009) 15–3630

ARTICLE IN PRESS
H. Hong, M. Kacperczyk / Journal of Financial Economics 93 (2009) 15–36 31
The results are presented in Panel C of Table 4. Incolumn 1, we estimate the cross-sectional regression yearby year for LOGMB. The coefficients are subsequentlyaggregated using the methodology of Fama and MacBeth(1973), in which standard errors are adjusted for possibleautocorrelation. The coefficient on SINDUM is �0.1540 andis significant at the 1% level of significance. We thus findsin stocks’ market-to-book ratios are smaller relative tocomparables by nearly 15.4%. The coefficients on ROE,RDSALES, and SP500 are positive and significant, while thecoefficient on the dummy variable for missing R&D data isnegative and insignificant. These latter findings areconsistent with the results reported by Hong, Kubik, andStein (2008). Interestingly, the coefficient on GDUM ispositive, suggesting that the prices of sin stock compar-ables actually are higher than those of other stocks.
In column 2, we estimate the same model, this timeusing LOGPE. The coefficient in front of SINDUM dropsslightly to �0.1508, but it is still significant at the 1% levelof significance. The other coefficients remain qualitativelysimilar. Importantly, the coefficient in front of SINDUM forLOGEBITDA is �0.2035 and significant at the 1% level. Insummary, all three methodologies that we have used toinvestigate the price effects of social norms on sin stocksyield economically interesting effects.
4.4. Robustness checks
In Panel D, we consider some robustness checks. Wetake the regression specification in column 6 of Panel Band reestimate it by netting out returns around earningsannouncement dates (defined as the three-day returnaround quarterly earnings announcements). The result isin column 1 of Panel D. We find a negligible change. Theworry here is that the results might be due to unexpectedearnings news, which it does not appear to be. We nextworry that our result might be due to firm leverage sincesin companies tend to be more levered as we show below.We insert as an additional control variable book leverageand do not find a significant difference. Also, controllingfor market leverage yields similar results to those in thesecond column. In the third column, we omit tobaccofrom our sin stocks. The worry here is that tobacco mighthave done unexpectedly well in evading all their litigationrisk during this period and hence might be driving all ourresults. We find that the sin portfolio, net of tobacco thisperiod, yields an alpha of 21 bps and significance at the10% level. The results are slightly lower than those incolumn 6 of Panel B but are not significantly differentfrom the 29 bps figure, though it does suggest thattobacco’s litigation risk this period might have contrib-uted to a slightly higher than sin portfolio return. Onecaveat is that even this might not be conservative enoughsince one could also argue that the gaming industry mighthave unexpectedly good news. But it is difficult toeliminate both gaming and tobacco industries and stillget statistical significance. Our additional analyses belowprovide comfort as to the robustness of our main findings.
In Panel E, we consider a robustness check of Panel C inthat we reestimate it without tobacco stocks. We find
similar results. For LOGMB, the coefficient in front ofSINDUM is slightly higher at �0.1652 with significance atthe 1% level. For LOGPE, the coefficient in front of SINDUM
is slightly lower at �0.1212 but it is nonetheless verysignificant. For LOGEBITDA, the coefficient is slightlyhigher at �0.2044 and again very significant. In sum, allof our return and valuation regressions are robust.
We have explored a number of other robustness checksto the findings reported in this paper, but omit their fullreporting for brevity. In particular, as we mentionedearlier in Section 2, defense stocks are considered bysome to be sinful. We have redone all of our analyses withdefense stocks included in the sin category. Our resultsremain qualitatively similar. We nevertheless focus on theso-called Triumvirate of Sin (alcohol, tobacco, and gam-ing) since there is much stronger consensus on thecharacterization of these industries.
4.5. Reconciling magnitudes from return and valuation
regressions
In this section, we analyze whether our return results(Panels A, B, and D of Table 4) are consistent with ourvaluation or ‘‘Q’’ effects (Panels C and E). The question iswhether the return results are consistent with theimplied-return figure from valuation regressions (aftertaking into account estimation error from these twosets of regressions). First, note the range of returnestimates. The baseline figure from the time-seriesregression (Panel A) is 26 bps or 3.1% a year. The one fromthe cross-sectional regression (Panel B) is 28 bps or 3.4% ayear. Now, this figure might be influenced by unexpectedgood litigation news for tobacco stocks. The result fromPanel D suggests that a more conservative number is21 bps or 2.5% a year. But the range is from 2.5% to 3.4% ayear. The 21 bps per month figure is perhaps morereasonable and in line with the size effect that is thebasis behind the neglect model of Merton (1987). Indeed,as we show in Section 4.8 on international stocks, we get a21 bps or 2.5% a year extra return from internationalstocks. So the figure of 2.5% is a good one to focus on forthe purposes of checking the reasonableness of thevaluation regression magnitudes.
There are different reasons to like each of the threevaluation measures but they all deliver similar magni-tudes. From Panel C, the low end in terms of a price effectis around 15% using LOGPE and the high end is a 20% priceeffect using LOGPEBITDA. Indeed, the estimation error ofthe price-to-EBITDA measure is such that it implies asmuch as a 25% lower valuation. To relate these valuationratio results to our return results we use the Gordongrowth formula, 1/(r�g), where r is the discount rate and g
is the growth rate. As a benchmark, let us assume r is 12%for a typical stock and g is 4% (which is the mid-point ofthe range of values that we typically observe in thevaluation literature). We can ask how much of an increasein r is required to get a 17% lower valuation for sin stocks.At these parameters, this would imply around a 2% excessreturn, which is not far away from the 2.4% figure that wecalculated. Indeed, if we take into account estimation

ARTICLE IN PRESS
H. Hong, M. Kacperczyk / Journal of Financial Economics 93 (2009) 15–3632
error, an even higher figure of 3.4% from the returnregressions would fall in the range of return estimatesimplied from the price-to-EBITDA regressions.
25 The full text of Arthur Levitt’s speech from which this quote has
been excerpted can be downloaded from /http://www.sec.gov/news/
speech/speecharchive/1998/spch218.htmS.
4.6. Calibrations with Merton model
The next question one can raise then is whether thesemagnitudes can be roughly reconciled within a Merton-style segmented market model. First, a realistic calibrationof a Merton-type model is done in Petajisto (2009). Thepricing in his model is done by arbitrageurs or mutualfunds. Managers have to pay a fee to cover a stock anduncover mispricings, which allows them to earn theirexcess returns to justify their fees. Petajisto uses therealistic fees charged by mutual funds (analog to Merton’sfixed cost) of 1–1.5% of assets under management, as ameans to figure out how big of a price effect we should seeassuming a pure 10% supply shock in the stock (eitherpositive or negative). He is interested in seeing whetherone can obtain realistic S&P 500 inclusion effects in whichwhen a company gets included into the S&P 500, one seesa price increase for some stocks of as much as 15%. Thisexample is very similar to our sin stocks situation exceptthat there is a positive supply shock (with certain largepassive institutions staying away from these stocks forpolitical or ethical reasons) as opposed to a negativesupply shock (passive index funds buying shares of theincluded company). The supply shocks in either situationare similar in that estimates place the fraction of dollarsunder management that undergo an ethical screen at1-in-9 to 1-in-10 dollars, very similar to estimates for S&P500 passive index funds. Petajisto shows that underrealistic parameters for fees, volatility, and persistence,we can get 15% pricing effects—which is in the ball park ofthe numbers we find for sin stocks.
Moreover, we present a simplified version of Heinkel,Kraus, and Zechner (2001), henceforth HKZ, who developa model to consider the price implications of ethicalinvesting that excludes companies that pollute. We showin Appendix A that this model can generate realisticpricing effects as well. First, in HKZ, they allow for thepossibility of a reformed company—an unacceptablecompany that pays a fixed cost to become an acceptablefirm. This does not apply to our discussion of sin stockssince they cannot really change who they are by paying afixed cost. As such, we simplify the HKZ model byallowing for only two types of firms, acceptable andunacceptable (which would be the sin stocks). Second, asin HKZ, we assume that green investors only invest inacceptable companies, whereas neutral investors willinvest in any company. Third, in HKZ, they assume thatgreen investors and neutral investors have the same riskaversion. In reality, institutions which follow screeningrules tend to be much less risk averse than individual/retail investors. In our set-up, we allow for the greeninvestors to be more risk tolerant than the neutralinvestors. We then show that we can get realistic pricingdifferences consistent with the data even assumingreasonable parameters on the fraction of green investors(say 10% or 15%) and the fraction of unacceptable
companies (say 5%). The reason is that if green investorsare massive institutions such as CalPERS (which wedescribe below) with long horizons and deep pockets,and neutral investors for sin companies are likely to beindividual investors who are far more risk averse, then onecan still get some realistic differences since the holders ofthe sin stocks will tend to be much more risk-averseindividuals.
4.7. Further tests
We now test some auxiliary implications of ourhypothesis. First, we investigate the implications of theprice effects of social norms for the financing decisions ofsin companies. If the equity of sin stocks is undervaluedbecause of limited risk sharing or investors misestimatingthe risk of these companies as we have argued in thispaper, and hence it is more expensive for sin companies tofinance operations using equity, then we should expectthem to use private debt to finance their operations. Debtmarkets offer the additional advantage of being lesstransparent than equity markets. Whereas mutual fundsand institutions are required to disclose their positions inequities on a semi-annual basis, no such requirementsexist for investments in corporate bonds. Accordingly, it isdifficult to figure out for a given company who itsfinanciers are on the debt side. While it is possible totrack down large public issuances of corporate bonds,large amounts of bank debt are difficult to trace. FormerSEC chairman Arthur Levitt, who pushed to increasetransparency in the bond market during his tenure, onceremarked, ‘‘The sad truth is that investors in the corporatebond market do not enjoy the same access to informationas a car buyer or a home buyer or, dare I say, a fruit buyer.And that’s unacceptable’’.25
To determine if sin companies indeed use the debtmarket more than the equity market, we implementa standard cross-sectional regression specification usedin the corporate finance literature to explain capitalstructure, i.e., leverage (e.g., Baker and Wurgler, 2002).We estimate the following cross-sectional regressionspecification:
FinancingDecisionit ¼ e0 þ e1 SINDUMit þ e2 þ Xit þ �it ,
i ¼ 1; . . . ; N (7)
where SINDUM equals one if the stock is a sin stock andzero otherwise; Xit is a vector of firm characteristics; andeit is measurement error. Xit includes the variables GDUM,TOBQ, TANG, PROFIT, and LOGSALES. The coefficient ofinterest is e1, which measures whether sin firms have adifferent capital structure as compared to other compa-nies. The null hypothesis is that it is zero, whereas ourprediction is that it will be significantly 40 when ameasure of leverage is used as the dependent variable inthe regression. e2 is the vector of loadings on the controlvariables. We then take the estimates from a pooled

ARTICLE IN PRESS
Table 5Corporate financing decisions of sin companies.
This table reports estimates from the pooled regression of sin companies’ corporate financing decisions on well-known predictors of capital structure
for the period of 1965–2006. The dependent variables are market leverage (MLEV), book leverage (BLEV), cash balances (CASH), overall firm payout ratio
(PAYOUT), dividend payout ratio (DIVPAY), and share repurchases (REP). SINDUM equals one if a stock is a sin stock (alcohol, gaming, and tobacco) and zero
otherwise. GDUM equals one if a stock is a sin stock or comes from the Fama and French (1997) industry groupings: 2 (food), 3 (soda), 7 (fun), and 43
(meals), and zero otherwise. TOBQ is Tobin’s Q, which is market value of equity plus assets minus book value of equity over assets. TANG is firm tangibility
defined as net plant, property, and equipment divided by total assets. PROFIT is earnings before interest, taxes, and depreciation divided by total assets.
LOGSALES is the log of net sales. All variables have been winsorized at the 1% level. All regressions include one-digit SIC industry fixed effects. *** 1%
significance; ** 5% significance; and * 10% significance.
MLEV BLEV CASH PAYOUT DIVPAY REP
SINDUM 0.0520** 0.0688 �0.0187 �0.0056 0.0141 �0.0148
(0.0244) (0.0445) (0.0243) (0.0911) (0.0829) (0.0235)
GDUM �0.0073 0.0031 0.0216** 0.0147 �0.0351 0.0452**
(0.0130) (0.0098) (0.0102) (0.0620) (0.0568) (0.0218)
TOBQ �0.0370*** �0.0191*** 0.0435*** �0.0071*** �0.0057*** 0.0001
(0.0053) (0.0024) (0.0018) (0.0025) (0.0020) (0.0008)
TANG 0.2694*** 0.3212*** �0.2852*** 0.1808* 0.2461** �0.0550*
(0.0438) (0.0343) (0.0324) (0.0923) (0.1209) (0.0326)
PROFIT �0.1342*** �0.1830*** �0.0420 0.2777*** 0.1362*** 0.1330***
(0.0369) (0.0318) (0.0335) (0.0375) (0.0231) (0.0174)
LOGSALES 0.0133 0.0162* �0.0564*** 0.0145 0.0040 0.0074*
(0.0085) (0.0093) (0.0103) (0.0129) (0.0125) (0.0038)
H. Hong, M. Kacperczyk / Journal of Financial Economics 93 (2009) 15–36 33
regression and cluster standard errors by the 49 Fama andFrench (plus gaming) industries.
The results are presented in Table 5. In column 1, thedependent variable is market leverage, MLEV. The coeffi-cient in front of SINDUM is positive (0.0520) andstatistically significant at the 5% level of significance.The typical company has a market leverage of 0.27, andthus, we find that a sin company has a 19.3% higherleverage ratio than the typical company. The coefficient onGDUM is negative but it is not statistically significant. Thecoefficients in front of the other variables (other thanGDUM and LOGSALES) are significant, as found in earlierwork. In the regression that uses book leverage (BLEV) asthe dependent variable, the coefficient on SINDUM againcomes in with the right sign, but it is not as statisticallysignificant as its counterpart in the regression analysis ofMLEV. For completeness, we also look to see whether thereare differences in other financing decision variables (CASH,PAYOUT, DIVPAY, REP) between sin stocks and othercompanies. The sin stock effects are not statisticallysignificant in these other regressions. In sum, it appearsthat sin companies rely more on the debt market forfinancing than do other firms, consistent with thehypothesis that they face a disadvantage in the equitymarket, but they do not differ markedly in their otherfinancing decisions.
We also attempted to test indirect implications of ourhypotheses. First, if sin stocks are more closely held, thenthe number of shares available to investors could decreaseand cause similar patterns to the ones we describe. Ofcourse, sin effect could also be a possible explanation ofthese increased close holdings, but likely not unique. Weexplore this possibility by relating the degree of closeownership, measured by the non-float fraction of out-standing shares, to the sin characteristic of each security.Our evidence indicates a weak negative relationshipbetween sin stocks and close ownership. The results are
similar if we use an alternative measure of ownershipbased on large-level institutional ownership. Hence, it isunlikely that the close-ownership effect drives our results.Second, since sin stocks are followed less by analysts andinstitutions, they may have higher illiquidity or bid–askspreads. However, we find only negligible differences inbid–ask spreads between sin stocks and other stocks.There are a few reasons that may explain this negativefinding. First, most sin companies are highly regulated andhave much better disclosure than do other companies.Accordingly, there may be less information asymmetry forthese stocks, leading to potentially lower spreads. Second,the lack of institutional ownership actually has anambiguous effect on spreads depending on assumptionsabout the trading process. Therefore, indirect implicationsregarding liquidity or other market microstructure aspectsof these companies are difficult to measure unless wehave more direct measures of the informational environ-ments of companies.
In addition, we also attempted to exploit the timevariation in the social norms governing tobacco as ameans to test our hypothesis. As we described earlier inSection 2, tobacco was not widely considered to be sinfuluntil the mid-1960s. Accordingly, our hypothesis suggeststhat before that time, tobacco stocks should have beenheld by institutions and covered by analysts as frequentlyas other stocks, and they should not have earned excessreturns. Unfortunately, due to data limitations, we canonly test the implications regarding returns, since data onownership and coverage are only available since the1980s.
One prediction is that we should see tobacco stocksunderperform over the period of the late 1940s (whenanecdotal evidence suggested the change in norms withprevious bad reports about health in the late 1940s) untilthe mid-1960s (when essentially even the governmentrecognized that tobacco was bad and imposed many

ARTICLE IN PRESS
H. Hong, M. Kacperczyk / Journal of Financial Economics 93 (2009) 15–3634
restrictions). The problem is finding the exact right datesto test this period of transition. The choices are arbitrarybut not that sensitive to within a few years. In particular,our initial date is 1947 when the first really bad reportsstarted coming out about tobacco and our ending date is1965 when Congress passed important legislation reg-ulating the advertising of cigarettes. One thing to note isthat tobacco companies fought back in the late 1950s withfalse claims about filtered cigarettes that they preventedlung cancer. Although this action temporarily boosted thestatus of tobacco companies, these claims were rejectedby the early 1960s and the transition of tobacco to being asin stock was complete. We perform this exercise and theresults are available from the authors. In sum, we find thattobacco underperformed the market by a significant 3% ayear or something on the order of 40% over the period1947–1965. This is a huge drop in prices in light of thegenerally good performance of tobacco throughout itshistory. This evidence has to be caveated with thedisclaimer that testing these long trends is problematicfor many reasons including changes in fundamentalsthroughout the periods. However, the evidence is largelyconsistent with there being a change in norms during thisperiod of the 1950s–1960s.
Table 6International evidence.
Panel A reports summary statistics about the sin stocks for the sample of in
stocks that fall into the three subgroups of tobacco, alcohol, and gaming. Pane
regressions for the period of 1985–2006 of EXMRET, the monthly return of a stoc
well-known predictors of stock returns. SINDUM equals one if a stock is a sin sto
of each month. EXMRET at month t is regressed on the previous month values
comes from the Fama and French (1997) industry groupings: 2 (food), 3 (soda), 7
fixed effects and standard errors are adjusted for serial correlation as in New
significance.
Panel A: Distribution of sin stocks by country: 1985–2006
Country
Canada
France
Germany
Italy
Netherlands
Spain
Switzerland
UK
Total
Panel B: OLS cross-sectional regressions for returns: 1985–2006
(1) (2
SINDUM 0.0015 0.00
(0.0010) (0.0
LOGSIZE1 �0.0010 �0.0
(0.0008) (0.0
LOGMB1 �0.00
(0.0
RET1
GDUM
Country fixed effects Yes Y
4.8. International stocks
We extend our analysis to international markets:Canada, France, Germany, Italy, Netherlands, Spain,Switzerland, and United Kingdom. The data for thesecountries from Datastream only cover the period of1985–2006 and we are only able to obtain a subset ofthe control variables that we had in the US regression.However, we are able to get the key characteristics of firmsize, book-to-market, past returns, and firm comparables.As a result, we can run an analog to the key baselineregression we had in Panel B column 4 of Table 4,enhanced with the country fixed-effects.
Various surveys from the Social Investment Forumindicate that these markets have very similar attitudestoward sin stocks as does the US. One key differencethough is that tobacco did not face nearly the sameintense litigation as in the US. Also, institutions in thesecountries have had an aversion to sin stocks for quitesome time. The key point of this analysis is to show thatthe US results are not spurious. To the extent that we findsignificant effects for the international sample, this is anout-of-sample test for our paper and will provide a highlevel of confidence in the robustness of our US results. One
ternational companies. We report country-by-country the number of sin
l B reports the results of the Fama and MacBeth (1973) cross-sectional
k net of the risk-free rate on the lagged (previous month) values of a set of
ck and zero otherwise. LOGSIZE, LOGMB, and RET are calculated at the end
of LOGSIZE, LOGMB, and RET. GDUM equals one if a stock is a sin stock or
(fun), and 43 (meals), and zero otherwise. All regressions include country
ey and West (1987). *** 1% significance; ** 5% significance; and * 10%
Number of sin stocks
14
14
31
2
4
10
3
34
112
) (3) (4)
14** 0.0013** 0.0021*
006) (0.0004) (0.0013)
004 �0.0006 �0.0006
007) (0.0006) (0.0006)
23*** �0.0040*** �0.0040***
005) (0.0006) (0.0006)
0.0115*** 0.0115***
(0.0010) (0.0010)
�0.0008
(0.0012)
es Yes Yes

ARTICLE IN PRESS
H. Hong, M. Kacperczyk / Journal of Financial Economics 93 (2009) 15–36 35
thing to keep in mind is that the international sample ismuch shorter than is that of the US and so the statisticalsignificance will naturally be lower.
Panel A of Table 6 gives a breakdown of the number ofsin stocks by country where sin is defined similarly astobacco, alcohol, and gaming. Panel B shows the results ofthe cross-sectional regression. Notice that the results areboth statistically and economically significant. Taking themost elaborate specification, column 4 of Table 6, we findthat sin stocks outperform by 21 bps a month or about2.5% per year. This effect is economically and statisticallysignificant at the 10% level. The statistical significance iscomforting given the small sample and the economicmagnitude is also reassuring. The sin return estimate fromthe international sample (21 bps a month) is smaller thanthat obtained from the comparable US estimation (28 bpsa month) but this difference is not statistically significant.
However, it is possible that this difference might bedue to the fact that tobacco firms did not face nearly thesame litigation pressure abroad as they did in the US. Thislitigation risk and the subsequent good outcomes for USfirms in light of this litigation likely contributed to thehigher returns of tobacco stocks in the US. This isconsistent with the robustness checks in the US samplein which we estimate the sin stock returns excludingtobacco and also find a 21 bps monthly effect for non-tobacco sin stocks. But again, all these estimates are veryclose to each other in terms of economic and statisticalsignificance and when taken in totality they providestrong proof of the robustness of our sin return effect.
5. Conclusion
In this paper, we provide evidence of significant effects ofsocial norms on markets by studying the investing environ-ment of ‘‘sin’’ stocks—publicly traded companies involved inthe production of alcohol, tobacco, and gambling. Inparticular, we show that there is a significant price effecton the order of 15–20% from large institutional investorsshunning sin stocks. Our paper has important implicationson the emerging literature on socially responsible investing.A key issue in this literature is whether socially responsibleinvesting makes a difference in terms of getting corporationsto change their behavior. Or is socially responsible investingsimply about feeling good, with little consequences for realinvestments? Our paper takes an important first step inanswering this question in that we show that at least for sinstocks, the neglect of these stocks by large institutionsaffected their cost of capital in a significant way. Unfortu-nately, there is little in the way of change that thesecompanies can make in contrast to say, companies thatpollute. Hence, an important agenda for future research is tosee to what extent socially responsible investing can affectthe cost of capital for a broader range of companies and toconnect changes in the behavior of these companies todistinct economic channels such as the cost of capital.
Appendix A
This appendix provides details on the calibration of asimplified model based on HKZ. In brief, we consider a
one-period model with N firms of the following two types:NA acceptable (A) firms that satisfy the investing criteria ofthe green investors and NP unacceptable (polluting) (P)firms that do not satisfy such criteria. Each A firm uses theclean technology and generates a normally distributedcash flow with mean mA and variance s2
A. Firm P uses thepolluting technology and generates normally distributedcash flow with mean mP and variance s2
P . The cash flows offirms A are perfectly correlated as are the cash flowsof firms P; the covariance between A and P technology issAP . In addition, a riskless asset with a rate of returnnormalized to zero is available in perfectly elastic supply.Borrowing is allowed, but short selling is prohibited.
In this economy, there are two types of investors, g
(green) and n (neutral), who differ in terms of theirattitude to environmental damage. The former groupabstains from holding shares in unacceptable firms, whilethe latter group does not internalize this fact in theirpreferences. In the context of our paper, the g investors arethe ones who are subject to social norms and do not investin sin stocks, while the n investors do not consider sin tobe unacceptable. The total number of investors in theeconomy is I with Ig of green and In of neutral investors.Green investors exhibit CARA preferences with risktolerance tg and neutral investors have a similar pre-ference but with a risk tolerance of tn. Let j ¼ s2
As2P � s2
AP .It is easy to show that the equilibrium prices for the twotypes of companies, A and P, are given by the followingtwo equations. The price of the A firm is
PA ¼ mA � 1ðIntn þ IgtgÞ½NPsAP þ NAs2A�, (A.1)
and the price of the P firm is given by
PP ¼ mP � 1ðIntn þ IgtgÞ½NAsAP þ NPs2P
þ NPðIg=InÞðj=s2AÞðtg=tnÞ�. (A.2)
Our goal is to verify whether prices observed for sinstocks could be obtained within the modeling frameworkoutlined above. Absent these social norms, the assump-tions of HKZ would yield the CAPM. However, CAPM is notvalid with substantial ethical investors in the economyand idiosyncratic (or cash-flow) risk is priced. Empiricalevidence suggests that the proportion of investors shun-ning sin stocks in the investing world approximatelyequals 10–15% and sin stocks represent about 5% of thestocks in the market. Therefore, with this number in mindwe should expect the abnormal returns we obtain for sinstocks to be comparable to those calibrated to the model.
We begin our calibration with the parameters that areaimed to produce reasonable expected rates of returns.With these numbers we are able to generate the equitypremium of about 8%, which is close to the excess marketreturn shown in the literature. In addition, the variance–covariance matrix of cash flows produces reasonableresults for the standard deviation of rate of return. Inparticular, we use the following set of parameters:
Mean cash flows: mP ¼ mA ¼ 35Standard deviation of cash flows: sP ¼ 20, sA ¼ 10Covariance of cash flows: sAP ¼ 100Total number of investors: I ¼ 1

ARTICLE IN PRESS
H. Hong, M. Kacperczyk / Journal of Financial Economics 93 (2009) 15–3636
Total number of firms: N ¼ 1Number of firms with each technology: NP ¼ 0.05,NA ¼ 0.95Aggregate risk tolerance: tn ¼ 30, tg ¼ 100
The quantity of our interest is abnormal return, whichin the context of their model is equal to (mP/PP)�1 (returnof P firms) compared to (mA/PA)�1 (return of A firms). HKZassume that the cash-flow risk of all firms in the economyis the same (and equal to 10). However, in our context, sinstocks may have higher cash-flow risk than comparablefirms because of the litigation risk that affects theiroperations. Since firm-specific risk is a priced risk in thisframework, our calibration attempts to illustrate thesensitivity of the sin stock premium also conditioning onchanging cash-flow risk. We use a figure of 20% toillustrate our calculation. At these numbers, the unaccep-table firms have a higher return than acceptable firms byabout 2% a year. The key parameters are that the greeninvestors (presumably large institutions like CalPERS) aremore risk tolerant than neutral investors who are morelikely to be individual investors.
References
Ahrens, D., 2004. Investing in Vice. St. Martin’s Press, New York.Akerlof, G., 1980. A theory of social custom, of which unemployment may
be one consequence. Quarterly Journal of Economics 94, 749–775.Altonji, J., Blank, R., 1999. Race and gender in the labor market. In: Card,
D., Ashenfelter, O. (Eds.), Handbook of Labor Economics, vol. 3c.North-Holland, Amsterdam, pp. 3143–3259.
Arrow, K., 1972. Models of job discrimination. In: Pascal, A. (Ed.), RacialDiscrimination in Economic Life. D.C. Heath, Lexington, MA, pp.83–102.
Baker, M., Wurgler, J., 2002. Market timing and capital structure. Journalof Finance 57, 1–32.
Becker, G., 1957. The Economics of Discrimination. University of ChicagoPress, Chicago.
Berman, D., 2002. Why sin is good: tobacco, alcohol, and gaming stockscan add sizzle to your portfolio? Money Sense, November.
Case, A., Katz, L., 1991. The company you keep: the effects of family andneighborhood on disadvantaged youths. NBER Working Paper no.3705.
Chen, D., Bin, F., 2001. Effects of legislation events on US gaming stockreturns and market turnings. Tourism Management 22, 539–549.
Del Guercio, D., 1996. The distorting effect of the prudent man law oninstitutional equity investments. Journal of Financial Economics 40,31–62.
Elster, J., 1989. Social norms and economic theory. Journal of EconomicPerspectives 3, 99–117.
Falkenstein, E., 1996. Preferences for stock characteristics as revealed bymutual fund portfolio holdings. Journal of Finance 51, 111–135.
Fama, E., French, K., 1997. Industry costs of equity. Journal of FinancialEconomics 43, 153–193.
Fama, E., MacBeth, J., 1973. Risk, return, and equilibrium: empirical test.Journal of Political Economy 81, 607–636.
Geczy, C., Stambaugh, R., Levin, D., 2003. Investing in socially responsiblemutual funds. Unpublished Working Paper, University of Pennsylva-nia, Wharton.
Glaeser, E., Sacerdote, B., Scheinkman, J., 1996. Crime and socialinteractions. Quarterly Journal of Economics 111, 502–548.
Glaeser, E., Scheinkman, J., 2003. Non-market interactions. In: Dewa-tripont, M., Hansen, L., Turnovsky, S. (Eds.), Advances in Economicsand Econometrics: Theory and Applications, Eight World Congress.Cambridge University Press, Cambridge, pp. 339–370.
Gompers, P., Metrick, A., 2001. Institutional investors and equity prices.Quarterly Journal of Economics 116, 229–259.
Greene, W., 2000. Econometric Analysis. Macmillan, New York.Heinkel, R., Kraus, A., Zechner, J., 2001. The effect of green investment on
corporate behavior. Journal of Financial and Quantitative Analysis 35,431–449.
Hong, H., Kubik, J., Stein, J., 2004. Social interaction and stock marketparticipation. Journal of Finance 59, 137–163.
Hong, H., Kubik, J., Stein, J., 2008. The only game in town: stock priceconsequences of local bias. Journal of Financial Economics 90, 20–37.
Hong, H., Lim, T., Stein, J., 2000. Bad news travels slowly: size, analystcoverage and the profitability of momentum strategies. Journal ofFinance 55, 265–295.
Levitt, S., 2004. Testing theories of discrimination: evidence fromweakest link. Journal of Law and Economics 47, 431–452.
Merton, R., 1987. A simple model of capital market equilibrium withincomplete information. Journal of Finance 42, 483–510.
Moulton, B., 1986. Random group effects and the precision of regressionestimates. Journal of Econometrics 32, 385–397.
Newey, W., West, K., 1987. A simple, positive semi-definite, hetero-skedasticity and autocorrelation consistent covariance matrix.Econometrica 55, 703–708.
Petajisto, A., 2009. Why do demand curves for stocks slope down?Journal of Financial and Quantitative Analysis, forthcoming.
Romer, D., 1984. The theory of social custom: a modification and someextensions. Quarterly Journal of Economics 99, 717–727.
Shleifer, A., Vishny, R., 1997. The limits of arbitrage. Journal of Finance 52,35–55.
Teoh, S., Welch, I., Wazzan, P., 1999. The effect of socially activistinvestment policies on the financial markets: evidence from theSouth African Boycott. Journal of Business 72, 35–89.
Waxler, C., 2004. Stocking Up on Sin. John Wiley and Sons, Inc.,New Jersey.