journal of energy technology - fe.um.si
TRANSCRIPT


JOURNAL OF ENERGY TECHNOLOGY

JET �
JOURNAL OF ENERGY TECHNOLOGY

� JET
JOURNAL OF ENERGY TECHNOLOGY
Ustanovitelj / FOUNDER Fakulteta za energetiko, UNIVERZA V MARIBORU / FACULTY OF ENERGY TECHNOLOGY, UNIVERSITY OF MARIBOR
Izdajatelj / PUBLISHER Fakulteta za energetiko, UNIVERZA V MARIBORU / FACULTY OF ENERGY TECHNOLOGY, UNIVERSITY OF MARIBOR
Izdajateljski svet / PUBLISHING COUNCIL Zasl. prof. dr. Dali ĐONLAGIĆ, Univerza v Mariboru, Slovenija, predsednik / University of Maribor, Slovenia, President Zasl. prof. dr. Bruno CVIKL, Univerza v Mariboru, Slovenija / University of Maribor, Slovenia Prof. ddr. Denis ĐONLAGIĆ, Univerza v Mariboru, Slovenija / University of Maribor, Slovenia Prof. dr. Danilo FERETIĆ, Sveučilište u Zagrebu, Hrvaška / University in Zagreb, Croatia Prof. dr. Roman KLASINC, Technische Universität Graz, Avstrija / Graz University Of Technology, Austria Prof. dr. Alfred LEIPERTZ, Universität Erlangen, Nemčija / University of Erlangen, Germany Prof. dr. Milan MARČIČ, Univerza v Mariboru, Slovenija / University of Maribor, Slovenia Prof. dr. Branimir MATIJAŠEVIČ, Sveučilište u Zagrebu, Hrvaška / University in Zagreb, Croatia Prof. dr. Borut MAVKO, Inštitut Jožef Stefan, Slovenija / Jozef Stefan Institute, Slovenia Prof. dr. Greg NATERER, University of Ontario, Kanada / University of Ontario, Canada Prof. dr. Enrico NOBILE, Università degli Studi di Trieste, Italia / University of Trieste, Italy Prof. dr. Iztok POTRČ, Univerza v Mariboru, Slovenija / University of Maribor, Slovenia Prof. dr. Andrej PREDIN, Univerza v Mariboru, Slovenija / University of Maribor, Slovenia Prof. dr. Jože VORŠIČ, Univerza v Mariboru, Slovenija / University of Maribor, Slovenia Prof. dr. Koichi WATANABE, KEIO University, Japonska / KEIO University, Japan
Odgovorni urednik / EDITOR-IN-CHIEF Andrej PREDIN
Uredniki / CO-EDITORS
Jurij AVSEC
VOLUME 6 / Issue 2
Revija Journal of Energy Technology (JET) je indeksirana v naslednjih bazah: INSPEC©, Cambridge Scientific Abstracts: Abstracts in New Technologies and Engineering (CSA ANTE), ProQuest's Technology Research Database.
The Journal of Energy Technology (JET) is indexed and abstracted in the following databases: INSPEC©, Cambridge Scientific Abstracts: Abstracts in New Technologies and Engineering (CSA ANTE), ProQuest's Technology Research Database.

JET �
JOURNAL OF ENERGY TECHNOLOGY
Ustanovitelj / FOUNDER Fakulteta za energetiko, UNIVERZA V MARIBORU / FACULTY OF ENERGY TECHNOLOGY, UNIVERSITY OF MARIBOR
Izdajatelj / PUBLISHER Fakulteta za energetiko, UNIVERZA V MARIBORU / FACULTY OF ENERGY TECHNOLOGY, UNIVERSITY OF MARIBOR
Izdajateljski svet / PUBLISHING COUNCIL Zasl. prof. dr. Dali ĐONLAGIĆ, Univerza v Mariboru, Slovenija, predsednik / University of Maribor, Slovenia, President Zasl. prof. dr. Bruno CVIKL, Univerza v Mariboru, Slovenija / University of Maribor, Slovenia Prof. ddr. Denis ĐONLAGIĆ, Univerza v Mariboru, Slovenija / University of Maribor, Slovenia Prof. dr. Danilo FERETIĆ, Sveučilište u Zagrebu, Hrvaška / University in Zagreb, Croatia Prof. dr. Roman KLASINC, Technische Universität Graz, Avstrija / Graz University Of Technology, Austria Prof. dr. Alfred LEIPERTZ, Universität Erlangen, Nemčija / University of Erlangen, Germany Prof. dr. Milan MARČIČ, Univerza v Mariboru, Slovenija / University of Maribor, Slovenia Prof. dr. Branimir MATIJAŠEVIČ, Sveučilište u Zagrebu, Hrvaška / University in Zagreb, Croatia Prof. dr. Borut MAVKO, Inštitut Jožef Stefan, Slovenija / Jozef Stefan Institute, Slovenia Prof. dr. Greg NATERER, University of Ontario, Kanada / University of Ontario, Canada Prof. dr. Enrico NOBILE, Università degli Studi di Trieste, Italia / University of Trieste, Italy Prof. dr. Iztok POTRČ, Univerza v Mariboru, Slovenija / University of Maribor, Slovenia Prof. dr. Andrej PREDIN, Univerza v Mariboru, Slovenija / University of Maribor, Slovenia Prof. dr. Jože VORŠIČ, Univerza v Mariboru, Slovenija / University of Maribor, Slovenia Prof. dr. Koichi WATANABE, KEIO University, Japonska / KEIO University, Japan
Odgovorni urednik / EDITOR-IN-CHIEF Andrej PREDIN
Uredniki / CO-EDITORS
Jurij AVSEC
VOLUME 6 / Issue 2
Revija Journal of Energy Technology (JET) je indeksirana v naslednjih bazah: INSPEC©, Cambridge Scientific Abstracts: Abstracts in New Technologies and Engineering (CSA ANTE), ProQuest's Technology Research Database.
The Journal of Energy Technology (JET) is indexed and abstracted in the following databases: INSPEC©, Cambridge Scientific Abstracts: Abstracts in New Technologies and Engineering (CSA ANTE), ProQuest's Technology Research Database.

� JET
Univerza v Mariboru, Slovenija / University of Maribor, Slovenia Doc. dr. Peter VIRTIČ, Univerza v Mariboru, Slovenija / University of Maribor, Slovenia Prof. dr. Jože VORŠIČ, Univerza v Mariboru, Slovenija / University of Maribor, Slovenia Prof. dr. Koichi WATANABE, KEIO University, Japonska / KEIO University, Japan Prof. dr. Mykhailo ZAGIRNYAK, Kremenchuk Mykhailo Ostrohradskyi National University, Ukrajina / Kremenchuk Mykhailo Ostrohradskyi National University, Ukraine, Doc. dr. Tomaž ŽAGAR, Univerza v Mariboru, Slovenija / University of Maribor, Slovenia Doc. dr. Franc ŽERDIN, Univerza v Mariboru, Slovenija / University of Maribor, Slovenia
Tehniška podpora / TECHNICAL SUPPORT
Tamara BREČKO BOGOVČIČ, Sonja NOVAK, Janko OMERZU;
Izhajanje revije / PUBLISHING
Revija izhaja štirikrat letno v nakladi 150 izvodov. Članki so dostopni na spletni strani revije - www.fe.um.si/si/jet.html / The journal is published four times a year. Articles are available at the journal’s home page - www.fe.um.si/en/jet.html.
Cena posameznega izvoda revije (brez DDV) / price per issue (VAT not included in price): 50,00 EUR Informacije o naročninah / subscription information: http://www.fe.um.si/en/jet/subscriptions.html
Lektoriranje / LANGUAGE EDITING
Terry T. JACKSON
Oblikovanje in tisk / DESIGN AND PRINT
Vizualne komunikacije comTEC® d.o.o.
Oblikovanje revije in znaka revije / JOURNAL AND LOGO DESIGN
Andrej PREDIN
Revija JET je sofinancirana s strani Javne agencije za knjigo Republike Slovenije ter v okviru Petrolovega Programa velikih zavezancev za zagotavljanje prihrankov energije pri končnih odjemalcih / The Journal of Energy Technology is co-financed by the Slovenian Book Agency and Petrol's Programme for providing energy savings of end consumers.
Miralem HADŽISELIMOVIĆ Gorazd HREN Milan MARČIČ Jože PIHLER Iztok POTRČ Janez USENIK Peter VIRTIČ Jože VORŠIČ
Uredniški odbor / EDITORIAL BOARD
Izr. prof. dr. Jurij AVSEC, Univerza v Mariboru, Slovenija / University of Maribor, Slovenia Prof. ddr. Denis ĐONLAGIĆ, Univerza v Mariboru, Slovenija / University of Maribor, Slovenia Doc. dr. Željko HEDERIĆ, Sveučilište Josipa Jurja Strossmayera u Osijeku, Hrvatska / Josip Juraj Strossmayer University Osijek, Croatia Izr. prof. dr. Miralem HADŽISELIMOVIĆ, Univerza v Mariboru, Slovenija / University of Maribor, Slovenia Doc. dr. Gorazd HREN, Univerza v Mariboru, Slovenija / University of Maribor, Slovenia Prof. dr. Roman KLASINC, Technische Universität Graz, Avstrija / Graz University Of Technology, Austria dr. Ivan Aleksander KODELI, Institut Jožef Stefan, Slovenija / Jožef Stefan Institute, Slovenia Prof. dr. Jurij KROPE, Univerza v Mariboru, Slovenija / University of Maribor, Slovenia Prof. dr. Alfred LEIPERTZ, Universität Erlangen, Nemčija / University of Erlangen, Germany Prof. dr. Branimir MATIJAŠEVIČ, Sveučilište u Zagrebu, Hrvaška / University of Zagreb, Croatia Prof. dr. Matej MENCINGER, Univerza v Mariboru, Slovenija / University of Maribor, Slovenia Prof. dr. Greg NATERER, University of Ontario, Kanada / University of Ontario, Canada Prof. dr. Enrico NOBILE, Università degli Studi di Trieste, Italia / University of Trieste, Italy Prof. dr. Iztok POTRČ, Univerza v Mariboru, Slovenija / University of Maribor, Slovenia Prof. dr. Andrej PREDIN, Univerza v Mariboru, Slovenija / University of Maribor, Slovenia Prof. dr. Aleksandar SALJNIKOV, Univerza Beograd, Srbija / University of Beograd, Serbia Prof. dr. Brane ŠIROK, Univerza v Ljubljani, Slovenija / University of Ljubljana, Slovenia Doc. dr. Andrej TRKOV, Institut Jožef Stefan, Slovenija / Jožef Stefan Institute, Slovenia Prof. ddr. Janez USENIK,

JET �
Univerza v Mariboru, Slovenija / University of Maribor, Slovenia Doc. dr. Peter VIRTIČ, Univerza v Mariboru, Slovenija / University of Maribor, Slovenia Prof. dr. Jože VORŠIČ, Univerza v Mariboru, Slovenija / University of Maribor, Slovenia Prof. dr. Koichi WATANABE, KEIO University, Japonska / KEIO University, Japan Prof. dr. Mykhailo ZAGIRNYAK, Kremenchuk Mykhailo Ostrohradskyi National University, Ukrajina / Kremenchuk Mykhailo Ostrohradskyi National University, Ukraine, Doc. dr. Tomaž ŽAGAR, Univerza v Mariboru, Slovenija / University of Maribor, Slovenia Doc. dr. Franc ŽERDIN, Univerza v Mariboru, Slovenija / University of Maribor, Slovenia
Tehniška podpora / TECHNICAL SUPPORT
Tamara BREČKO BOGOVČIČ, Sonja NOVAK, Janko OMERZU;
Izhajanje revije / PUBLISHING
Revija izhaja štirikrat letno v nakladi 150 izvodov. Članki so dostopni na spletni strani revije - www.fe.um.si/si/jet.html / The journal is published four times a year. Articles are available at the journal’s home page - www.fe.um.si/en/jet.html.
Cena posameznega izvoda revije (brez DDV) / price per issue (VAT not included in price): 50,00 EUR Informacije o naročninah / subscription information: http://www.fe.um.si/en/jet/subscriptions.html
Lektoriranje / LANGUAGE EDITING
Terry T. JACKSON
Oblikovanje in tisk / DESIGN AND PRINT
Vizualne komunikacije comTEC® d.o.o.
Oblikovanje revije in znaka revije / JOURNAL AND LOGO DESIGN
Andrej PREDIN
Revija JET je sofinancirana s strani Javne agencije za knjigo Republike Slovenije ter v okviru Petrolovega Programa velikih zavezancev za zagotavljanje prihrankov energije pri končnih odjemalcih / The Journal of Energy Technology is co-financed by the Slovenian Book Agency and Petrol's Programme for providing energy savings of end consumers.
Miralem HADŽISELIMOVIĆ Gorazd HREN Milan MARČIČ Jože PIHLER Iztok POTRČ Janez USENIK Peter VIRTIČ Jože VORŠIČ
Uredniški odbor / EDITORIAL BOARD
Izr. prof. dr. Jurij AVSEC, Univerza v Mariboru, Slovenija / University of Maribor, Slovenia Prof. ddr. Denis ĐONLAGIĆ, Univerza v Mariboru, Slovenija / University of Maribor, Slovenia Doc. dr. Željko HEDERIĆ, Sveučilište Josipa Jurja Strossmayera u Osijeku, Hrvatska / Josip Juraj Strossmayer University Osijek, Croatia Izr. prof. dr. Miralem HADŽISELIMOVIĆ, Univerza v Mariboru, Slovenija / University of Maribor, Slovenia Doc. dr. Gorazd HREN, Univerza v Mariboru, Slovenija / University of Maribor, Slovenia Prof. dr. Roman KLASINC, Technische Universität Graz, Avstrija / Graz University Of Technology, Austria dr. Ivan Aleksander KODELI, Institut Jožef Stefan, Slovenija / Jožef Stefan Institute, Slovenia Prof. dr. Jurij KROPE, Univerza v Mariboru, Slovenija / University of Maribor, Slovenia Prof. dr. Alfred LEIPERTZ, Universität Erlangen, Nemčija / University of Erlangen, Germany Prof. dr. Branimir MATIJAŠEVIČ, Sveučilište u Zagrebu, Hrvaška / University of Zagreb, Croatia Prof. dr. Matej MENCINGER, Univerza v Mariboru, Slovenija / University of Maribor, Slovenia Prof. dr. Greg NATERER, University of Ontario, Kanada / University of Ontario, Canada Prof. dr. Enrico NOBILE, Università degli Studi di Trieste, Italia / University of Trieste, Italy Prof. dr. Iztok POTRČ, Univerza v Mariboru, Slovenija / University of Maribor, Slovenia Prof. dr. Andrej PREDIN, Univerza v Mariboru, Slovenija / University of Maribor, Slovenia Prof. dr. Aleksandar SALJNIKOV, Univerza Beograd, Srbija / University of Beograd, Serbia Prof. dr. Brane ŠIROK, Univerza v Ljubljani, Slovenija / University of Ljubljana, Slovenia Doc. dr. Andrej TRKOV, Institut Jožef Stefan, Slovenija / Jožef Stefan Institute, Slovenia Prof. ddr. Janez USENIK,

� JET
Commercial exploitation of wind energy has finally begun in Slovenia
Slovenia's first commercial-scale wind farm, located in the village of Dolenja Vas on the Griško plain has begun operation. The wind power station is a 2.3 MW E-70 model from the German manufacturer ENERCOM. It has a three-blade rotor with a diameter of 71 m, covering an area of 3,959 m². The wings are made of reinforced epoxy, in which is integrated a system for lightning protection. The rotational speed of the rotor is between 6 and 21.5 revolutions per minute. The wings are pivoted via a common system, which also includes a protective stop in case of excessive wind speeds. A safety brake with the possibility of locking the rotor is also installed. All controls include triple independent systems, with the possibility of providing emergency control. The cut-out speed is between 28 and 34 m/s. Remote control is provided via an ENERCON SCADA system. The generator is direct-drive type, which means that no additional exchange transitions are needed. This is also the reason that no foreign oil, which is so often disputed our environmental regime, is needed. The tower is 98 m high. The foundation was cast in a cylindrical form with a diameter of 15 m and height of the cylinder 2.8 m. The foundation has installed 50 tons of iron armatures, which are enveloped by approximately 500 m³ of concrete. The rotor of the wind power station rotates clockwise and is the first power plant in the series, which will eventually form a large wind farm. An energy permit has been issued for a wind farm with total of 80 MW installed capacity.
Of course, construction was not without a particularly Slovenian feature: anonymous complaints to the Ministry of Environment, which nevertheless issued a building permit. Apparently, the investor does not have all the consent of the owners of land affected by the wind farm. Legal experts, from the Institute of Administrative Law, are of the opinion that the repeal of a building permit by the ministry is illegal. All of this entailed costs, which will once again be borne by the Slovenian taxpayers.
I hope this will be a good example for the future for other projects, with fewer of the bureaucratic entanglements, however.
Krško, May, 2013
Andrej PREDIN
V Sloveniji končno pričeli komercialno izrabljati vetrno energijo Naša prva komercialna velika vetrna elektrarna, postavljena ob Dolenji vasi na Griškem polju, je pričela obratovati. Vetrnica je tipa E-70, nemškega proizvajalca ENERCOM, moči 2,3 MW. Rotor je trokrak, premera 71 m, ki koristi površino 3.959 m2. Krila so izvedena iz armiranega epoxy-ja, v katerem je integriran tudi sistem strelovoda. Vrtilna hitrost rotorja je med 6 in 21,5 vrtljaji na minuto. Krila so vrtljivo pivotirana, s skupnim sistemom, ki zajema tudi varnostno zaustavitev, oz. izklop v primeru prevelikih hitrostih vetra. Instalirana je varnostna zavora z možnostjo blokiranja rotorja. Vse nadzira trojni neodvisni sistem, z možnostjo zasilnega zagotavljanje regulacijske napetosti. Izklopna hitrost je med 28 in 34 m/s. Oddaljeni nadzor je vršen s sistemom ENERCON SCADA. Generator je tipa »direct-drive«, kar pomeni, da ne potrebuje menjalniških prenosov in s tem tudi ne menjalniškega olja, ki je tako pogosto sporno našim okolje-varnostnikom. Stolp je visok 98 m. Temeljenje vetrnice je izvedeno v valjasti obliki s premerom 15 m in višino valja 2,8 m. V temelj je instalirano 50 ton železne armature, ki je zalita s približno 500 m3 betona. Vetrnica, ki se vrti v smeri urinega kazalca, je prva v nizu, ki bo sestavljalo veliko vetrno polje. Energetsko dovoljenje za skupaj 80 MW instalirane moči vetrnega polja, je že izdano.
Seveda pri gradnji ni izostala tipična slovenska lastnost, ki se je pokazala v obliki anonimne prijave Ministrstvu za okolje, ki je po prejetju le-te razveljavilo izdano gradbeno dovoljenje. Domnevno investitor ni imel vseh soglasij lastnikov zemljišč, na katerih se bo vetrno polje raztezalo. Pravni strokovnjaki z Inštituta za upravno pravo pa navajajo, da je bila razveljavitev gradbenega dovoljenja s strani ministrstva nezakonita. Seveda so pri tem nastali dodatni stroški, ki jih bomo spet po neumnosti plačevali davkoplačevalci naše Slovenije.
Upam, da bo to lep zgled za v bodoče, tudi pri drugih gradnjah. Prav tako upam, da bo v bodoče tudi birokratskih zapletov bistveno manj.
Krško, maj 2013
Andrej PREDIN

JET �
Commercial exploitation of wind energy has finally begun in Slovenia
Slovenia's first commercial-scale wind farm, located in the village of Dolenja Vas on the Griško plain has begun operation. The wind power station is a 2.3 MW E-70 model from the German manufacturer ENERCOM. It has a three-blade rotor with a diameter of 71 m, covering an area of 3,959 m². The wings are made of reinforced epoxy, in which is integrated a system for lightning protection. The rotational speed of the rotor is between 6 and 21.5 revolutions per minute. The wings are pivoted via a common system, which also includes a protective stop in case of excessive wind speeds. A safety brake with the possibility of locking the rotor is also installed. All controls include triple independent systems, with the possibility of providing emergency control. The cut-out speed is between 28 and 34 m/s. Remote control is provided via an ENERCON SCADA system. The generator is direct-drive type, which means that no additional exchange transitions are needed. This is also the reason that no foreign oil, which is so often disputed our environmental regime, is needed. The tower is 98 m high. The foundation was cast in a cylindrical form with a diameter of 15 m and height of the cylinder 2.8 m. The foundation has installed 50 tons of iron armatures, which are enveloped by approximately 500 m³ of concrete. The rotor of the wind power station rotates clockwise and is the first power plant in the series, which will eventually form a large wind farm. An energy permit has been issued for a wind farm with total of 80 MW installed capacity.
Of course, construction was not without a particularly Slovenian feature: anonymous complaints to the Ministry of Environment, which nevertheless issued a building permit. Apparently, the investor does not have all the consent of the owners of land affected by the wind farm. Legal experts, from the Institute of Administrative Law, are of the opinion that the repeal of a building permit by the ministry is illegal. All of this entailed costs, which will once again be borne by the Slovenian taxpayers.
I hope this will be a good example for the future for other projects, with fewer of the bureaucratic entanglements, however.
Krško, May, 2013
Andrej PREDIN
V Sloveniji končno pričeli komercialno izrabljati vetrno energijo Naša prva komercialna velika vetrna elektrarna, postavljena ob Dolenji vasi na Griškem polju, je pričela obratovati. Vetrnica je tipa E-70, nemškega proizvajalca ENERCOM, moči 2,3 MW. Rotor je trokrak, premera 71 m, ki koristi površino 3.959 m2. Krila so izvedena iz armiranega epoxy-ja, v katerem je integriran tudi sistem strelovoda. Vrtilna hitrost rotorja je med 6 in 21,5 vrtljaji na minuto. Krila so vrtljivo pivotirana, s skupnim sistemom, ki zajema tudi varnostno zaustavitev, oz. izklop v primeru prevelikih hitrostih vetra. Instalirana je varnostna zavora z možnostjo blokiranja rotorja. Vse nadzira trojni neodvisni sistem, z možnostjo zasilnega zagotavljanje regulacijske napetosti. Izklopna hitrost je med 28 in 34 m/s. Oddaljeni nadzor je vršen s sistemom ENERCON SCADA. Generator je tipa »direct-drive«, kar pomeni, da ne potrebuje menjalniških prenosov in s tem tudi ne menjalniškega olja, ki je tako pogosto sporno našim okolje-varnostnikom. Stolp je visok 98 m. Temeljenje vetrnice je izvedeno v valjasti obliki s premerom 15 m in višino valja 2,8 m. V temelj je instalirano 50 ton železne armature, ki je zalita s približno 500 m3 betona. Vetrnica, ki se vrti v smeri urinega kazalca, je prva v nizu, ki bo sestavljalo veliko vetrno polje. Energetsko dovoljenje za skupaj 80 MW instalirane moči vetrnega polja, je že izdano.
Seveda pri gradnji ni izostala tipična slovenska lastnost, ki se je pokazala v obliki anonimne prijave Ministrstvu za okolje, ki je po prejetju le-te razveljavilo izdano gradbeno dovoljenje. Domnevno investitor ni imel vseh soglasij lastnikov zemljišč, na katerih se bo vetrno polje raztezalo. Pravni strokovnjaki z Inštituta za upravno pravo pa navajajo, da je bila razveljavitev gradbenega dovoljenja s strani ministrstva nezakonita. Seveda so pri tem nastali dodatni stroški, ki jih bomo spet po neumnosti plačevali davkoplačevalci naše Slovenije.
Upam, da bo to lep zgled za v bodoče, tudi pri drugih gradnjah. Prav tako upam, da bo v bodoče tudi birokratskih zapletov bistveno manj.
Krško, maj 2013
Andrej PREDIN

10 JET
JET Volume 6 (2013), p.p. 11 - 16
Issue 2, May 2013
http://www.fe.um.si/en/jet.html
FRACTOGRAFIC EXAMINATION OF WELDS WITH STRENGTH MISMATCHING
FRAKTOGRAFSKA RAZISKAVA TRDNOSTNO NEENAKIH ZVAROV
Zdravko Praunseis, Jurij Avsec, Simon Marčič
Keywords: fractografic examination, welds, strength mismatching
Abstract
Many investigations of cleavage fracture have shown that the normal stresses in welds with strength mismatching have good correlation with the cleavage fracture behaviour of materials. The objective of this investigation was to find evidence for the microstructural mechanisms leading to cleavage fracture. Examinations of the centre of the macroscopic river patterns at high magnifications revealed fine river patterns. These river patterns could be traced to a single area containing one to a few cleavage facets. These areas are referred to as initiation sites of welds with strength mismatching. Povzetek
Mnogo raziskav cepilnega krhkega loma je pokazalo, da so normalne napetosti v trdnostno neenakih zvarih v dobri korelaciji z lomnim obnašanjem krhkih cepilnih materialov. Namen raziskave je najti tiste mikrostrukturne mehanizme, ki vodijo do cepilnega krhkega loma. Raziskave centra makroskopskih rečnih strug pokažejo pri večjih povečavah drobno razvejanost rečnih strugic. Te rečne strugice lahko zajemajo eno ali več cepilnih faset in predstavljajo iniciacijske točke krhkega loma trdnostno neenakih zvarov.
Corresponding author: Zdravko Praunseis, PhD, Faculty of Energy Technology, University of Maribor, Tel.: +386 31 743 753, Fax: +386 7 620 2222, Mailing address: Hočevarjev trg 1, SI-8270 Krško, Slovenia, E-mail address: [email protected]
Table of Contents / Kazalo
Fractografic examination of welds with strength mismatching /
Fraktografska raziskava trdnostno neenakih zvarov
Zdravko Praunseis, Jurij Avsec, Simon Marčič ............................................................................. 11
EOBD usage in LPG conversions /
EOBD in predelava vozil na avtoplin
Primož Pogorevc, Tadej Tasič, Ignacijo Biluš ............................................................................... 17
Using steam as an alternative motive fluid in the existing turbine ejector system of the Ljubljana district heating plant /
Možnosti napajanja obstoječega ejektorskega sistema turboagregata v Toplarni Ljubljana z alternativno pogonsko paro
Dušan Strušnik, Jurij Avsec ........................................................................................................... 31
Experimental spray study with usage of alternative fuels /
Eksperimantalna študija razvoja curka alternativnih goriv
Blaž Vajda, Gorazd Bombek, Marko Hočevar, Danilo Ritlop, Breda Kegl, Ignacijo Biluš ........... 49
Energy renovation of an older house /
Energetska prenova starejše hiše
Zdravko Praunseis, Jurij Avsec, Simon Marčič, Renato Strojko .................................................. 59
Instructions for authors ............................................................................................................... 71

JET 11
JET Volume 6 (2013), p.p. 11 - 16
Issue 2, May 2013
http://www.fe.um.si/en/jet.html
FRACTOGRAFIC EXAMINATION OF WELDS WITH STRENGTH MISMATCHING
FRAKTOGRAFSKA RAZISKAVA TRDNOSTNO NEENAKIH ZVAROV
Zdravko Praunseis, Jurij Avsec, Simon Marčič
Keywords: fractografic examination, welds, strength mismatching
Abstract
Many investigations of cleavage fracture have shown that the normal stresses in welds with strength mismatching have good correlation with the cleavage fracture behaviour of materials. The objective of this investigation was to find evidence for the microstructural mechanisms leading to cleavage fracture. Examinations of the centre of the macroscopic river patterns at high magnifications revealed fine river patterns. These river patterns could be traced to a single area containing one to a few cleavage facets. These areas are referred to as initiation sites of welds with strength mismatching. Povzetek
Mnogo raziskav cepilnega krhkega loma je pokazalo, da so normalne napetosti v trdnostno neenakih zvarih v dobri korelaciji z lomnim obnašanjem krhkih cepilnih materialov. Namen raziskave je najti tiste mikrostrukturne mehanizme, ki vodijo do cepilnega krhkega loma. Raziskave centra makroskopskih rečnih strug pokažejo pri večjih povečavah drobno razvejanost rečnih strugic. Te rečne strugice lahko zajemajo eno ali več cepilnih faset in predstavljajo iniciacijske točke krhkega loma trdnostno neenakih zvarov.
Corresponding author: Zdravko Praunseis, PhD, Faculty of Energy Technology, University of Maribor, Tel.: +386 31 743 753, Fax: +386 7 620 2222, Mailing address: Hočevarjev trg 1, SI-8270 Krško, Slovenia, E-mail address: [email protected]
Table of Contents / Kazalo
Fractografic examination of welds with strength mismatching /
Fraktografska raziskava trdnostno neenakih zvarov
Zdravko Praunseis, Jurij Avsec, Simon Marčič ............................................................................. 11
EOBD usage in LPG conversions /
EOBD in predelava vozil na avtoplin
Primož Pogorevc, Tadej Tasič, Ignacijo Biluš ............................................................................... 17
Using steam as an alternative motive fluid in the existing turbine ejector system of the Ljubljana district heating plant /
Možnosti napajanja obstoječega ejektorskega sistema turboagregata v Toplarni Ljubljana z alternativno pogonsko paro
Dušan Strušnik, Jurij Avsec ........................................................................................................... 31
Experimental spray study with usage of alternative fuels /
Eksperimantalna študija razvoja curka alternativnih goriv
Blaž Vajda, Gorazd Bombek, Marko Hočevar, Danilo Ritlop, Breda Kegl, Ignacijo Biluš ........... 49
Energy renovation of an older house /
Energetska prenova starejše hiše
Zdravko Praunseis, Jurij Avsec, Simon Marčič, Renato Strojko .................................................. 59
Instructions for authors ............................................................................................................... 71

12 JET
Fractografic examination of welds with strength mismatching
----------
Table 1: Fatigue crack positioning in SENB specimens (B x 2B) at weld joints
SENB specimen
Specimen Fatigue
crack
position
Crack depth
a/W
M HAZ WM
0.5
B×2B D
0.5
E
0.5
3 RESULTS AND DISCUSSION
As it can be seen from Table 1, the fatigue crack was positioned in the HAZ and the weld metal of the homogeneous and heterogeneous under-matched weld joints. By positioning the fatigue crack in the HAZ, a so-called “composite” fatigue crack front crosses the filler passes - HAZ - base material - HAZ - filler passes. The distance between the fatigue crack front and the fusion line in the weld root region was approximately 3.5 mm in all specimens B × 2B (Fig. 1 - Cross-section A-A). The basic aim of the fractographical investigation was to determine the location of brittle fracture initiation on the fracture surface of specimens B × 2B, and to identify the brittle fracture initiation point by using Energy-Dispersive X-ray (EDX) analysis. The microstructure at the brittle fracture initiation point and around it, as well as the nature of the crack path deviation was evaluated using the fracture surface cross-section through the brittle fracture initiation point. After the metallographic specimen was made, a detailed analysis of the welded joint region at the crack tip and along deviated crack path was performed with an optical microscope and a Scanning Electron Microscope (SEM). In this manner, a critical microstructure in the fatigue crack tip surroundings, where the brittle fracture initiated, and the microstructure where it propagated and later arrested was identified. For fractographical and metallographical analysis, the most representative fracture of specimens B × 2B were chosen, which also appeared in other specimens in an appropriate shape (Fig. 1).
Zdravko Praunseis, Jurij Avsec, Simon Marčič JET Vol. 6 (2013)
Issue 2
----------
1 INTRODUCTION
The development of the microstructure in the weld metal and especially in the heat-affected zone (HAZ) of multi-pass joints is strongly influenced by the welding thermal cycle and base material properties. Metallographically examined microstructures in under-matched joints with homogeneous and heterogeneous welds were, in particular, expected to have extremely low fracture toughness. Therefore, microstructures developed in weld metal and the HAZ of a multi-pass under-matched joint with homogeneous and heterogeneous weld metals were analysed using optical microscopy.
High strength low-alloyed (HSLA) steels are often used as new materials for the construction of multi-pass welded joints. The welding of HSLA steels to produce under-matched weld joints is a technological challenge for the current production of welded structures.
Therefore, the aim of this paper is to analyse the fracture behaviour of HSLA under-matched welded joints, and to determine the brittle fracture initiation points and crack path deviation in testing specimens, 1.
2 EXPERIMENTAL PROCEDURE
The fracture toughness of homogeneous and heterogeneous under-matched weld joints was evaluated using a standard static Crack Tip Opening Displacement (CTOD) test at the Geesthacht Research Center 5. All CTOD tests were conducted using Zwick (20t) and Schenk (100t) testing machines. Specimen loading was carried out with constant crosshead speed v = 0.5 mm/min. The test temperature was -10 °C according to the recommendation of the OMAE (Offshore Mechanics and Artic Engineering) association. For CTOD testing, the single specimen method was used. To evaluate the fracture toughness of under-matched welded joints, standard bending specimens, 2-4 with deep (a/W = 0.5) and shallow (a/W = 0.25 - 0.4) notches in the weld metal and HAZ were used, 1. For all specimens, fatigue pre-cracking was carried out with the Step-Wise High R ratio method (SHR) procedure, 5. During the CTOD tests the potential drop technique was used for monitoring stable crack growth, 1. The load line displacement (LLD) was also measured with a reference bar to minimize the effects of possible indentations of the rollers. The CTOD values were calculated in accordance with BS 5762, 2, and also directly measured using a clip gauge on the specimen side surfaces at the fatigue crack tip over a gauge length of 5 mm, 5.
For fracture mechanics, standards for the treatment of welded joints suitable are not yet available, but different procedures exist, 1, 6-8, recommending different ways of fatigue crack positioning in weld joints. Having this in mind, different positions and depths (a/W) of fatigue cracks in homogeneous and heterogeneous welds were chosen, as shown in Table 1.

JET 1�
Fractografic examination of welds with strength mismatching
----------
Table 1: Fatigue crack positioning in SENB specimens (B x 2B) at weld joints
SENB specimen
Specimen Fatigue
crack
position
Crack depth
a/W
M HAZ WM
0.5
B×2B D
0.5
E
0.5
3 RESULTS AND DISCUSSION
As it can be seen from Table 1, the fatigue crack was positioned in the HAZ and the weld metal of the homogeneous and heterogeneous under-matched weld joints. By positioning the fatigue crack in the HAZ, a so-called “composite” fatigue crack front crosses the filler passes - HAZ - base material - HAZ - filler passes. The distance between the fatigue crack front and the fusion line in the weld root region was approximately 3.5 mm in all specimens B × 2B (Fig. 1 - Cross-section A-A). The basic aim of the fractographical investigation was to determine the location of brittle fracture initiation on the fracture surface of specimens B × 2B, and to identify the brittle fracture initiation point by using Energy-Dispersive X-ray (EDX) analysis. The microstructure at the brittle fracture initiation point and around it, as well as the nature of the crack path deviation was evaluated using the fracture surface cross-section through the brittle fracture initiation point. After the metallographic specimen was made, a detailed analysis of the welded joint region at the crack tip and along deviated crack path was performed with an optical microscope and a Scanning Electron Microscope (SEM). In this manner, a critical microstructure in the fatigue crack tip surroundings, where the brittle fracture initiated, and the microstructure where it propagated and later arrested was identified. For fractographical and metallographical analysis, the most representative fracture of specimens B × 2B were chosen, which also appeared in other specimens in an appropriate shape (Fig. 1).
Zdravko Praunseis, Jurij Avsec, Simon Marčič JET Vol. 6 (2013)
Issue 2
----------
1 INTRODUCTION
The development of the microstructure in the weld metal and especially in the heat-affected zone (HAZ) of multi-pass joints is strongly influenced by the welding thermal cycle and base material properties. Metallographically examined microstructures in under-matched joints with homogeneous and heterogeneous welds were, in particular, expected to have extremely low fracture toughness. Therefore, microstructures developed in weld metal and the HAZ of a multi-pass under-matched joint with homogeneous and heterogeneous weld metals were analysed using optical microscopy.
High strength low-alloyed (HSLA) steels are often used as new materials for the construction of multi-pass welded joints. The welding of HSLA steels to produce under-matched weld joints is a technological challenge for the current production of welded structures.
Therefore, the aim of this paper is to analyse the fracture behaviour of HSLA under-matched welded joints, and to determine the brittle fracture initiation points and crack path deviation in testing specimens, 1.
2 EXPERIMENTAL PROCEDURE
The fracture toughness of homogeneous and heterogeneous under-matched weld joints was evaluated using a standard static Crack Tip Opening Displacement (CTOD) test at the Geesthacht Research Center 5. All CTOD tests were conducted using Zwick (20t) and Schenk (100t) testing machines. Specimen loading was carried out with constant crosshead speed v = 0.5 mm/min. The test temperature was -10 °C according to the recommendation of the OMAE (Offshore Mechanics and Artic Engineering) association. For CTOD testing, the single specimen method was used. To evaluate the fracture toughness of under-matched welded joints, standard bending specimens, 2-4 with deep (a/W = 0.5) and shallow (a/W = 0.25 - 0.4) notches in the weld metal and HAZ were used, 1. For all specimens, fatigue pre-cracking was carried out with the Step-Wise High R ratio method (SHR) procedure, 5. During the CTOD tests the potential drop technique was used for monitoring stable crack growth, 1. The load line displacement (LLD) was also measured with a reference bar to minimize the effects of possible indentations of the rollers. The CTOD values were calculated in accordance with BS 5762, 2, and also directly measured using a clip gauge on the specimen side surfaces at the fatigue crack tip over a gauge length of 5 mm, 5.
For fracture mechanics, standards for the treatment of welded joints suitable are not yet available, but different procedures exist, 1, 6-8, recommending different ways of fatigue crack positioning in weld joints. Having this in mind, different positions and depths (a/W) of fatigue cracks in homogeneous and heterogeneous welds were chosen, as shown in Table 1.

1� JET
Fractografic examination of welds with strength mismatching
----------
Direct measurement (5 method) and the calculation (BS - 5762) of CTOD values from the measured Crack Mouth Opening Displacement (CMOD) values and the estimation of values (c, u in m) are described in 1, 6-8. Evaluation of pop-in appearance using curves (F - CMOD, 5) is described in more detail in 1. The CTOD testing was done at a temperature at -10 °C.
Figure 2: Comparison of directly measured (5) and calculated (BS) CTOD fracture toughness values of specimens B × 2B with a deep crack (a/W = 0.5) in homogeneous and heterogeneous
under-matched weld joints
From Fig. 2, it is clear that measured (5) and calculated (BS) CTOD fracture toughness values match approximately. More detailed analysis indicates that the direct measured method 5 gives more conservative CTOD values 1.
4 CONCLUSIONS
Good agreement between calculated (BS) and measured (5) CTOD values is obvious from the comparison of CTOD results, verifying the method of direct measurement of CTOD, for which the material property data (e.g. yield strength) is not necessary, in contrast to the calculated CTOD values according to the BS 5762 standard. This argument favours using direct measurement 5 at the crack tip in welded joints with local and global strength mismatching, and precludes the application of the BS 5762 standard for welded joints, which is valid for base material.
The brittle fracture initiation points of the root layer were indicated by EDX analysis as a Mn-Al-Si inclusion or TiCN carbide, and are found just below the blunting line, which is in agreement with the brittle fracture model theory. It should be noted that for correct identification of a brittle fracture initiation point it is of utmost importance to apply EDX analysis to both fracture
Zdravko Praunseis, Jurij Avsec, Simon Marčič JET Vol. 6 (2013)
Issue 2
----------
Figure 1: Brittle fracture initiation points and crack path deviation on fractured specimen B × 2B
with deep crack in HAZ of the heterogeneous under-matched weld joint
Directly measured (5) and calculated CTOD values (BS) of fracture toughness for homogeneous and heterogeneous under-matched weld joints are summarized in Figure 2 for Single Edge Notch Bend (SENB) specimens, B × 2B. Different values of rotational factor were used at the determination of calculated CTOD values (BS) for surface cracks introduced in specimens in accordance with different ratio a/W. Rotational factor values rp, [1], to determine the calculated CTOD - (BS) were depended on crack depths (a/W) as following:
for crack depths a/W = 0.25 - 0.37 » rp = 0.25
for crack depths a/W = 0.43 - 0.48 »rp = 0.44

JET 1�
Fractografic examination of welds with strength mismatching
----------
Direct measurement (5 method) and the calculation (BS - 5762) of CTOD values from the measured Crack Mouth Opening Displacement (CMOD) values and the estimation of values (c, u in m) are described in 1, 6-8. Evaluation of pop-in appearance using curves (F - CMOD, 5) is described in more detail in 1. The CTOD testing was done at a temperature at -10 °C.
Figure 2: Comparison of directly measured (5) and calculated (BS) CTOD fracture toughness values of specimens B × 2B with a deep crack (a/W = 0.5) in homogeneous and heterogeneous
under-matched weld joints
From Fig. 2, it is clear that measured (5) and calculated (BS) CTOD fracture toughness values match approximately. More detailed analysis indicates that the direct measured method 5 gives more conservative CTOD values 1.
4 CONCLUSIONS
Good agreement between calculated (BS) and measured (5) CTOD values is obvious from the comparison of CTOD results, verifying the method of direct measurement of CTOD, for which the material property data (e.g. yield strength) is not necessary, in contrast to the calculated CTOD values according to the BS 5762 standard. This argument favours using direct measurement 5 at the crack tip in welded joints with local and global strength mismatching, and precludes the application of the BS 5762 standard for welded joints, which is valid for base material.
The brittle fracture initiation points of the root layer were indicated by EDX analysis as a Mn-Al-Si inclusion or TiCN carbide, and are found just below the blunting line, which is in agreement with the brittle fracture model theory. It should be noted that for correct identification of a brittle fracture initiation point it is of utmost importance to apply EDX analysis to both fracture
Zdravko Praunseis, Jurij Avsec, Simon Marčič JET Vol. 6 (2013)
Issue 2
----------
Figure 1: Brittle fracture initiation points and crack path deviation on fractured specimen B × 2B
with deep crack in HAZ of the heterogeneous under-matched weld joint
Directly measured (5) and calculated CTOD values (BS) of fracture toughness for homogeneous and heterogeneous under-matched weld joints are summarized in Figure 2 for Single Edge Notch Bend (SENB) specimens, B × 2B. Different values of rotational factor were used at the determination of calculated CTOD values (BS) for surface cracks introduced in specimens in accordance with different ratio a/W. Rotational factor values rp, [1], to determine the calculated CTOD - (BS) were depended on crack depths (a/W) as following:
for crack depths a/W = 0.25 - 0.37 » rp = 0.25
for crack depths a/W = 0.43 - 0.48 »rp = 0.44

1� JET
JET Volume 6 (2013), p.p. 17 - 30
Issue 2, May 2013
http://www.fe.um.si/en/jet.html
EOBD USAGE IN LPG CONVERSIONS
EOBD IN PREDELAVA VOZIL NA AVTOPLIN
Primož Pogorevc, Tadej Tasič, Ignacijo Biluš
Keywords: IC engines, emissions, LPG conversion, EOBD, LPG system setup
Abstract Aftermarket conversions of gasoline engines to also run on LPG are a way of reducing greenhouse gas emissions. The correct setup of the LPG system is necessary for optimal engine performance. If it is not set up correctly, the engine will not run properly, fuel consumption will increase, and the appearance of diagnostic trouble codes may activate the engine warning light. With European On-Board Diagnostics (EOBD), information from engine sensors throughout the car can be monitored and stored. Engine diagnostic trouble codes can also be read and cleared. This paper shows the usage of EODB for the optimal setup of aftermarket LPG systems. The analysis of the results obtained was made, and the LPG map was modified accordingly. Povzetek Eno izmed možnosti v boju proti emisijam toplogrednih plinov predstavlja predelava bencinskih motorjev na avtoplin. Pravilna nastavitev sistema je ključna za optimalno delovanje motorja. Če sistem ni pravilno nastavljen, motor ne deluje pravilno, poveča se poraba goriva, napake pri delovanju pa lahko celo prižgejo opozorilno lučko. S pomočjo EOBD lahko spremljamo ter shranjujemo podatke o delovanju motorja, omogoča pa tudi branje in brisanje napak. Prispevek prikazuje uporabo EOBD pri optimalnem nastavljanju avtoplinskega sistema. Na podlagi analize pridobljenih podatkov so bile ustrezno korigirane nastavitve avtoplinskega sistema.
Corresponding author: Primož Pogorevc, PhD, Tel.: +386 40 860 068, Mailing address: RA-CEN d.o.o., Gozdarska cesta 55, SI-2382 Mislinja E-mail address: [email protected]
Zdravko Praunseis, Jurij Avsec, Simon Marčič JET Vol. 6 (2013)
Issue 2
----------
surfaces. In the opposite case, it could happen that the EDX analysis detects a false brittle fracture initiation point.
Acknowledgements
The authors wish to acknowledge the financial support of the Slovenian Foundation of Science and Technology and the Japanese Promotion of Science
References
[1] Z. Praunseis: The influence of Strength Under-matched Weld Metal containing Heterogeneous Regions on Fracture Properties of HSLA Steel Weld Joint (Dissertation in English). Faculty of Mechanical Engineering, University of Maribor, Slovenia, 1998
[2] BS 5762, Methods for crack opening displacement (COD) testing, The British Standards Institution, London 1979.
[3] ASTM E 1152-87, Standard test method for determining J-R curves, Annual Book of ASTM Standards, Vol. 03.01, American Society for Testing and Materials, Philadelphia, 1990.
[4] ASTM E 1290-91, Standard test method for crack-tip opening displacement (CTOD) fracture toughness measurement, American Society for Testing and Materials, Philadelphia, 1991.
[5] GKSS Forschungszentrum Geesthacht GMBH, GKSS-Displacement Gauge Systems for Applications in Fracture Mechanic.
[6] Z. Praunseis, M. Toyoda, T. Sundararajan: Fracture behaviours of fracture toughness testing specimens with metallurgical heterogeneity along crack front. Steel res., Sep. 2000, 71, no 9,
[7] Z. Praunseis, T. Sundararajan, M. Toyoda, M. Ohata: The influence of soft root on fracture behaviors of high-strength, low-alloyed (HSLA) steel weldments. Mater. manuf. process., 2001, vol. 16, 2
[8] T. Sundararajan, Z. Praunseis: The effect of nitrogen-ion implantation on the corrosion resistance of titanium in comparison with oxygen- and argon-ion implantations. Mater. tehnol., 2004, vol. 38, no. 1/2.
JET 1�
JET Volume 6 (2013), p.p. 17 - 30
Issue 2, May 2013
http://www.fe.um.si/en/jet.html
EOBD USAGE IN LPG CONVERSIONS
EOBD IN PREDELAVA VOZIL NA AVTOPLIN
Primož Pogorevc, Tadej Tasič, Ignacijo Biluš
Keywords: IC engines, emissions, LPG conversion, EOBD, LPG system setup
Abstract Aftermarket conversions of gasoline engines to also run on LPG are a way of reducing greenhouse gas emissions. The correct setup of the LPG system is necessary for optimal engine performance. If it is not set up correctly, the engine will not run properly, fuel consumption will increase, and the appearance of diagnostic trouble codes may activate the engine warning light. With European On-Board Diagnostics (EOBD), information from engine sensors throughout the car can be monitored and stored. Engine diagnostic trouble codes can also be read and cleared. This paper shows the usage of EODB for the optimal setup of aftermarket LPG systems. The analysis of the results obtained was made, and the LPG map was modified accordingly. Povzetek Eno izmed možnosti v boju proti emisijam toplogrednih plinov predstavlja predelava bencinskih motorjev na avtoplin. Pravilna nastavitev sistema je ključna za optimalno delovanje motorja. Če sistem ni pravilno nastavljen, motor ne deluje pravilno, poveča se poraba goriva, napake pri delovanju pa lahko celo prižgejo opozorilno lučko. S pomočjo EOBD lahko spremljamo ter shranjujemo podatke o delovanju motorja, omogoča pa tudi branje in brisanje napak. Prispevek prikazuje uporabo EOBD pri optimalnem nastavljanju avtoplinskega sistema. Na podlagi analize pridobljenih podatkov so bile ustrezno korigirane nastavitve avtoplinskega sistema.
Corresponding author: Primož Pogorevc, PhD, Tel.: +386 40 860 068, Mailing address: RA-CEN d.o.o., Gozdarska cesta 55, SI-2382 Mislinja E-mail address: [email protected]
Zdravko Praunseis, Jurij Avsec, Simon Marčič JET Vol. 6 (2013)
Issue 2
----------
surfaces. In the opposite case, it could happen that the EDX analysis detects a false brittle fracture initiation point.
Acknowledgements
The authors wish to acknowledge the financial support of the Slovenian Foundation of Science and Technology and the Japanese Promotion of Science
References
[1] Z. Praunseis: The influence of Strength Under-matched Weld Metal containing Heterogeneous Regions on Fracture Properties of HSLA Steel Weld Joint (Dissertation in English). Faculty of Mechanical Engineering, University of Maribor, Slovenia, 1998
[2] BS 5762, Methods for crack opening displacement (COD) testing, The British Standards Institution, London 1979.
[3] ASTM E 1152-87, Standard test method for determining J-R curves, Annual Book of ASTM Standards, Vol. 03.01, American Society for Testing and Materials, Philadelphia, 1990.
[4] ASTM E 1290-91, Standard test method for crack-tip opening displacement (CTOD) fracture toughness measurement, American Society for Testing and Materials, Philadelphia, 1991.
[5] GKSS Forschungszentrum Geesthacht GMBH, GKSS-Displacement Gauge Systems for Applications in Fracture Mechanic.
[6] Z. Praunseis, M. Toyoda, T. Sundararajan: Fracture behaviours of fracture toughness testing specimens with metallurgical heterogeneity along crack front. Steel res., Sep. 2000, 71, no 9,
[7] Z. Praunseis, T. Sundararajan, M. Toyoda, M. Ohata: The influence of soft root on fracture behaviors of high-strength, low-alloyed (HSLA) steel weldments. Mater. manuf. process., 2001, vol. 16, 2
[8] T. Sundararajan, Z. Praunseis: The effect of nitrogen-ion implantation on the corrosion resistance of titanium in comparison with oxygen- and argon-ion implantations. Mater. tehnol., 2004, vol. 38, no. 1/2.
1� JET
EOBD usage in LPG conversions
----------
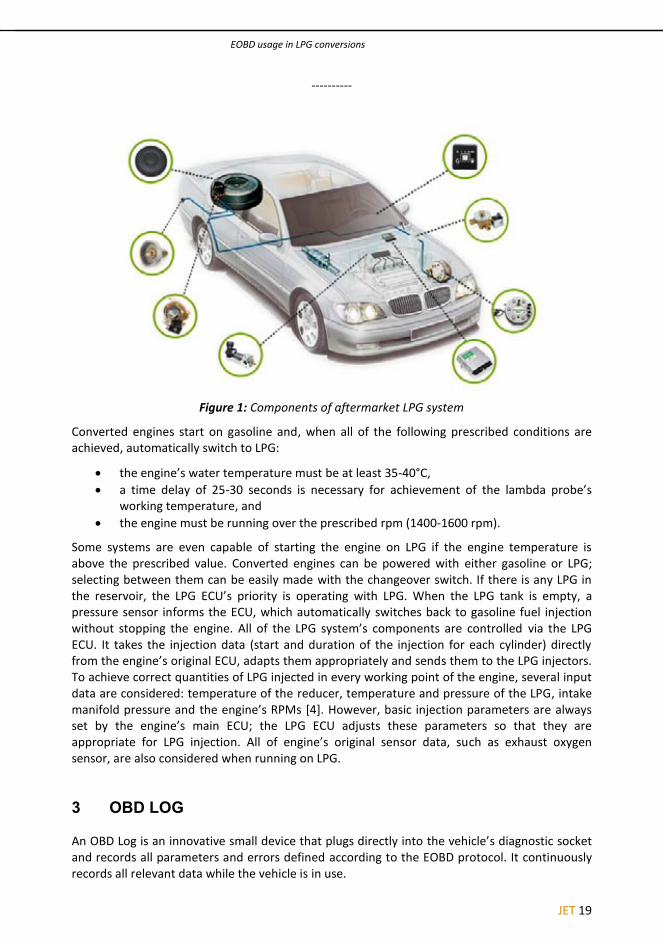
Figure 1: Components of aftermarket LPG system
Converted engines start on gasoline and, when all of the following prescribed conditions are achieved, automatically switch to LPG:
the engine’s water temperature must be at least 35-40°C, a time delay of 25-30 seconds is necessary for achievement of the lambda probe’s
working temperature, and the engine must be running over the prescribed rpm (1400-1600 rpm).
Some systems are even capable of starting the engine on LPG if the engine temperature is above the prescribed value. Converted engines can be powered with either gasoline or LPG; selecting between them can be easily made with the changeover switch. If there is any LPG in the reservoir, the LPG ECU’s priority is operating with LPG. When the LPG tank is empty, a pressure sensor informs the ECU, which automatically switches back to gasoline fuel injection without stopping the engine. All of the LPG system’s components are controlled via the LPG ECU. It takes the injection data (start and duration of the injection for each cylinder) directly from the engine’s original ECU, adapts them appropriately and sends them to the LPG injectors. To achieve correct quantities of LPG injected in every working point of the engine, several input data are considered: temperature of the reducer, temperature and pressure of the LPG, intake manifold pressure and the engine’s RPMs [4]. However, basic injection parameters are always set by the engine’s main ECU; the LPG ECU adjusts these parameters so that they are appropriate for LPG injection. All of engine’s original sensor data, such as exhaust oxygen sensor, are also considered when running on LPG.
3 OBD LOG
An OBD Log is an innovative small device that plugs directly into the vehicle’s diagnostic socket and records all parameters and errors defined according to the EOBD protocol. It continuously records all relevant data while the vehicle is in use.
Primož Pogorevc, Tadej Tasič, Ignacijo Biluš JET Vol. 6 (2013)
Issue 2
----------
1 INTRODUCTION
Slovenia is the only transition country that has yet to achieve the targets of the Kyoto Protocol. The biggest problem in reducing greenhouse gases lies in traffic, which accounts for more than 25% of emissions [1][2].
LPG (Liquefied Petroleum Gas) is both a naturally occurring product of the natural gas extraction process and an automatic result of the oil refining production process. LPG-powered vehicles produce up to 20% less CO, 30% less CO2 and around 30% less NOX in comparison with petrol engines, while the exhaust of comparable diesel engine contains 20-fold greater NOX and 120-fold greater particulate emissions. As a low-carbon, low-polluting fossil fuel, it is recognized by governments around the world for the contribution it can make towards improved indoor and outdoor air quality and reduced greenhouse gas emissions [3].
There are almost 1.1 million personal vehicles registered in Slovenia, but less than 3000 of them are powered by LPG. LPG conversions with aftermarket kits are therefore one of the easiest options for Slovenia to reduce greenhouse gas emissions. There are over 700,000 vehicles with petrol engines, most of which are suitable for the LPG conversion.
Aftermarket conversion kits require individual LPG ECU (Engine Control Unit) injection parameters settings for each vehicle. Based on our experiences, this is quite complicated for several vehicles. If the map is not set up correctly, the engine will not run properly, fuel consumption will increase, and, in the worst case scenario, the engine warning light will be activated. Despite the fact that the LPG ECU controls and operates all the components of the LPG conversion system, the injection parameters are still set by the main ECU; the LPG ECU merely converts these parameters for appropriate LPG usage. That means that all of engine’s original sensor data are also taken into account when the engine is powered by LPG. The European On-Board Diagnostic (EOBD) allows monitoring the engine performance and therefore also gives vital information about the correct set up of the LPG system.
2 LPG CONVERSION
Aftermarket conversions to LPG are possible for the majority of the petrol-powered cars. Figure 1 shows the locations of an LPG system’s components after conversion (reservoir with multivalve, filling point, reducer, ECU, injectors, pressure sensor and changeover switch).
JET 1�
EOBD usage in LPG conversions
----------
Figure 1: Components of aftermarket LPG system
Converted engines start on gasoline and, when all of the following prescribed conditions are achieved, automatically switch to LPG:
the engine’s water temperature must be at least 35-40°C, a time delay of 25-30 seconds is necessary for achievement of the lambda probe’s
working temperature, and the engine must be running over the prescribed rpm (1400-1600 rpm).
Some systems are even capable of starting the engine on LPG if the engine temperature is above the prescribed value. Converted engines can be powered with either gasoline or LPG; selecting between them can be easily made with the changeover switch. If there is any LPG in the reservoir, the LPG ECU’s priority is operating with LPG. When the LPG tank is empty, a pressure sensor informs the ECU, which automatically switches back to gasoline fuel injection without stopping the engine. All of the LPG system’s components are controlled via the LPG ECU. It takes the injection data (start and duration of the injection for each cylinder) directly from the engine’s original ECU, adapts them appropriately and sends them to the LPG injectors. To achieve correct quantities of LPG injected in every working point of the engine, several input data are considered: temperature of the reducer, temperature and pressure of the LPG, intake manifold pressure and the engine’s RPMs [4]. However, basic injection parameters are always set by the engine’s main ECU; the LPG ECU adjusts these parameters so that they are appropriate for LPG injection. All of engine’s original sensor data, such as exhaust oxygen sensor, are also considered when running on LPG.
3 OBD LOG
An OBD Log is an innovative small device that plugs directly into the vehicle’s diagnostic socket and records all parameters and errors defined according to the EOBD protocol. It continuously records all relevant data while the vehicle is in use.
Primož Pogorevc, Tadej Tasič, Ignacijo Biluš JET Vol. 6 (2013)
Issue 2
----------
1 INTRODUCTION
Slovenia is the only transition country that has yet to achieve the targets of the Kyoto Protocol. The biggest problem in reducing greenhouse gases lies in traffic, which accounts for more than 25% of emissions [1][2].
LPG (Liquefied Petroleum Gas) is both a naturally occurring product of the natural gas extraction process and an automatic result of the oil refining production process. LPG-powered vehicles produce up to 20% less CO, 30% less CO2 and around 30% less NOX in comparison with petrol engines, while the exhaust of comparable diesel engine contains 20-fold greater NOX and 120-fold greater particulate emissions. As a low-carbon, low-polluting fossil fuel, it is recognized by governments around the world for the contribution it can make towards improved indoor and outdoor air quality and reduced greenhouse gas emissions [3].
There are almost 1.1 million personal vehicles registered in Slovenia, but less than 3000 of them are powered by LPG. LPG conversions with aftermarket kits are therefore one of the easiest options for Slovenia to reduce greenhouse gas emissions. There are over 700,000 vehicles with petrol engines, most of which are suitable for the LPG conversion.
Aftermarket conversion kits require individual LPG ECU (Engine Control Unit) injection parameters settings for each vehicle. Based on our experiences, this is quite complicated for several vehicles. If the map is not set up correctly, the engine will not run properly, fuel consumption will increase, and, in the worst case scenario, the engine warning light will be activated. Despite the fact that the LPG ECU controls and operates all the components of the LPG conversion system, the injection parameters are still set by the main ECU; the LPG ECU merely converts these parameters for appropriate LPG usage. That means that all of engine’s original sensor data are also taken into account when the engine is powered by LPG. The European On-Board Diagnostic (EOBD) allows monitoring the engine performance and therefore also gives vital information about the correct set up of the LPG system.
2 LPG CONVERSION
Aftermarket conversions to LPG are possible for the majority of the petrol-powered cars. Figure 1 shows the locations of an LPG system’s components after conversion (reservoir with multivalve, filling point, reducer, ECU, injectors, pressure sensor and changeover switch).

20 JET
EOBD usage in LPG conversions
----------
displacement: 2,597 ccm, compression ratio: 10.5:1, power: 125 kW at 5000 rpm, torque: 240 Nm at 4500 rpm, transmission: 6-speed, manual, fuel system: multipoint injection, vehicle weight: 1,575 kg, acceleration 0–100 km/h: 9.2 s, maximal speed: 236 km/h, average fuel consumption: 10.8 l/100 km, CO2 emission: 259 g/km.
4.2 OBD Log
The OBD Log was configured to record the following parameters at one-second intervals (Figure 3):
vehicle speed, throttle pedal position, engine rpm, engine load, exhaust oxygen sensor, and slow and fast fuel trims of the main ECU.
Selected parameters were recorded during the two road tests. The first road test was performed to determine the current set up of LPG map, while the second road test provided results of the modified LPG map.
Figure 3: OBD Log configuration
Primož Pogorevc, Tadej Tasič, Ignacijo Biluš JET Vol. 6 (2013)
Issue 2
----------
Technical DATA of the OBD Log:
EOBD compatibility: complete electrical and mechanical, power supply: OBD socket for 12 V vehicles, USB socket for PC, current draw: engine on < 100 mA, engine off < 1 mA, processor: ARM 32-bit Cortex-M3 with 256 KB DRAM, internal memory: 2048 KB, operating temperature range: -40°C to +85°C, and software: IDC3 PC Suite.
The OBD Log, shown in Figure 2, can record all parameters handled by the EOBD protocol, including vehicle speed, engine speed and load, air and coolant temperature, inlet manifold air and fuel pressure, air mass flow rate, battery voltage and all errors handled by the EOBD protocol. It can record one or all parameters with sampling resolution from 1 up to 5 seconds. Its memory allows 90 hours of recording for eight parameters monitored at a five-second sampling rate.
Figure 2: OBD Log
The OBD Log features a cyclical memory; therefore if no error is detected; it writes the new data over the oldest. At the end of the monitoring period, recorded data can be downloaded to a PC using the OBD Log software, and exported into Microsoft Excel for further analysis [5].
4 EXPERIMENT
The experiment was carried out using the OBD Log in a vehicle with an aftermarket conversion LPG kit.
4.1 Vehicle
For the experiment, a Mercedes-Benz CLK 240 was used. It had been converted to run on LPG using the Zavoli Alisei-6S sequential system with AEB 2568 electronics.
Technical data of the vehicle:
number of cylinders: V6, bore and stroke: 89.9 × 68.2 mm,

JET 21
EOBD usage in LPG conversions
----------
displacement: 2,597 ccm, compression ratio: 10.5:1, power: 125 kW at 5000 rpm, torque: 240 Nm at 4500 rpm, transmission: 6-speed, manual, fuel system: multipoint injection, vehicle weight: 1,575 kg, acceleration 0–100 km/h: 9.2 s, maximal speed: 236 km/h, average fuel consumption: 10.8 l/100 km, CO2 emission: 259 g/km.
4.2 OBD Log
The OBD Log was configured to record the following parameters at one-second intervals (Figure 3):
vehicle speed, throttle pedal position, engine rpm, engine load, exhaust oxygen sensor, and slow and fast fuel trims of the main ECU.
Selected parameters were recorded during the two road tests. The first road test was performed to determine the current set up of LPG map, while the second road test provided results of the modified LPG map.
Figure 3: OBD Log configuration
Primož Pogorevc, Tadej Tasič, Ignacijo Biluš JET Vol. 6 (2013)
Issue 2
----------
Technical DATA of the OBD Log:
EOBD compatibility: complete electrical and mechanical, power supply: OBD socket for 12 V vehicles, USB socket for PC, current draw: engine on < 100 mA, engine off < 1 mA, processor: ARM 32-bit Cortex-M3 with 256 KB DRAM, internal memory: 2048 KB, operating temperature range: -40°C to +85°C, and software: IDC3 PC Suite.
The OBD Log, shown in Figure 2, can record all parameters handled by the EOBD protocol, including vehicle speed, engine speed and load, air and coolant temperature, inlet manifold air and fuel pressure, air mass flow rate, battery voltage and all errors handled by the EOBD protocol. It can record one or all parameters with sampling resolution from 1 up to 5 seconds. Its memory allows 90 hours of recording for eight parameters monitored at a five-second sampling rate.
Figure 2: OBD Log
The OBD Log features a cyclical memory; therefore if no error is detected; it writes the new data over the oldest. At the end of the monitoring period, recorded data can be downloaded to a PC using the OBD Log software, and exported into Microsoft Excel for further analysis [5].
4 EXPERIMENT
The experiment was carried out using the OBD Log in a vehicle with an aftermarket conversion LPG kit.
4.1 Vehicle
For the experiment, a Mercedes-Benz CLK 240 was used. It had been converted to run on LPG using the Zavoli Alisei-6S sequential system with AEB 2568 electronics.
Technical data of the vehicle:
number of cylinders: V6, bore and stroke: 89.9 × 68.2 mm,

22 JET
EOBD usage in LPG conversions
----------
Figure 5: Engine rpm’s and load
Figure 6: Slow fuel trims for Banks 1 and 2
Primož Pogorevc, Tadej Tasič, Ignacijo Biluš JET Vol. 6 (2013)
Issue 2
----------
4.3 Road tests
The purpose of the first road test was to check the current setup of the installed LPG system so that necessary map modifications could be made. After the recorded data analysis, the LPG map was changed accordingly. The second road test was carried out to check the modified setup. The duration of both tests was approximately one hour.
5 RESULTS
The results from OBD Log of the first road test are shown in Figures 4 to 9.
5.1 First road test
Figure 4: Throttle position and vehicle speed
JET 2�
EOBD usage in LPG conversions
----------
Figure 5: Engine rpm’s and load
Figure 6: Slow fuel trims for Banks 1 and 2
Primož Pogorevc, Tadej Tasič, Ignacijo Biluš JET Vol. 6 (2013)
Issue 2
----------
4.3 Road tests
The purpose of the first road test was to check the current setup of the installed LPG system so that necessary map modifications could be made. After the recorded data analysis, the LPG map was changed accordingly. The second road test was carried out to check the modified setup. The duration of both tests was approximately one hour.
5 RESULTS
The results from OBD Log of the first road test are shown in Figures 4 to 9.
5.1 First road test
Figure 4: Throttle position and vehicle speed
2� JET
EOBD usage in LPG conversions
----------
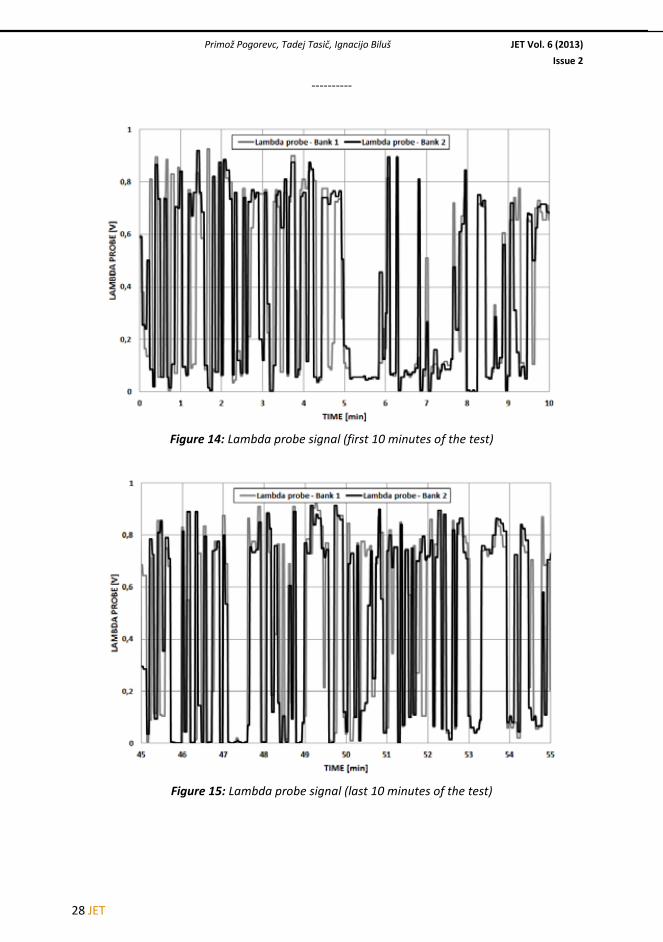
Figure 9: Lambda probe signal (last 10 minutes of the test)
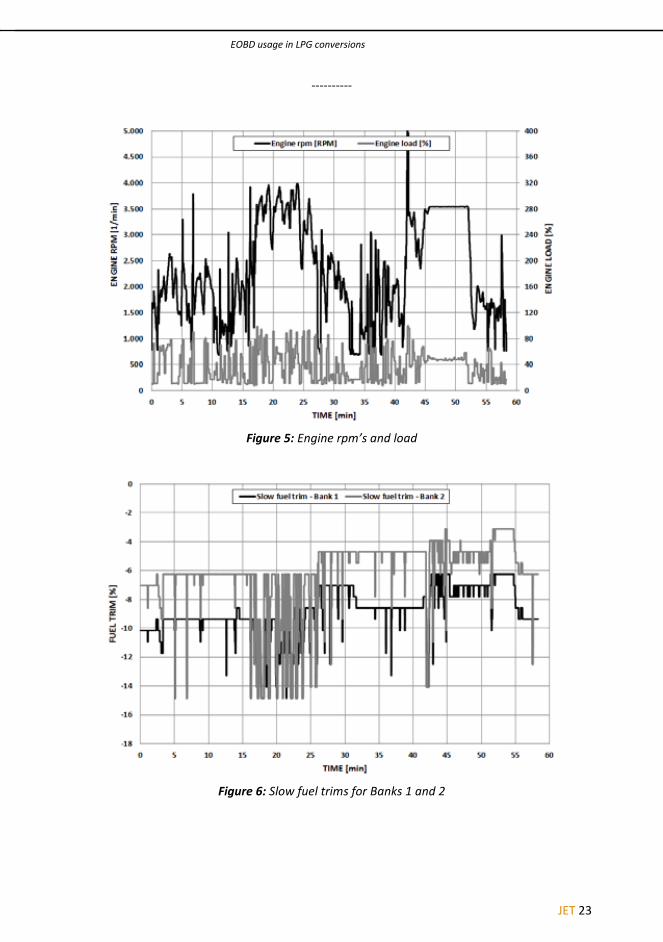
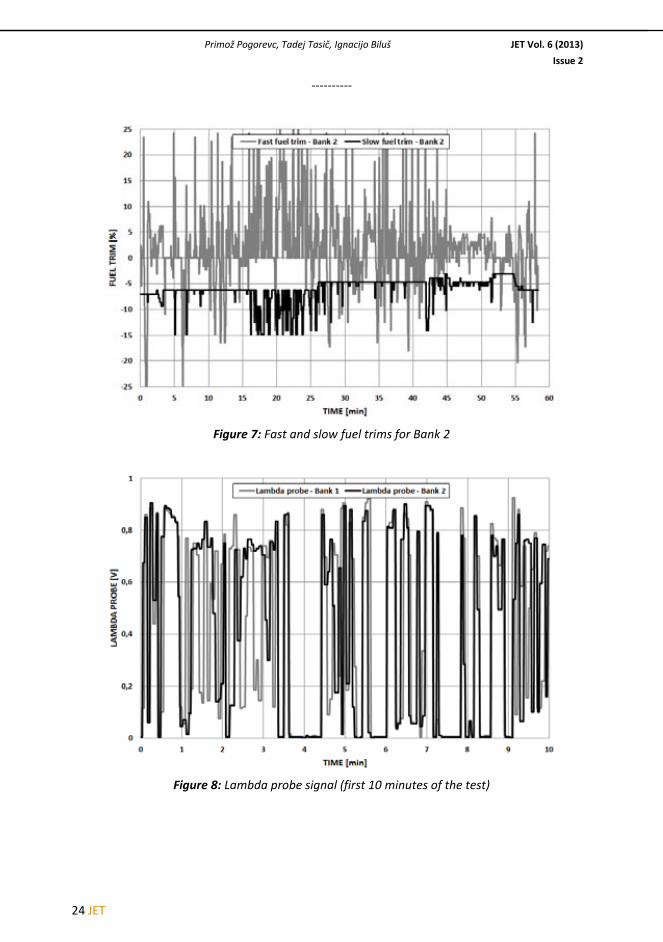
Figure 4 shows vehicle velocity and throttle position in Road Test 1. The engine was powered by LPG throughout the test. The average velocity was 83.82 km/h with the average throttle position at 12.95%. Between the 45th and 52nd minutes of the test, the vehicle’s cruise control was switched on at 142 km/h. During the test, the average load of the engine was 36.46% with an average of 2310 rpm. Diagrams are shown in Figure 5. Fuel trims of the main ECU are shown in Figures 6 and 7. Because the CLK 240 has a V6 engine, there are two fuel trims, one for each side of the engine: Banks 1 and 2. Figure 6 shows slow fuel trims or long-term fuel regulation for both banks, while Figure 7 shows slow and fast fuel trims or short-term fuel regulation for Bank 2 (left side of the engine). The results show that the LPG map is too high for both banks; therefore, the main ECU reduced slow fuel trims to an average of 8.9% for Bank 1 and -6.2% for Bank 2. Slow fuel trims changed a bit during the test, but the values stayed on the negative side at the end of the test. Slow fuel trims for Bank 1 changed from -10.2 to -9.3 %, and for Bank 2 they changed from -7.0 to -6.3% during the test. If the LPG map was set up correctly, the long-term fuel correction should be around 0%. Fast fuel trims, which define value of slow fuel trims, are controlled with the signal from the lambda probes. Output voltages of both lambda probes are shown in Figures 8 and 9. Figure 8 presents the first ten minutes, while in Figure 9 the last ten minutes of the road test can be seen.
Based on the results, the LPG map was modified accordingly. The values in the map were lowered by 10%.
5.2 Second road test
The results from OBD Log of the second road test with modified LPG map are shown in Figures 10 to 15.
Primož Pogorevc, Tadej Tasič, Ignacijo Biluš JET Vol. 6 (2013)
Issue 2
----------
Figure 7: Fast and slow fuel trims for Bank 2
Figure 8: Lambda probe signal (first 10 minutes of the test)

JET 2�
EOBD usage in LPG conversions
----------
Figure 9: Lambda probe signal (last 10 minutes of the test)
Figure 4 shows vehicle velocity and throttle position in Road Test 1. The engine was powered by LPG throughout the test. The average velocity was 83.82 km/h with the average throttle position at 12.95%. Between the 45th and 52nd minutes of the test, the vehicle’s cruise control was switched on at 142 km/h. During the test, the average load of the engine was 36.46% with an average of 2310 rpm. Diagrams are shown in Figure 5. Fuel trims of the main ECU are shown in Figures 6 and 7. Because the CLK 240 has a V6 engine, there are two fuel trims, one for each side of the engine: Banks 1 and 2. Figure 6 shows slow fuel trims or long-term fuel regulation for both banks, while Figure 7 shows slow and fast fuel trims or short-term fuel regulation for Bank 2 (left side of the engine). The results show that the LPG map is too high for both banks; therefore, the main ECU reduced slow fuel trims to an average of 8.9% for Bank 1 and -6.2% for Bank 2. Slow fuel trims changed a bit during the test, but the values stayed on the negative side at the end of the test. Slow fuel trims for Bank 1 changed from -10.2 to -9.3 %, and for Bank 2 they changed from -7.0 to -6.3% during the test. If the LPG map was set up correctly, the long-term fuel correction should be around 0%. Fast fuel trims, which define value of slow fuel trims, are controlled with the signal from the lambda probes. Output voltages of both lambda probes are shown in Figures 8 and 9. Figure 8 presents the first ten minutes, while in Figure 9 the last ten minutes of the road test can be seen.
Based on the results, the LPG map was modified accordingly. The values in the map were lowered by 10%.
5.2 Second road test
The results from OBD Log of the second road test with modified LPG map are shown in Figures 10 to 15.
Primož Pogorevc, Tadej Tasič, Ignacijo Biluš JET Vol. 6 (2013)
Issue 2
----------
Figure 7: Fast and slow fuel trims for Bank 2
Figure 8: Lambda probe signal (first 10 minutes of the test)
2� JET
EOBD usage in LPG conversions
----------
Figure 12: Engine rpm’s and load
Figure 13: Fast and slow fuel trims for Bank 2
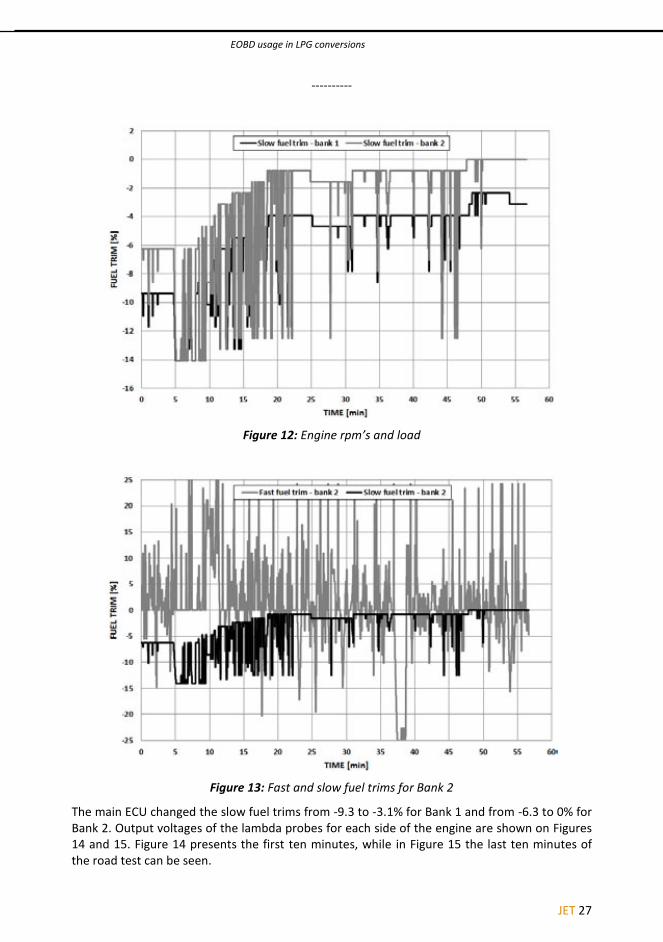
The main ECU changed the slow fuel trims from -9.3 to -3.1% for Bank 1 and from -6.3 to 0% for Bank 2. Output voltages of the lambda probes for each side of the engine are shown on Figures 14 and 15. Figure 14 presents the first ten minutes, while in Figure 15 the last ten minutes of the road test can be seen.
Primož Pogorevc, Tadej Tasič, Ignacijo Biluš JET Vol. 6 (2013)
Issue 2
----------
Figure 10: Throttle position and vehicle speed
Figure 11: Engine rpm’s and load
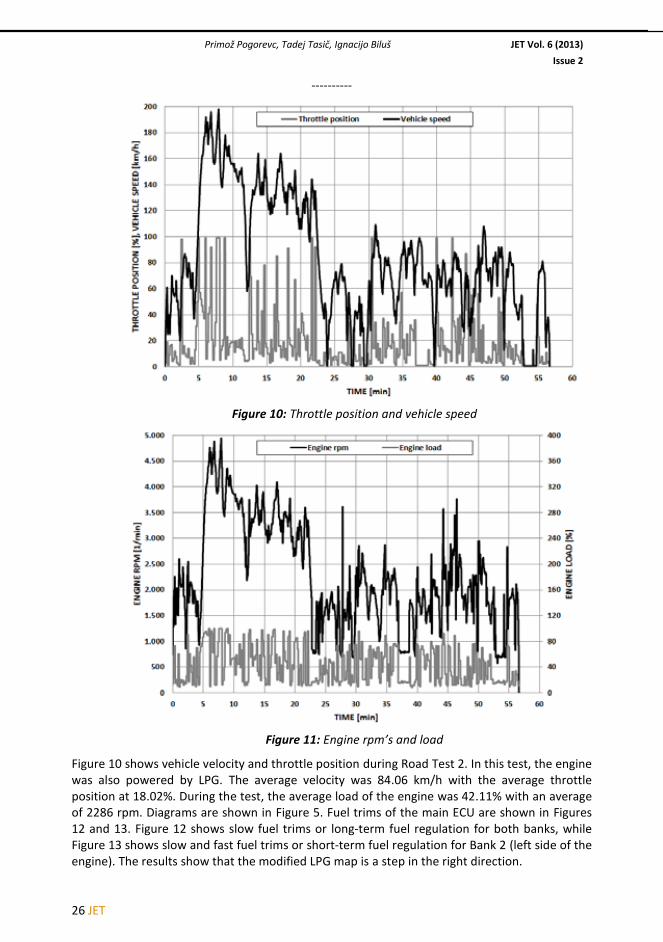
Figure 10 shows vehicle velocity and throttle position during Road Test 2. In this test, the engine was also powered by LPG. The average velocity was 84.06 km/h with the average throttle position at 18.02%. During the test, the average load of the engine was 42.11% with an average of 2286 rpm. Diagrams are shown in Figure 5. Fuel trims of the main ECU are shown in Figures 12 and 13. Figure 12 shows slow fuel trims or long-term fuel regulation for both banks, while Figure 13 shows slow and fast fuel trims or short-term fuel regulation for Bank 2 (left side of the engine). The results show that the modified LPG map is a step in the right direction.
JET 2�
EOBD usage in LPG conversions
----------
Figure 12: Engine rpm’s and load
Figure 13: Fast and slow fuel trims for Bank 2
The main ECU changed the slow fuel trims from -9.3 to -3.1% for Bank 1 and from -6.3 to 0% for Bank 2. Output voltages of the lambda probes for each side of the engine are shown on Figures 14 and 15. Figure 14 presents the first ten minutes, while in Figure 15 the last ten minutes of the road test can be seen.
Primož Pogorevc, Tadej Tasič, Ignacijo Biluš JET Vol. 6 (2013)
Issue 2
----------
Figure 10: Throttle position and vehicle speed
Figure 11: Engine rpm’s and load
Figure 10 shows vehicle velocity and throttle position during Road Test 2. In this test, the engine was also powered by LPG. The average velocity was 84.06 km/h with the average throttle position at 18.02%. During the test, the average load of the engine was 42.11% with an average of 2286 rpm. Diagrams are shown in Figure 5. Fuel trims of the main ECU are shown in Figures 12 and 13. Figure 12 shows slow fuel trims or long-term fuel regulation for both banks, while Figure 13 shows slow and fast fuel trims or short-term fuel regulation for Bank 2 (left side of the engine). The results show that the modified LPG map is a step in the right direction.
2� JET
EOBD usage in LPG conversions
----------
6 CONCLUSIONS
European On-Board Diagnostics (EOBD) was introduced, in line with European Directive 98/69/EC, to monitor and reduce emissions from cars. It can monitor and store information from the engine’s sensors throughout the car. Sensor values outside an acceptable range trigger a DTC or Diagnostic Trouble Code. Diagnostic tools can read and interpret these codes, and view the live sensor output.
Aftermarket conversions of petrol-powered cars to run on LPG are extremely popular throughout the world. In comparison with the leading two transport fuels, LPG has two main advantages: lower exhaust emissions and a lower price. The optimal setup of the map on the LPG ECU is crucial for the proper engine performance and its characteristics.
This paper shows that EOBD can also be extremely useful in LPG conversions of petrol-powered cars. Because the main ECU of the engine still has the overall control over the injection characteristics when the engine is switched to LPG, the engine sensors (such as the lambda probe) give vital information about the setup of the LPG system. The OBD Log allows monitoring and recording of sensors’ output and data directly from the ECU, such as fuel trims and DTC, while the car is being driven. Based on the recorded data analysis, the LPG map can be modified accordingly. The results presented show that the theory also works in practice. The modified LPG map is reflected in the correction of slow fuel trims of the main ECU. Both long-term regulations moved in the right direction, and while the fuel trim for Bank 2 moved to the ideal 0%, the map for Bank 1 needs another reduction of approximately 5%.
References
[1] J. Stritih: Podnebno-energetske zaveze EU in Slovenije po Koebenhavnu, 1. „Podnebni posvet” v okviru projekta „Slovenija znižuje CO2“, 2010, http://www.slovenija-co2.si
[2] Ministry of the environment and spatial planning: Državni načrt razdelitve emisijskih kuponov za obdobje od 2008 do 2012, 2006, http://www.mop.gov.si
[3] P. Pogorevc, T. Tasič: Plin kot pogonsko gorivo vozil, Environmental Management, 2010, p. 16-19.
[4] R. Ramchandra Saraf, S.Thipse, K. Saxena: Case study on Endurance test of LPG Automotive Engine, 2004, SAE 2008-01-2756
[5] TEXA for automotive professionals: OBD Log data sheet, 2010, http://www.texa.com
Nomenclature
EOBD European On-Board Diagnostic
LPG Liquefied Petroleum Gas
ECU Engine Control Unit
rpm revolutions per minute
Primož Pogorevc, Tadej Tasič, Ignacijo Biluš JET Vol. 6 (2013)
Issue 2
----------
Figure 14: Lambda probe signal (first 10 minutes of the test)
Figure 15: Lambda probe signal (last 10 minutes of the test)
JET 2�
EOBD usage in LPG conversions
----------
6 CONCLUSIONS
European On-Board Diagnostics (EOBD) was introduced, in line with European Directive 98/69/EC, to monitor and reduce emissions from cars. It can monitor and store information from the engine’s sensors throughout the car. Sensor values outside an acceptable range trigger a DTC or Diagnostic Trouble Code. Diagnostic tools can read and interpret these codes, and view the live sensor output.
Aftermarket conversions of petrol-powered cars to run on LPG are extremely popular throughout the world. In comparison with the leading two transport fuels, LPG has two main advantages: lower exhaust emissions and a lower price. The optimal setup of the map on the LPG ECU is crucial for the proper engine performance and its characteristics.
This paper shows that EOBD can also be extremely useful in LPG conversions of petrol-powered cars. Because the main ECU of the engine still has the overall control over the injection characteristics when the engine is switched to LPG, the engine sensors (such as the lambda probe) give vital information about the setup of the LPG system. The OBD Log allows monitoring and recording of sensors’ output and data directly from the ECU, such as fuel trims and DTC, while the car is being driven. Based on the recorded data analysis, the LPG map can be modified accordingly. The results presented show that the theory also works in practice. The modified LPG map is reflected in the correction of slow fuel trims of the main ECU. Both long-term regulations moved in the right direction, and while the fuel trim for Bank 2 moved to the ideal 0%, the map for Bank 1 needs another reduction of approximately 5%.
References
[1] J. Stritih: Podnebno-energetske zaveze EU in Slovenije po Koebenhavnu, 1. „Podnebni posvet” v okviru projekta „Slovenija znižuje CO2“, 2010, http://www.slovenija-co2.si
[2] Ministry of the environment and spatial planning: Državni načrt razdelitve emisijskih kuponov za obdobje od 2008 do 2012, 2006, http://www.mop.gov.si
[3] P. Pogorevc, T. Tasič: Plin kot pogonsko gorivo vozil, Environmental Management, 2010, p. 16-19.
[4] R. Ramchandra Saraf, S.Thipse, K. Saxena: Case study on Endurance test of LPG Automotive Engine, 2004, SAE 2008-01-2756
[5] TEXA for automotive professionals: OBD Log data sheet, 2010, http://www.texa.com
Nomenclature
EOBD European On-Board Diagnostic
LPG Liquefied Petroleum Gas
ECU Engine Control Unit
rpm revolutions per minute
Primož Pogorevc, Tadej Tasič, Ignacijo Biluš JET Vol. 6 (2013)
Issue 2
----------
Figure 14: Lambda probe signal (first 10 minutes of the test)
Figure 15: Lambda probe signal (last 10 minutes of the test)

�0 JET
JET Volume 6 (2013), p.p. 31 - 48
Issue 2, May 2013
http://www.fe.um.si/en/jet.html
USING STEAM AS AN ALTERNATIVE MOTIVE FLUID IN THE EXISTING TURBINE EJECTOR SYSTEM OF THE LJUBLJANA
DISTRICT HEATING PLANT
MOŽNOSTI NAPAJANJA OBSTOJEČEGA EJEKTORSKEGA SISTEMA
TURBOAGREGATA V TOPLARNI LJUBLJANA Z ALTERNATIVNO
POGONSKO PARO
Dušan Strušnik, Jurij Avsec
Keywords: analysis, ejector, heat flow, oscillation, reconstruction, reliability of production, pump system, motive steam, turbine condenser
Abstract In this paper, we will examine the possibility of using steam as an alternative motive fluid in the existing turbine ejector system of the Ljubljana district heating plant. As alternative motive fluid, steam is of lesser quality and has constant pressure. The ejector pump system will be adjusted to new circumstances. The purpose of the present work is to rationalise and increase the reliability of ejector system operation at the lowest possible investment costs. A computer model of an ejector model will be designed using the measurements and analyses of the existing system. On the basis of the results obtained, the changes required for the reliable operation of the system using steam as an alternative fluid will be defined and the appropriate solutions will be indicated.
Corresponding author: Dušan Strušnik, Termoelektrarna Toplarna Ljubljana, Toplarniška 19, 1000 Ljubljana, Slovenija. E-mail address: [email protected].
Primož Pogorevc, Tadej Tasič, Ignacijo Biluš JET Vol. 6 (2013)
Issue 2
----------

JET �1
JET Volume 6 (2013), p.p. 31 - 48
Issue 2, May 2013
http://www.fe.um.si/en/jet.html
USING STEAM AS AN ALTERNATIVE MOTIVE FLUID IN THE EXISTING TURBINE EJECTOR SYSTEM OF THE LJUBLJANA
DISTRICT HEATING PLANT
MOŽNOSTI NAPAJANJA OBSTOJEČEGA EJEKTORSKEGA SISTEMA
TURBOAGREGATA V TOPLARNI LJUBLJANA Z ALTERNATIVNO
POGONSKO PARO
Dušan Strušnik, Jurij Avsec
Keywords: analysis, ejector, heat flow, oscillation, reconstruction, reliability of production, pump system, motive steam, turbine condenser
Abstract In this paper, we will examine the possibility of using steam as an alternative motive fluid in the existing turbine ejector system of the Ljubljana district heating plant. As alternative motive fluid, steam is of lesser quality and has constant pressure. The ejector pump system will be adjusted to new circumstances. The purpose of the present work is to rationalise and increase the reliability of ejector system operation at the lowest possible investment costs. A computer model of an ejector model will be designed using the measurements and analyses of the existing system. On the basis of the results obtained, the changes required for the reliable operation of the system using steam as an alternative fluid will be defined and the appropriate solutions will be indicated.
Corresponding author: Dušan Strušnik, Termoelektrarna Toplarna Ljubljana, Toplarniška 19, 1000 Ljubljana, Slovenija. E-mail address: [email protected].
Primož Pogorevc, Tadej Tasič, Ignacijo Biluš JET Vol. 6 (2013)
Issue 2
----------

�2 JET
Using steam as an alternative motive fluid in the existing turbine ejector system of the Ljubljana district heating plant
----------
It has been proved that the alternative motive steam can be used, specifically that of the third regulated steam extraction as a result of the constant pressure. Fig. 2 shows a variation in relative pressure ranging from 7.83 bar to 7.88 bar, which means oscillation of absolute pressure from 8.83 bar to 8.88 bar, to be used in the analysis. It was established that the steam of the third steam extraction has a enormous advantage over the existing motive steam, i.e. lower operating pressure oscillation, uninterrupted constant availability of steam even in the event of a boiler failure, no additional need for steam reduction and consequently no need for reducing valves. The steam from the third extraction expands in the turbine, thus producing useful work. A drawback of the alternative motive steam is its poorer quality requiring a detailed analysis of the pump system.
Figure 1: Pressure oscillation of the steam generated in the boiler, TE-TOL [8]
Dušan Strušnik, Jurij Avsec JET Vol. 6 (2013)
Issue 2
----------
Povzetek V članku bomo preučili možnosti napajanja obstoječega ejektorskega sistema turboagregata v toplarni Ljubljana z alternativno pogonsko paro. Alternativna pogonska para je slabše kvalitete in konstantnega tlaka. Ejektorski črpalni sistem bomo prilagodili novim razmeram. Namen naloge je racionalizacija in povečanje zanesljivosti delovanja ejektorskega sistema s čim nižjimi investicijskim stroški. S pomočjo opravljenih meritev in matematične analize obstoječega sistema, bomo izdelali računalniški program modela ejektorja. S pomočjo pridobljenih rezultatov, bomo določili potrebne spremembe za zanesljivo delovanje alternativnega sistema z alternativno pogonsko paro in podali ustrezne rešitve.
1 INTRODUCTION
In view of the strategic requirement for a rational use of fuels and more reliable operation of ejector systems, we are forced to seek alternative ideas. Some unexpected failures have occurred in the turbine operation as a consequence of the ejector system malfunctioning. The system was designed to remove any non-condensable gases from the turbine condenser (air). As a result of the pumping, a stable operating vacuum is maintained in the turbine condenser system. Due to pressure oscillation of the motive steam of the ejector pump system supplied via the reducing valves from a boiler, disruptions occur in maintaining proper condenser pressure. The primary cause of motive steam pressure oscillation is poor manual steam pressure control, which changes following the change in the boiler steam pressure. A more suitable source of ejector motive steam has been proven to be the steam generated from the third turbine extraction. The extraction is controlled, and pressure oscillation disruptions should not cause any substantial obstacles. In addition to the constant pressure of the motive steam, another advantage of the new system is that the motive steam expands in the turbine, thus producing useful work. The ejector motive steam of the existing system is generated by damping the high pressure boiler steam without any work being produced.
2 ANALYSIS OF EXISTING MOTIVE STEAM AND ADEQUACY ASSESSMENT OF ALTERNATIVE MOTIVE STEAM
The existing ejector system is supplied with steam generated from a boiler (92 bar and 512°C), reduced to 14 bar by means of manual reducing valves prior to entering the ejector system (Fig. 3). As a result of pressure oscillation in the boiler and poor pressure control of the ejector motive steam, changes in the ejector motive steam occur, leading to fluctuations in the ejector system flow. The fluctuation of the flow rate of gases leads to a pressure rise in the turbine condenser, causing lower turbine efficiency. Fig. 1 illustrates the boiler steam pressure oscillation (for a period of five days). The variations of pressure range from 87 bar to 96 bar. The boiler steam pressure variation leads to the variation of ejector motive steam pressure from 9 bar to 20 bar. The flow rate of gases lowers at the ejector motive steam pressure of 9 bar, causing a pressure rise in the condenser in long-term operation and consequently turbine failure. At the ejector motive steam pressure of 20 bar, the steam consumption for the system operation unnecessarily increases, resulting in reduced pump system efficiency.

JET ��
Using steam as an alternative motive fluid in the existing turbine ejector system of the Ljubljana district heating plant
----------
It has been proved that the alternative motive steam can be used, specifically that of the third regulated steam extraction as a result of the constant pressure. Fig. 2 shows a variation in relative pressure ranging from 7.83 bar to 7.88 bar, which means oscillation of absolute pressure from 8.83 bar to 8.88 bar, to be used in the analysis. It was established that the steam of the third steam extraction has a enormous advantage over the existing motive steam, i.e. lower operating pressure oscillation, uninterrupted constant availability of steam even in the event of a boiler failure, no additional need for steam reduction and consequently no need for reducing valves. The steam from the third extraction expands in the turbine, thus producing useful work. A drawback of the alternative motive steam is its poorer quality requiring a detailed analysis of the pump system.
Figure 1: Pressure oscillation of the steam generated in the boiler, TE-TOL [8]
Dušan Strušnik, Jurij Avsec JET Vol. 6 (2013)
Issue 2
----------
Povzetek V članku bomo preučili možnosti napajanja obstoječega ejektorskega sistema turboagregata v toplarni Ljubljana z alternativno pogonsko paro. Alternativna pogonska para je slabše kvalitete in konstantnega tlaka. Ejektorski črpalni sistem bomo prilagodili novim razmeram. Namen naloge je racionalizacija in povečanje zanesljivosti delovanja ejektorskega sistema s čim nižjimi investicijskim stroški. S pomočjo opravljenih meritev in matematične analize obstoječega sistema, bomo izdelali računalniški program modela ejektorja. S pomočjo pridobljenih rezultatov, bomo določili potrebne spremembe za zanesljivo delovanje alternativnega sistema z alternativno pogonsko paro in podali ustrezne rešitve.
1 INTRODUCTION
In view of the strategic requirement for a rational use of fuels and more reliable operation of ejector systems, we are forced to seek alternative ideas. Some unexpected failures have occurred in the turbine operation as a consequence of the ejector system malfunctioning. The system was designed to remove any non-condensable gases from the turbine condenser (air). As a result of the pumping, a stable operating vacuum is maintained in the turbine condenser system. Due to pressure oscillation of the motive steam of the ejector pump system supplied via the reducing valves from a boiler, disruptions occur in maintaining proper condenser pressure. The primary cause of motive steam pressure oscillation is poor manual steam pressure control, which changes following the change in the boiler steam pressure. A more suitable source of ejector motive steam has been proven to be the steam generated from the third turbine extraction. The extraction is controlled, and pressure oscillation disruptions should not cause any substantial obstacles. In addition to the constant pressure of the motive steam, another advantage of the new system is that the motive steam expands in the turbine, thus producing useful work. The ejector motive steam of the existing system is generated by damping the high pressure boiler steam without any work being produced.
2 ANALYSIS OF EXISTING MOTIVE STEAM AND ADEQUACY ASSESSMENT OF ALTERNATIVE MOTIVE STEAM
The existing ejector system is supplied with steam generated from a boiler (92 bar and 512°C), reduced to 14 bar by means of manual reducing valves prior to entering the ejector system (Fig. 3). As a result of pressure oscillation in the boiler and poor pressure control of the ejector motive steam, changes in the ejector motive steam occur, leading to fluctuations in the ejector system flow. The fluctuation of the flow rate of gases leads to a pressure rise in the turbine condenser, causing lower turbine efficiency. Fig. 1 illustrates the boiler steam pressure oscillation (for a period of five days). The variations of pressure range from 87 bar to 96 bar. The boiler steam pressure variation leads to the variation of ejector motive steam pressure from 9 bar to 20 bar. The flow rate of gases lowers at the ejector motive steam pressure of 9 bar, causing a pressure rise in the condenser in long-term operation and consequently turbine failure. At the ejector motive steam pressure of 20 bar, the steam consumption for the system operation unnecessarily increases, resulting in reduced pump system efficiency.

�� JET
Using steam as an alternative motive fluid in the existing turbine ejector system of the Ljubljana district heating plant
----------
Figure 3: Turbine ejector system and the measurement results, Strušnik [6]
4 EJECTOR SYSTEM MATHEMATICAL ANALYSIS
The motive steam enters the ejector at point 0 and flows through the Laval nozzle, where the steam expands at up to supersonic speed. In the mixing chamber x, the expanded motive steam sucks gases from the turbine condenser 4, where they mix with each other from point 1 to point 2. The mixture of gases enters a diffuser, where kinetic energy of a gas transforms into pressure energy and at point 3, the gases exit at a higher pressure and a lower speed (Fig. 4).
Figure 4: Ejector model and Mollier h-s diagram, Strušnik [6]
Dušan Strušnik, Jurij Avsec JET Vol. 6 (2013)
Issue 2
----------
Figure 2: Pressure oscillation of the third steam extraction, TE-TOL [8]
3 DESCRIPTION OF EJECTOR SYSTEM OPERATION
Ejectors are devices designed to use the pressure energy of a working fluid for the transport of another working fluid, whereby no mechanical work is supplied or recovered. The working fluid may be liquid, vapour or gas. It is used as a vacuum compressor or a vacuum pump in order to produce vacuum in steam turbine systems, in refrigeration systems, for bulk material transport etc. The actual efficiency is low, ranging from 0.1 to 0.35. The process is non-reversible due to mixing of two flows.
The suction pipe of an ejector pump system is connected to the coldest spot of the turbine condenser, where there is remarkably little steam due to sub-cooling, and therefore almost pure air is sucked out. A steam ejector is a two-stage flow-type compressor. Compression is achieved through fresh steam flow energy. In our case, the device comprises two stages. In the primary stage, i.e. the condensation stage, the sucked out air is compressed at a pressure of approximately 0.25 bar. A mixture of the sucked out gases and working steam from the primary ejector is led to the primary cooler. Most of the steam is condensed here and returned to the condenser through a special barometer loop. The mixture remaining in the primary cooler after the condensation is sucked out at the steam pressure of the secondary (atmospheric) stage and compressed to the pressure slightly higher than the atmospheric pressure, then led, together with the steam from the second stage, to the secondary cooler. The steam is also condensed in this cooler. The condensate passes through the condensate pot to the turbine condenser and the residual extracted air to the atmosphere. Fig. 3 illustrates the ejector system operating principle and the measurements of the existing system.

JET ��
Using steam as an alternative motive fluid in the existing turbine ejector system of the Ljubljana district heating plant
----------
Figure 3: Turbine ejector system and the measurement results, Strušnik [6]
4 EJECTOR SYSTEM MATHEMATICAL ANALYSIS
The motive steam enters the ejector at point 0 and flows through the Laval nozzle, where the steam expands at up to supersonic speed. In the mixing chamber x, the expanded motive steam sucks gases from the turbine condenser 4, where they mix with each other from point 1 to point 2. The mixture of gases enters a diffuser, where kinetic energy of a gas transforms into pressure energy and at point 3, the gases exit at a higher pressure and a lower speed (Fig. 4).
Figure 4: Ejector model and Mollier h-s diagram, Strušnik [6]
Dušan Strušnik, Jurij Avsec JET Vol. 6 (2013)
Issue 2
----------
Figure 2: Pressure oscillation of the third steam extraction, TE-TOL [8]
3 DESCRIPTION OF EJECTOR SYSTEM OPERATION
Ejectors are devices designed to use the pressure energy of a working fluid for the transport of another working fluid, whereby no mechanical work is supplied or recovered. The working fluid may be liquid, vapour or gas. It is used as a vacuum compressor or a vacuum pump in order to produce vacuum in steam turbine systems, in refrigeration systems, for bulk material transport etc. The actual efficiency is low, ranging from 0.1 to 0.35. The process is non-reversible due to mixing of two flows.
The suction pipe of an ejector pump system is connected to the coldest spot of the turbine condenser, where there is remarkably little steam due to sub-cooling, and therefore almost pure air is sucked out. A steam ejector is a two-stage flow-type compressor. Compression is achieved through fresh steam flow energy. In our case, the device comprises two stages. In the primary stage, i.e. the condensation stage, the sucked out air is compressed at a pressure of approximately 0.25 bar. A mixture of the sucked out gases and working steam from the primary ejector is led to the primary cooler. Most of the steam is condensed here and returned to the condenser through a special barometer loop. The mixture remaining in the primary cooler after the condensation is sucked out at the steam pressure of the secondary (atmospheric) stage and compressed to the pressure slightly higher than the atmospheric pressure, then led, together with the steam from the second stage, to the secondary cooler. The steam is also condensed in this cooler. The condensate passes through the condensate pot to the turbine condenser and the residual extracted air to the atmosphere. Fig. 3 illustrates the ejector system operating principle and the measurements of the existing system.

�� JET
Using steam as an alternative motive fluid in the existing turbine ejector system of the Ljubljana district heating plant
----------
sss hhc 101 2 (4.3)
where sc1 - isentropic nozzle gas velocity.
4.2 Conditions in the mixing zone
The flow of the motive gas entering through the Laval nozzle and of the pumped out gas is mixed in the mixing zone. The thermodynamic state is described by means of the following equations:
Mass balance: 2
2240 v
cAmm
(4.4)
where 4m - mass flow of gas pumped out,
A2 - inlet cross sectional area of the diffuser,
c2 - inlet diffuser speed of gases,
v2 - inlet diffuser specific volume of gases.
Momentum: 222402410 ApcmmApcm (4.5)
where c1 - exhaust nozzle gas speed,
p4 - pumped gas pressure,
p2 - gas pressure at the inlet to the diffuser.
Energy balance:
2
22
2404400c
hmmhmhm (4.6)
where h4 - specific enthalpy of pumped gas,
h2 - specific enthalpy at the inlet to the diffuser.
A constant pressure in the mixing chamber p4=p1 is taken into consideration in the calculation.
4.3 Conditions in the diffuser
Energy balance: 3
32
2 2h
ch (4.7)
where h3 - specific enthalpy at the outlet from the diffuser.
By introducing isentropic efficiency of a diffuser we obtain:
2323 hhhh d (4.8)
Dušan Strušnik, Jurij Avsec JET Vol. 6 (2013)
Issue 2
----------
The mathematical analysis is based on the facts of conservation of momentum, mass and energy balances in each part of the ejector (Laval nozzle, mixing chamber and diffuser)
The following facts are taken into consideration in the calculation:
• There is no heat transfer in the transformations in the Laval nozzle,
• The motive stream expands in the Laval nozzle from the initial state of p0 up to pressure in mixing chamber px,
• We assume that pressure px in the mixing chamber equals the gas suction pressure p4,
• The gases in the mixing chamber mix with each other and are regarded below as an ideal gas,
• Potential energy is negligibly low and is not taken into consideration,
• Outlet speed from the diffuser is extremely low and is therefore neglected.
4.1 Conditions in the Laval nozzle
It is assumed in the calculation of the mass flow through the Laval nozzle that the motive fluid is an ideal gas. The mass flow equals:
11
0
0
12
R
Am L0 T
p (4.1)
where 0m - motive gas mass flow rate,
R - gas constant,
AL - cross section of the Laval nozzle,
p0 - inlet gas pressure,
T0 - inlet gas temperature,
- ratio of specific heats of gas.
The Laval nozzle isentropic efficiency is defined as:
97,010
10
s
s hh
hh (4.2)
where s - isentropic efficiency of a nozzle,
h0 - specific enthalpy of inlet motive gas,
h1 - specific enthalpy of nozzle expansion,
h1s - specific enthalpy of isentropic nozzle expansion.
Speed at exit from the nozzle is calculated as:

JET ��
Using steam as an alternative motive fluid in the existing turbine ejector system of the Ljubljana district heating plant
----------
sss hhc 101 2 (4.3)
where sc1 - isentropic nozzle gas velocity.
4.2 Conditions in the mixing zone
The flow of the motive gas entering through the Laval nozzle and of the pumped out gas is mixed in the mixing zone. The thermodynamic state is described by means of the following equations:
Mass balance: 2
2240 v
cAmm
(4.4)
where 4m - mass flow of gas pumped out,
A2 - inlet cross sectional area of the diffuser,
c2 - inlet diffuser speed of gases,
v2 - inlet diffuser specific volume of gases.
Momentum: 222402410 ApcmmApcm (4.5)
where c1 - exhaust nozzle gas speed,
p4 - pumped gas pressure,
p2 - gas pressure at the inlet to the diffuser.
Energy balance:
2
22
2404400c
hmmhmhm (4.6)
where h4 - specific enthalpy of pumped gas,
h2 - specific enthalpy at the inlet to the diffuser.
A constant pressure in the mixing chamber p4=p1 is taken into consideration in the calculation.
4.3 Conditions in the diffuser
Energy balance: 3
32
2 2h
ch (4.7)
where h3 - specific enthalpy at the outlet from the diffuser.
By introducing isentropic efficiency of a diffuser we obtain:
2323 hhhh d (4.8)
Dušan Strušnik, Jurij Avsec JET Vol. 6 (2013)
Issue 2
----------
The mathematical analysis is based on the facts of conservation of momentum, mass and energy balances in each part of the ejector (Laval nozzle, mixing chamber and diffuser)
The following facts are taken into consideration in the calculation:
• There is no heat transfer in the transformations in the Laval nozzle,
• The motive stream expands in the Laval nozzle from the initial state of p0 up to pressure in mixing chamber px,
• We assume that pressure px in the mixing chamber equals the gas suction pressure p4,
• The gases in the mixing chamber mix with each other and are regarded below as an ideal gas,
• Potential energy is negligibly low and is not taken into consideration,
• Outlet speed from the diffuser is extremely low and is therefore neglected.
4.1 Conditions in the Laval nozzle
It is assumed in the calculation of the mass flow through the Laval nozzle that the motive fluid is an ideal gas. The mass flow equals:
11
0
0
12
R
Am L0 T
p (4.1)
where 0m - motive gas mass flow rate,
R - gas constant,
AL - cross section of the Laval nozzle,
p0 - inlet gas pressure,
T0 - inlet gas temperature,
- ratio of specific heats of gas.
The Laval nozzle isentropic efficiency is defined as:
97,010
10
s
s hh
hh (4.2)
where s - isentropic efficiency of a nozzle,
h0 - specific enthalpy of inlet motive gas,
h1 - specific enthalpy of nozzle expansion,
h1s - specific enthalpy of isentropic nozzle expansion.
Speed at exit from the nozzle is calculated as:

�� JET
Using steam as an alternative motive fluid in the existing turbine ejector system of the Ljubljana district heating plant
----------
From Equation (4.15) we express c2 and insert it into Equation (4.5) to obtain, after a transformation, a quadratic equation for the calculation of the flow rate of gases 4m , whose solution is:
4
22222224100
204
240
20400
4 22
111
)(4)()(
h
MpAApApcmhmhhhmhhm
m
(4.16)
4.5 Calculation of flow rate of non-condensable and condensable phase of primary and secondary ejector
In the calculation of the phase quantity of the pumped gases of the primary ejector, the proportion of a mixture of the primary ejector ( 1,4m ) is taken into account on the basis of
experience, i.e. 75% of non-condensable phase and 25% of condensable phase, whereby 25,021,4 OHx and 75,01,4 airx .
It is necessary to calculate the phase ratio to be sucked into the secondary ejector. In view of the fact that the Laval nozzle of the secondary ejector has a larger diameter than the primary ejector, the secondary ejector pumps a higher quantity of gases. This means that the secondary ejector also pumps a portion of the primary ejector motive steam not condensed in the primary cooler. The quantity of the primary ejector motive steam pumped via the cooler into the secondary ejector is calculated:
1,42,42,4 mmm pr (4.17)
where prm 2,4 - quantity of primary ejector motive steam pumped via the primary cooler
into the secondary ejector,
2,4m - quantity of pumped gases of the secondary ejector,
1,4m - quantity of pumped gases from the primary ejector condenser.
The share of non-condensable phase pumped by 2nd rate ejector is calculated:
1,41,41,42,4 75,0 mmxx aircondno (4.18)
where condnox 2,4 - share of non-condensable phase pumped by 2nd rate ejector,
airx 1,4 - share of non-condensable phase,
1,4m - quantity of pumped gases from 1st ejector rate condenser.
The share of condensable phase pumped by the secondary ejector is calculated:
prprOHcond mmmxx 2,41,42,421,42,4 25,0 (4.19)
Dušan Strušnik, Jurij Avsec JET Vol. 6 (2013)
Issue 2
----------
where 3h - isentropic specific enthalpy at the outlet from a diffuser,
d - diffuser efficiency.
4.4 Mach number in the mixing zone
The Mach number in the mixing zone is calculated:
5,0
22
22
vp
cM
(4.9)
Where M2 - Mach number in the mixing zone.
Using Equations (4.4), (4.5) and (4.9) the necessary diameter is expressed and calculated:
4222
102 1 pMp
cmA
(4.10)
Equations (4.7) and (4.8) are used to calculate:
2
22
23c
hh d (4.11)
Other equations for ideal gases are used, i.e. Tch p , 1
R
c p and TRM to
obtain the equation:
12
122
1
2
3
M
p
p d (4.12)
If the inlet diffuser cross-section A2 is known, it is possible to express M2 depending on p2 from Equation (4.10) to obtain:
22
22410
22
241022
)(11Ap
Appcm
Ap
ApcmM
(4.13)
By inserting Equation (4.12) into Equation (4.13) we obtain:
0112
)1(
22
2410
1
2
3
Ap
Apcm
p
p d
(4.14)
If p3 (pressure behind the ejector) is known, Equation (4.13) is solved, and p2 is obtained and then M2 is calculated from Equation (4.12). It is necessary to determine c2, T2 and 4m . Taking into account Equation (4.4) the energy Equation (4.6) can be written as follows:
22222
222
2
2224400 2121
MpcAcRT
RT
pcAhmhm
(4.15)

JET ��
Using steam as an alternative motive fluid in the existing turbine ejector system of the Ljubljana district heating plant
----------
From Equation (4.15) we express c2 and insert it into Equation (4.5) to obtain, after a transformation, a quadratic equation for the calculation of the flow rate of gases 4m , whose solution is:
4
22222224100
204
240
20400
4 22
111
)(4)()(
h
MpAApApcmhmhhhmhhm
m
(4.16)
4.5 Calculation of flow rate of non-condensable and condensable phase of primary and secondary ejector
In the calculation of the phase quantity of the pumped gases of the primary ejector, the proportion of a mixture of the primary ejector ( 1,4m ) is taken into account on the basis of
experience, i.e. 75% of non-condensable phase and 25% of condensable phase, whereby 25,021,4 OHx and 75,01,4 airx .
It is necessary to calculate the phase ratio to be sucked into the secondary ejector. In view of the fact that the Laval nozzle of the secondary ejector has a larger diameter than the primary ejector, the secondary ejector pumps a higher quantity of gases. This means that the secondary ejector also pumps a portion of the primary ejector motive steam not condensed in the primary cooler. The quantity of the primary ejector motive steam pumped via the cooler into the secondary ejector is calculated:
1,42,42,4 mmm pr (4.17)
where prm 2,4 - quantity of primary ejector motive steam pumped via the primary cooler
into the secondary ejector,
2,4m - quantity of pumped gases of the secondary ejector,
1,4m - quantity of pumped gases from the primary ejector condenser.
The share of non-condensable phase pumped by 2nd rate ejector is calculated:
1,41,41,42,4 75,0 mmxx aircondno (4.18)
where condnox 2,4 - share of non-condensable phase pumped by 2nd rate ejector,
airx 1,4 - share of non-condensable phase,
1,4m - quantity of pumped gases from 1st ejector rate condenser.
The share of condensable phase pumped by the secondary ejector is calculated:
prprOHcond mmmxx 2,41,42,421,42,4 25,0 (4.19)
Dušan Strušnik, Jurij Avsec JET Vol. 6 (2013)
Issue 2
----------
where 3h - isentropic specific enthalpy at the outlet from a diffuser,
d - diffuser efficiency.
4.4 Mach number in the mixing zone
The Mach number in the mixing zone is calculated:
5,0
22
22
vp
cM
(4.9)
Where M2 - Mach number in the mixing zone.
Using Equations (4.4), (4.5) and (4.9) the necessary diameter is expressed and calculated:
4222
102 1 pMp
cmA
(4.10)
Equations (4.7) and (4.8) are used to calculate:
2
22
23c
hh d (4.11)
Other equations for ideal gases are used, i.e. Tch p , 1
R
c p and TRM to
obtain the equation:
12
122
1
2
3
M
p
p d (4.12)
If the inlet diffuser cross-section A2 is known, it is possible to express M2 depending on p2 from Equation (4.10) to obtain:
22
22410
22
241022
)(11Ap
Appcm
Ap
ApcmM
(4.13)
By inserting Equation (4.12) into Equation (4.13) we obtain:
0112
)1(
22
2410
1
2
3
Ap
Apcm
p
p d
(4.14)
If p3 (pressure behind the ejector) is known, Equation (4.13) is solved, and p2 is obtained and then M2 is calculated from Equation (4.12). It is necessary to determine c2, T2 and 4m . Taking into account Equation (4.4) the energy Equation (4.6) can be written as follows:
22222
222
2
2224400 2121
MpcAcRT
RT
pcAhmhm
(4.15)

�0 JET
Using steam as an alternative motive fluid in the existing turbine ejector system of the Ljubljana district heating plant
----------
[t]
temperature
[t]
temp
[p]
preasure
[p]
preassu
m01
m02moc
power calculation
power
m1
m2
air in 2. step
steam in 2.step
phase calculation in 2 step
phase
0.009
dl2-lavalo diameter2
[p]
dl2
0.0074
dl1-laval diameter1
[t]
dl1
743
Temperature
Sine Wave1
Sine Wave
14
Preasure
Add1Add
f(u)
2. step pumping mass flow
f(u)
1. step pumping mass flow
T0
p0
dl1-lav al diameter 1.step
dl2-lav al diameter 2.step
m01 steam mass f low1
c1 nizzle outlet speed1
m01 steam mass f low2
c2 nizzle outlet speed2
cl lav al steam speed
lav al-steam preasure
lav al-density
1,end 2. ejectors steps
Figure 6: Ejector model, Matlab [5]
6 ANALYSIS OF THE EXISTING EJECTOR SYSTEM AND DETERMINATION OF GEOMETRICAL DATA OF THE ALTERNATIVE EJECTOR SYSTEM
In order to ensure a good turbine condenser vacuum, the amount of gases pumped using the existing ejector system is important. The alternative ejector system must ensure an equivalent flow rate to the existing system. In view of the fact that the alternative system motive steam is of poorer quality, an appropriate nozzle diameter must be defined. To this end, an ejector model is to be used.
The measured data of the existing system (Fig. 3) and geometrical data (Table 1) were put into the ejector model.
Table 1: Existing ejector system data
Designation Meaning Primary ejector Secondary ejector
dL Narrowest Laval nozzle diameter 7.4 mm 9.0 mm
d1 Laval nozzle outlet diameter 35.6 mm 23.6 mm
d2 Diffuser inlet diameter 49.6 mm 32.3 mm
d3 Final diameter of a diffuser 102.5 mm 87.2 mm
Diffuser expansion angle 10° 10°
Nozzle efficiency 0.97 0.97
Dušan Strušnik, Jurij Avsec JET Vol. 6 (2013)
Issue 2
----------
where condx 2,4 - share of condensable phase pumped by the secondary ejector,
OHx 21,4 - share of condensable phase,
1,4m - quantity of pumped gases from the primary ejector condenser,
prm 2,4 - quantity of the primary ejector motive steam pumped via the primary cooler
into the secondary ejector.
5 EJECTOR SYSTEM MODEL IN MATLAB-SIMULINK SOFTWARE ENVIRONMENT
Using Matlab-Simulink software, an ejector was modelled to calculate, by means of the equations described in Chapter 4, the conditions in the ejector, the quantity of pumped gases, the consumption of ejector motive steam and the work done by the turbine if the ejector motive steam expanded in the turbine. The ejector model consists of the main model (Fig. 6) and three sub-models. The first sub-model (Fig. 5) calculates the conditions in the Laval nozzle. The main model computes the quantity of the pumped gases for each ejector separately by means of the computed parameters. The second sub-model computes the phase ratios of gases pumped into the secondary ejector. On the basis of the motive gas quantity used for the ejector system operation, the third sub-model computes the power produced as a result of the expansion of the ejector motive steam in the turbine. The model is conceived so that the narrowest nozzle diameter and the motive steam quality may be manually selected.
cl laval steam speed
7
laval-density6
laval-steam preasure
5
cl laval steam speed
4
c2 nizzle outlet speed2
3
m01 steam mass flow2
2
c1 nizzle outlet speed1
1
m01 steam mass flow1
u(2)*u(1)
m01 - steam mass flow2
u(2)*u(1)
m01 - steam mass flow1u(1)*((2/2.3)^(1.3/0.3))
laval steam preasure
((u(2)*100000/u(1))/Rp)*((u(3)/u(2))^(1/1.3))
laval density
sqrt(2*1.3/2.3*Rp*u(1))
cl-laval steam speed
sqrt((ni*2*(1.3/0.3)*Rp*u(1)*(1-(p42/u(2))^(0.3/1.3))))
c2 - nizzle outlet speed2
sqrt((ni*2*(1.3/0.3)*Rp*u(1)*(1-(p41/u(2))^(0.3/1.3))))
c1 - nizzle outlet speed1
Product1
Product
f(u)
Fcn1
f(u)
Fcn
4
dl2-laval diameter 2.step
3
dl1-laval diameter 1.step
2 p0
1
T0
Figure 5: Ejector sub-model, Matlab [5]

JET �1
Using steam as an alternative motive fluid in the existing turbine ejector system of the Ljubljana district heating plant
----------
[t]
temperature
[t]
temp
[p]
preasure
[p]
preassu
m01
m02moc
power calculation
power
m1
m2
air in 2. step
steam in 2.step
phase calculation in 2 step
phase
0.009
dl2-lavalo diameter2
[p]
dl2
0.0074
dl1-laval diameter1
[t]
dl1
743
Temperature
Sine Wave1
Sine Wave
14
Preasure
Add1Add
f(u)
2. step pumping mass flow
f(u)
1. step pumping mass flow
T0
p0
dl1-lav al diameter 1.step
dl2-lav al diameter 2.step
m01 steam mass f low1
c1 nizzle outlet speed1
m01 steam mass f low2
c2 nizzle outlet speed2
cl lav al steam speed
lav al-steam preasure
lav al-density
1,end 2. ejectors steps
Figure 6: Ejector model, Matlab [5]
6 ANALYSIS OF THE EXISTING EJECTOR SYSTEM AND DETERMINATION OF GEOMETRICAL DATA OF THE ALTERNATIVE EJECTOR SYSTEM
In order to ensure a good turbine condenser vacuum, the amount of gases pumped using the existing ejector system is important. The alternative ejector system must ensure an equivalent flow rate to the existing system. In view of the fact that the alternative system motive steam is of poorer quality, an appropriate nozzle diameter must be defined. To this end, an ejector model is to be used.
The measured data of the existing system (Fig. 3) and geometrical data (Table 1) were put into the ejector model.
Table 1: Existing ejector system data
Designation Meaning Primary ejector Secondary ejector
dL Narrowest Laval nozzle diameter 7.4 mm 9.0 mm
d1 Laval nozzle outlet diameter 35.6 mm 23.6 mm
d2 Diffuser inlet diameter 49.6 mm 32.3 mm
d3 Final diameter of a diffuser 102.5 mm 87.2 mm
Diffuser expansion angle 10° 10°
Nozzle efficiency 0.97 0.97
Dušan Strušnik, Jurij Avsec JET Vol. 6 (2013)
Issue 2
----------
where condx 2,4 - share of condensable phase pumped by the secondary ejector,
OHx 21,4 - share of condensable phase,
1,4m - quantity of pumped gases from the primary ejector condenser,
prm 2,4 - quantity of the primary ejector motive steam pumped via the primary cooler
into the secondary ejector.
5 EJECTOR SYSTEM MODEL IN MATLAB-SIMULINK SOFTWARE ENVIRONMENT
Using Matlab-Simulink software, an ejector was modelled to calculate, by means of the equations described in Chapter 4, the conditions in the ejector, the quantity of pumped gases, the consumption of ejector motive steam and the work done by the turbine if the ejector motive steam expanded in the turbine. The ejector model consists of the main model (Fig. 6) and three sub-models. The first sub-model (Fig. 5) calculates the conditions in the Laval nozzle. The main model computes the quantity of the pumped gases for each ejector separately by means of the computed parameters. The second sub-model computes the phase ratios of gases pumped into the secondary ejector. On the basis of the motive gas quantity used for the ejector system operation, the third sub-model computes the power produced as a result of the expansion of the ejector motive steam in the turbine. The model is conceived so that the narrowest nozzle diameter and the motive steam quality may be manually selected.
cl laval steam speed
7
laval-density6
laval-steam preasure
5
cl laval steam speed
4
c2 nizzle outlet speed2
3
m01 steam mass flow2
2
c1 nizzle outlet speed1
1
m01 steam mass flow1
u(2)*u(1)
m01 - steam mass flow2
u(2)*u(1)
m01 - steam mass flow1u(1)*((2/2.3)^(1.3/0.3))
laval steam preasure
((u(2)*100000/u(1))/Rp)*((u(3)/u(2))^(1/1.3))
laval density
sqrt(2*1.3/2.3*Rp*u(1))
cl-laval steam speed
sqrt((ni*2*(1.3/0.3)*Rp*u(1)*(1-(p42/u(2))^(0.3/1.3))))
c2 - nizzle outlet speed2
sqrt((ni*2*(1.3/0.3)*Rp*u(1)*(1-(p41/u(2))^(0.3/1.3))))
c1 - nizzle outlet speed1
Product1
Product
f(u)
Fcn1
f(u)
Fcn
4
dl2-laval diameter 2.step
3
dl1-laval diameter 1.step
2 p0
1
T0
Figure 5: Ejector sub-model, Matlab [5]
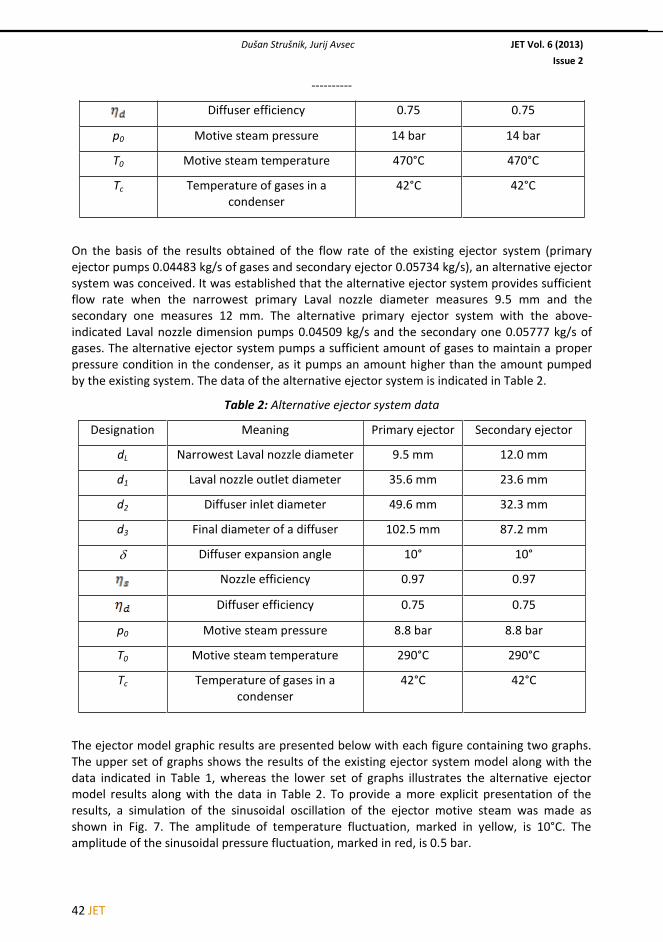
�2 JET
Using steam as an alternative motive fluid in the existing turbine ejector system of the Ljubljana district heating plant
----------
0 10 20 30 40 50 608
9
10
minute
bar
0 10 20 30 40 50 6013.5
14
14.5
bar
0 10 20 30 40 50 60280
290
300
°C
0 10 20 30 40 50 60460
470
480
°C
steam temperature
steam temperature
steam pressure
steam pressure
alternative steam
alternative steam
existent steam
existent steam
Figure 7: Sinusoidal oscillation of ejector motive steam, Matlab [5]
Fig. 8 shows the conditions of Laval nozzle in Laval cross-section. The yellow curve shows the pressure and the pink curve the ejector motive steam density. A 2.8 bar decrease in pressure in the Laval cross-section and a slight decrease in density are observed in the operation of the ejector with alternative motive steam.
0 10 20 30 40 50 602
4
6
8
minute
kg/m
3
bar
0 10 20 30 40 50 602
3
4
5
6
minutekg
/m3
bar
pressuredensity
pressuredensity
steam 14 bar, 470°C
steam 8,8 bar, 290°C
Figure 8: Conditions in the Laval nozzle Laval cross-section, Matlab [5]
Fig. 9 shows Laval nozzle velocities. The yellow curve shows the outlet nozzle speed of the primary motive steam, the pink curve the outlet nozzle speed of the secondary motive steam and the blue curve the motive steam speed in Laval cross-section. Lower velocities are observed in the alternative ejector system. The primary and secondary outlet nozzle velocities are lower by 220 m/s. The velocity of steam in Laval cross-section is lower by 50 m/s.
Dušan Strušnik, Jurij Avsec JET Vol. 6 (2013)
Issue 2
----------
Diffuser efficiency 0.75 0.75
p0 Motive steam pressure 14 bar 14 bar
T0 Motive steam temperature 470°C 470°C
Tc Temperature of gases in a condenser
42°C 42°C
On the basis of the results obtained of the flow rate of the existing ejector system (primary ejector pumps 0.04483 kg/s of gases and secondary ejector 0.05734 kg/s), an alternative ejector system was conceived. It was established that the alternative ejector system provides sufficient flow rate when the narrowest primary Laval nozzle diameter measures 9.5 mm and the secondary one measures 12 mm. The alternative primary ejector system with the above-indicated Laval nozzle dimension pumps 0.04509 kg/s and the secondary one 0.05777 kg/s of gases. The alternative ejector system pumps a sufficient amount of gases to maintain a proper pressure condition in the condenser, as it pumps an amount higher than the amount pumped by the existing system. The data of the alternative ejector system is indicated in Table 2.
Table 2: Alternative ejector system data
Designation Meaning Primary ejector Secondary ejector
dL Narrowest Laval nozzle diameter 9.5 mm 12.0 mm
d1 Laval nozzle outlet diameter 35.6 mm 23.6 mm
d2 Diffuser inlet diameter 49.6 mm 32.3 mm
d3 Final diameter of a diffuser 102.5 mm 87.2 mm
Diffuser expansion angle 10° 10°
Nozzle efficiency 0.97 0.97
Diffuser efficiency 0.75 0.75
p0 Motive steam pressure 8.8 bar 8.8 bar
T0 Motive steam temperature 290°C 290°C
Tc Temperature of gases in a condenser
42°C 42°C
The ejector model graphic results are presented below with each figure containing two graphs. The upper set of graphs shows the results of the existing ejector system model along with the data indicated in Table 1, whereas the lower set of graphs illustrates the alternative ejector model results along with the data in Table 2. To provide a more explicit presentation of the results, a simulation of the sinusoidal oscillation of the ejector motive steam was made as shown in Fig. 7. The amplitude of temperature fluctuation, marked in yellow, is 10°C. The amplitude of the sinusoidal pressure fluctuation, marked in red, is 0.5 bar.

JET ��
Using steam as an alternative motive fluid in the existing turbine ejector system of the Ljubljana district heating plant
----------
0 10 20 30 40 50 608
9
10
minute
bar
0 10 20 30 40 50 6013.5
14
14.5
bar
0 10 20 30 40 50 60280
290
300
°C
0 10 20 30 40 50 60460
470
480
°C
steam temperature
steam temperature
steam pressure
steam pressure
alternative steam
alternative steam
existent steam
existent steam
Figure 7: Sinusoidal oscillation of ejector motive steam, Matlab [5]
Fig. 8 shows the conditions of Laval nozzle in Laval cross-section. The yellow curve shows the pressure and the pink curve the ejector motive steam density. A 2.8 bar decrease in pressure in the Laval cross-section and a slight decrease in density are observed in the operation of the ejector with alternative motive steam.
0 10 20 30 40 50 602
4
6
8
minute
kg/m
3
bar
0 10 20 30 40 50 602
3
4
5
6
minute
kg/m
3
b
ar
pressuredensity
pressuredensity
steam 14 bar, 470°C
steam 8,8 bar, 290°C
Figure 8: Conditions in the Laval nozzle Laval cross-section, Matlab [5]
Fig. 9 shows Laval nozzle velocities. The yellow curve shows the outlet nozzle speed of the primary motive steam, the pink curve the outlet nozzle speed of the secondary motive steam and the blue curve the motive steam speed in Laval cross-section. Lower velocities are observed in the alternative ejector system. The primary and secondary outlet nozzle velocities are lower by 220 m/s. The velocity of steam in Laval cross-section is lower by 50 m/s.
Dušan Strušnik, Jurij Avsec JET Vol. 6 (2013)
Issue 2
----------
Diffuser efficiency 0.75 0.75
p0 Motive steam pressure 14 bar 14 bar
T0 Motive steam temperature 470°C 470°C
Tc Temperature of gases in a condenser
42°C 42°C
On the basis of the results obtained of the flow rate of the existing ejector system (primary ejector pumps 0.04483 kg/s of gases and secondary ejector 0.05734 kg/s), an alternative ejector system was conceived. It was established that the alternative ejector system provides sufficient flow rate when the narrowest primary Laval nozzle diameter measures 9.5 mm and the secondary one measures 12 mm. The alternative primary ejector system with the above-indicated Laval nozzle dimension pumps 0.04509 kg/s and the secondary one 0.05777 kg/s of gases. The alternative ejector system pumps a sufficient amount of gases to maintain a proper pressure condition in the condenser, as it pumps an amount higher than the amount pumped by the existing system. The data of the alternative ejector system is indicated in Table 2.
Table 2: Alternative ejector system data
Designation Meaning Primary ejector Secondary ejector
dL Narrowest Laval nozzle diameter 9.5 mm 12.0 mm
d1 Laval nozzle outlet diameter 35.6 mm 23.6 mm
d2 Diffuser inlet diameter 49.6 mm 32.3 mm
d3 Final diameter of a diffuser 102.5 mm 87.2 mm
Diffuser expansion angle 10° 10°
Nozzle efficiency 0.97 0.97
Diffuser efficiency 0.75 0.75
p0 Motive steam pressure 8.8 bar 8.8 bar
T0 Motive steam temperature 290°C 290°C
Tc Temperature of gases in a condenser
42°C 42°C
The ejector model graphic results are presented below with each figure containing two graphs. The upper set of graphs shows the results of the existing ejector system model along with the data indicated in Table 1, whereas the lower set of graphs illustrates the alternative ejector model results along with the data in Table 2. To provide a more explicit presentation of the results, a simulation of the sinusoidal oscillation of the ejector motive steam was made as shown in Fig. 7. The amplitude of temperature fluctuation, marked in yellow, is 10°C. The amplitude of the sinusoidal pressure fluctuation, marked in red, is 0.5 bar.
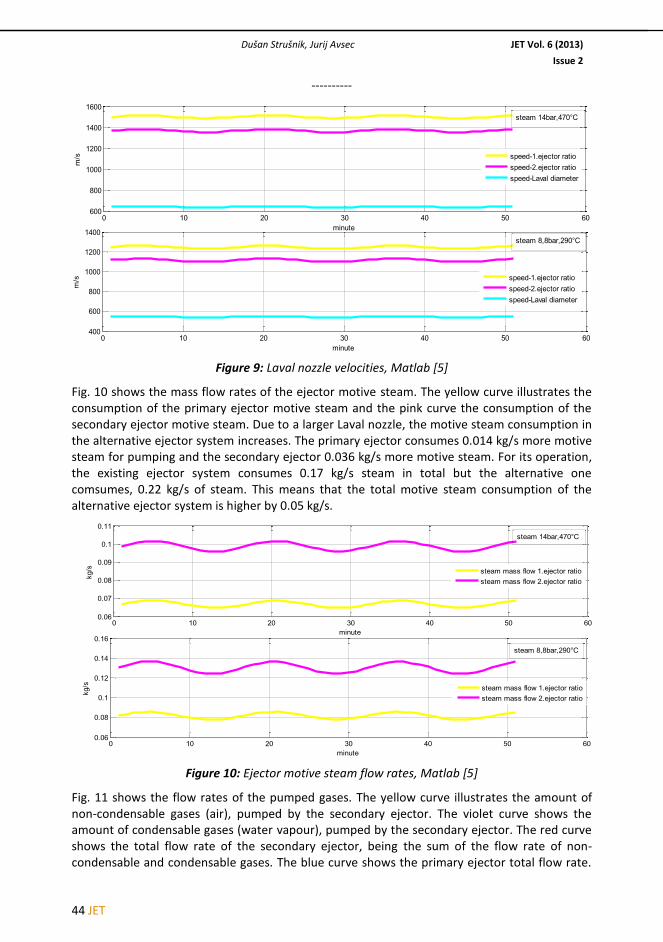
�� JET
Using steam as an alternative motive fluid in the existing turbine ejector system of the Ljubljana district heating plant
----------
It is observed that the secondary ejector pumps a larger quantity than the primary ejector, which means that the secondary ejector also pumps a portion of the motive steam of the primary ejector. An important item of information regarding the alternative ejector system dimension is the equivalent flow rate of the existing system. Fig. 11 shows the primary and secondary ejector flow rates (blue and red curves).
0 10 20 30 40 50 600.02
0.03
0.04
0.05
0.06
minute
kg/s
0 10 20 30 40 50 600.02
0.03
0.04
0.05
0.06
0.07
minute
kg/s
pumping air in 2.ejector ratiopumping steam in 2.ejector ratiopumping mass flow 1.ejector ratiopumping mass flow 2.ejector ratio
pumping air in 2.ejector ratiopumping steam in 2.ejector ratiopumping mass flow 1.ejector ratiopumping mass flow 2.ejector ratio
steam 14bar,470°C
steam 8,8bar,290°C
Figure 11: Quantity of pumped gases, Matlab [5]
Fig. 12 shows the generated power that would be developed by the ejector motive steam expansion in the turbine. The yellow curve shows the generated power in the case of expansion of the total quantity of the motive steam in the turbine that is used to drive the primary and secondary ejectors. In this case, the steam expands from the parameter of the quality of the steam produced in the steam boiler and expansion in the turbine to the pressure state in the turbine condenser. The pink curve shows the generated power that would be developed by the quantity of the ejector motive steam in the expansion of the steam in the turbine, from the state of quality of the steam produced in the boiler to the pressure state of the Turbine 3 extraction.
The alternative ejector system is supplied with the steam of the third turbine extraction. For its operation, the existing ejector system uses the quantity of the motive steam that would produce in the turbine expansion from the pressure state in the condenser an additional amount of 197 kW of electric power. For its operation, the alternative ejector system uses a larger quantity of motive steam that would produce additional 240 kW of electric power in a turbine expansion to the pressure state in the condenser. However, the alternative ejector system is supplied from the third turbine expansion, which is why the ejector motive steam of this system expands in the turbine to the pressure state of the third turbine expansion and generates 60 kW of electric power. As the motive steam of the alternative ejector system actually expands in the turbine to the state of the third expansion, the power of expansion to the state of the third expansion has to be deducted from the total generated power of 240 kW (expansion to the pressure state in the condenser). The actual generated power of 180 kW is thus obtained that would be developed by the alternative motive steam. The comparison of both ejector systems shows that the alternative ejector system actually generates only 17 kW more electric power due to the expansion of the ejector motive steam in the turbine.
Dušan Strušnik, Jurij Avsec JET Vol. 6 (2013)
Issue 2
----------
0 10 20 30 40 50 60600
800
1000
1200
1400
1600
minute
m/s
0 10 20 30 40 50 60400
600
800
1000
1200
1400
minute
m/s
speed-1.ejector ratiospeed-2.ejector ratiospeed-Laval diameter
speed-1.ejector ratiospeed-2.ejector ratiospeed-Laval diameter
steam 8,8bar,290°C
steam 14bar,470°C
Figure 9: Laval nozzle velocities, Matlab [5]
Fig. 10 shows the mass flow rates of the ejector motive steam. The yellow curve illustrates the consumption of the primary ejector motive steam and the pink curve the consumption of the secondary ejector motive steam. Due to a larger Laval nozzle, the motive steam consumption in the alternative ejector system increases. The primary ejector consumes 0.014 kg/s more motive steam for pumping and the secondary ejector 0.036 kg/s more motive steam. For its operation, the existing ejector system consumes 0.17 kg/s steam in total but the alternative one comsumes, 0.22 kg/s of steam. This means that the total motive steam consumption of the alternative ejector system is higher by 0.05 kg/s.
0 10 20 30 40 50 600.06
0.08
0.1
0.12
0.14
0.16
minute
kg/s
0 10 20 30 40 50 600.06
0.07
0.08
0.09
0.1
0.11
minute
kg/s
steam mass flow 1.ejector ratiosteam mass flow 2.ejector ratio
steam mass flow 1.ejector ratiosteam mass flow 2.ejector ratio
steam 14bar,470°C
steam 8,8bar,290°C
Figure 10: Ejector motive steam flow rates, Matlab [5]
Fig. 11 shows the flow rates of the pumped gases. The yellow curve illustrates the amount of non-condensable gases (air), pumped by the secondary ejector. The violet curve shows the amount of condensable gases (water vapour), pumped by the secondary ejector. The red curve shows the total flow rate of the secondary ejector, being the sum of the flow rate of non-condensable and condensable gases. The blue curve shows the primary ejector total flow rate.

JET ��
Using steam as an alternative motive fluid in the existing turbine ejector system of the Ljubljana district heating plant
----------
It is observed that the secondary ejector pumps a larger quantity than the primary ejector, which means that the secondary ejector also pumps a portion of the motive steam of the primary ejector. An important item of information regarding the alternative ejector system dimension is the equivalent flow rate of the existing system. Fig. 11 shows the primary and secondary ejector flow rates (blue and red curves).
0 10 20 30 40 50 600.02
0.03
0.04
0.05
0.06
minute
kg/s
0 10 20 30 40 50 600.02
0.03
0.04
0.05
0.06
0.07
minute
kg/s
pumping air in 2.ejector ratiopumping steam in 2.ejector ratiopumping mass flow 1.ejector ratiopumping mass flow 2.ejector ratio
pumping air in 2.ejector ratiopumping steam in 2.ejector ratiopumping mass flow 1.ejector ratiopumping mass flow 2.ejector ratio
steam 14bar,470°C
steam 8,8bar,290°C
Figure 11: Quantity of pumped gases, Matlab [5]
Fig. 12 shows the generated power that would be developed by the ejector motive steam expansion in the turbine. The yellow curve shows the generated power in the case of expansion of the total quantity of the motive steam in the turbine that is used to drive the primary and secondary ejectors. In this case, the steam expands from the parameter of the quality of the steam produced in the steam boiler and expansion in the turbine to the pressure state in the turbine condenser. The pink curve shows the generated power that would be developed by the quantity of the ejector motive steam in the expansion of the steam in the turbine, from the state of quality of the steam produced in the boiler to the pressure state of the Turbine 3 extraction.
The alternative ejector system is supplied with the steam of the third turbine extraction. For its operation, the existing ejector system uses the quantity of the motive steam that would produce in the turbine expansion from the pressure state in the condenser an additional amount of 197 kW of electric power. For its operation, the alternative ejector system uses a larger quantity of motive steam that would produce additional 240 kW of electric power in a turbine expansion to the pressure state in the condenser. However, the alternative ejector system is supplied from the third turbine expansion, which is why the ejector motive steam of this system expands in the turbine to the pressure state of the third turbine expansion and generates 60 kW of electric power. As the motive steam of the alternative ejector system actually expands in the turbine to the state of the third expansion, the power of expansion to the state of the third expansion has to be deducted from the total generated power of 240 kW (expansion to the pressure state in the condenser). The actual generated power of 180 kW is thus obtained that would be developed by the alternative motive steam. The comparison of both ejector systems shows that the alternative ejector system actually generates only 17 kW more electric power due to the expansion of the ejector motive steam in the turbine.
Dušan Strušnik, Jurij Avsec JET Vol. 6 (2013)
Issue 2
----------
0 10 20 30 40 50 60600
800
1000
1200
1400
1600
minute
m/s
0 10 20 30 40 50 60400
600
800
1000
1200
1400
minute
m/s
speed-1.ejector ratiospeed-2.ejector ratiospeed-Laval diameter
speed-1.ejector ratiospeed-2.ejector ratiospeed-Laval diameter
steam 8,8bar,290°C
steam 14bar,470°C
Figure 9: Laval nozzle velocities, Matlab [5]
Fig. 10 shows the mass flow rates of the ejector motive steam. The yellow curve illustrates the consumption of the primary ejector motive steam and the pink curve the consumption of the secondary ejector motive steam. Due to a larger Laval nozzle, the motive steam consumption in the alternative ejector system increases. The primary ejector consumes 0.014 kg/s more motive steam for pumping and the secondary ejector 0.036 kg/s more motive steam. For its operation, the existing ejector system consumes 0.17 kg/s steam in total but the alternative one comsumes, 0.22 kg/s of steam. This means that the total motive steam consumption of the alternative ejector system is higher by 0.05 kg/s.
0 10 20 30 40 50 600.06
0.08
0.1
0.12
0.14
0.16
minute
kg/s
0 10 20 30 40 50 600.06
0.07
0.08
0.09
0.1
0.11
minute
kg/s
steam mass flow 1.ejector ratiosteam mass flow 2.ejector ratio
steam mass flow 1.ejector ratiosteam mass flow 2.ejector ratio
steam 14bar,470°C
steam 8,8bar,290°C
Figure 10: Ejector motive steam flow rates, Matlab [5]
Fig. 11 shows the flow rates of the pumped gases. The yellow curve illustrates the amount of non-condensable gases (air), pumped by the secondary ejector. The violet curve shows the amount of condensable gases (water vapour), pumped by the secondary ejector. The red curve shows the total flow rate of the secondary ejector, being the sum of the flow rate of non-condensable and condensable gases. The blue curve shows the primary ejector total flow rate.

�� JET
Using steam as an alternative motive fluid in the existing turbine ejector system of the Ljubljana district heating plant
----------
The advantage of the ejector system lies in the easy maintenance of its driving parts and its reliable operation. It would be reasonable to consider a replacement of the ejector system with an electric vacuum pump characterised by lower energy consumption and a considerably higher efficiency.
References
[1] Z. Elčić: Pogonski propisi turbine 50 MW-Ljubljana, Jugoturbina tvornica parnih turbina Karlovac, p.p., 1965.
[2] Z. Elčić: Obratovalna navodila turbine Te-to Ljubljana, Rekonstrukcija, druga izdaja, ABB-TEP Karlovac, pp.5600.0006-5602.0001, 1996.
[3] B. Kraut: Krautov strojniški priročnik, 14. slovenska izdaja, izdajo pripravila Puhar J. Stropnik J. Ljubljana: Littera picta, 2003.
[4] M. Marietta: Investigation of an ejector heat pump by analytical methods, Oak Ridge national laboratory, United States Department of Energy, University of Tennessee, 1984.
[5] Matlab: Computer program, Simulink, version 2010-a. [6] D. Strušnik: Analiza delovanja ejektorskega sistema na turboagregatu 3, v TE-TOL,
Univerza v Mariboru, Fakulteta za strojništvo, 2009. [7] D Strušnik: Primerjalna analiza delovanja ejektorskega sistema in električne vakumske
črpalke turboagregata, Univerza v Mariboru, Fakulteta za energetiko, 2011. [8] TE-TOL.: Thermal power plant, information system (TIS).
Nomenclature
(Symbols) (Symbol meaning)
A cross section
c speed
h specific enthalpy
M mach number
m mass flow
p pressure
R gas constant
T temperature
v specific volume
x flow rate
ratio of specific heats
efficiency
Dušan Strušnik, Jurij Avsec JET Vol. 6 (2013)
Issue 2
----------
0 10 20 30 40 50 6050
100
150
200
250
300
minute
kW
0 10 20 30 40 50 6050
100
150
200
minute
kW
steam expansion in turbine-output powersteam expansion to 3.turbine extract-output power
steam expansion in turbine-output powersteam expansion to 3.turbine extract-output power
steam 14bar,470°C
steam 8,8bar,290°C
Figure 12: Power that would be developed by the ejector motive steam in steam expansion in
the turbine, Matlab [5]
7 CONCLUSION
The measurements and the ejector model data show that a reconstruction of the system is necessary in order to adjust the existing ejector system to the new motive steam parameters.
Certain parts of the ejector need to be adjusted to the new computed dimensions (Table 2). Both Laval nozzles have to be replaced and the ejector system coolers enlarged by 15% due to the higher consumption of the ejector motive steam. As a result, the secondary ejector mainly pumps non-condensable gases. The automated system operation may be achieved by installing electric shut-off valves. All the other ejector system elements, such as diffusers, mixing chambers, connecting fittings and flanges could be used without reconstruction. No manual throttle valves are needed as the steam would have a constant pressure. Due to the replacement of the nozzles and the constant pressure of the alternative motive steam, the ejector mixing chamber would have a constant volume flow and consequently smoother operation and uniform pumping of gases from the condenser. The existing ejector system may also be manually controlled. Within the reconstruction, the steam electric valves would be mounted to a more accessible position. The steam valve operation would be remotely controlled. The alternative ejector system motive steam pressure would be ensured from various sources and would not be dependent only on the boiler operation.
The main observation regarding the system reconstruction is that the ejector motive steam previously expands in the turbine to the third turbine expansion pressure and that the ejector system is not directly supplied with the boiler-reduced steam. Additionally, 60 kW of electric energy are generated, and the motive steam enthalpy drop is used, which is lost in the original case of damping. A weakness of the alternative ejector system is that it uses a larger quantity of motive steam and that only 17 kW of additionally generated electric power in the turbine is saved.
The ejector system reconstruction is reasonable only for the sake of a more reliable and safer alternative system operation.

JET ��
Using steam as an alternative motive fluid in the existing turbine ejector system of the Ljubljana district heating plant
----------
The advantage of the ejector system lies in the easy maintenance of its driving parts and its reliable operation. It would be reasonable to consider a replacement of the ejector system with an electric vacuum pump characterised by lower energy consumption and a considerably higher efficiency.
References
[1] Z. Elčić: Pogonski propisi turbine 50 MW-Ljubljana, Jugoturbina tvornica parnih turbina Karlovac, p.p., 1965.
[2] Z. Elčić: Obratovalna navodila turbine Te-to Ljubljana, Rekonstrukcija, druga izdaja, ABB-TEP Karlovac, pp.5600.0006-5602.0001, 1996.
[3] B. Kraut: Krautov strojniški priročnik, 14. slovenska izdaja, izdajo pripravila Puhar J. Stropnik J. Ljubljana: Littera picta, 2003.
[4] M. Marietta: Investigation of an ejector heat pump by analytical methods, Oak Ridge national laboratory, United States Department of Energy, University of Tennessee, 1984.
[5] Matlab: Computer program, Simulink, version 2010-a. [6] D. Strušnik: Analiza delovanja ejektorskega sistema na turboagregatu 3, v TE-TOL,
Univerza v Mariboru, Fakulteta za strojništvo, 2009. [7] D Strušnik: Primerjalna analiza delovanja ejektorskega sistema in električne vakumske
črpalke turboagregata, Univerza v Mariboru, Fakulteta za energetiko, 2011. [8] TE-TOL.: Thermal power plant, information system (TIS).
Nomenclature
(Symbols) (Symbol meaning)
A cross section
c speed
h specific enthalpy
M mach number
m mass flow
p pressure
R gas constant
T temperature
v specific volume
x flow rate
ratio of specific heats
efficiency
Dušan Strušnik, Jurij Avsec JET Vol. 6 (2013)
Issue 2
----------
0 10 20 30 40 50 6050
100
150
200
250
300
minute
kW
0 10 20 30 40 50 6050
100
150
200
minute
kW
steam expansion in turbine-output powersteam expansion to 3.turbine extract-output power
steam expansion in turbine-output powersteam expansion to 3.turbine extract-output power
steam 14bar,470°C
steam 8,8bar,290°C
Figure 12: Power that would be developed by the ejector motive steam in steam expansion in
the turbine, Matlab [5]
7 CONCLUSION
The measurements and the ejector model data show that a reconstruction of the system is necessary in order to adjust the existing ejector system to the new motive steam parameters.
Certain parts of the ejector need to be adjusted to the new computed dimensions (Table 2). Both Laval nozzles have to be replaced and the ejector system coolers enlarged by 15% due to the higher consumption of the ejector motive steam. As a result, the secondary ejector mainly pumps non-condensable gases. The automated system operation may be achieved by installing electric shut-off valves. All the other ejector system elements, such as diffusers, mixing chambers, connecting fittings and flanges could be used without reconstruction. No manual throttle valves are needed as the steam would have a constant pressure. Due to the replacement of the nozzles and the constant pressure of the alternative motive steam, the ejector mixing chamber would have a constant volume flow and consequently smoother operation and uniform pumping of gases from the condenser. The existing ejector system may also be manually controlled. Within the reconstruction, the steam electric valves would be mounted to a more accessible position. The steam valve operation would be remotely controlled. The alternative ejector system motive steam pressure would be ensured from various sources and would not be dependent only on the boiler operation.
The main observation regarding the system reconstruction is that the ejector motive steam previously expands in the turbine to the third turbine expansion pressure and that the ejector system is not directly supplied with the boiler-reduced steam. Additionally, 60 kW of electric energy are generated, and the motive steam enthalpy drop is used, which is lost in the original case of damping. A weakness of the alternative ejector system is that it uses a larger quantity of motive steam and that only 17 kW of additionally generated electric power in the turbine is saved.
The ejector system reconstruction is reasonable only for the sake of a more reliable and safer alternative system operation.

�� JET
JET Volume 6 (2013), p.p. 49 - 58
Issue 2, May 2013
http://www.fe.um.si/en/jet.html
EXPERIMENTAL SPRAY STUDY WITH USAGE OF ALTERNATIVE FUELS
EKSPERIMANTALNA ŠTUDIJA RAZVOJA CURKA ALTERNATIVNIH GORIV
Blaž Vajda , Gorazd Bombek, Marko Hočevar, Danilo Ritlop, Breda Kegl, Ignacijo Biluš
Keywords: Alternative fuels, high-speed camera, fuel spray
Abstract This paper presents an experimental investigation of the development of alternative fuel sprays. Injection process characteristics were measured with a Friedmann-Maier injection system test bench using different fuel blends. The spray was injected into the pressurised chamber at 40 or 60 bars and filmed with a high-speed camera. The image acquisition and processing system was developed in order to determine the spray-cone angle and the penetration length during different injection regimes. The results obtained from the experimental study show that differences in the chemical and physical characteristics of the alternative fuel blends used influence the spray characteristics (spray cone angle and penetration length). For wider usage of alternative fuels, further investigations need to be made.
Povzetek Članek predstavlja eksperimentalno analizo razvoja curka alternativnih goriv. Karakteristike vbrizgavanja so bile izmerjene na napravi za izvenvozilsko testiranje tlačilk Friedmann-Maier, ob uporabi različnih mešanic goriv. Vbrizgavanje curka v namensko tlačno komoro, s tlakom 40 ali 60 barov, je bilo posneto s hitro kamero. Za lažjo določitev dolžine in kota curka je bila razvita posebna metoda obdelave slik, posnetih s hitro kamero. Rezultati študije so pokazali, da kemijske in fizikalne lastnosti uporabljenih alternativnih goriv vplivajo na karakteristike vbrizganega curka (kot in dolžina). Za širšo uporabo alternativnih goriv, so potrebne nadaljnje raziskave.
Corresponding author: Blaž Vajda, B.Sc., University of Maribor, Faculty for Mechanical Engineering, Engine Research Laboratory, Smetanova ulica 17, SI-2000 Maribor, Slovenia Tel.: +386 41 522 145, E-mail address: [email protected]
Dušan Strušnik, Jurij Avsec JET Vol. 6 (2013)
Issue 2
----------
JET ��
JET Volume 6 (2013), p.p. 49 - 58
Issue 2, May 2013
http://www.fe.um.si/en/jet.html
EXPERIMENTAL SPRAY STUDY WITH USAGE OF ALTERNATIVE FUELS
EKSPERIMANTALNA ŠTUDIJA RAZVOJA CURKA ALTERNATIVNIH GORIV
Blaž Vajda , Gorazd Bombek, Marko Hočevar, Danilo Ritlop, Breda Kegl, Ignacijo Biluš
Keywords: Alternative fuels, high-speed camera, fuel spray
Abstract This paper presents an experimental investigation of the development of alternative fuel sprays. Injection process characteristics were measured with a Friedmann-Maier injection system test bench using different fuel blends. The spray was injected into the pressurised chamber at 40 or 60 bars and filmed with a high-speed camera. The image acquisition and processing system was developed in order to determine the spray-cone angle and the penetration length during different injection regimes. The results obtained from the experimental study show that differences in the chemical and physical characteristics of the alternative fuel blends used influence the spray characteristics (spray cone angle and penetration length). For wider usage of alternative fuels, further investigations need to be made.
Povzetek Članek predstavlja eksperimentalno analizo razvoja curka alternativnih goriv. Karakteristike vbrizgavanja so bile izmerjene na napravi za izvenvozilsko testiranje tlačilk Friedmann-Maier, ob uporabi različnih mešanic goriv. Vbrizgavanje curka v namensko tlačno komoro, s tlakom 40 ali 60 barov, je bilo posneto s hitro kamero. Za lažjo določitev dolžine in kota curka je bila razvita posebna metoda obdelave slik, posnetih s hitro kamero. Rezultati študije so pokazali, da kemijske in fizikalne lastnosti uporabljenih alternativnih goriv vplivajo na karakteristike vbrizganega curka (kot in dolžina). Za širšo uporabo alternativnih goriv, so potrebne nadaljnje raziskave.
Corresponding author: Blaž Vajda, B.Sc., University of Maribor, Faculty for Mechanical Engineering, Engine Research Laboratory, Smetanova ulica 17, SI-2000 Maribor, Slovenia Tel.: +386 41 522 145, E-mail address: [email protected]
Dušan Strušnik, Jurij Avsec JET Vol. 6 (2013)
Issue 2
----------
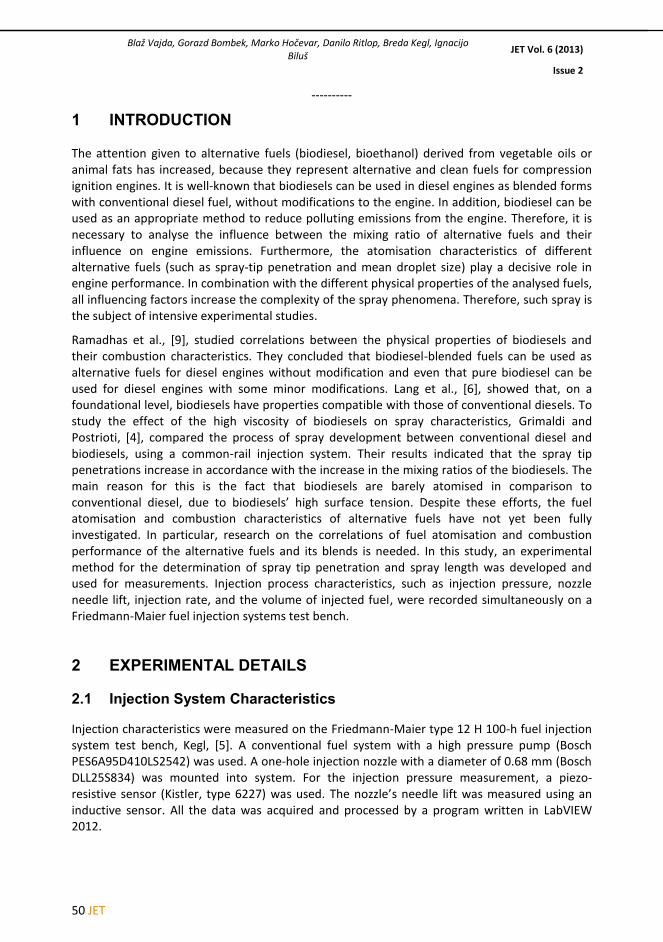
�0 JET
Experimental spray study with usage of alternative fuels
----------
2.2 Experimental setup
The measurement system consisted of a pressure chamber and two subsystems. Subsystem 1 was used for pressure setup and Subsystem 2 for spray injection (Figure 1). In Subsystem 1, a M51/M52 reduction valve was mounted. The purpose of the reduction valve was pressure reduction and regulation in the combustion chamber. A pressure of 40 or 60 bars was set by using an inert gas (N2) in order to achieve the conditions that usually appear in combustion engines. Subsystem 2 includes a BOSCH type PES 6A 95D 410 LS 2542 pump, with six injection nozzles (type BOSCH DLL 25S834) placed on the Friedmann-Maier fuel injection system in order to enable changing the rotation speed of the pump. One of the nozzles was connected with the pressure chamber, using the high pressure tube. The spray that was injected into the pressure chamber was recorded with a high-speed camera.
Figure 1: Graphic presentation of experimental setup
Figure 2: Experimental setup – pressure chamber and
Friedmann & Maier fuel injection system
High-speed camera
Pressure chamber
Lighting from the back
Spray
Fuel filter
Nozzle
Fuel container
Pump
Pressure setup valve N2
One way valve
Subsystem 2
Subsystem 1
Blaž Vajda, Gorazd Bombek, Marko Hočevar, Danilo Ritlop, Breda Kegl, Ignacijo Biluš JET Vol. 6 (2013)
Issue 2
----------
1 INTRODUCTION
The attention given to alternative fuels (biodiesel, bioethanol) derived from vegetable oils or animal fats has increased, because they represent alternative and clean fuels for compression ignition engines. It is well-known that biodiesels can be used in diesel engines as blended forms with conventional diesel fuel, without modifications to the engine. In addition, biodiesel can be used as an appropriate method to reduce polluting emissions from the engine. Therefore, it is necessary to analyse the influence between the mixing ratio of alternative fuels and their influence on engine emissions. Furthermore, the atomisation characteristics of different alternative fuels (such as spray-tip penetration and mean droplet size) play a decisive role in engine performance. In combination with the different physical properties of the analysed fuels, all influencing factors increase the complexity of the spray phenomena. Therefore, such spray is the subject of intensive experimental studies.
Ramadhas et al., [9], studied correlations between the physical properties of biodiesels and their combustion characteristics. They concluded that biodiesel-blended fuels can be used as alternative fuels for diesel engines without modification and even that pure biodiesel can be used for diesel engines with some minor modifications. Lang et al., [6], showed that, on a foundational level, biodiesels have properties compatible with those of conventional diesels. To study the effect of the high viscosity of biodiesels on spray characteristics, Grimaldi and Postrioti, [4], compared the process of spray development between conventional diesel and biodiesels, using a common-rail injection system. Their results indicated that the spray tip penetrations increase in accordance with the increase in the mixing ratios of the biodiesels. The main reason for this is the fact that biodiesels are barely atomised in comparison to conventional diesel, due to biodiesels’ high surface tension. Despite these efforts, the fuel atomisation and combustion characteristics of alternative fuels have not yet been fully investigated. In particular, research on the correlations of fuel atomisation and combustion performance of the alternative fuels and its blends is needed. In this study, an experimental method for the determination of spray tip penetration and spray length was developed and used for measurements. Injection process characteristics, such as injection pressure, nozzle needle lift, injection rate, and the volume of injected fuel, were recorded simultaneously on a Friedmann-Maier fuel injection systems test bench.
2 EXPERIMENTAL DETAILS
2.1 Injection System Characteristics
Injection characteristics were measured on the Friedmann-Maier type 12 H 100-h fuel injection system test bench, Kegl, [5]. A conventional fuel system with a high pressure pump (Bosch PES6A95D410LS2542) was used. A one-hole injection nozzle with a diameter of 0.68 mm (Bosch DLL25S834) was mounted into system. For the injection pressure measurement, a piezo-resistive sensor (Kistler, type 6227) was used. The nozzle’s needle lift was measured using an inductive sensor. All the data was acquired and processed by a program written in LabVIEW 2012.
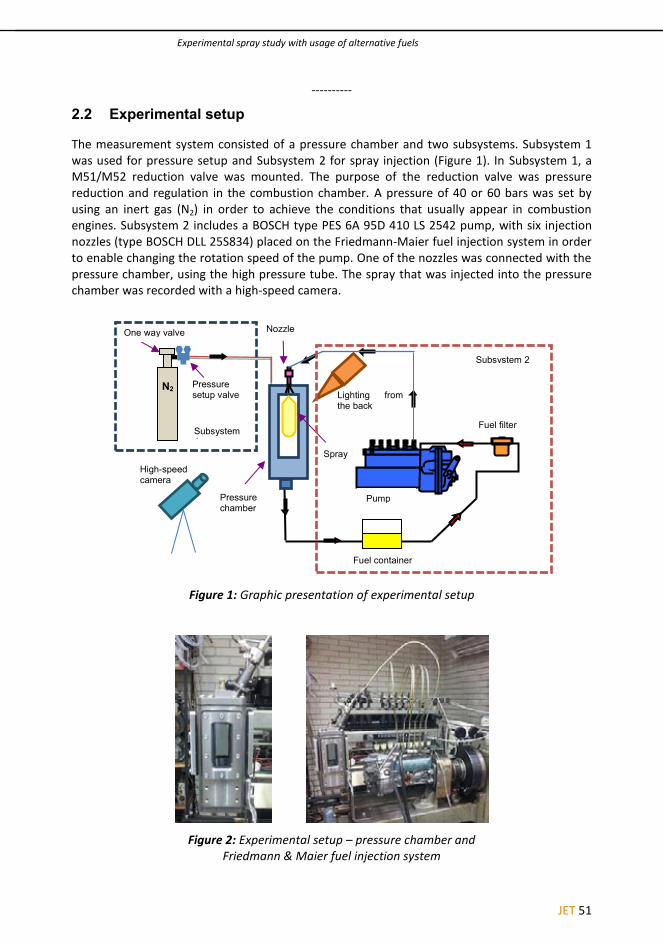
JET �1
Experimental spray study with usage of alternative fuels
----------
2.2 Experimental setup
The measurement system consisted of a pressure chamber and two subsystems. Subsystem 1 was used for pressure setup and Subsystem 2 for spray injection (Figure 1). In Subsystem 1, a M51/M52 reduction valve was mounted. The purpose of the reduction valve was pressure reduction and regulation in the combustion chamber. A pressure of 40 or 60 bars was set by using an inert gas (N2) in order to achieve the conditions that usually appear in combustion engines. Subsystem 2 includes a BOSCH type PES 6A 95D 410 LS 2542 pump, with six injection nozzles (type BOSCH DLL 25S834) placed on the Friedmann-Maier fuel injection system in order to enable changing the rotation speed of the pump. One of the nozzles was connected with the pressure chamber, using the high pressure tube. The spray that was injected into the pressure chamber was recorded with a high-speed camera.
Figure 1: Graphic presentation of experimental setup
Figure 2: Experimental setup – pressure chamber and
Friedmann & Maier fuel injection system
High-speed camera
Pressure chamber
Lighting from the back
Spray
Fuel filter
Nozzle
Fuel container
Pump
Pressure setup valve N2
One way valve
Subsystem 2
Subsystem 1
Blaž Vajda, Gorazd Bombek, Marko Hočevar, Danilo Ritlop, Breda Kegl, Ignacijo Biluš JET Vol. 6 (2013)
Issue 2
----------
1 INTRODUCTION
The attention given to alternative fuels (biodiesel, bioethanol) derived from vegetable oils or animal fats has increased, because they represent alternative and clean fuels for compression ignition engines. It is well-known that biodiesels can be used in diesel engines as blended forms with conventional diesel fuel, without modifications to the engine. In addition, biodiesel can be used as an appropriate method to reduce polluting emissions from the engine. Therefore, it is necessary to analyse the influence between the mixing ratio of alternative fuels and their influence on engine emissions. Furthermore, the atomisation characteristics of different alternative fuels (such as spray-tip penetration and mean droplet size) play a decisive role in engine performance. In combination with the different physical properties of the analysed fuels, all influencing factors increase the complexity of the spray phenomena. Therefore, such spray is the subject of intensive experimental studies.
Ramadhas et al., [9], studied correlations between the physical properties of biodiesels and their combustion characteristics. They concluded that biodiesel-blended fuels can be used as alternative fuels for diesel engines without modification and even that pure biodiesel can be used for diesel engines with some minor modifications. Lang et al., [6], showed that, on a foundational level, biodiesels have properties compatible with those of conventional diesels. To study the effect of the high viscosity of biodiesels on spray characteristics, Grimaldi and Postrioti, [4], compared the process of spray development between conventional diesel and biodiesels, using a common-rail injection system. Their results indicated that the spray tip penetrations increase in accordance with the increase in the mixing ratios of the biodiesels. The main reason for this is the fact that biodiesels are barely atomised in comparison to conventional diesel, due to biodiesels’ high surface tension. Despite these efforts, the fuel atomisation and combustion characteristics of alternative fuels have not yet been fully investigated. In particular, research on the correlations of fuel atomisation and combustion performance of the alternative fuels and its blends is needed. In this study, an experimental method for the determination of spray tip penetration and spray length was developed and used for measurements. Injection process characteristics, such as injection pressure, nozzle needle lift, injection rate, and the volume of injected fuel, were recorded simultaneously on a Friedmann-Maier fuel injection systems test bench.
2 EXPERIMENTAL DETAILS
2.1 Injection System Characteristics
Injection characteristics were measured on the Friedmann-Maier type 12 H 100-h fuel injection system test bench, Kegl, [5]. A conventional fuel system with a high pressure pump (Bosch PES6A95D410LS2542) was used. A one-hole injection nozzle with a diameter of 0.68 mm (Bosch DLL25S834) was mounted into system. For the injection pressure measurement, a piezo-resistive sensor (Kistler, type 6227) was used. The nozzle’s needle lift was measured using an inductive sensor. All the data was acquired and processed by a program written in LabVIEW 2012.

�2 JET
Experimental spray study with usage of alternative fuels
----------
When comparing images on Figures 4 and 5, all abovementioned issues (illumination inhomogeneity-edges, fog cloud and spots) can be observed. Grayscale values of both images were stored in a 2D matrix, and Figure 4 was subtracted from Figure 5. The image is presented in Figure 6. The homogeneous background can be noted on Figure 6.
Figure 6: Subtracted image
Furthermore, it is possible to perform a histogram analysis of this image and establish the border value for the background and to set up the maximum greyscale value to extract the greyscale interval with the highest interest, as presented on Figure 7.
Figure 7: Subtracted image-reduced interval
The images presented on Figures 4–7 are stored in a 2D matrix from which it is possible to extract single raw/column. The whole image presented in Figure 7 was sliced perpendicular to the spray propagation. An example is shown in Figure 8.
Figure 8: Slice at 1/3 of spray length
y axis
Grey
scal
e va
lues
Blaž Vajda, Gorazd Bombek, Marko Hočevar, Danilo Ritlop, Breda Kegl, Ignacijo Biluš JET Vol. 6 (2013)
Issue 2
----------
2.3 Image acquisition system
The developing spray was filmed with a Fastec HiSpec 4 high-speed digital camera (Figure 3). The camera was placed at a distance of 1.7 m from the fuel spray. A resolution of 128 × 332 pixels at a frame-rate of 18,499 frames per second (fps) was used. The camera was triggered with electric pulse that was recorded together with pressures p1 and p2, needle lift and the signal of TDC (top dead centre).
Figure 3: High-speed camera Fastec HiSpec4
3 VISUALISATION METHOD FOR FLOW ANALYSIS IN THE LABVIEW PROGRAM
In general, the camera and lightning give good results (image quality) when there is little or no fog (small particles) in the chamber. This condition is met when the rotation speed of the pump and the injection pressures are consequently low. Higher pump rotating speed results in a higher number of cycles and a generally higher amount of fuel injected per cycle at a higher pressure. Higher pressure results in better fuel distribution and, combined with higher quantity of fuel injected per time unit, increases the quantity of fog. During the test, it was observed that the movement of the fog cloud is much slower than the fuel injection. The idea to improve visual quality of the images is based on the presumption that the shape of the fog cloud remains the same during the injection. An additional issue that can be addressed with this approach is illumination in homogeneity or spots on the chamber window. A raw image just before the injection started is presented in Figure 4. Figure 5 was taken just before needle closure.
Figure 4: Image before injection Figure 5: Image at maximal injection
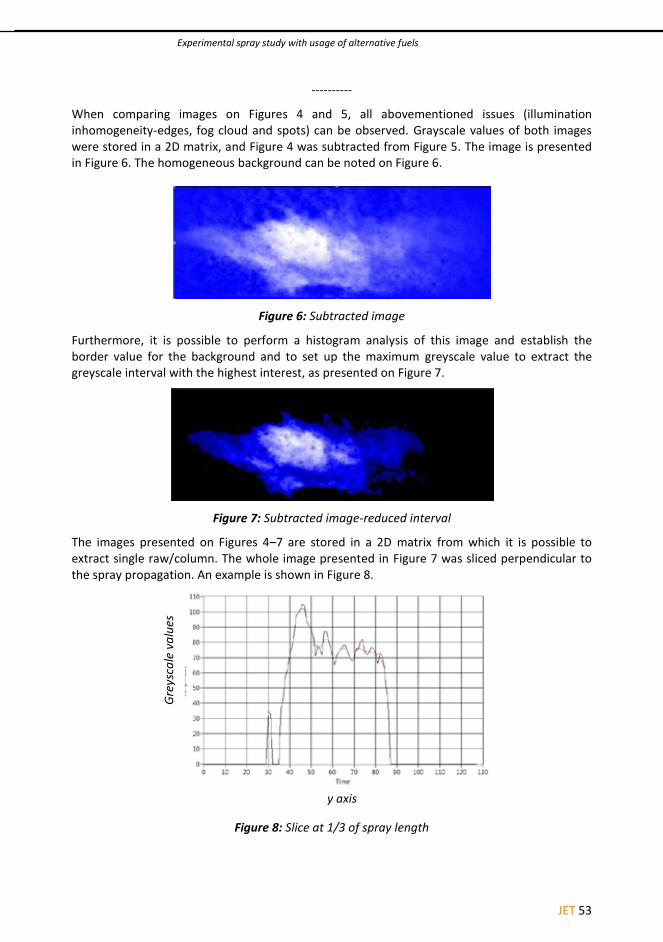
JET ��
Experimental spray study with usage of alternative fuels
----------
When comparing images on Figures 4 and 5, all abovementioned issues (illumination inhomogeneity-edges, fog cloud and spots) can be observed. Grayscale values of both images were stored in a 2D matrix, and Figure 4 was subtracted from Figure 5. The image is presented in Figure 6. The homogeneous background can be noted on Figure 6.
Figure 6: Subtracted image
Furthermore, it is possible to perform a histogram analysis of this image and establish the border value for the background and to set up the maximum greyscale value to extract the greyscale interval with the highest interest, as presented on Figure 7.
Figure 7: Subtracted image-reduced interval
The images presented on Figures 4–7 are stored in a 2D matrix from which it is possible to extract single raw/column. The whole image presented in Figure 7 was sliced perpendicular to the spray propagation. An example is shown in Figure 8.
Figure 8: Slice at 1/3 of spray length
y axis
Grey
scal
e va
lues
Blaž Vajda, Gorazd Bombek, Marko Hočevar, Danilo Ritlop, Breda Kegl, Ignacijo Biluš JET Vol. 6 (2013)
Issue 2
----------
2.3 Image acquisition system
The developing spray was filmed with a Fastec HiSpec 4 high-speed digital camera (Figure 3). The camera was placed at a distance of 1.7 m from the fuel spray. A resolution of 128 × 332 pixels at a frame-rate of 18,499 frames per second (fps) was used. The camera was triggered with electric pulse that was recorded together with pressures p1 and p2, needle lift and the signal of TDC (top dead centre).
Figure 3: High-speed camera Fastec HiSpec4
3 VISUALISATION METHOD FOR FLOW ANALYSIS IN THE LABVIEW PROGRAM
In general, the camera and lightning give good results (image quality) when there is little or no fog (small particles) in the chamber. This condition is met when the rotation speed of the pump and the injection pressures are consequently low. Higher pump rotating speed results in a higher number of cycles and a generally higher amount of fuel injected per cycle at a higher pressure. Higher pressure results in better fuel distribution and, combined with higher quantity of fuel injected per time unit, increases the quantity of fog. During the test, it was observed that the movement of the fog cloud is much slower than the fuel injection. The idea to improve visual quality of the images is based on the presumption that the shape of the fog cloud remains the same during the injection. An additional issue that can be addressed with this approach is illumination in homogeneity or spots on the chamber window. A raw image just before the injection started is presented in Figure 4. Figure 5 was taken just before needle closure.
Figure 4: Image before injection Figure 5: Image at maximal injection
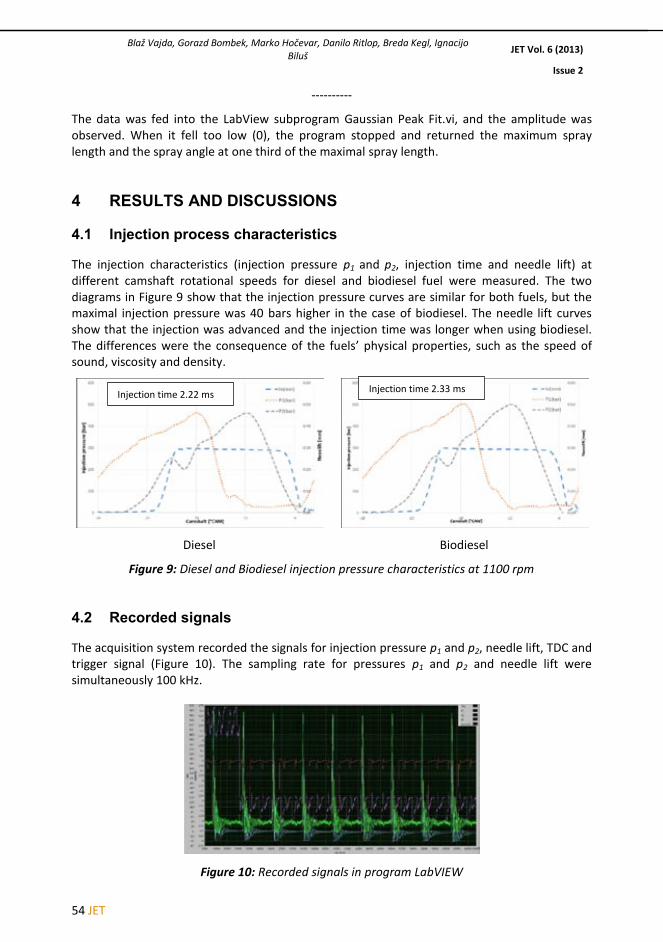
�� JET
Experimental spray study with usage of alternative fuels
----------
4.3 Spray development
Based on the images of the spray visualisation, we have determined main spray developments of interest, for different fuel blends and pressure in chamber, shown on Figures 11–14. The images show the spray development in different camshaft rotational angles. Figure 11b represents the starting point of injection time (needle slowly starts to open), and Figure 11f represents the full development of spray.
For each spray development, two images are shown. The left one on Figure11b represents the image recorded with a high-speed camera, and the right one represents the image analyses with the visualisation method. Comparison of the experimental results shows substantial accordance in the spray development as well as in its shape (spray angle and penetration). The difference in angle and spray length between the alternative fuels is less than 10% (Tables 1 and 2).
Figure 11: Spray development measured with high-speed camera and LabVIEW (B100, 800 rpm,
40 bars)
Blaž Vajda, Gorazd Bombek, Marko Hočevar, Danilo Ritlop, Breda Kegl, Ignacijo Biluš JET Vol. 6 (2013)
Issue 2
----------
The data was fed into the LabView subprogram Gaussian Peak Fit.vi, and the amplitude was observed. When it fell too low (0), the program stopped and returned the maximum spray length and the spray angle at one third of the maximal spray length.
4 RESULTS AND DISCUSSIONS
4.1 Injection process characteristics
The injection characteristics (injection pressure p1 and p2, injection time and needle lift) at different camshaft rotational speeds for diesel and biodiesel fuel were measured. The two diagrams in Figure 9 show that the injection pressure curves are similar for both fuels, but the maximal injection pressure was 40 bars higher in the case of biodiesel. The needle lift curves show that the injection was advanced and the injection time was longer when using biodiesel. The differences were the consequence of the fuels’ physical properties, such as the speed of sound, viscosity and density.
Diesel Biodiesel
Figure 9: Diesel and Biodiesel injection pressure characteristics at 1100 rpm
4.2 Recorded signals
The acquisition system recorded the signals for injection pressure p1 and p2, needle lift, TDC and trigger signal (Figure 10). The sampling rate for pressures p1 and p2 and needle lift were simultaneously 100 kHz.
Figure 10: Recorded signals in program LabVIEW
Injection time 2.22 ms Injection time 2.33 ms
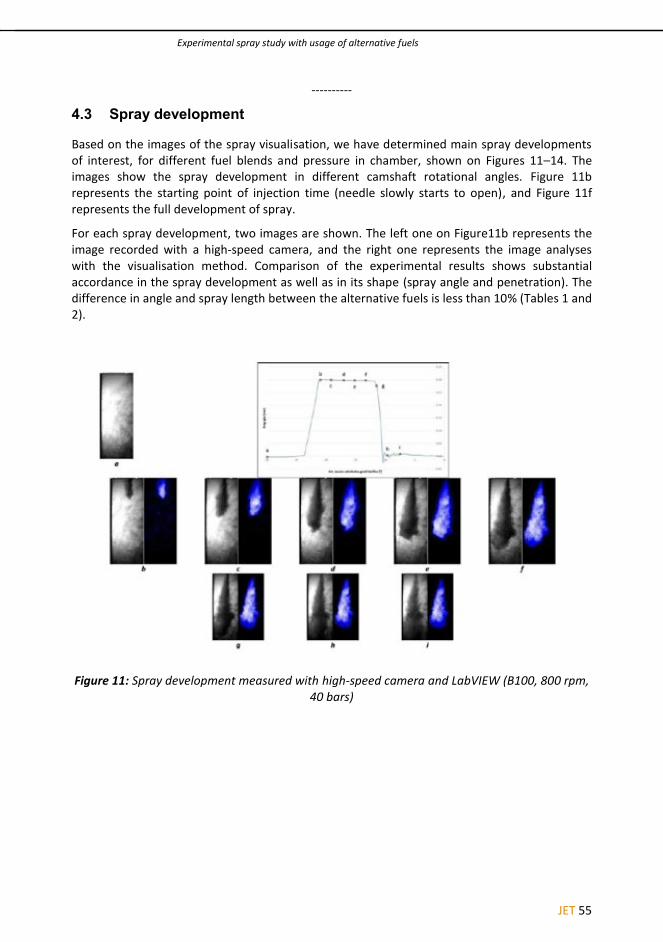
JET ��
Experimental spray study with usage of alternative fuels
----------
4.3 Spray development
Based on the images of the spray visualisation, we have determined main spray developments of interest, for different fuel blends and pressure in chamber, shown on Figures 11–14. The images show the spray development in different camshaft rotational angles. Figure 11b represents the starting point of injection time (needle slowly starts to open), and Figure 11f represents the full development of spray.
For each spray development, two images are shown. The left one on Figure11b represents the image recorded with a high-speed camera, and the right one represents the image analyses with the visualisation method. Comparison of the experimental results shows substantial accordance in the spray development as well as in its shape (spray angle and penetration). The difference in angle and spray length between the alternative fuels is less than 10% (Tables 1 and 2).
Figure 11: Spray development measured with high-speed camera and LabVIEW (B100, 800 rpm,
40 bars)
Blaž Vajda, Gorazd Bombek, Marko Hočevar, Danilo Ritlop, Breda Kegl, Ignacijo Biluš JET Vol. 6 (2013)
Issue 2
----------
The data was fed into the LabView subprogram Gaussian Peak Fit.vi, and the amplitude was observed. When it fell too low (0), the program stopped and returned the maximum spray length and the spray angle at one third of the maximal spray length.
4 RESULTS AND DISCUSSIONS
4.1 Injection process characteristics
The injection characteristics (injection pressure p1 and p2, injection time and needle lift) at different camshaft rotational speeds for diesel and biodiesel fuel were measured. The two diagrams in Figure 9 show that the injection pressure curves are similar for both fuels, but the maximal injection pressure was 40 bars higher in the case of biodiesel. The needle lift curves show that the injection was advanced and the injection time was longer when using biodiesel. The differences were the consequence of the fuels’ physical properties, such as the speed of sound, viscosity and density.
Diesel Biodiesel
Figure 9: Diesel and Biodiesel injection pressure characteristics at 1100 rpm
4.2 Recorded signals
The acquisition system recorded the signals for injection pressure p1 and p2, needle lift, TDC and trigger signal (Figure 10). The sampling rate for pressures p1 and p2 and needle lift were simultaneously 100 kHz.
Figure 10: Recorded signals in program LabVIEW
Injection time 2.22 ms Injection time 2.33 ms
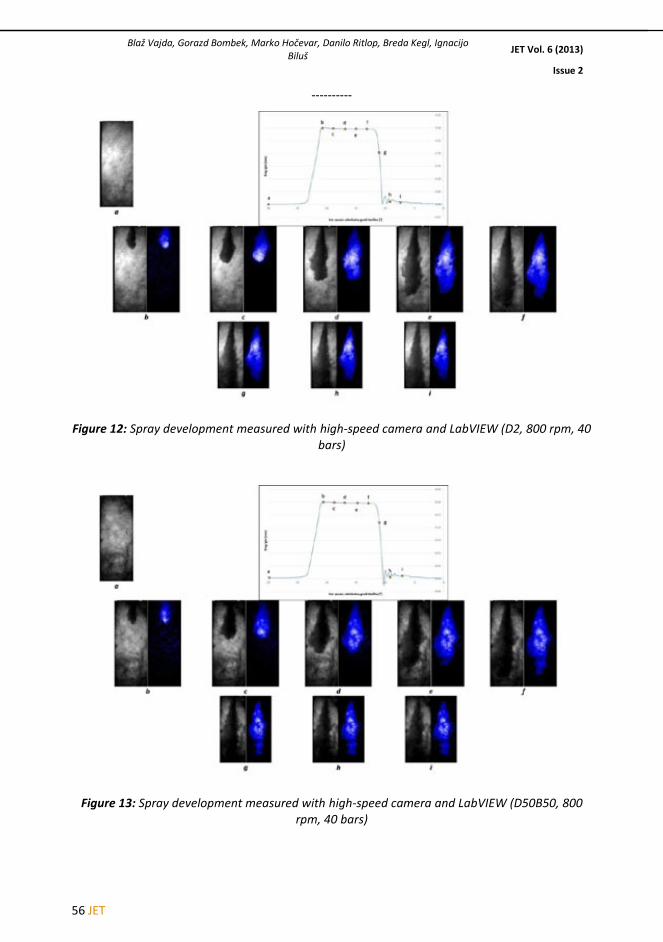
�� JET
Experimental spray study with usage of alternative fuels
----------
Figure 14: Spray development measured with high-speed camera and LabVIEW (D85E15, 800
rpm, 40 bars)
Table 1: Spray development length for different alternative fuels
Fuel D2 B100 D50B50 D85E15
Length [mm] 71.56 72.09 65.42 69.42
Table 2: Spray development angle for different alternative fuels
Fuel D2 B100 D50B50 D85E15
Angle [°] 30.51 29.12 30.32 26.4 5 CONCLUSION
The visualisation method for the determination of spray characteristics described in this paper presents the procedure for the reliable determination of spray length and angle. This study showed that it is possible to use alternative fuels in diesel engines without modifications, but this is limited to older fuel injection systems. The comparison of spray cone angle and length showed that the alternative fuels have similar spray development and characteristics as the standard diesel fuel. In particular:
the results showed minor differences in spray cone angle, spray length at different camshaft rotational speeds has shown some differences,
which are caused by the different densities of the used fuels (B100 ρ=875 [kg/m³]; D2 ρ=825 [kg/m³]; D50B50 ρ=852 [kg/m³]; D85E15 ρ=822 [kg/m³]),
injection time for different fuel blends showed minor differences,
Blaž Vajda, Gorazd Bombek, Marko Hočevar, Danilo Ritlop, Breda Kegl, Ignacijo Biluš JET Vol. 6 (2013)
Issue 2
----------
Figure 12: Spray development measured with high-speed camera and LabVIEW (D2, 800 rpm, 40
bars)
Figure 13: Spray development measured with high-speed camera and LabVIEW (D50B50, 800
rpm, 40 bars)

JET ��
Experimental spray study with usage of alternative fuels
----------
Figure 14: Spray development measured with high-speed camera and LabVIEW (D85E15, 800
rpm, 40 bars)
Table 1: Spray development length for different alternative fuels
Fuel D2 B100 D50B50 D85E15
Length [mm] 71.56 72.09 65.42 69.42
Table 2: Spray development angle for different alternative fuels
Fuel D2 B100 D50B50 D85E15
Angle [°] 30.51 29.12 30.32 26.4 5 CONCLUSION
The visualisation method for the determination of spray characteristics described in this paper presents the procedure for the reliable determination of spray length and angle. This study showed that it is possible to use alternative fuels in diesel engines without modifications, but this is limited to older fuel injection systems. The comparison of spray cone angle and length showed that the alternative fuels have similar spray development and characteristics as the standard diesel fuel. In particular:
the results showed minor differences in spray cone angle, spray length at different camshaft rotational speeds has shown some differences,
which are caused by the different densities of the used fuels (B100 ρ=875 [kg/m³]; D2 ρ=825 [kg/m³]; D50B50 ρ=852 [kg/m³]; D85E15 ρ=822 [kg/m³]),
injection time for different fuel blends showed minor differences,
Blaž Vajda, Gorazd Bombek, Marko Hočevar, Danilo Ritlop, Breda Kegl, Ignacijo Biluš JET Vol. 6 (2013)
Issue 2
----------
Figure 12: Spray development measured with high-speed camera and LabVIEW (D2, 800 rpm, 40
bars)
Figure 13: Spray development measured with high-speed camera and LabVIEW (D50B50, 800
rpm, 40 bars)
�� JET
JET Volume 6 (2013), p.p. 59 - 70
Issue 2, May 2013
http://www.fe.um.si/en/jet.html
ENERGY RENOVATION OF AN OLDER HOUSE
ENERGETSKA PRENOVA STAREJŠE HIŠE
Zdravko Praunseis, Jurij Avsec, Simon Marčič, Renato Strojko
Keywords : energy, energy performance certificate, renovation, renewable sources
Abstract This paper presents an energy renovation of an older house, according to state regulations for efficient energy use. There are many ways to design successful energy efficient homes, because they can be built from many different types of material. Becoming a successful builder of energy-efficient homes does not merely require proficient knowledge of theory in new building techniques, but also skills in implementing innovative designs and high-quality construction practises. The energy performance of the building is evaluated and then an energy performance certificate is granted; these certificates are obligatory for all public buildings and also for all buildings that are rented or sold.
Povzetek Članek predstavlja energetsko sanacijo starejših hiš glede na veljavni državni Pravilnik o učinkoviti rabi energije. Obstaja mnogo različnih možnosti kako uspešno izvesti in doseči energetsko učinkovitost zgradb glede na uporabo različnih konstrukcijskih materialov. Uspešen projektant energetsko varčnih hiš mora poleg sodobne gradnje stavb poznati tudi možnosti praktične uporabe inovativnih konstrukcijskih idej in obstoječih praks v svetu. Prikazani so energetski kazalci, ki jih podaja Energetska izkaznica in številčno ovrednotijo stavbo glede na
Corresponding author: Zdravko Praunseis, PhD, Faculty of Energy Techology, University of Maribor, Tel.:+386 31 743 753, Fax: +386 7 620 2222, Mailing address : Hočevarjev trg 1, 8270 Krško, Slovenia E-mail address: zdravko.praunseis@uni-mb-si
Blaž Vajda, Gorazd Bombek, Marko Hočevar, Danilo Ritlop, Breda Kegl, Ignacijo Biluš JET Vol. 6 (2013)
Issue 2
----------
the injection pressures p1 and p2 shows differences between them and indicate the importance of further experimental investigations.
References
[1] Allen C. A. W.: Prediction of biodiesel fuel atomization characteristics based on measured properties. PhD Dissertation, Dalhousie University - DALTECH, Halifax, Canada, 1998.
[2] Chang C. T., Farrell P. V.: Effects of Biodiesel Blended Fuels and Multiple injections on D.I. Diesel Engine Emissions. SAE 970218, Society of Automotive Engineers: Warrendale, PA, 1997.
[3] Corpetti T., Heitz D., Arroyo G., Mémin É., A. Santa-Cruz: Fluid experimental flow estimation based on an optical-flow scheme. Exp. Fluids 40, pp. 80–97 (2006).
[4] Grimaldi, C.; Postrioti, L.: SAE Tech. Pap. Ser. 2000, 2000-01-1252. [5] Kegl B.: Numerical analysis of injection characteristics using biodiesel fuel. Fuel 2006, 85,
2377–2387. [6] Lang, X.; Dalai, A. K.; Bakhshi, N. N.; Reaney, M. J.; Hertz, P. B.: Bioresource. Technol.
2001, 80, 53–62. [7] Lee, S. Tanaka, D. Kusaka, J. Daisho, Y.: Effects of diesel fuel characteristics on spray and
combustion in a diesel engine. JSAE200224660, Japanese Society of Automotive engineers: Tokyo, Japan, 2002.
[8] Lee, C. S. Park, S. W. Kwon, S. I.: An Experimental Study on the Atomization and Combustion Characteristics of Biodiesel-Blended Fuels. Energy Fuels 2005, 19, 2201
[9] Ramadhas, A. S. Jayaraj, S. Muraleedharan, C.: Renewable Energy 2004, 29, 727–742.

JET ��
JET Volume 6 (2013), p.p. 59 - 70
Issue 2, May 2013
http://www.fe.um.si/en/jet.html
ENERGY RENOVATION OF AN OLDER HOUSE
ENERGETSKA PRENOVA STAREJŠE HIŠE
Zdravko Praunseis, Jurij Avsec, Simon Marčič, Renato Strojko
Keywords : energy, energy performance certificate, renovation, renewable sources
Abstract This paper presents an energy renovation of an older house, according to state regulations for efficient energy use. There are many ways to design successful energy efficient homes, because they can be built from many different types of material. Becoming a successful builder of energy-efficient homes does not merely require proficient knowledge of theory in new building techniques, but also skills in implementing innovative designs and high-quality construction practises. The energy performance of the building is evaluated and then an energy performance certificate is granted; these certificates are obligatory for all public buildings and also for all buildings that are rented or sold.
Povzetek Članek predstavlja energetsko sanacijo starejših hiš glede na veljavni državni Pravilnik o učinkoviti rabi energije. Obstaja mnogo različnih možnosti kako uspešno izvesti in doseči energetsko učinkovitost zgradb glede na uporabo različnih konstrukcijskih materialov. Uspešen projektant energetsko varčnih hiš mora poleg sodobne gradnje stavb poznati tudi možnosti praktične uporabe inovativnih konstrukcijskih idej in obstoječih praks v svetu. Prikazani so energetski kazalci, ki jih podaja Energetska izkaznica in številčno ovrednotijo stavbo glede na
Corresponding author: Zdravko Praunseis, PhD, Faculty of Energy Techology, University of Maribor, Tel.:+386 31 743 753, Fax: +386 7 620 2222, Mailing address : Hočevarjev trg 1, 8270 Krško, Slovenia E-mail address: zdravko.praunseis@uni-mb-si
Blaž Vajda, Gorazd Bombek, Marko Hočevar, Danilo Ritlop, Breda Kegl, Ignacijo Biluš JET Vol. 6 (2013)
Issue 2
----------
the injection pressures p1 and p2 shows differences between them and indicate the importance of further experimental investigations.
References
[1] Allen C. A. W.: Prediction of biodiesel fuel atomization characteristics based on measured properties. PhD Dissertation, Dalhousie University - DALTECH, Halifax, Canada, 1998.
[2] Chang C. T., Farrell P. V.: Effects of Biodiesel Blended Fuels and Multiple injections on D.I. Diesel Engine Emissions. SAE 970218, Society of Automotive Engineers: Warrendale, PA, 1997.
[3] Corpetti T., Heitz D., Arroyo G., Mémin É., A. Santa-Cruz: Fluid experimental flow estimation based on an optical-flow scheme. Exp. Fluids 40, pp. 80–97 (2006).
[4] Grimaldi, C.; Postrioti, L.: SAE Tech. Pap. Ser. 2000, 2000-01-1252. [5] Kegl B.: Numerical analysis of injection characteristics using biodiesel fuel. Fuel 2006, 85,
2377–2387. [6] Lang, X.; Dalai, A. K.; Bakhshi, N. N.; Reaney, M. J.; Hertz, P. B.: Bioresource. Technol.
2001, 80, 53–62. [7] Lee, S. Tanaka, D. Kusaka, J. Daisho, Y.: Effects of diesel fuel characteristics on spray and
combustion in a diesel engine. JSAE200224660, Japanese Society of Automotive engineers: Tokyo, Japan, 2002.
[8] Lee, C. S. Park, S. W. Kwon, S. I.: An Experimental Study on the Atomization and Combustion Characteristics of Biodiesel-Blended Fuels. Energy Fuels 2005, 19, 2201
[9] Ramadhas, A. S. Jayaraj, S. Muraleedharan, C.: Renewable Energy 2004, 29, 727–742.

�0 JET
Energy renovation of an older house
----------
Figure 1: Dominant factors for energy efficiency building
2 ENERGY EFFICIENT BUILDINGS – LAW REQUIREMENTS
As a member of the EU, the Republic of Slovenia has adopted EU Directive EU-EPBD Recast 2010/31/EU (previously, Directive EU-EPBD 2002/91/EU). Both directives are related to the energy efficiency of buildings. Some other EU directives have also been adopted for the purposes of energy reduction, e.g. Directive 2006/32/EC on end-use efficiency and energy services and Directive 2009/28/EC on renewable energy, according to which Slovenia has to achieve a goal of 25% renewable energy sources in end use.
On the basis of the above-mentioned EU directives, Slovenia has adopted new proposals and requirements in its legislation, UL RS, [2,3]; the law covering civil engineering has prescribed new regulations:
Statute of efficient energy use in buildings (PURES 2010).
Technical guide TSG-1-004:2010-Efficient energy use.
When preparing project documentation for obtaining building permission, a document of energy performance for the building must be prepared as a standard part of the civil engineering requirements.
User
Renewable sources of
energy
Energy efficient equipment
Low-energy arhitectural design and excelent protection of the
building's envelope
Zdravko Praunseis, Jurij Avsec, Simon Marčič, Renato Strojko JET Vol. 6 (2013)
Issue 2
----------
porabo energije. Energetska izkaznica je po novi zakonodaji obvezna za vse javne objekte in tudi za vse objekte, ki so predmet nepremičninskih poslov.
1 INTRODUCTION
In the Republic of Slovenia, buildings are mostly energy inefficient. For example, almost two-thirds of multi-dwelling buildings are energy inefficient with regard to the thickness of the insulation of the external walls. Moreover, only 16% of all windows have energy efficient glass. Energy efficient renovation is defined as that which accomplishes at least a 30% reduction of energy use and, of course, fulfils all requirements set by law. Such goals can be reached by carefully planning a renovation; specifically, the following steps should be followed, Praunseis, [1]:
Constructing a so-called building envelope with additional heat insulation made without heat-bridges and (as much as possible) airless,
Installing new efficiency equipment for heating and air-conditioning with recuperative functions and low electricity consumption,
Installing low-emissivity window glazing to control solar heat gain and loss in hot climates,
Making use of solar energy for hot water preparation can reduce energy consumption by at least 50%,
Installing a photovoltaic system (PV system) for generating electric power influences the energy balance of the building,
Selecting appropriate energy carriers, i.e. choosing renewable energy and systems where possible,
Building a passive cooling system.
With the practical case of the Jozlinova house, some renovation possibilities shall be demonstrated with the main goal of making an energy efficient house. Materials and construction types for the walls, ensuring the presence of excellent heat envelope of the building as well as some renewable sources of energy, shall be presented.

JET �1
Energy renovation of an older house
----------
Figure 1: Dominant factors for energy efficiency building
2 ENERGY EFFICIENT BUILDINGS – LAW REQUIREMENTS
As a member of the EU, the Republic of Slovenia has adopted EU Directive EU-EPBD Recast 2010/31/EU (previously, Directive EU-EPBD 2002/91/EU). Both directives are related to the energy efficiency of buildings. Some other EU directives have also been adopted for the purposes of energy reduction, e.g. Directive 2006/32/EC on end-use efficiency and energy services and Directive 2009/28/EC on renewable energy, according to which Slovenia has to achieve a goal of 25% renewable energy sources in end use.
On the basis of the above-mentioned EU directives, Slovenia has adopted new proposals and requirements in its legislation, UL RS, [2,3]; the law covering civil engineering has prescribed new regulations:
Statute of efficient energy use in buildings (PURES 2010).
Technical guide TSG-1-004:2010-Efficient energy use.
When preparing project documentation for obtaining building permission, a document of energy performance for the building must be prepared as a standard part of the civil engineering requirements.
User
Renewable sources of
energy
Energy efficient equipment
Low-energy arhitectural design and excelent protection of the
building's envelope
Zdravko Praunseis, Jurij Avsec, Simon Marčič, Renato Strojko JET Vol. 6 (2013)
Issue 2
----------
porabo energije. Energetska izkaznica je po novi zakonodaji obvezna za vse javne objekte in tudi za vse objekte, ki so predmet nepremičninskih poslov.
1 INTRODUCTION
In the Republic of Slovenia, buildings are mostly energy inefficient. For example, almost two-thirds of multi-dwelling buildings are energy inefficient with regard to the thickness of the insulation of the external walls. Moreover, only 16% of all windows have energy efficient glass. Energy efficient renovation is defined as that which accomplishes at least a 30% reduction of energy use and, of course, fulfils all requirements set by law. Such goals can be reached by carefully planning a renovation; specifically, the following steps should be followed, Praunseis, [1]:
Constructing a so-called building envelope with additional heat insulation made without heat-bridges and (as much as possible) airless,
Installing new efficiency equipment for heating and air-conditioning with recuperative functions and low electricity consumption,
Installing low-emissivity window glazing to control solar heat gain and loss in hot climates,
Making use of solar energy for hot water preparation can reduce energy consumption by at least 50%,
Installing a photovoltaic system (PV system) for generating electric power influences the energy balance of the building,
Selecting appropriate energy carriers, i.e. choosing renewable energy and systems where possible,
Building a passive cooling system.
With the practical case of the Jozlinova house, some renovation possibilities shall be demonstrated with the main goal of making an energy efficient house. Materials and construction types for the walls, ensuring the presence of excellent heat envelope of the building as well as some renewable sources of energy, shall be presented.

�2 JET
Energy renovation of an older house
----------
Roof – For the roof, a typical style with ventilation (Fig.4) was built with two layers of mineral wool insulation so that all thicknesses of insulation are greater than 20 cm; mineral wool was fixed in rolls between wooden beams (pos. 8); wool was additionally fixed in slabs (pos. 9) to wooden beams. An aluminium vapour-stop membrane was tightly fixed to the isolation from inside (pos.10). Finally, a layer of Knauf gypsum board (pos.11) was added; this material is excellent for cladding walls and ceilings constructed on metal grids and wooden frames: for backing surfaces, partitions and ceilings.
Figure 4: Roof details
Basement – Renovation of the basement of an old house requires considerable attention; it cannot be assumed that that earth is a good isolator. The floor in the basement (Fig.5) must be insulated (insulation under concrete baseplate) and simultaneously protected against water (hydro-insulation). On the concrete baseplate, the first layer of insulation of XPES (extruded polystyrene) was fixed (Fig 6.), then a layer of concrete (slab concrete) and finally ceramic tile. The layer of concrete was used for levelling and serves as a solid basis for the final layer.
Figure 5: Basement waterproofing detail Figure 6: Placing of XEPS isolation
Doors and windows (building furniture) – Wooden windows of the brand Ekolight were chosen. These windows are double-glazed (Uw= 1.2 W/m²K). Spruce wooden doors of the brand Klasik were also chosen (Ud < 1.6 W/m²K) (Fig.7).
Zdravko Praunseis, Jurij Avsec, Simon Marčič, Renato Strojko JET Vol. 6 (2013)
Issue 2
----------
3 RENOVATION
Renovation typically entails two phases: civil works for improving the building envelope and installing new equipment, Praunseis et al., [4].
3.1 Renovation for improving building envelope- civil works
The building envelope is the border between the building and its surroundings; these are primarily the external walls, roof and ground-floor.
External wall – A decision was made that the outside wall be built from modular bricks, which are excellent insulators and a well-known material. Recently developed bricks have thicker walls to provide better thermal insulation; the latest versions use internal fillers instead of air.
Requirements for much lower thermal transmittance for walls can be attained with the use of insulating material, such as glass wool (fiberglass), mineral wool (stone wool), EPS (expanded polystyrene); where water is present, XEPS (extruded polystyrene) shall be used. All these insulating materials have low thermal conductivity (λ; W/mK), i.e. they retain heat. All the above-mentioned insulating materials can be used with ease as they are light, inexpensive and easily handled. Recently, cellulose insulation has been used in wooden panel buildings; it is placed in the space between wooden panels with a blower. Cellulose is considered to be an ecologically sound material and has lower temperature conductivity (a=λ/ρ x c; m²/h) than mineral wool. It also has a longer phase delay, which means that more time is needed to warm or cool the place, which is especially useful in summer when the building is being cooled at night.
For insulation against water and moisture (waterproofing), a hydro-isolation material shall be used. This waterproofing membrane (Fig.2) is made from different types of reinforcement (glass fleece, geotextile) coated on both sides with oxidized bitumen. This shall be built as the first ground-layer insulation on the concrete floor. Special requirements for waterproofing are necessary for basement rooms.
Special attention must be dedicated to the physics of the building and for water and water vapour transfer through different types of walls or other construction elements. For this purpose, protective membranes made from extremely thin PVC or PE (Fig.3) are used. They are classified according to their function: to stop water and let vapour pass, or to stop both vapour and water. As a rule, the outer side of the external wall shall be guaranteed waterproof, and there must be a membrane that lets vapour through on the inner side of the external wall.
Figure 2: Waterproofing membrane Figure 3: PE protective membrane

JET ��
Energy renovation of an older house
----------
Roof – For the roof, a typical style with ventilation (Fig.4) was built with two layers of mineral wool insulation so that all thicknesses of insulation are greater than 20 cm; mineral wool was fixed in rolls between wooden beams (pos. 8); wool was additionally fixed in slabs (pos. 9) to wooden beams. An aluminium vapour-stop membrane was tightly fixed to the isolation from inside (pos.10). Finally, a layer of Knauf gypsum board (pos.11) was added; this material is excellent for cladding walls and ceilings constructed on metal grids and wooden frames: for backing surfaces, partitions and ceilings.
Figure 4: Roof details
Basement – Renovation of the basement of an old house requires considerable attention; it cannot be assumed that that earth is a good isolator. The floor in the basement (Fig.5) must be insulated (insulation under concrete baseplate) and simultaneously protected against water (hydro-insulation). On the concrete baseplate, the first layer of insulation of XPES (extruded polystyrene) was fixed (Fig 6.), then a layer of concrete (slab concrete) and finally ceramic tile. The layer of concrete was used for levelling and serves as a solid basis for the final layer.
Figure 5: Basement waterproofing detail Figure 6: Placing of XEPS isolation
Doors and windows (building furniture) – Wooden windows of the brand Ekolight were chosen. These windows are double-glazed (Uw= 1.2 W/m²K). Spruce wooden doors of the brand Klasik were also chosen (Ud < 1.6 W/m²K) (Fig.7).
Zdravko Praunseis, Jurij Avsec, Simon Marčič, Renato Strojko JET Vol. 6 (2013)
Issue 2
----------
3 RENOVATION
Renovation typically entails two phases: civil works for improving the building envelope and installing new equipment, Praunseis et al., [4].
3.1 Renovation for improving building envelope- civil works
The building envelope is the border between the building and its surroundings; these are primarily the external walls, roof and ground-floor.
External wall – A decision was made that the outside wall be built from modular bricks, which are excellent insulators and a well-known material. Recently developed bricks have thicker walls to provide better thermal insulation; the latest versions use internal fillers instead of air.
Requirements for much lower thermal transmittance for walls can be attained with the use of insulating material, such as glass wool (fiberglass), mineral wool (stone wool), EPS (expanded polystyrene); where water is present, XEPS (extruded polystyrene) shall be used. All these insulating materials have low thermal conductivity (λ; W/mK), i.e. they retain heat. All the above-mentioned insulating materials can be used with ease as they are light, inexpensive and easily handled. Recently, cellulose insulation has been used in wooden panel buildings; it is placed in the space between wooden panels with a blower. Cellulose is considered to be an ecologically sound material and has lower temperature conductivity (a=λ/ρ x c; m²/h) than mineral wool. It also has a longer phase delay, which means that more time is needed to warm or cool the place, which is especially useful in summer when the building is being cooled at night.
For insulation against water and moisture (waterproofing), a hydro-isolation material shall be used. This waterproofing membrane (Fig.2) is made from different types of reinforcement (glass fleece, geotextile) coated on both sides with oxidized bitumen. This shall be built as the first ground-layer insulation on the concrete floor. Special requirements for waterproofing are necessary for basement rooms.
Special attention must be dedicated to the physics of the building and for water and water vapour transfer through different types of walls or other construction elements. For this purpose, protective membranes made from extremely thin PVC or PE (Fig.3) are used. They are classified according to their function: to stop water and let vapour pass, or to stop both vapour and water. As a rule, the outer side of the external wall shall be guaranteed waterproof, and there must be a membrane that lets vapour through on the inner side of the external wall.
Figure 2: Waterproofing membrane Figure 3: PE protective membrane

�� JET
Energy renovation of an older house
----------
winter and cooling in summer, though it is not true air conditioning without a facility to adjust the humidity of the inside air. Though the cost of installation is generally high, it is less than the cost of a ground source heat pump because the latter requires excavation to install its ground loop.
Figure 10: Air source-heat pump Figure 11: Function of air source heat pump
Installing heat recovery ventilation
Heat recovery ventilation (HRV) is an energy recovery ventilation system using equipment known as a heat recovery ventilator, heat exchanger, air exchanger, or air-to-air heat exchanger (Fig. 12), which employs a counter-flow heat exchanger (counter current heat exchange) between the inbound and outbound air flows. HRV provides fresh air and improved climate control, while also saving energy by reducing heating (and cooling) requirements.
Figure 12: Main unit of heat recovery ventilation
Placing underfloor heating
Underfloor heating (Fig.13) was selected due to its low temperature level of heating (35 degrees Celsius) which is very comfortable, heating rooms and their occupants from the bottom-up. The low temperature level of this heating is more economical than other methods requiring middle
Zdravko Praunseis, Jurij Avsec, Simon Marčič, Renato Strojko JET Vol. 6 (2013)
Issue 2
----------
Figure 7: Windows and doors
3.2 Placing new equipment based on renewable energy
State regulations prescribe that at least 20% of all needed building energy must be provided by renewable sources of energy.
Renewable sources of energy are:
1. Sunlight (solar thermal collection system for hot water and photovoltaic system, or PV system for converting sunlight into electricity)
2. Wind (bulk movement of air) 3. Hydro-electric (rivers, rain, tides, waves) 4. Biomass biological material) 5. Geothermal (thermal energy generated and stored in the ground)
For our building, the following steps were taken:
Placing solar thermal collectors (evacuated tube type) (Fig.8) for hot water and supporting heating in winter
Figure 8: Fixed solar collectors Figure 9: Evacuated tube collectors
For hot water, evacuated tube collectors (Fig.9) are based on the latest technology and achieve greater efficiency than previous flat-plate collectors, especially in colder conditions. A vacuum between the two glass layers insulates against heat loss.
Placing an air-source heat pump for heating Air-source heat pumps (ASHPs) (Fig. 10) are used to provide interior space heating and cooling even in colder climates, and can be used efficiently for water heating in milder climates (Fig. 11). A major advantage of some ASHPs is that the same system may be used for heating in
JET ��
Energy renovation of an older house
----------
winter and cooling in summer, though it is not true air conditioning without a facility to adjust the humidity of the inside air. Though the cost of installation is generally high, it is less than the cost of a ground source heat pump because the latter requires excavation to install its ground loop.
Figure 10: Air source-heat pump Figure 11: Function of air source heat pump
Installing heat recovery ventilation
Heat recovery ventilation (HRV) is an energy recovery ventilation system using equipment known as a heat recovery ventilator, heat exchanger, air exchanger, or air-to-air heat exchanger (Fig. 12), which employs a counter-flow heat exchanger (counter current heat exchange) between the inbound and outbound air flows. HRV provides fresh air and improved climate control, while also saving energy by reducing heating (and cooling) requirements.
Figure 12: Main unit of heat recovery ventilation
Placing underfloor heating
Underfloor heating (Fig.13) was selected due to its low temperature level of heating (35 degrees Celsius) which is very comfortable, heating rooms and their occupants from the bottom-up. The low temperature level of this heating is more economical than other methods requiring middle
Zdravko Praunseis, Jurij Avsec, Simon Marčič, Renato Strojko JET Vol. 6 (2013)
Issue 2
----------
Figure 7: Windows and doors
3.2 Placing new equipment based on renewable energy
State regulations prescribe that at least 20% of all needed building energy must be provided by renewable sources of energy.
Renewable sources of energy are:
1. Sunlight (solar thermal collection system for hot water and photovoltaic system, or PV system for converting sunlight into electricity)
2. Wind (bulk movement of air) 3. Hydro-electric (rivers, rain, tides, waves) 4. Biomass biological material) 5. Geothermal (thermal energy generated and stored in the ground)
For our building, the following steps were taken:
Placing solar thermal collectors (evacuated tube type) (Fig.8) for hot water and supporting heating in winter
Figure 8: Fixed solar collectors Figure 9: Evacuated tube collectors
For hot water, evacuated tube collectors (Fig.9) are based on the latest technology and achieve greater efficiency than previous flat-plate collectors, especially in colder conditions. A vacuum between the two glass layers insulates against heat loss.
Placing an air-source heat pump for heating Air-source heat pumps (ASHPs) (Fig. 10) are used to provide interior space heating and cooling even in colder climates, and can be used efficiently for water heating in milder climates (Fig. 11). A major advantage of some ASHPs is that the same system may be used for heating in

�� JET
Energy renovation of an older house
----------
Figure 15: Energy performance certificate
Zdravko Praunseis, Jurij Avsec, Simon Marčič, Renato Strojko JET Vol. 6 (2013)
Issue 2
----------
or high temperatures, i.e. the energy needed for heating can be attained with less power. One alternative is a wall heating system (Fig. 14).
Figure 13: Underfloor heating system Figure 14: Wall heating system
4 RESULTS OF THE ENERGY RENOVATION
All the activities done for an energy renovation of an older house becoming can be measured. Approval for energy efficient building is given by numeric (energy level) indicators. For this purpose, an energy performance certificate, UL RS, [5], has been adopted; this is a public document accompanied by recommendations for the cost-effective improvement of the energy performance. An energy performance certificate can be calculated according to the type of building. For our building, the calculated energy performance certificate was issued using the Knauf-energy software programme and can be seen below.
1. Coefficient of heat loss due to transmission through the building envelope area Ht`(T) = H(t)/A
Ht`< 0.28 + TL/300 + 0.04/fo + z/4 (4.1)
Where fo means no number between the window area (z means civil engineering frame) and the building envelope area
Ht' = 0.295 W/m²K < Ht'max= 0.396 W/m²K
JET ��
Energy renovation of an older house
----------
Figure 15: Energy performance certificate
Zdravko Praunseis, Jurij Avsec, Simon Marčič, Renato Strojko JET Vol. 6 (2013)
Issue 2
----------
or high temperatures, i.e. the energy needed for heating can be attained with less power. One alternative is a wall heating system (Fig. 14).
Figure 13: Underfloor heating system Figure 14: Wall heating system
4 RESULTS OF THE ENERGY RENOVATION
All the activities done for an energy renovation of an older house becoming can be measured. Approval for energy efficient building is given by numeric (energy level) indicators. For this purpose, an energy performance certificate, UL RS, [5], has been adopted; this is a public document accompanied by recommendations for the cost-effective improvement of the energy performance. An energy performance certificate can be calculated according to the type of building. For our building, the calculated energy performance certificate was issued using the Knauf-energy software programme and can be seen below.
1. Coefficient of heat loss due to transmission through the building envelope area Ht`(T) = H(t)/A
Ht`< 0.28 + TL/300 + 0.04/fo + z/4 (4.1)
Where fo means no number between the window area (z means civil engineering frame) and the building envelope area
Ht' = 0.295 W/m²K < Ht'max= 0.396 W/m²K

�� JET
Energy renovation of an older house
----------
which shall be limited due to new regulation. Managing energy shall become increasingly economical due to regulations and new technical solutions.
References
[1] Z. Praunseis, R. Strojko: Energy efficient Jozlinova house, Project work, University of Maribor, Faculty of Energy Technology, April 2013
[2] UL RS: Statute of efficient energy use in buildings (PURES 2010) (Pravilnik o učinkoviti rabi energije v stavbah - UL RS št. 52/30.6.2010)
[3] UL RS: Technical guide TSG-1-004:2010-Efficient energy use; (Tehnična smernica za graditev TSG-1-004- Učinkovita raba energije - UL RS št. 52/30.6.2010)
[4] Z. Praunseis: Energy efficient house, EOO, lectures, University of Maribor, Faculty of Energy Technology, February 2012
[5] UL RS: Statute of methodology making and issuing of energy performance certificates for buildings (Pravilnik o metodologiji izdelave in izdaji energetski izkaznic stavb – UL RS št. 77/2009 z dne 02.10.2009 in Pravilnik o spremembah in dopolnitvah Pravilnika o metodologiji izdelave in izdaji energetskih izkaznic stavb – UL RS št. 93/2012 z dne 07.12.2012)
Nomenclature
(Symbols) (Symbol meaning)
λ thermal conductivity
a temperature conductivity
U heat transfer coefficient
Zdravko Praunseis, Jurij Avsec, Simon Marčič, Renato Strojko JET Vol. 6 (2013)
Issue 2
----------
2. The allowed yearly energy need for heating of building, Q(NH), calculated to condition area A(k) or volume of the building V(e) shall not be exceeded:
Q(NH)/ V(e) < 45 + 60 f(0) – 4.4 T(L) (kWh/m²a) (for residential buildings) (4.2)
Q(NH)/A(k) = 17.9 KWh/m²a < (Q(NH)/A(k))max= 43.1 kWh/m²a
As can be seen in energy performance certificate (see above), our building is classified as B1.
3. The allowed yearly energy need for cooling, Q(NC), of building, calculated to condition area A(k) shall not be exceeded.
Q(NC)/A(k) < 50 kWh/m²a (for residential buildings) (4.3)
Q(NC)/A(k) = 18.6 kWh/m²a < (Q(NC)/A(k))max= 70 kWh/m²a
4. The allowed yearly energy need for working all systems in building Q(p), calculated to condition area A(k) shall not be exceeded :
Q(p)/A(k)= 200 + 1.1 (60 f(0) – 4,4 T(L)) kWh/m²a (4.4)
Q(p)/A(k) = 62.5 kWh/m²a < (Q(p)/A(k))max= 187 kwh/m²a
5. The calculated yearly CO2 emission is 33 kg/m²a
6. The percentage ratio of renewable sources of energy is 44%, which confirms that the prescribed demand has been reached.
7. The calculated thermal conductivities of the building envelope are below the prescribed values in the TSG-1-004:2010 book.
5 CONCLUSIONS
The scope of the task was to illustrate improving a building's energy efficiency according to the requirements of the latest state regulations. The main materials and technologies are demonstrated as sample model for the construction of building envelopes in order to achieve all prescribed requirements. Renewable sources of energy are classified, as are the technical solutions that have been chosen for our building.
The energy performance certificate was calculated and created; all proposed and executed tasks for energy efficient of the house were evaluated by the PC program. The result is the calculation and a certificate showing that all required parameters have been fulfilled. It has definitively been confirmed that our renovated building, the Jozlinova House, is an energy-efficient building, which will result in much lower energy costs.
Our building has a B1 energy performance certificate, which means that it has exceptionally high energy efficiency and can be classified as a “low-energy house”.
Energy efficiency is becoming increasingly important, and its role in the future will be even more significant in geo-politics. This requires controlling and managing energy consumption,

JET ��
Energy renovation of an older house
----------
which shall be limited due to new regulation. Managing energy shall become increasingly economical due to regulations and new technical solutions.
References
[1] Z. Praunseis, R. Strojko: Energy efficient Jozlinova house, Project work, University of Maribor, Faculty of Energy Technology, April 2013
[2] UL RS: Statute of efficient energy use in buildings (PURES 2010) (Pravilnik o učinkoviti rabi energije v stavbah - UL RS št. 52/30.6.2010)
[3] UL RS: Technical guide TSG-1-004:2010-Efficient energy use; (Tehnična smernica za graditev TSG-1-004- Učinkovita raba energije - UL RS št. 52/30.6.2010)
[4] Z. Praunseis: Energy efficient house, EOO, lectures, University of Maribor, Faculty of Energy Technology, February 2012
[5] UL RS: Statute of methodology making and issuing of energy performance certificates for buildings (Pravilnik o metodologiji izdelave in izdaji energetski izkaznic stavb – UL RS št. 77/2009 z dne 02.10.2009 in Pravilnik o spremembah in dopolnitvah Pravilnika o metodologiji izdelave in izdaji energetskih izkaznic stavb – UL RS št. 93/2012 z dne 07.12.2012)
Nomenclature
(Symbols) (Symbol meaning)
λ thermal conductivity
a temperature conductivity
U heat transfer coefficient
Zdravko Praunseis, Jurij Avsec, Simon Marčič, Renato Strojko JET Vol. 6 (2013)
Issue 2
----------
2. The allowed yearly energy need for heating of building, Q(NH), calculated to condition area A(k) or volume of the building V(e) shall not be exceeded:
Q(NH)/ V(e) < 45 + 60 f(0) – 4.4 T(L) (kWh/m²a) (for residential buildings) (4.2)
Q(NH)/A(k) = 17.9 KWh/m²a < (Q(NH)/A(k))max= 43.1 kWh/m²a
As can be seen in energy performance certificate (see above), our building is classified as B1.
3. The allowed yearly energy need for cooling, Q(NC), of building, calculated to condition area A(k) shall not be exceeded.
Q(NC)/A(k) < 50 kWh/m²a (for residential buildings) (4.3)
Q(NC)/A(k) = 18.6 kWh/m²a < (Q(NC)/A(k))max= 70 kWh/m²a
4. The allowed yearly energy need for working all systems in building Q(p), calculated to condition area A(k) shall not be exceeded :
Q(p)/A(k)= 200 + 1.1 (60 f(0) – 4,4 T(L)) kWh/m²a (4.4)
Q(p)/A(k) = 62.5 kWh/m²a < (Q(p)/A(k))max= 187 kwh/m²a
5. The calculated yearly CO2 emission is 33 kg/m²a
6. The percentage ratio of renewable sources of energy is 44%, which confirms that the prescribed demand has been reached.
7. The calculated thermal conductivities of the building envelope are below the prescribed values in the TSG-1-004:2010 book.
5 CONCLUSIONS
The scope of the task was to illustrate improving a building's energy efficiency according to the requirements of the latest state regulations. The main materials and technologies are demonstrated as sample model for the construction of building envelopes in order to achieve all prescribed requirements. Renewable sources of energy are classified, as are the technical solutions that have been chosen for our building.
The energy performance certificate was calculated and created; all proposed and executed tasks for energy efficient of the house were evaluated by the PC program. The result is the calculation and a certificate showing that all required parameters have been fulfilled. It has definitively been confirmed that our renovated building, the Jozlinova House, is an energy-efficient building, which will result in much lower energy costs.
Our building has a B1 energy performance certificate, which means that it has exceptionally high energy efficiency and can be classified as a “low-energy house”.
Energy efficiency is becoming increasingly important, and its role in the future will be even more significant in geo-politics. This requires controlling and managing energy consumption,

�0 JET
Instructions to Authors
http://www.fe.um.si/en/jet.html
AUTHOR INSTRUCTIONS (MAIN TITLE)
SLOVENIAN TITLE
Authors, Corresponding author
Key words: (Up to 10 keywords)
Abstract Abstract should be up to 500 words long, with no pictures, photos, equations, tables, only text.
Povzetek (In Slovenian language)
Submission of Manuscripts: All manuscripts must be submitted in English by e-mail to the editorial office at [email protected] to ensure fast processing. Instructions for authors are also available online at http://www.fe.um.si/en/jet.html.
Preparation of manuscripts: Manuscripts must be typed in English in prescribed journal form (Word editor). A Word template is available at the Journal Home page.
A title page consists of the main title in the English and Slovenian languages; the author(s) name(s) as well as the address, affiliation, E-mail address, telephone and fax numbers of author(s). Corresponding author must be indicated.
Main title: should be centred and written with capital letters (ARIAL bold 18 pt), in first paragraph in English language, in second paragraph in Slovenian language.
Key words: A list of 3 up to 6 key words is essential for indexing purposes. (CALIBRI 10pt)
Abstract: Abstract should be up to 500 words long, with no pictures, photos, equations, tables, - text only.
Povzetek: - Abstract in Slovenian language.
Corresponding author and other authors: Title, Name and Surname, Tel.: +XXX x xxx xxx, Fax: +XXX x xxx xxx, Mailing address: xxxxxxxxxxxxxxxxxxxxxxxxxxxxxxxx, E-mail address: [email protected]
Zdravko Praunseis, Jurij Avsec, Simon Marčič, Renato Strojko JET Vol. 6 (2013)
Issue 2
----------

JET �1
Instructions to Authors
http://www.fe.um.si/en/jet.html
AUTHOR INSTRUCTIONS (MAIN TITLE)
SLOVENIAN TITLE
Authors, Corresponding author
Key words: (Up to 10 keywords)
Abstract Abstract should be up to 500 words long, with no pictures, photos, equations, tables, only text.
Povzetek (In Slovenian language)
Submission of Manuscripts: All manuscripts must be submitted in English by e-mail to the editorial office at [email protected] to ensure fast processing. Instructions for authors are also available online at http://www.fe.um.si/en/jet.html.
Preparation of manuscripts: Manuscripts must be typed in English in prescribed journal form (Word editor). A Word template is available at the Journal Home page.
A title page consists of the main title in the English and Slovenian languages; the author(s) name(s) as well as the address, affiliation, E-mail address, telephone and fax numbers of author(s). Corresponding author must be indicated.
Main title: should be centred and written with capital letters (ARIAL bold 18 pt), in first paragraph in English language, in second paragraph in Slovenian language.
Key words: A list of 3 up to 6 key words is essential for indexing purposes. (CALIBRI 10pt)
Abstract: Abstract should be up to 500 words long, with no pictures, photos, equations, tables, - text only.
Povzetek: - Abstract in Slovenian language.
Corresponding author and other authors: Title, Name and Surname, Tel.: +XXX x xxx xxx, Fax: +XXX x xxx xxx, Mailing address: xxxxxxxxxxxxxxxxxxxxxxxxxxxxxxxx, E-mail address: [email protected]
Zdravko Praunseis, Jurij Avsec, Simon Marčič, Renato Strojko JET Vol. 6 (2013)
Issue 2
----------

�2 JET
Paper title (centred, Calibri 10pt, Italic)
----------
Tables should have a legend that includes the title of the table at the top of the table. Each table should be cited in the text.
Table legend example:
Table 1: Name of the table (centred, on top of the table)
Figures and images should be labelled sequentially numbered (Arabic numbers) and cited in the text – Fig.1 or Figure 1. The legend should be below the image, picture, photo or drawing.
Figure legend example:
Figure 1: Name of the figure (centred, on bottom of image, photo, or drawing)
References
[1] Name. Surname: Title, Publisher, p.p., Year of Publication
Example of reference-1 citation: In text, Predin, [1], text continue. (Reference number order!)
Authors names and surname (centred, Calibri 10pt, Italic)s JET Vol. 6 (2013)
Issue 2
----------
Main text should be structured logically in chapters, sections and sub-sections. Type of letters is Calibri, 10pt, full justified.
Units and abbreviations: Required are SI units. Abbreviations must be given in text when firstl mentioned.
Proofreading: The proof will be send by e-mail to the corresponding author, who is required to make their proof corrections on a print-out of the article in pdf format. The corresponding author is responsible to introduce corrections of data in the paper. The Editors are not responsible for damage or loss of manuscripts submitted. Contributors are advised to keep copies of their manuscript, illustrations and all other materials.
The statements, opinions and data contained in this publication are solely those of the individual authors and not of the publisher and the Editors. Neither the publisher nor the Editors can accept any legal responsibility for errors that could appear during the process.
Copyright: Submissions of a publication article implies transfer of the copyright from the author(s) to the publisher upon acceptance of the paper. Accepted papers become the permanent property of “Journal of Energy Technology”. All articles published in this journal are protected by copyright, which covers the exclusive rights to reproduce and distribute the article as well as all translation rights. No material can be published without written permission of the publisher.
Chapter examples:
1 MAIN CHAPTER
(Arial bold, 12pt, after paragraph 6pt space)
1.1 Section
(Arial bold, 11pt, after paragraph 6pt space)
1.1.1 Sub-section
(Arial bold, 10pt, after paragraph 6pt space)
Example of Equation (lined 2 cm from left margin, equation number in normal brackets (section.equation number), lined right margin, paragraph space 6pt before in after line):
(1.1)

JET ��
Paper title (centred, Calibri 10pt, Italic)
----------
Tables should have a legend that includes the title of the table at the top of the table. Each table should be cited in the text.
Table legend example:
Table 1: Name of the table (centred, on top of the table)
Figures and images should be labelled sequentially numbered (Arabic numbers) and cited in the text – Fig.1 or Figure 1. The legend should be below the image, picture, photo or drawing.
Figure legend example:
Figure 1: Name of the figure (centred, on bottom of image, photo, or drawing)
References
[1] Name. Surname: Title, Publisher, p.p., Year of Publication
Example of reference-1 citation: In text, Predin, [1], text continue. (Reference number order!)
Authors names and surname (centred, Calibri 10pt, Italic)s JET Vol. 6 (2013)
Issue 2
----------
Main text should be structured logically in chapters, sections and sub-sections. Type of letters is Calibri, 10pt, full justified.
Units and abbreviations: Required are SI units. Abbreviations must be given in text when firstl mentioned.
Proofreading: The proof will be send by e-mail to the corresponding author, who is required to make their proof corrections on a print-out of the article in pdf format. The corresponding author is responsible to introduce corrections of data in the paper. The Editors are not responsible for damage or loss of manuscripts submitted. Contributors are advised to keep copies of their manuscript, illustrations and all other materials.
The statements, opinions and data contained in this publication are solely those of the individual authors and not of the publisher and the Editors. Neither the publisher nor the Editors can accept any legal responsibility for errors that could appear during the process.
Copyright: Submissions of a publication article implies transfer of the copyright from the author(s) to the publisher upon acceptance of the paper. Accepted papers become the permanent property of “Journal of Energy Technology”. All articles published in this journal are protected by copyright, which covers the exclusive rights to reproduce and distribute the article as well as all translation rights. No material can be published without written permission of the publisher.
Chapter examples:
1 MAIN CHAPTER
(Arial bold, 12pt, after paragraph 6pt space)
1.1 Section
(Arial bold, 11pt, after paragraph 6pt space)
1.1.1 Sub-section
(Arial bold, 10pt, after paragraph 6pt space)
Example of Equation (lined 2 cm from left margin, equation number in normal brackets (section.equation number), lined right margin, paragraph space 6pt before in after line):
(1.1)

�� JET
Authors names and surname (centred, Calibri 10pt, Italic)s JET Vol. 6 (2013)
Issue 2
----------

Authors names and surname (centred, Calibri 10pt, Italic)s JET Vol. 6 (2013)
Issue 2
----------