journal of economics and management research
TRANSCRIPT

University of LatviaFaculty of Economics and Management
Journal of Economics and Management Research
Founded in 2001 as Acta Universitatis Latviensis, series «Economics. Business Administration»
Volume 1
Rīga 2012
JournalEconMngmnt-makets.indd 1 20.12.2012 14:12:10

Journal of Economics and Management Research, Volume 1.Riga: University of Latvia, 2012, 156 pages.
The Journal of Economics and Management Research is an interdisciplinary scientific journal in the field of economics, business management, national economy, structural and social policies, innovation perspectives and institutional capability.
The Journal of Economics and Management Research, a Scientific Journal of the University of Latvia, is published three times per year.
EDITORIAL BOARD Prof. Dr. Elena Dubra, University of Latvia (Editor-in-Chief – Economics) As. prof. Dr. Signe Bāliņa, University of Latvia (Editor-in-Chief – Management) Prof. Dr. Jean David Avenel, Paris-Est Creteil (Val de Marne) University (France) Prof. Jeržy Boehlke, Copernicus University (Poland) Prof. Dr. Inta Brūna, University of Latvia Prof. Dr. Inta Ciemiņa, University of Latvia Prof. Dr. Alexandrina Deaconu, Economic Studies Academy (Romania) Doc. Dr. Džineta Dimante, University of Latvia Prof. Dr. Dainora Grundey, Mykolas Romeris University (Lithuania) Prof. Dr. Gundars Kaupins, Boise State University (USA) Prof. Dr. Natalia Kuznetsova, St. Petersburg University (Russia) Prof. Dr. Kristina Levišauskaitė, Vytautas Magnus University (Lithuania) Prof. Dr. Barry Lesser, Dalhousie University (Canada) Prof. Dr. Marco J. Menichetti, University of Liechtenstein (Liechtenstein) Prof. Dr. Tatjana Muravska, University of Latvia Prof. Dr. Nikolay Nenovsky, University of National and World Economy (Bulgaria) Prof. Dr. Josef Neuert, University of Applied Sciences Kufstein (Austria) Prof. Dr. Tiiu Paas, Tartu University (Estonia) Prof. Dr. Gunnar Prause, Vismar University of Applied Sciences (Germany) Prof. Dr. Baiba Rivža, Latvian University of Agriculture Prof. Arild Sæther, Agder University (Norway) Prof. Dr. Bruno Sergi, Messina University (Italy) Prof. Dr. Biruta Sloka, University of Latvia Prof. Dr. Baiba Šavriņa, University of Latvia Prof. Dr. Ērika Šumilo, University of Latvia Lic. Sc., Head of Master's Degree Programmes in Business Erja Tuulikki Turunen, VTT Technical Research Centre of Finland Prof. Dr. Elvīra Zelgalve, University of Latvia
English Language Editor: Edgars KariksLayout: Ieva Tiltiņa
Secretariat: Anita Jankovska (Manager of the Secretariat) Zanda Nilendere (Economics) Elīna Ermane (Management)
© University of Latvia, 2012
ISSN 2255-9000
JournalEconMngmnt-makets.indd 2 20.12.2012 14:12:10

Table of ConTenTs
Juris Bārzdiņš, Rita Konstante Management Competencies for Healthcare Professionals – a Focus on Course Offerings from Medical Studies Programmes in the Baltic States 4
Andrejs Bessonovs Transmission of Monetary Shocks: the faVaR Approach 21
Ilona Dubra Support Activities for Innovation in Latvia: Myth or Reality 33
Ivita Faitusa Opportunities for the Development of Internal Audit Procedures at Local Government Level in Latvia 45
Svetlana Jesiļevska Statistical Aspects of Collecting Innovation Data 54
Ludmila Jevčuka, Kārlis Ketners Creating a Motivational Remuneration Package Structure for Public Administration in Latvia 67
Gundars Kaupins, Elena Dubra, Daira Baranova Economic Climate and Development Challenges for Latvia and EU Countries 94
Oļegs Krasnopjorovs Measuring the Sources of Economic Growth in the EU with Parametric and Non-Parametric Methods 106
Sarmīte Mickeviča, Signe Bāliņa, Martynas Bieliunas An Analysis of the Competitiveness of the ICT Manufacturing Sector in Latvia 123
Māris Pūķis, Ināra Dundure Sustainability of the Pension System in Latvia 139
JournalEconMngmnt-makets.indd 3 20.12.2012 14:12:10

ManaGeMenT CoMPeTenCIes foR HealTHCaRe PRofessIonals –
a foCUs on CoURse offeRInGs fRoM MeDICal sTUDIes PRoGRAMMes
In THe balTIC sTaTes
JURIs bāRzDIņš *faculty of Medicine, University of latvia, latvia
RITa KonsTanTeMehamn Health centre, norway
Abstract. The recent economic downturn and struggle for the sustainability of social security programmes in an ageing Europe has increased pressure on healthcare systems to deliver their services in a more cost-effective way and to halt, or at least to slow down, the growth of expenditure on health. While the medical profession always welcomes new medical technologies, this is not usually the case for accepting new management technologies that have already proven to be extremely valuable towards the increase of efficiency and competitiveness in other industries.The purpose of this study is to compare the internationally expressed needs for new competencies in the medical profession and the content of medical studies programmes in Latvia, Lithuania and in Estonia with regard to courses being offered towards the development contextual organisational, leadership and management competencies.This study is based on a content analysis of the published frameworks of competen cies for the profession of physician and on a comparison of medical studies programmes in all three Baltic states.The results of this study have revealed a similarity in understanding of the necessary competencies for physicians and also that there is a broad variety in the availability of definitive courses that are more directed at developing non-technical core competencies. The study also revealed a lack of dedicated courses, among the programmes analysed, aimed towards the development of managerial skills.This study clearly demonstrates the need for more collaboration between governments, healthcare providers and universities with regard to the adoption of professional education programmes to serve the present-day needs of our ever-changing healthcare systems.
Key words: healthcare management, medical education curricula, managerial competencies.
JEL code: A 12, A22, I12
ManaGeMenT CoMPeTenCIes foR HealTHCaRe PRofessIonals ..
JURIs bāRzDIņš, RITa KonsTanTe
* Corresponding author. Tel.: + 371 67733211; fax: +371 6733211; e-mail: [email protected]
Journal of Economics and Management Research Vol. 1, 2012: 4–20
JournalEconMngmnt-makets.indd 4 20.12.2012 14:12:10

Juris Bārzdiņš, Rita Konstante 5
InTRoDUCTIon
The healthcare service industry certainly has unique dimensions with regard to the spheres of economics and management. At the same time, the growing pressure for cost-effectiveness without any compromise on quality has raised the need to adapt to the healthcare industry the similar management technologies that have proven to be extremely valuable in other industries. It is a commonly recognised fact that the low engagement of physicians in the planning, delivery and transformation of services is an obstacle to improvements within the various health systems. There is an obvious need for the creation of an organisational culture that motivates physicians to become involved in these decision-making processes. This of course leads to a potential paradigm shift on the future role of physicians and on how their training should be changed in the future. This paper investigates the demand and supply aspects on perceived new competencies requirements for physicians.
PRessURes foR CHanGes In HealTHCaRe
Social development, increased well-being and security of individuals, the accumulation of knowledge and the progress of technologies in the field of medicine all serve to provide us and the economies of our countries with more productive life-years. In the last fifteen years life expectancy at birth has grown significantly (Figure 1).
65676971737577798183
1995 1996 1997 1998 1999 2000 2001 2002 2003 2004 2005 2006 2007 2008 2009 2010
Expe
cted
life
yea
rs a
t bir
th
YearsLatviaEU members before May 2004EU members since 2004 or 2007
Source: WHO, Health for All databasesFig. 1. The Dynamic of Expected Life Years at Birth in the European Union
JournalEconMngmnt-makets.indd 5 20.12.2012 14:12:11
6 MANAGEMENT COMPETENCIES FOR HEALTHCARE PROFESSIONALS ..
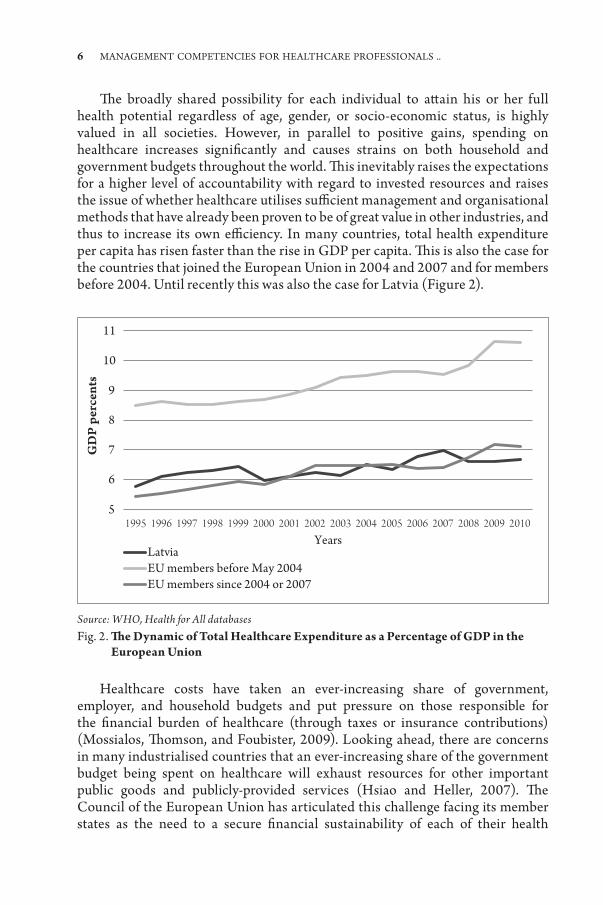
The broadly shared possibility for each individual to attain his or her full health potential regardless of age, gender, or socio-economic status, is highly valued in all societies. However, in parallel to positive gains, spending on healthcare increases significantly and causes strains on both household and government budgets throughout the world. This inevitably raises the expectations for a higher level of accountability with regard to invested resources and raises the issue of whether healthcare utilises sufficient management and organisational methods that have already been proven to be of great value in other industries, and thus to increase its own efficiency. In many countries, total health expenditure per capita has risen faster than the rise in GDP per capita. This is also the case for the countries that joined the European Union in 2004 and 2007 and for members before 2004. Until recently this was also the case for Latvia (Figure 2).
5
6
7
8
9
10
11
1995 1996 1997 1998 1999 2000 2001 2002 2003 2004 2005 2006 2007 2008 2009 2010
GD
P pe
rcen
ts
YearsLatviaEU members before May 2004EU members since 2004 or 2007
Source: WHO, Health for All databasesFig. 2. The Dynamic of Total Healthcare Expenditure as a Percentage of GDP in the
European Union
Healthcare costs have taken an ever-increasing share of government, employer, and household budgets and put pressure on those responsible for the financial burden of healthcare (through taxes or insurance contributions) (Mossialos, Thomson, and Foubister, 2009). Looking ahead, there are concerns in many industrialised countries that an ever-increasing share of the government budget being spent on healthcare will exhaust resources for other important public goods and publicly-provided services (Hsiao and Heller, 2007). The Council of the European Union has articulated this challenge facing its member states as the need to a secure financial sustainability of each of their health
JournalEconMngmnt-makets.indd 6 20.12.2012 14:12:11

Juris Bārzdiņš, Rita Konstante 7
systems without undermining the values they share: universal coverage, solidarity in financing, equity of access and the provision of high-quality healthcare (The Council of European Union, 2006). During the recent period of economic downturn, Latvia, together with other European countries most affected by the crisis, is implementing rigorous austerity measures and the budget cannot finance healthcare needs at the previous level of state contribution. This has resulted in increased financial pressure on individual households and to a growing inequity of access to services as well as to a general dissatisfaction with the government’s inability to guarantee fundamental rights.
There are several factors that are most often mentioned as being a cause for the rise of healthcare costs, (e.g. aging, unhealthy lifestyles of individuals), but these are beyond the direct sphere of influence of doctors, managers of healthcare organisations and even of ministries of health. However, other causes (e.g. the evaluation and introduction of new costly technologies, the organisation of care processes) are in their direct domain. The rise in healthcare expenditures as a result of demographic change appears to be very small by comparison to the effects of changing physician treatment methods (Dormont and Grignon, 2006). The extensive usage of new and costly technologies (diagnostics, treatment schemes, medical equipment, and pharmaceuticals) is mentioned as one of the most prominent single drivers of increasing healthcare costs (Lubitz, 2005). While breakthrough discoveries and innovations in healthcare are rare, there is a constant high offer from industries to use new technologies that often provide only a marginal additional benefit to health outcomes, while leaving exaggerated expectations for the consumer. However, the over usage of innovations is not the only possible direction to look at for the purpose of making savings in the costs of healthcare. Inefficient spending on health may be categorised into three waste “baskets”:
• Behavioural –where individual behaviours are shown to lead to healthproblems, and there are potential opportunities for earlier, non-medical interventions;
• Operational –whereadministrativeorotherbusinessprocessesappeartoadd costs without creating value;
• Clinical – where the medical care itself is considered inappropriate,entailing overuse, misuse or under-use of particular interventions, missed opportunities for earlier interventions, and overt errors leading to quality problems for the patient, plus cost and rework (PricewaterhouseCoopers 2008).
The practice of medicine has essentially been based on a model in which physicians are trained to deal with individuals, not organisations; to take personal responsibility rather than to delegate; and to do their best for each patient rather than to make trade-offs in a resource constrained environment (Degeling, Kennedy, and Hill, 1998). Historically, healthcare services delivery is heavily influenced by the medical profession, which controls (directly or indirectly) up
JournalEconMngmnt-makets.indd 7 20.12.2012 14:12:11

8 MANAGEMENT COMPETENCIES FOR HEALTHCARE PROFESSIONALS ..
to 85 percent of all spending (Sager and Socolar, 2005). Physicians are the key persons in control of the resources within healthcare and often enjoy a near monopoly over the most important decisions governing resource allocation, including: the prescribing of pharmaceuticals, performing surgical procedures, ordering laboratory or imaging tests, and admitting patients to a hospital bed (Burns et al., 2012). Once a physician receives certification in a specialty and is appointed to a permanent position in a hospital or place of primary care, they automatically become leaders within that health system – not necessarily in formal leadership roles but as the professionals who are expected to provide leadership both in healthcare and in the wider community. Taking into account the importance and influence of the decisions being made by physicians, in general, the effectiveness of healthcare services depends heavily on their support and on their active engagement not only as medical practitioners, but also in their managerial and leadership roles.
THe neeD foR ManaGeMenT CoMPeTenCIes In HealTHCaRe
There are several basic models that demonstrate how healthcare organisations and particularly hospitals are managed. The model of a management structure with dual hierarchies where the physician staff forms a second line of authority alongside the administrative staff is typical in North America and in some European countries. Alternatively, the model of a single line of hierarchy consists of the head physician managing and taking full responsibility for all hospital operations. The latter model was more prominent in countries that joined the EU after 2004 and in Turkey (Akbulut, Esatoglu, and Yildirim, 2010). For example, in Lithuania, the managers of health institutions are mostly physicians (Padaiga et al., 2006). Under such a structure, those physicians with managerial roles also are working as practitioners. In countries using this model, the medical profession tends to dominate healthcare management (Mahon and Young, 2006). Within both of these models the managers, physicians and physicians with managerial roles are all under growing pressure to change in relation to the new circumstances in the demand side of the equation (demographics, patterns of diseases, public expectations), and in the supply side (technology and clinical knowledge, healthcare workforce) as well as taking into consideration wider societal changes (financial pressures, the internationalisation of health care systems, an increasingly global market for research and development) (McKee et al., 2002) and in responding to these external changes. The way in which organisations are managed changes too. A power shift takes place between managers and physicians without formal management roles, and at the strategic decision level the middle and top managements gain more power while the medical practitioners themselves lose some influence. This means that these hospitals have moved to a state of professional management as distinct from
JournalEconMngmnt-makets.indd 8 20.12.2012 14:12:11
Juris Bārzdiņš, Rita Konstante 9
physician management (Glouberman and Mintzberg, 2001; McKee et al., 2002). In this situation, however, there is a growing need for physicians with dual role capability (professional physician and manager) with acquired capabilities so as to better be able to balance the needs of the individual patient, the department and the organisation as a whole. The most successful managers will be those who develop the ability to appropriately balance both sides of their dual roles (McConnell, 2008).
While a manager’s responsibility for the whole organisation is traditionally related to a pre-occupation with systems, the allocation of resources, an emphasis on the community and a need for public accountability, the physician’s responsibility has historically been related to the needs of individual patients, thus leading to professional autonomy and to a high desire for self-regulation (Davies and S. Harrison, 2003). The increased demand from society and governments to control healthcare costs and quality has lead to one of the major challenges for both managers of healthcare organisations and physicians – to a conflict of professional values (Nigel Edwards, Kornacki, and Silversin, 2002). In other words, any effort to improve efficiency entails the necessity of trade-offs between competing demands and sometimes between conflicting values. The difficulty with such trade-off results may be observed in the slow adaptation of healthcare systems and organisations to these new demands. It has been estimated that the development of leadership in healthcare falls behind other sectors of the economy by 10–15 years (Mcalearney, 2006). A growing number of publications and policy documents have suggested that all doctors should acquire management and leadership competencies in addition to the clinical knowledge and skills needed to be an effective and safe practitioner. It is argued that only by developing those competencies needed for leadership, can physicians be more actively involved in the planning, delivery and transformation of health services as an integral part of their role as doctors (NHS Institute for Innovation and Improvement and Academy of Medical Royal Colleges, 2010). The participation of physicians in decision-making processes within their hospitals is important and is directly related to that hospital’s performance (McDaniel and Ashmos, 1986). The terms “non-clinical competencies”, “non-medical competencies”, “management competencies” and “leadership competencies” are all used interchangeably in the existing literature that refers to the skills and knowledge necessary to be effective in the complex organisational systems required to deliver healthcare. The necessary competencies in such a context fall well within a broader understanding of the entrepreneurial attitudes and skills that should generally be fostered in all spheres, including non-business studies. However, in discussions that debate the need for development of contextual non-clinical competencies for physicians, the term “entrepreneurship” is used rarely. The narrower understanding of entrepreneurship as a specific concept of training in how to create a business seems inappropriate for some of the authors. However, to strive for “non-clinical competencies”, “non-medical competencies”, “management competencies” and “leadership competencies” for physicians has the same broad meaning as to strive
JournalEconMngmnt-makets.indd 9 20.12.2012 14:12:11
10 MANAGEMENT COMPETENCIES FOR HEALTHCARE PROFESSIONALS ..
for entrepreneurship competencies for other non-business professions, therefore this descriptive term nowadays of defining a wider complex of conceptual skills seems to be fully applicable also for studies in medicine as a profession.
an analysIs of seleCTeD ManaGeMenT-RelaTeD CoMPeTenCy fRAMewoRKs foR PHysICIans
While the approved professional standards for physicians in Latvia focus mainly on clinical competencies, recently, several countries such as the United Kingdom, Canada, Denmark and the USA have developed formal competency models for their physicians at the individual level – describing competencies, standards, personal qualities and desirable interactions that all contribute to leadership ability and success in healthcare. In Canada there are six roles defined for the physician to be recognised as a medical expert – professional, communicator, collaborator, manager, health advocate, scholar (Royal College of Physicians and Surgeons of Canada, 2005), whereas research in the USA ranked the order of competencies needed to become physicians and leaders:
1) interpersonal and communication skills, 2) professional ethics and social responsibility, 3) continuous learning and improvement, 4) ability to build coalitions and support for change, 5) clinical excellence, 6) ability to convey a clear compelling vision, 7) system-based decision making/problem solving, 8) ability to address the needs of multiple stakeholders, 9) financial acumen and resource management (McKenna, Gartland, and
Pugno, 2004). Another study undertaken in the U.S. (Calhoun et al., 2003) lead to a health
leadership competency model that describes three elements of competencies: Transformation, Execution and People. The competency for Transformation was described as a complex set of such skills as achievement orientation, analytical thinking, community orientation, financial skills, information seeking, innovative thinking and strategic orientation. The competency of Execution was described as a complex set of such skills as accountability, change leadership, collaboration, communication, impact and influence, information technology management, initiative, organisational awareness, performance measurement, process management, organisational design and project management. The third competency with regard to dealing with People consisted of a complex set of skills such as human resources management, interpersonal understanding, professionalism, relationship building, self-confidence, self-development, talent development and team leadership.
JournalEconMngmnt-makets.indd 10 20.12.2012 14:12:11

Juris Bārzdiņš, Rita Konstante 11
Similar models have also been set for physicians in Denmark – the need for such core leadership competencies as personal leadership, leadership in a political context, leadership qualities, the ability to lead change and to be capable of leading other professionals (Clark and Armit, 2010). The above-mentioned models describe several roles as a professional leader – medical expert, professional, leader/administrator, academic, collaborator, communicator, promoter of health and adviser. And finally, the medical leadership competency framework developed in the United Kingdom (NHS Institute for Innovation and Improvement and Academy of Medical Royal Colleges, 2010) requires physicians to be able:
1) to demonstrate personal qualities for developing self-awareness, self-management, continuing personal development, acting with integrity;
2) to be able to work with others by developing networks, building and maintaining relationships, encouraging contribution, working within teams;
3) to be able to manage services by planning, managing resources, managing people, managing performance;
4) to improve existing services by ensuring patient safety, critical evaluation, encouragement of improvement, innovation and in being capable of facilitating transformation;
5) to be able to set directions by identifying the contexts for change, applying knowledge and evidence and making decisions.
Even if some of the frameworks being referred to are clearly intended for individuals already in formal leadership roles, all of the frameworks show broad similarities in the identified competencies and personal qualities needed for physicians working within and across the organisation. These studies confirm that while sufficient clinical knowledge and skill is the baseline, the additional non-clinical competencies, including those of leadership and management are a new requirement of those persons who are responsible for the education and training of physicians.
THe Role of eDUCaTIon In PRoMoTInG new CoMPeTenCIes
The need for education in new competencies is not unique only to the medical professions. The important role of education in the promoting of more entrepreneurial attitudes and behaviours for all is now widely recognised. The Recommendations of the European Parliament and the Council on Key Competences for Lifelong Learning (European Council, 2006) identify the “sense of initiative and entrepreneurship” as being one of eight key competencies that should be included across, and at all stages/levels of education and training. Entrepreneurship refers to the ability of an individual to turn/transform ideas
JournalEconMngmnt-makets.indd 11 20.12.2012 14:12:11

12 MANAGEMENT COMPETENCIES FOR HEALTHCARE PROFESSIONALS ..
into action and is therefore a key competence for all, thus helping people to be more creative and self-confident in whatever they undertake. The benefits of entrepreneurship education are not limited to the creation of new firms, innovative ventures and new jobs. Two different elements within the definition of entrepreneurship teaching should include:
1) a broader concept of education for entrepreneurial attitudes and skills, which involves the developing of certain personal qualities and that is not directly focused on the creation of new businesses, and
2) a more specific concept of training in how to create a business.While there does exist a policy commitment at governmental/ministerial
level in most EU member states to promote the teaching of entrepreneurship within the education system, such training is not yet sufficiently integrated into the curricula of higher education institutions in the area of non-business studies, and available data shows that the majority of entrepreneurship courses are offered in business and economic studies programmes (Figures 3 and 4 illustrate the representative situation in the UK and Spain) (European Commission, 2008). Nevertheless, numerous examples can be found in the literature on entrepreneurship education delivery to science and engineering students with resultant successful outcomes at individual, institutional and regional levels. There are also examples of the successful integration of business and entrepreneurship education across a variety of other study programmes including in the disciplines of geography, the environmental sciences, art and other creative disciplines (Henry, 2011).
0
10
20
30
40
50
60
70
Business Engineering Art / Design Math /Computing
Natural /Pure Science
Medicine /Health
Source: European Commission, 2008. Report on Entrepreneurship in Higher EducationFig. 3. Curricular Provision of Entrepreneurship Training in the UK, by Field of Study
(in %)
JournalEconMngmnt-makets.indd 12 20.12.2012 14:12:12

Juris Bārzdiņš, Rita Konstante 13
0
10
20
30
40
50
60
Economics /Business Sciences
Technology Social Sciences Health Sciences
Source: European Commission, 2008. Report on Entrepreneurship in Higher EducationFig. 4. Curricular Provision of Entrepreneurship Training in Spain, by Field of Study (in %)
In the healthcare context the evidence of incorporating entrepreneurship into course content is less evident. However, trainings based on an individualistic orientation do not prepare physicians to be able to function successfully as members of large, complex organisations (Nigel Edwards et al., 2002). Although physicians are mostly dominant in the managerial positions, and even without formal management titles they may need to make management related decisions, the subjects of entrepreneurship, leadership and management have not, until recently, been considered as an integral part of any core undergraduate curriculum for medical studies in which the focus primarily has been placed on technical and clinical skills necessary to become a capable medical practitioner. However, successful management requires specific entrepreneurial knowledge, skills, behaviours and attitudes to succeed in the planning, organising, leading and controlling of an organisation. Graduates of medical schools with leadership and management studies incorporated within the core curriculum should be better prepared to take up roles in the modern healthcare system that requires leadership and innovation and, as such, they should be more capable of distinguishing themselves from among their competition … a benefit reported by other science and engineering graduates (Henry, 2011). There are cases reported of entrepreneurship education being incorporated within medical degree study programmes. For example, the entrepreneurship education in one USA medical school is described by Padilla et al. (Padilla et al., 2011). The authors highlighted, “Many areas of healthcare and medical practice can be made more efficient once business principles are factored, and built into the solution. These include delivery of primary care services, pathology services, emergency department services, cardiovascular services.” The authors further highlight that
JournalEconMngmnt-makets.indd 13 20.12.2012 14:12:12

14 MANAGEMENT COMPETENCIES FOR HEALTHCARE PROFESSIONALS ..
the skills required in practice but not developed in traditional medical training programmes included “business administration skills and, specifically, skills in financial management and analysis and strategic planning, with additional skills in marketing, accounting, cost accounting, communications, and business law. Negotiation skills and techniques are not traditionally taught to medical professionals, yet successful negotiation is required to run an efficient practice or organisation”.
Despite the fact that training programmes for entrepreneurship related competences are not yet integral parts of medical education, medical schools and universities should be able to react to demand from the market and incorporate management and leadership in their curricula. In order to gain a better insight into the current practice of graduate medical education regarding the amount and content of courses being offered with the aim of developing contextual organisational, leadership and management competencies, a survey was also undertaken in the Baltic states.
sURVey of seleCTeD MeDICal sTUDIes PRoGRAMMes
The main focus of this survey was to determine the proportion of courses in undergraduate medical education that are aimed towards the development of knowledge, skills and attitudes necessary for work in modern healthcare systems. The principal interest was to observe the presence and amount of courses in these study programmes directed towards the developing of competencies in entrepreneurship, management and leadership.
The content curriculum of graduate level study programmes in medicine in all five medical studies programmes for students in the three Baltic states were selected for analysis (Latvia – two study programmes, Lithuania – two study programmes, Estonia – one study programme). The selected study pro grammes was analysed with regard to the courses being offered and to the type of skills being acquired. The courses were categorised according to type of skills as identified by Daft (Daft, 2012). In citing Katz (Katz, 1955) he identified three broad types of skills that managers and to some extent individual contributors must possess:
• Technical skills are those that reflect the ability to use the methods, processes and techniques of a particular field and that may be acquired through training, education and work experience.
• Human skills are those that reflect the ability to get along with other people, to understand them and to motivate and lead them in the workplace.
• Conceptual skills are those that reflect the mental ability to visualise all the complex inter-relationships that exist in the workplace among people,
JournalEconMngmnt-makets.indd 14 20.12.2012 14:12:12

Juris Bārzdiņš, Rita Konstante 15
departments or units of an organisation and the environment in which these exist – i.e. the cognitive ability to see the organisation as a whole system.
For the purpose of analysis, the courses for the acquisition of technical skills include all of the following: bio-medical basic science, clinical, language, terminology and medical informatics courses. All other courses being analysed were considered to be oriented towards the acquisition of human and conceptual skills. Specifically designed courses for such entrepreneurship-related competencies as management and economics were considered as a sub-group of courses devoted to human and conceptual skills. The proportion of selected compulsory courses from the total programme content was calculated as a percentage of the total amount of credit points or weeks of studies. Elective non-technical skills courses are also listed, but were not included in further quantitative analysis.
ReseaRCH ResUlTs anD DIsCUssIon
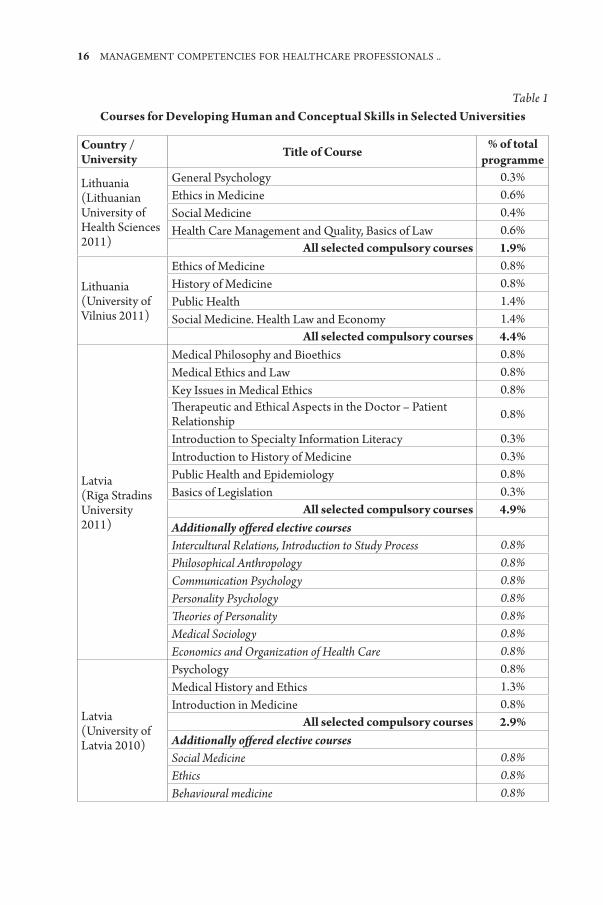
The consolidated data from the analysis of five study programmes is presented in Table 1.
As it may be observed, the amount and content of dedicated non–technical courses for the acquisition of human or conceptual skills varies among universities (Figure 5).
0%
1%
2%
3%
4%
5%
6%
7%
LithuanianUniversity of
HealthSciences
University ofLatvia
University ofVilnus
Riga StradinsUniversity
University ofTartu
Source: own studyFig. 5. The Composition and Summary Proportion of Non-Technical Skills Courses in
Selected Universities
JournalEconMngmnt-makets.indd 15 20.12.2012 14:12:12
16 MANAGEMENT COMPETENCIES FOR HEALTHCARE PROFESSIONALS ..
Table 1 Courses for Developing Human and Conceptual Skills in Selected Universities
Country / University Title of Course % of total
programme
Lithuania (Lithuanian University of Health Sciences 2011)
General Psychology 0.3%Ethics in Medicine 0.6%Social Medicine 0.4%Health Care Management and Quality, Basics of Law 0.6%
All selected compulsory courses 1.9%
Lithuania (University of Vilnius 2011)
Ethics of Medicine 0.8%History of Medicine 0.8%Public Health 1.4%Social Medicine. Health Law and Economy 1.4%
All selected compulsory courses 4.4%
Latvia (Rīga Stradins University 2011)
Medical Philosophy and Bioethics 0.8%Medical Ethics and Law 0.8%Key Issues in Medical Ethics 0.8%Therapeutic and Ethical Aspects in the Doctor – Patient Relationship 0.8%
Introduction to Specialty Information Literacy 0.3%Introduction to History of Medicine 0.3%Public Health and Epidemiology 0.8%Basics of Legislation 0.3%
All selected compulsory courses 4.9%Additionally offered elective coursesIntercultural Relations, Introduction to Study Process 0.8%Philosophical Anthropology 0.8%Communication Psychology 0.8%Personality Psychology 0.8%Theories of Personality 0.8%Medical Sociology 0.8%Economics and Organization of Health Care 0.8%
Latvia (University of Latvia 2010)
Psychology 0.8%Medical History and Ethics 1.3%Introduction in Medicine 0.8%
All selected compulsory courses 2.9%Additionally offered elective coursesSocial Medicine 0.8%Ethics 0.8%Behavioural medicine 0.8%
JournalEconMngmnt-makets.indd 16 20.12.2012 14:12:12

Juris Bārzdiņš, Rita Konstante 17
Country / University Title of Course % of total
programme
Estonia (University of Tartu 2011)
Medical Theory and Ethics 0.8%History of Medicine 1.3%Introduction to Medicine 0.3%Health Promotion and Medical Sociology 1.7%Health Care Management and Health Economics 1.7%
All selected compulsory courses 5.8%Additionally offered elective coursesCommunication with Patients in Crisis 1.3%Introduction to Philosophy 1.3%Medical Law 0.6%Health Technology Assessment 0.6%
Source: author’s construction based study data
There was more than a threefold difference in the amount of compulsory non-technical skills courses being offered between the selected curricula – the total percentage of courses with a focus on human and conceptual skills varied from 1.9% to 5.8%. Some of the universities also offered elective courses that were aimed at the development of human or conceptual skills. Most of the courses devoted to developing human skills were oriented to questions of ethics and psychology. Most of the courses devoted to developing conceptual skills were oriented to public health, history of medicine and legislation issues. Of all five universities being screened only in four cases did the structure of selected courses include issues related to the economics, management or organisation of healthcare. Only in two of the mentioned cases were there courses with a focus on economics, management or organisation of healthcare and which were mandatory. The highest percentage of the total study amount devoted to mandatory training in management and economics was 1.7% (University of Tartu).
There are several limitations that we should be aware of in the interpreting of these survey results.
First of all, the training of the medical student for human and conceptual skills goes far beyond formal stand-alone teaching courses. These study programmes do not reflect the informal transfer of non-technical skills during the whole study process, nor even during courses aimed purely for the development of clinical skills. Secondly, a deeper study has not yet been undertaken on the components of the individual courses – the only variables analysed were course titles, the relative amount of credit points or weeks for selected courses, and the year of studies during which the course was taught. This means that the amount and content of training in human/interpersonal or conceptual skills could vary quite considerably even among those cases in which the titles of the courses were similar. With regard to those courses that are dedicated to management
JournalEconMngmnt-makets.indd 17 20.12.2012 14:12:12

18 MANAGEMENT COMPETENCIES FOR HEALTHCARE PROFESSIONALS ..
and economics issues, without any deeper analysis of the actual course content, there is only a limited possibility of our being able to determine whether the main focus of the course is on training for the developing of universal management and leadership skills or more towards specific topics regarding the organisation of healthcare and of health economics. Nevertheless, the data from this survey does provide an insight into the different levels of integration of training for human/interpersonal and conceptual competencies, including management competencies in all three Baltic states.
In these times during which the perceived necessity for the introduction of entrepreneurship related competencies, even in non-business professions, is gaining growing recognition in Europe from both governments and the commu-nity, universities should be ready to facilitate changes in their study curricula in order to satisfy the growing demand for new competencies. This survey has demonstrated that despite the demand, the benefits of entrepreneur ship education are not yet being fully exploited in the case of studies in the field of medicine in the Baltic states. There are, however, some universities already offering certain elements of a better integrated education, which is seen to be necessary for the greater engagement of physicians in the planning, delivery and transformation of services.
Further collaboration between the healthcare provision industry, govern-ments and universities is needed in order to better respond to the newly emerging trends in healthcare.
Additional studies may well be necessary for the finding of better ways of integrating entrepreneurship education into the curricula for undergraduate studies and that will add the necessary systemic overview and inter-professional competencies in the profile of all future physicians, and will thus support the development of leadership among tomorrow’s healthcare managers.
ConClUsIons
1. According to a review of the available literature there is strong demand for management-related competencies for physicians in both clinical and managerial roles.
2. All selected medical studies programmes in the Baltic states include courses for the developing of non-technical conceptual and human skills, however, the proportion of such courses varies significantly between universities.
3. At present only some of selected university curricula for medical studies include courses that are devoted to the development of managerial human and conceptual skills.
4. Further research into medical studies programmes worldwide is needed to identify the ‘best practice’ in the providing of healthcare professionals with the necessary skills for work in our ever-changing healthcare systems.
JournalEconMngmnt-makets.indd 18 20.12.2012 14:12:12

Juris Bārzdiņš, Rita Konstante 19
bibliography Akbulut, Y., Esatoglu, A. E. & Yildirim, T., 2010. Managerial Roles of Physicians in the
Turkish Healthcare System: Current Situation and Future Challenges. Journal of Health Management, 12(4), pp. 539-551.
Burns, L. R. et al., 2012. Shortell and Kaluzny’s Health Care Management Organization Design and Behavior. Clifton Park, NY: Delmar Cengage Learning.
Calhoun, J. G. et al., 2003. Development of an Interprofessional Competency Model for Healthcare Leadership. Journal of Healthcare Management, 53(6), pp. 375-89.
Clark, J. & Armit, K., 2010. Leadership Competency for Doctors: a Framework. Leadership in Health Services, 23(2), pp.115-129. Available at: http://www.emeraldinsight.com/10.1108/17511871011040706 [Accessed 23 March 2012].
Council of the European Union, 22.6.2006. Official Journal of the European Union, pp. 1-3.
Daft, R., 2012. Management, Cengage Learning.Davies, H. T. O. & Harrison, S., 2003. Trends in Doctor-Manager Relationships. BMJ
(Clinical research ed.), 326(7390), pp. 646-9. Degeling, P., Kennedy, J. & Hill, M., 1998. Professional Sub-Cultures and Hospital
Reform. Clinician in Management, 7(2), pp. 89-98.Dormont, B. & Grignon, M., 2006. Health Expenditure Growth: Reassessing the
Threat of Ageing. Health Economics, 963, pp. 947-963.Edwards, Nigel, Kornacki, M. J. & Silversin, J., 2002. Unhappy Doctors: What are the
Causes and What can be Done? BMJ (Clinical research ed.), 324(7341), pp. 835-8. European Commission, 2008. Entrepreneurship in Higher Education, Especially Within
Non-business Studies,European Council, 2006. Recommendations of the European Parliament and the
Council on Key Competences for Lifelong Learning. Official Journal of the European Union, (394), pp. 10-18.
Glouberman, S. & Mintzberg, H., 2001. Managing the Care of Health and the Cure of Disease–Part I: Differentiation. Health Care Manage Rev, pp. 56-71.
Henry, C., 2011. A Critical Review of Contemporary Practice in Business Education in Veterinary Medicine, Higher Education Academy. Available at: <http://www.heacademy.ac.uk/assets/hlst/documents/critical-reviews/BusinessEd_in_VetEd.pdf > [Accessed 23 March 2012].
Hsiao, W. & Heller, P. S., 2007. What Should Macro-economists Know about Health Care Policy?, International Monetary Fund.
Katz, R., 1955. Skills of an Effective Administrator. Harvard Business Review, 33, pp. 33-42.Lithuanian University of Health Sciences, 2011. Medicine Curriculum 2011/2012.
Available at: <http://trc.lsmuni.lt/media/dynamic/files/452/faculty_of_medicine_ 2011-2012_updated.pdf > [Accessed 23 March 2012]
Lubitz, J., 2005. Health, Technology, and Medical Care Spending. Health Affairs, 24 Suppl 2, p. W5R81-R85.
Mahon, A. & Young, R., 2006. Health Care Managers as a Critical Component of the Health care Workforce. In C.-ardy Dubois & M. Mckee, eds. Human Resources for Health in Europe. Maidenhead: Open University Press, pp. 116-140.
McConnell, C. R., 2008. The Health Care Professional as a Manager: Balancing Two Important Roles. The Health Care Manager, 27(3), pp. 277-284.
McDaniel, R. R. & Ashmos, D. P., 1986. Strategic Directions Within Health Care Institutions: the Role of the Physician. Journal of the National Medical Association, 78(7), pp. 633-41.
JournalEconMngmnt-makets.indd 19 20.12.2012 14:12:12

20 MANAGEMENT COMPETENCIES FOR HEALTHCARE PROFESSIONALS ..
McKee, M. et al., 2002. Pressures for Change. In J. Helay & M. McKee, eds. Hospitals in a Changing Europe. European Observatory on Health Care Systems Series. Buckingham: Open University Press.
McKenna, M. K., Gartland, M. P. & Pugno, P. A., 2004. Development of Physician Leadership Competencies: Perceptions of Physician Leaders, Physician Educators and Medical Students. The Journal Of Health Administration Education, 21(3), pp. 343-354.
Mcalearney, A.N.N.S., 2006. Leadership Development in Healthcare: A Qualitative Study. Journal of Organizational Behavior, 982(7), pp. 967-982.
Mossialos, T., Thomson, S. & Foubister, T., 2009. Financing Health Care in the European Union, European Observatory on Health Systems and Policies.
NHS Institute for Innovation and Improvement and Academy of Medical Royal Colleges, 2010. Medical Leadership Competency Framework. Enhancing Engagement in Medical Leadership Third Edition, July 2010, NHS Institute for Innovation and Improvement.
Padaiga, Z. et al., 2006. Lithuania. In R. Bernd, C.-A. Dubois, & Martin McKee, eds. The Health Care Workforce in Europe Learning from Experience. Copenhagen: World Health Organization, pp. 47-58. Available at: <http://www.euro.who.int/__data/assets/pdf_file/0008/91475/E89156.pdf > [Accessed 23 March 2012].
Padilla, P. M. et al., 2011. An Innovative, Interdisciplinary Healthcare Entrepreneurship and Innovation Program for Medical Students. In USASBE 2011. pp. 48-61.
PricewaterhouseCoopers, 2008. The Price of Excess. Identifying Waste in Healthcare Spending, Available at: <http://www.kaiserhealthnews.org/~/media/Files/2010/May to September/pwcreport.pdf> [Accessed 23 March 2012].
Riga Stradins University, 2011. Medicine Curriculum 2011/2012. Available at: <http://www.rsu.lv/eng/images/Documents/Study_related/curriculum_medicine_2011_2012.pdf> [Accessed 23 March 2012].
Royal College of Physicians and Surgeons of Canada, 2005. The CanMEDS 2005 Physician Competency Framework.
Sager, A. & Socolar, D., 2005. Health Costs Absorb One-Quarter of Economic Growth, 2000 – 2005, Boston. Available at: <http://dcc2.bumc.bu.edu/hs/health costs absorb one-quarter of economic growth 2000-05 sager-socolar 7 February 2005.pdf> [Accessed 23 March 2012].
University of Latvia, 2010. Medicine Curriculum 2010/2011. Available at: <http://www.mf.lu.lv/fileadmin/user_upload/lu_portal/projekti/mf/foreignstudents/Higher_prof_study_program_MEDICINE_2010_2011.pdf> [Accessed 23 March 2012].
University of Tartu, 2011. Medicine Curriculum 2011/2012. Available at: <http://www.med.ut.ee/orb.aw/class=file/action=preview/id=109961/curricula20112012.pdf > [Accessed 23 March 2012].
University of Vilnius, 2011. Medicine Curriculum 2011/2012. Available at: <https://klevas.vu.lt/pls/klevas/public_ni$www_progr_app.show?p_kalba_name=en&p_mode=view> [Accessed 23 March 2012].
JournalEconMngmnt-makets.indd 20 20.12.2012 14:12:13

TRAnsMIssIon of MoneTaRy sHoCKs: THe FAVAR aPPRoaCH
anDReJs bessonoVs*University of latvia and bank of latvia**
Abstract. This paper reviews the concept of monetary transmission within a rather new econometric framework of macroeconomics – Factor Augmented Vector Autoregression (FAVAR). The study discusses recent advancements regarding the econometric estimation of monetary policy effects and reviews the latest literature on that topic. It also describes the general concept of FAVAR as suggested by Bernanke et al. (2005).This study stresses the importance of monetary policy analysis in Latvia, bearing in mind the aim of the Bank of Latvia to accede to the euro area and introduce the euro in 2014. In becoming participants of the euro area Latvia will face new challenges with regard to how to consequently analyse monetary policy and for this purpose shall need to utilise the appropriate tools to capture monetary effects on real economy. This paper discusses potential solutions on how to analyse monetary effects for small open economies within FAVAR and possible solutions for Latvia.
Key words: FAVAR model, euro area, monetary transmission, factor model.
JEL code: C32, C52, E52
InTRoDUCTIon
The quantification of monetary transmission is of great importance for every central bank. The most popular method of uncovering the effect of monetary policy on the economy is the Vector Autoregression (VAR) model, which studies the effect of an unexpected change in a policy-controlled interest rate on several macroeconomic variables.1 However, with the purpose of setting the monetary policy, a central bank examines a wide set of variables; thus the estimates of a monetary shock derived from empirical models based on just a small number of observed variables may be biased. In order to overcome these circumstances, Bernanke et al. (2005) introduced a Factor-Augmented Vector Autoregression model (FAVAR) approach wherein a large amount of information about the
* Corresponding author. Tel.: +371 28265333; e-mail: [email protected]** The opinions expressed in this paper are those of the author and do not necessarily reflect the opinion
of the University of Latvia or of the Bank of Latvia. 1 For the euro area monetary transmission mechanism, excellent examples are provided by Peersman
and Smets (2001), Mojon and Peersman (2001). For Latvia, the VAR approach was used by Bitāns et al. (2003) and Bitāns and Kaužēns (2004).
TRAnsMIssIon of MoneTaRy sHoCKs: THe FAVAR aPPRoaCH
ANDREJS BESSONOVS
Journal of Economics and Management Research Vol. 1, 2012: 21–32
JournalEconMngmnt-makets.indd 21 20.12.2012 14:12:13

22 TRANSMISSION OF MONETARY SHOCKS: THE FAVAR APPROACH
economy is first summarised within a few common factors and then VAR analysis is applied.
Over the years, the integration of global capital, goods and financial markets has become stronger. Therefore, the spill-over of global shocks should be taken into account while analysing the transmission mechanism for individual countries, especially on such a small and open economy as Latvia. Taking into account that Latvia’s national currency – the lat – is fixed to the euro and that Latvia participates in the exchange rate mechanism (ERM II) and aims to accede to the euro area in the very near future, the quantification of the response to euro area monetary shock is of great importance in assessing the transmission mechanism for Latvia. The main question we have to address is to what extent euro area monetary policy shocks affect the Latvian economy.
There are several existing papers on the study of monetary shock transmission in Latvia. For instance, the study by Bitāns et al. (2003) concludes that monetary shocks affect the economy mainly by means of the exchange rate channel, though these shocks are exogenous due to the fixed exchange rate. Bitāns and Kaužēns (2004) have suggested that the impact of interest rate changes on Latvia’s GDP and inflation is 5–6 times weaker than in the EMU countries. Benkovskis (2008) revealed some evidence about the influence of Latvia’s monetary policy on the lat loan supply of certain Latvian banks being transmitted through the lending channel, but no statistically significant evidence has been collected for total loans as yet. None of these studies provide a pervasive analysis of the cross-border effects of monetary policy shocks.
This paper reviews recent advances in the empirical literature regarding econometric estimation of monetary policy effects by means of the FAVAR model. It shows that an extended version of the FAVAR model for a small open economy may serve as a suitable representation with which to analyse cross-border effects of euro area monetary policy shocks on Latvia. Based on the available literature, a theoretical discussion is offered on the possible impact of euro area monetary shocks on Latvia.
The paper is organised as follows. Section 2 reveals the recent literature on the FAVAR framework emphasising its advantages in comparison to the VAR model. Section 3 describes a FAVAR model and its extension in order to analyse monetary shocks for small and open economies from a theoretical and econometrical perspective. Section 4 provides a condensed overview of the possible cross-border effects of the euro area monetary shocks on Latvia.
1 MoneTaRy PolICy by Means of faVaR
1.1 Cause and Consequences
A vast body of literature and of monetary research has been devoted to uncovering the effects of monetary policy on macro-economic variables. A
JournalEconMngmnt-makets.indd 22 20.12.2012 14:12:13
Andrejs Bessonovs 23
conventional tool with which to explore and account for these effects is known as Vector Autoregression (VAR). Nevertheless, standard VAR models can capture only a small number of variables, usually no more than 8, since a larger number may lead to a loss of degree of freedom. According to Bernanke et al. (2005), three potential problems arise: firstly, the small number of variables is unlikely to span the dataset that is used by central banks and the private sector to make policy decisions. There is also a risk of encountering the “price puzzle” problem pointed out by Sims (1992), i.e. a tightening of monetary policy leads to an initial increase of price levels, which contradicts the macroeconomic (monetarist) theory. Secondly, there is a problem that arises from the sparse information in VAR analyses of monetary policy in that it requires a stand on some specific observable measures regarding theoretical framework. Therefore, the concept of “economic activity” need not be represented by industrial production or by real GDP. Consequently it may be misleading to rely on specific observables. Thirdly, in using a VAR analysis, we can observe impulse responses only for those variables that are included in the given framework and a large number of economic variables that we are concerned about are left beyond this. Thus, Bernanke et al. (2005) suggested the need to estimate the unobservable factors from a large panel of observable variables and then to run the VAR model on unobservable factors, and to call this new method Factor-Augmented Vector Autoregression (FAVAR).
Bernanke et al. (2005) demonstrated first of all how the VAR model can be extended to account for the much larger number of information sources, without giving up too much freedom in comparison with a conventional VAR model. Secondly, they concluded that the FAVAR model is able to accurately identify the monetary transmission mechanism. Thirdly, the FAVAR model is able to solve the “price puzzle” issue, which Sims (1992) called the problem of insufficient information that is not included in the model, or, omitted variable bias.
The work of Bernanke et al. (2005) gave great impetus to econometric literature. The analysis of large data sets of information is a major challenge for the quantification of the economic relationships. Several papers by Bernanke et al. (2005), Boivin and Giannoni (2006), Benkovskis et al. (2011), Mumtaz (2010), Eickmeier et al. (2011a) have analysed the impact of monetary policy, i.e. causes and consequences of the real and nominal economic indicators with large datasets used simultaneously in the VAR model.
Boivin and Giannoni (2006) used large macro-economic data sets within the FAVAR model and analysed U.S. monetary transmission effectiveness over a period of forty years. Boivin and Giannoni (2006) also noted that since 1980, the years of U.S. monetary policy became more effective. Monetary policy shocks have been less disruptive to economic activity and inflation since the 1980s. They concluded that monetary policy has become more stabilising. In describing the reasons for this, the authors argued the case of the dominant role of monetary policy decisions and a stronger response to inflation expectations.
JournalEconMngmnt-makets.indd 23 20.12.2012 14:12:13
24 TRANSMISSION OF MONETARY SHOCKS: THE FAVAR APPROACH
Mumtaz (2010) used the FAVAR model to analyse UK monetary policy since the 1970s. He developed the new method and evaluated the impact of monetary policy with time-varying FAVAR, which exploits Bayesian techniques to estimate parameters of the model and impulse responses. Mumtaz (2010) argued that since the Bank of England introduced inflation targeting in 1992 the persistence and volatility of UK output and inflation has fallen significantly. In addition, similar behaviour has been observed for money growth and asset prices. Decomposition of the variation, however, shows that monetary policy shock has had a smaller impact on inflation and interest rates since 1992, but that the “price puzzle” phenomena was much less pronounced than in other studies of UK monetary policy.
Eickmeier et al. (2011a) extended the Bernanke et al. (2005) model and confirmed the Boivin and Giannoni (2006) conclusions on the effectiveness of monetary policy. Eickmeier et al. (2011a) extended the model to a time-varying FAVAR. In contrast to Mumtaz (2010), Eickmeier et al. (2011a) estimated the time-varying FAVAR model in two steps. In the first step, the factors were estimated by the principal components (PC) method. In the second step they estimated time-varying factor weights, FAVAR autoregression matrices, variance and correlation, but the shocks were identified using traditional Cholesky decomposition. Consequently, time-varying parameters were estimated with the Kalman filter. As in previous studies on the impact of monetary policy on the U.S. economy, Eickmeier et al. (2011a) confirmed the conclusion that since 1980s monetary policy shocks did have much smaller effects on economic activity and prices, which served to partly demonstrate best practice in monetary policy decision-making, it was the right choice to switch to inflation expectations targeting and the impact of globalisation. Eickmeier et al. (2011a) also claimed that they have not found evidence that economic activity would have reacted differently to a monetary economy in different economic phases, i.e. during recession and expansion periods.
1.2 International Dimensions
World economic integration or globalisation has made it impossible for one country’s growth, development, economic crisis and crisis management, to take place without affecting neighbour (other) country development and progress. Interaction proceeds via multiple channels – foreign trade, exchange rate regimes, financial integration and business cycles, the synchronisation of the technological shocks and confidence. Since global economic integration is expanding, it is frequently mentioned that one country’s macroeconomic performance more and more reflects events in the rest of the world. In recognising this, researchers have put forward hypotheses that try to determine the extent to which international economic drivers affect domestic circumstances. Eickmeier (2007, 2009), Eickmeier et al. (2011b), Eickmeier and Ng (2011), Boivin and Giannoni (2010), Mumtaz and Surico (2009), Mumtaz et al. (2011) in that sense, and to that purpose, employed dynamic factor models.
JournalEconMngmnt-makets.indd 24 20.12.2012 14:12:13

Andrejs Bessonovs 25
Eickmeier (2007) developed a structural dynamic factor model to study international business cycle transmission between the U.S. and Germany. In contrast to the VAR models, which are routinely used for structural shock identification and evaluation – the structural dynamic factor model has several advantages: (i) there is a greater amount of information used, (ii) it is possible to estimate the impulse response functions for a greater number of economic indicators, (iii) It may be possible to estimate various transmission channels simultaneously, including the so-called “new” channels such as the stock markets, FDI, international borrowing and confidence channels. By using several (U.S. and Germany) economic indicators at hand, Eickmeier (2007) evaluated the structural dynamic factor model with the PC method. She concluded that U.S. macroeconomic shocks affect Germany largely symmetrically, i.e. supply shock raises output and reduces prices, but demand shock increases both indicators. However, German output and price reactions to the U.S. supply and demand shocks are not statistically significant. Eickmeier (2007) has pointed out that marketing channels play a major role in transmission, in particular on the impact of demand shocks. Less convincing was her conclusion on the financial markets and confidence channels. Perhaps the confidence channel becomes significant only at the end of the data. Boivin and Giannoni (2010) have drawn attention to global economic driving forces and the effectiveness of monetary policy. They posed the question as to what extent global economic driving forces affect the U.S. key macro-economic indicators. The second issue of their study dealt with the question of whether financial market globalisation reduced the ability of U.S. monetary policy to affect the domestic financial market and thus the economy as a whole. To explore the global impacts on U.S. macro-economic indicators and monetary policy, researchers developed the FAVAR model with “global” factors. Boivin and Giannoni (2010) concluded that the unobservable factors explain most of the variance of U.S. macro-economic indicators. Secondly, they pointed out, however, that there is evidence that global factors have tended to change the variable behaviour in recent decades, but that this trend has been observed in only a few variables. Thirdly, the researchers found no strong statistical evidence to conclude that global economic factors have a significant impact on monetary policy transmission mechanisms, while at the same time stating that this does not mean that global factors do not affect domestic economy. Eickmeier et al. (2011b) explained in their study how and to what extent the U.S. financial shocks affect the rest of the world’s great powers. Eickmeier et al. (2011b) defined the U.S. shock by means of a financial condition index (FCI). They used the time-varying FAVAR model and FCI index with 200 economic indicators for the top nine developed countries to study the financial shock of the international transmission mechanism. The time-varying features of the model allow for the possibility to analyse the evolution of transmission and to determine the impact of financial shock over time to the economic activity of the great powers. They quantitatively confirmed that
JournalEconMngmnt-makets.indd 25 20.12.2012 14:12:13

26 TRANSMISSION OF MONETARY SHOCKS: THE FAVAR APPROACH
the recent global financial crisis was caused by a negative financial shock in the U.S. and its strong spread all around. About 30 per cent of GDP variation in industrialised countries can be explained by variations in the U.S. financial shock during the years of crisis as opposed to less than 10 per cent during the period from 1971 to 2007. Transmission channels for the dissemination of the crisis are financial markets, trade and economic policy responses. Close trade ties between industrialised countries and the United States contributed to a stronger pass-through effect.
Mumtaz and Surico (2009), Mumtaz et al. (2011) explored the international monetary transmission effect on a small open country, e.g., the United Kingdom. Using 560 indicators for 17 developed countries, they defined the term “foreign” economy and studied the impact on a small open economy utilising the FAVAR model. Mumtaz and Surico (2009) extended the Bernanke et al. (2005) FAVAR model and developed a model for a small open economy. Their analysis differed in terms of structural shock identification and estimation methods. To identify the “foreign” demand and supply shocks Mumtaz and Surico (2009) and Mumtaz et al. (2011) exploited the sign restriction scheme for structural shock identification in line with Canova and De Nicolo (2002) and Uhlig (2005), but the parameters were estimated with the Bayesian method. Mumtaz and Surico (2009) concluded that the expansionary “foreign” monetary policy strengthened the nominal exchange rate but significantly affected GDP, consumption and investment. They found weak evidence of “foreign” demand shocks on the domestic economy, but that “foreign” supply shocks significantly affect consumer prices. In observing that negative price reaction is negatively asymmetric, they concluded that the supply shock affects the domestic economy through relative prices. Similar to Bernanke et al. (2005), Mumtaz and Surico (2009) concluded that the FAVAR model helps partly to explain macroeconomic puzzles (liquidity, price and exchange rate puzzles) that show little evidence.
Mumtaz et al. (2011) used the time-varying FAVAR model to obtain impulse response functions and confirmed the changing character of “foreign” monetary policy, supply and demand shocks over the period from 1975 to 2005. They discovered that the “foreign” inf luence of monetary policy over time was very different to domestic economic activity indicators. Time-varying impulse response functions revealed a sharp changing nature of “foreign” monetary shock to the economy. Due to the diminishing indirect effect of exchange rate on import prices, economic activity response to the shock is less at the end of the data sample. “Foreign” supply and demand shocks do not show drastic changes over time, but highlight this with a lower stability over the end of the data sample, possibly pointing to an inf lation targeting in the beginning of the 1990s.
Benkovskis et al. (2011) developed the FAVAR model for a small open economy and examined the monetary policy of cross-border effects on three Central and Eastern European countries: the Czech Republic, Hungary and
JournalEconMngmnt-makets.indd 26 20.12.2012 14:12:13

Andrejs Bessonovs 27
Poland. To explore the mechanisms of transmission, they used 170–200 indicators for each country and evaluated the model proposed by Bernanke et al. (2005) with a two-step method. Benkovskis et al. (2011) concluded that ECB monetary policy significantly and substantially affects these small and very open CEE economies. They noted that increased interest rates and consequently lower foreign demand primarily affected real economic activity variables, thus reducing the GDP. Secondly, they concluded that exchange rate significantly affects price volatility. A positive monetary policy shock reduces the effective exchange rate and in the medium-term increases export and import deflators. Although the CEE countries are very similar to each other, however, monetary policy effects are slightly different. Monetary policy affects Poland to a lesser extent, but this is due to relatively less foreign trade. Since the euro area monetary policy is likely to affect economic activity not only in the euro area countries, but also in neighbouring countries, these neighbouring countries must closely follow and analyse the euro area monetary policy decisions, and timeliness of implementation.
2 THe faVaR MoDel foR laTVIa
2.1 Classical faVaR
Bernanke et al. (2005) proposed a solution to the “curse of dimensionality” problems by using the VAR analysis for a small number of unobserved factors obtained from a large dataset. These latent factors account for the common dynamic of hundreds of macro-economic variables and summarise the bulk of information about the whole economy into a small number of factors. Impulse responses of the key macroeconomic variables are then constructed using the impulse responses of factors and corresponding factor loadings.
The main idea of the FAVAR proposed by Bernanke et al. (2005) is to consider the joint dynamics of latent factors that span most of the economic activity and monetary policy tools that have comprehensive effects throughout the economy as follows:
(2.1)
where is the vector of latent factors, is the vector of observable variables that affect economy, is the lag polynomial of finite order , and shocks and are assumed to be normal i.i.d. with mean zero and covariance matrices
and .Bernanke et al. (2005) obtained common factors by the principal components
method. Stock and Watson (2002b) proved that the principal components are consistent estimates of common factors in an approximate dynamic factor model.
JournalEconMngmnt-makets.indd 27 20.12.2012 14:12:13

28 TRANSMISSION OF MONETARY SHOCKS: THE FAVAR APPROACH
According to the assumption of the approximate dynamic factor model, the observable time series relates to the unobservable factors and to the observable variables as follows:
(2.2)
where is the vector of economic indicators, is the vector of unobserved factors, is the vector of observed variables (e.g. policy variables) for periods; and are factor loadings matrices with and
elements respectively, the number of factors is much smaller relative to the number of indicators , residuals are allowed to be serially and weakly correlated across indicators.
2.2 extended faVaR for a small open economy
International macroeconomic theory proposes that any small open economy with a fixed exchange rate has rather limited monetary policy instruments at its disposal. This is exactly the case of Latvia. Moreover, Latvia is directly exposed to the monetary policy from the euro area. The presence of international banks, originating in the European Union, in the Latvian financial market is high. In 2009, the share of Latvian resident credits in those banks was 74% of total credits, and mostly taken in the euro currency. Moreover, with the turnover of Latvian foreign trade with the EU being high (73.6% of the total Latvian foreign trade turnover in 2009) there is an extra reason to consider the dynamics of the euro area and Latvia’s economic driving forces jointly when determining the monetary shock transmission mechanism. Therefore, the FAVAR model needs to be modified so as to capture these circumstances.
The general FAVAR model needs to be extended in order to estimate the impact of euro area monetary shocks on Latvia. Similarly to Boivin and Giannoni (2010), Mumtaz and Surico (2009) and Benkovskis et al. (2011), we assume two regions: the big economy and the small economy. The big economy stands for the euro area, and we assume that Latvia is a small and open economy, closely connected with the European Union and the euro area.
Both regions have their own vectors for the common latent factors , which cover economic activity as summarised from the
observed economic variables where :
(2.3)
(2.4)
The Vectors of the common factors take the forms and where is the regions’
observable variable and is estimated common factor. is the factor loadings
JournalEconMngmnt-makets.indd 28 20.12.2012 14:12:14

Andrejs Bessonovs 29
relating the common factors to economic variables . The Vectors are uncorrelated with common components, , but they may be serially correlated and weakly correlated across indicators. As noted earlier, it is assumed that
.The joint dynamics of equations (2.3) and (2.4) might be reflected in the
following structural form:
(2.5)
where is white-noise disturbances with diagonal covariance matrix .Pre-multiplying equation (2.5) by allows us to obtain VAR in reduced
form:
(2.6)
where reduced form VAR innovations and are cross-correlated.
The FAVAR in equation (2.6) could be estimated with the two-step approach. Firstly, we must estimate the factors and their loadings by means of principal components analysis individually for Latvia and the euro area, identifying a proper number of factors and monetary policy tool. Secondly, we must estimate the equation system (2.6) applying specific identification restrictions on and obtain impulse responses for individual variables of interest.
2.3 estimation of the faVaR
Having the determined structure of FAVAR in Section 3.2, it is now possible to turn to equation (2.6) and discuss the necessary identification restrictions on the FAVAR model. Benkovskis et al. (2011) showed that by imposing zero restrictions on the FAVAR coefficients it is possible to eliminate the impact of small open economy on the big economy. In the Latvian case equation (2.6) may take the following form:
(2.7)
where are lag polynomials representing the influence of lagged values on . Lag polynomials and show the impact of the euro area common factors on the euro area and Latvia’s common factors respectively.
On the assumption that is equal to zero, there is no effect of Latvia’s latent factors and interest rates on the euro area common factors at any lags.
JournalEconMngmnt-makets.indd 29 20.12.2012 14:12:14

30 TRANSMISSION OF MONETARY SHOCKS: THE FAVAR APPROACH
Identification might significantly affect the impulse responses, therefore proper economic reasoning is necessary to identify a monetary shock. The usual and simple way is to assume a recursive identification scheme for the economically grounded order of variables (e.g. Cholesky decomposition). The variables are ordered as follows: .
Thus, euro area factors and monetary instruments contemporaneously determine movements in Latvia’s factors but not vice-versa. The order of region-specific variables assumes that interest rate reacts contemporaneously to factor movements in the first period but not otherwise.
Note that as we are not interested in impulse responses to Latvian monetary shock, thus is omitted.
The FAVAR model typically faces two types of uncertainty: the uncertainty of factors and FAVAR estimates. In order to overcome bias problems in determining confidence intervals of a small sample that are usually present in traditional parametric estimation methods, the bootstrap method (a non-parametric approach) can be applied to obtain the confidence intervals for common factors and impulse responses of FAVAR.
DIsCUssIon anD ConClUsIons
The FAVAR model seems the most plausible and effective solution to the analysis of cross-border monetary policy effects on real and nominal variables in a small and open economy capturing a major of important information. By properly identifying the FAVAR econometric model we are able to quantify impulse responses to every specific variable in the dataset we are interested in. Benkovskis et al. (2011) obtained comprehensive results about the cross-border effects of the euro area monetary shocks on small open economies (Poland, Czech Republic and Hungary). They noted that foreign demand and interest rates play a significant role in transmission. Knowing the facts of Latvia’s foreign trade size, dependency on foreign trade and the sizable domestic loans denominated in euro, the effects of the euro area monetary policy on Latvia can be both direct, via changes in interest rates, and indirect, via changes in foreign demand. Therefore after joining the EMU, the majority of real activity variables in Latvia may react stronger to euro area monetary policy shocks than to the euro area itself. A spill-over effect from any decreasing euro area activity may negatively affect Latvia’s activity by reducing exports. Taking into account the evidence on convergence between the Latvian and euro area business cycles, the euro area monetary policy may affect activity in Latvia counter-cyclically. Furthermore, bearing in mind the higher volatility of Latvia’s output, the common euro area monetary policy will act as an effective instrument for the prevention of potential imbalances in the Latvian economy.
Future research should be carried out on the estimation of a FAVAR model for Latvia thus quantifying euro area monetary shocks to important economic
JournalEconMngmnt-makets.indd 30 20.12.2012 14:12:15

Andrejs Bessonovs 31
variables. Taking into account Latvia’s relatively short time series it would be beneficial to estimate the FAVAR model with Bayesian techniques. Thus, we would be able to exploit available information efficiently and easily calculate impulse responses and confidence intervals as a by-product of Monte Carlo Integration.
IEGULDĪJUMS TAVĀ NĀKOTNĒ
This work has been supported by the European Social Fund within the project “Support for Doctoral Studies at the University of Latvia”.
bibliographyBai, J., Ng, S., 2002. Determining the Number of Factors in Approximate Factor Models.
Econometrica, vol. 70, No. 1, pp. 191-221.Benkovskis, K., 2008. Is There a Bank Lending Channel of Monetary Policy in Latvia?
Evidence from Bank Level Data. Latvijas Banka Working Paper, No. 1.Benkovskis, K., Bessonovs, A., Feldkircher, M., Woerz, J., 2011. The Transmission of
Euro Area Monetary Shocks to the Czech Republic, Poland and Hungary. Evidence from a FAVAR Model. Focus of European Economic Integration, vol. 3, pp. 8-36.
Bernanke, B., Boivin, J., Eliasz, P., 2005. Measuring the Effects of Monetary Policy: A Factor-Augmented Vector Autoregressive (FAVAR) Approach. Quarterly Journal of Economics, vol. 120, issue 1, pp. 387-422.
Bitāns, M., Stikuts, D., Tillers, I., 2003. Transmission of Monetary Shocks in Latvia. Latvijas Banka Working Paper, No. 1.
Bitāns, M., Kaužēns, E., 2004. Impact of the Euro Adoption on the Economy of Latvia. Latvijas Banka Working Paper, No. 2.
Boivin, J., Giannoni, M., 2006. Has Monetary Policy Become More Effective? Review of Economics and Statistics, vol. 88, No. 3, pp. 445-462.
Boivin, J., Giannoni, M., 2010. Global Forces and Monetary Policy Effectiveness. NBER volume on International Dimensions of Monetary Policy, pp. 429-478.
Canova, F., De Nicolo, G., 2002. Monetary Disturbances Matter for Business Fluctuations in the G-7. Journal of Monetary Economics, vol. 49, pp. 1131-1159.
Eickmeier, S., 2007. Business Cycle Transmission from the US to Germany – A Structu-ral Factor Approach. European Economic Review, vol. 51, pp. 521-551.
Eickmeier, S., Lemke, W., Marcellino, M., 2011a. Classical Time-Varying FAVAR Models – Estimation, Forecasting and Structural Analysis. CEPR Discussion Paper, No. 8321.
Eickmeier, S., Lemke, W., Marcellino, M., 2011b. The Changing International Transmission of Financial Shocks: Evidence from a Classical Time-Varying FAVAR. CEPR Discussion Paper, No. 8341.
Eickmeier, S., Ng, T., 2011. Forecasting National Activity Using Lots of International Predictors. An Application to New Zealand. International Journal of Forecasting, vol. 27, pp. 496-511.
JournalEconMngmnt-makets.indd 31 20.12.2012 14:12:15

32 TRANSMISSION OF MONETARY SHOCKS: THE FAVAR APPROACH
Kilian, L., 1998. Small-Sample Confidence Intervals for Impulse Response Functions. The Review of Economics and Statistics, vol. 80, issue 2, pp. 218-230.
Mojon, B., Peersman, G., 2001. A VAR Description of the Effects of Monetary Policy in the Individual Countries of the Euro Area. European Central Bank Working Paper Series, No. 92.
Mumtaz, H., 2010. Evolving UK Macroeconomic Dynamics: a Time-Varying Factor Augmented VAR. Bank of England Working Paper, No. 386.
Mumtaz, H., Surico, P., 2009. The Transmission of International Shocks: A Factor-Augmented VAR Approach. Journal of Money, Credit and Banking, vol. 41, issue 1, pp. 71-100.
Mumtaz, H., Liu, P., Theophilopoulou, A., 2011. International Transmission of Shocks. A Time-Varying Factor-Augmented VAR Approach to the Open Economy. Bank of England Working Paper, No. 425.
Sims, C., 1992. Interpreting the Macroeconomic Time Series Facts: The Effects of Monetary Policy. European Economic Review, vol. 36, issue 5, pp. 975-1011.
Stock, J., Watson, M., 2002b. Forecasting Using Principal Components from a Large Number of Predictors. Journal of the American Statistical Association, vol. 97, No. 460, pp. 1167-1179.
Uhlig, H., 2005. What Are the Effects of Monetary Policy on Output? Results from an Agnostic Identification Procedure. Journal of Monetary Economics, vol. 52, issue 2, pp. 381-419.
JournalEconMngmnt-makets.indd 32 20.12.2012 14:12:15

sUPPoRT aCTIVITIes foR InnoVaTIon In laTVIa:
MyTH oR RealITy
Ilona DUbRA*1
University of latvia, faculty of economics and Management a/s lUXHoUse
Abstract. Developing innovative ideas and successfully taking them to the market is an important determinant for economic growth and sustainability. The stimulation of innovation and interaction between such actors as business, academia, research institutes, finance institutions, industry representatives, associations and government institutions are regarded as a key prerequisite for sustainable development of the state.European innovation policy supports the co-operation of national and regional innovation programmes and activities for innovation institutions and other innovation actors to implement joint action. There is a specific need to investigate innovation support mechanisms, state innovation policy and implemented activities in order to promote innovation in Latvia in a more effective way.The aim of this study is to analyse innovation support policy actions. The main research methods implemented involved qualitative data collection, processing and interpretation. The author of this study utilised a multi-method research design to identify and analyse the appropriate scientific publications and other information and sources of data within the scope of semantics, synthesis and content analysis. In the context of this study, such tools as monographic, grouping, reference, generalisation, graphical analysis and content analysis were all applied within economic science quantitative and qualitative research methods. State government policy actions in support of innovation are treated as a vital tool for innovation creation, development and promotion. Although there are many documents to be found in the area of innovation policy, there nevertheless remains a systematic lack of supportive action and/or financial support for innovation development in Latvia.
Key words: innovation policy, support activities in Latvia, university, research institutes, industry, and government institutions.
JEL code: A11; A12; A13; H52; M21; O16; O31; O32; O34; O38; O52
InTRoDUCTIon
This study deals with an analysis of the concept of innovation through an examination of its various definitions. The present study also examines important aspects of the European Union Innovation Support Policy Action and reveals key
* Corresponding author. E-mail: [email protected]
sUPPoRT aCTIVITIes foR InnoVaTIon In laTVIa: MyTH oR RealITy
ILONA DUBra
Journal of Economics and Management Research Vol. 1, 2012: 33–44
JournalEconMngmnt-makets.indd 33 20.12.2012 14:12:15

34 SUPPORT ACTIVITIES FOR INNOVATION IN LATVIA: MYTH OR REALITY
statistical data on innovation support. It also provides an insight to the expert discussion on the Latvian innovation policy framework in the context of its support activities and systemic failures.
Within the overall Latvian economy there is a prevalence of industries with low added value that are oriented towards nature resources processing, and employ the benefits of an inexpensive workforce. Unfortunately, there is a lack of innovative entrepreneurial activity in the context of the Latvian economic sector (Dubra, 2011 b).
According to the most recent Eurostat data, Latvia’s counties have the poorest ratio of innovative enterprises. This fact may be the reason for a low level business environment at most and this most certainly poses a dramatic threat to the already depleted national economic sector (Dubra, 2011a).
Taking into account the available data of the Central Statistical Bureau of Latvia, it is important to observe that only one in five of all enterprises registered in Latvia are involved in any innovative activities. In addition, public funding for Research and Development is well behind that of other developed countries of the European Union. There is only a notably scarce co-operation between enterprises and the academic community, which results in the delay of innovative creation. There is a lack not only of information but also of interest about probable co-operation prospects with researchers in the area of innovation. However, while there is no shortage of documents that have been drafted in order to put pressure on the Latvian innovation policy, the realisation of any concrete planning is proceeding at a minimum pace.
The purpose of this study is to analyse the existing innovation support policy actions.
Research Tasks:• toanalysethetheoreticalaspectoftheconceptofinnovation.• toexamineEuropeanUnionpolicyactionsinsupportofinnovation.• toinvestigateinnovationsupportactivitiesandsystemicfailuresinLatvia.Research methods applied: the grouping method; the graphical method;
content analysis; the monograph method.Taking into account the increasing aged population and pressures of the
global environment, Europe’s future economic growth and development should be based on product innovation, services innovation and innovation in business models. Innovation strategy has been placed in the block of growth and jobs in the context of the EU growth strategy document “Europe 2020”. The list of problematic questions of the study undertaken includes issues such as: minor innovation support activities in Latvia; lack of clarity within Latvia on innovation systems; and the fact that there is actually no state policy on innovation in Latvia.
Of particular focus in the review of information and data sources were the following scholarly publications: Administrative Science Quarterly,
JournalEconMngmnt-makets.indd 34 20.12.2012 14:12:15

Ilona Dubra 35
The International Journal of Management Science, Technovation, The Journal of Occupational and Organizational Psychology, Nigerian Journal of Applied Psychology, Technology in Society, The Publications Office of the European Union, 32nd Conference of the European Association of Research in Industrial Economies, expert discussion papers from “Education. Innovation. Entrepreneurship” March, 2012.
Theoretical discussion within this study has been inspired by the following scholars: Gopalakrishnan, S., Damanpour, F., Eisenhardt, K., Tabrizi, B., Bernstein, B., Singh, P., Akinboye, J., Ten Bos, R., Schumpeter, J., Zhongi, X., Yang, X., Dubra, I., Freeman, C., Friedrich-Nishio, M., Axtell, C., Holman, D., Unsworth, K., Wall, T., Waterson, P., Harrington, E.
InnoVaTIon anD sUsTaInable eConoMy
First of all, any discussion on the state innovation system requires some initial definition of the term “innovation”. Innovation is “a complex process with multiple, cumulative and conjunctive progressions of convergent, parallel and divergent activities” (Gopalakrishnan and Damanpour, 1997). Eisenhardt and Tabrizi conceptualise innovation as an uncertain process that relies on improvisation, real-time experience and flexibility. Innovation, in this context, follows a very uncertain path through fast-changing markets and technologies (Eisenhardt and Tabrizi, 1995). Bernstein and Singh identify four stages, namely:
1) idea generation; 2) innovation support; 3) innovation development; 4) innovation implementation (Bernstein and Singh, 2006). Innovation refers to new things and ideas. It is “the act of introducing
something new” (American Heritage Dictionary of the English Language, 2000). The innovation process involves the generation, adoption and implementation, and incorporation of new ideas and practices (Axtell et al. 2000). Innovation is the application of ideas, concepts and designs to create wealth (Akinboye, 2000). In relation to organisational management, innovation is the process of being creative and implementing new methods to organise or run a company and create improved results (Ten Bos, 2000).
Schumpeter defined innovation in the following manner (Schumpeter, 1934):• Theintroductionofanewproductoraqualitativechange inanalready
existing product• Theintroductionofanewprocess,notknownintheindustry• Theopeningofanewmarket• Thedevelopmentofnewsourcesforthesupplyofrawmaterialsorinputs• Theintroductionofchangesinindustrialorganisation
JournalEconMngmnt-makets.indd 35 20.12.2012 14:12:15

36 SUPPORT ACTIVITIES FOR INNOVATION IN LATVIA: MYTH OR REALITY
Schumpeter argues that entrepreneurship is the process of providing a new and different mix of resources with the purpose to introduce new ideas to the market. The Innovator, through replacing the existing firms or ideas with new firms, products or processes is trying/attempting to disturb the existing order and to create a new order. In Schumpeter’s perspective, this is a dynamic process because along with the efforts of entrepreneurs to introduce innovation to the market through replacement of non-competitive businesses as well as products, services or processes, a considerable pressure is exerted on existing enterprises to become more competitive. As a consequence, such entrepreneurial actions lead to economic change (Zhongi and Yang, 2007). The Austrian school is inspired by Schumpeter’s views and refers to innovation and entrepreneurship as being the main factors of production in the national economy. This is why it is important to promote and develop not only episodic innovation activities but also to constantly support and extend a National Innovation Policy (including all of its actors/participants) on the basis of sustainable development.
Freeman argues that state economic success is tightly related with major institutional changes in the national system of innovation and also with increases in volume of professional research, inventive activities and new clusters of radical innovations (Freeman, 1987). Friedrich-Nishio proposed the following model for a National Innovation System to identify the main player/s in an innovation system (Friedrich-Nishio, 2005). The characteristics of various innovation systems were analysed in terms of science and technology activities. The indicators of an innovation process may be seen in such input factors as R&D expenditures, human resources, and such output factors as number of patents, number of scientific papers and such other indicators that reflect the results of innovations as technology trade, exports of high-tech products, relationships between universities and companies. According to M. Friedrich-Nishio, a National Innovation System should operate on five levels: Society, Policy, Knowledge base, Industry and Market. The first level consists of the following determinants: environment, culture and tradition, national character; politics and economy; government. The block determinants impact on the knowledge base through economic policy, social infrastructure, education policy, science and technology policy, labour policy, tax and financial policy. Universities are treated as Human resources, producers of knowledge and as the actors of development and supply. There is a constant collaboration between universities and companies. Finally, taking account of market demand, companies can thus create innovations through the utilisation of knowledge.
ReseaRCH ResUlTs anD DIsCUssIon
The european Union Innovation support Policy in action
Innovation support measurement is being treated as a policy instrument that has been designed at regional, national or European Union level to support
JournalEconMngmnt-makets.indd 36 20.12.2012 14:12:15

Ilona Dubra 37
innovation in business. During the Competitiveness Council meeting in Brussels, in December 2006, it was concluded that: “Innovation Policy should best be understood as a set of instruments. These aim at improving access to financing in support of innovation; at creating an innovation-friendly regulatory environment and demand for innovation as well as at reinforcing the activities of institutions relevant for innovation, including the links between research institutions and industry”. It was also acknowledged that “Innovation Policy typically addresses horizontal issues, consisting of various public policies, thus requiring effective governance” (European Commission, 2009). Table 1 (below) summarises a possible policy action in order to support innovation on activities (product and/or service innovation, process innovation, organisational innovation or marketing innovation), firm, sector and at market level. Policy actions may aim at supporting (European Commission, 2009):
• innovationingeneral(thesectorortypeoffirmisnottakenintoaccount)• innovativefirmsasthekeydriversofcompetitivenessandgrowth• innovativenessofentiresectorsorthecreationofnewmarketopportunities
for innovative services
Table 1Policy Actions in Support of Innovation
Activity level Firm level Sector level Market levelSpecific support policies
– statistical and stakeholder based analysis on innovation performance
– Support to pub-lic RTD
– Facilitation of knowledge trans-fer
– Promotion of ICT use (e-business)
– Market replica-tion projects, such as on eco-innovation
– Innovation benchmarking & technology foresight
– Business incuba-tion
– Innovation management training & sup-port for protec-tion of intellec-tual property
– Access to finance– interactions with
other firms or research bodies /universities
– Sectorial indus-try policy initia-tives in specific sectors, including innovation
– Specific cluster policies and/or initiatives in specific sectors
– Standardisation & certification
– Legal & regula-tory framework for innovative activities
– Better regula-tion/ liberalisa-tion of specific markets
– Lead market initiatives on new markets
Horizontal support policies
– Tax incentives– State aids– Public
procurement– Education &
training
– Entrepreneur-ship policies for start up’s
– Mobility programmes
– Public procurement
– IPR policy– Sector-specific
standardisation, such as in ICT
– Internal Market– Trade &
competition policy, including merger controls
Source: European Commission, 2009
JournalEconMngmnt-makets.indd 37 20.12.2012 14:12:15

38 SUPPORT ACTIVITIES FOR INNOVATION IN LATVIA: MYTH OR REALITY
Specific support policies mainly address factors hampering innovation activities at activity and firm level. Support activities are implemented through framework programmes or specific actions with a defined budget and period of duration. Horizontal support policies are especially vital for the creation of an appropriate environment for innovation mainly at the sectorial and market level.
Innovation support activities in latvia
Low added value industries are typical for the Latvian economy according to the latest data provided by the Ministry of Economics in Latvia. Industry actors take advantage of the cheap labour force, which offers the main competitive advantage (Dubra, 2011a). The Ministry of Economics of the Republic of Latvia has drafted several innovation support programmes. The Latvian Investment and Development Agency manages a broad range of EU structural funds in the context of co-financing innovation support programmes. Within the framework of such programmes, companies have the opportunity to receive financial support at all stages of innovation development, i.e., from original idea to new product and technology creation and implementation in the whole production process (Ministry of Economics of the Republic of Latvia, 2011). Innovation support activities are being carried out through a popularisation of the concept of innovation among young and experienced entrepreneurs, through education and motivation to commence innovative entrepreneurship. The Ministry of Economics of the Republic of Latvia has announced that support activities are being made available to the private sector and to the science sector in order to promote collaboration activities between the academic community and industry representatives in the context of joint project implementation. The Ministry of Economics contends that such support activities are being devoted to the creation of new technologies and products, and for implementation into production processes. Support activities are also being devoted to huge projects for production facility creation with the purpose of stimulating local entrepreneurs to invest in science and technology projects as well as to attract foreign investments to the high added value sector. A variety of activities have been undertaken in order to provide entrepreneurs with access to finance for the implementation of innovative projects. On a parallel basis, the Ministry of Economics in co-operation with the Latvian Investment and Development Agency is working to develop new support tools for the promotion of innovation in Latvia.
The Ministry of Economics of the Republic of Latvia has summarised its main innovation support programmes within which projects are being implemented (Ministry of Economics of Republic of Latvia, 2011):
• Technology transformation contact points – for the support of collaboration between contact points, entrepreneurs in state science institutions and higher education authorities in order to provide project result commercialisation. In the context of this programme eight technology transformation contact points are presently being supported.
JournalEconMngmnt-makets.indd 38 20.12.2012 14:12:15

Ilona Dubra 39
• Competence centres – for the promotion of joint scientist – entrepreneur production projects and for new product development. In the context of the programme, taking into account Latvia’s main economy sectors, the following competence areas are being supported: 1) the pharmaceuticals and chemicals industry, 2) information and communications technologies, 3) the forestry industry, 4) the production of electrical and optical equipment, 5) the environment, bio-energy and the bio-technology industry, 6) transport and the mechanical engineering industry.
• Business incubators – for the promotion and development of new, viable, competitive entrepreneurship formations in all Latvian regions. The provision of appropriate environment and consultation services. Overall, there have been nine business incubators created in Latvia’s regions and one creative industry incubator in Rīga. Business incubator services are available in 24 Latvian cities.
• The Creation of new products and technologies – financial support is available for new or significantly improved product or technology creation and development (for entrepreneurs).
• The Creation of new products and technologies – support is available for implementation in production – support for entrepreneurial projects that deal with new product, service or technology processes implementation in the production process, including equipment and technology purchase.
• High added value investments – for the stimulation/motivation of local entrepreneurs to invest in education and technology-intensive projects in order to attract foreign investments in the high added value sector and to transfer modern technologies from foreign countries. In the context of this programme the main support activities are devoted to large-scale factory creation and to the creation of new jobs, equipment purchase and building (Ministry of Economics of Republic of Latvia, 2011).
statistical Data on Innovation support
According to the Eurostat definition, government budget appropriations or outlays on research and development (GBAORD) are funds allocated to R&D in central government or federal budgets and therefore entail budget provisions, not actual expenditure. Government budget appropriations or outlays on R&D are distributed on the basis of socio-economic objectives, depending on the purpose of the R&D programmes or projects and on the basis of the nomenclature for the analysis and comparison of scientific programmes and budgets (Eurostat, 2011). Spain held the leading position in the GBAORD level before the economic downturn from 2007 until 2008, however in 2009 Finland was the only European Union member state for which this figure was above 1%.
Figure 1 reveals the fact that government budget appropriations or outlays on Research and Development in Latvia were close to zero and even decreased
JournalEconMngmnt-makets.indd 39 20.12.2012 14:12:15
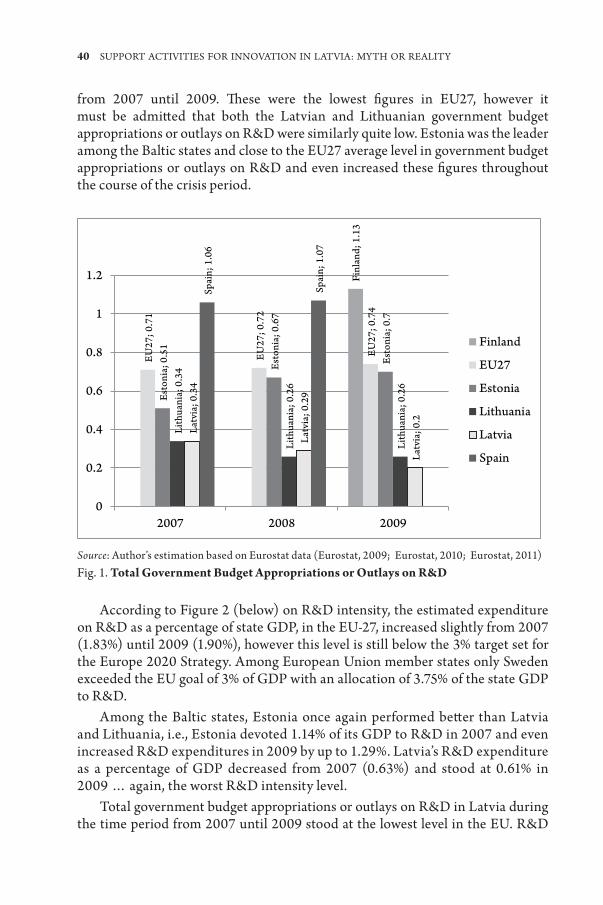
40 SUPPORT ACTIVITIES FOR INNOVATION IN LATVIA: MYTH OR REALITY
from 2007 until 2009. These were the lowest figures in EU27, however it must be admitted that both the Latvian and Lithuanian government budget appropriations or outlays on R&D were similarly quite low. Estonia was the leader among the Baltic states and close to the EU27 average level in government budget appropriations or outlays on R&D and even increased these figures throughout the course of the crisis period.
EU27
; 0.7
1
EU27
; 0.7
2
EU27
; 0.7
4
Esto
nia;
0.5
1
Esto
nia;
0.6
7
Esto
nia;
0.7
Lith
uani
a; 0
.34
Lith
uani
a; 0
.26
Lith
uani
a; 0
.26
Latv
ia; 0
.34
Latv
ia; 0
.29
Latv
ia; 0
.2
Spai
n; 1
.06
Spai
n; 1
.07
Finl
and;
1.1
3
0
0.2
0.4
0.6
0.8
1
1.2
2007 2008 2009
Finland
EU27
Estonia
Lithuania
Latvia
Spain
Source: Author’s estimation based on Eurostat data (Eurostat, 2009; Eurostat, 2010; Eurostat, 2011)Fig. 1. Total Government Budget Appropriations or Outlays on R&D
According to Figure 2 (below) on R&D intensity, the estimated expenditure on R&D as a percentage of state GDP, in the EU-27, increased slightly from 2007 (1.83%) until 2009 (1.90%), however this level is still below the 3% target set for the Europe 2020 Strategy. Among European Union member states only Sweden exceeded the EU goal of 3% of GDP with an allocation of 3.75% of the state GDP to R&D.
Among the Baltic states, Estonia once again performed better than Latvia and Lithuania, i.e., Estonia devoted 1.14% of its GDP to R&D in 2007 and even increased R&D expenditures in 2009 by up to 1.29%. Latvia’s R&D expenditure as a percentage of GDP decreased from 2007 (0.63%) and stood at 0.61% in 2009 … again, the worst R&D intensity level.
Total government budget appropriations or outlays on R&D in Latvia during the time period from 2007 until 2009 stood at the lowest level in the EU. R&D
JournalEconMngmnt-makets.indd 40 20.12.2012 14:12:16

Ilona Dubra 41
expenditure as a percentage of the GDP was also, at the same time, the lowest in the EU. This fact, combined with a poor state innovation policy resulted in dramatic delays in the development of innovative entrepreneurship and innovation activities at all.
EU27
; 0.7
1
EU27
; 0.7
2
EU27
; 0.7
4
Esto
nia;
0.5
1
Esto
nia;
0.6
7
Esto
nia;
0.7
Lith
uani
a; 0
.34
Lith
uani
a; 0
.26
Lith
uani
a; 0
.26
Latv
ia; 0
.34
Latv
ia; 0
.29
Latv
ia; 0
.2
Spai
n; 1
.06
Spai
n; 1
.07
0
0.2
0.4
0.6
0.8
1
1.2
2007 2008 2009
Finland
EU27
Estonia
Lithuania
Latvia
Spain
Source: Author’s estimation based on Eurostat data (Eurostat, 2009; Eurostat, 2010; Eurostat, 2011)Fig. 2. R&D Intensity (R&D Expenditure as % of GDP)
eXPeRT DIsCUssIon
Latvian experts from higher education, entrepreneurship, economics and finance, research institutions, the government and the non-governmental sector as well as policy makers took part in an expert’s discussion entitled “Education. Innovation. Entrepreneurship” that was held on 23 March 2012 at JSC “Hipotēku banka”. In the context of this discussion by experts, some key issues related to innovation, education and aspects of state competitiveness were announced. The gathered experts agreed that there is no actual state policy on innovation in Latvia and that there is a seeming lack of understanding about the capabilities of creating an effective innovation system. The various factors discussed combine to have a most negative impact on education and entrepreneurship activities. In other words, any semblance of a coherent and targeted effort in the context of achieving sustainable public welfare and stable economy development is missing. The specific institutions necessary in the area of innovation policy creation, and for the creation of an effective innovation system and its development are missing.
JournalEconMngmnt-makets.indd 41 20.12.2012 14:12:16

42 SUPPORT ACTIVITIES FOR INNOVATION IN LATVIA: MYTH OR REALITY
Overall, the gathering of experts admitted that Latvia has exhausted itself of young employers. It was observed that in Latvia, scientists are only partially involved in entrepreneurial activities and therefore it is difficult for firms to increase the proportion of their intellectual capacity and to develop higher technologies. Finland, Denmark, Germany, Sweden are the acknowledged leaders of innovation in the EU (European Union, 2012). In Finland, only 36% of scientists are actually involved in the higher education sector and 56% are directly involved in entrepreneurial activities. By comparison, in Latvia, 72% of scientists are employed in the higher education sector and only 8.7% are involved in any entrepreneurial activities.
There is a negligible and insufficient state government financing available for scientific-research institutions with a resultant poor commercialisation of invention, a lack of motivation to build an adequate infrastructure for technological innovation creation and difficulties in the attraction of EU funds for the purpose of project development.
The experts were unanimous in their conclusion that those local representatives of the natural and engineering sciences have an insufficient practical knowledge (formalisation, protection, maintenance and selling) about patents and another forms of intellectual property rights.
In actual fact, deep mismatches were observed in the context of innovative entrepreneurship support with the obvious consequence that experimental and entrepreneurial development activities are being delayed. The business incubators do not support risky projects and did not provide financial support for repeated experimental attempts after some initial failures.
ConClUsIons, PRoPosals anD ReCoMMenDaTIons
1. The main source of future economic growth and sustainable development is dependent on an increase of innovation capacity. The creation and application of product innovation, process innovation, organisational and marketing innovation is a necessary stable basis for sustainable growth and development in the context of a modern socio-economic environment. State government policy actions in support of innovation are to be regarded as a vital tool for innovation creation, development and promotion.
2. Many documents that have been drafted out of concern for innovation policy have not achieved practical implementation. There is a systematic lack of support action and financial support for innovation development in Latvia.
3. There is a poor and insufficient state financing for scientific-research institutions. State expenditure on R&D is dramatically low. The development of innovative activities is seemingly beyond the public interest and is not a part of current state policy.
4. It is necessary to increase total government budget appropriations or outlays on R&D and expenditures on R&D as a percentage of the GDP in Latvia by
JournalEconMngmnt-makets.indd 42 20.12.2012 14:12:16

Ilona Dubra 43
up to 3% in order to reach the Lisbon Strategy data. At present there is no appropriate national innovation system in Latvia.
5. There are too few scientists involved in entrepreneurial activities in Latvia.6. Business incubators are only slightly motivated to support innovation.7. There is a lack of knowledge about patents and other forms of intellectual
property rights protection.
Recommendation to the Ministry of Economics of the Republic of Latvia: Work out/draft a “Latvian National Innovation System”; include it in all mid-term and long-term planning documents and implement it into practice.
Recommendation to the Government of the Republic of Latvia: Increase R&D expenditure as a percentage of the GDP in order to increase R&D intensity in the near future; increase total government budget appropriations or outlays on R&D.
Recommendation to the Ministry of Education and Science of the Republic of Latvia: Create educational support programmes for entrepreneurship starters and provide them with all necessary knowledge, skills and competences for practical entrepreneurship.
Proposal to entrepreneurs: Communicate pro-actively and take advantage of collaboration opportunities with universities and the academic community; Utilise the LU Innovation Centre option in order to extend knowledge about patent options, Intellectual Property Rights and other options with regard to the commercialisation of innovation.
IEGULDĪJUMS TAVĀ NĀKOTNĒ
This work has been supported by the European Social Fund within the project “Support for Doctoral Studies at the University of Latvia”.
bibliographyAkinboye, J. O., 2000. The Era of Creativity and Knowledge Innovation. Nigerian
Journal of Applied Psychology, vol. 6, No. 1, pp. 1-19.Axtell, C. M., Holman, D. J., Unsworth, K. L., Wall, T. D., Waterson, P. E. and Harrington, E.,
2000. Shopfloor Innovation: Facilitating the Suggestion and Implementation of Ideas. Journal of Occupational and Organizational Psychology, vol. 73, pp. 265-85.
Houghton Mifflin, Boston, MA, 2000. American Heritage Dictionary of the English Language [online] Houghton Mifflin, Boston, MA. Available at: <www.dictionary.com> [Accessed 2, April 2012].
JournalEconMngmnt-makets.indd 43 20.12.2012 14:12:16

44 SUPPORT ACTIVITIES FOR INNOVATION IN LATVIA: MYTH OR REALITY
Bernstein, B. and Singh, P. J., 2006. An Integrated Innovation Process Model Based on Practices of Australian Biotechnology Firms. Technovation, vol. 26, No. 45, pp. 561-72.
Dubra, I., 2011a. Innovation as a New Business Philosophy. Journal of Economics and Culture, vol. 3, pp. 103-116.
Dubra, I., 2011b. The Significance of Innovation Activities in the Challenging Socio-Economic Environment of Today. Journal Economics. Business Administration, vol. 766, pp. 48-63.
Eisenhardt, K. M. and Tabrizi, B. N., 1995. Accelerating Adaptive Processes: Product Innovation in the Global Computer Industry. Administrative Science Quarterly, vol. 40, No. 1, pp. 84-107.
Eurostat, European Commission, 2009. Science, Technology and Innovation in Europe. Luxembourg: Publications Office of the European Union.
Eurostat, European Commission, 2010. Science, Technology and Innovation in Europe. Luxembourg: Publications Office of the European Union.
Eurostat, European Commission, 2011. Science, Technology and Innovation in Europe. Luxembourg: Publications Office of the European Union.
European Union, 2012. Innovation Union Scoreboard 2011. Research and Innovation Union Scoreboard . European Commission Making Public Support for Innovation in the EU More Effective: Lessons Learned from a Public Consultation for Action at Community Level. Luxembourg: Publications Office of the European Union, 2009, P. 74, ISBN 978-92-79-12033-6.
Freeman, C., 1987. Technology Policy and Economic Performance: Lessons from Japan. Pinter, London.
Friedrich-Nishio, M., 2005. Impact of Behavioural Factors on Innovation Performance. An Evolutionary Simulation Mode. 32nd Conference of the European Association of Research in Industrial Economies Proceedings, vol. 5, pp. 89-108.
Gopalakrishnan, S., Damanpour, F., 1997. A Review of Innovation Research in Economics, Sociology and Technology Management. Omega, The International Journal of Management Science, vol. 25, No. 1, pp. 15-28.
Ministry of Economics of Republic of Latvia, 2011. Innovation Support Activities, EU Structural Funds for Innovation 2011 [online]. Ministry of Economics of Republic of Latvia. Available at: <http://www.em.gov.lv/em/2nd/ ?lng=lv&cat=30281> [Accessed 2 April 2012].
Schumpeter, J.,1934. Theorie der wirtschaftlichen Entwicklung: Eine Untersuchung über Unternehmergewinn, Kapital, Kredit, Zins und den Konjunkturzyklus. Duncher & Humbolt, Berlin, pp. 22-34.
Ten Bos, R., 2000. Fashion and Utopia in Management Thinking. John Benjamins, Philadelphia, PA.
Zhong, X., Yang, X., 2007. Science and Technology Policy Reform and its Impact on China’s National Innovation System. Technology in Society, vol. 29, issue. 3, pp. 317-325.
JournalEconMngmnt-makets.indd 44 20.12.2012 14:12:16
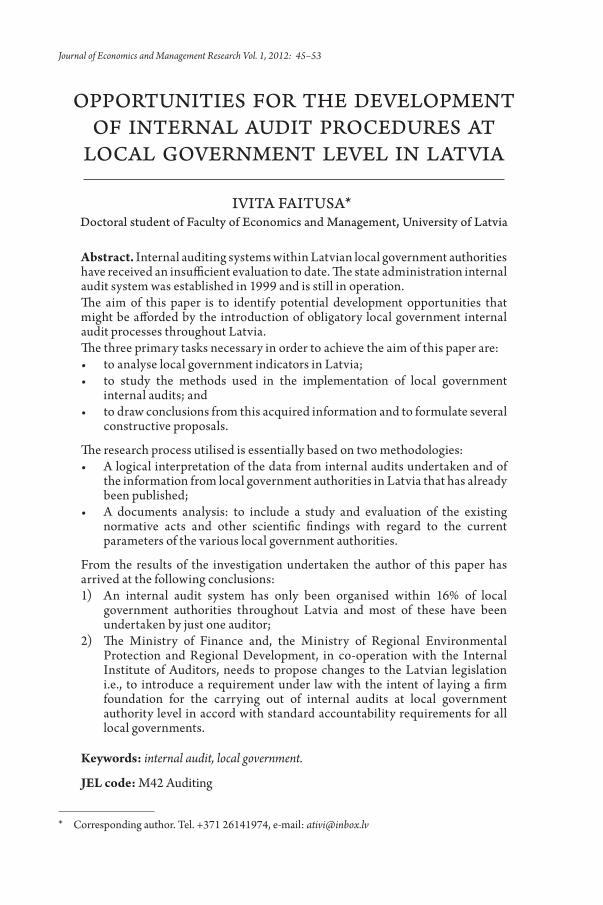
oPPoRTUnITIes foR THe DeVeloPMenT of InTeRnal aUDIT PRoCeDURes aT
loCal GoVeRnMenT leVel In laTVIa
IVITa faITUsa*1
Doctoral student of faculty of economics and Management, University of latvia
Abstract. Internal auditing systems within Latvian local government authorities have received an insufficient evaluation to date. The state administration internal audit system was established in 1999 and is still in operation. The aim of this paper is to identify potential development opportunities that might be afforded by the introduction of obligatory local government internal audit processes throughout Latvia.The three primary tasks necessary in order to achieve the aim of this paper are: • toanalyselocalgovernmentindicatorsinLatvia;• to study the methods used in the implementation of local government
internal audits; and• todrawconclusionsfromthisacquiredinformationandtoformulateseveral
constructive proposals.
The research process utilised is essentially based on two methodologies: • Alogicalinterpretationofthedatafrominternalauditsundertakenandof
the information from local government authorities in Latvia that has already been published;
• A documents analysis: to include a study and evaluation of the existingnormative acts and other scientific findings with regard to the current parameters of the various local government authorities.
From the results of the investigation undertaken the author of this paper has arrived at the following conclusions: 1) An internal audit system has only been organised within 16% of local
government authorities throughout Latvia and most of these have been undertaken by just one auditor;
2) The Ministry of Finance and, the Ministry of Regional Environmental Protection and Regional Development, in co-operation with the Internal Institute of Auditors, needs to propose changes to the Latvian legislation i.e., to introduce a requirement under law with the intent of laying a firm foundation for the carrying out of internal audits at local government authority level in accord with standard accountability requirements for all local governments.
Keywords: internal audit, local government.
JEL code: M42 Auditing
* Corresponding author. Tel. +371 26141974, e-mail: [email protected]
OPPORTUNITIES FOR THE DEVELOPMENT OF INTERNAL AUDIT PROCEDURES ..
IVITA FAITUSA
Journal of Economics and Management Research Vol. 1, 2012: 45–53
JournalEconMngmnt-makets.indd 45 20.12.2012 14:12:16

46 OPPORTUNITIES FOR THE DEVELOPMENT OF INTERNAL AUDIT PROCEDURES ..
InTRoDUCTIon
The process of internal audit is an independent, objective assurance and consulting activity that is designed to add value and to improve the operations of an organisation. The process helps an organisation to accomplish its objectives through the implementation of a systematic and disciplined approach to the evaluation and improvement of the effectiveness of its risk management, control, and governance processes (IIA, 2008).
Throughout the public sector in Latvia (ministries and government institutions), internal audit activities are prescribed by the legislation On Internal Audit, but this legislation does not apply to local government authorities. This is the primary reason why internal audit procedures have not been established as a standard practice in most local government authorities in Latvia.
Numerous scientific studies have been undertaken on the development and history of internal audits throughout the world: Sawyer L. B., Dunn J. (1996), Taylor D. H., Chambers A. D. (1997), Louwers T. J. et al. (2007), Linnas R. (2008), Ramos M. J. (2008), Sarens G. et al. (2010), Burnaby P. A., Hass S. (2011) and others. In Latvia, only two studies have been made on particular aspects of internal audit within the Latvian state administration and at local government authority level: Magone I. (2010) and Šulca R. (2010).
The aim of this particular investigation is to identify opportunities for the development of internal audit systems for local government authorities in Latvia.
The three necessary tasks in order to achieve this goal are: • toanalyseallavailablelocalgovernmentindicatorsinLatvia;• to scrutinise themethodology being implemented in local government
internal audits throughout Latvia; and• todrawconclusionsfromtheseobservationsandtoformulateproposals.This study utilises the following methodology: • Alogicalinterpretationismadeofotherpublisheddataonthesubjectof
internal audits and local government authorities in Latvia;• Thedocumentsanalysismethod –astudyandevaluationofthenormative
acts, scientific researches, and local government parameters is undertaken;• By observing the delimitations of research subjects, and theoretical
discussion: planning regions and local government authorities in Latvia, internal auditing in the European public sector and on internal audits within Latvian local government authorities.
The novelty in this approach is to be seen in an analysis of the situation with regard to the implementation of internal audit in Latvia’s planning regions and within local government authorities.
JournalEconMngmnt-makets.indd 46 20.12.2012 14:12:16

Ivita Faitusa 47
TeRRIToRIes of THe PlannInG ReGIons anD loCal GoVeRnMenT aUTHoRITIes In laTVIa
Following the administrative territorial reform of the existing 522 local government authorities in 2010 there now remain only 119 local government authorities within Latvia – nine cities and 110 municipalities.
The planning regions began their formation in Latvia during the second half of the 1990s, but since 2003 five more have been approved by the government: Rīga, Vidzeme, Kurzeme, Zemgale, and Latgale.
It was one of the tasks of the Ministry of Environmental Protection and Regional Development, in 2011, to draft a legal basis for establishing the regions. The smallest territorial units in Latvia and about which statistical information is duly summarised and analysed, according to the European Classification of Statistical Territorial Units, are the six statistical regions as follows: Rīga, Pierīga, Vidzeme, Kurzeme, Zemgale, and Latgale (Development of Regions in Latvia, State Regional Development Agency, Rīga, 2011).
Table 1Planning Regions and Local Government Authorities in Latvia
Planning Region Rīga Vidzeme Zemgale Latgale Kurzeme TotalNumber of local government authorities 30 26 22 21 20 119
Source: the author’s construction based on Development of Regions in Latvia, 2011
The majority of local government authorities are situated within the Rīga planning region, accounting for 25.2% of all local government authorities, and in the Vidzeme planning region, accounting 21.8% of the total. There are fewer local government authorities in the Zemgale (18.5%), Latgale (21%), and Kurzeme planning regions (20% of all local government authorities).
For the purposes of this study, all of the local government authorities have been placed within the five regions: Rīga, Vidzeme, Zemgale, Kurzeme, and Latgale.
InTeRnal aUDITInG anD eURoPean PUblIC InTeRnal aUDITs
The Common Body of Knowledge study, conducted by The Institute of Internal Auditors Research Foundation in 2006 (Sarens G. et al., 2011), established that the oldest known internal audit function was set up in 1641.
Although historians have traced the practise of internal audit to several centuries BC, many people associate the genesis of modern auditing with the establishment of the Institute of Internal Auditors in 1941. Both this institute and the profession of internal auditor have evolved dramatically since then (Reding Kurt F. et al., 2007).
JournalEconMngmnt-makets.indd 47 20.12.2012 14:12:16

48 OPPORTUNITIES FOR THE DEVELOPMENT OF INTERNAL AUDIT PROCEDURES ..
Scholars in the United States of America maintain that the importance of the internal auditing profession has grown dramatically over the last decade, mostly as a result of the escalation of fraud and capricious practices among financial managers. (Burnaby, Hass, 2011).
The Institute of Internal Auditors has developed the following definition (IIA definition, 2008):
Internal auditing is an independent, objective assurance and consulting activity designed to add value and improve an organisation’s operations. It helps an organisation to accomplish its objectives by bringing a systematic, disciplined approach in order to evaluate and improve the effectiveness of risk management, control, and governance processes.
According to data from the Compendium on public internal control systems within the member states of the EU in 2012, the vast majority of the 27 EU member states have an internal audit function in place. Three countries presently rely on other arrangements, but have plans to introduce internal audits within their public sector (Greece, Spain, and Italy). Most of the existing internal audit systems do not cover all parts of the public sector, or, they do not cover every part in the same way. Even the coverage of the various central governments varies from country to country.
For example, Lithuania plans to amend its existing legislation for a better elaboration of local government internal audits. In Estonia, work is continuing on the implementation of both internal control systems and on an internal audit function within local government authorities. In both of these countries there is a need, and an objective, to ensure that more coherent and comparable information is made available on the performance and accountability of the public sector. Efforts aimed at achieving cost efficiency within government also explain the variations in internal audit coverage.
In Romania, internal audit structures have been established within each public entity and undertake the same tasks, which range from issues of legality to audit of economy, efficiency, and effectiveness.
In Sweden, only those few agencies that manage complex or sensitive operations, possess large assets, transfer huge funds, or have a high cost base are required to set up internal audits.
Belgian regulations explicitly allow for internal audit activities to be carried out in three different ways:
• byapermanent,dedicatedauditservice;• byapermanent,sharedauditserviceforanumberofinstitutions;or• byanexternalservice.These methods are already possible, or will soon be possible, in other countries
as well, under certain conditions (e.g. Denmark, Estonia, the Netherlands, and Slovenia).
JournalEconMngmnt-makets.indd 48 20.12.2012 14:12:16

Ivita Faitusa 49
The Spanish contribution serves to illustrate the new complexities, which arise from a public audit and control point of view, whereby a centralised public sector becomes fundamentally re-organised and the demand for control and audit affects different types of organisations, which have different report ing requirements. One way forward which has been suggested in this contribution is with the implementation of a broader and more common application of the single audit concept, including techniques, procedures, and reporting arrangements, which would allow for a more cohesive action by all control/audit bodies.
A basic component of most internal audit functions today is the auditing of financial information and the regularity of financial management, which is aimed at assur ing the minister or the top managers of an entity as to how the internal control systems and procedures of that entity are functioning.
The extension of the scope of internal audit services is also reflected in the various and increasing types of audits which are regularly conducted by internal audit functions: compliance, inventory, financial, financial assurance, management, operational, systems, and IT audits.
Latvian state government auditors conduct audits based on the definitions prescribed in the Law on Internal Audit in the Republic of Latvia:
“An internal audit is the independent and objective activity of an internal auditor, which results in the provision of an opinion or a consultation by the auditor with the aim of improving the operation of the internal control system within the ministry and/or the institution” (Law on Internal Audit in the Republic of Latvia 2010).
In Latvia there are four types of audit:• Stateaudit –anauditoftheoperationswithinenterprisesandinstitutions
that are financed by state and/or local government authorities;• Tax audit – an audit on the procedures for the estimation of tax and
payments;• Certifiedauditingservices – theauditingofannual reports forbusiness
enterprises and local government authorities;• Internalauditsorinternalauditingservices.While the first two are undertaken in the interests of the government, this
is only partially true regarding the other two types of control. The services of certified auditors are not required for all enterprises, but are required for all local government authorities, while an internal review or audit is required for all state government departments (Bruna, 2010).
It is important to evaluate local government system operations and to make recommendations to managers for the improvement of internal control systems for the effective use of financial expenditure. An internal audit covers all activities of local government.
JournalEconMngmnt-makets.indd 49 20.12.2012 14:12:16

50 OPPORTUNITIES FOR THE DEVELOPMENT OF INTERNAL AUDIT PROCEDURES ..
InTeRnal aUDITs wITHIn laTVIan loCal GoVeRnMenT aUTHoRITIes
The Law On Local Government Authorities of the Republic of Latvia prescribes that local government authorities shall ensure the performance of financial audits in order:
1. to control the use of local government financial means in conformity with approved budgets and estimates;
2. to examine the lawfulness and appropriateness of the activities of heads and officials of local government institutions and capital companies;
3. to control whether local government financial means, movable and immovable property is managed in conformity with the decisions of the local government and in the interests of its residents.
Local government officers shall, not less than once a year, invite an auditing company or a sworn/registered auditor to perform a financial audit, to prepare an audit report and to submit an opinion with regard to the annual financial report, the payment for which shall be from funds provided for this purpose within the budget of the relevant local government.
The Ministry of Regional Environmental Protection and Regional Development is entitled to appoint specialists to perform an extraordinary financial audit for a local government (On Local Government Authorities, 1994).
The Law on Internal Audit in the Republic of Latvia is not applicable to local government authorities. Local government authorities shall determine their own system of internal audit and methodology for local government authorities and local government institutions (Internal Audit Law, 2010).
The author of this paper undertook a study on the existence of internal audit processes within local government authorities in Latvia. Information was gathered (mostly available from internet sources such as the websites of local government authorities and through telephone interviews) with regard to all 119 local government internal audit units or internal auditor staff units. The findings are presented in Figure 1 and Figure 2 – only eighteen local government authorities (15%) out of the total of 119 had performed internal audits.
There are several issues/questions that require further investigation: 1) Do local government indicators (incomes, population, and area) have an
impact on the establishing/creation of an internal audit unit?2) Do local government indicators have an impact on the size of internal
audit units? 3) Since it is necessary, in accord with Internal Audit Standards, to compare
all of the organisational structures of local government with an internal audit unit in order to clarify whether a dependency in administrative structure has developed – is the internal audit unit independent of other local government units?
JournalEconMngmnt-makets.indd 50 20.12.2012 14:12:16

Ivita Faitusa 51
30 26 22 21 20
54
3 3 3
Riga Vidzeme Zemgale Latgale Kurzeme
Local governments with Internal auditNumber of local governments in region
Source: author’s construction after research
Fig. 1. Local Government Authorities with Internal Audit Processes at the Beginning of 2012
The author of this study discovered, for example, that while there was an internal auditor’s staff unit within the Ventspils local government, at the beginning of 2012 there was nobody employed in this capacity. In the Salaspils local government there is an internal auditor and quality management specialist – this is a part-time-job specialist. The Olaine local government has an internal control administrator but no internal auditor.
0
1
2
3
4
5
6
7
Ces
u n
ovad
sD
auga
vpils
Valk
asno
vads
Ieca
vas
nov
ads
Jelg
ava
Jeka
bpils
Kra
slava
s n
ovad
sM
adon
as n
ovad
sR
ezek
ne
Rig
aSa
lasp
ils n
ovad
s*Ta
lsu n
ovad
sVa
lmie
raA
dazu
nov
ads
Liep
aja
Jurm
ala
Vent
spils
*Tu
kum
a n
ovad
s
Source: author’s construction after research
Fig. 2. Number of Internal Auditors in Local Government Authorities in 2011
JournalEconMngmnt-makets.indd 51 20.12.2012 14:12:17

52 OPPORTUNITIES FOR THE DEVELOPMENT OF INTERNAL AUDIT PROCEDURES ..
In Figure 2 (above) we can clearly see which local government authorities have formed internal audit units. We can also see the number of auditors in each audit unit. From this author’s point of view, there is an important negative factor present in most internal audit units and that is that they contain only one auditor – these auditors cannot provide the “under four-eyes principle”.
For future investigation into this topic it will be necessary to determine the methodology and standards used by these internal audit units, especially in those thirteen local government authorities where only one auditor is employed. It will also be important to establish a local government authority internal audit co-ordinating institution. It is quite an important requirement that a unified/common internal audit methodology is established for all local government authorities for the better gathering of comparative information on audit results from within Latvian local government authorities.
obseRVaTIons, ConClUsIons anD PRoPosals
1. Only 15% of local government authorities in Latvia perform internal audits. Eighteen local government authorities out of a total of 119 contain internal audit divisions, and most local government authorities have only one auditor.
2. The Ministry of Finance and, the Ministry of Regional Environmental Protection and Regional Development, in co-operation with the Internal Institute of Auditors, needs to propose changes to the Latvian legislation – changes that will serve to prescribe requirements in the legislative acts on the foundation of internal audit processes in local government areas according to the indicators on each individual local government levels of income, expenses, population, and size for the improving of internal control systems. It is important to form a local government authority internal audit co-ordinating body.
3. The following are some questions/issues for future investigation: • Dolocalgovernmentindicators(incomes,population,andarea)havean
impact on the establishment of an internal audit unit? • Dolocalgovernmentindicatorshaveanimpactonthesizeoftheirinternal
audit unit?• It will be necessary to compare (in accord with the Internal Audit
Standards) all of the organisational structures within local government authorities with size of internal audit units in order to clarify whether a dependency in the administrative structure has developed.
4. It will be necessary to determine which methodology and standards of internal audit will be used for auditing systems within local government authorities.
5. It will be necessary to prescribe a common internal audit methodology for all local government authorities for ease of access to comparative information about audit results in all Latvian local government authorities.
JournalEconMngmnt-makets.indd 52 20.12.2012 14:12:17

Ivita Faitusa 53
bibliographyAnalysis of Finance Indicators for Local Government Authorities [online]. Republic of
Latvia, Ministry of Finance. Available at: <http://fm.gov.lv/?lat/pasvaldibam/pasvaldibu_finansu_raditaju_analize> [Accessed: 3 January 2012].
Bruna, I., 2010. Enterprise Internal Audit and Control. Rīga, University of Latvia, p. 166.Burnaby, A. P., Hass, S., 2011. Internal Auditing in the Americas. Managerial Auditing
Journal, vol. 26, No. 8, pp. 734-756.Compendium of the Public Internal Control Systems in the EU Member States 2012
[online]. Luxembourg: Publications Office of the European Union, 2011. Available at: <http://ec.europa.eu/budget/library/biblio/publications/2011/compendium_27_countries_en.pdf> [Accessed: 14 February 2012].
Development of Regions in Latvia, 2011. State Regional Development Agency, Riga, p.171.
Internal Audit Definition, 2008 [online]. The Institute of Internal Auditors. Available at: <http://iai.lv/lv/standarti> [Accessed: 20 January 2012].
The Law on Internal Audit, 2 March 2010 [online]. Available at: <http://www.likumi.lv/doc.php?id=205906&from=off> [Accessed: 19 January 2012].
The Law on Local Government Authorities, 19 May 1994 [online]. Available at: <http://www.likumi.lv/doc.php?id=57255> [Accessed: 19 January 2012].
Reding, Kurt F. et al., 2007. Internal Auditing Assurance & Consulting Services, IIARF, Altamonte Springs.
Sarens, G. et al., 2011. Are Internal Auditing Practices Related to the Age of the Internal Audit Function? Managerial Auditing Journal, vol. 26, No.1, pp. 51-64.
Sulca, R., 2010. Internal Audit in Local Government Authorities in the Republic of Latvia. In: New Socio-Economic Challenges of Development in Europe: Conference Proceedings. Riga, University of Latvia, pp. 300-303.
JournalEconMngmnt-makets.indd 53 20.12.2012 14:12:17

sTaTIsTICal asPeCTs of ColleCTInG InnoVaTIon DaTa
sVeTlana JesIļeVska*1 faculty of economics and Management, University of latvia
Abstract. Innovative entrepreneurship is becoming the cornerstone of economic growth in the developed world that encourages enterprises to actively implement new scientific and technological achievements. The detailing of Statistics on innovation is extremely important as it is a tool for the explanation of economic growth rate.The concept of innovation is interpreted differently among statisticians, econom-ists and entrepreneurs and this often causes inaccuracy in innovation accounting.The reasons for difficulty in the producing of accurate innovation statistics are to do not only with failures in the interpretation of the concept of innovation, but also with the complexity and dynamism of the innovation process. The following tasks should be undertaken in order to develop the quality of innovation statistics: to clarify meaning of the term ‘innovation’; to refresh the importance of understanding the significance of the innovation process; to promote the use of a methodology for creating statistics on innovation and on the interpretation of statistical information as an integral part in the planning process of innovation policy.This paper proposes to discuss guidelines on the collection and interpretation of data on innovations and to analyse statistical innovation indicators.The theoretical and methodological evidence utilised in this study is based on the analysis of the economics literature and scientific papers published by Latvian and foreign scientists, conference and seminar papers, Latvian legal documents, the statistics database of Eurostat and of the Central Statistical Bureau of Latvia, Eurostat and other international statistical and methodological materials. A review of the bibliography, as well as methods of statistical analysis such as grouping, processing and comparative analysis has mainly been used in this paper.
Key words: innovation statistics, innovation survey, knowledge economy.
JEL code: C00, C13, O31
InTRoDUCTIon
In the present conditions of international crisis, innovations are the basis for competitiveness among economically active countries. The term ‘knowledge economy’ is a new paradigm, which characterises the tendency of economically developed countries to rely more on knowledge, creativity and access to
* Corresponding author. E-mail: [email protected]
STATISTICAL ASPECTS OF COLLECTING INNOVATION DATA
SVETLANA JESIļEVSka
Journal of Economics and Management Research Vol. 1, 2012: 54–66
JournalEconMngmnt-makets.indd 54 20.12.2012 14:12:17

Svetlana Jesiļevska 55
information and individual intellectual potential. The ability to create and sell competitive goods and services on the global markets is a factor that has had a notable influence on the growth prospects of the Latvian economy and serves to increase social welfare. Like many countries of the world, which today are working towards a better future, a significant part of the Latvian government’s mission is to create the knowledge-based economy.
The Latvian National Development Plan 2014–2020 clearly states that “Establishing knowledge as the key resource for the country’s development means that people, as the creators and disseminators of knowledge, become the main driving force and the beneficiaries of this development. In such a growth model, knowledge determines the quality of the labour force, the use of capital and the development of technologies” (Nacionālā attīstības plāna 2014.–2020. gadam prioritāšu pamatojuma ziņojums – The Report on National Development Plan 2014–2020). The support and development of innovation performance is one of the priority tasks for the government of Latvia, in turn, the Central Statistical Bureau (CSB) aims to provide data users with timely, exact, complete, comprehensible, and internationally comparable statistical information on innovations. This is essential for the development of an effective economic policy to promote knowledge-based entrepreneurship.
1. MeTHoDoloGy on THe CReaTIon of InnoVaTIon sTaTIsTICs
To enjoy the possibility of comparing data on innovations with other countries there is a need for the harmonisation of concepts, definitions, methodological guidelines – all of which are provided by Eurostat.
An innovation survey is being carried out in Latvia in compliance with Commission Regulation (EC) No 1450/2004 of 13 August 2004, the purpose of which is the implementation of Decision No 1608/2003/EC of the European Parliament and Council on the development and completion of innovation statistics on the Community. This Regulation prescribes the necessary guidelines for the implementation of Decision No 1608/2003/EC with regard to Community innovation statistics. The list of statistical variables, the activities and sectors covered, the breakdowns of the results, the frequency, the deadlines for data transmission and other characteristics are all to be found in the Annex to this Regulation.
According to this Commission Regulation, the Community innovation statistics listed in the Annex shall be based on harmonised concepts and definitions, as contained in the most recent version of the Oslo Manual. The Oslo Manual, developed jointly by Eurostat and the OECD, is devoted to the measurement and interpretation of data relating to science, technology and innovation. The CSB of Latvia collects information on innovations in compliance with the methodology of the Oslo Manual.
JournalEconMngmnt-makets.indd 55 20.12.2012 14:12:17

56 STATISTICAL ASPECTS OF COLLECTING INNOVATION DATA
According to the Commission’s Regulation, “In close co-operation with member states, methodological recommendations for the Community Innovation Surveys shall be drawn up by the Commission (Eurostat) leading to a high level of harmonisation of the survey results. These recommendations shall, at least, cover the target population, the survey methodology (including regional aspects), the harmonised survey questionnaire, the collection, processing and transmission of the data and data quality requirements” (Commission Regulation (EC) No. 1450/2004 of 13 August 2004).
An Innovation Survey is carried out in accordance with the Community Innovation Survey (CIS). The Oslo Manual provides the methodological basis for the CIS. The CIS is a survey conducted by EU member states to monitor Europe’s progress on innovation. The general aim of the CIS is to collect innovation data in order to provide a better understanding of innovation and how it relates to economic growth. The most recent observation period covered by the survey is 2008–2010, the reference year being 2011.
Eurostat priorities serve as a reduction of the response burden by using more the administrative data sources, simplification of legislation, consistency and comparability of statistical data. For these purposes Eurostat is able to provide the Integrated Regulation for Innovation and R&D statistics. Eurostat has already presented the second draft version of an integrated legislation, which combines the revised implementing measures set up in Commission Regulation No 753/2004 on statistics on science and technology and in Commission Regulation No 1450/2004 on innovation statistics. This regulation shall cover the following domains:
a) statistics on research and development;b) statistics on government budget appropriations or outlays on research and
development (GBAORD);c) innovation statistics;d) statistics on Human resources in science and technology, including gender
and mobility statistics (HRST), statistics on patents, statistics on high-technology industries and knowledge-based services and other statistics on science and technology.
It is expected that the new Regulation will be adopted in Autumn 2012.
2. DefInInG InnoVaTIon
In the field of economic theory several studies have been conducted in order to develop the concept and definition of the term ‘innovation’ and to evaluate the coherence between the various indicators characterising innovation in the performance of enterprises (e.g., the following researchers Brouwer & Kleinknecht (Brouwer, E., Kleinknecht, A., 1996), Jacobsson et al. (Jacobsson, S., Oskarsson, C., Phillipson, J., 1996), Eric A. Von Hippel, Jeroen De Jong, Steven Flowers (Eric A. Von Hippel, Jeroen De Jong, Steven Flowers, 2010), Masso,
JournalEconMngmnt-makets.indd 56 20.12.2012 14:12:17
Svetlana Jesiļevska 57
Roolaht, Varblane (Masso, J., Roolaht, T., Varblane, U., 2010), Paas & Poltimal (Paas, T., Poltimal, H.), Shah &Tripsas (Shah, S.K., Tripsas, M., 2012) etc.).
The term ‘innovation’ is defined and interpreted in different ways (Drošas, inovatīvas un pieejamas zāles – jauns redzējums farmācijas nozarē – Secure, innovative and accessible medications – a new vision in pharmaceuticals, 2008):
• By improvement of products or services, and expansion of the marketshare;
• A new way of thinking about how to successfully commercialise newtechnologies for the development of business activity;
• Byraisingthequalityofbusinessmanagementandlabourforceskills;• Throughtheimplementationofnewmethodsofproduction,distribution
and delivery.The Oslo Manual definition states that: ‘An innovation is the implementation of
a new or significantly improved product (good or service), or process, a new marketing method, or a new organisational method in business practices, workplace organisation or external relations’ (Oslo Manual, 2005).
The following definition is used in the Law on Scientific Activity: ‘Innovation – the implementation in a product or service of new ideas, developments and technologies of a scientific, technical, social, or in the cultural or other fields’ (The Law on Scientific Activity).
The main difference between the two definitions is that in the Law of Scientific Activity the following types of innovations are distinguished: product innovation and process innovation, whilst in the Oslo Manual four types of innovations are distinguished: product innovations, process innovations, marketing innovations and organisational innovations.
A product innovation is the introduction of a good or service that is new or significantly improved with respect to its characteristics or intended uses. This includes significant improvements in technical specifications, components and materials, incorporated software, user friendliness or other functional characteristics (Oslo Manual, 2005).
A process innovation is the implementation of a new or significantly improved production or delivery method. This includes significant changes in techniques, equipment and/or software (Oslo Manual, 2005).
A marketing innovation is the implementation of a new marketing method involving significant changes in product design or packaging, product placement, product promotion or pricing (Oslo Manual, 2005).
An organisational innovation is the implementation of a new organisational method in the firm’s business practices, workplace organisation or external relations (Oslo Manual, 2005).
The CSB in Latvia collects statistical data on innovation activities according to the definition of innovation proposed in the Oslo Manual. In order to
JournalEconMngmnt-makets.indd 57 20.12.2012 14:12:17

58 STATISTICAL ASPECTS OF COLLECTING INNOVATION DATA
successfully carry out an innovation survey, both statisticians and respondents should be able to distinguish the four different types of innovations: product innovations, process innovations, marketing innovations and organisational innovations. To achieve this, it would be necessary to hold informative seminars for all innovation participants (the Ministry of Economics of the Republic of Latvia, the Ministry of Education and Science of the Republic of Latvia, the Investment and Development Agency of Latvia, the Central Statistical Bureau, employers, municipalities, practicing scientists, the Latvian Academy of Sciences, etc.), with the aim of achieving a common understanding and a harmonisation of the innovation process; to explain the differences between the four types of innovations and to actualise the need for an improvement in the quality of innovation statistics. A common understanding of the innovation process, an extensive and comprehensible explanation of the types of innovations will help to collect more accurate, reliable and comparable data on innovations. This data is an integral part in the planning process of innovation policy.
3. laTVIa In eURoPe
So as to revive economic growth and to generate new jobs, EU member states should focus on innovative activities. Among EU member states the highest propensity to innovate in 2008 (see Figure 1) was recorded in Germany (79.9% of all enterprises), followed by Luxembourg (64.7%) – these were the only member states where more than 60% of enterprises were innovative – the EU-27 average (excluding Greece) was 51.6%. The lowest propensities to innovate were recorded in Latvia (24.3%), Poland (27.9%) and in Hungary (28.9%) – the only member states in which the proportion of innovative enterprises was below 30%.
0
25
50
75
100
EU-2
7G
erm
any
Luxe
mbo
urg
Belg
ium
Port
ugal
Irel
and
Esto
nia
Aus
tria
Cyp
rus
Cze
ch R
epub
licSw
eden
Ital
yFi
nlan
dD
enm
ark
Slov
enia
Fran
ceU
nite
d K
ingd
omN
ethe
rland
sSp
ain
Mal
taSl
ovak
iaR
oman
iaBu
lgar
iaLi
thua
nia
Hun
gary
Pola
ndLa
tvia
Icel
and
Nor
way
Cro
atia
Source: based on Statistics Explained data (an official Eurostat website) Fig. 1. Proportion of Innovative Enterprises, 2008 (% of all Enterprises).
JournalEconMngmnt-makets.indd 58 20.12.2012 14:12:17

Svetlana Jesiļevska 59
The Innovation Union is one of seven flagship initiatives within Europe 2020 strategy for a sustainable and inclusive economy. Reforms of national innovation systems should be made by governments to foster co-operation between entrepreneurs and universities, to adapt national funding procedures to improve cross-border co-operation and to embrace joint programming and provide a sufficient supply of science and engineering graduates (A European strategy for smart, sustainable and inclusive growth).
The European Innovation Scoreboard (EIS), is a tool that is meant to help monitor the implementation of the Europe 2020 Innovation Union flagship by providing a comparative assessment of the innovation performance of the EU27 member states and the relative strengths and weaknesses of their research and innovation systems. The Innovation Union Scoreboard 2011 draws on 25 research and innovation-related indicators and covers the 27 EU member states, as well as Croatia, Serbia, Turkey, Iceland, the Former Yugoslav Republic of Macedonia, Norway and Switzerland. The indicators are grouped into three main categories (Innovation Union Scoreboard 2011):
• “Enablers”, i.e. the basic building blocks which allow innovation to take place (Human resources, finance and support, open, excellent and attractive research systems);
• “Firmactivities”which show how innovative European firms are (firm investments, linkages & entrepreneurship, intellectual assets); and
• “Outputs” which show how this translates into benefits for the economy as a whole (innovators, economic effects).
The Innovation Union Scoreboard 2011 places member states into the following four country groups (New Innovation Union Scoreboard):
• Innovationleaders: Denmark, Finland, Germany and Sweden all show a performance well above that of the EU27 average.
• Innovation followers: Austria, Belgium, Cyprus, Estonia, France, Ireland, Luxembourg, the Netherlands, Slovenia and the UK all show a performance close to that of the EU27 average.
• Moderate innovators: The performance of Croatia, Czech Republic, Greece, Hungary, Italy, Malta, Poland, Portugal, Slovakia and Spain is below that of the EU27 average.
• Modestinnovators: The performance of Bulgaria, Latvia, Lithuania and Romania is well below that of the EU27 average.
Latvia is one of the modest innovators with a below average performance. High growth has been observed for Community trademarks and Community designs. A strong decline has been observed for Innovative SMEs (small and medium enterprises) collaborating with others and License and Patent revenues from abroad. Growth performance in Human resources, Open, excellent and attractive research systems and Intellectual assets is well above average (Innovation Union Scoreboard 2011).
JournalEconMngmnt-makets.indd 59 20.12.2012 14:12:18

60 STATISTICAL ASPECTS OF COLLECTING INNOVATION DATA
Figure 2 (below) shows the proportion of innovative enterprises in the Baltic states that introduced new products to the market or own-developed process innovations in 2008 (% of enterprises within size class or total). Large enterprises (those with 250 or more employees) in Estonia, Latvia and Lithuania were more likely to have brought product innovations to the market in 2008 than either small (10 to 49 employees) or medium-sized enterprises (50 to 249 employees); this pattern held also for process innovations developed by the enterprise or group. Lithuania was the only member state in which the proportion of small enterprises with process innovations was above the overall proportion for all enterprises. In Estonia, Latvia and Lithuania more innovative enterprises were involved in process innovations rather than product innovations. In Estonia and Lithuania the proportion of innovative enterprises was higher than in Latvia.
0
10
20
30
40
50
60
Tota
l
With
10 to
49
empl
oyee
sW
ith50
to 2
49em
ploy
ees
With
> 25
0em
ploy
ees
Tota
l
With
10 to
49
empl
oyee
sW
ith50
to 2
49em
ploy
ees
With
> 25
0em
ploy
ees
Process innovations:developed by the enterprise
or group
Product innovations:new to market
EstoniaLatviaLithuania
Source: author’s construction based on Statistics Explained data (an official Eurostat website)Fig. 2. Proportion of innovative enterprises in the Baltic states, which introduced
products new to the market or own-developed process innovations, 2008 (% of enterprises within size class or total)
This could be explained by the fact that gross domestic expenditure as a percentage of the GDP (see Figure 3) on Research and Development (R&D) in Estonia and Lithuania is much higher than in Latvia, although it is below the EU-27 average. The EU-27 average gross domestic expenditure for R&D in 2010 is about 2% of GDP, in Estonia – 1.62% of GDP, in Lithuania – 0.79% of GDP, but in Latvia only 0.60% of GDP.
JournalEconMngmnt-makets.indd 60 20.12.2012 14:12:18

Svetlana Jesiļevska 61
0
0.5
1
1.5
2
2.5
2000 2001 2002 2003 2004 2005 2006 2007 2008 2009 2010
EU-27
Estonia
Lithuania
Latvia
Source: author’s construction based on Statistics Explained data (an official Eurostat website)Fig. 3. Gross Domestic Expenditure on R&D, 2000-2010 (% share of GDP)
4. THe InnoVaTIon sURVey anD InnoVaTIon sTaTIsTICal InDICaToRs
According to the Oslo Manual (Par. 231), and taking into account how innovation activities are usually organised, the enterprise is, in general, the most appropriate statistical unit for compilation (and collection) of innovation data. Eurostat defines an enterprise as ‘the smallest combination of legal units that is an organisational unit producing goods or services, which benefits from a certain degree of autonomy in decision-making, especially for the allocation of its current resources. An enterprise carries out one or more activities at one or more locations’ (Council Regulation (EEC) No 696/93 of 15 March 1993).
The sampling frame for an innovation survey includes the industrial and service enterprises. Innovation activities are carried out in small, medium and large enterprises; that is why the enterprises in the sampling frame are stratified by the number of employed persons i.e., enterprises are distributed into three size-classes: large (with 250 and more employees), medium (50–249 employed persons) and small (10–49 employed persons) enterprises.
According to Article 3 of Commission Regulation (EC) No 1450/2004 “Member states shall acquire the necessary data using a combination of different sources such as sample surveys, administrative data sources or other data sources. The other data sources shall be at least equivalent in terms of quality or statistical estimation procedures to sample surveys or administrative data sources.” (Commission Regulation (EC) No 1450/2004) In creating a sampling frame for an innovation survey, the CSB uses Business Register data, Register of Scientific Institutes data, information from the Investment and Development Agency of Latvia on major projects of the 2007-2013 planning period in providing support
JournalEconMngmnt-makets.indd 61 20.12.2012 14:12:18

62 STATISTICAL ASPECTS OF COLLECTING INNOVATION DATA
for the introduction of new products and technologies in manufacturing. The target population of the innovation survey is economically active statistical units – merchants (individual merchants and commercial companies) carrying out economic activities in the following branches: NACE Rev. 2 Sections B, C, D, E, H, K and NACE Rev.2 Divisions 46, 58, 61, 62, 63 and 71.
Since 2002 the CSB has been participating in an innovation survey that is conducted every two years with the aim of collecting innovation data for the reference period of the previous three years. Every new CIS survey is quite different from the previous one. During the last innovation survey with the reference period 2011 (the period covered by the survey was 2008-2010), the Survey questionnaire ‘An Overview on Research and Innovation Performance in the Business Sector in 2010’ (2-Research and Innovation) was utilised.
The survey questionnaire 2-Research and Innovation consists of two sections. Section A is dedicated to the collecting of information on new or significantly improved products (goods or services) or processes, on the related activities in manufacturing and service sectors, on organisational and marketing innovations, as well as on staff creativity and skills. Section B questions are related to R&D data: expenditure on R&D, R&D personnel, sources of funds etc. Section A ‘Innovation’ consists of the following question blocks (Business Surveys, Website of Central Statistical Bureau of Latvia):
A.1. General information about the enterpriseA.2. Product (goods or services) innovationA.3. Process innovationA.4. Ongoing or abandoned innovation activities for process and product
innovationsA.5. Innovation activities and expenditures for process and product
innovationsA.6. Sources of information and co-operation for product and process
innovation A.7. Objectives for product and process innovations during 2008 to 2010A.8. Factors hampering product and process innovation activitiesA.9. Organisational innovationA.10. Marketing innovationA.11. Creativity and skillsThe survey questionnaire contains specific questions about the innovation
process; therefore, the questionnaire should be designed so that different persons in the firm could reply to different questions, e.g. questions relating to the firm’s economic data should be provided by the finance division, specific questions about the innovative technologies might thus be completed by the product manager. It would be more useful to undertake interviews in person (instead of surveys by e-mail or by post) and these should be conducted by trained
JournalEconMngmnt-makets.indd 62 20.12.2012 14:12:18

Svetlana Jesiļevska 63
staff, since this would provide a more positive impact on the response rate and on the quality of the results obtained. During a live interview, qualified staff provide the respondents with immediate and relevant assistance in completing the questionnaire, thereby improving the quality of the results. Moreover, a direct contact with the respondent helps to identify weaknesses of the survey questionnaire, which should then be corrected. To improve the degree of co-operation between statisticians and respondents and to motivate enterprises to provide correct and accurate data, booklets with the main indicators on innovation statistics from the previous survey should be disseminated to respondents who are filling in the survey questionnaire, together with an expression of appreciation for their active collaboration. Such information could be most interesting for them. The CSB is planning to expand the range of its statistical information on innovations available on the CSB portal, so innovation statistics in the future mostly should be available at the CSB website.
Survey questionnaire forms (the period covered by the survey 2006–2008) were sent to 1077 enterprises. The information was extrapolated on 5.8 thousand enterprises. The response rate comprised 89.1% (Research and Development and Innovation Statistics, 2010). Innovation survey results are published by the CSB in the Statistical Data Collection ‘Research and Development and Innovation Statistics’, as well as in the CSB and Eurostat Statistics Databases that contain data on innovation statistics.
In Latvia 16.9% of all small enterprises are regarded as being innovative, 63.0% of all large enterprises are also thus considered as innovative (Research and Development and Innovation Statistics, 2010). Large enterprises (with 250 and more employees) are more likely to have the financial and material resources; they have a broader ability to attract qualified scientists and researchers and to receive additional financing for innovation projects from European Union funds. Large companies tend to innovate more actively than small and medium-sized enterprises. Small innovative enterprises can successfully solve specific innovation tasks. In Latvia, the structure of innovative enterprises by size group shows that more innovations are introduced in large and medium-sized enterprises.
Only 11.7% of innovative enterprises that developed technological innovations during the period 2006 to 2008 received financial support for innovation activities from European Union funds and only 1.8% received financial support for innovation activities from the government sector (Research and Development and Innovation Statistics, 2010). This data provides indirect evidence that innovation activities in Latvia are mostly financed by the enterprise’s own funds. Small innovative enterprises should be encouraged by the implementation of special financial support policies in Latvia.
As shown in Table 1, intramural R&D expenditure decreased sharply in 2009 under the influence of the global economic crisis but increased significantly in 2010, mainly due to the increase of financing from abroad. This is a positive trend.
JournalEconMngmnt-makets.indd 63 20.12.2012 14:12:18

64 STATISTICAL ASPECTS OF COLLECTING INNOVATION DATA
Research and innovation have thus been placed at the centre of the Europe 2020 strategy to promote smart, sustainable and inclusive growth. This includes the headline objective of increasing spending on R&D to 3% of the GDP by 2020, 1% of which must be from government funding. To ensure these conditions and to stimulate innovation activity, Latvia should make a revision of its structural funds and provide more state aid to innovative enterprises.
Table 1 Intramural R&D Expenditure in Latvia by Source of Funds as per cent of GDP
2005 2006 2007 2008 2009 2010*Total 0.56 0.70 0.63 0.61 0.46 0.60Business enterprise sector 0.19 0.37 0.23 0.17 0.17 0.23Government sector 0.26 0.27 0.35 0.29 0.21 0.16Higher education sector 0.01 0.01 0.00 0.01 0.01 0.01Abroad 0.10 0.05 0.05 0.14 0.07 0.20
* Author’s calculations
Source: Research and Development and Innovation Statistics, Statistical Data Collection, 2010, p.32.
ConClUsIons anD ReCoMMenDaTIons
• Only one fifth of enterprises in Latvia are involved in innovation activities. Latvian entrepreneurs lack information about possible collaboration with researchers for the development of innovative products. A large proportion of scientists are engaged in basic research, which is more conducive to their academic career, but not for the implementation of new innovative products or services. In Latvia, for the development of a successful innovation support policy it is necessary to increase co-operation between scientists and entrepreneurs.
• Innovative activities in Latvia are dominated by large companies, whereas the small innovative enterprises should be encouraged by the implementation of special financial support policies.
• Itisnecessarytomoderniseoureducationsystem,toinvestintheeducationsector and to support the education of enterprising people who are able to think economically, to make effective decisions and who are able to start up an innovative entrepreneurship.
• LatviangovernmentsectorfundingforResearchandDevelopmentisfarbelowthe average level of other EU member states, therefore, a special financial support policy should be developed.
• Innovationsurveyresultsshouldbedisseminatedwidely,inordertoencourageenterprises to participate in future surveys and to promote researcher and innovation policy-maker awareness and to encourage the use of statistical data on innovations.
JournalEconMngmnt-makets.indd 64 20.12.2012 14:12:18

Svetlana Jesiļevska 65
• A publicly available database of innovative enterprises will promote co-operation between enterprises and research institutions and increase public awareness about the progress of innovation in the country.
• TheCSBcollectsstatisticaldataoninnovationactivitybutitappearswithatime lag, e.g., in 2011 the data was collected for the observation period 2008-2010. During the time period when a CIS survey is not conducted, it would be necessary to carry out smaller sample surveys with a smaller number of innovative companies so as to survey innovative performance characterising indicators (determining the basic indicators of innovative activity which are essential for development of the innovation support policy) to obtain operational data.
bibliographyBrouwer, E. & Kleinknecht, A., 1996. Determinants of Innovation Output. A Micro-
econometric Analysis of Three Innovation Output Indicators. In: Kleinknecht, A. (Ed.) Determinants of Innovation. The Message from New Indicators. Macmillan, London, pp. 99-124.
Business Surveys [online] Website of Central Statistical Bureau of Latvia. Available at: <http://www.csb.gov.lv/veidlapas/2011> [Accessed 16 February 2012].
Commission Regulation (EC) No 1450/2004 of 13 August 2004 implementing Decision No 1608/2003/EC of the European Parliament and of the Council concerning the production and development of Community statistics on innovation. [online] Official Journal of the European Union. Available at: <http://eur-lex.europa.eu/LexUriServ/LexUriServ.do?uri=OJ:L:2004:267:0032:0035:EN:PDF> [Accessed 11 February 2012].
Council Regulation (EEC) No 696/93 of 15 March 1993 on the statistical units for the observation and analysis of the production system in the Community [online]. Official Journal of the European Union. Available at: <http://eurlex.europa.eu/LexUriServ/LexUriServ.do?uri=CELEX:31993R0696:EN:HTML> [Accessed 19 February 2012].
Drošas, inovatīvas un pieejamas zāles – jauns redzējums farmācijas nozarē, 2008 [online]. Eiropas Kopienu komisijas paziņojums Eiropas Parlamentam, Padomei, Eiropas Ekonomikas un sociālo lietu komitejai un reģionu komitejai, Brisele. Available at: <http://eur-lex.europa.eu/LexUriServ/LexUriServ.do?uri=OJ:C:2009:318:FULL:LV:PDF> [Accessed 11 February 2012].
European strategy for smart, sustainable and inclusive growth [online]. Europe 2020. Available at: <http://ec.europa.eu/eu2020/pdf/COMPLET EN BARROSO 007 - Europe 2020 - EN version.pdf> [Accessed 15 February 2012].
Eric A. Von Hippel, Jeroen De Jong & Steven Flowers, 2010. Comparing Business and Household Sector Innovation in Consumer Products: Findings from a Representative Study in the UK [online]. Social Science Electronic Publishing, Inc. Available at: <http://papers.ssrn.com/sol3/papers.cfm?abstract_id=1683503> [Accessed 12 February 2012].
Innovation Union Scoreboard 2011. The Innovation Union’s performance scoreboard for Research and Innovation [online]. Pro Inno Europe portal. Available at: <http://www.proinno-europe.eu/inno-metrics/page/innovation-union-scoreboard-2011> [Accessed 16 February 2012].
JournalEconMngmnt-makets.indd 65 20.12.2012 14:12:18

66 STATISTICAL ASPECTS OF COLLECTING INNOVATION DATA
Jacobsson, S., Oskarsson, C. & Phillipson, J., 1996. Indicators of Technological Activities – Comparing Educational, Patent and R&D Statistics in the Case of Sweden. Research Policy 25, pp. 573-585.
Jankovskis, J. et al., 2012. Nacionālā attīstības plāna 2014.–2020. gadam prioritāšu pamatojuma ziņojums. Pārresoru koordinācijas centrs, Latvia, Riga. Available at: <http://www.mk.gov.lv/file/files/ministru_prezidents/pkc/prioritasu_pamatojuma_zinojums_20120215.pdf> [Accessed 10 February 2012].
Masso, J., Roolaht, T. & Varblane, U., 2010. Foreign Direct Investment and Innovation in Central and Eastern Europe: Evidence from Estonia. The University of Tartu Faculty of Economics and Business Administration Working Paper, No. 67-2010, Estonia, Tartu. Available at: <http://papers.ssrn.com/sol3/papers.cfm?abstract_id=1557036> [Accessed 15 February 2012].
New Innovation Union Scoreboard: main competitors outpace the EU despite progress in many Member States [online]. ‘Europa’ portal. Available at: <http://europa.eu/rapid/pressReleasesAction.do?reference=IP/11/114&format=HTML&aged=1&language=LV&guiLanguage=en> [Accessed 15 February 2012].
Oslo Manual: Guidelines for Collecting and Interpreting Innovation Data, 3rd Edition, 2005 [online]. OECD, EUROSTAT. Available at: <http://www.oecd.org/document/33/0,3746,en_2649_34451_35595607_1_1_1_1,00.html> [Accessed 10 February 2012].
Paas, T. & Poltimal, H. Consistency Between Innovation Indicators & Innovation Performance in the Case of Small Economies. Available at: <http://www.enid-europe.org/conference/abstract pdf/Paas_Poltimae_abstracts.pdf> [Accessed 10 February 2012].
Research and Development and Innovation Statistics, Statistical Data Collection. Central Statistical Bureau of Latvia, Riga, 2010.
Shah, S.K. & Tripsas, M., 2012. When Do User Innovators Start Firms? A Theory of User Entrepreneurship. Harvard Business School Entrepreneurial Management Working Paper, No. 04-054. Available at: <http://papers.ssrn.com/sol3/papers.cfm?abstract_id=1022358> [Accessed 18 February 2012].
Statistics Explained: Gross domestic expenditure on R&D [online]. An official Euro-stat website. Available at: <http://epp.eurostat.ec.europa.eu/statistics_explained/ images/2/2a/Gross_domestic_expenditure_on_R%26D%2C_2000-2010 _%28%25_share_of_GDP%29.png> [Accessed 15 February 2012].
Statistics Explained: Proportion of innovative enterprises [online]. An official Euro-stat website. Available at: <http://epp.eurostat.ec.europa.eu/statistics_explained/ images/2/2c/Proportion_of_innovative_enterprises%2C_2008_%281%29_ %28%25_of_all_enterprises%29.png> [Accessed 15 February 2012].
Statistics Explained: Proportion of innovative enterprises, which introduced products new to the market or own-developed process innovations [online]. An official Euro stat website. Available at: <http://epp.eurostat.ec.europa.eu/statistics_explained/images/6/6b/Proportion_of_innovative_enterprises_which_introduced_products_new_to_the_market_or_own-developed_process_innovations%2C_2008_%28%25_of_enterprises_within_size_class_or_total%29.png> [Accessed 15 February 2012].
The Law on Scientific Activity [online]. Website of ‘Latvijas Vēstnesis’. Available at: <http://www.likumi.lv/doc.php?id=107337> [Accessed 10 February 2012].
JournalEconMngmnt-makets.indd 66 20.12.2012 14:12:18

CReaTInG a MoTIVaTIonal ReMUneRATIon PaCkaGe sTRUCTURe
foR PUblIC aDMInIsTRATIon In laTVIa
lUDMIla JeVčUka*1
Ministry of finance of the Republic of latvia
KāRlIs KeTneRsRiga Technical University
Abstract. The purpose of this study is to identify the financial elements of remuneration and its motivational features; to describe specific delimitations for the remuneration system in the public sector, and, on the basis of this information, to create a model for a possible remuneration package structure and to predict its future effect on the motivational level of public sector employees. This study provides an analysis of the existing remuneration package structure for public servants in Latvia and, based on a theoretical background, it offers proposals for the improvement of a remuneration package structure that aims to ensure its functionality and to provide possibilities to motivate employees. As a result of this analysis, the general and motivating parts of a remuneration package were defined, the last being divided into fixed and variable parts. An examination of the appropriate legislation has lead to the conclusion that the present combination of financial elements of remuneration has neither a clearly fixed, nor a clearly variable nature. Two alternative structures for a remuneration package have been proposed, namely, a fixed remuneration package structure and a remuneration package with a significant proportion of variable part. In the case of implementation of a fixed remuneration package structure it is forecast that all transparency and fairness (equality) principles will be met, stability of the remuneration system will be ensured, and, as well, a positive image of the public sector within the labour market will be sustained. The implementation of a remuneration package with significant variable part should ensure a stronger link between the level of remuneration and job output of employee, as well as to provide more flexible possibilities to stimulate employees for immediate actions. For the practical implementation of both proposed alternatives and for a revision of current remuneration levels in nominal terms, the authors propose the utilisation of an employee job output and remuneration level correlation matrix, thus ensuring an optimal equilibrium of output and remuneration and a targeted usage of remuneration funds.
Key words: remuneration package, monthly salary, public administration, work motivation.
JEL code: J33
* Corresponding author. Tel.: + 371 25952270; fax: +371 67089659; e-mail: [email protected] The findings and conclusions expressed in this article are those of the authors and do not represent the official view of Ministry of Finance or Riga Technical University
CReaTInG a MoTIVaTIonal ReMUneRATIon PaCkaGe sTRUCTURe ..
lUDMIla JeVčUka, KāRlIs KeTneRs
Journal of Economics and Management Research Vol. 1, 2012: 67–93
JournalEconMngmnt-makets.indd 67 20.12.2012 14:12:18
68 CREATING A MOTIVATIONAL REMUNERATION PACkaGE STRUCTURE ..
InTRoDUCTIon
Highly competent and motivated employees are the greatest asset to any organisation that deals with activities of an intellectual nature. Employee satisfaction with workplace and remuneration has a direct impact on the quality of work, achievement of results and on the fulfilment of organisational goals. The current literature on the subject lists a number of motivational tools, which are oriented towards an improvement of level of motivation of employees and on the achievement of better work output. Nevertheless, financial motivators are recognised as being one of the most important motivators, in line with such other motivators as interesting and meaningful work content, self-fulfilment opportunities and satisfaction with one’s own achievements (Jevčuka L., 2010; Keršule L., 2011).
For quite some time prior to the economic crisis there was a widely held (and persistent) opinion among public sector employees, that the level of remuneration in the public sector is “more demotivating than motivating”, only being compensated for by other important motivating factors (State Chancellery, 2005). During the immediate period of the economic crisis, wage funds and remuneration levels were sharply decreased and severe employee cutbacks took place, while the actual workload either remained unchanged or even increased. This created a set of circumstances in which the remaining employees had to perform an increased amount of duties for a decreased amount of money. A sharp reduction in remuneration levels commenced in 2009 and continued for the next few years. Even in 2012 the average remuneration levels were still well below the pre-crisis pay levels, thus indicating that the movement towards an exit from the “crisis wage” period was more than slow. For example, in the 1st quarter of 2012 the average remuneration level was higher by only 2.3% compared to the same period in 2011, but was less by 31% compared for the same period in 2008 (Ministry of Finance, 2012 (2)). By comparison, the average level of remuneration in the private sector has experienced a constant upside development (except in 2010), and has already exceeded pre-crisis remuneration levels – i.e., in the 1st quarter of 2012 the average remuneration level was higher by 3.9% compared to the same period of 2011, at the same time being higher than the average remuneration in the 1st quarter for both the years 2008 and 2009 (Ministry of Finance, 2012 (2)). The latest comparative survey results demonstrate that during the period 2008–2011 both the total amount of remuneration and its separate elements were almost always higher in the private sector than in public sector. This is applicable to all samples from top and middle level managers, specialists and experts, in small and large entities – and the remuneration levels between both these sectors differ by up to four times (Ministry of Finance, 2012 (3)). The sharp differences in remuneration level, in combination with various job content and organisational factors, leads to an outflow of professional specialists to the private sector.
Despite all of the aforementioned, the public sector still has to perform its duties at the highest level of competence, to retain professional employees and to
JournalEconMngmnt-makets.indd 68 20.12.2012 14:12:19
Ludmila Jevčuka, Kārlis Ketners 69
recruit new highly potential specialists, all the time searching for organisational and functional effectivisation possibilities. To achieve an increase in organisational effectiveness is only possible by increasing the motivation level of employees, and, this has become one of the most important daily tasks of managers. It is not possible to maintain an effectively functioning organisation without an effectively functioning remuneration system within this organisation (Leppik A., 2005). The ability to exploit limited remuneration funds in a most effective way has become one of the greatest challenges for post-crisis public administration.
In realising the necessity to introduce a transparent and competitive remuneration system, a few measures were (already) undertaken in 2007, which had two main directions – [a] to ensure that employees doing similar duties receive similar pay and [b] to realise an increase in the absolute levels of remuneration, bringing them closer to private sector levels (Cabinet of Ministers, 2006). A lack of financial resources necessitated the introduction of adjustments to the aforementioned plans, and new tasks were formulated – to ensure a fair, motivational and fiscally responsible remuneration policy by introducing new motivational elements: by increasing the intensity of existing motivational elements and by reviewing the monthly wage-setting principles and limitations with an aim to motivate qualified specialists to remain working in the public sector (Ministry of Finance, 2012 (1)).
The purpose of this paper is to identify the financial elements of remuneration and its motivational features, to describe specific delimitations of the remuneration system in the public sector, and, based on this information to create a model for a possible remuneration package structure and to predict its future effect on the motivation level of public sector employees. This study identifies financial motivators as listed in the relevant theoretical literature and practical researches and studies, as well as contains an analysis of existing financial motivators in Latvia based on an examination of native legislation. This analysis leads to a (further) definition of the components of a remuneration package, and a proposal for two remuneration package structure alternatives and a discussion of the possible impact of these alternatives on the motivation level of employees through an analysis of the main motivational principles. It is not the aim of this article to estimate any monetary costs for the practical implementation of the proposed alternatives.
The terminology used in this study has been harmonised with that used in the Law on Remuneration of Officials and Employees of State and Self-government Authorities (Law on Remuneration, 2009), in which the term “remuneration” includes regular monthly salary, additional monetary payments and bonuses, social guarantees and other payments and goods as provided by the employer, and within which, the term “monthly salary” is a single component of the remuneration package, which is paid monthly and can not be further divided into smaller components. The term “employees” in this study stands to represent both civil servants and employees within ministries and their subordinated institutions (non-specialised ones), all of whom are subject to the Law on Remuneration.
JournalEconMngmnt-makets.indd 69 20.12.2012 14:12:19

70 CREATING A MOTIVATIONAL REMUNERATION PACkaGE STRUCTURE ..
1. fInanCIal MoTIVaToRs anD lIMITaTIons In THeIR eXPloITaTIon In PUblIC aDMInIsTRATIon
Motivators (incentives) are external measures that are designed and established to influence the motivation and behaviour of individuals, groups or organisations. Motivation systems or structures are combinations of several more or less coherent incentives (United Nations Development Programme, 2006). Financial motivators are basically divided into “direct payments” and “allowances”. The first group of motivators usually includes an increase in monthly salary, additional payments, bonuses, vacation (and other) allowances, monetary premiums and other similar payments. Allowances granted usually refer to health insurance, additional paid vacation, job car, paid-for mobile phone, compensation for studying costs, and other allowances of a similar nature (Jevčuka L., 2010). The monthly salary in itself is not usually recognised as a motivator, but any increases or decreases in the established monthly wage are considered as motivators or demotivators. There is an opinion and common understanding that fear of losing one’s job position (and thus income source) can in fact serve as a motivator, however this is more likely a relevant consideration during periods of crisis and can not be regarded as an effective long-term motivator (Kuprov M., 2000). Such remuneration aspects as health insurance or vacation allowance are not usually associated with the particular job contribution of a particular employee, because such remuneration elements are granted to all employees of the institution. However, such motivators do help to sustain the loyalty of employees towards work in the public sector in general.
State budget institutions plan their remuneration expenditure according to the budget expenditure classification by economic categories, which are approved by the Cabinet of Ministers (Cabinet of Ministers, 2005). According to this classification, the term remuneration includes all payments associated with monthly salaries, bonuses, additional payments (including overtime), different types of allowances and goods, health insurance, as well as social tax payments (those are the most important categories). Remuneration expenditure as reflected in the law on the annual state budget has been a constant subject of annual budget consolidation measures for the past few years, and this budgetary position still attracts significant attention from the community, the media and international experts. Within the restricted limits of available wage funds the principals of the various state budgeted institutions must provide a fair remuneration to their employees, retain qualified specialists, attract new employees, and motivate existing employees to achieve high job results and to provide qualitative public service. Remuneration expenditure comprises a significant portion the total state budget expenditure. Figure 1 (below) shows the total state budget expenditure (without municipalities) for the years 2007–2013, and specifically the remuneration expenditure. The data provided reflects the budget execution for the years 2007–2011, the planned budget for year 2012 (with amendments), and draft budget for year 2013 as submitted to Saeima.
JournalEconMngmnt-makets.indd 70 20.12.2012 14:12:19

Ludmila Jevčuka, Kārlis Ketners 71
4,271
5,0944,757 4,690 4,575
4,879 4,792
774 894579 461 478 487 518
0
1,000
2,000
3,000
4,000
5,000
6,000
2007 2008 2009 2010 2011 2012p 2013p
State consolidated budget expenditure Remuneration
Source: State Treasury, Annual budget execution report, volume “Budget execution”, annexes “State consolidated budget execution” and “State basic (special) budget revenue and expenditure by economic classification”(years 2007-2011); State Budget Law (years 2012-2013).
Fig. 1. Remuneration Expenditure Compared to Total State Consolidated Budget Expenditure (in millions of LVL)
In the pre-crisis period there was quite a wide range of remuneration elements listed in the various legislative acts (for more details see Jevčuka L., & Ketners K., 2010), and the relatively low level of monthly salary was attempted to be compensated for by a wide range of bonuses and additional payments, however, at the same time there was often no clearly observable link between remuneration and job results (Jevčuka L., 2010). This created an impression that remuneration, in many cases, was granted by the principle “the more, the better”, without any deep analysis of the direct impact of remuneration on work motivation and job results (see Figure 2.a). The authors of this study believe that both during periods of highly limited financial resources and during “the good times” the remuneration elements must be combined into a remuneration package in the most effective way, so that in transposition through the value scale of every individual employee it would be directly oriented towards the achievement of high job results, thus exploiting the available wage funds in the most effective manner (see Figure 2.b).
At this point, the authors of this study would like to clarify such aspects as the efforts of the employee while performing the task (inputs), the real contribution of the employee (the result of his efforts) (outputs), and results at the global level (organisation, state level) (outcomes). It is important to realise that not always do high efforts necessarily lead to qualitative outputs (e.g., due to lack of certain skills), and that not always will qualitative outputs lead to the fulfilment of organisational or political goals (e.g., a legislative act developed by an employee may not be accepted due to lack of political will or some other unfavourable factor). The authors of this study believe that output is the factor that should be
JournalEconMngmnt-makets.indd 71 20.12.2012 14:12:19

72 CREATING A MOTIVATIONAL REMUNERATION PACkaGE STRUCTURE ..
rewarded, thus ensuring that the employee really can influence his job results and thus also his remuneration level (Jevčuka L., & Ketners K., 2010).
Wage funds
Jobresults
Jobresults
Wagefunds
2.a
2.b
Source: constructed by authors
Fig. 2. Illustration of Remuneration Elements Effect on Job Results
The exploitation of financial motivators within public administration is limited by various factors, if compared to the private sector. First of all, the source of financing for remuneration of public sector employees is mostly derived from tax payer’s money; therefore every issue connected with changes in remuneration serves to create a reaction in the community. Decision makers, while deliberating on remuneration issues, are forced to evaluate not only the particular impact of their decisions on the budget and on the employees, but also to consider whether it is “an appropriate moment” to put such a sensitive issue ‘on the table’. Secondly, as a result of certain activities noted in the open society publication of remuneration data (as in the case of Neo) the state legislation has been amended, and budget institutions are now required to publish, on their web pages, all general information about remuneration within each such institution and make public the amount of monthly remuneration of every employee. On the one hand, this degree of openness provides the possibility for employees to compare themselves with other employees in similar positions but on the other hand, a comparison of the amounts paid does not, by itself, provide a fair evaluation on possible equality among employees if their duties, responsibilities, outputs and results are not analysed as well. Thirdly, the amounts of available wage funds have a very limited nature from year to year, if there are no reforms or new policy initiatives with respect to changes of remuneration policy. In the private sector, an increase in wages would take place of the basis of and at the expense of potential profit of the enterprise. In public administration a limited amount of fiscal resources has to be split among all employees, and when all resources have already been allocated, the algorithm is quite simple – remuneration per capita can only be raised by decreasing the number of employees. Finally, all significant structural changes in the remuneration system
JournalEconMngmnt-makets.indd 72 20.12.2012 14:12:19
Ludmila Jevčuka, Kārlis Ketners 73
require the enacting of amendments to the legislation, which is usually a very slow and mostly inflexible process and can not be performed too frequently due to the political sensitivity of the issue. As has been noted, during the creation of a remuneration system such issues as fairness, equality, transparency, effectiveness and result orientation must all be considered but, in reality, the parties involved have to consider the disposition of the community, political sensitivity of issues, negotiations and compromises within and outside the existing coalitions. In practice, both mentioned principle systems are hardly compatible with each other (United Nations Development Programme, 2006).
2. THeoReTICal asPeCTs on sTRUCTURe of ReMUneRATIon PaCkaGe
Certain criteria must be fulfilled in order for financial motivators to be really motivating and encouraging so that the employee delivers a contribution and reaches (or even exceeds) set job results. The remuneration system must be understandable and based on clear criteria. It must reflect the skills, proficiency and abilities of the employees and correspond to their beliefs about how their work should be remunerated. At the same time, the remuneration must be fair compared to other employees with a similar position and duties. There must be a clear correlation between job results (outputs) and remuneration level. Remuneration, especially in public sector institutions, must be stable, and employees must have a clear vision on how their remuneration will develop in the medium to long-term perspective (Jevčuka L., & Ketners K., 2010). Various authors have identified the following view on the necessary pre-requisites of a remuneration system.
Fairness (equity). The concept of fairness (also called equity theory) in work organisations is associated with positive correlation between the efforts and other inputs of the employee and remuneration received in exchange (for more see Adams J.S., 1965). At the same time, employees will (naturally) seek for a fair attitude towards them, compared to other employees with similar duties. Any suspicions about unfair attitude (inequity) will cultivate psychological problems within the organisation, thus negatively influencing the performance of tasks and achievement of organisational goals (Jevčuka L., 2010). Based on the aforementioned, (most) employees are willing to recognise a fairness of remuneration in two dimensions – a fairness towards the internal potential of the employee (the belief that they could get a similar remuneration elsewhere on the labour market), and a fairness towards other similar employees (the belief that similar skills and efforts are similarly remunerated).
In the process of determining and evaluating what is a fair level of total remuneration, both employee and principal are faced with certain risks (Burgess S., 2003). The employer (direct manager or principal) of an employee can not precisely
JournalEconMngmnt-makets.indd 73 20.12.2012 14:12:19

74 CREATING A MOTIVATIONAL REMUNERATION PACkaGE STRUCTURE ..
measure the abilities and potential efforts of an employee; therefore in setting the remuneration level the principal takes into consideration a certain degree of observation with regard to employee behaviour. The principal is interested in getting a maximum output from the employee by paying the minimal (reasonable) remuneration (in other words, not to overpay), but the risk exists that in the case of too low a remuneration the employee would not be interested to continue to work in that relationship (or at least not to deliver any high outputs). The employee, in his turn, is interested in receiving the maximum possible remuneration for his efforts. At this point the authors of this study assume that, in the event of too low remuneration, a capable and rational employee will not be oriented towards diminishing (not exploiting) his skills and competences, but will instead either require higher remuneration or give preference to some other place of work. Finally, in the possible event in which the remuneration level exceeds the contribution delivered by the employee, the situation can not be maintained from the side of employer, and, sooner or later (if the employee is not ready or able to improve work quality) some kind of equilibrium must be reached, either by decreasing the remuneration or by rotating the employee to a more appropriate work place. This correlation of the interests of the employee and of the employer (direct manager), as well as remuneration and job output matrix, is expressed in Figure 3.
I II
III IV
High output
Lowoutput
Low remuneration level High remuneration level
�e remuneration level is disproportionately low. �e
employer is be�er o, but the employee’s interests suer and this condition can not hold in
the long term
�e remuneration corresponds to output level, but e�ciency of such employment is question-
able, and possibilities to reallocate resources to more capable employees must be
considered
�e remuneration level is unreasonably high. �e
employer is worse o due to lack of possibility to invest in more capable employees, therefore
such situation can not last in the long term
�e remuneration re�ects the outputs of employee. An optimal
equilibrium of output and remuneration is ensured, leaving both employee and employer in
a be�er o situation
Source: constructed by author, based on various sources.
Fig. 3. Remuneration Level and Job Output Matrix
JournalEconMngmnt-makets.indd 74 20.12.2012 14:12:20

Ludmila Jevčuka, Kārlis Ketners 75
On the matrix in Figure 3 it is clear that quadrants I and IV are not in equilibrium, therefore, sooner or later, conditions must change and move into a quadrant II situation, thus ensuring equilibrium in remuneration level and job outputs. If the employee is not capable of improving job quality, then the situation will move from quadrant IV to quadrant III. Quadrant III is economically ineffective for the employer from the point of view of general work organisation and wage funds allocation, especially if considering the need for intellectual, innovative and creative performance. A full effectiveness can be attained by estimating the available human resources and evaluating the potential consequences of the exploitation of these resources. A higher performance can be achieved by retaining more competent employees and by paying them more, rather than by keeping a larger quantity of variously skilled employees and paying them all almost (more or less) equally (Ozoliņa-Ozola I., 2011).
There is an opinion held in some studies that different pay schemes could well be used for different employees (or groups of employees) within an organisation if each employee (group) performs a very specific/individualised task and the total performance of the organisation is a sum of the performances of all employees within this organisation. However, if the employees in one unit can compete among each other with respect to the performance of their specific tasks, then the remuneration system (pay scheme) must be structured equally for all of them (Dixit A., 2002). It is important for individuals to realise that the attitude towards them is as equal as towards any other part of the community, thus a social motivation also persists among employees – to behave (to work) in such a way that would lead to the belonging to a particular (favourable) group of employees (United Nations Development Programme, 2006). Various studies reflect the observation that a productivity-based remuneration system that is directed to a particular number of employees can not serve as a motivational system for the whole organisation, because those employees, who are not granted additional remuneration for their (individual) productivity, would feel demotivated rather than motivated (the fairness principle is not met) if compared to a “privileged” group (United Nations Development Programme, 2006; Organisation for Economic Co-operation and Development, 2005).
Transparency and value. Transparency of the remuneration system means that employees have a good understanding about what they are being remunerated for and what they have to do in order to receive any monetary increase in the existing remuneration agreement or to be granted additional remuneration elements. The employee must believe that all employees in the organisation are remunerated by the same clearly defined principles. The concept of transparency is quite often associated with the availability of information on the remuneration amounts being received by other employees instead of by the criteria of determining and setting the actual remuneration level. In this context it is important to stress that a just examination of the remuneration amounts will not reveal the concept of fairness of the remuneration system and its criteria, unless outputs, skills,
JournalEconMngmnt-makets.indd 75 20.12.2012 14:12:20

76 CREATING A MOTIVATIONAL REMUNERATION PACkaGE STRUCTURE ..
experience, duties, responsibilities and other work aspects of the respective employee are not considered at the same time.
The parties involved in the work process (both the employer and the employee) must realise that the skills, knowledge and job output of the employee must be exchanged against remuneration, and that this remuneration must be valuable for the employee. The employee receives remuneration and evaluates it (this process might also happen at a subconscious level), and if remuneration is deemed to be valuable, then the employee experiences satisfaction and motivation to work and to receive such remuneration also in the future. At the same time, if the remuneration received is not deemed as valuable enough, then the level of (job) satisfaction is lower, and through this experience the employee should clearly understand, what he would like to receive more of and what less. In this process the employee has the possibility to evaluate whether his performance has lead to a fair remuneration (or not) (Steers, R.M., 1996).
Although financial motivators are among the most important ones, experience has shown that the process and content of work (to be performed) is often full of demotivating factors besides insufficient remuneration. The removal or lessening of demotivating factors and the recognition and development of important non-financial (or indirect financial) rewards may well have a significant impact on job motivation and on the organisation as a whole (United Nations Development Programme, 2006). There is an opinion, which is also supported by empirical studies, that the non-competitive (compared to the private sector) financial remuneration within the public sector could quite possibly be well compensated for by a satisfaction of the employee’s altruistic goals, i.e., the possibility of being on duty in the service of the state and society (Francois P., 2000). Some studies that have been undertaken in the private sector reveal surprising results – showing that there is no statistically significant correlation between remuneration level and work motivation in the sample of most motivated employees of the companies. At the same time, the highest correlation of all those insignificant correlations was observed in the companies in which employees were paid the least (compared to other companies participating in the survey) (Pinto E.P., 2011). Such a finding can be explained by the basics of Maslow’s hierarchy of needs, which states that the individual is motivated by his unsatisfied needs, and when a certain need is satisfied (in this case – with sufficient financial remuneration) it is no longer a motivating factor.
Link with job results. The fact that employees possess certain skills and qualities does not necessarily mean that they will put them into practice. There is an opinion that remuneration has to be directly linked to the achievement of job results and that the employee must have a very good understanding of this link. The skilled but unmotivated employee is like a car with capacious engine but without fuel and/or driver – it drives nowhere (United Nations Development Programme, 2006). A professionally designed remuneration system will encourage employees
JournalEconMngmnt-makets.indd 76 20.12.2012 14:12:20

Ludmila Jevčuka, Kārlis Ketners 77
to be creative and productive, it will remunerate employees according to their contribution and it will stimulate innovation and initiative. At the same time, an alternative opinion exists – that while financial motivators have to appraise the inputs of the employees, nevertheless, a linking of remuneration to the job results (outcomes) would not be advisable with regard to public sector employees, mostly because it is very difficult to recognise or measure the achievement of results at the state level (Burgess S. & Metacalfe P., 1999). This opinion is also confirmed by local Latvian experts who suggest that the lack of goals, or too comprehensive goals, the lack of a serious attitude towards formulated goals, contradictions and changeability of goals, discrepancies between goals and actions on the political level and other similar factors may consequently lead to a lack of concrete and meaningful goals at state level, which could otherwise have been efficiently achieved (Jaunzeme K., 2012). In the opinion of the authors of this study, however, although there are many contradicting goals to be observed in the work environment of public administration, it should still be possible to formulate concrete and measurable goals – at least at the institutional level (these would mostly be goals with no political agenda).
The classical remuneration scheme is a combination of fixed and variable parts of remuneration, in which the input and output of the employee are clearly identified. The fixed part is considered to be that remuneration for efforts exerted (inputs), but the variable part is that remuneration offered for tangible achieved results (in this case by the outputs). The employee is the one who chooses the methods of work in order to achieve certain results, and, as those methods and behaviours can differ; therefore, the variable part of the remuneration package has to be sufficient to motivate employees to choose such a behaviour that will lead to the best outputs in the most effective way (Dixit A., 2002). That aspect of job content which is related to creative thinking and innovative approach has a positive correlation with the presence of a significant variable part of the remuneration package (Kuprov M., 2000).
The variable part of the remuneration package may be paid regularly or for particular periods of time (e.g. quarterly after appropriate evaluation) (Dixit A., 2012). In the case of regular additional payments the employee keeps in mind that any reductions in his outputs could lead to a reduction in that variable part in the future, thus the employee is motivated to maintain work quality and not to lose these additional payments for the future. By contrast, in making a decision to reward the employee for a particular period (e.g., the past quarter) s/he is given an indication that by performing excellently in future s/he can expect to receive additional payments again. Psychologically, in the first instance, the employee is motivated by a willingness to retain (not to lose) the existing level of remuneration (including the variable part), but in the second case the employee is motivated by a willingness to increase his future income through appropriate job performance (the variable part is perceived as an “extra”) (Dixit A., 2012).
The linking of remuneration to the achievement of particular (expected) results may have various side effects. First of all, these results are primarily
JournalEconMngmnt-makets.indd 77 20.12.2012 14:12:20

78 CREATING A MOTIVATIONAL REMUNERATION PACkaGE STRUCTURE ..
evaluated by the direct manager of the employee, who could be consciously or sub-consciously subjective in his decisions. It should be understood that it is mutually beneficial for both employee and principal to maintain “fair” relationships, meaning that for the employee – to deliver high value and to receive remuneration from principal, and for the principal – to ensure fair remuneration and to receive qualitative performance from the employee. Secondly, employees, by their performance evaluation, are often conditionally divided into two opposite groups: “good” and “bad” employees, and such employees who are simply “average” or “normal” would automatically be relegated to the “bad” group, thus having a negative impact on their remuneration level and components. Finally, the linking of remuneration to certain results could lead to a situation in which the employee intentionally works on the “important” aspects, which, in his opinion would lead to a higher remuneration, leaving aside the seemingly less important duties (Burgess S., 2003; Burgess S. & Metcalfe P., 1999). Some studies have revealed that the implementation of a performance oriented remuneration system serves only as an increased work motivation for the best-paid employees, leaving the medium and low paid employee motivation without significant changes. It should be stressed that the implementation of a performance-oriented remuneration system also requires changes in the work process and content, otherwise employees would be demotivated rather than motivated (Ohtake F., 2004).
Stability. The stability of a remuneration level and regularity of payment is traditionally considered as a positive aspect of employment within the public sector, compared to the private sector. At the same time, the recent period of economic downturn has demonstratively and clearly revealed that a seemingly stable remuneration can be unpredictably decreased, both in the cancelling of separate elements of the remuneration package and by decreasing monthly salary amounts. The various studies and theoretical literature on the subject do not widely discuss this aspect of public sector remuneration stability, most probably because the stability and predictability are the self-explanatory pre-requisites of a motivational remuneration system. There is a general opinion that all additional payments (i.e., bonuses, allowances, non-financial goods) are offered as compensation for a generally insufficient monthly salary, thus creating a non-transparent and unfair remuneration system (Kiragu K., 2005). At the same time, the regular monthly salary is perceived as the most stable element of the remuneration package which is made up of many less stable (easier to abolish) elements and which may thus indicate the possibility that the whole system is unstable. The remuneration system and reforms in this respective field should conform to the existing political system, its social structure, and the nature and allocation of the political centres (Kiragu K., 2005). It could only be under such a condition that the remuneration level and its components will not be a victim of the volatilities of the economy and will remain stable within the system.
The Law on Remuneration states that the remuneration of employees of state (municipalities) institutions is to be revised taking into consideration the
JournalEconMngmnt-makets.indd 78 20.12.2012 14:12:20

Ludmila Jevčuka, Kārlis Ketners 79
economic developments of the state, principles of solidarity, an evaluation of state economic conditions (inflation, deflation, changes in the levels of productivity) and other reasonable criteria. The present legislation does not contain any concrete mechanisms for wage remuneration indexation, and there is no comprehensive strategy for the (ongoing) development of a state remuneration policy. Every institution is free to include additional requirements on the revision of its remuneration of employees, if this is not contrary to the external legislation.
3. an eValUaTIon of THe CURRenT ReMUneRATIon PaCkaGe foR PUblIC aDMInIsTRATIon eMPloyees
At the present moment the remuneration-related issues and processes for Latvian public service employees may be characterised as the beginning of a post-crisis regeneration. Starting from early 2009 the majority of additional payments and allowances were decreased or frozen, but commencing in 2012 a part of those remuneration elements were re-activated.
A base monthly salary is the dominant element of the remuneration package and reflects the skills, experience and level of responsibility required for work in a certain position (Kiragu K., 2005). The monthly wage of employees (within ministries and subordinated institutions) is determined by a wage scale that has been approved by the Cabinet of Ministers. This scale takes into consideration the level of work complexity, evaluation results and work experience (the last two determine the qualification level of an employee) (Cabinet of Ministers, 2009). The Law on Remuneration prescribes that in order to motivate the most competent employees they may be assigned additional payments for personal work contribution and work quality, taking into consideration the importance of employee’s work towards the achievement of organisational goals. Some surveys have revealed that this additional payment is being called a “motivational payment”, because it is paid mostly to those employees, whom the institution/department really wants to keep from leaving (Ministry of Finance, 2012 (3)). In 2012 these additional payments may not exceed 20% of the base monthly salary and must be revised at least once a year, evaluating their necessity and justification. Also, as from 2012, a vacation allowance has been initiated and if until 2009 this allowance was granted to all employees of the organisation, then the legislation now states that a vacation allowance is to be granted according to an evaluation of the work quality of the employee, thus it is differentiated for every individual. The maximum vacation allowance in 2012 is limited to 25% of the base monthly salary, but in following years it may be increased up to 50%. Considering the diversification of this allowance with respect to work quality, it might also be viewed as a motivating element of the remuneration package. It is foreseen in the legislation on remuneration that the annual evaluation of employees may also lead to a bonus payment, which can not exceed 75% of the base monthly salary (the respective regulation of the Cabinet of Ministers (2009)
JournalEconMngmnt-makets.indd 79 20.12.2012 14:12:20

80 CREATING A MOTIVATIONAL REMUNERATION PACkaGE STRUCTURE ..
prescribes 75% for an evaluation – A, 65% for – B and 55% for – C). This norm is not yet in force in 2012, but is expected to come into force in the following years. State institutions/organisations have the right to pay a monetary premium (not exceeding the state minimal wage level) in the case of significant events for the employee or the organisation, and/or in consideration of individual employee contributions to the achievement of organisational goals.
The aforementioned remuneration elements, in the opinion of the authors of this study, are those comprising the motivating part of the remuneration package. It must be stressed that, within scope of this study, the motivational elements are those elements, which are expressed both in monetary terms (thus have an impact on total wage funds) and are directly connected with motivating and remunerating a particular individual (thus being differentiated between employees, and not all of them being paid equally).
State institutions are allowed to purchase health insurance packages for their employees, and this health insurance is not differentiated among employees by the level of their work quality or contribution. The fact of granting health insurance serves rather to improve the image of the institution as an employer, compared to those institutions, which do not offer health insurance. Similarly, an additional vacation is not viewed as a motivational element within the scope of this paper because, although it is connected with evaluation results, it has no direct link with the exploitation of available wage funds. Therefore, health insurance and additional vacation are related to the general part of the remuneration package.
All of the aforementioned remuneration elements may only be applied within the limit of wage funds available for that institution. The relevant legislation does not prescribe a requirement to make those payments (optional “may pay”), and the institution does not have the right to require additional financing to implement all of the possible remuneration elements stated in the law. This leads to a situation in which some institutions can afford to exploit certain motivational elements, and some institutions – not, depending on the re-organisation and optimisation possibilities and on historically granted wage funds levels.
On the basis of the aforementioned analysis, the motivating part of a remuneration package (directed towards the individual motivation of the employee) consists of a core monthly salary (and its possible increases), additional payments for work quality, a monetary premium, an evaluation bonus (not in force in 2012) and a vacation allowance. At the same time, the general part of the remuneration package (that improves the image of the institution on the labour market) consists of health insurance and additional vacation. The issue of additional payments for overtime is not reviewed within the scope of this article as a classical element of the remuneration package, because this increase in remuneration (or additional time off) is proportional to a short term increase in workload. At this point the authors of this study assume that the skills and output of the employee do not change, whether the employee is working overtime or on a normal workload. Also, the question of additional payment for replacement of
JournalEconMngmnt-makets.indd 80 20.12.2012 14:12:20

Ludmila Jevčuka, Kārlis Ketners 81
an absent employee is not considered as part of the classical motivating element and therefore is neither recorded in the motivating or in the general part of the remuneration package, but is simply recognised as a short term workplace organisational solution. Other possible allowances (e.g., child birth, significant anniversary, etc.) are not analysed in this paper, because even if they do exist, such payments/bonuses happen very rarely compared to whole work duration, and do have to be analysed as a component of the annual remuneration cycle.
Monetary premiumVacation allowanceEvaluation bonusAdditional paymentYear monthly salaryHealth insuranceAdditional vacation
~ 25%
~ 75%
Source: constructed by authors, based on existing legislation.
Fig. 4. A Visualisation of the Existing Remuneration Package Structure
The existing remuneration structure may be visualized in Figure 4 and expressed in system (1) [below], in which a monthly salary (MS) of the employee, for calculation purposes, is assumed to be 800 money units, and on the assumption that this is for a very competitive employee with additional payment (AP) of 20% for the whole year, evaluated by an ‘A’ rating and receiving (from 2013) evaluation bonus (EB) 75%, is granted two monetary premiums (MP) per year to the maximum amount (two times 200 minimum wage money units) and a differentiated vacation allowance (VA) set at 50% of the monthly wage. Health insurance (HI) is assumed at a value of 300 money units, and additional vacation (AV) is expressed in monetary terms for better visualisation purposes.
(1)
Therefore, the current remuneration package (RP) with maximum amounts of variable elements consists of the general part (RGen), which is relatively insignificant and the motivating part (RMot). The latter is made up of the fixed part
JournalEconMngmnt-makets.indd 81 20.12.2012 14:12:20

82 CREATING A MOTIVATIONAL REMUNERATION PACkaGE STRUCTURE ..
(F) or the monthly salary (approximately 75% of the whole motivating part) and the variable part (V), which consists of a range of variable remuneration elements (approximately 25% of the whole motivating part). Thus, if the remuneration structure for an employee would be modelled on the basis of somebody who has received an evaluation ‘C’ and who is not offered any additional payments, the variable part of such an employee’s remuneration package in 2012 would be close to zero. In understanding the motivating part as a percentage of the whole annual remuneration, one must also distinguish between the different regularities of payments; for example, additional payment for work quality is paid monthly, but an evaluation bonus only once a year.
The various monthly salary ranges are designed in such a way that employees holding similar positions and duties might receive a different monthly salary (that is normal practice). Since the variable elements of the remuneration package are expressed as a percentage of the monthly salary, and the monthly salary can differ of itself, this creates a situation of double differentiation of the variable elements. An increase in monthly salary would naturally generate a higher motivating part level in monetary terms, since almost all elements are expressed as a percentage of the individual monthly salary, and separate variable elements are differentiated by themselves (e.g., vacation allowance).
The idea of separation of remuneration based on fixed and variable parts may have several weaknesses, if the weightings of those parts are not optimal. The routine job of an employee is directed towards the achievement of certain results and the fulfilment of particular tasks. If legislation or the internal organisational culture undermines that variable part of the remuneration reflects the contribution and initiative factors, a situation might arise in which it would no longer be possible to determine what the fixed part was originally meant for. Employees may thus assume the wrong impression that the fixed part of there salary is granted on the basis of performing their duties at a minimal required level, devoting only such amount of effort necessary so as not to come down below a certain work quality standard. In such a case, employees working only on the basis of fixed part remuneration will not be motivated to put in any additional effort, because they will not perceive any link between remuneration and output. Another group of employees, who would have been granted a relatively modest variable part, might also feel demotivated because they would not feel that this variable part compensates for all their efforts and initiative, compared to just keeping on a bare base standard. If one were to hold on to the philosophy that every employee consistently delivers a valuable output and contributes positively to the whole work process, expresses initiative and personal effort, then it would be more rational to grant each employee only a fixed part remuneration. In such an event this part must be significant (competitive in the labour market) enough that these employees would clearly see the link between this remuneration with their absolute and maximum work contribution, and there would be no room for the opinion that the fixed part remuneration is paid “just for being present at the workplace”, and that the employer would have to pay extra for a more valuable output.
JournalEconMngmnt-makets.indd 82 20.12.2012 14:12:20

Ludmila Jevčuka, Kārlis Ketners 83
4. PRoPosals foR a ReMUneRATIon PaCkaGe sTRUCTURe
In evaluating the existing remuneration package structure for public administration employees in Latvia, the authors of this study have concluded that while it is not of a strictly fixed nature, it does not have a clearly expressed division between the fixed and variable parts. At present, the so-called variable part of the remuneration package is made up of several elements, which are not assigned to all employees in the institution. The authors of this study therefore propose two possible alternatives for a remuneration structure, analyse the pros and cons of these options and elaborate on the possibilities for the practical implementation of each alternative.
a fixed Remuneration Package structure
One of the possible solutions is to create such a remuneration package so its motivating part consists mostly of a set monthly salary, but the general part contains some remuneration elements that might help to maintain a positive image of public administration on the labour market. If a set monthly salary is the dominant part of a remuneration package, it must fulfil certain criteria. The ranges of monthly salary levels for different positions and managerial staff should be revised, based on similar positions and duties in the private sector, and the amounts of these monthly salaries should be set at an unequivocally competitive level. Employees receiving such a monthly salary must realise that this level of remuneration fully corresponds to the level of their individual skills, knowledge, experience, responsibilities and quality of job output. In this way a fairness (equity) principle would be ensured in both dimensions, both with respect to the employee’s singular efforts and in comparison to other employees. To reform the remuneration system in this way, it would be advisable to utilise the remuneration level and job output matrix (see Figure 3) proposed by the authors of this study. A practical exploitation of this matrix would assist in an evaluation of optimisation opportunities, as well as in determining a (concrete) monthly salary limit for every employee, and especially so for those employees, who are presently being granted additional payments.
Further, it would be necessary to formulate certain criteria within the legislation for the systematic revision of monthly salaries. For example, this could include an annual indexation for the wages of all public sector employees to allow for inflation, at the same time granting the required financial resources for this purpose (it would be pointless to adjust salaries for inflation within an unchanged core wage funds scenario, otherwise, in practice, it would mean either no change or reductions in certain positions). Indexation would provide some insight for employees about the long-term development prospects for their monthly salaries. Clearly formulated and justified criteria (e.g., inflation) for a centralised revision of monthly salaries would serve to reduce any negative attitude within
JournalEconMngmnt-makets.indd 83 20.12.2012 14:12:20

84 CREATING A MOTIVATIONAL REMUNERATION PACkaGE STRUCTURE ..
the community every time negotiations on the remuneration of the public sector employees are initiated. Of course, individual mechanisms for the revision of monthly salaries would still be applicable and connected with changes in each employee’s qualifications status.
In the general part of the remuneration package there should be provision for a vacation allowance as this remuneration element is also widely utilised in the private sector. The authors of this study recommend against any differentiation in this allowance as being dependant on the quality of work of the employee or any other relatively subjective criteria. Since a vacation allowance is already set as a certain percentage of the monthly salary, and, as such, it would already have been differentiated – an employee with a higher monthly salary would receive a higher vacation allowance in nominal terms, than an employee with a lower monthly salary. The authors are of the opinion that the main idea behind the granting of a vacation allowance is not so much as to remunerate for particular effort and work results, but rather to the ensure the financial resources for a qualitative employee’s vacation, thus promoting a greater loyalty between employer and employee. Therefore, items such as vacation allowance, health insurance and additional vacation options should be included in the general part of any proposed remuneration package structure and viewed as goods of a social nature, which are also traditionally offered in private sector companies (for more information on remuneration elements of private sector see (Ministry of Finance, 2012 (3)).
An evaluation bonus has for many years been a traditional motivational element for public sector employees, therefore, under a proposed fixed remuneration package structure the absolute exclusion of this bonus from the remuneration package would have a negative impact both on the content of the evaluation procedure and on the symbolic importance of the evaluation bonus.
In the opinion of the authors, such motivating elements as monetary premiums should be granted on the basis of exceptional and/or extraordinary achievements. In such a situation it would be also advisable to revise the nominal value of the allowed monetary premiums, as any premium set as being equal to the state minimal wage would not be motivational nor adequate remuneration for truly significant achievements.
The proposed remuneration package structure may thus be expressed in the following way:
(2)
The implementation of a fixed remuneration package structure would ensure various advantages. Firstly, all employees of the institution would be remunerated on the same principles and remuneration packages for all employees would
JournalEconMngmnt-makets.indd 84 20.12.2012 14:12:21
Ludmila Jevčuka, Kārlis Ketners 85
have the same structure. Employees would not be divided into two conditional groups – those who are being granted additional payment, and those who are not. This would help to ensure the principle of fairness as described in this study. Secondly, the principle of transparency would be assured as well, since the main (and almost the only) component of the remuneration package – the monthly salary – would be based on specialisation of job description and on the qualification level of the individual employee. Transparency in the face of the community would also be ensured, thereby decreasing any possible illusions about the possibilities to grant any different hidden and “unfair” additional payments and bonuses, thus helping neutralise all negative reaction within the community with regard to the remuneration of public sector employees. Thirdly, a remuneration stability principle would be reinforced, because a set monthly salary is not so easy to change downwards even during periods of economic downturn. In addition, with the setting of clear monthly salary re-evaluation principles on a state level, employees would have a relatively clear understanding about all possible developments of their remuneration prospects in the medium and long term. The authors are convinced that the implementation of the above-described fixed remuneration package structure would ensure the creation of a positive and competitive image of the public administration as an employer, which would serve also to motivate capable existing and potential future employees to choose (or continue to choose) public administration as an appropriate place to work. Holding on to the principles of fairness and transparency would ensure the everyday satisfaction of employees and thus also a positive correlation with work motivation and loyalty level.
The proposed remuneration package may have some various weaknesses. Since a monthly salary is relatively difficult to adjust (both in the upside or downside directions) the risk exists, that it would not be possible to motivate employees for effective action in the short term (e.g., for a specific creative task), or to instil a feeling of necessity to maintain a certain level of work quality, bearing in mind a possible decrease in remuneration level. In the case that the outputs of an employee have systematically worsened in comparison to some previous periods, somewhat long bureaucratic and complex measures are needed to achieve equilibrium between remuneration level and worsened outputs. As a result, the proposed alternative with a fixed remuneration package structure might not be effective in the need for a short term stimulation of the employee (by initiating a motivational impulse for a particular period of time so as to perform certain tasks with an exceptional level of quality).
Any movement towards the implementation of a fixed remuneration system must be implicit and on a long-term basis, in order not to allow for a possible future scenario in which, after years of the reformed monthly salary, it would then be wrapped by different irregular payments and bonuses, thus bringing the whole system back to its origins. There exists a risk that the practical implementation of the reform, due to insufficient financial resources, could result with the cancellation of current variable remuneration elements, leaving
JournalEconMngmnt-makets.indd 85 20.12.2012 14:12:21

86 CREATING A MOTIVATIONAL REMUNERATION PACkaGE STRUCTURE ..
the issue of competitiveness of the monthly salary in half-way. This scenario would be destructive for the entire public administration, which has just started to recover and to revitalise the motivation aspects of the remuneration system. With respect to the practical implementation of this alternative – the existing legislation in the field of public sector remuneration already contains indications of a movement towards the strengthening of the variable part of the remuneration equation. Therefore, policy makers would have to prepare a very convincing argumentation in favour of a change in direction towards the fixed remuneration package structure, both for government and for the community. The risk exists, however, that any such redirection of action would require significant time due to bureaucratic process, thus leaving public administration and all of its employees with an undeveloped and unbalanced remuneration system and with inadequate motivating components for some more years ahead.
The Introduction of Variable Component in the Remuneration Package
The second proposed alternative foresees the combination of fixed and variable parts within the motivating part of the remuneration system, and in which the variable component would have a significant weighting, i.e., the variable component would be introduced conceptually and for a long time, and it would be a part of the remuneration package structure for every employee (not just for a group of some employees). The fixed part of the remuneration package would be a monthly salary that would reflect the general level of effort (inputs) of the employee, because in order to raise any effort, the employee must already possess certain knowledge, skills and competence. The variable component of the remuneration (in some sources also called “unguaranteed part of wage” (Ministry of Finance, 2012 (3)) would reflect the outputs of the employee, in this way motivating the employees to raise their efforts and to choose an action in such a way as to ensure achievement of the best possible work results and professional contribution. In this case the set monthly salary would be a kind of “advance (guaranteed) payment” for those qualities the employee possesses, but the variable part (including variable component) – to serve as the motivator to put those qualities and skills in place in the most effective way.
In order for the variable component to be motivational, it should constitute a significant proportion of the total motivating part of the remuneration package. As one possibility, the authors of this study propose that there should be a maximum amount of variable component set as 30% of the total monthly salary. Any smaller percentage could quite possibly be insufficient to fulfil the motivational task of variable component, whereas any larger percentage would effectively diminish the meaning of a monthly salary as such. In any practical implementation of the variable component and revision of the remuneration structure and level for all employees, it is suggested to commence with a start-up point of 5% to those employees, who currently are not recipients of additional
JournalEconMngmnt-makets.indd 86 20.12.2012 14:12:21

Ludmila Jevčuka, Kārlis Ketners 87
payments for higher quality of work. This value should then be reviewed, e.g., once a quarter, and remuneration for higher outputs would mean an increase in the variable component up to the maximum level. In the case of unsatisfactory performance the variable component could be decreased to zero, with further evaluation possibilities in an upward direction when there is an observed improvement of performance quality. In thus reforming the remuneration system and recalculating monthly salaries and variable components for every employee, it would be advisable to utilise the remuneration level and job output matrix (see Figure 3) already proposed by the authors.
In choosing the implementation of this proposed remunerations structure, the monthly salary range within one job position must be narrowed, because any volatility of remuneration being dependent on employee outputs would be best ensured by the variable component. In this way any potential double differentiation of remuneration would be prevented, not allowing for a situation that allows for any fluctuation both in monthly salary level (thus influencing the variable component in nominal terms) and the variable component itself as a percentage of the monthly salary. It would be necessary to formulate (preferably in the legislation) the criteria for the setting and revision of monthly salary and any variable components. It would not be advisable to set any limitation on the maximum portion for employees in an institution, who might be granted the maximum variable component. At the same time, the principals of these institutions must ensure that a situation does not arise in which almost all of the employees are recipients of the maximum variable component, as this would diminish the motivational aspect of the whole idea.
If this remuneration package alternative is implemented and the significance of the variable part is strengthened, then the role of the annual evaluation grading should be revised. Quite possibly, an evaluation result could be directly connected to a percentage of the variable component of a particular employee, considering certain percentage ranges of variable component for certain evaluation grades. One of possible proposals would be to grant a variable component of 20–30% of the monthly salary for grade ‘A’ evaluations, 10-20% for grade ‘B’ evaluations, and 0–10% for grade ‘C’. Alternatively, it would be possible to create overlapping ranges, for example ‘A’ – 15–30%, ‘B’ – 5–20%, ‘C’ – 0–15%. On the one hand, such a connection between the variable part and evaluation grade would not allow the employer to react hastily to any significant changes in performance of the employee during the year, but, on the other hand, this same interconnection would link the evaluation result directly with the variable part of the remuneration, and thus strengthen the meaning of the evaluation procedure.
Vacation allowances and possible monetary premiums would have the same significance, as described in the alternative scenario with a fixed remuneration package – i.e., they would be included in the general part of the remuneration package.
JournalEconMngmnt-makets.indd 87 20.12.2012 14:12:21

88 CREATING A MOTIVATIONAL REMUNERATION PACkaGE STRUCTURE ..
A remuneration package structure with variable component (VComp) would thus be expressed in the following way:
(3)
It is important to stress that, for any particular employee, the level of monthly salary in nominal terms within the concept of a fixed remuneration package would be equal to the sum of a monthly salary and variable component within the concept of the remuneration package with a dominant variable part. In practice, this would mean that, independently of implementation of one or another alternative, the employee’s total remuneration level, in nominal terms, would be equal, and thus the employee would be better off in both cases, assuming perfect re-calculation and re-evaluation of the different remuneration elements. The aforementioned remuneration package structures are illustrated in Figure 5 (below), in which a schematic comparison of both alternatives is shown. In both cases, the general part of the remuneration package includes health insurance, additional vacation, monetary premiums and a vacation allowance. In its turn, the structure of motivating part of both alternatives differs by the share of the variable parts – in the case of 5.a. it shows the variable component at 30% level plus evaluation bonus, but in 5.b. case – only as an evaluation bonus.
Evaluation bonus
Variable component
Monthlysalary
5.b. Fixed remunerationpackage structure
5.a. Remuneration packagestructure with variable component
Remunerationpackage
General part
Motivating part
Fixedpart
Variablepart
Variablepart
Fixedpart
Source: constructed by the authors
Fig. 5. Alternatives of Remuneration Package Structures
The introduction of a variable component to the remuneration structure would ensure a flexibility of total remuneration level for the employee, thus
JournalEconMngmnt-makets.indd 88 20.12.2012 14:12:21

Ludmila Jevčuka, Kārlis Ketners 89
strengthening the (intended) motivational role of remuneration. Employees might be stimulated to aspire to a higher variable part (or to the preserve the existing level) by combining and utilising their skills and knowledge in such a way as to achieve the best possible work results (outputs). The granting of variable components to all employees in the institution (although of different amounts) would ensure the principle of fairness (equity), because employees would then not be conditionally divided into two groups – those employees “with” and those “without” a variable component. Employees who might be granted at least the basic percentage of a variable component would thus have cause to believe that through improved effort they can earn more. A transformation through the stages from “low variable component” to “high variable component” is easier and more realistic than through the stages from “no variable component” to “with variable component” and managers, in their turn, would have an instrument on hand with which to be able to react operatively (and in proportion) to changes in employee performance and to ensure a link between remuneration level and job outputs.
The introduction of variable component would most probably result in a negative reaction from the community, possibly leading to a groundless impression that employees in the public sector would now be “overpaid”. In realising any systematic movement towards the strengthening of the variable part of a remuneration package, it would be necessary to engage in a significant informative and educational campaign so as to clarify the principles of setting certain remuneration elements and thus ensuring an observance of the transparency principle. It would be necessary to accentuate the fact that the variable part of the remuneration package is an integral part of the total remuneration structure, and that it is directly related to the evaluation and performance of the employee, and as such, does not possess any irregular, unlimited or uncontrollable aspects. In enacting any changes to the remuneration system it is no less important to ensure clarification and informative processes among employees, otherwise any reforms in this field could a priori instigate a negative reaction and consequent reduction in work motivation level (Ohtake F., 2004).
One of the possible drawbacks on the introduction of a variable component is its possible instability over the long term. In the event of any significant volatilities in the economy, the variable component would be the first remuneration element that would be placed under pressure by budget consolidation measures, which (however) would have absolutely no correlation with the contribution and outputs of employees. Therefore, the presence of a significant variable part in remuneration package might not seem all that attractive to potential job seekers in public administration, as it would not fulfil the need for long term stability.
Currently, the legislative base and new ideas of policy makers in the field of improvements to the remuneration system are conducive to the creation of an advantageous scenario for the strengthening of the variable part and for the development and inclusion of variable components into the remuneration
JournalEconMngmnt-makets.indd 89 20.12.2012 14:12:21

90 CREATING A MOTIVATIONAL REMUNERATION PACkaGE STRUCTURE ..
package structure. With respect to any practical implementation of this alternative, the risk exists that due to insufficiency of the financial resources, the variable component might not work as it is meant to, but may be granted only to certain parts of the government’s public administration system, thus not ensuring an introduction of the system at state level.
ConClUsIons
Within the scope of this study, the authors have analysed the financial elements of remuneration for employees of the Latvian public administration, defined different parts of the remuneration package, and proposed alternative remuneration package structures, in order to ensure its functionality and ability to motivate employees.1. Definitions for components of the remuneration package have been proposed.
Remuneration package can be divided into a general part and a motivating part, the latter being further divided into fixed part and variable part.
2. An analysis of the legislation presently in force reveals that, at the moment, the scope of the financial elements in the remuneration package has neither a clearly fixed nor a clearly variable nature in its classical meaning.
3. Two alternatives structures for a remuneration package have been proposed, namely, a fixed remuneration package structure and a remuneration package with significant proportion of variable part.
4. The implementation of a fixed remuneration package structure would ensure adherence to fairness and transparency principles, stability of the remuneration in the long term, and an overall improvement of the image of the public sector as a competitive and attractive employer. At the same time, the possibilities of flexible and operative adjustments of the remuneration level based on changes in employee outputs would be limited.
5. A remuneration structure with a significant proportion of variable part foresees the introduction of a variable component being granted to all employees within the institution and linking the level of variable component to annual evaluation. The implementation of this alternative would meet the fairness principle, and it would make it possible to provide a motivational impulse for the employee in the short term, and, to be able to adjust the remuneration level relative to any changes in work quality in a more effective way.
6. For the practical implementation of both alternatives and a recalculation of wage levels, the authors have proposed the utilisation of a remuneration level and employee job output level correlation matrix, thus ensuring an equilibrium position between remuneration and outputs, and an efficient exploitation of the available remuneration funds.
7. The implementation and maintenance of any proposed alternative would require additional financial resources. A combination of remuneration
JournalEconMngmnt-makets.indd 90 20.12.2012 14:12:21

Ludmila Jevčuka, Kārlis Ketners 91
elements would ensure motivational effect only if the total remuneration level of the employee would be competitive and would correspond to the beliefs of the employee concerning how s/he must be rewarded. At the same time, even with a sufficiency of financial resources, remuneration elements must be combined into any remuneration package wisely, so that as it is transformed through the values scale of every individual employee, it would be directly oriented towards the achievement of high job results, thus exploiting the available wage funds in a most effective manner.
8. In order to choose and implement the most successive remuneration structure and to fulfil the remuneration valuability principle, it would be necessary to perform a systematic and comprehensive study among public sector employees in order to identify the most acceptable remuneration package structure, which could then most effectively influence the motivation level of employees and ensure work contribution to its best quality.Financial remuneration is considered to be one of the most powerful
motivators, but the recognition and improvement of other important motivational factors could have a complex positive impact on the general motivation level within an organisation. There exist a set of motivators that do not require the involvement of financial resources, and the potential for exploitation of such motivators should not be underestimated. Even a financially well-remunerated employee may suffer loss of self-confidence, experience dissatisfaction and demotivation in his workplace if s/he systematically does not receive personal recognition and positive feedback for qualitative work, and, sooner or later s/he will commence the search for new employment possibilities.
“Pay people well, pay them fairly,
and then do everything possible to help them forget about money.”
/A. Kohn/
bibliographyAdams, J. S., 1965. Inequity in Social Exchange. In: L. Berkowitz (Ed.) Advances in
Experimental Social Psychology, vol. 2. New York: Academic Press, pp 267-299.Burgess, S., Metcalfe, P., 1999. The Use of Incentive Schemes in the Public and Private
Sectors: Evidence from British Establishments [online]. CMPO Working Paper Series No. 00/15. Available at: <http://www.bristol.ac.uk/cmpo/ publications/papers/1999/cmpo/publications/papers/1999/wp15.pdf> [Accessed 12 April 2012].
Burgess, S., Ratto, M., 2003. The Role of Incentives in the Public Sector: Issues and Evidence [online]. CMPO Working Paper Series No. 03/071. Available at: <http://www.bris.ac.uk/cmpo/publications/papers/2003/wp71.pdf> [Accessed 12 June 2012].
Cabinet of Ministers of the Republic of Latvia, 2001. Ierēdņa darbības un tās rezultātu novērtēšanas kārtība [online]. Rīga: Cabinet of Ministers 13 February 2001 Instruction Nr. 2. Available at: <http://www.likumi.lv/ doc.php?id=3496> [Accessed 23 June 2012].
JournalEconMngmnt-makets.indd 91 20.12.2012 14:12:21
92 CREATING A MOTIVATIONAL REMUNERATION PACkaGE STRUCTURE ..
Cabinet of Ministers of the Republic of Latvia, 2005. Noteikumi par budžetu izdevumu klasifikāciju atbilstoši ekonomiskajām kategorijām [online]. Rīga: Cabinet of Ministers 27 December 2005 Regulation Nr. 1031. Available at: <http://www.likumi.lv/doc.php?id=124833> [Accessed 12 March 2012].
Cabinet of Ministers of the Republic of Latvia, 2006. Darba samaksas paaugstināšanas plāns 2007.–2011. gadam [online]. Rīga: Cabinet of Ministers 23 May 2006 decision Nr. 42. Available at: <http://polsis.mk.gov.lv/view.do?id=1982> [Accessed 7 March 2012].
Cabinet of Ministers of the Republic of Latvia, 2009. Noteikumi par valsts un pašvaldību institūciju amatpersonu un darbinieku darba samaksu, kvalifikācijas pakāpēm un to noteikšanas kārtību [online]. Rīga: Cabinet of Ministers 22 December 2009 Regulation Nr. 1651. Available at: <http://www.likumi.lv/doc.php?id=203051> [Accessed 15 August 2012].
Dixit, A., 2002. Incentives and Organizations in the Public Sector [online]. The Journal of Human Resources, Nr. 37, pp. 696.-727. Available at: <http://www.unc.edu/~shanda/courses/plcy289/Dixit_JHR_incentives.pdf> [Accessed 3 April 2012].
Francois, P., 2000. Public Service Motivation as an Argument for Government Provision [online]. Journal of Public Economics, Nr. 78, pp. 275-299. Available at: <http://localgov.fsu.edu/readings_papers/Service Delivery/Francois_Public_Service_Motivation.pdf> [Accessed 31 March 2012].
Jaunzeme, K., 2012. Valsts pārvaldē strādājošo motivācija. Jurista Vārds, Nr. 22 (721), 29/05/2012. pp. 6-12.
Jevčuka, L., 2010. Motivācijas jēdziens un darba motivāciju veicinošo faktoru noteikšana valsts pārvaldē. Latvijas Universitātes Raksti, vol. 758 Ekonomika. Vadības zinātne, pp. 46-59.
Jevčuka, L., Ketners, K., 2010. Atlīdzības valsts pārvaldē kā motivatora regulējums – attīstība un nākotnes perspektīvas. Rīgas Tehniskās universitātes Zinātniskie raksti, Series „Ekonomika un uzņēmējdarbība”, vol. 20, pp.72-80.
Keršule, L., 2011. Darbinieku vadīšana un motivēšana ekonomiskās lejupslīdes apstākļos Latvijā. Latvijas Universitātes Raksti, vol. 766. Ekonomika. Vadības zinātne, pp. 212-226.
Kiragu, K., Mukandala, R. 2005. Public Sector Pay Policies [online]. Price water-houseCoopers, Draft for Discussion and Comments at the Dissemination Workshop. Available at: <http://www.gsdrc.org/docs/open/SD30.pdf> [Accessed 29 may 2012].
Купров, М., 2000. Организация оплаты труда в условиях экономической неопреде-ленности [online]. Диссертация на соискание ученой степени кандидата эко-номических наук. Москва: Московский государственный университет, pp.162. Available at: <http://www.dissercat.com/content/organizatsiya-oplaty-truda-v-usloviyakh-ekonomicheskoi-neopredelennosti> [Accessed 14 March 2012].
The Law On Remuneration of Officials and Employees of the State and Self-government Authorities, 2009 [online]. Law 01.12.2009. Rīga: Saeima of the Republic of Latvia. Available at: <http://www.likumi.lv/doc.php?id=202273> [Accessed 3 August 2012].
Леппик, А., 2005. Компенсационные механизмы стимулирования персонала в органи-зациях [online]. Диссертация на соискание ученой степени кандидата социо-логических наук. Москва: Московский государственный университет. pp. 134. Available at: <http://www.dissercat.com/content/kompensatsionnye-mekhaniz-my-stimulirovaniya-personala-v-organizatsiyakh> [Accessed 14 March 2012].
JournalEconMngmnt-makets.indd 92 20.12.2012 14:12:21

Ludmila Jevčuka, Kārlis Ketners 93
Ministry of Finance of the Republic of Latvia, 2012 (1). Finanšu ministrijas darbības stratēģija 2012.–2014. gadam [online]. Rīga: Ministry of Finance. Available at: <http://www.fm.gov.lv/lv/finansu_ministrija/strategija_2012__2014__gadam/> [Accessed 20 August 2012].
Ministry of Finance of the Republic of Latvia, 2012 (2). Informatīvais ziņojums par atalgojuma izmaiņām sabiedriskajā un privātajā sektorā 2012. gada 1. ceturksnī [online]. Rīga; Ministry of Finance. Available at: <http://www.fm.gov.lv/files/valstsparvaldesdarbasamaksaspolitika/FMzin_28062012.pdf> [Accessed 3 August 2012].
Ministry of Finance of the Republic of Latvia, 2012 (3). Salīdzinošais pētījums par atalgojuma apjomu. 1. un 2. nodevums [online]. Rīga: Ministry of Finance. Available at: <http://www.fm.gov.lv/lv/sadalas/valsts_parvaldes_darba_samaksas_politika/> [Accessed 26 July 2012].
Ohtake, F., Karato, K., 2004. Performance Based Wage System and Motivation to Work [online]. International Forum for ESRI Collaboration Projects, pp. 32-67. Available at: <http://www.esri.go.jp/jp/prj-2004_2005/macro/macro16/08-2-R.pdf> [Accessed 12 June 2012].
Organisation for Economic Co-operation and Development, 2005. Modernising Government: the Way Forward [online]. OECD. Available at: <http://browse.oecdbookshop.org/oecd/pdfs/product/4205131e.pdf> [Accessed 29 May 2012].
Ozoliņa-Ozola, I., 2011. Cilvēku resursu vadīšanas efektivitātes novērtēšanas problēmas. Rīgas Tehniskās universitātes Zinātniskie raksti, Series „Ekonomika un uzņēmējdarbība”, vol. 21, pp. 67-75.
Pinto, E. P. 2011. The Influence of Wage on Motivation and Satisfaction [online]. International Business and Economics Research Journal, Nr. 9, vol. 10, pp. 81-93. Available at: <http://journals.cluteonline.com/index.php/IBER/article/view/5629> [Accessed 29 May 2012].
The State Chancellery of the Republic of Latvia, 2005. Ierēdņu sociālpsiholoģiskais profils un motivācija. Pētījuma 3. posma ziņojums [online]. Rīga: State Chancellery. Available at: <http://petijumi.mk.gov.lv/ui/default.aspx> [Accessed 18 May 2012].
Steers, R. M., Porter, L. W., Bigley. G. A., 1996. Motivation and Leadership at Work. USA: McGraw-Hill, pp. 766.
United Nations Development Programme, 2006. Incentive systems: Incentives, Motivation and Development Performance [online]. United Nations Development Programme Capacity Development Resource, Conference paper. Available at: <http://www.unpcdc.org/media/20669/incentive-systems-cp8%5B1%5D.pdf> [Accessed 22 March 2012].
JournalEconMngmnt-makets.indd 93 20.12.2012 14:12:21

eConoMIC ClIMaTe anD DeVeloPMenT CHallenGes
foR laTVIa anD eU CoUnTRIes
GUnDaRs kaUPIns*Department of Management, boise state University, Usa
elena DUbRA, DaIRA baRAnoVafaculty of economics and Management, University of latvia
Abstract. This paper concentrates on the economic climate of EU countries in the context of integration and globalisation. The aim of this study is to analyse the (comparative) economic climate in the Baltic and other leading EU countries. The main emphasis is on the economies of the three Baltic states. The strategic goals of the EU and of Latvia are discussed as well as are the development challenges and models for Latvia. The research methodology utilised is based on macro-economic theory. This paper provides information about various different indexes and the main results and conclusions reflect the overall situation in EU countries but especially in Latvia.
Key words: globalisation, economic climate, economic strategies, indexes, develop-ment challenges.
JEL code: E20, E66, O11
InTRoDUCTIon
Globalisation has been defined as the increasingly free flow of ideas, people, goods, services, and capital that all leads to the integration of economies and societies and has thus become a major force for global change. It has also added to the number of channels through which shocks can be transmitted across borders more quickly (Nallari, 2009, p. 5). The strategic goals of the EU and Latvia are also discussed in this paper.
In accord with macro-economic theory, it is important to distinguish between Policy Variables (or instruments of fiscal and monetary policy), External Variables (or variables outside the macro-economic system and international trade) and Induced Variables (e.g.: output, inflation, unemployment). This paper investigates all three categories of variable factors. Policy Variables and External Variables are inputs that affect the economy, whereas Induced Variables are outputs produced by the economy. A major focus in this study is devoted to Economic Climate analysis in the EU countries.
eConoMIC ClIMaTe anD DeVeloPMenT CHallenGes foR laTVIa anD eU CoUnTRIes
GUNDARS kaUPINS, ELENA DUBra, DAIra BAraNOVA
Journal of Economics and Management Research Vol. 1, 2012: 94–105
* Corresponding author. E-mail: [email protected]
JournalEconMngmnt-makets.indd 94 20.12.2012 14:12:22

Gundars Kaupins, Elena Dubra, Daira Baranova 95
The methodology of Economic Climate as an indicator is based on a survey questionnaire involving 121 countries and 1101 experts (undertaken in April 2012).1 The information collected on economic climate is a useful instrument in that it reveals economic changes earlier than do business statistics. A lack of confidence in the economic policies of their own country is the current most serious economic concern in addition to the broader problems resultant of general government budget deficits, unemployment, inflation, monetary and fiscal policy and free trade policy.
This discussion in this paper consists of three parts:1. Economic climate in Latvia and EU countries.2. EU 2020 goals and the strategy of Latvia3. Stages in the economic development of Latvia.The analysis of the stages in the economic development of Latvia is based on
a study of strategic documents and on a variety of indexes such as, for example, The Index of Globalisation, The Human Development Index and The Doing Business Index.
Conclusions and recommendations are proposed at the end of the paper.
1. THe eConoMIC ClIMaTe In laTVIa anD oTHeR eU CoUnTRIes
Economic Climate has been defined (Rutherford, 1995, p.134) as that which is represented by the persisting state of an economy apparent in its general trends over a specific time period.
According to the business dictionary (http://www.businessdictionary.com), economic climate has been seen to differ where it provides a general characterisation of the overall mood of the global economy or of a regional economy, which is reflected by:
• thestatusofthestockmarket.• aperceptionoftheeconomybyconsumers.• theavailabilityofjobsandcredit.• the statusofbusinessdecisions suchashiring,borrowing, lending, and
investment in new initiatives. CESifo (the Center for Economic Studies) has undertaken a study of
economic climate as a joint initiative of the University of Munich Centre
1 The individual replies are combined for each country without weighting. The grading procedure con-sists in giving a grade of 9 to positive replies (+), a grade of 5 to indifferent replies (=) and a grade of 1 to negative (-) replies. Overall grades within the range of 5 to 9 indicate that positive answers prevail or that a majority experts trends to increase, whereas grades with the range of 1 to 5 reveal predominantly negative replies or expectations of decreasing trends (Ifo institute, 2012, p. 2).
JournalEconMngmnt-makets.indd 95 20.12.2012 14:12:22

96 ECONOMIC CLIMATE AND DEVELOPMENT CHALLENGES FOR LATVIA AND EU COUNTRIES
for Economic Studies and the Ifo Institute2. A survey was conducted in co-operation with the International Chamber of Commerce in Paris. Methodology employed by CESifo3 includes a survey questionnaire that focuses on qualitative information on the assessment of a country’s general economic situation and expectations regarding key economic indicators. The survey results have been published in the form of aggregated data with the procedure involved being based on country classifications. Within each group or region, the individual country results are weighted according to the share of that specific country’s exports and imports relative to total world trade (Ifo institute, 2012, p. 2).
The WES results provide a rapid and up-to-date assessment of the economic situation prevailing around the world. The Ifo World Economic Climate Indicator showed a slight upturn in the first quarter of 2012 after two successive decreases, but at 82.4 it remains significantly below the long term average4 (1996–2011: 96.7) of the world economy. The improvement was entirely driven by a slightly more optimistic six-month outlook. The survey results confirm that the situation of the world economy remains difficult, despite first signs of stabilisation. The economic climate indicator for Western Europe barely moved up and remained at 82.2, which is considerably below its long-term average of 105.7 during the period 1996–2011 (Ifo institute, 2012, p. 3-10). The economic outlook for the next six-month period is slightly less negative, but remains cautions. According to the WES experts, Western Europe expects an increase in economic performance in 2012 (Table 1).
Table 1 Economic Climate Index (base year: 2005=100)
Quarter/year
II/ 2010
III/ 2010
IV/ 2010
I/ 2011
II/ 2011
III/ 2011
IV/ 2011
I/ 2012
II/ 2012
World Economy 104.1 103.2 98.6 106.8 107.7 97.7 78.7 82.4 95.0
Western Europe 99.3 102.2 105.2 113.2 115.1 105.2 81.4 82.4 99.3
Source: author’s construction based on Ifo institute, 2nd quarter 2012, p.1, 3.
According to WES experts, Germany and Estonia were the only two countries for which the current economic situation was assessed as “good” in the first quarter of 2012. Private consumption is the particular main driving force behind Germany’s economy.
2 The Ifo Institute is one of the largest economics studies institutes in Germany and has a three-fold ori-entation: to conduct economic research, to advise economic policy makers and to provide services for research and business communities.
3 CESifo is the name under which the international service products and research results of Center for Economic Studies within the Department of Economics of Ludwig Maximilian University and Ifo Insti-tute are published.
4 The Arithmetic mean of judgment about the present and expected economic situation.
JournalEconMngmnt-makets.indd 96 20.12.2012 14:12:22
Gundars Kaupins, Elena Dubra, Daira Baranova 97
In Finland, Luxembourg, Malta and Slovakia the present economic situation has been rated as “satisfactory”. Outside of the euro area the economic situation is currently favourable in Norway, and to a slightly lesser degree, in both Switzerland and Sweden. In the latter two countries capital expenditure and private consumption are expected to slow down somewhat. The economic climate indicator in Eastern Europe remains at a low level. In Poland, the present economic situation remains favourable. According to the WES experts it is also satisfactory in the Czech Republic and in Lithuania. The Czech Republic is pessimistic about future developments due to the low levels of private consumption. In Bulgaria, Latvia and Romania the current situation is regarded as unfavourable and is expected to remain so over the next six-month period.
According to the compound number of macro-economic activity, which is calculated by the Ministry of Finance of the Republic of Latvia and based on operative data, the February growth rate was 7%, which is lower than it was in January of 2012, but the average results for the first quarter of 2012 will be the same as for the previous quarter (Ministry of Finance, 2012). This means that the results are similar to the economic climate indicator from the quarterly survey on business cycle developments and other economic factors.
The Latvian economy continued to grow in 2012 (at a rate of 3.5%) but the GDP growth will be lower than in 2011 (5.5%). This declaration is primarily influenced by external risks on the downside (Bank of Latvia, 2012, p. 34).
According to macro-economic theory, Policy Variables and External Variables are the factors that drive the economy, producing Induced Variables.
Other characteristics of macro-economic consequences include: Endogenous Variables and Exogenous Variables for the short-term and in the long-term.
Short-term macro-economic relations are reflected by:• Endogenous variables – gross domestic product (GDP), foreign trade
balance, employment and profitability of capital;• Exogenous variables – capital flow, technological changes in primary
production factors, real wages, private consumption, government expenditures and investment.
Long-term macro-economic relations are reflected by:• Endogenous variables – capital flows, real wage, private consumption,
government expenditures, investment and GDP.• Exogenousvariables – the profitability of capital, technological changes in
primary production factors, employment and foreign trade balance. We can thus sketch out what it is that drives much of the macro-economic
policy-making in the 21st century:• Inflation;• Monetarypolicy;
JournalEconMngmnt-makets.indd 97 20.12.2012 14:12:22

98 ECONOMIC CLIMATE AND DEVELOPMENT CHALLENGES FOR LATVIA AND EU COUNTRIES
• Fiscalpolicy;• Policyforexchangerates;• Freetradepolicy.The information on Endogenous Variables and on Exogenous Variables
should be taken into account in the setting of goals for the short-term, for the medium-term and in the long-term, and as well as in macro-economic modelling some aspects of which will be discussed in next sections of this paper.
2. eU 2020 Goals anD THe sTRATeGy foR laTVIa
The European Union will face the challenge in the long-term of making its currency bloc competitive and then the benefits of lower capital costs should eventually bring with it a lower rate of unemployment and a more sustainable, non-inflationary growth.
EU long-term goals have been set in the strategy document EU 2020.There are five EU-level targets to be achieved by 2020 (Ministry of
Economics, December 2010, p. 82):1. 75% of the population aged 20–64 should be employed.2. 3% of the GDP should be invested in R&D.3. Greenhouse gas emission must be reduced by 20% compared to 1990, and
to increase the share of renewable energy resources in energy consumption to 20% with an increase of energy efficiency by 20%.
4. The rate of early school-leavers should be less than 10% and at least 40% of the younger generation (aged 30–34 years) should have a tertiary degree.
5. 20 million fewer people should be at risk of poverty.The official Communiqué of the European Commission proposes that
economic, social and territorial cohesion will remain at the heart of the EU 2020 strategy.
On 3 March 2010 the European Commission published the communiqué Europe 2020: A Strategy for Smart, Sustainable and Inclusive Growth. In its communication the European Commission indicates that economic, social and territorial cohesion will remain at the heart of the EU 2020 strategy. The EU 2020 Strategy and Integrated Guidelines and EU member states agreed with the European Commission that EU member states must all work to develop national reform programmes.
Figure 1 (below) reflects EU national level comparisons. On the basis of these EU level targets Latvia has set its national level targets and identified the main challenges/obstacles. On 16 November 2010 the Cabinet of Ministers approved the Draft National Reform Programme of Latvia for Implementation of the EU 2020 Strategy.
JournalEconMngmnt-makets.indd 98 20.12.2012 14:12:22

Gundars Kaupins, Elena Dubra, Daira Baranova 99
EU 2020 Strategy Headline Targets for Growth and Jobs
National level
Macro-structural challenges/ bottlenecks
Quantitative targets for 2020
EU level Integrated Guidelines
National Reform
Programme
Macro-level policy and measures
to tackle macro-structural challenges/
bottlenecks
Macroeconomic conditions
for successful achievement of the quantitative targets
Micro-level reforms and policy for achieving the
quantitative targets
Source: Ministry of Economics, 2010. Economic Development of Latvia, Report December 2010, Riga p.85
Fig. 1. Interaction of EU and Latvian National Levels in the Implementation of the EU 2020 Strategy
The National Reform Programme of Latvia identifies the following macro-economic bottlenecks in the national economy of Latvia (Ministry of Economics December, 2010, p. 85):
• Reducingthehighgeneralgovernmentstructuraldeficit;• Ensuring awell-functioning and stable financial sector in the economy
towards the tradable sectors and raising productivity levels;• Avoidinghighunemployment frombecomingstructuralandensuringa
better matching in the labour market;• Addressingtheweaknessinthebusinessenvironment,ensuringefficient
use of EU structural funds and adequate access to finance for companies with a view to favouring productive investment.
Quantitative targets for Latvia have also been set, taking into account the medium-term development scenario of the economy of Latvia and the goals of the Sustainable Development Strategy for Latvia – Latvia 2030. Targets for Latvia, which should have been reached by 2020 (Ministry of Economics December, 2010, p. 85):
1. Employment level 73%.2. R&D of 1.5% of GDP.3. To increase the share of renewable energy resources in gross energy
consumption to 40%.4. To lower the share of school dropouts to 13.4%, to increase the share of
persons having obtained a tertiary education to 34–36%.5. To reduce the rate of people at risk of poverty to 21%.
JournalEconMngmnt-makets.indd 99 20.12.2012 14:12:22
100 ECONOMIC CLIMATE AND DEVELOPMENT CHALLENGES FOR LATVIA AND EU COUNTRIES
The achievement of these quantitative targets depend, of course, on Endogenous and Exogenous variables, as well as on the economic development model for Latvia.
3. sTaGes In THe eConoMIC DeVeloPMenT of laTVIa
The growth process triggers an important evolutionary change in the structure of the economy.
There is a large ongoing debate about the sources of this growth. Clearly, economists do not have all the answers to the complex question on what exactly determines growth. They have, nevertheless, made some progress in identifying some key factors. The Nobel laureate Robert Solow of MIT developed an accounting framework for measuring the main factors in economic growth. It is the so-called Solow Residual, which has been at the centre of the measuring of growth and productivity. Economists interpret the Solow Residual as that part of economic growth due to technical/technological progress. As in Solow’s original study, Edward Denison of the Brookings Institute discovered that capital deepening, i.e., the increase of capital per unit of labour played only a small role in overall growth. Denison shows most convincingly that education level plays a major quantitative factor in the rise of output per worker. This points to the importance of investment in human capital as a source of growth. (Sachs, Larrain, 1993, p. 552–558).
The Harrod-Domar growth model introduces three separate concepts for growth in an economy (Beynon, 2001, p. 223):
• Naturalgrowthistherateatwhichaneconomywillneedtogrowtoensurefull employment, and is a function of the growth in the working population and technological progress which brings about higher productivity;
• Warrantedgrowthistherateatwhichinvestmentwillgrow,andthatwilldepend on the rate of savings and the capital-output ratio;
• Actualgrowthisthegrowthlevel,whichhappensinreality.In analysing the various factors and stages in the economic development of
Latvia, there are three stages that have taken place since Latvia joined the EU (see Figure 2). There was a stage of economic development during the period 2004–2007, in which, due to the inflow of foreign capital, the domestic demand had grown rapidly.
This rapid growth for several years with an average annual increase in the GDP of Latvia at a rate of 11% happened over the period 2005–2007. The considerable increase in domestic demand was the main growth stimulus. The result of this led to an internal and external imbalance. In 2008 a recession started in the economy of Latvia as a result of the global financial crisis. In 2008–2009 the GDP decreased by 21.4% (Ministry of Economics December, 2010, p. 9). Since 2010 the economic recession has stopped. An improvement of the economic
JournalEconMngmnt-makets.indd 100 20.12.2012 14:12:22

Gundars Kaupins, Elena Dubra, Daira Baranova 101
situation is being determined by external demand, that is, by an increase in export volumes and in the growth of tradable sectors. To reach the goals identified in the previous section of this paper which suggests that economic development is based on knowledge and innovation, on the efficient use of resources and on a high level of employment thus ensuring economic, social and territorial cohesion for Latvia. This means that the stage of economic development must transform into a sustainable economic model, in which the main driving force is export and a long-term economic policy of transition from being a labour-intensive to becoming a knowledge-based economy. The economic implications of the current wave of information technology are changing the ways in which we look at growth.
2004–2007 Growth stimulus – domestic demand
2008–2009 Impact of
the global financial crisis
2010–2015 Growth stimulus –
external demand
Substantial inflow of capital
Growing domestic demand
Rapid growth
Inflow of foreign capital decreases in Latvia
Balancing of the current account
Domestic demand decreases
External demand decreases
Global financial system recovery
External demand increases
Latvian exports growDomestic demand
increases
Emerging risks:• Internal imbalance• External imbalance
GDP decreases GDP increases
Source: Ministry of Economics, 2010. Economic Development of Latvia, Report June 2010, Riga
Fig. 2. Stages in the Economic Development of Latvia
Three indexes have been utilised in this paper so as to analyse the present and future development prospects in selected countries:
• TheKOFIndexofGlobalisation;• TheHumanDevelopmentIndex;• TheDoingBusinessIndex.The KOF Index of Globalisation measures the economic, social and political
dimensions of globalisation (see Table 2 below). Latvia’s ranking was 37 in 2010 (in 2007 – 52). The KOF Globalisation Index’s ranking for 2010 is based on the data from 2007 (KOF Index of Globalisation in 2007 based on data for 2004). The pace of economic and social globalisation decelerated in 2009. At the head of the KOF Index of Globalisation in 2012 are Belgium, Ireland, Austria, the Netherlands, Australia and Singapore, while Equatorial Guinea, Kiribati and Timor – Lesotho are at the lower end of the ranking (The KOF Index of
JournalEconMngmnt-makets.indd 101 20.12.2012 14:12:22

102 ECONOMIC CLIMATE AND DEVELOPMENT CHALLENGES FOR LATVIA AND EU COUNTRIES
Globalisation, 2012). KOF Globalisation Index’s ranking for 2012 is based on the collected data from 2009.
Table 2 The KOF Index of Globalisation, The Human Development Index and The Doing
Business Index
Country KOF Index of Globalisation,
Index and (rank) in 2012
Human Development Index,
Index and (rank) in 2011
Doing Business Index,Rank in 2012 and
(2011)Estonia 79.34 (26) 0.835 (34) 24 (17)Latvia 66.27 (50) 0.805 (43) 21 (24)Lithuania 66.56 (48) 0.810 (40) 27 (23)Germany 81.53 (22) 0.905 (9) 19 (22)France 84.12 (18) 0.884 (20) 29 (26)UK 85.54 (14) 0.863 (28) 7 (4)
Source: author’s construction based on the KOF Index of Globalisation, 2012, the Human Development Index, 2011, and the Doing Business Index, 2012, 2011.
The annual United Nations measure of progress in human well-being, the Human Development Index (HDI) is a comparative measure of life expectancy, literacy, education and standards of living. The UN Development Programme began using a new methodology in the calculating the HDI and with 2011 the HDI combines these three dimensions:
• Alongandhealthylife:LifeExpectancyIndex.• EducationIndex:Meanyearsofschoolingandexpectedyearsofschooling.• Adecentstandardofliving:GNIpercapita(PPPUS$),IncomeIndex.According to the UNDP HDI the 2011 rankings placed Norway, Australia,
the Netherlands, the United States and New Zealand at the top while the Democratic Republic of the Congo, Nigeria and Burundi were at the bottom. Latvia’s ranking was 43.
The Doing Business Index (DBI) is an index created by the World Bank and is based on the study of laws and regulations. The DBI ranks economies on a scale from 1 to 183. The ranking for each economy is calculated as the simple average of percentile rankings for each of the 10 topics included in the DBI 2012: starting a business, dealing with construction permits, registering property, getting credit, protecting investors, paying taxes, trading across boarders, enforcing contracts, resolving insolvency and, with a new topic this year – the getting of access to electricity (The World Bank group, 2012). Latvia jumped from 24th place in 2011 to 21st in 2012 due to its reforms. Estonia fell from a 17th place ranking in 2011 to 24th place in 2012, and Lithuania fell from 23rd place to 27th. At the top in 2011 and also in 2012 were/are Singapore, Hong Kong and New Zealand while the Central African Republic and Chad are at the bottom of the scale.
JournalEconMngmnt-makets.indd 102 20.12.2012 14:12:22
Gundars Kaupins, Elena Dubra, Daira Baranova 103
According to World Economic Outlook, 2012 the global recovery is being threatened by intensifying strains within the Euro area and fragilities elsewhere. Financial conditions have deteriorated, growth prospects have dimmed, and downside risks have escalated. Global output is projected to expand by 3¼% in 2012.
ConClUsIons anD ReCoMMenDaTIons
1. The development of the Economic Climate Indicator was different in the world’s various regions. WES showed a slight upturn in the first quarter of 2012. The survey results confirm that the situation of the world economy remains difficult, despite first signs of stabilisation.
2. The Economic Climate Indicator has continued to rise and is now slightly below its long-term average and WES experts predict an increase in economic performance.
3. In comparison to its neighbouring countries, Latvia has outpaced both Lithuania and Estonia for the first time in the Doing Business Indicator ranking. Estonia has lost its position by 7 places and Lithuania by 4 places in 2012.
4. Targets for Latvia, which have been set for 2020: employment level 73%, R&D of 1.5% of GDP, an increase in the share of renewable energy resources and gross energy consumption to 40%, to lessen the share of school drop-outs to 13.4%, to increase the percentage of persons having obtained a tertiary education to 34–36% and to reduce the share of people at poverty risk down to 21%.
5. The national development of the economy of Latvia is to take place within the framework of EU strategies and regulatory acts, the economic strategies and legislation of Latvia as well as within the Eurostat forecasts on the economic development of Latvia and demographic forecasts for Latvia. The main problems in the area of the development of the economy that have been identified in the strategic and policy planning documents on the development of national economy of the Republic of Latvia are basically in line with the legislation and policy planning documents of the EU.
6. The formulation and compliance with integrated guidelines that tie together issues of the development of national economics at the macro-economic level and the micro-economic level and issues of employment policy can prevent these discrepancies. The EU national economies strategies have all been related to the influence of several internal and external factors. Latvia’s participation in the EU integration process can serve to guarantee political stability and a sufficiently consistent implementation of the economic and social strategies and programmes.
7. The development processes presently underway in the economy of Latvia comply, to a large extent, with the guidelines of strategic documents on the
JournalEconMngmnt-makets.indd 103 20.12.2012 14:12:22
104 ECONOMIC CLIMATE AND DEVELOPMENT CHALLENGES FOR LATVIA AND EU COUNTRIES
development of the national economy and employment in the country, thus reflecting the goals and tasks defined by EU 2020 in the areas of competition and employment.
8. The development problems must be addressed towards a more efficient restructuring of sectors of national economies, that would promote a more rapid development of sectors with a higher value added as well as the question of developing a more flexible and balanced labour market, taking into account the actual demographic situation of the community and national economies competitiveness in the EU and world markets.
9. Taking into account the actual problems and situation/circumstances in the EU and other world countries, it is important for the Latvian economy to ensure that as many economically active inhabitants/residents as possible are employed in competitive sectors of a national economy adjusted to the open market and in companies producing goods with a high value added, and as well, to use modern information technologies in their work.
10. National economies will need to recognise that a labour market and lower corporate taxes are the only competitive tools if they want to attract new capital – which, in the longer term, is the key to lower unemployment. In the short-term this means that a restructuring of the EU economy will continue with the innovative sector share increase into GDP.
bibliography Bank of Latvia, 2012. Macro-economic Developments Report, Nr. 9 [pdf]. Available
at: <http://www.bank.lv> [Accessed 16 April 2012]. Beynon, R., 2001. The Routledge Companion to Global Economics. London and New
York: Routledge.Economic Climate [online]. Available at: <http://www.businessdictionary.com/
definition/economic-climate.htlm1#ixzzlro14eaHS> [Accessed 10 April 2012].Nallari, R., 2009. Growing Out of Crisis. Development Outreach. Volume 11, Nr. 3,
December 2009: World Bank Institute.Ifo institute, CESifo World Economic Survey, A Quarterly Publication on the World
Economic Climate [pdf]. Available at: <http://www.cesifo-group.de/fbo/login-e/D2A27DD3EBF4F19EC39C3E344FF60A131BA6DB78C21B751F> [Accessed 10 April 2012].
Ifo institute, CESifo World Economic Survey, of the 4th Quarter of 2011. Press release in co-operation with the International Chamber of Commerce, Paris [pdf]. Available at: <http://www.cesifo-group.de/fbo/login-e/D2A27DD3EBF4F19 EC39C3E344FF60A131BA6DB78C21B751F> [Accessed 10 April 2012].
Ifo institute, CESifo World Economic Survey, of the 2nd Quarter of 2012. Press release in co-operation with the International Chamber of Commerce, Paris [pdf]. Available at: <http://www.cesifo-group.de/fbo/login-e/D2A27DD3EBF4F19E C39C3E344FF60A131BA6DB78C21B751F> [Accessed 16 April 2012].
Ministry of Economics, Economic Development of Latvia, Report December 2010, Rīga: Ministry of Economics of the Republic of Latvia.
Ministry of Economics, Economic Development of Latvia “Europe 2020” Strategy. PPT presentation June 7, 2010, Riga: Ministry of Economics of Republic of Latvia.
JournalEconMngmnt-makets.indd 104 20.12.2012 14:12:22

Gundars Kaupins, Elena Dubra, Daira Baranova 105
Rutherford, D., 1995. Routledge Dictionary of Economics. London and New York.Sachs, J. D., Larrain, F. B., 1993. Macro-economics in the Global Economy. New York:
Harvester Wheatsheaf.The World Bank group, 2012. Doing Business in a More Transparent World [online].
Available at: <http://www.doingbusiness.org/~/media/FPDKH/DoingBusiness/ Annual-Reports/English/DB12-chapters/Ease-of-doing-business.pdf> [Accessed 17 April 2012]
The World Bank group. Ease of Doing Business and distance to Frontier [pdf]. Available at: <http://www.doingbusiness.org/reports> [Accessed 17 April 2012]
United Nations, 2011 Human Development Index [online]. Available at: <http://www.un.org/en/statistics/hdi> [Accessed 17 April 2012].
World Economic Outlook Update [online]. Available at: <http://www.imf.org/extend/pwbs/ft/weo/2012/update/01/idexhtm> [Accessed 16 April 2012].
JournalEconMngmnt-makets.indd 105 20.12.2012 14:12:22

MeasURInG THe soURCes of eConoMIC GRowTH In THe eU
wITH PaRAMeTRIC anD non-PaRAMeTRIC MeTHoDs
oļeGs KRAsnoPJoRoVs*1
University of latvia
Abstract. The standard neoclassical growth accounting (parametric) framework serves to explain only a minor part of labour productivity growth and its cross-country differences, thus implying an important role (as yet unexplained) for the Solow Residual or the Total Factor Productivity (TFP). However, the increased application of non-parametric methods in growth accounting, and in particular with Data Envelopment Analysis (DEA), has revealed that, along with the direct effect on output, a higher capital stock will have a substantial indirect effect that has been disregarded by the neoclassical framework. In line with an appropriate technology model (Basu, Weil, 1998), a higher capital stock allows a country to use a better technology. This paper extends the evidence regarding the relevance of an appropriate technology view to those Eastern European countries that were not previously included in a growth accounting investigation using non-parametric methods. It also reveals that the appropriate technology view is useful in explaining labour productivity growth and its cross-country differences within the EU. Furthermore, the results are robustly subject to assumptions on capital formation and on whether labour productivity has been adjusted with regard to the cross-country differences in employment structure by the various sectors and by natural resource endowment. Given both the direct and indirect effects of capital accumulation, it might prove to be a much more important tool for determining labour productivity growth than is usually considered within a neoclassical framework.
Key words: growth accounting, Data Envelopment Analysis, efficiency, appropriate technology, total factor productivity.
JEL code: C14, D24, E22, O33, O47.
* Corresponding author. E-mail: [email protected]; [email protected]. I thank my research supervisor prof. Ismena Revina (University of Latvia), two anonymous referees, Dr. Konstantins Benkovskis, participants of the International Conference for Doctoral Students “Current Issues in Economic and Management Sciences” (University of Latvia, Riga, November 10-12, 2011), as well as participants of the central bankers course “Advanced Topics in Empirical Macroeconometrics” at Study Center Gerzensee (Gerzensee, Switzerland, February 6-17, 2012), particularly prof. Juan Jose Dolado (Universidad Carlos III de Madrid) for helpful suggestions. All remaining errors are my own.
MeasURInG THe soURCes of eConoMIC GRowTH In THe eU ..
oļeGs KRAsnoPJoRoVs
Journal of Economics and Management Research Vol. 1, 2012: 106–122
JournalEconMngmnt-makets.indd 106 20.12.2012 14:12:22

Oļegs Krasnopjorovs 107
InTRoDUCTIon
There are three fundamental questions to the better understanding of economic growth: why does income differ so much between countries, why does income grow over time and why is income growth faster in some countries than in others? (Jones C.I., 2002).
Empirical research has shown that the standard growth accounting framework, which is based on a neoclassical growth model, leaves these questions largely unanswered (i.e., they are mostly explained, instead, by a residual term – Total Factor Productivity (TFP) or by the Solow Residual).
For instance, in summarising growth research over the past 25 years, physical capital accounts for about 20% of income differences across countries whereas Human capital could well explain another 10–30% (Hsieh, Klenow, 2010). This implies that TFP accounts for the remaining part (50–70%) of income gaps. A similar conclusion from earlier research efforts was made by (Khan, 2009): “TFP is found to explain between 50 and 75 percent of the observed differences in income per capita”. Easterly and Levine (2002) even stated the new stylised fact of growth that TFP explains about a half of the average per-capita output growth and 90% of the cross-country variation in growth rates. However, the term TFP continues to be a ‘black box’ to a great extent (it is exogenous if considered within a neoclassical growth model) and captures “all other factors”, i.e., those that remain unexplained by any standard growth accounting framework.
Within the neoclassical setting, capital accumulation and TFP are mutually independent.
However, this proposition was questioned by the appropriate technology model (Basu, Weil, 1998). Even if the various technologies flow freely across state borders, the advances designed for big capital to labour ratios are not usable or at least are not so productive in any low capital to labour environment.
As Basu and Weil stated, “...an advance in transportation technology in Japan may take the form of a refinement of the newest maglev train. Such an advance may have very few spillovers to the technology of the transportation sector in Bangladesh, which relies in large part on bicycles and bullock carts”. Capital accumulation in Bangladesh may, however, allow it to use (at least some of) Japanese technical advances. Therefore, along with a direct effect on labour productivity, captured by the neoclassical growth model, capital accumulation exerts a substantial indirect effect by allowing a state to employ a more productive technology.
The impact of capital accumulation on labour productivity growth could be empirically decomposed between these two effects by the application of non-parametric methods of growth accounting research. By estimating the world production frontier using the Data Envelopment Analysis (DEA) method and then by measuring the impact of capital accumulation, the shift of the world production frontier and the consequent efficiency catch-up on labour productivity
JournalEconMngmnt-makets.indd 107 20.12.2012 14:12:22
108 MEASURING THE SOURCES OF ECONOMIC GROWTH IN THE EU ..
growth, various papers have shown that both direct and indirect effects of capital accumulation are important (for instance, Kumar, Russell, 2002; Jerzmanowski, 2007; Merkina, 2009). By ignoring the indirect effect, the neoclassical growth model thus underestimates the role of capital accumulation and overestimates the role of TFP in economic growth.
The purpose of this paper is to undertake an empirical test on the relevance of an appropriate technology viewpoint in assessing the sources of labour productivity growth and its cross-country differentials within the EU, using both parametric and non-parametric methods.
None of the previous studies used non-parametric methods for the study of growth accounting in Eastern European countries, possibly because of unavailability of reliable capital stock data. Therefore, the first task in the empirical part of this paper is to construct a capital stock time series for each of the twelve new EU member states. Moreover, very few papers have assessed the impact of economy structural changes on results. For instance, if in any particular country, labour moves into the productive sectors or the use of natural resources becomes more intense, then the aggregate labour productivity goes up, and this may be wrongly interpreted as a catch-up to the world production frontier. Thus, the second task is to make labour productivity data comparable both internationally and between time periods. Finally, the results may depend on assumptions used, therefore, the third task is to analyse the robustness of results subject to alternative assumptions regarding capital formation.
This paper is organised as follows. Section 1 reviews methodology, Section 2 describes data, and Section 3 discusses the results. This is followed by a summary of conclusions and main findings and offers some suggestions for further research.
ReseaRCH ResUlTs anD DIsCUssIon
Methodology
Assuming no scale effect, unit elasticity of substitution between labour to physical capital and Hicks-neutral technology, neoclassical multi-country production function in a Cobb-Douglas form is given by:
(1)
where Y – Gross Domestic Product (Output) in real terms; K – stock of physical capital in real terms; L – hours worked (Labour); A – Total Factor Productivity (TFP) or Solow Residual; α and (1-α) – GDP elasticity with respect to capital (typically found to be about 1/3) and labour respectively; i and t – country and time period respectively.
JournalEconMngmnt-makets.indd 108 20.12.2012 14:12:23

Oļegs Krasnopjorovs 109
Note that Y, A, K, and L in (1) are country and period-specific, whereas α is assumed to be the same across countries and time. Under standard Cobb-Douglas decomposition, labour productivity (equivalent to income) can be expressed as a function of capital stock per hour and Solow Residual:
(2)
where and is labour productivity and capital stock per working hour respectively.
In its turn, under the non-parametric representation, labour productivity can be expressed as:
(3)
where is the world production frontier (also referenced as production possibilities frontier and world technology frontier), reflecting the highest attainable labour productivity given the endowment of physical capital (measured by capital to labour ratio). E – measure of output technical efficiency (see (Coelli, 1996) for details).
Note the two differences between (3) and (2) above. Firstly, the non-parametric representation does not require an assumption about the elasticity of output to capital which is allowed to vary with time. For each time period, the world production frontier is estimated using empirical data. Thus, the DEA is less robust to the changes in the country sample and rather sensitive to outliers: if the world production frontier consists of one or more outliers, it may bias the efficiency estimates for other countries. Nevertheless, the DEA offers a more realistic form of world production frontier than does, for instance FDH (Free Disposal Hull: world production frontier consists only of vertical and horizontal lines) and therefore is more widely used in academic research. While a SFA (Stochastic Frontier Analysis) may overcome some DEA drawbacks, it is not a non-parametric method and is left open for further research efforts. Secondly, the term TFP is now changed by a measure of technical efficiency. However, the interpretation of a country’s position relative to the world production frontier is broadly similar to that of the TFP. The world production frontier “should be interpreted quite broadly to encompass institutions and policies as well as purely technological phenomena” (Kumar, Russell, 2002).
And finally, the Cobb-Douglas assumption of α = 1/3 could be incorporated into a DEA framework (i.e., mixed case). After splitting the Solow Residual into the indirect effect of capital accumulation T and (residual) efficiency E, labour productivity could be expressed as:
(4)
JournalEconMngmnt-makets.indd 109 20.12.2012 14:12:23

110 MEASURING THE SOURCES OF ECONOMIC GROWTH IN THE EU ..
The equation for labour productivity growth in each of the three cases could be obtained by log differencing (2), (3) and (4) above. For instance, for a mixed case by taking the logs of (4) we get:
(5)
By differentiating (5), we get that labour productivity growth in each particular country and time period depends on the speed of capital accumulation (times α), shift of the world production frontier (subject to a particular capital endowment) and an efficiency catch-up process:
(6)
Thus, average labour productivity growth (in a country sample) could be expressed as:
(7)
where is the average growth rate (in a country sample) of a variable X.
Note that the contribution of capital accumulation, a shift of the world production frontier and an efficiency catch-up to the labour productivity growth (average in a country sample) in a particular time period t, is given respectively by
, and :
(8)
For instance, a high means that the appropriate technology model is relevant, i.e., fast capital accumulation in Bangladesh allows this country to use (at least some of) Japanese technologies. Moreover if is higher than , the indirect effect of capital accumulation is even more important for labour productivity growth than a direct effect captured by the neoclassical model. At the same time, a high points to efficiency catch-up over time (the average distance to the world production frontier tends to decrease). On the contrary, if
is at about zero, then labour productivity growth could be fully explained by (both direct and indirect effects of) capital accumulation.
Figure 1 (below) shows the sources of labour productivity growth according to the three methods described above. The horizontal axis reflects the capital stock per hour worked while the vertical axis reflects labour productivity (output per hour worked). We may assume that the TFP exceeds unity so that labour productivity level in either hypothetical country is located above the curve. Under the standard (parametric) Cobb-Douglas decomposition, labour productivity growth in a country A (which is denoted by b), could be expressed as a sum of a contribution of capital accumulation (a) and the contribution of TFP (b – a; see Figure 1A). In country B, the only source of labour productivity growth is capital accumulation. Since the contribution of capital accumulation is
JournalEconMngmnt-makets.indd 110 20.12.2012 14:12:24

Oļegs Krasnopjorovs 111
equal in both countries (a), faster labour productivity growth in country A is a result of TFP rise.
A1
Out
put p
er h
our
Capital stock per hour
a
b
f
A0
B0B1
a
a
Out
put p
er h
our
Capital stock per hour
cb
a
d
e
Ф1
Ф0
y = k1/3
y = k1/3
A1
A0
B1
B0
C1
C0
Out
put p
er h
our
Capital stock per hour
cb
a
d
e
Ф1
Ф0
A1
A0
B1
B0
C1
C0
A) B)
C)
Source: author’s construction
Fig. 1. Measuring the sources of cross-country growth differentials using: A) the Cobb-Douglas Framework; B) the DEA Framework; C) a combination of the Cobb-Douglas and DEA Frameworks (mixed case).
In the non-parametric representation, we first need to estimate a world production frontier using empirical data. The world production frontier includes countries that achieve the highest level of labour productivity in a country sample given their capital to labour ratio. Figure 1B shows that over a period (0), two hypothetical countries (A and B) belong to the world production frontier ( ) and, thus, are considered efficient. At the same time, country C operates below the world production frontier and is considered inefficient. While countries A and C have the same capital to labour ratios, country C achieves lower labour productivity so the whole labour productivity gap between countries A and C is explained by an efficiency term. Inefficiency (more specifically, output technical inefficiency) can be measured by a vertical distance between a respective country and a frontier (b). Output technical efficiency of country C ( from equation 3)
JournalEconMngmnt-makets.indd 111 20.12.2012 14:12:24

112 MEASURING THE SOURCES OF ECONOMIC GROWTH IN THE EU ..
can be calculated as . In the next period, the world production frontier shifts
up to . Since the efficiency of countries A and B did not change (these countries again are considered fully efficient) it both increased their labour productivity solely due to capital accumulation. Note that country C is still inefficient during period 1. However, it increased labour productivity substantially (by e), at the same time becoming more efficient (vertical distance to a frontier decreased from b to d). Contribution of efficiency and capital accumulation to labour productivity growth in country C is given by b – d and e – (b – d) respectively.
When combining the Cobb-Douglas and DEA frameworks (mixed case), again, labour productivity in country C increases by e and the contribution of efficiency to labour productivity growth is the difference between b and d (see Figure 1C). However, now, the contribution of (the direct effect of) capital accumulation is assessed by f. The larger the capital stock, the higher is the labour productivity given the same technology. The remaining part of the labour productivity rise is due to an indirect effect of capital accumulation in line with an appropriate technology view and is represented by e – f – (b – d), implying that a higher capital to labour ratio allows a country to use a more productive technology.
Sources of labour productivity growth differentials could be measured using a variance decomposition exercise. After denoting , and as , and
respectively, variance of labour productivity growth for a mixed case could be shown as (based on Jerzmanowski M., 2007):
(9)
where Var and Cov denotes variance and covariance respectively.
Splitting the covariance terms equally between the factors (Klenow, Rodriguez-Clare, 1997; Jerzmanowski, 2007), the contribution of direct and indirect effects of capital accumulation as well as role of (residual) efficiency term in the variance of labour productivity growth in a particular time period t is given respectively by , and :
; ;
(10)
For instance, if is zero, the situation is realistically represented by the neoclassical model in which capital accumulation has no impact on TFP. By contrast, a significant would mean that rapid capital accumulation allows fast growing economies to bear fruits from technologies developed in advanced countries.
JournalEconMngmnt-makets.indd 112 20.12.2012 14:12:25

Oļegs Krasnopjorovs 113
Data
While focusing overall on the EU member states, this paper includes an assessment of three other countries – Norway, the USA and Japan – that are often regarded as being among the major technology leaders and, thus, should be included in any world production frontier in order to correctly assess the efficiency of the remaining countries. Therefore, the sample under discussion consists of 30 countries. Both capital stock and output (gross value added) annual data are expressed in per hour worked and in Euro PPP terms in order to take into account international price differences. Output, number of hours worked and PPP index data were obtained from Eurostat. Moreover, both input and output data were filtered with a Hodrick-Prescott filter (λ = 100) in order to exclude the short-term cyclical impact on output and employment. The annual input and output time series for all countries involves the 1995-2010 period. Reliable macro-economic data for Eastern European countries is not available prior to 1995, thus, growth investigation usually starts at that year (for instance, Vanags, Bems, 2005).
Capital stock data are based on the Groningen Growth Accounting Database (GGAD), which is widely used in a recent growth research (for instance, Apergis, et al., 2010; Ark, et al., 2008). However, the data only covers 16 countries (EU-15 and the U.S.) and the time span until 2004. The following rule-of-thumb assumptions were made regarding capital accumulation.
For the EU-15 and U.S., capital stock data were extrapolated to 2005–2010 using the perpetual inventory method (see, for instance, Vanags, Bems, 2005) and gross capital formation data taken from Eurostat. The capital stock time series for each of the EU-12 countries were constructed by assuming an initial (in 1995) capital to GDP ratio to be 100% (150% for Norway and Japan). The capital stock annual depreciation rate was assumed to be 10% for all countries.
Moreover, in exploring the possibility that the capital stock depreciation rate may differ across countries, as well as dealing with the possibility of imprecise initial capital to output ratio estimates, an alternative capital stock estimation method was used (k adjusted).
Firstly, the implied capital depreciation rates were calculated for 16 countries included in the GGAD during 1995–2004 (the GGAD capital stock data and the Eurostat fixed capital formation data were combined in a perpetual inventory method). The average implied capital depreciation rate for the 16 countries was estimated at 10.2%, which is slightly higher than is usually considered for advanced countries in a growth accounting research (for example, a conventional estimate for the USA is usually 6% (Khan, 2009) or 5% (Barro, Sala-i-Martin, 2004)). Nevertheless, cross-country differences are significant with the highest depreciation rate being estimated for Portugal and Ireland (16.5% and 14.0% respectively), which is about two times as much as it is in France and Denmark (7.9% and 8.3% respectively).
Secondly, it was found that the capital depreciation rate relates positively to the share of manufacturing in the gross value added (GVA) and investment to
JournalEconMngmnt-makets.indd 113 20.12.2012 14:12:25

114 MEASURING THE SOURCES OF ECONOMIC GROWTH IN THE EU ..
GDP ratio, while negatively relating to the share of construction in the GVA and initial capital to output ratio:
(11)
p-value: (0.4647) (0.0011) (0.0002) (0.0011) (0.0402) R2 = 0.872
where is implied capital depreciation rate;
– investment (gross fixed capital formation) as a share of the GDP (1995–2004
average);
– capital to GDP ratio in 1995;
and – share of manufacturing and construction respectively in the
GVA (1995–2004 average).
As for the initial capital output ratios, the only factor that showed border significance (p-value is 0.0849) was the share of public services (public administration, education and healthcare) in the GVA which could be regarded as one of the proxies of maturity of the economy.
Thirdly, the initial capital to output ratio and capital depreciation rate was estimated for the remaining 14 countries (EU-12, Norway and Japan). In line with the observation that capital depreciation rates may generally be higher in developing countries than in developed economies (for instance, see Duma, 2007), the capital depreciation rate in the EU-12 was found to be significantly higher compared to the EU-15 (14.9% and 10.2% respectively). With regard to the Baltic states, the capital depreciation rate was estimated at 19.3%, 16.1% and 12.5% for Estonia, Latvia and Lithuania respectively.
In its turn, the initial capital to GDP ratio for the EU-12 is found to be somewhat lower than in the EU-15 plus USA (1.44 and 1.69 respectively). In regard to the Baltic states, the initial capital to GDP ratio was estimated at 1.594, 1.556 and 1.442 in Latvia, Lithuania and Estonia respectively. This result is in line with the conventional logic that in order for investments flow from Western Europe to Eastern Europe, the capital marginal product in Eastern Europe should be higher than that in Western Europe (Vanags, Bems, 2005). Assuming that the GDP elasticity to capital is similar across countries, this could then be accomplished only if the capital to output ratio is higher in Western Europe than in Eastern Europe.
Along with an unadjusted measure of labour productivity, this paper also uses the adjusted level (y adjusted) taking into account the impact of structural effects on aggregate labour productivity. As labour productivity differs by sectors, and is
JournalEconMngmnt-makets.indd 114 20.12.2012 14:12:25
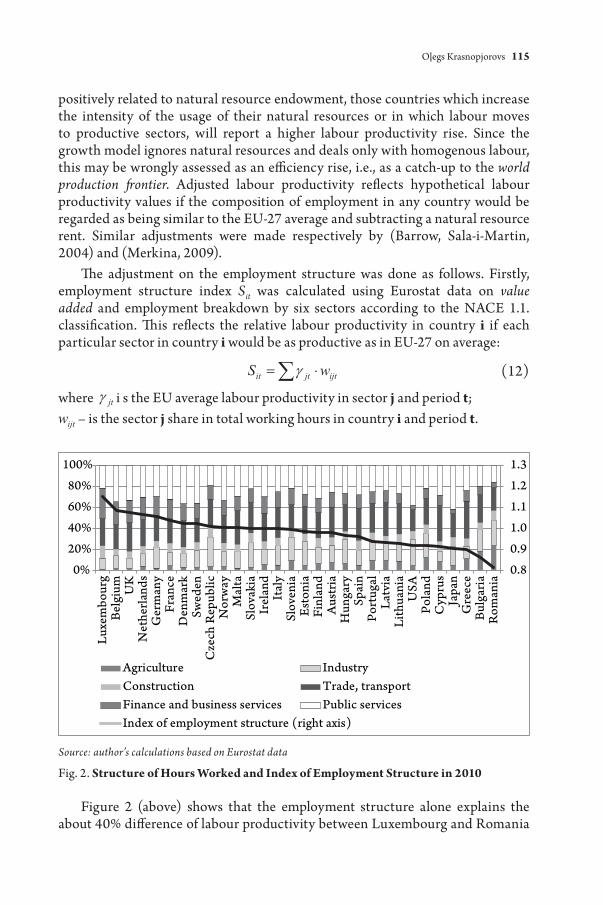
Oļegs Krasnopjorovs 115
positively related to natural resource endowment, those countries which increase the intensity of the usage of their natural resources or in which labour moves to productive sectors, will report a higher labour productivity rise. Since the growth model ignores natural resources and deals only with homogenous labour, this may be wrongly assessed as an efficiency rise, i.e., as a catch-up to the world production frontier. Adjusted labour productivity reflects hypothetical labour productivity values if the composition of employment in any country would be regarded as being similar to the EU-27 average and subtracting a natural resource rent. Similar adjustments were made respectively by (Barrow, Sala-i-Martin, 2004) and (Merkina, 2009).
The adjustment on the employment structure was done as follows. Firstly, employment structure index Sit was calculated using Eurostat data on value added and employment breakdown by six sectors according to the NACE 1.1. classification. This reflects the relative labour productivity in country i if each particular sector in country i would be as productive as in EU-27 on average:
(12)
where i s the EU average labour productivity in sector j and period t;
– is the sector j share in total working hours in country i and period t.
0.80.91.01.11.21.3
0%20%40%60%80%
100%
Luxe
mbo
urg
Belg
ium
UK
Net
herla
nds
Ger
man
yFr
ance
Den
mar
kSw
eden
Cze
ch R
epub
licN
orw
ayM
alta
Slov
akia
Irel
and
Ital
ySl
oven
iaEs
toni
aFi
nlan
dA
ustr
iaH
unga
rySp
ain
Port
ugal
Latv
iaLi
thua
nia
USA
Pola
ndC
ypru
sJa
pan
Gre
ece
Bulg
aria
Rom
ania
Agriculture IndustryConstruction Trade, transportFinance and business services Public servicesIndex of employment structure (right axis)
Source: author’s calculations based on Eurostat data
Fig. 2. Structure of Hours Worked and Index of Employment Structure in 2010
Figure 2 (above) shows that the employment structure alone explains the about 40% difference of labour productivity between Luxembourg and Romania
JournalEconMngmnt-makets.indd 115 20.12.2012 14:12:26
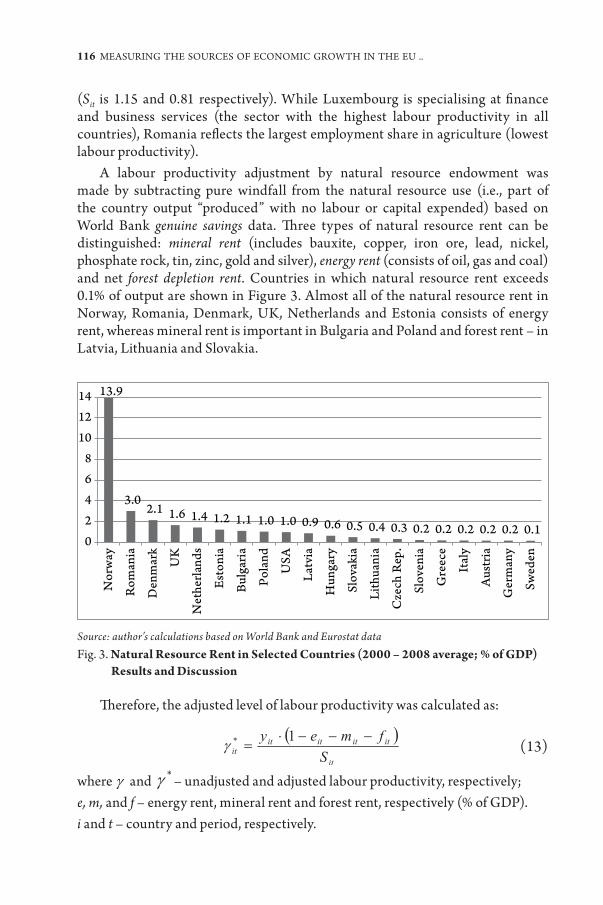
116 MEASURING THE SOURCES OF ECONOMIC GROWTH IN THE EU ..
(Sit is 1.15 and 0.81 respectively). While Luxembourg is specialising at finance and business services (the sector with the highest labour productivity in all countries), Romania reflects the largest employment share in agriculture (lowest labour productivity).
A labour productivity adjustment by natural resource endowment was made by subtracting pure windfall from the natural resource use (i.e., part of the country output “produced” with no labour or capital expended) based on World Bank genuine savings data. Three types of natural resource rent can be distinguished: mineral rent (includes bauxite, copper, iron ore, lead, nickel, phosphate rock, tin, zinc, gold and silver), energy rent (consists of oil, gas and coal) and net forest depletion rent. Countries in which natural resource rent exceeds 0.1% of output are shown in Figure 3. Almost all of the natural resource rent in Norway, Romania, Denmark, UK, Netherlands and Estonia consists of energy rent, whereas mineral rent is important in Bulgaria and Poland and forest rent – in Latvia, Lithuania and Slovakia.
13.9
3.02.1 1.6 1.4 1.2 1.1 1.0 1.0 0.9 0.6 0.5 0.4 0.3 0.2 0.2 0.2 0.2 0.2 0.1
02468
101214
Nor
way
Rom
ania
Den
mar
k
UK
Net
herla
nds
Esto
nia
Bulg
aria
Pola
nd
USA
Latv
ia
Hun
gary
Slov
akia
Lith
uani
a
Cze
ch R
ep.
Slov
enia
Gre
ece
Ital
y
Aus
tria
Ger
man
y
Swed
en
Source: author’s calculations based on World Bank and Eurostat data Fig. 3. Natural Resource Rent in Selected Countries (2000 – 2008 average; % of GDP)
Results and Discussion
Therefore, the adjusted level of labour productivity was calculated as:
(13)
where and – unadjusted and adjusted labour productivity, respectively; e, m, and f – energy rent, mineral rent and forest rent, respectively (% of GDP). i and t – country and period, respectively.
JournalEconMngmnt-makets.indd 116 20.12.2012 14:12:26

Oļegs Krasnopjorovs 117
Given the large impact of assumption with regard to initial capital to output ratio on the input variable at the beginning of the period, results are discussed for the 2000-2010 period.
The world production frontier, estimated by DEA method, consists of four countries observed in both 2000 and 2010: Romania, Ireland, the USA and Luxembourg (see figure 4A and 4B). The other countries are not efficient. For instance, Latvia has a lower labour productivity than the U.S. not only due to relatively low capital to labour ratio, but also due to its backwardness relative to the world production frontier. Ireland and Luxembourg are the only two countries considered to be efficient in either particular year and irrespective of the data set.
BE
BG
CZ
DKDE
EE
IE
GR
SP
FRIT
CY
LV
LT
LU
HUMT
NLAT
PLPT
RO
SLSK
FISE
UK
NOUS
JP
0
5
10
15
20
25
30
35
40
0 10 20 30 40 50 60 70Labo
ur p
rodu
ctiv
ity p
er h
our (
PPP)
in 2
000
Capital per working hour (PPP) in 2000
BE
BG
CZ
DK
DE
EE
IE
GR
SP
FR
ITCY
LV
LT
LU
HUMT
NLAT
PL
PTRO
SLSK
FISE
UK
NOUS
JP
0
5
10
15
20
25
30
35
40
45
50
55
0 10 20 30 40 50 60 70 80 90 100 110Labo
ur p
rodu
ctiv
ity p
er h
our (
PPP)
in 2
010
Capital per working hour (PPP) in 2010A) B)
Source: author’s construction Fig. 4. World Production Frontier (adjusted k and y values): A) 2000; B) 2010
Note also, that, although in 2000 the Eastern European economies were lagging their Western counterparts in terms of efficiency (73.3% vs. 82.9%; see Table 1), the efficiency differentials almost vanish up to 2010 (81.4% vs. 82.1%). The efficiency catch-up by EU-12 countries was accompanied by a rapid capital accumulation as compared to the advanced economies (70% vs. 41% growth in capital stock per working hour). While the difference in capital endowment decreased in relative numbers, it still increased in absolute numbers over the decade. In the Baltic states, the capital formation was particularly fast, but the efficiency catch-up was somewhat slower as compared to other EU-12 economies.
Under the traditional neoclassic growth accounting framework relying on a Cobb-Douglas production function, the contribution of capital accumulation to labour productivity growth is estimated to be between 40% and 50% depending on the data set (the respective figure for variance of labour productivity growth is between 44% and 66%). Taking the average number of the four data sets, capital accumulation accounts for about 45% of labour productivity growth (the average
JournalEconMngmnt-makets.indd 117 20.12.2012 14:12:26

118 MEASURING THE SOURCES OF ECONOMIC GROWTH IN THE EU ..
of the countries sample) whereas cross-country differences in the speed of capital accumulation explain about 55% of labour productivity growth cross-country differentials (see Table 2). This means that about half of the economic growth is not explained by a standard Cobb-Douglas framework, thus mirroring a large role of TFP. Although the average result of the four data sets lacks real-world interpretation, it may still be useful in assessing the relevance of the appropriate technology view given the imprecision of capital stock estimates for the Eastern European countries. The usage of the non-parametric DEA method in measuring the sources of economic growth substantially increases the role of capital – to about 95–100%. Thus, a relaxing of the Cobb-Douglas assumptions suggests that capital accumulation is (very) nearly the only source of economic growth within a particular sample of countries.
Table 1 Efficiency Estimation for Selected Countries (2000 and 2010)
Period: 2000 2010 Variable: kit yit yt (kit)
yit / yt (kit) kit yit yt (kit)
yit / yt (kit) Unit: euro PPP euro PPP Estonia 12.2 10.5 15.2 0.688 31.2 20.8 28.0 0.742Latvia 10.1 8.9 13.2 0.675 25.7 16.5 23.5 0.701Lithuania 14.4 12.7 17.2 0.738 26.9 19.8 24.5 0.807EU-15 and USA 50.1 29.4 35.5 0.829 70.6 38.8 47.3 0.821EU-12 18.1 13.6 19.2 0.733 30.8 21.8 27.2 0.814
Source: author’s calculations based on GGAD, World Bank and Eurostat data
Table 2 Sources of labour productivity growth and its cross-country variance in 2000-2010
using Cobb-Douglas and DEA decompositions separately, %
Variable: Labour productivity growth Variance of labour productivity growth
Method: Cobb-Douglas DEA Cobb-Douglas DEAGrowth
factor: Data used:
Capital TFP Capital Efficiency Capital TFP Capital Efficiency
No adjustments 48.1 51.9 91.9 8.1 59.3 40.7 140.3 -40.3
Y adjustment 50.1 49.9 107.7 -7.7 66.3 33.7 121.1 -21.1K adjustment 39.6 60.4 91.2 8.8 44.2 55.8 71.9 28.1K & Y adjustment 41.3 58.7 88.7 11.3 49.1 50.9 67.1 32.9
Average: 44.8 55.2 94.9 5.1 54.7 45.3 100.1 -0.1
Source: author’s calculations based on GGAD, World Bank and Eurostat data
JournalEconMngmnt-makets.indd 118 20.12.2012 14:12:27

Oļegs Krasnopjorovs 119
To clarify whether the difference in results is due to the indirect impact of capital to technology in line with an appropriate technology view, the Cobb-Douglas and DEA frameworks were combined. Note that in some cases (depending on data set) the indirect effect of capital accumulation is even more important than the direct effect (see Table 3). Taking the average result of the four data sets, both effects of capital accumulation are similarly important sources of labour productivity growth: and are close to 45% each. However, when measuring why labour productivity growth in some countries is faster than in others, direct effect is somewhat more important: and are estimated to be about 50% and 37% respectively. Thus, the results confirm the appropriate technology view that rapid capital accumulation, by increasing the capital to labour ratio, allows a country to employ a more productive technology which, in its turn, has a positive impact on labour productivity.
Table 3Sources of labour productivity growth and its cross-country variance in 2000-2010
using a combination of Cobb-Douglas and DEA decompositions, %
Variable: Labour productivity growth Variance of labour productivity growth
Growth factor:
Data used: Capital Technology Efficiency Capital Technology Efficiency
No adjustments 50.0 36.6 13.4 46.4 64.8 -11.2
Y adjustment 50.1 62.4 -12.5 64.0 42.6 -6.6K adjustment 39.6 43.7 16.7 43.3 37.1 19.6K & Y adjustment 41.3 40.1 18.6 47.8 2.6 49.6
Average: 45.3 45.7 9.0 50.4 36.8 12.8
Source: author’s calculations based on GGAD, World Bank and Eurostat data
The indirect effect of capital accumulation on labour productivity is ignored by a standard Cobb-Douglas decomposition. While the Cobb-Douglas assumes that TFP is not related to k, in reality, however, there is a strong positive relation between these variables. In using data with both input and output adjustments, about 71% of the cross-country differences in TFP can be explained by the difference in capital to labour ratio (when none of the adjustments is used, the relation is even stronger with R2 = 0.83). The results prove that the technology available to a country is crucially dependent on its capital endowment (k = K/L). Given the direct and indirect effects of capital accumulation, investments have a greater role in economic growth than is derived from standard (Cobb-Douglas) growth-accounting practices.
Note that the role of efficiency in economic growth is not robust (results are not stable and depend on the data set used). This could reflect data measurement
JournalEconMngmnt-makets.indd 119 20.12.2012 14:12:27

120 MEASURING THE SOURCES OF ECONOMIC GROWTH IN THE EU ..
error since capital stock data are the least precise in almost all growth accounting literature. The absence of robust relation between efficiency increase and labour productivity growth could be interpreted as fast growing economies experience with only modest efficiency catch-up. While the rapid rise of capital stock not only increases labour productivity directly, but also allows these countries to use a more productive technology, their backwardness compared to the world production frontier remains rather stable. Earlier research suggests that the contribution of efficiency to economic growth could even be negative (for instance, Jerzmanowski, 2007), i.e., fast growing economies tend to deviate from the world production frontier over time. Although this is not the case with regard to Eastern European economies in general, the efficiency catch-up was particularly slow in the Baltic states, especially in Latvia (see table 1.). Still, given the possible imprecision of capital estimates and unstable efficiency numbers depending on the data set, a caveat should be made before linking efficiency measures to any fundamental (i.e., institutional) factors.
It should be noted that this paper uses a narrow definition of the term capital that includes physical capital stock but disregards Human capital. While some growth accounting papers consider Human capital as well (for instance, Hsieh, Klenow, 2010; Jerzmanowski, 2007), all of these use the broad country sample (including both the world’s richest and poorest countries) in which there is a strong positive correlation between the Human capital variable and income level. In contrast, the Eastern European economies are not lagging behind their Western counterparts with regard to quantitative Human capital data (years of schooling etc.), thus, there is no statistically significant correlation between these indicators and labour productivity. Despite a possible lack of Human capital quality, this cannot be concluded, for example, via “mincerian equations” both due to the unavailability of data and since the “age” of employee’s education matters for its value in some countries (as documented by (Hazans, 2005) in the case of Latvia). Given that (Melihovs, Davidsons, 2006) have not found any Human capital variable that would improve the accuracy of Latvia’s production function, the finding of a precise Human capital proxy that would be useful for cross-country growth accounting research becomes a real challenge that is left for further research efforts.
ConClUsIons, PRoPosals, ReCoMMenDaTIons
The main findings of this paper are summarised as follows: 1. In accord with the observation that capital depreciation rates are generally
higher in developing countries than in developed economies, the annual depreciation rate of physical capital is found to be substantially higher in Eastern European countries than in Western European countries (14.9% and 10.2% respectively).
JournalEconMngmnt-makets.indd 120 20.12.2012 14:12:27

Oļegs Krasnopjorovs 121
2. The initial capital to GDP ratio (in 1995) in the Eastern European countries was found to be somewhat lower than in the Western European countries (1.44 and 1.69 respectively). This is in line with a common observation that the capital marginal product is relatively higher in Eastern Europe.
3. Using a standard neoclassical growth accounting framework relying on the Cobb-Douglas production function, the contribution of capital accumulation to labour productivity growth (average in a country sample that consists of all 27 EU countries, Norway, the USA and Japan; during 2000-2010) is about 45%. Similarly, the cross-country differences in the speed of capital accumulation accounts for about 55% of labour productivity growth differentials. This reflects the direct effect of capital accumulation on output: the increase of capital to labour ratio increases labour productivity given the same level of technology.
4. The usage of non-parametric DEA methodology allows for increasing the contribution of capital in assessing the sources of economic growth to 95–100%. In line with the appropriate technology model (Basu, Weil, 1998), capital accumulation has an indirect effect on output ignored by the neoclassical framework: the increase of capital to labour ratio allows a country to use a more productive technology. When accounting for the sources of labour productivity growth, both effects of capital accumulation are similarly important. In its turn, when evaluating why labour productivity growth in some countries is faster than in others, the direct effect of capital accumulation seems to be somewhat more important.
5. The conclusion regarding the presence of an indirect effect of capital accumulation is robust, subject to the usage of alternative assumptions of capital formation as well as an adjustment of labour productivity in respect to the employment structure by sectors and natural resource endowment.
6. Although the neoclassical growth model assumes that the capital to labour ratio and TFP are independent of each other, empirical data points to the strong positive relation between these variables.
7. Further research efforts on multi-county growth accounting in the EU should focus on the usage of other methods to estimate the world production frontier, alternative to DEA (for instance, SFA: stochastic frontier analysis). An additional challenge is to find a precise Human capital approximation that would be suitable for growth accounting in each of the EU economies.
IEGULDĪJUMS TAVĀ NĀKOTNĒ
This work has been supported by the European Social Fund within the project “Support for Doctoral Studies at the University of Latvia”.
JournalEconMngmnt-makets.indd 121 20.12.2012 14:12:27

122 MEASURING THE SOURCES OF ECONOMIC GROWTH IN THE EU ..
bibliography Apergis, N., Panopoulou, E. & Tsousmas, C., 2010. Old Wine in a New Bottle: Growth
Convergence Dynamics in the EU. Atlantic Economic Journal, vol. 38. pp. 169-181. Ark, B., Mahony, M. O. & Timmer, M. P., 2008. The Productivity Gap between Europe
and the United States: Trends and Causes. Journal of Economic Perspectives, vol. 22, No. 1, pp. 25-44.
Basu, S. & Weil, D. N., 1998. Appropriate Technology and Growth. The Quarterly Journal of Economics, vol. 113, issue 4, pp. 1025-1054.
Barro, R. & Sala-i-Martin, X., 2004. Economic Growth. London: The MIT Press. p. 672. Coelli, T. 1996. A Guide to DEAP Version 2.1.: A Data Envelopment Analysis
(Computer) Program [online]. CEPA Working Paper, No. 96/08, 50 pp. Available at: <http://www.owlnet.rice.edu/~econ380/DEAP.PDF> [Access: 29 December 2011].
Duma, N. 2007. Sri Lanka’s Sources of Growth [online]. International Monetary Fund Working Paper No. 07/225, 25 pp. Available at: <http://www.imf.org/external/pubs/ft/wp/2007/wp07225.pdf> [Access: 29 December 2011].
Easterly, W. & Levine, R., 2002. It’s Not a Factor Accumulation: Stylized Facts and Growth Models. Economic Growth: Sources, Trends, and Cycles, ed. Norman Loayza, Raimundo Soto, Norman Loayza & Klaus Schmidt-Hebbel, chapter 3, pp. 61-114.
Hazans, M., 2005. Unemployment and the Earnings Structure in Latvia. World Bank Policy Research Working Paper, No. 3504, pp. 90.
Hsieh, C. T. & Klenow, P. J., 2010. Development Accounting. American Economic Journal: Macroeconomics. Vol. 2, pp. 207-223.
Jerzmanowski, M., 2007. Total Factor Productivity Differences: Appropriate Techno-logy vs. Efficiency. European Economic Review, vol. 51, issue 8, pp. 2080-2110.
Jones, C. I., 2002. Introduction to Economic Growth. Norton, USA, 2 ed., pp. 256. Khan, A., 2009. Accounting for Cross-Country Differences in Income Per Capita.
Business Review, Q1 2009, pp. 11-18. Klenow, P. J. & Rodriguez-Clare, A., 1997. The Neoclassical Revival in Growth
Economics: Has it Gone Too Far? NBER Macroeconomics Annual 1997. MIT Press 1997, pp.73-103.
Kumar, S. & Russell, R. R., 2002. Technological Change, Technological Catch-up, and Capital Deepening: Relative Contributions to Growth and Convergence. The American Economic Review, vol. 92, issue 3, pp. 527-548.
Melihovs, A. & Davidsons, G., 2006. The Role of Production Progress and Human Capital in the Economic Growth of Latvia [online]. Bank of Latvia Working Paper No. 1/2006, 31 pp. Available at: <http://www.macroeconomics.lv/role-production-progress-and-human-capital-economic-growth-latvia> [Access 29 December 2011].
Merkina, N., 2009. Technological Catch-up or Resource Rents: a Production Function Approach to Growth Accounting. Journal of International Economics and Economic Policy, vol. 6, pp. 59-82.
Vanags, A. & Bems, R., 2005. The Baltic Growth Acceleration: Is It Sustainable? [online]. BICEPS Working Paper, 35 pp. Available at: <http://www.biceps.org/files/Growth Acceleration in the Baltic states.pdf> [Access 29 December 2011].
JournalEconMngmnt-makets.indd 122 20.12.2012 14:12:27

an analysIs of THe CoMPeTITIVeness of THe ICT ManUfaCTURInG seCToR
In laTVIa
saRMīTe MICKeVIča, sIGne bālIņaUniversity of latvia, faculty of economics and Management
MaRTynas bIelIUnasInformation science (Informology), Vilnius University faculty of Communication
Abstract. The Information and Communications Technologies (ICT) manu factur-ing industry in Latvia is currently exporting most of its products, however the question is – how competitive is the Latvian ICT manufacturing industry and what is its future potential? Moreover, the recent economic and financial crisis in Latvia continues to raise the question with regard to which industries, services and economic activities can best serve as the cornerstones of Latvia’s national wealth.The purpose of this study is to analyse the competitiveness of the Latvian ICT manufacturing industry by utilising the Porter diamond – five forces model and the resource-based view model. This paper undertakes an evaluation of the innovation potential of the Latvian ICT manufacturing industry and of its capability to become one of cornerstones of Latvia’s national competitiveness. The research outcome offers recommendations for strategy development within individual organisations and for the industry as a whole.This paper includes a review of the available literature, exploratory interviews with experts of the Latvian ICT industry, quantitative analysis, logical analysis and generalisation.The research undertaken will serve as a contribution to those organisations which are involved in making strategic decisions on the possibility of entering the ICT manufacturing industry of Latvia and will help to shape the strategies for current ICT manufacturing industry players in Latvia. This research may also be useful to governmental institutions that are directly involved in the developing economic strategies of Latvia.
Key words: ICT manufacturing industry, industry analysis, competitiveness, export.
JEL code: L63.
InTRoDUCTIon
During the past decade we have experienced how ICT technologies are changing the world and the lives of individuals. ICT has also proven to be a key pre-condition for enhanced competitiveness and economic and societal modernisation, as well as an important instrument for the bridging of economic
an analysIs of THe CoMPeTITIVeness of THe ICT ManUfaCTURInG seCToR ..
SARMīTE MICKEVIčA, SIGNE BāLIņA, MARTYNAS BIELIUNAS
Journal of Economics and Management Research Vol. 1, 2012: 123–138
JournalEconMngmnt-makets.indd 123 20.12.2012 14:12:27

124 AN ANALYSIS OF THE COMPETITIVENESS OF THE ICT MANUFACTURING SECTOR ..
and social divides and in reducing poverty (Dutta, Mia, 2010). The ICT industry has become an increasingly important industry within the global economy, accounting for approximately 5 percent of total GDP growth between 2003 and 2008 and representing 5.4 percent of GDP worldwide in 2008 (Dutta, Mia, 2009).
Recent economic history has shown that, as developed countries approach the technological frontier, ICT is crucial for them to continue innovation in their processes and products and to maintain their competitive advantage (Dutta, Mia, 2009). Latvia is not an exception to this observation and we are continuously realising that the role of ICT in everyday life and the role of the ICT industry in the state economy is growing.
From a global perspective, ICT is a priority for many countries and the best index with which to compare countries in the information society and ICT developments area is the “Networked Readiness Index” developed by the World Economic Forum and the INSEAD business school. The index compares 138 countries, which are evaluated on 31 environment, 20 readiness and 20 usage components of ICT. The total rank of Latvia in 2011–2012 is 41, and that is an improvement by 11 positions compared with the previous period. Our Baltic neighbours are ranked higher with Estonia – 24, an improvement by 2 positions and Lithuania – 31 which has improved its rating by 11 positions. (Dutta, Mia, 2011; Dutta, Bilbao-Osorio, 2012)
In countries with a small internal market and with limited natural resources, the governments are continuously searching for those forms of economic activity that could bring wealth to the nation, and for which products and services the country might export. The ICT industry already contributes significantly to the Latvian economy and its contribution is expected to grow. Its value added and profitability factors are higher than in the majority of other sectors of the economy (Balina, Mickevica, 2012). The ICT industry has a high knowledge intensity instead of production factor intensity. In this context, the investments by government and private companies into the research and development (R&D) of ICT become important as do (intellectual) property rights protection with patents, trademarks and copyrights.
THe THeoReTICal foUnDaTIon of naTIonal CoMPeTITIVeness analysIs
Nations become competitive in particular industries because the home environment in those industries is the most forward-looking, dynamic and challenging. No nation can or will become competitive in every or even most industries. Companies gain advantages against the world’s best competitors because of the pressure and challenge of having strong domestic rivals, aggressive home-based suppliers, and demanding local customers (Porter, 2008).
Porter formulates the national competitiveness model as a diamond which consists of four building blocks: factor conditions, demand conditions, related
JournalEconMngmnt-makets.indd 124 20.12.2012 14:12:27

Sarmīte Mickeviča, Signe Bāliņa, Martynas Bieliunas 125
and supporting industries, company strategy, structure and rivalry. To support the competitive advantage factor there must be highly specialised support for the particular needs of the industry – a scientific institute specialising in optics, a pool of a venture capital to fund software companies. Such factors are more difficult for foreign competitors to imitate.
Nations can gain a competitive advantage in those industries in which the home demand gives their companies an earlier picture of emerging buyer needs, and where demanding buyers will pressure companies to innovate faster. The scope of demand has proven to be far less important than the character of the demand. The third determinant of national advantage is the presence in the nation of related and supporting industries that are internationally competitive. The presence of such industries provides the benefits of information flow and technical interchange which then serve to accelerate the rate of innovation and upgrade.
According to the fourth component of the diamond model – company strategy, structure and rivalry, and competitiveness in a specific industry results from a convergence of the management practices and organisational modes favoured within the country. Countries differ in the goals that individuals and companies seek to achieve. A nation’s success depends largely on the types of education its most talented people choose, where they choose to work, and on the level of their commitment and effort.
Nowadays, for a country to become competitive it is not enough for governments to focus only on the fundamentals such as the basic and secondary education systems, and on a bare basics core national infrastructure and research in areas of broad national concern, such as healthcare, in order to create national competitiveness. Rather, there should be a focus on the mechanisms that can translate into a competitive advantage for industries. These mechanisms may be specialised apprenticeship programmes, research efforts in universities connected with an industry, trade association activities and private investments in companies.
According to Porter Research (2008), governments should avoid intervening in the factor and exchange markets, i.e., when market forces create rising factor costs or a higher exchange rate, governments should resist the temptation to push them back down. At the same time they should be enforcing stricter product, safety and environmental regulations that promote competitive advantage.
Governments should limit co-operation amongst industry rivals in research projects, because these companies rarely dedicate/offer their best people to such co-operative projects and government investments are mediocre as well. It has lately been promoted very widely that companies should co-operate on R&D projects because of economies of scale, but, from the viewpoint of creating competitive advantage, such projects are clearly not sustainable. There can, however, be areas in which co-operative research projects can prove beneficial – areas involving basic product and process research, and not too closely connected to the company’s basic proprietary advantage.
JournalEconMngmnt-makets.indd 125 20.12.2012 14:12:27

126 AN ANALYSIS OF THE COMPETITIVENESS OF THE ICT MANUFACTURING SECTOR ..
Companies must recognise that innovations are at the centre of the competitive advantage that grows out of pressure and challenge. Company managements must recognise the shortcuts that offer apparent competitive advantage, for example, co-operative research and development. Companies could instead sell to the most sophisticated and demanding buyer and channels; seek out those buyers with the most demanding requirements; establish norms that exceed the toughest regulatory hurdles or product standards; source their materials from the most advanced suppliers; and treat employees as permanent in order to stimulate the upgrading of skills and productivity. Companies should seek out the most capable competitors as motivators for development, welcome domestic market rivalry, establish early warning systems and create alliances only selectively so as to tap individual advantages, not core competencies.
One important area to recognise is that all companies are contributing to the national diamond model. This means that a part of company responsibility is to play an active role in forming clusters, because the health and strength of the national cluster will only enhance the company’s own rate of innovation and upgrading. Almost in every successful competitive industry, the leading companies also take explicit steps to create and develop specialised factors such as their human resources, scientific knowledge or infrastructure.
an analysIs of THe THeoReTICal foUnDaTIon of InDUsTRy CoMPeTITIVeness
The competitiveness of any enterprise should be sustainable and based on competitive advantage. According to Barney (1991), competitive advantage is achieved when a company implements a value-creating strategy that is not simultaneously being implemented by any current or potential competitors. A sustained competitive advantage is achieved when the value-creating strategy is not simultaneously being implemented by any current or potential competitors and when these other firms are unable to duplicate the benefits of this strategy.
A traditional industry analysis can be made using Porter’s five competitive forces model that captures the essential division of value between current and potential industry players. In the five forces model (Porter, 1998; Magretta, 2012) there is an evaluation of new entrants to the industry, suppliers, buyers, substitutes and rivalry among existing industry players. This model can also be used to determine the ultimate profit potential in the ICT industry measured in terms of long-run return on invested capital. As well as industry structure, it provides a snapshot of the rules of the game of industry (Porter, 1998). The Porter model assumes that firms within an industry or within a strategic group are identical in terms of the strategically relevant resources they control and the strategies they pursue (Porter, 1981).
In the research undertaken by Rumelt (1991), one of key conclusions was that a company’s specific variables are more important than the overall industry
JournalEconMngmnt-makets.indd 126 20.12.2012 14:12:27
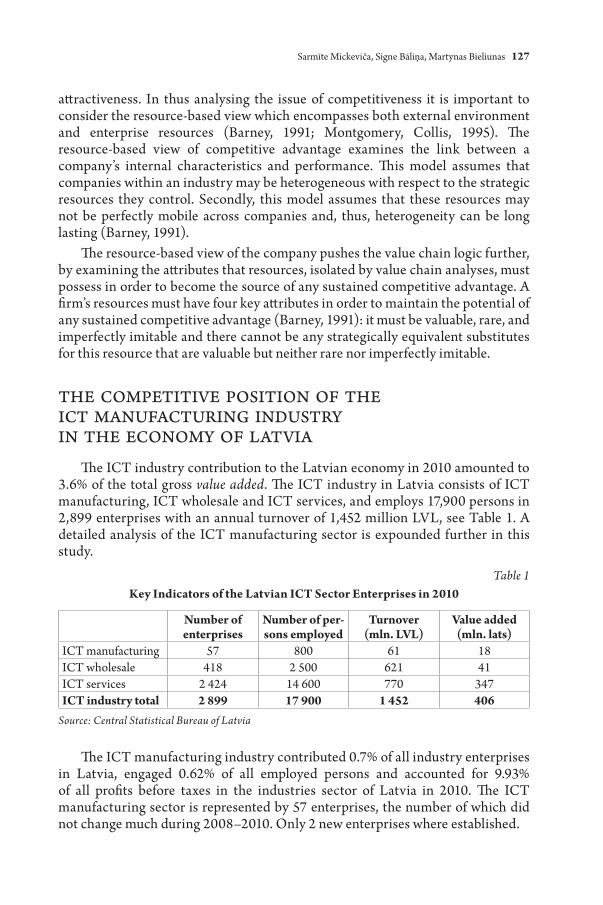
Sarmīte Mickeviča, Signe Bāliņa, Martynas Bieliunas 127
attractiveness. In thus analysing the issue of competitiveness it is important to consider the resource-based view which encompasses both external environment and enterprise resources (Barney, 1991; Montgomery, Collis, 1995). The resource-based view of competitive advantage examines the link between a company’s internal characteristics and performance. This model assumes that companies within an industry may be heterogeneous with respect to the strategic resources they control. Secondly, this model assumes that these resources may not be perfectly mobile across companies and, thus, heterogeneity can be long lasting (Barney, 1991).
The resource-based view of the company pushes the value chain logic further, by examining the attributes that resources, isolated by value chain analyses, must possess in order to become the source of any sustained competitive advantage. A firm’s resources must have four key attributes in order to maintain the potential of any sustained competitive advantage (Barney, 1991): it must be valuable, rare, and imperfectly imitable and there cannot be any strategically equivalent substitutes for this resource that are valuable but neither rare nor imperfectly imitable.
THe CoMPeTITIVe PosITIon of THe ICT ManUfaCTURInG InDUsTRy In THe eConoMy of laTVIa
The ICT industry contribution to the Latvian economy in 2010 amounted to 3.6% of the total gross value added. The ICT industry in Latvia consists of ICT manufacturing, ICT wholesale and ICT services, and employs 17,900 persons in 2,899 enterprises with an annual turnover of 1,452 million LVL, see Table 1. A detailed analysis of the ICT manufacturing sector is expounded further in this study.
Table 1 Key Indicators of the Latvian ICT Sector Enterprises in 2010
Number of enterprises
Number of per-sons employed
Turnover (mln. LVL)
Value added (mln. lats)
ICT manufacturing 57 800 61 18ICT wholesale 418 2 500 621 41ICT services 2 424 14 600 770 347ICT industry total 2 899 17 900 1 452 406
Source: Central Statistical Bureau of Latvia
The ICT manufacturing industry contributed 0.7% of all industry enterprises in Latvia, engaged 0.62% of all employed persons and accounted for 9.93% of all profits before taxes in the industries sector of Latvia in 2010. The ICT manufacturing sector is represented by 57 enterprises, the number of which did not change much during 2008–2010. Only 2 new enterprises where established.
JournalEconMngmnt-makets.indd 127 20.12.2012 14:12:27

128 AN ANALYSIS OF THE COMPETITIVENESS OF THE ICT MANUFACTURING SECTOR ..
On the other hand this same ICT sector in Latvia experienced a major decline in number of employees – from 1,200 in 2008 to just 800 in 2010. The positive impact on the profitability of this sector may be seen by a recorded average 278 thousand LVL profit per enterprise in 2010. The ICT manufacturing industry experienced a small 4% decline in 2009 but in 2010 showed a strong revenue growth by 17%. The growth of value added declined from 31 million LVL in 2008 to 18 million LVL in 2010, corresponding to the global trend in which the value added of ICT hardware manufacturers is growing slower as is the GDP (Central Statistical Bureau of Latvia, 2011; IBIS World, 2012).
In comparing the local ICT industry manufacturing sector to other industries in Latvia by average value added per enterprise and average profit or loss by enterprise (see Figure 1), the ICT manufacturing related activity sector (computers, electronics, optical products) holds second place with an average profitability of 147 thousand LVL per enterprise, followed by the electricity, gas and air conditioning industries which generated 237 thousand LVL average profit per enterprise. ICT related manufacturing activity is ranked 10th and generates 238 thousand LVL of average value added per enterprise, and is ranked second by average value added per employee – 18,500 LVL (Central Statistical Bureau of Latvia, 2012).
Source: author’s calculations based on data from the Central Statistical Bureau of Latvia
Fig. 1. Average Value Added and Profits Comparison of Latvian Industry Activities, 2010
JournalEconMngmnt-makets.indd 128 20.12.2012 14:12:27
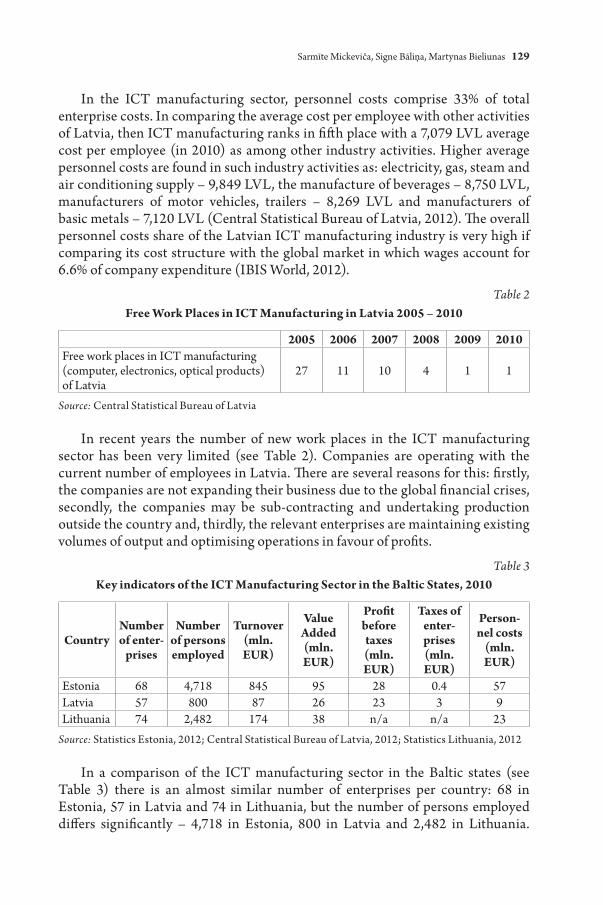
Sarmīte Mickeviča, Signe Bāliņa, Martynas Bieliunas 129
In the ICT manufacturing sector, personnel costs comprise 33% of total enterprise costs. In comparing the average cost per employee with other activities of Latvia, then ICT manufacturing ranks in fifth place with a 7,079 LVL average cost per employee (in 2010) as among other industry activities. Higher average personnel costs are found in such industry activities as: electricity, gas, steam and air conditioning supply – 9,849 LVL, the manufacture of beverages – 8,750 LVL, manufacturers of motor vehicles, trailers – 8,269 LVL and manufacturers of basic metals – 7,120 LVL (Central Statistical Bureau of Latvia, 2012). The overall personnel costs share of the Latvian ICT manufacturing industry is very high if comparing its cost structure with the global market in which wages account for 6.6% of company expenditure (IBIS World, 2012).
Table 2Free Work Places in ICT Manufacturing in Latvia 2005 – 2010
2005 2006 2007 2008 2009 2010Free work places in ICT manufacturing (computer, electronics, optical products) of Latvia
27 11 10 4 1 1
Source: Central Statistical Bureau of Latvia
In recent years the number of new work places in the ICT manufacturing sector has been very limited (see Table 2). Companies are operating with the current number of employees in Latvia. There are several reasons for this: firstly, the companies are not expanding their business due to the global financial crises, secondly, the companies may be sub-contracting and undertaking production outside the country and, thirdly, the relevant enterprises are maintaining existing volumes of output and optimising operations in favour of profits.
Table 3Key indicators of the ICT Manufacturing Sector in the Baltic States, 2010
CountryNumber of enter-
prises
Number of persons employed
Turnover (mln. EUR)
Value Added (mln. EUR)
Profit before taxes (mln. EUR)
Taxes of enter-prises (mln. EUR)
Person-nel costs
(mln. EUR)
Estonia 68 4,718 845 95 28 0.4 57Latvia 57 800 87 26 23 3 9Lithuania 74 2,482 174 38 n/a n/a 23
Source: Statistics Estonia, 2012; Central Statistical Bureau of Latvia, 2012; Statistics Lithuania, 2012
In a comparison of the ICT manufacturing sector in the Baltic states (see Table 3) there is an almost similar number of enterprises per country: 68 in Estonia, 57 in Latvia and 74 in Lithuania, but the number of persons employed differs significantly – 4,718 in Estonia, 800 in Latvia and 2,482 in Lithuania.
JournalEconMngmnt-makets.indd 129 20.12.2012 14:12:27

130 AN ANALYSIS OF THE COMPETITIVENESS OF THE ICT MANUFACTURING SECTOR ..
Although there are significant turnover differences between the Estonian and Latvian ICT manufacturing sectors, the average profit per enterprise is similar at 411 thousand EUR in Estonia and 403 thousand EUR in Latvia.
The ICT manufacturing sector in Latvia presently exports 99% of its production. ICT manufacturing exports grew by 26% in 2010, and by 18% in 2011 (see Table 4). Imports grew by 123% in 2010, and by 11% in 2011. Overall, the trade balance of the ICT manufacturing sector is positive, even though this sector is highly dependent on electronic components purchases from Asia. The main products exported are mechanical and electrical equipment, contributing 89% of all ICT manufacturing exports (NACE 2 red. group 26). The main import products were similar – mechanical and electrical equipment, making up a similar 89% of all ICT manufacturing imports in 2011.
Table 4Latvian ICT Manufacturing Export, Import and Trade Balance (in thousands of LVL)
ICT manufacturing (NACE 2 red, group 26) 2009 2010 2011*
Export 48,219 60,710 71,793Import 17,063 38,087 42,270Trade balance 31,156 22,623 29,523
Source: author’s calculations based on Central Statistical Bureau of Latvia; * provisional data
InnoVaTIon anD R&D aCTIVITIes In THe ICT seCToR
The Innovation and Research and Development (R&D) activities of ICT companies are becoming more crucial together with the overall development of the industry. Moreover, there is an observable trend that competitive ICT companies in the global economy are increasingly moving from manufacturing to innovation activities (Ning, 2007).
In the global ICT research agenda there are now eight broad priorities: the physical foundations of computing, computing systems and architectures, converging technologies such as nanotechnologies, biotechnologies and ICT imitations of natural information processing, network infrastructures, software engineering and data management, digital content technologies, human – technology interfaces and internet security and safety. R&D in the ICT sector requires large investments and is very innovative; it exceeds other industries by a large margin in most of the OECD countries. From among the European Union (EU) countries, ICT R&D expenditures recently accounted for 63% in Finland and 34% in Ireland. Another important measure of ICT R&D is to be observed in the expenditure of industry companies on R&D, where, on average, ICT manufacturing and service companies spend around 15% of their revenues on R&D and the leading companies re-invest from one-fifth up to one-third of their revenues (Dutta, Mia, 2009).
JournalEconMngmnt-makets.indd 130 20.12.2012 14:12:27
Sarmīte Mickeviča, Signe Bāliņa, Martynas Bieliunas 131
In Ireland, the government has set six technology actions in motion for ICT R&D, which is contributing to the development of a smart economy and 30,000 new, high-value and sustainable jobs. These actions have been explicitly defined: an exemplar communications test-bed based on optical burst switching; an initiative to establish Ireland as a location for energy-efficient data centres and cloud computing centres; the establishment of an international content services centre; the convergence of communications and energy technology in the development of a smart electricity network/grid; the development of a real-time remote water monitoring system; and a combined intelligent traffic/work commuting approach. By defining very clear and concise investment priorities, Ireland managed to attract foreign direct investments in those areas (Dutta, Mia, 2010).
ICT is not only R&D-intensive, but it is also innovative in terms of R&D organisation. Collaboration and internationalisation of R&D are seen as major sources of innovation for the industry. There are even such terms used as collaborative R&D and open innovation to characterise new forms of R&D. Those activities usually take such forms as: partnerships, framework agreements, R&D contracts with universities and laboratories, involvement of PhD researchers in the work of company R&D labs, R&D partnerships, industrial technology alliances, and consortia of ICT firms, all prospecting for new ideas from individuals and start-ups with promising research. The internationalisation of ICT R&D has been driven by a growing use of ICT as the basic international science and technology infrastructure, by programmes that encourage international research such as the EU Seventh Framework Programme (FP7) and by specialised organisations such as the International Technology Roadmap for Semiconductors. Although collaborative R&D is widely used, it has its limitations as, while co-operative activities between companies are working together as part of the exploration for opportunities to benefit from spillovers, nevertheless, the most development and innovation closer to the financial market is tightly guarded within the companies (Dutta, Mia, 2009).
In Latvia, such areas as quantum computing, language processing and semantic analysis, and advanced digital signal processing are all research domains that stand out among other areas and which find correspondence to global priorities – the physical foundations of computing, network infrastructures and software engineering. There are a number of organisations in Latvia with definite ICT research capabilities, adequate infrastructure, and experience in ICT research projects. Nevertheless, any collaboration and exchange of resources among ICT Centres of Excellence is rather low. Even though the poor collaboration between the academic sector and industry has been identified as a weakness, an analysis of the network reveals great potential for growth and for better ties in the future (Pascall, 2011).
Two centres for ICT research of national importance have been established. The first is the national level Research Centre on Information, Communications
JournalEconMngmnt-makets.indd 131 20.12.2012 14:12:27

132 AN ANALYSIS OF THE COMPETITIVENESS OF THE ICT MANUFACTURING SECTOR ..
and Signal-processing Technologies, which conducts research related to electronics, and electrical industrial technologies and satellite technologies, developing new products in those areas. The second centre is the ICT Competence Centre, which conducts research projects in natural languages technologies and business processes analysis areas (Balina, 2011).
The State Research Programme for Innovative Products “Scientific Foundation of Information technology” 2005–2009 has already applied for 10 patents, been involved in the establishing of 13 methodologies, and has produced 20 prototypes of products and technologies. Three competitive signal-processing technologies have also been initiated and developed: a super-sensitive ultra-wide-bandwidth signal recording technology, an effective linear object detection and segmentation technology and original wireless sensor network hardware and software platforms, all of which are now subject to further research and development (Balina, 2011).
Latvia is not yet an active player in the European ICT research area and its contribution to the development of European ICT research does not yet fully correspond to its capabilities. Latvia has participated in the FP6 and FP7 programme calls. Science and Technology expenditures for proposals with Latvian participation have been estimated at 185.7 MEurs during the period 2002–2005 and 379.4 MEurs during the period 2006–2008. The success rate of Latvian organisations in FP6 calls is 14.5% and compares to the EU average, but it is lower than for the FP7 calls – 11.1% (Pascall, 2011).
Some obstacles to the successful participation of Latvian organisations in EU research programs have been identified: the lack of a clear long-term and mid-term R&D strategy in many organisations; a low level of co-operation between the academic and industry sectors for ICT R&D; no obvious clear understanding on Framework Programme (FP) participation rules, conditions, or funding schemes; a lack of resources (Human, financial) for qualitative FP project application preparation; and no access to EU leading partnership networks (Pascall, 2011).
The Latvian government and the ICT industry should take advantage of all the opportunities being made available nationally and in the EU so as to increase the research and technology development of ICT. There is a high potential for growth and development for these organisations via participation in EU research projects in the future (Pascall, 2011).
From all patent applications received in 2006, Latvia contributed 0.5% of all ICT patent applications to the EPO from the EU-27 countries. By contrast, Estonia contributed 52.7% of ICT patent applications (European Union, 2011). Globally, ICT patents represent on average 35% of all fillings and its share is constantly rising (Dutta, Mia, 2009). The total number of patent applications is very low in Latvia at an estimated 9.04 applications per million of population, whereas in Estonia it was 32.92 per million of population in 2009 (Balina, 2011). A breakdown of patents acquired by Latvian inventors over the past few years has
JournalEconMngmnt-makets.indd 132 20.12.2012 14:12:28

Sarmīte Mickeviča, Signe Bāliņa, Martynas Bieliunas 133
been published by the Patent Office of Latvia. The data for class G and H patents are shown in the following table:
Table 5Class G and H Patent Applications Filed in Latvia
Class 2007 2008 2009G – physics 16 26 29
H – electricity 6 25 37Source: Patent Office of the Republic of Latvia Databases
The ICT industry is the global leader in R&D expenditures, employment, and patents; and as well, ICT R&D has developed new forms of organisation – both collaborative and international and which continue to evolve. There are organisations in Latvia with definite ICT research capabilities, although the degree of collaboration and exchange of resources among ICT centres of excellence is rather low and Latvian ICT R&D is not fully realising its potential in international projects. The number of filled patents in ICT is very low, so that is a challenge to any future growth of the ICT manufacturing industry and requires additional focus from ICT industry enterprises as well as from the government.
ICT ManUfaCTURInG seCToR CoMPeTITIVe PosITIon anD sTRATeGIC ResoURCes ReqUIReMenTs analysIs
The number of enterprises operating in the Latvian ICT manufacturing sector is low and yet the profits are the 3rd highest across all manufacturing industries in Latvia. The top ICT manufacturing sector players are Mikrotīkls, SAF tehnika, and Hanzas elektronika, see Table 6. The first two produce electronic products and the third is an electronics manufacturing service provider. These top three enterprises are currently generating 85% of all of Latvia’s ICT manufacturing sector turnover. Profits of the top seven players in 2010 are estimated at 20 million LVL which is higher than it was for the entire ICT manufacturing sector in 2010 – 16 million LVL and suggests that the rest of this type of enterprise could be experiencing losses.
According to the market analysts IBIS World (2012), the necessary key success factors for an enterprise to operate internationally and globally in ICT manufacturing related industries are: the establishment of brand names and reputation, economies of scale, market research, ensuring that the pricing policy is appropriate, effective cost controls, having links with suppliers, and having an extensive distribution network for brand-name manufacturers. Strong and efficient sales distribution channels are important as well as is the development of new products, access to niche markets and the undertaking of technical research and development. The top three Latvian ICT manufacturing enterprises are the
JournalEconMngmnt-makets.indd 133 20.12.2012 14:12:28

134 AN ANALYSIS OF THE COMPETITIVENESS OF THE ICT MANUFACTURING SECTOR ..
beneficiaries of several of these strategies: they have established a brand name, ensured an appropriate pricing policy and have access to the niche markets.
Table 6Top ICT Manufacturing Sector Players in Latvia, 2010
EnterpriseTurnover
2010 (mln. LVL)
Profit 2010
(th LVL)
Profit-ability %
Employ-ees
Registered trade-marks
Regis-tered
patentsMikrotīkls 37.15 11,671 31.42 80 6 0
SAF tehnika 10.90 7,780 7.16 165 2 1Hanzas elektronika 3.74 125 3.35 250 0 0
Alfa RPAR 2.00 17 0.83 250 5 0VEF Radiotehnika RRR 1.22 17 1.38 n/a 5 0
Volburg 1.20 95 7.90 n/a 0 0RD Alfa Mikroelektro-
nikas departaments 0.94 335 35.61 n/a 2 0
Total 57.15 20,039 745 20 1Source: Diena-Bonnier, 2012; Company Mikrotīkls, SAF tehnika, Hanzas elektronika, Alfa RPAR
home pages; Latvia and European patent offices
The ICT manufacturing industry is considered to have high barriers to entry. Economies of scale are one of the main entry barriers in this sector for Latvian enterprises, because the local market is too small for start-up to develop and get and significant returns from its initial investment. Start-ups are usually small enterprises and cannot qualify for larger export orders, because of other financial criteria. In order to export their products, enterprises need investments for export sales channel development. A second entry barrier is to be found in capital requirements because the enterprises need capital investment for product development, for the purchase of electronic components as well as for the sub-contracting of manufacturing service providers.
In the ICT manufacturing sector, electronic component suppliers are important, because these components are an important input to the end product and its quality. Suppliers are differentiated by their brand components providers such as Texas Instruments, Intel, Samsung etc. and the various non-brand components providers, which mainly reside in Asia, thus making the components more expensive because of transportation costs. The enterprises can find substitutes for these components but the major choice here is between price and quality. Purchases are made through a local distribution channel with clear pricing rules and discount policies.
The buyers of Latvian ICT manufacturing enterprise products are mainly from the professional or niche markets of Asia, as well as the telecommunications and energy sectors. Professional buyers typically are not very price sensitive compared to the consumer markets, and as well there is a limited number of producers specialising in those sectors, thus buyer power and leverage is
JournalEconMngmnt-makets.indd 134 20.12.2012 14:12:28

Sarmīte Mickeviča, Signe Bāliņa, Martynas Bieliunas 135
moderate. The manufacturing services enterprises mostly sell their services to Europe – Sweden, Germany. For professional and niche markets the existence of substitutes is limited, but if intellectual property is not protected, there is the risk that the product could be copied by rivals in local or overseas markets.
Product producers in the Latvian ICT manufacturing sector have to compete against global rivals in their respective markets although the major rivals for electronic manufacturing service providers – Hanzas elektronika and Volburg – are in Lithuania.
Reviewing the competitive positioning from a resources view and according to the four criteria: valuable, rare, imperfectly imitable, without equivalent substitutes – in ICT manufacturing the key resources are intellectual capital – patents, trademarks and production process quality certifications, and engineering and technical personnel, who are capable of developing intellectual capital for their enterprises. The present situation is not very promising as among the top seven Latvian ICT manufacturing enterprises there is only 1 patent and only 20 trademarks that have been registered (see Table 6).
From a resource perspective there is the need for an additional evaluation of Latvia’s long-term potential to create enterprises with a sustainable competitive advantage in this sector. Currently, alongside financial investments enterprises, there is a lack of capable engineering and technical specialists who are the primary resource for any potential ICT manufacturing enterprise growth and for the strengthening of a competitive position for Latvia in the ICT business.
There are two aspects that must be considered by people involved in resource development for ICT manufacturing – firstly, there must be a total pool of new specialists who are educated and capable of developing intellectual capital for this sector. Secondly, there must be an environment for practice possibilities for these new specialists. As there are only a very small number of enterprises at present, it will only be possible for a few specialists to join these enterprises and to develop their abilities. In order to build a platform for their business sustainability and for competitiveness sustainability, ICT manufacturing enterprises should consider participation in the development of a study programme for new specialists and to ensure the possibilities for new technical and engineering personnel to gain practical experience during their study time.
ConClUsIons
The ICT industry already contributes significantly to the Latvian economy and its contribution is expected to grow. Value added and profitability is higher than in the majority of other Latvian economy sectors. The ICT industry has a high knowledge intensity instead of production factor intensity. In this context the investments by government and private companies into the R&D of ICT become important, as does intellectual property protection with patents, trademarks and copyrights.
JournalEconMngmnt-makets.indd 135 20.12.2012 14:12:28
136 AN ANALYSIS OF THE COMPETITIVENESS OF THE ICT MANUFACTURING SECTOR ..
Latvia’s ICT manufacturing related activity sector (computers, electronics, and optical products) is in overall second place by the average profitability of its enterprise. The Latvian ICT manufacturing industry is presently exporting 99% of it products and the overall trade balance of companies operating in this sector has been positive. In summary – the overall strength of Latvia’s ICT manufacturing industry is to be seen in the high profits, high value added, industry export capability, and access to niche market established brand names and an appropriate pricing policy.
The global ICT industry is the leader in R&D expenditures, employment, and patents; and as well, ICT R&D has developed new forms of organisation – both collaborative and international – which continues to evolve. Latvia has organisations in-country with definite ICT research capabilities, but the overall R&D aspect is a weakness of the ICT manufacturing industry. There is a rather low collaboration and exchange of resources among ICT centres of excellence and the existing ICT R&D organisations are not fully realising their potential in international projects. The number of filled patents in ICT is very low, and that is challenging to the future growth and competitiveness of the ICT manufacturing industry. This will require additional focus not only from the ICT industry enterprises but also from the government.
One more observed weakness is to be seen in the limited number of persons employed by the industry and in the number of high level but under-utilised scientists and technical people capable of developing intellectual property for enterprises. The limited numbers of workforce raises personnel costs throughout the industry. While (in Latvia) this factor currently reflects 33% of all enterprise costs, the global industry benchmark is 6.6%.
An opportunity is to be found in the as yet unutilised innovation and R&D potential of Latvia in ICT enterprises and by undertaking market research for lucrative niche markets so as to enter into the future with existing brand names. Threats to success are to be recognised in the globalisation of the industry, labour cost increases and with global level competitors entering the niche markets in which Latvian enterprises are now operating.
Overall, this sector could well be regarded as one of cornerstones of Latvia’s national wealth which could be best realised by motivating present key industry players to invest into R&D, in the development of new products and patents and in supporting them via government intervention/assistance and special taxation in R&D investments and international sales. This type of strategy could bring many more new companies into the sector in the long term and, as a consequence, the pool of persons employed and specialists capable of delivering innovative products in this industry will also grow.
JournalEconMngmnt-makets.indd 136 20.12.2012 14:12:28

Sarmīte Mickeviča, Signe Bāliņa, Martynas Bieliunas 137
bibliographyBalina, S., 2011. Development of Science and Technology in Latvia, 2011. Rīga:
Ministry of Education and Science, Republic of Latvia.Balina. S, Mickevica, S., 2012. Analysis of Competitiveness of Latvia’s ICT Services
Sector. In: Proceedings of the International Scientific Conference “Economic Science for Rural Development. Rural Business and Finance”, No. 28, pp. 25-30.
Balina, S., Mickevica, S., 2012. The Analysis of Competitiveness of Latvia’s ICT Services sector. In: Proceedings of the 2012 International Conference “Economic Science for Rural Development”. Jelgava: University of Agriculture.
Barney, J., 1991. Firm Resources and Sustained Competitive Advantage. Journal of Management, volume 17, No. 1, pp. 99-120.
Central Statistical Bureau of Latvia, 2011. On the Information Society of Latvia, 2011. Collection of Statistical Data. Riga: Central Statistical Bureau of Latvia.
Central Statistical Bureau of Latvia, 2012. Databases of the Central Statistical Bureau of Latvia: Economics and Finance [online]. Available at: <data.csb.gov.lv/DATABASE/ekfin/databasetree.asp?lang=16> [Accessed 15 March 2012].
Diena-Bonnier in co-operation with Lursoft, 2012. Largest Enterprises of Latvia 2012. Top 500. Rīga.
Dutta, S., Mia, I. eds., 2009. The Global Information Technology Report 2008–2009. Mobility in a Networked World. Geneva: World Economic Forum.
Dutta, S., Mia, I. eds., 2010. The Global Information Technology Report 2009–2010. ICT for Sustainability. Geneva: World Economic Forum.
Dutta, S., Mia, I. eds., 2011. The Global Information Technology Report 2010–2011. Transformations 2.0. Geneva: World Economic Forum.
Dutta, S., Bilbao-Osorio, B. eds., 2012. The Global Information Technology Report 2012. Living in a Hyperconnected World. Geneva: World Economic Forum.
Magretta, J., 2012. Understanding Michael Porter: The Essential Guide to Competition and Strategy. Boston: Harvard Business Press.
Montgomery, C. A., Collis, D. J., 1995. Competing on Resources. Harvard Business Review, volume 73: 4, pp. 118-128.
Ning, L., 2007. Economic Liberalisation for High-Tech Industry Development? Lessons from China’s Response in Developing the ICT Manufacturing Sector Compared with the Strategies of Korea and Taiwan. Journal of Development Studies, vol. 43, No. 3, pp 562-587.
Pascall, S., 2011. Deliverable 9 Latvia − RTD Technological Audit – Simplified Report. European Communities, 2009–2011.
Porter, M., 1981. The Contributions of Industrial Organization to Strategic Management. Academy of Management Review, No 6, pp. 609-620.
Porter, M. E., 1998. Competitive Strategy: Techniques for Analyzing Industries and Competitors: with a new introduction. New York: The Free Press, p. 397.
Porter, M. E., 2008. On Competition. Boston: Harvard Business Press, Upd. Exp. Edition.
Rumelt, P. R., 1991. How Much Does Industry Matter? Strategic Management Journal, volume 12, pp. 167-185.
European Union, 2011. Science, Technology and Innovation in Europe. 2011 edition. Luxembourg: Publications Office of the European Union.
IBISWorld. Global Computer Hardware Manufacturing Market Research Report. March 2012. Santa Monica: IBISWorld [online]. Available at: <www.ibisworld.com>.
JournalEconMngmnt-makets.indd 137 20.12.2012 14:12:28

138 AN ANALYSIS OF THE COMPETITIVENESS OF THE ICT MANUFACTURING SECTOR ..
Mikrotīkls, 2012. Company home page [online]. Available at: <www.mikrotik.com> [Accessed 15 March 2012].
SAF tehnika, 2012. Company home page [online]. Available at: <www.saftehnika.com > [Accessed 15 March 2012].
Hanzas elektronika, 2012. Company home page [online]. Available at: <www.hansamatrix.com> [Accessed 15 March 2012].
Alfa RPAR, 2012. Company home page [online]. Available at: <www.alfarzpp.lv> [Accessed 15 March 2012].
European Patent Office, 2012. European Patent Office Databases [online]. Available at: <ww.epo.org/searching/free/espacenet.html> [Accessed 15 March 2012].
Patent Office of the Republic of Latvia, 2012. Patent Office of the Republic of Latvia databases. Trademark search [online]. Available at: <www.lrpv.lv/database3/index.aspx?lang=EN&id=361> [Accessed 15 March 2012].
Statistical Office of Estonia, 2012. Statistical Database of the Statistical Office of Estonia [online]. Available at: <pub.stat.ee/px-web.2001/dialog/statfile1.asp > [Accessed 15 March 2012].
Statistics Lithuania, 2012. Databases of Statistics Lithuania [online]. Available at: <www.stat.gov.lt/en/pages/view/?id=1349 > [Accessed 15 March 2012].
JournalEconMngmnt-makets.indd 138 20.12.2012 14:12:28

sUsTaInabIlITy of THe PensIon sysTeM In laTVIa
MāRIs PŪĶIs, InāRA DUnDURe*1 University of latvia
Abstract. Regardless of the fact that the Latvian pension system seems to be advanced and modern, we have recently found cause to question the sustainability of that system. The discussions on this subject have been aroused by the various alarming economic and social processes: a decrease of the social budget, the economic crisis and breakdown, the outflow of population, bad demographics, an increase of the aged population, illegal aspects of the national economy and somewhat inconsistent pension politics. The purpose of this study is to research and analyse the conditions necessary for the building of a sustainable pension system. In order to achieve the latter, the authors describe the impact of economic and social factors on the sustainability of the pension system, analyse the legislation regulating the Latvian pension system, and formulate the criteria of sustainability. The following scientific research methods have been utilised in the preparation of this work: the analytical method, the comparative method, the historical method and the logical and abstractedly constructive method.The authors have concluded that, within the existing system, a 70% replacement rate for old age pensions in Latvia is not a realistic goal and that a proper balance between family support, solidarity support and support from individual savings shall be the basis for further pension reforms within the whole European Community. A sustainable pension system will reduce the impact of inflation on savings and pensions after retirement.
Keywords: Pension system, pension schemes, sustainability, replacement rate.
JEL code: H55
InTRoDUCTIon
People nowadays are healthier and are living longer than ever before – the increase in life span is estimated at being by up to two and a half years per decade. Nevertheless, the overall demographics are declining – we are having fewer children. If nothing significant changes, most people in the European Union, as well in Latvia, will live increasingly longer lives with the life expectancy at birth for men increasing by 8.5 years and for women by 6.9 years.
Due to these circumstances, over the past decade, most European countries have reformed their pension systems with the goal of retaining sustainability
* Corresponding authors. Tel. +371 67034740, e-mail: [email protected]. Tel. +371 29166530, e-mail: [email protected]
sUsTaInabIlITy of PensIon sysTeM of laTVIa
Māris Pūķis, Ināra Dundure
Journal of Economics and Management Research Vol. 1, 2012: 139–154
JournalEconMngmnt-makets.indd 139 20.12.2012 14:12:28

140 SUSTAINABILITY OF PENSION SYSTEM OF LATVIA
and adequacy. These reforms have brought important progress, but there are signs that ongoing reforms might create risks regarding both the questions of adequacy and sustainability. Budgetary consolidation, which has become more urgent following the recent economic crisis, is essential in order to reduce public debt and to contribute to a financing of the expected future increase in public pension expenditure.
The issues of adequacy and sustainability are both relevant and interrelated. In essence, people will need to work more and longer to ensure both. Of the many existing pension systems, though different, each has its strengths and weaknesses- but they all need to consider the demographic and economic trends. Their aim must be to find a balance between sustainability and adequacy. Regardless of the fact that the Latvian pension system seems to be advanced and modern, the community has been questioning the sustainability of this system.
In this study the analytical method is utilised in the review of the influence of economic and social factors on the sustainability of the pension system, as well to analyse and study the laws and normative acts regulating the Latvian pension system. The authors have also utilised the comparative method for several assignments: an analysis of the pension systems of the European Union, an examination of the senior income replacement rate. As it is also important to recognise and comprehend the historical and political circumstances and legislative tendencies that existed during the formation of the pension system, the historical method is also explored in this study. The logical and abstractedly constructive method is also employed in order to offer some forecasts and to further define the main research results – the conditions necessary for the ensuring of pension system sustainability that have been detected by the authors during the course of this study.
1. THe PensIon PolICy of THe oRGanIsaTIon foR eConoMIC Co-oPeRATIon anD DeVeloPMenT (oeCD)
As the OECD (2011, pp.106) notes, “Retirement – income systems are diverse and often involve a number of different programmes. Classifying pension systems and different retirement–income schemes is consequentially difficult”. Furthermore, any comparison of these systems is certain to be controversial as every system has evolved from each country’s own particular economic, social, cultural, political and historical circumstances. There is no perfect system that can be applied universally around the world. Palacios (1994, pp. 3) of the World Bank in its influential report “Averting the Old Crisis” recommended a multi-pillar system for the provision of old-age income security comprising:
Pillar 1: A mandatory publicly managed tax-financed public pension.Pillar 2: Mandatory privately managed fully funded benefits.Pillar 3: Voluntary privately managed, fully funded personal savings.
JournalEconMngmnt-makets.indd 140 20.12.2012 14:12:28

Māris Pūķis, Ināra Dundure 141
More recently, Holzmann and Hinz (2005, pp. 42) of the World Bank have extended this three – pillar system to the following five-pillar approach:
Pillar 0: A basic pension from public finances that may be universal or means-tested.
Pillar 1: A mandated public pension plan that is publicly managed with contributions and, in some cases, financial reserves.
Pillar 2: Mandated and fully funded occupational or personal pension plans with financial assets.
Pillar 3: Voluntary and fully funded occupational or personal pension plans with financial assets.
Pillar 4: A voluntary system outside the pension system with access to a range of financial and non-financial assets and support.
In effect, they split the original first pillar into two and then also split the third pillar by adding a new fourth pillar which includes personal savings, home ownership and other assets held outside the pension system.
Park (2009, pp.6) in an Asian Development Bank paper suggests that a well designed pension system will have the following characteristics:
1. Broad – based in terms of both coverage and the range of risks covered.2. Sustainable over time in terms of its actuarial and financial soundness.3. Robust so that it can withstand macroeconomic and other shocks.4. Affordable from individual, business, fiscal and macroeconomic perspectives.5. Providing reasonable levels of post retirement income.6. Providing a safety net for the elderly poor.This list suggests a multiple set of objectives for any pension system and,
as Park correctly notes, different societies will need to decide on the relative importance of each objective at a particular time. Furthermore, these priorities are likely to change over time as a society’s economic and demographic circumstances change.
2. PensIons PolICy of THe eURoPean UnIon
The development of a pension system is within the competence of each of the member states of the EU. At the same time, according to Article 136 of the Amsterdam Treaty, the provision of proper social protection is a common objective of the Union and its member states. To achieve this objective, the European Council may introduce measures to encourage co-operation among member states through initiatives aimed at improving knowledge, developing exchanges of information and best practices, and promoting innovative approaches and evaluating experiences.
During the Laeken summit in December 2001, the European Council defined 11 common pension objectives. Although worded in relatively general
JournalEconMngmnt-makets.indd 141 20.12.2012 14:12:28

142 SUSTAINABILITY OF PENSION SYSTEM OF LATVIA
terms (which are easily understandable considering that a consensus of all 15 member states was needed to reach an agreement), these objectives describe the common policy of the EU in the field of pensions. In 2002, 15 member states of the EU presented their national pension strategies to the European Commission. In these strategy papers the member states had all evaluated the current situation and prospects (over the time period up to 2050) of their pension system in meeting the common objectives of the EU. On the basis of these national strategies, the European Commission drafted a joint report, evaluating the situation of different member states with respect of the 11 objectives (Council of the European Union 2003).
In 2002–2004, the Social Protection Committee of the EU was engaged in developing common indicators to compare the pension systems of the member states in a coherent way (Atkinson, Marlier and Nolan, 2004). As a new member state, Latvia must also participate in the OMC in the field of pensions.
To facilitate progress towards adequate and fiscally sustainable pensions, several procedures have been put into place, including the Europe 2020 strategy, the Open Method of Co-ordination on Social Protection and Social Inclusion, and the Stability and Growth Pact.
3. THe laTVIan PensIon sysTeM
A reform of the Latvian pension system was commenced in the beginning of 1990s. The aim of this reform was to restructure the pension system according to the new socio-economic circumstances in Latvia. Latvia was one of the first countries in Central and Eastern Europe which introduced the multi-pillar pension system and the first country in the world, which introduced the non-funded generation solidarity pension scheme based on the principles of capital accumulation. The underlying principle of this system is: the larger the contributions made today, the larger the pension will be tomorrow.
Since July 2001 there has been a three-pillar pension system in Latvia: 1) the state obligatory non-funded pension scheme; 2) the state obligatory funded pension scheme;3) the private voluntary pension scheme.
3.1. The 1st Pillar (tier) of the state Pension system
All persons making social insurance contributions are involved in the 1st tier or the state obligatory non-funded pension scheme. Paid contributions are used for the payment of old age pensions to the existing generation of pensioners.
Social insurance contributions, earmarked for the old-age pensions, are recorded in national (virtual) individual accounts that return national interest until retirement and accumulate national pension capital, while real contributions are used for
JournalEconMngmnt-makets.indd 142 20.12.2012 14:12:28

Māris Pūķis, Ināra Dundure 143
financing the present pensions expenditure. At retirement, pensions are calculated by dividing the amount accumulated in the national account by the average number of years protected for the pension payouts at each specific age of retirement.
According to the results of the Population and Housing Census, on 16 December 2011, the Central Statistics Bureau (CSB) announced that the population of Latvia is just over 2 million – that there are 2,067,887 people living in Latvia. This number representing the population has lessened since the previous Population and Housing Census, and the change was attributed due to both negative demographics (number of deaths exceeding the number of births) and migration abroad. The number of pensioners in these figures from the Central Statistical Bureau at 31.12.2011 amounted to 581,864 persons or 28% of the total Latvian population. There are 482,537 old-age pensioners, and the average size of a monthly pension is (LVL) 179.75. Only 4.5% of the pensioners receive an amount higher than (LVL) 300. The minimum amount set for the retirement pension cannot be less than the state social security benefits (the data for 31 December 2011 – (LVL) 45 and 75 for persons disabled from childhood).
3.2. The 2nd Pillar (tier) of the state Pension system
The social insurance contributions of those who participate in the 2nd pension tier or the state obligatory funded pension scheme through chosen fund managers are invested into the financial market and saved for the pension of the specific contributor. Level 2 of the Pension System was introduced on 1 July 2001. From the initiation of the Level 2 of the Pension System – until 1 January 2003 – the only manager of the funds was the State Treasury. Beginning with 1 January, 2003, private fund managers became involved in the management of these funds.
The State Social Insurance Agency (SSIA) is required to ensure functioning of the 1st and 2nd tier pension schemes. Upon reaching pension age a person may choose either to add the capital accrued within the 2nd tier of the pension system to the 1st tier and receive the pension from the state or to purchase a life pension insurance policy from a life insurance company and receive his/her pension according to the conditions thereof. The total social insurance contributions for pensions (20% of one’s salary) are divided between the 1st tier and the 2nd tier of the pension system.
Table 1Social Insurance Contributions Among the 1st and the 2nd Pension Tiers
Years the 1st tier the 2nd tier2001 – 2006 18% 2%
2007 16% 4%2008 12% 8%
2009–2012 18% 2%from 2013 14% 6%
Source: State Social Insurance Agency of Latvia, 2012.
JournalEconMngmnt-makets.indd 143 20.12.2012 14:12:28

144 SUSTAINABILITY OF PENSION SYSTEM OF LATVIA
Individuals are not required to pay any additional social tax contributions for participation in the 2nd tier. In the future, the assets accrued under the 2nd tier of the pension system together with additional profit, may account for a considerable part of the pension.
Table 2General Information on the Management of State-funded Pension Scheme Assets
Item 31/12/2011Number of managers of State-funded pension scheme assets 9Number of investment plans provided by managers of State-funded pension scheme assets (incl. private asset managers) 27
Number of participants in the State-funded pension scheme 1,156,743incl. joined voluntarily 486,227incl. registered obligatory 670,516incl. participants who have switched investment plans since the beginning of year 276, 967
Source: Financial and Capital Market Commission, 2012.
These managers are specially licensed management companies, which have more investment options, enabling them to accumulate a larger pension principal. The saving function is based on the unitisation principle, i.e. individual contributions, invested according to portfolio, and chosen by the individual, are marked in units. These units are used for accounting purposes in relation to assets and in transactions. The value of each unit, which is a subject to investment performance, is calculated as a ratio between the value of assets as at the time of calculation and the number of units registered at that same time. The average net assets per unit of investment plans at the end of accounting period 31 December 2011 was (LVL) 757.5, and the average annual assets per unit (LVL) 75.8.
Table 3Net Assets of Investment Plans for State-funded Pension Scheme Assets
Item (in thousands of lats) 31/12/2011Net assets at beginning of accounting year 828,604Net assets at end of accounting period 876,264Gain/loss of net assets arising from investments -17,467Average profitability of investment plans*, % -1.96
incl. conservative plans 1.89 incl. balanced plans 0.57 incl. active plans -3.78
* Annualized ratio of changes in net assets per unit of investment plans during the period to the value of net assets per unit of investment plans at beginning of accounting year.
Sources: Financial and Capital Market Commission of Latvia, 2012.
The annual real rate of investment returns (in lats and after investment management expenses) was – 1.96%, whereas for conservative plans it was 1.89%,
JournalEconMngmnt-makets.indd 144 20.12.2012 14:12:28

Māris Pūķis, Ināra Dundure 145
for balanced plans it was 0.57% and for active plans –3.78%. Pension funds lost (LVL) 17,467,000 of net assets arising from the investments.
2001 2002 2003 2004 2005 2006 2007 2008 2009 2010 2011
7.10 6.30 0.30 3.76 6.74 2.82 2.50 -11.5 12.33 7.59 -1.96
2.15 2.65 2.11 4.55 6.77 6.74 7.75 14.15 9.50 -0.67 2.47
Weighted average yeld per year, %
In�ation
-15
-10
-5
0
5
10
15
20%
Source: author’s construction based on profitability Investment Plans for State-funded Pension Scheme. Financial and Capital Market Commission of Latvia, 201.2 and inflation rate. Central Statistics Bureau of Latvia. 2012.
Fig. 1. Inflation rate (%) and weighted average yield per year (%) of State-funded Pension plans
Figure 1 shows the average profitability of the 2nd pension tier since its launch. In 2008, this tier suffered the biggest loss, when the profitability was –11.5%, but the inflation reached 14.5%. The annual average consumer price increase in Latvia in 2011 was 4.4%. In most EU countries in practice, this assumption has little effect on the results of pension plans assets because of indexation. In 2010 Latvia stopped indexation. Savings swell and preserve their value, if the profitability of a pension plan is higher than the inflation.
3.3. The 3rd Pillar (tier) of the Pension system
The third pension tier or the private voluntary pension scheme ensures the possibility for every individual according to his free choice to create additional savings for his pension among the private pension funds. It has been effective since 1 July 1998. Pension funds can be closed or open and they can have one or more pension schemes. Members of this pension scheme can participate in the pension plan both directly and/or by mediation of their employers. Accumulated capital remains the property of the private person irrespective of the entity that made the contributions; moreover, it is subjected to inheritance rights. By accumulating private pension capital through the pension funds, it is possible to enjoy a series of
JournalEconMngmnt-makets.indd 145 20.12.2012 14:12:29
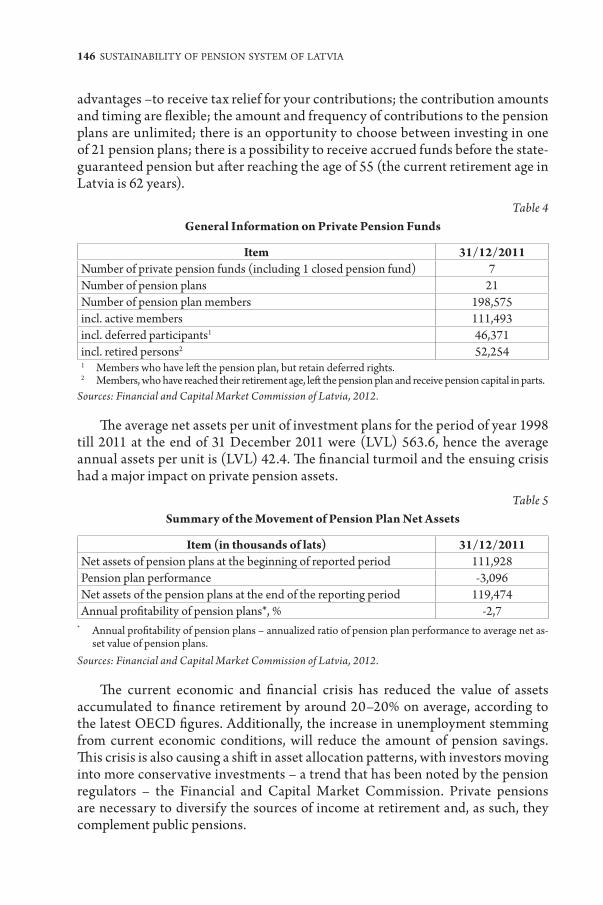
146 SUSTAINABILITY OF PENSION SYSTEM OF LATVIA
advantages –to receive tax relief for your contributions; the contribution amounts and timing are flexible; the amount and frequency of contributions to the pension plans are unlimited; there is an opportunity to choose between investing in one of 21 pension plans; there is a possibility to receive accrued funds before the state-guaranteed pension but after reaching the age of 55 (the current retirement age in Latvia is 62 years).
Table 4General Information on Private Pension Funds
Item 31/12/2011Number of private pension funds (including 1 closed pension fund) 7Number of pension plans 21Number of pension plan members 198,575incl. active members 111,493incl. deferred participants1 46,371incl. retired persons2 52,2541 Members who have left the pension plan, but retain deferred rights.2 Members, who have reached their retirement age, left the pension plan and receive pension capital in parts.
Sources: Financial and Capital Market Commission of Latvia, 2012.
The average net assets per unit of investment plans for the period of year 1998 till 2011 at the end of 31 December 2011 were (LVL) 563.6, hence the average annual assets per unit is (LVL) 42.4. The financial turmoil and the ensuing crisis had a major impact on private pension assets.
Table 5Summary of the Movement of Pension Plan Net Assets
Item (in thousands of lats) 31/12/2011Net assets of pension plans at the beginning of reported period 111,928Pension plan performance -3,096Net assets of the pension plans at the end of the reporting period 119,474Annual profitability of pension plans*, % -2,7
* Annual profitability of pension plans – annualized ratio of pension plan performance to average net as-set value of pension plans.
Sources: Financial and Capital Market Commission of Latvia, 2012.
The current economic and financial crisis has reduced the value of assets accumulated to finance retirement by around 20–20% on average, according to the latest OECD figures. Additionally, the increase in unemployment stemming from current economic conditions, will reduce the amount of pension savings. This crisis is also causing a shift in asset allocation patterns, with investors moving into more conservative investments – a trend that has been noted by the pension regulators – the Financial and Capital Market Commission. Private pensions are necessary to diversify the sources of income at retirement and, as such, they complement public pensions.
JournalEconMngmnt-makets.indd 146 20.12.2012 14:12:29

Māris Pūķis, Ināra Dundure 147
4. CoMMon obJeCTIVes foR PensIons
EU Member States (EUROPEAN ECONOMY, Koopman, et al. 2010, pp. 16) are committed to providing adequate and sustainable pensions by ensuring:
1. an adequate retirement income for all and access to pensions, which allow people to maintain, to a reasonable degree, their living standard after retirement, in the spirit of solidarity and fairness between and within generations;
2. the financial sustainability of public and private pension schemes, bearing in mind pressures on public finances and the ageing of populations, and in the context of the three-pronged strategy for tackling the budgetary implications of ageing.
3. that pension systems are transparent and well adapted to the needs and aspirations of women and men and the requirements of modern societies, demographic ageing and structural change; that people receive the information they need to plan their retirement and that reforms are conducted on the basis of the broadest possible consensus.
The old-age pension replacement rate measures how effectively a pension system provides a retirement income to replace earnings, the main source of income before retirement (Koopman, Kastrop, Bogaert and Carone, 2009).
The ‘Benefit ratio’ is the average benefit of: (i) public pension; and (ii) public and private pensions, respectively, as a share of the economy-wide average wage (gross wages and salaries in relation to employees). Public pensions used to calculate the Benefit Ratio includes old-age, early pensions and other pensions (disability and survivors). In the countries with a high at-risk-of-poverty rate, the magnitude of the decline in the Benefit Ratio is quite strong. In Latvia, the average pensions of future retirees will fall (relative to average wages), leaving its citizens facing pension sustainability risks.
Table 6 “Benefit Ratio for selected EU countries and trends in 2007–2060 (%)” shows results and prognosis before the onset of the crisis.
Table 6Benefit Ratio for selected EU countries and trends in 2007-2060 (%)
Benefit Ratio (%)Public Pensions Public and private pensions
2007 2060 % change 2007 2060 % changeLatvia 24 13 -47 24 25 4Estonia 26 16 -40 26 22 -18Lithuania 33 28 -16 33 32 -2Denmark 39 38 -4 64 75 17Hungary 39 36 -8 39 38 -3
Sources: European Commission 2009.
JournalEconMngmnt-makets.indd 147 20.12.2012 14:12:29

148 SUSTAINABILITY OF PENSION SYSTEM OF LATVIA
The “Gross Average Replacement Rate” is calculated as the average first retirement pension as a share of the economy-wide average wage, as reported by member states in the 2009 long-term projection exercise. As shown in Table 7, the generosity of the first pension from public pension schemes is set to decline by 33% in Latvia. Latvia and Estonia both show a considerable decline in the value of first pensions during the period between 2007 thus raising pension sustainability concerns in these countries. The lower the first pension, the greater is the risk that future retirees will end up in poverty. The effect on private pensions of the recent crises may also bring Latvia into this high-risk group. With a falling replacement rate there will be a tendency to extend working lives and enhance future retirement incomes.
Table 7Gross Average Replacement Rate for Selected EU Countries and Trends
in 2007-2060 (%)
Gross Average Replacement Rate (%)Public pensions Public and private pensions
2007 2060 % change 2007 2060 % changeLatvia 33 22 -33 33 33 0Estonia 28 16 -43 28 31 11Lithuania 32 29 -9 32 37 16Denmark 33 33 0 71 84 18Hungary 49 38 -22 49 43 -12
Sources: European Commission, 2009.
Replacement Rate is a case-study based calculation that shows the level of pension income in the first year after retirement as a percentage of individual earnings at the moment of take-up of pension.
Theoretical replacement rate is a measure of the impact of new pension policies. The base case calculates the retirement pension received by a hypothetical individual (male) working a full working life (40 contribution years), retiring at 62, and accumulating pension rights under the new pension scheme, and divides it by the projected wage in the immediate previous time period. It covers public pensions and mandatory private schemes, as well as private schemes that are expected to play a significant role in the future (Figure 2).
The results in Figure 2 indicate the potential of the net Replacement Rate, which was the goal of reforming the Latvian pension system – the value of the pension retirement, after taxes, should reach up to 70% of the level of earnings before retirement, after taxes and contributions.
JournalEconMngmnt-makets.indd 148 20.12.2012 14:12:29

Māris Pūķis, Ināra Dundure 149
100%
70%
50%
40%
3rd pillar – of pension system(private voluntary pension scheme)
2nd pillar – of state pension system(state obligatory funded pension scheme)
1st pillar – of state pension system(state obligatory non-funded pension scheme)
Source: author’s construction based on data: Financial and Capital Market Commission of Latvia, 2012. State Social Insurance Agency of Latvia, 2012. Central Statistics Bureau of Latvia, 2012. Citadele Private Pension Fund,2010.
Fig. 2. Theoretical replacement rate
5. THe IMPaCT of THe CRIsIs on PensIon sCHeMes anD ITs soCIal ConseqUenCes
With the financial crisis and the economic downturn, Latvians have had to assess the short – and longer – term impacts on the various elements in their pension schemes. The financial crisis adds to the economic impact of demographic ageing on pension provision, although the consequences will critically depend on the depth and length of the downturn. For public “Pay-As-You-Go” pension schemes, the slowing of the real economy is bringing about additional fiscal pressures on financing and contributions. For funded schemes, the crisis has exposed their vulnerabilities on the financial markets. In practice, the level of pensions will be affected by economic crisis, by inflation, and by discount rates and the profitability of pension plans.
Figure 3 (below) shows that Replacement Rate, including at all three levels, reaches only 42-45%.The financial crisis has highlighted the need to review the
JournalEconMngmnt-makets.indd 149 20.12.2012 14:12:29

150 SUSTAINABILITY OF PENSION SYSTEM OF LATVIA
design of the Latvian pension system and the need to determine the right balance between PAYG (Pay-As-You-Go) systems and fully funded systems. In comparing the situation of Latvia with other European countries, one can conclude that Replacement Ratio is one of the lowest within the EU 27 countries (see table 7).
Replacement rate 38%-45%
100%
40-42%42-45%
38%3rd pillar (tier)2nd pillar (tier)
1st pillar (tier)
Source: author’s construction based on data: Financial and Capital Market Commission of Latvia,2012. State Social Insurance Agency of Latvia, 2012. Central Statistics Bureau of Latvia.2012.
Fig. 3. Replacement rate (2012)
The crisis will affect all pension designs and has revealed several shortages such as the poor interaction between public and private pillars. Some governments, for example, Argentina, have de facto nationalised the private pensions, and there are policy discussions in progress about the possibility of reverting back towards PAYG public pensions in some Central and Eastern European countries (Hungary, some activities in Estonia, Lithuania and Poland).
In order to achieve a situation in Latvia in which the Replacement Rate is 70% of the pre-retirement income, it will be necessary to change community and individual attitudes towards their old age. It is therefore important to introduce the 4th pension tier. The existing pension system does not provide income for 70% substitution level. With savings in private pension funds and with an introduction of the 4th pension tier it would be possible to achieve a 70% of pre-retirement income. The recognition of the fourth pillar highlights the important role of the financial and non-financial assets in financially supporting the individual or household during retirement.
JournalEconMngmnt-makets.indd 150 20.12.2012 14:12:29

Māris Pūķis, Ināra Dundure 151
Although the pension schemes of each of the European countries differ, all of them face the same contemporary demographic and economic risks. To continue on the path towards reaching sustainability, it must be noted that the current crisis (and economic problems as such), due to lower growth prospects and increasing deficit and debt affect, all serves to influence the present-day employees and particularly the younger generations. The crisis affects all levels of the pension system, which are interlinked, since macro-economic stability and well-functioning labour and financial markets are essential for any pension system as a whole to function well. Being aware of unemployment problems and working longer must be strongly encouraged – it is the only way to reach the adequacy-sustainability balance.
It is interesting to explore the changes that were made in the Hungarian pensions system in 2010–2011. The objective of a comprehensive pension reform process that is currently under way in Hungary is to return to the two-pillar pension system based on social solidarity, on the one hand, and on voluntary contributions, on the other. The major changes that Hungary made to its mandatory two-pillar pension system in the latter half of 2010 were designed to address the perceived under-performance of the funded second pillar, and to encourage people to work longer and, in recognition and support of family life, to provide a fairer system for women who had child-rearing responsibilities and a qualifying service period of at least 40 years.
6. CRITeRIa of sUsTaInabIlITy
Analyses of the impact of the world economic crisis have shown that all tiers of the Latvian pension system are threatened. The decreasing of salaries and the increasing of unemployment all lead to necessity for an increase in the share of the first tier from 12% to 18% in order to preserve pension levels as prescribed by law. The dropping of second and third tier profitability to negative values is leading to real losses instead of the foreseen savings.
The negative impact of crisis is natural. The full economic cycle, including increasing phase and decreasing phase, is much more important for social security taxpayers. Normally, the payments period includes several economic cycles. During the current period the main factors in an outcome are the:
1. impact of family support after retirement, compared with pension support;2. impact of indexation of pensions after retirement;3. impact of tax-rate during the social security payment;4. difference between inflation and profitability of funded pensions.In actual fact, the achievement of the predicted Replacement Rate according
the post crisis scenario based on fiscal discipline is impossible. First of all, it depends on the difference between inflation and profitability. During the past decade the inflation rate was substantially greater than profitability of the second
JournalEconMngmnt-makets.indd 151 20.12.2012 14:12:29

152 SUSTAINABILITY OF PENSION SYSTEM OF LATVIA
and third tier pension funds. Therefore, at the moment of retirement, the impact on the funded pensions will be very small.
Compared with funded pensions, the financial basis of the first tier (solidarity of ages) is not vulnerable by inflation. In Latvia, the average salaries are three times smaller than the average productivity (compared to EU figures). That means that there is an objective necessity to increase salaries faster than the inflation. The basis of solidarity pensions during the past decade has increased by more than 3 times; the basis of the funded pensions during the past decade has increased only by several percent. Therefore, the first tier pension basis, during working years, increases much more than the basis for the funded pensions. The effect of demography is much less than that of inflation.
The next important shortage affecting the welfare of retired persons depends on the rate of inflation after retirement. The first tier is dependent on indexation. The second and third tier profitability depends on management and inflation rate. If profitability is reduced, then the sustainability of those tiers is under question.
The welfare of a retired individual depends substantially on family support. The crisis is the facilitating factor for the need to rethink the role of the traditional family model. The right balance between family support, solidarity support and support from individual savings should be discussed again and again.
Technological progress has lead to the present situation in which only a very small part of the workforce are producing goods from industry and agriculture. The majority of the workforce is occupied in dealing with different kinds of services, a substantial part of which are not important for pensioners. The bureaucracy could be substantially decreased, if society and politicians could agree on a substantial reduction of the amount and content of normative regulation. If society decreased bureaucratisation and lessened the purchase of luxury services, then the Replacement Rate could be decreased.
The issue of sustainability may also be analysed from fiscal and macro-economic points of view. Latvia has a comparably high rate of taxes from wages. During the crisis, attempts to increase tax rates on individual income tax as well as compulsory social insurance tax were undertaken. Such increases stimulated the illegal economy, but did not give any positive fiscal result. There are signs that both components of taxes from wages will be reduced in order to ensure greater revenues for pensions.
Thus, the criteria for sustainability of pension system could be formulated in such a way:
1. Substantial part of the retired persons’ welfare will depend on family support.
2. Pensions have to ensure:• anincreasingofthepensionbasefasterthantheinflationrate;• acompensationforinflationimpactafterretirement;• theinterest/motivationofemployeestopaysocialinsurancetax;• aminimalrevenuesstandardforthepoor.
JournalEconMngmnt-makets.indd 152 20.12.2012 14:12:29

Māris Pūķis, Ināra Dundure 153
3. A compulsory social insurance tax as the basis for state pensions must be so small as to stimulate an active investments policy, thus creating jobs and economic development.
A discussion on the sense of state-funded pensions allocation into national economics and about the multiplicative effect of this allocation is also necessary. An assessment of such an allocation could be reached on the basis of a public good concept-evaluating impact not only on future pensioners, but also on the economics of state and local government budgets and household expenditures.
ConClUsIons
1. A Sustainable Pension system must ensure that older people are not placed at risk of poverty and can enjoy a decent standard of living. A 70% replacement Rate for old age pensions in Latvia is not a realistic goal.
2. The Financial sustainability of pension systems and the adequacy of these pensions are dependent upon the efficiency, availability and security of provisions of state-funded and private pension funds. Administrative policy must stimulate a reduction of bureaucracy and an increase of the productivity of both the private and public sectors in order to reduce Replacement Rate.
3. A Sustainable Pension system reduces the impact of inflation on savings and pensions after retirement. Those components of the pension system, which cannot ensure such reduction, should be excluded from compulsory social insurance.
4. A Social Policy must stimulate the increasing of the role of family to ensure the welfare of retired persons. The right balance between family support, solidarity support and support from individual savings is a challenge for further research and shall be the basis for further pension reforms.
bibliographyAtkinson, A. B., Marlier, E. and Nolan, B., 2004. Indicators and Targets for Social
Inclusion in the EUROPEAN UNION. Journal of Common Market Studies. Vol. 42, No. 1, pp. 47-75.
Antolin, P., Stewart, F., 2009. Private Pensions and Policy Responses to the Financial and Economic Crisis [pdf]. Available at: <www.oecd.org/dataoecd/37/54/42601323.pdf> [Accessed 15 February 2012].
Bonoli, G., 2003. Two Worlds of Pension Reform in Western Europe. Journal Comparative Politics. Vol. 35, No. 4, pp. 399-416.
CEC, 2010. Green Paper: Towards adequate, sustainable and safe European pension systems [pdf]. COM 365 final, Brussels, EC 830. Available at: <http://ec.europa.eu> [Accessed 20 March 2012].
CEC, 2010. Progress and key challenges in the delivery of adequate and sustainable pensions in Europe [pdf]. OCCASIONAL Papers 71. Available at: <http://ec.europa.eu/economy finance/publications> [Accessed 10 February 2012].
JournalEconMngmnt-makets.indd 153 20.12.2012 14:12:29

154 SUSTAINABILITY OF PENSION SYSTEM OF LATVIA
Central Statistics Bureau of Latvia, 2012. Consumer price changes (annual average) [online]. Available at: <http://www.csb.gov.lv/statistikas-temas/paterina-cenas-galvenie-raditaji-30385.html> [Accessed 10 April 2012].
Central Statistics Bureau of Latvia, 2012. Wages and Salaries – Key Indicators. [online] Available at: http://www.csb.gov.lv/en/statistikas-temas/wages-and-salaries-key-indicators-30608.html [Accessed 5 April 2012].
Financial and Capital Market Commission of Latvia, 2012. Management of the assets of the State Funded Pension scheme 4Quarte 2011 [online]. Available at: <http://www.fktk.lv/lv/statistika/pensiju_fondi/ceturksna_parskati/2012-02-23_valsts_fondeto_pensiju_s/ > [Accessed 17 April 2012].
Financial and Capital Market Commission of Latvia, 2012. Management of the Private Pension Funds 4Quarte 2011. [online]. Available at: < http://www.fktk.lv/lv/statistika/pensiju_fondi/ceturksna_parskati/2012-02-23_privato_pensiju_fondu_da/> [Accessed 20 April 2012].
OECD, 2011. Pensions at a Glance: Retirement – income systems in OECD and G20 countries [pdf]. OECD Publishing. Available at: <www.dgaep.gov.pt/upload//RIareas/Pensions_at_a_glance_2011.pdf> [Accessed 10 February 2012].
Ministry for National Economy of Hungary. The reform of the Hungarian pension system [pdf]. Available at: <http://www.mfa.gov.hu/NR/rdonlyres/97A1F1F0-92D7-42AE-A8AD-49A260C81066/0/ThereformoftheHungarianpensionsystem.pdf> [Accessed 10 April 2012].
Grech, A. G., 2010. Assessing the sustainability of pension reforms in Europe [pdf]. Centre for Analysis of Social Exclusion London School of Economics. Available at: <http://sticerd.lse.ac.uk/dps/case/cp/CASEpaper140.pdf> [Accessed 15 January 2012].
Holzmann, R., Hinz, R., 2005. Old – Age Income Support in the 21st Century. The World Bank. Washington.
Koopman, G.-J., Kastrop, C., Bogaert, H. and Carone, G., 2009. Ageing Report: Economic and budgetary projections for the EU-27 Member States (2008–2060) [pdf]. Europen Economy 2/2009. Available at: <http://ec.europa.eu/economy_finance/publications/publication14992_en.pdf> [Accessed 10 February 2012].
Park, D., 2009. Ageing Asias Looking Pension Crisis [pdf]. ADB Working Paper Series, No. 165. Available at: <http://www.oecd.org/dataoecd/44/18/48239408.pdf> [Accessed 5 February 2012].
Palacios, R. J., 1994. Averting the Old Crisis [pdf]. The World Bank report. Available at: <http://www-wds.worldbank.org/external/default/WDSContentServer/WDSP/IB/1996/02/01/000009265_3961214125318/additional/104504322_ 20041117180511.pdf> [Accessed 5 February 2012].
State Social Insurance Agency of Latvia, 2012. 2nd Tier – Mandatory State Funded Pension Scheme [online]. Available at: <http://www.vsaa.lv/en/pakalpojumi/stradajosajiem/2-pensiju-limenis> [Accessed 25 September 2012].
Zaidi, A., 2010. Fiscal and Pension Sustainability: Present and Future Issues in EU Countries [pdf]. EUROPEAN CENTRE. Available at: <http://www.euro.centre.org/data/1267020891_76093.pdf> [Accessed 15 January 2012].
Zaidi, A., 2010. Sustainability and Adequacy of pensions in EU countries: Synthesis from a Cross-national Perspective. The Journal of Poverty and Social Justice. Paper No. 15/2010, pp. 229-311.
JournalEconMngmnt-makets.indd 154 20.12.2012 14:12:30

JournalEconMngmnt-makets.indd 155 20.12.2012 14:12:30

Journal of Economics and Management Research. Volume 1, 2012
LU Akadēmiskais apgādsBaznīcas iela 5, Rīga, LV-1010
Tālrunis 67034535
Iespiests SIA «Latgales druka»
JournalEconMngmnt-makets.indd 156 20.12.2012 14:12:30