journal of anthropological archaeology - mark...
TRANSCRIPT

Innovation and cultural transmission in the American Paleolithic:Phylogenetic analysis of eastern Paleoindian projectile-point classes
Michael J. O’Brien a,⇑, Matthew T. Boulanger a, Briggs Buchanan b, Mark Collard c,d, R. Lee Lyman a,John Darwent e
aDepartment of Anthropology, University of Missouri, Columbia, MO 65211, USAbDepartment of Anthropology, University of Tulsa, Tulsa, OK 74104, USAcHuman Evolutionary Studies Program and Department of Archaeology, Simon Fraser University, Burnaby V5A 1S6, CanadadDepartment of Archaeology, University of Aberdeen, Aberdeen AB24 3UF, UKeDepartment of Anthropology, University of California, Davis, CA 95616, USA
a r t i c l e i n f o
Article history:
Received 26 November 2012
Revision received 2 March 2014
Keywords:
Cladistics
Classification
Clovis
Cultural transmission
Fluted points
a b s t r a c t
North American fluted projectile points are the quintessential temporally diagnostic artifacts, occurring
over a relatively short time span, from ca. 13,300 calBP to ca. 11,900 calBP, commonly referred to as the
Early Paleoindian period. Painting with a broad brush, points from the Plains and Southwest exhibit less
diversity in shape than what is found in the East, especially for the later half of the Early Paleoindian per-
iod. It remains unclear how various fluted-point forms relate to each other and whether the continent-
wide occurrence of the earliest fluted-point forms represents a single cultural expression, albeit with
regional differences. We used phylogenetic analysis to evaluate fluted-point classes from the eastern
United States. Preliminary results suggest that there is both temporal and spatial patterning of some clas-
ses and that much of the variation in form has to do with modifications to hafting elements. Although our
analyses are presently at a coarse scale, it appears that different kinds of learning could contribute in part
to regional differences in point shape.
� 2014 Elsevier Inc. All rights reserved.
Introduction
The earliestwell-documentedhumanoccupationofNorthAmer-
ica is marked by the occurrence of bifacially chipped and fluted pro-
jectile points. The antiquity of these points—ca. 13,300–11,900
calendar years before present [calBP], a time span referred to as
the Early Paleoindian period—was first documented in the American
Southwest at Folsom and Blackwater Draw, New Mexico (Cotter,
1937, 1938; Figgins, 1927),where theywere foundwith the remains
of extinct animals such as mammoth and large bison. Since those
early discoveries in the late 1920s and early 1930s, archaeologists
have recovered fluted points throughout the contiguous United
States, Alaska, southern Canada, and northernMesoamerica (Ander-
son and Faught, 1998, 2000; Anderson et al., 2010; Buchanan and
Collard, 2007, 2010; Buchanan et al., 2012; Goebel et al., 2008;
Haynes, 1964; Holliday, 2000; Prasciunas, 2011; Sanchez, 2001;
Sholts et al., 2012; Smallwood, 2012; Waters and Stafford, 2007).
Point shape was not consistent throughout the Early Paleoin-
dian period. Between ca. 13,300 calBP and 12,800 calBP in theWest
and between ca. 12,800 calBP and 12,500 in the East (Gingerich,
2011; Haynes et al., 1984; Haynes, 2002; Holliday, 2000; Levine,
1990) there was a single type of point, termed ‘‘Clovis,’’ which
has parallel to slightly convex sides and a concave base, and exhib-
its a series of flake-removal scars on one or both faces that extend
from the base to about a third of the way to the tip (Fig. 1) (Bradley,
1993; Buchanan and Collard, 2010; Morrow, 1995; Sholts et al.,
2012; Wormington, 1957).
This description may perhaps give the impression that Clovis
points do not vary, but this is not the case. They are, in fact, quite
variable—considerably more than is evident in Fig. 1. This brings
into focus an issue that we treat in detail later but should mention
here: When we said in the preceding paragraph that ‘‘there was a
single type of point, termed ‘Clovis,’’’ we should have made clear
that what we really mean is something like this: ‘‘Despite obvious
variation in point shape, archaeologists typically refer to early flu-
ted points by one name—Clovis.’’ Sometimes other names are used
for regional variants—Western Clovis and Redstone, for example—
but ‘‘Clovis’’ is the time-honored default label for a morphologi-
cally variable category.
The key analytical question is, what accounts for the variation in
Clovis point shape? Is it the result of drift—that is, is it random—or is
http://dx.doi.org/10.1016/j.jaa.2014.03.001
0278-4165/� 2014 Elsevier Inc. All rights reserved.
⇑ Corresponding author. Fax: +1 573 882 3404.
E-mail address: [email protected] (M.J. O’Brien).
Journal of Anthropological Archaeology 34 (2014) 100–119
Contents lists available at ScienceDirect
Journal of Anthropological Archaeology
journal homepage: www.elsevier .com/ locate / jaa

there perhaps an adaptive reason that results in regional pattern-
ing? The latter position—what has been called the regional environ-
mental adaptation hypothesis (Buchanan et al., 2014)—holds that
Clovis groups adapted their hunting equipment to the characteris-
tics of their prey and local habitat, which resulted in regional differ-
ences in projectile-point form (Anderson, 1990; Meltzer, 1988,
1993; Smallwood, 2012; Storck and Spiess, 1994; Witthoft, 1952,
1954). The alternate position—the continent-wide adaptation
hypothesis (Buchanan et al., 2014)—holds that Clovis groups did
not adjust the shape of their points in relation to local environmen-
tal conditions (Buchanan and Hamilton, 2009; Byers, 1954; Haynes,
1964; Kelly and Todd, 1988; Krieger, 1954; Morrow and Morrow,
1999; Robinson et al., 2009; Sholts et al., 2012; Willey and Phillips,
1958). Recent geometric morphometric analysis of a sample of 241
Clovis points from 30 dated assemblages across North America
(excluding the Far West and Southeast) showed that significant
morphological differences do occur, both at the gross level of East
versus West (using the Mississippi River as a dividing line) and be-
tween some subregions, leading Buchanan et al. (2014) to conclude
that Clovis peoplemodified their points to suit the characteristics of
local prey and/or the habitats in which they hunted. We return to
this proposition in the Discussion section.
In the West, especially the Plains and Southwest, Clovis points
were followed by ‘‘Folsom’’ points, which tend to be smaller in size
than Clovis points and to have more-invasive channel flakes (Ahler
and Geib, 2000; Buchanan and Collard, 2010; Collard et al., 2010;
Crabtree, 1966; Wormington, 1957) (Fig. 2). Our impression is that
Folsom points are more standardized in terms of shape than Clovis
points, perhaps reflecting strict requirements imposed by the haf-
ting technique (Amick, 1995; Buchanan, 2006; Judge, 1970; Tunnell
and Johnson, 1991). There was no such large-scale standardization
in the East, where Clovis points were followed by a host of fluted
forms such as Gainey/Bull Brook and Crowfield in the Northeast
and Great Lakes region; Dalton, Quad, and Cumberland over much
of the South and Midsouth; and Simpson and Suwannee in the ex-
treme Southeast (Anderson, 1990; Anderson et al., 1996, 2010;
Bradley, 1997; Bradley et al., 2008; Brennan, 1982; Bullen, 1968;
Goodyear, 1982; Lewis, 1954; MacDonald, 1968; Mason, 1962;
O’Brien et al., 2001; Robinson et al., 2009; Thulman, 2007, 2012)
(Fig. 2). Because of a paucity of radiometric dates from many areas
of the East, especially the Southeast (O’Brien et al., 2001), it is in
some cases difficult to tell how much of the variation is synchronic
and how much is diachronic (see below).
How do we explain what appears to be even greater regional
point diversity in the later portion of the Early Paleoindian period
in the East than what occurred with Clovis points? Was it a contin-
uation of the regional adaptation proposed by Buchanan et al.
(2014) for Clovis variation, or could the diversity at least in part re-
flect differences in how people learned to make weaponry and how
they transmitted that information intra- and intergenerationally?
Differences in learning strategies have been suggested as the
explanations for geographic patterning in arrowhead form in the
Great Basin (Bettinger and Eerkens, 1999), and this hypothesis
has been supported by laboratory experiments (Mesoudi and
O’Brien, 2008a, 2008b). It is possible that a similar phenomenon
structured the patterning evident across much of North America
during the post-Clovis portion of the Paleoindian period.
Importantly, the two hypotheses are not mutually exclusive.
Anderson and Faught (2000) point out that disruptions in climate
and food resources associated with the Younger Dryas (12,890–
11,680 calBP), coupled with the disappearance of megafauna
(Boulanger and Lyman, 2014; Grayson, 2007; Meltzer and Mead,
1983), can be expected to have led to changes in logistic patterns
(but see Polyak et al., 2012). Large-distance movements may have
givenway tomore-localizedmovements geared toward awider range
of small animals andplants. Anderson and Faught (2000) propose that
the distribution of several projectile-point types—Suwannee and
Simpson (Fig. 2), for example—within circumscribed ranges in the
southeastern United States might reflect the beginning of that trend.
Over a decade ago, we began a series of projects aimed at clar-
ifying the relationships among Paleoindian point forms (Buchanan
and Collard, 2007, 2010; Collard et al., 2010, 2011; O’Brien et al.,
2012), several of which focused on points from the Southeast
(O’Brien and Lyman, 2000, 2003; O’Brien et al., 2001, 2002,
2013). Independent temporal control was largely unavailable for
the region—a condition largely unchanged today—but even if it
had been available, we were interested in more than simply con-
structing a chronological record of what came before or after
something else. Rather, we were interested in patterns of cultural
descent: which point forms were ancestral to which other point
forms. To find and evaluate these patterns, we used a method
known as cladistics, which creates hypotheses of evolutionary des-
cent with explicit rules surrounding changes in the form of things,
be they organisms, languages, or artifacts, through time. Cladistics
generates phylogenetic trees, which are testable hypotheses of
relatedness. Trees show change within lineages and can be used
Fig. 1. Clovis points from various North American sites. Photo by Charlotte D.
Pevny; courtesy Michael R. Waters.
Fig. 2. Examples of Paleoindian fluted projectile points from North America: (a)
Clovis (Logan Co., Kentucky); (b) Dalton (Lyon Co., Kentucky); (c) Folsom (Roosevelt
Co., New Mexico); (d) Cumberland (Colbert Co., Alabama); (e) Gainey/Bull Brook
(Essex Co., Massachusetts); (f) Crowfield (Addison Co., Vermont).
M.J. O’Brien et al. / Journal of Anthropological Archaeology 34 (2014) 100–119 101
to construct an ordinal-scale sequence of point evolution. Essen-
tially, this means that in certain cases we can potentially deter-
mine not only which point form preceded another form but
which form was ancestral to another.
In this paper we extend our previous analysis of Paleoindian
points from the Southeast. We add specimens from the Middle
Atlantic and the Northeast as well as additional specimens from
the Southeast. This much broader coverage allows us to detect
phylogenetic relationships not seen previously and provides a ba-
sis for making preliminary inferences about the transmission of
information relative to point manufacture. Although in the follow-
ing section we refer to well-known point types, in our analysis we
used paradigmatic classes because of the ambiguity inherent in
existing point typologies. We discuss this in more detail later.
Background
As noted above, usual practice is to place the Clovis period be-
tween ca. 13,300 calBP and 12,800 calBP in the West and between
ca. 12,800 calBP and 12,500 in the East (Gingerich, 2011; Haynes
et al., 1984; Haynes, 2002; Holliday, 2000; Levine, 1990), although
more-restrictive date ranges have been proposed (e.g., Waters and
Stafford, 2007). Our assessment of the data from the Debra L. Fried-
kin site in central Texas (Waters et al., 2011), however, suggests
that Clovis may be considerably older than usual practice suggests
(Buchanan et al., 2014). There, the Buttermilk Creek Complex
(BCC), which is posited to be pre-Clovis in age and underlies a
Clovis assemblage, may actually be a Clovis assemblage, albeit
one that is missing a few kinds of tools (including Clovis points)
and manufacturing by-products often found at Clovis sites in the
West. If so, and the dating of the BCC is accurate—and, despite
questions that have been raised (Morrow et al., 2012), we see no
reason to suspect that the dating is not accurate (Driese et al.,
2013; Jennings, 2012)—the appearance date of Clovis is pushed
back to as early as 15,000 calBP.1 This is perhaps not surprising,
as the general expectation in archaeology and palaeontology is that
most first-appearance dates are underestimates. Taphonomic
processes are such that the probability of a given first-appearance
date being too young is high. Thus, the discovery of a Clovis assem-
blage older than the known Clovis first-appearance date was to be
expected (Waguespack, 2007)—an expectation made all the more
realistic when one considers that less than two dozen or so North
American Clovis sites have been directly radiocarbon dated (Waters
and Stafford, 2007). In other words, we have an exceptionally small
sample to begin with.
Jennings and Waters (2014) recently presented the results of
three comparisons made between the BCC and Clovis components
from several western Clovis sites—including the identified 2.5-cm-
thick Clovis component that overlies the BCC at Debra L. Friedkin—
that in their opinion demonstrates that BCC is ‘‘distinct from but
similar to Clovis [and] could represent an ancestral assemblage
from which Clovis is derived’’ (pp. 25–26). The comparisons were
in terms of (1) site-level behaviors in stone reduction and site-
use activities; (2) technological and typological trait lists; and (3)
phylogenetic relatedness. Not surprising, there were differences
between the BCC and other assemblages. Similarly, it was unsur-
prising that from a phylogenetic standpoint the BCC was most re-
lated to the overlying Clovis component at Debra L. Friedkin and
less related to Clovis sites in Arizona (Blackwater Draw [Boldurian
and Cotter, 1999; Cotter, 1937, 1938] and Murray Springs [Haynes
and Hemmings, 1968; Haynes and Huckell, 2007; Hemmings,
1970]). Abundant evidence from both eastern and western Clovis
assemblages indicates substantial variation in lithic toolkits. For
example, Meltzer (1988) showed that different toolkits were used
by Paleoindians in two different subregions of the East and, in an
earlier study focused on a single tool type, Wilmsen (1970) argued
that Clovis and later Paleoindian end scrapers were used differ-
ently between the East and West. In the East they were used for
wood and bone working, whereas in the West they were used pri-
marily for butchering and hide working.
Given that cladistics is the approach that underlies the analysis
we present here, we applaud Jennings and Waters’s use of the ap-
proach—similar to what Buchanan and Collard (2008a) did in their
reassessment of relationships among Denali, Nenana, and Clovis
assemblages—in an attempt to sort out phylogenetic relatedness
with respect to the BCC and Clovis. We would, however, like to
see more, and larger, samples used in the cladistic analysis and
an attempt made to control for spatial variation. Still, whether
one quibbles over whether the BCC is early Clovis or something
slightly earlier, and perhaps ancestral to Clovis, the significance
of the BCC for what it tells us about a critical period in North Amer-
ican prehistory is not in doubt.
Where did Clovis point manufacture originate? It has long been
suspected that Clovis points originated in the West—the earliest
radiocarbon dates (not all of them are universally accepted [e.g.,
Waters and Stafford, 2007]) are from the Aubrey site in northern
Texas (ca. 13,450 calBP) and the Sheaman site in Wyoming
(13,210 calBP)—but one credible date from the Southeast—Sloth
Hole in Florida (Waters and Stafford, 2007), at 12,900 calBP—falls
inside the 13,300–12,800 calBP date range. With the exception of
six radiocarbon dates on hawthorn (Crataegus sp.) seeds from
Shawnee-Minisink in Pennsylvania (Dent, 2007; Gingerich, 2007),
at ca. 12,865 calBP, the earliest dates from sites in the Northeast
with large numbers of fluted points—Bull Brook in Massachusetts
(Byers, 1954; Robinson et al., 2009), Vail in Maine (Gramly,
1982), and Debert in Nova Scotia (MacDonald, 1968)—consistently
fall later than the earliest fluted-point dates in the West (Bradley
et al., 2008; Curran, 1996; Haynes et al., 1984; Levine, 1990; Miller
and Gingerich, 2013; Robinson et al., 2009).
Based more on the fact that the earliest dates in the Northeast
are later than those in the West, together with an almost complete
lack of dates from the Southeast, archaeologists have long assumed
that Clovis points originated in the West and spread eastward.
There was, however, an exception. Observing that a greater num-
ber of points and a greater richness of point forms occurred in
the Southeast than elsewhere in North America, Mason (1962) con-
cluded that fluted points were not a western invention that had
been diffused to eastern parts of the country, perhaps as Plains
groups escaped the drying effects of the terminal Pleistocene.
Rather, it was the other way around:
the distributional and some of the typological evidence, as cur-
rently understood, would not seem to favor the proposed wes-
tern origin for the development of Clovis points and the Llano
complex. On the contrary, fluted points of every description
except Folsom are far more numerous in the East, particularly
in the southeastern United States, than they are in the South-
west or on the High Plains; and this area also has produced
the greatest diversification in fluted point styles. On these
grounds, then, it is defensible to suggest the southeastern Uni-
ted States, and not the West, as a possible ‘‘homeland’’ of the
Clovis complex. (Mason, 1962: 234–235)
Mason’s proposal was endorsed in some quarters, either tenta-
tively or wholeheartedly (e.g., Bryan, 1991; Griffin, 1977; Meltzer,
1988; Painter, 1983; Stanford, 1991), although he had few quantita-
1 Dating at Debra L. Friedkin was done through optically stimulated luminescence
of terrace sediments. Two OSL ages immediately below the Clovis horizon date to
14,350 + 910 BP and 14,070 + 910 BP, and two ages at the top of the Clovis horizon
date to 13,780 + 885 BP and 13,090 + 830 BP. The latter age agrees with Waters and
Stafford’s (2007) accepted age of Clovis.
102 M.J. O’Brien et al. / Journal of Anthropological Archaeology 34 (2014) 100–119
tive data to support his proposition. Two decades later, Louis Bren-
nan, editor of Archaeology of Eastern North America, attempted to ad-
dress this deficiency by initiating a survey of fluted point finds in the
eastern United States. Brennan (1982) reported 5280 fluted points
from east of the Mississippi River, with almost all respondents to
the survey noting that their counts likely underestimated the ‘‘real’’
count by a considerable amount. Although laudable, Brennan’s sur-
veywas sharply criticized for a variety of reasons (e.g., Griffin, 1983;
Haynes, 1983;Moeller, 1983),most having to dowith sampling bias,
yet the basic concept of statewide and continental surveys of fluted
points remains relevant tomodern research questions (e.g., Anderson,
1990, 1991; Anderson and Faught, 1998, 2000; Anderson and
Gillam, 2000; Anderson et al., 2010; Faught et al., 1994; Stanford
and Bradley, 2012; Steele et al., 1998).
Mason’s hypothesis of a southeastern origin for fluted points re-
mains controversial, but there is general agreement with his state-
ment that eastern North America contains a greater number of
fluted points (Anderson and Faught, 1998, 2000; Stanford and
Bradley, 2012; Steele et al., 1998) as well as a greater diversity of
fluted-point forms than western North America (Anderson and
Faught, 1998, 2000). Archaeologists, however, have yet to reach
consensus on how, if at all, these various point forms relate to
one another (O’Brien et al., 2001, 2002). In creating sequences of
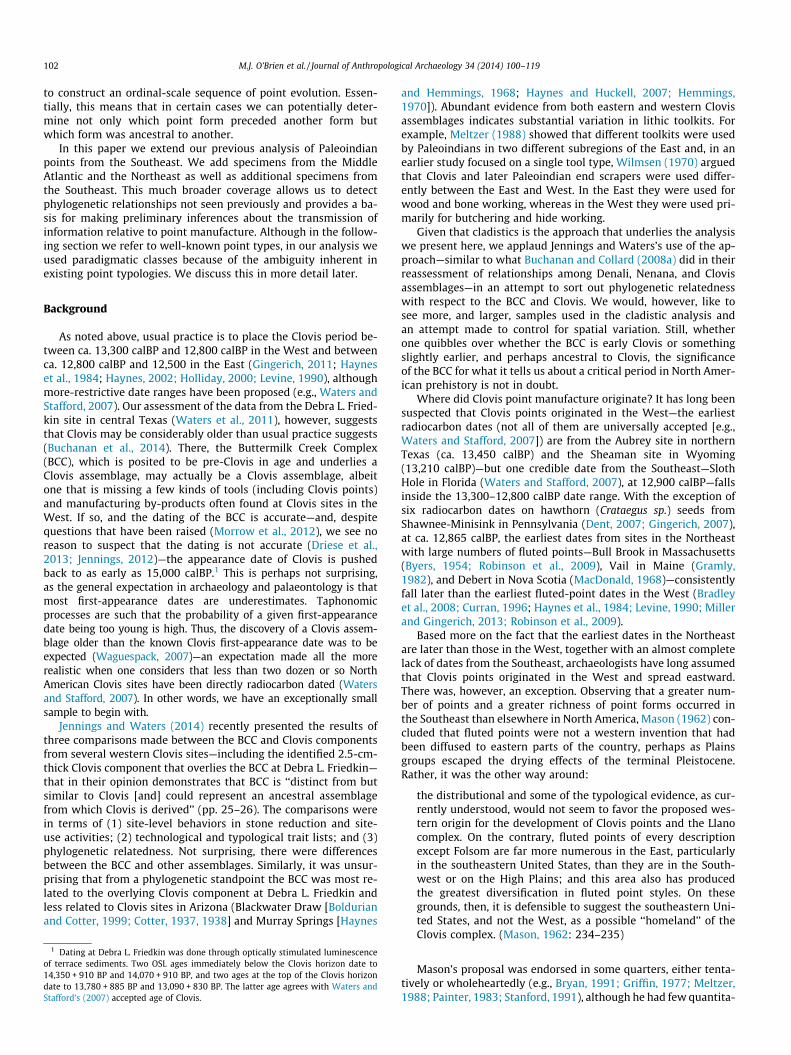
point forms for the Paleoindian period, such as those in Fig. 3,
researchers have relied on chronological data from other regions
and on intuitive models of stylistic evolution of points (Anderson
et al., 1996; Bradley et al., 2008; Curran, 1996; Faught, 2006).
It was with these complex issues in mind that we began our cla-
distic analysis of Paleoindian points from the eastern United States
(O’Brien et al., 2001). Cladistics was first developed in the 1940s by
the German entomologist Willi Hennig (1950, 1965, 1966) and to-
day is one of the main methods of phylogenetic reconstruction
used in biology (e.g., Cap et al., 2008; Lycett et al., 2007; Mallegni,
2007; O’Leary and Gatesy, 2008; Smith and Grine, 2008). The cen-
tral tenet of cladistics is that not all phenotypic similarities are
equally useful for reconstructing phylogenetic relationships. Cla-
distics divides phenotypic similarities into three kinds: Synapomor-
phies, or shared derived traits, are similarities between two or more
taxa that are inherited (derived) from the taxa’s most recent com-
mon ancestor; symplesiomorphies, or shared ancestral traits, are
similarities between two or more taxa that are inherited from a
more-distant common ancestor; and homoplasies are similarities
11,500
12,000
Clovis
Cumberland
Bull Brook
Kings Road
Butler
Southeastafter Anderson et al. (1996)
Mid-Atlanticafter Hranicky (1994)
Northeastafter Bradley et al. (2008)
Great Lakesafter Bradley et al. (2008)
12,500
13,000calBP
Northumberland
Neponset
Debert
Holcombe
Crowfield Crowfield
Gainey
Barnes
Quad
Beaver Lake
Clovis
Cumberland
Suwannee
Simpson
Dalton
Fig. 3. Proposed chronological sequences of Early Paleoindian–period projectile points from the eastern United States. The time scale reflects our proposed alignment.
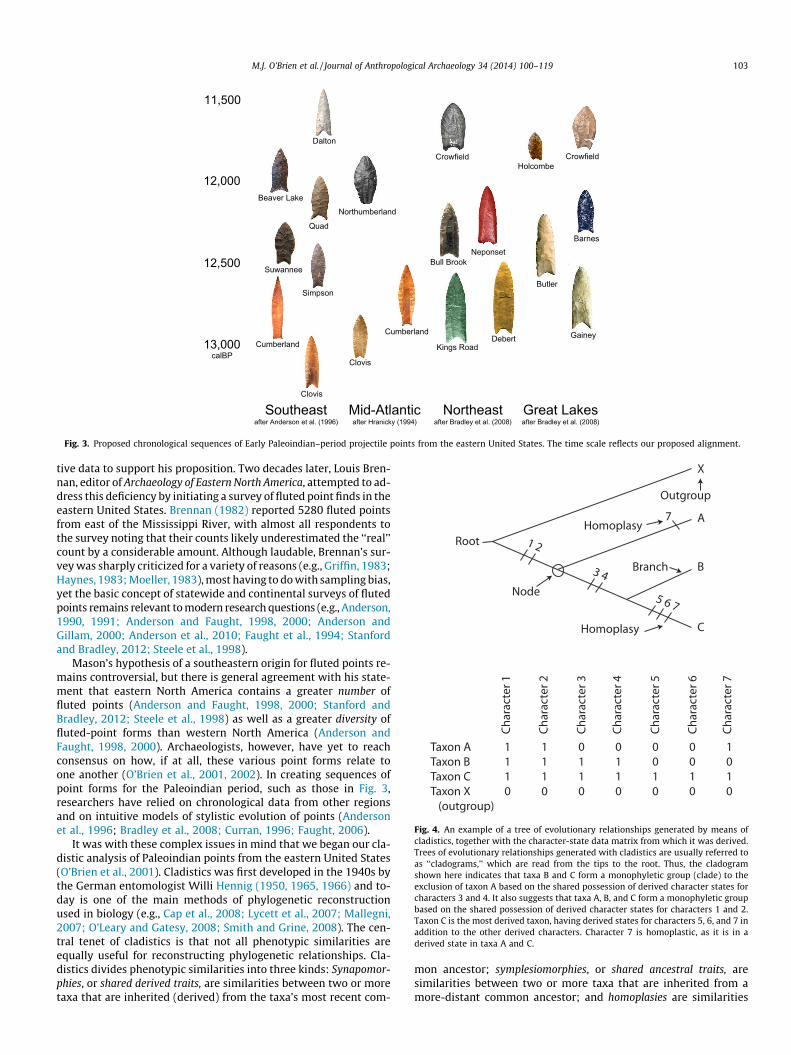
Fig. 4. An example of a tree of evolutionary relationships generated by means of
cladistics, together with the character-state data matrix from which it was derived.
Trees of evolutionary relationships generated with cladistics are usually referred to
as ‘‘cladograms,’’ which are read from the tips to the root. Thus, the cladogram
shown here indicates that taxa B and C form a monophyletic group (clade) to the
exclusion of taxon A based on the shared possession of derived character states for
characters 3 and 4. It also suggests that taxa A, B, and C form a monophyletic group
based on the shared possession of derived character states for characters 1 and 2.
Taxon C is the most derived taxon, having derived states for characters 5, 6, and 7 in
addition to the other derived characters. Character 7 is homoplastic, as it is in a
derived state in taxa A and C.
M.J. O’Brien et al. / Journal of Anthropological Archaeology 34 (2014) 100–119 103
resulting from processes other than descent from a common ances-
tor, such as convergence, parallelism, and horizontal transmission
between and among lineages (Collard and Wood, 2001; O’Brien
and Lyman, 2003; Sanderson and Hufford, 1996). Of these three
types of similarity, only synapomorphies are informative with re-
gard to phylogenetic relationships.2
Based on a model of descent with modification in which new
taxa arise from the bifurcation of existing ones, cladistics defines
phylogenetic relationships in terms of relative recency of common
ancestry. Two taxa are deemed to be more closely related to one
another than either is to a third taxon if they share a common
ancestor that is not also shared by the third taxon. The evidence
for exclusive common ancestry is evolutionarily novel, or derived,
character states. Two taxa are inferred to share a common ancestor
to the exclusion of a third taxon if they share derived character
states (synapomorphies) that are not also shared with the third
taxon.
In its simplest form, cladistic analysis proceeds via four steps.
First, a character-state matrix is generated. This shows the states
of the characters exhibited by each taxon. Second, the direction
of evolutionary change among the states of each character is estab-
lished. Several methods have been developed to facilitate this,
including communality (Eldredge and Cracraft, 1980), ontogenetic
analysis (Nelson, 1978), and stratigraphic-sequence analysis
(Nelson and Platnick, 1981). Currently, the favored method is
outgroup analysis (Maddison et al., 1984), which entails examining
a close relative of the study group. When a character occurs in two
states among the study group, but only one of the states is found in
the outgroup, the principle of parsimony is invoked (see below),
and the state found only in the study group is deemed to be evolu-
tionarily novel with respect to the outgroup state.
After the probable direction of change for the character states
has been determined, the third step is to construct a branching dia-
gram of relationships for each character. This is done by joining the
two most derived taxa by two intersecting lines and then succes-
sively connecting each of the other taxa according to how derived
they are. Each group of taxa defined by a set of intersecting lines
corresponds to a clade, and the diagram is referred to as a clado-
gram. Ideally, the distribution of the character states among the
taxa will be such that all the character cladograms imply relation-
ships among the taxa that are congruent with one another. Nor-
mally, however, a number of the character cladograms will
suggest relationships that are incompatible. This problem is over-
come through the fourth step, generating an ensemble cladogram
that is consistent with the largest number of characters and there-
fore requires the smallest number of homoplasies to account for
the distribution of character states among the taxa. We refer to
such a cladogram as the ‘‘most parsimonious’’ solution.3 An exam-
ple of an ensemble cladogram is shown in Fig. 4.
There are numerous techniques for measuring the goodness of
fit between a data set and a given cladogram. The most commonly
used are the consistency index (CI) (Kluge and Farris, 1969) and the
retention index (RI) (Farris, 1989a, 1989b). The CI measures the rel-
ative amount of homoplasy in a data set but is dependent on the
number of taxa. Thus, the expected CI for a given cladogram must
be assessed relative to the number of taxa used in the analysis
(Sanderson and Donoghue, 1989). The RI measures the number of
similarities in a dataset that are retained as homologies in relation
to a given cladogram. It is insensitive to both the presence of de-
rived character states that are present in only a single taxon (auta-
pomorphies) and the number of characters or taxa employed. Thus,
it can be compared among studies (Sanderson and Donoghue,
1989). Both indices range from zero, which indicates a lack of fit
between the cladogram and the data set, to 1.0, which represents
a perfect fit (see O’Brien and Lyman (2003) for discussion).
Methods other than cladistics have been used to reconstruct
phylogenetic relationships. These are termed phenetic approaches
and include such methods as hierarchical clustering (Sokal and
Sneath, 1963). These approaches, however, are of dubious merit
from an evolutionary standpoint because the algorithms used do
not search for shared derived characters (synapomorphies). In fact,
they do not distinguish between homologous and homoplastic
traits, let alone between shared derived and shared ancestral traits
(symplesiomorphies). Rather, they look for overall similarities
among sets of objects and then group the most similar sets to-
gether. Work carried out in biology over the last half century has
demonstrated that overall similarity can be expected to be a poor
2 Here are a couple of examples of different kinds of characters. All mammals have
a vertebral column, as do animals placed in other categories. The presence of
vertebrae is one criterion that we use to place organisms in the subphylum
Vertebrata. The vertebral column is a homologous character shared by mammals,
birds, and crocodilians, and it suggests that at some remote time in the past, the
organisms in these taxa shared an ancestor. But if we want to pick a character to
organize the taxa phylogenetically, we would not choose ‘‘presence of vertebrae.’’
Given that all three taxa possess that character, it cannot help us sort out relatedness.
As another example, birds and bats both have wings, and those characters share
properties in common, yet we classify birds and bats in two widely separate
taxonomic groups because birds and bats are only distantly related phylogenetically.
This is because these two large groups diverged from a common vertebrate ancestor
long before either one of them developed wings. Therefore wings are of no utility in
reconstructing lineages because they evolved independently in the two lineages after
they diverged. Independently evolved characters are referred to as analogues.
Interestingly, the difference between homologous and analogous characters is at
the center of one of the more extreme hypotheses put forward for the origin of Clovis
peoples. Based on similarities between Clovis points and Solutrean points from
western Europe, which date no later than 17,000–16,500 calBP (Straus, 2000),
Stanford and Bradley (2012) speculate that Clovis points arose from an Atlantic pre-
Clovis maritime archaeological culture that represented the expansion of Solutrean-
age peoples from Europe. Numerous lines of evidence contradict the idea that Clovis
is descended from the Soloutrean and, by extension, suggest that the similarities
between Clovis points and Solutrean points are homoplastic (O’Brien et al., 2014). We
focus on just three here. First, there are large chunks of Solutrean culture, including
rock art, that are missing from Clovis assemblages (Straus, 2000). As Straus et al.
(2005) point out, for the Solutrean origin of Clovis to make sense, there would had to
have been a cultural as well as a genetic amnesia on the part of Solutrean colonists
once they arrived on the North American continent. Second, Eren et al. (2013, 2014)
used a combination of experimental and archaeological analysis to evaluate the key
trait—overshot flaking—that Stanford and Bradley argue supports the hypothesis that
the Solutrean is ancestral to Clovis. Eren and colleagues found that overshot flaking is
most parsimoniously explained as a technological by-product rather than a complex
knapping strategy and concluded that it cannot be considered to be good evidence for
an ancestral–descendent relationship between the Solutrean and Clovis. Additionally,
virtually no evidence for overshot flaking exists among any of the putative North
American pre-Clovis assemblages. As such, even if it were a complex knapping
strategy, it would be a convergent similarity between the Solutrean and Clovis rather
than a similarity indicative of ancestor–descendant relationships. Third, there is a
significant chronological problem with Stanford and Bradley’s hypothesis, which
perhaps is even more serious than all the other problems put together. Needless to
say, for the Solutrean to give rise to pre-Clovis, the Solutrean must precede it.
However, if the pre-Clovis dates and artifact contexts Stanford and Bradley (2012) cite
in defense of their argument are correct—and we do not believe they are (O’Brien
et al., 2014)—we would be forced to conclude, based on Stanford and Bradley’s own
data, that western Europe was colonized by people from North America, not the other
way around. How many times have homologous relations been posited on a much
less evidence than what has been brought to bear in the Solutrean–Clovis debate? The
number is probably countless. In addition, the two proponents of the Solutrean-origin
hypothesis, Bruce Bradley and Dennis Stanford, have seen more Clovis-age tools than
most of us combined, and Bradley is an expert flintknapper who knows Clovis stone-
tool technology inside and out. If they can be wrong in assessing homologous
relations, then that should give us some reason to pause (O’Brien, 2010). We might
ask ourselves if it wouldn’t be better to rely on some of the phylogenetic methods
discussed here rather than on experience and intuition.
3 There are grounds other than parsimony for creating trees, including two
probabilistic methods, maximum likelihood and Bayesian Markov chain Monte Carlo.
With maximum parsimony, trees are evaluated on the basis of the minimum number
of character-state changes required to generate the data on a given tree, without
assuming a specific distribution. With the probabilistic methods, the criterion for
evaluating a topology—the probability of the data, given the tree—is calculated with
reference to an explicit evolutionary model from which the data are assumed to be
distributed identically (Kolaczkowski and Thornton, 2004).
104 M.J. O’Brien et al. / Journal of Anthropological Archaeology 34 (2014) 100–119

guide to phylogenetic relationships. The same applies to cultural
phenomena (O’Brien and Lyman, 2003).
Until roughly twodecades ago, cladistics’ sole use hadbeen in the
biological realm, but themethod is becoming increasingly important
in the social sciences as well (e.g., Beck and Jones, 2007; Bouckaert
et al., 2012; Bowern, 2012; Buchanan and Collard, 2007, 2008a,
2008b; Buckley, 2012; Currie and Mace, 2011; Currie et al., 2010;
Darwent and O’Brien, 2006; Fortunato and Jordan, 2010; García
Rivero andO’Brien, 2014;Gray andAtkinson, 2003;Gray and Jordan,
2000; Gray et al., 2009; Holden and Mace, 2003; Jennings and
Waters, 2014; Jordan and Shennan, 2003; Jordan et al., 2009;
Matthews et al., 2011; O’Brien et al., 2008, 2012; Platnick and
Cameron, 1977; Rexová et al., 2003; Tehrani, 2013; Tehrani and
Collard, 2002; Tehrani et al., 2010). The logical basis for applying
cladistics to artifacts is the sameas it for applying it to fossil hominin
cranial remains and other biological datasets: Artifacts are complex
systems, comprising any number of parts that act in concert to pro-
duce a functional unit. The kinds of changes that occur over genera-
tions of, say, point manufacture are highly constrained in that new
structures and functions usually arise throughmodification of exist-
ing structures and functions as opposed to arising de novo. Thus,
‘‘the history of these changes is recorded in the similarities and
differences in the complex characteristics of related [objects]—in
the extent to which the characteristics of their common ancestors
have been modified by subsequent additions, losses, and transfor-
mations’’ (Brown and Lomolino, 1998: 328).
Materials and methods
For the study reported here, we expanded the original database
(O’Brien et al., 2001, 2002) to include fluted points from the Middle
Atlantic and Northeast and additional points from the Southeast.
This resulted in a sample of 1813 points from 20 US states and 3
Canadian provinces. As with our earlier studies, measurements
were recorded from actual specimens as well as from high-quality
drawings and photographs. Measurements were coded following
the paradigmatic classification used by O’Brien et al. (2001). This
form of classification has been proposed by paleontologists (Shaw,
1969) and biologists (Colless, 1985), but it has seen little use in the
biological sciences. Its use in archaeology is likewise not wide-
spread, despite its ability to produce objective, replicable analytical
units. In contrast to taxonomic classification, paradigmatic classifi-
cation uses an unordered and unweighted structure of character
states to construct classes (Dunnell, 1971). Before starting the clas-
sification, the investigator specifies the characters and the states of
each character that might be of analytical interest. There is no limit
to the number of characters and states that can be included. Each
specimen is then classified by noting the states of each character.
Any state belonging to a single character can combine with any
state belonging to any other character. Whether they actually do
or not in a particular collection of specimens is a separate, empir-
ical question (O’Brien and Lyman, 2000, 2002).
This classification method contrasts sharply with one based on
nominal units such as ‘‘types.’’ Although types are commonly used
to classify points from eastern North America, there are two major
problems with this approach. One is a lack of redundancy in the
characters used to create types. In the case of points, one point type
may be defined primarily by blade length and curvature, whereas
another point type may be defined by basal shape and curvature.
The other problem is that types are extensionally defined (Dunnell,
1986; Lyman and O’Brien, 2000), meaning that definitions are de-
rived from the sorting of specimens into groups based on overall
similarity and then describing the average properties of each group
of specimens. Extensionally defined types are often fuzzy amal-
gams of character states because such units (types) conflate the
taxa and the specimens in them (O’Brien and Lyman, 2002).
These problems led Haynes (1983: 24) to comment that classi-
fication of fluted points in the East was ‘‘highly subjective’’ (see
also Ellis, 2004). With respect to Clovis points, Table 1 lists six
descriptions of ‘‘Clovis’’ points, including the first general descrip-
tion of which we are aware (Wormington, 1957), as well a specific
description of specimens from the Clovis type site, Blackwater
Draw (Hester, 1972). The only commonality among the descrip-
tions is that ‘‘Clovis’’ points have concave bases and are fluted. Here
is what Faught (2006: 171) had to say about the classification of
Paleoindian points from Florida: ‘‘Fluted points are universally
classified as Clovis, regardless of whether the base is straight or
waisted, or what the basal shape is.’’ As far as we can tell, Paleoin-
dian sequences from the East are based in large part on fluting: If a
point is fluted, then by definition it is earlier than an unfluted
point, even if two specimens are identical in every other aspect.
To be clear, we are not claiming that there is no role in archae-
ology for extensionally derived units such as point types. As short-
hand mnemonic devices they serve a useful purpose in conveying
coarse-grained information that aids communication. They are not,
however, robust enough to use in the kinds of analysis reported
here—a point underscored by Thulman (2012: 1599):
Types based on limited samples of isolated specimens usually
fail to capture the variation in point form due to manufacturing
variability and resharpening. Appending suffixes such as ‘‘-oid’’
(ex., Folsomoid) or ‘‘-like’’ emphasize the variability but do not
hone the definitions. Even though these problems are apparent
and occasionally discussed (e.g., Kimball, 1996), archaeology as
a discipline has an inertia that keeps it dependent on ‘‘type
specimens’’ and traditional point descriptions.
Characters and character states
Each class in our classification comprises eight characters, each
of which has a variable number of character states (Fig. 5). The
characters are defined as follows:
I. Height of maximum blade width—the quarter section of a
specimen in which the widest point of the blade occurs.
II. Overall base shape—qualitative assessment of the shape of
the basal indentation.
III. Basal indentation ratio—the ratio between the medial length
of a specimen and its maximum length; the smaller the
ratio, the deeper the indentation.
Table 1
Six published descriptions of the Clovis point type. Note that the only commonality among all six is that Clovis points are fluted and have concave bases.
Length Width Parallel
sides
Convex
sides
Concave
base
Sides
fluted
Basal
constriction
Retouch Basal
grinding
Flute
length
Wormington (1957) 1.5–500 x x x 2 x 1/3–2/3
Ritchie (1961) 1–500 x x x 1–2 x
Prufer and Baby (1963) x x x 1–2 Never
Roosa (1965) Max. at midline x 1–2 Never
Hester (1972) 2–600 1–200 x x 2 Slight x x 1/3–2/3
Cox (1986) x x x 2 Never x <1/2
M.J. O’Brien et al. / Journal of Anthropological Archaeology 34 (2014) 100–119 105

IV. Constriction ratio—the ratio between the minimum blade
width (proximal to the point of maximum blade width)
and the maximum blade width; the smaller the ratio, the
higher the amount of constriction.
V. Outer tang angle—the degree of tang expansion from the
long axis of a specimen; the lower the angle, the greater
the expansion.
VI. Tang-tip shape—the shape of the tip ends of tangs.
VII. Fluting—the removal of one or more large flakes (>1 cm
long) from the base of a specimen and parallel to its long
axis; subsequent flake removal may obliterate earlier flake
scars.
VIII. Length/width ratio—the maximum length of a specimen
divided by its maximum width.
The choice of which characters to use was based on expecta-
tions as to which parts of a point would change most over time
as a result of cultural transmission and thus create a strong phylo-
genetic signal (O’Brien et al., 2001). Considerable variation exists in
the size and shape of fluted points, so we selected characters I, IV,
and VIII in order to explore changes in size and shape. All three
avoid potential bias that could be introduced by using direct mea-
surements of length and width—bias created by some points hav-
ing been resharpened (Flenniken and Raymond, 1986). Our
experience with Paleoindian points, in conjunction with published
studies (e.g., Beck, 1995; Hughes, 1998; Musil, 1988), suggested
that the hafting element is a likely region in which to find other
characters that would be useful in phylogenetic analyses. The haft
area, as Thulman (2012) notes, is also the least likely to have been
altered from its original form since manufacture (Ahler, 1971;
Goodyear, 1974; Hoffman, 1985; Musil, 1988; Thulman, 2006).
Four characters—II, III, V, and VI—were selected to monitor changes
in such features as base shape, the shape of tang tips, and the angle
formed by a tang relative to the long axis of a specimen.
Character VII has only two states: fluted and unfluted. This
bears discussion because we have stated up to this point that our
interest is in fluted points. If so, why would we include unfluted
points in our sample? The answer is found in the unsystematic nat-
ure of traditional point typology discussed above. For example, the
literature is rife with discussions of such types as fluted Daltons,
unfluted Clovis, and the like. What, for example, does one do with
a point that has all the characteristics that one normally associates
with Dalton (Fig. 2b) except it is fluted? Ignoring, for the moment,
that such a specimen is an obvious potential phylogenetic link be-
tween Clovis and Dalton (O’Brien, 2005; O’Brien and Lyman, 2000;
O’Brien and Wood, 1998), it seems appropriate to not be too wor-
ried about the issue. For one thing, how does one define fluting in
the first place? Here is what Bruce Bradley, a knapping expert
familiar with Paleoindian points, had to say on the subject:
Technological fluting is where basal thinning is done by the
removal of one or more flakes that proportionally reduce the
longitudinal thickness of the biface. This involves the removal
of flakes that travel past the point of maximum longitudinal
thickness. It makes no difference whatsoever if the resulting
flake scars are retained in subsequent flaking. Morphological
flutes, on the other hand, are simply basal flake scars that
extend past the point of the hafting element and are visible
on the finished object.
With these definitions, it is possible to have points that were
technologically fluted but are not morphologically fluted, if
the channel scars are removed by subsequent flaking. It is also
possible to have points that are morphologically fluted but
whose basal flakes did not extend past the point of maximum
longitudinal thickness. These did not technically thin the pre-
form. (Bradley, 1997: 54–55)
In two short paragraphs Bradley reduced the mystique sur-
rounding fluting, showing that it is nothing more than the removal
of longitudinal flakes from the base of a point to thin it. Both Clovis
points and Dalton points were fluted, although the visual effect on
each often differs. In scoring our character VII, we followed Brad-
ley’s distinction. If a specimen clearly showed evidence of morpho-
logical fluting, it was coded as ‘‘fluted.’’ If it showed only
technological fluting, it was coded as ‘‘unfluted.’’
Taxa and trees
Our classification of the 1813 points in the sample resulted in a
total of 763 classes. From these, we selected a subset of those clas-
ses that contained four or more specimens (n = 41), accounting for
Fig. 5. Characters (roman numerals) and character states (Arabic numerals) used in
the analysis.
106 M.J. O’Brien et al. / Journal of Anthropological Archaeology 34 (2014) 100–119

218 specimens (Table 2). There was nothing particularly significant
about having a minimum of four specimens per taxa; we used it as
a crude means of controlling for idiosyncrasies arising from such
things as different flaking qualities of raw materials. Following
O’Brien et al. (2001), we labeled our taxa using abbreviations of
the type names assigned to points within each class (Fig. 6 and
Table 3). One outcome of our classification, certainly not unantici-
pated, was the lack of congruence between previously named
projectile-point types and the classes we created. Our sample
was derived in large part from specimens illustrated in the litera-
ture, and hence we knew which type name had been assigned to
any particular specimen. After the classification was completed,
it was not uncommon to have four or more type names used to
refer to specimens in the same class. Class 21234312, for example,
contained specimens distributed across four named types—Beaver
Lake, Dalton, Quad, and Suwannee (Figs. 2 and 3). All of those point
types have been described in the literature and are typically
thought of as discrete units. In reality, they are anything but dis-
crete units and are plagued with the same problems as Clovis
(Table 1).
Subsequently, the computer program PAUP� (v. 4) (Swofford,
1998) was used to generate phylogenetic trees. The first step in
the procedure is to provide the program with a starting point for
tree construction—that is, where the trees should be rooted. This
requires that an ‘‘outgroup’’ taxon be designated as the starting
point. Any taxon can serve as an outgroup, but the closer the phy-
logenetic relationship is between outgroup and ingroup taxa, the
better the chances of determining character polarity (the direction
of change from one character state to another) (O’Brien and Lyman,
2003; O’Brien et al., 2002). Given the age of the taxa—projectile-
point classes—with which we were dealing, it was difficult to select
an appropriate ancestral taxon from outside those classes. The ear-
liest accepted point type in North America is Clovis. If Clovis points
are ancestral to the remainder of the sequence, and we assume
they are, then it would make sense to select them as the outgroup,
but specimens of what most archaeologists would term Clovis
points occur in 25 of the 41 classes.
We selected KDR as our outgroup class. This class contains spec-
imens classified as Clovis (including a point from Kimmswick, Mis-
souri, found associated with mastodon remains [Graham et al.,
1981]), Dalton, and Redstone. In earlier studies (O’Brien et al.,
2001, 2002), occurrence seriation had shown KDR to be the earliest
class in the sequence. Occurrence seriation is a technique that or-
ders phenomena on the basis of the presence/absence of characters
or character states (Dempsey and Baumhoff, 1963; Rowe, 1959).
The phenomena to be seriated can be sets of things or individual
things. Here, those sets are classes of points. The characters are
the traits being used to order the phenomena—those listed in
Fig. 5—each of which contains multiple character states.
Within PAUP� we used the heuristic search method in three sep-
arate runs of 100, 10,000, and 100,000 replicates. Although this
method is not guaranteed to identify a single globally optimal tree,
it is the most computationally efficient method when dealing with
large numbers of taxa.
Results
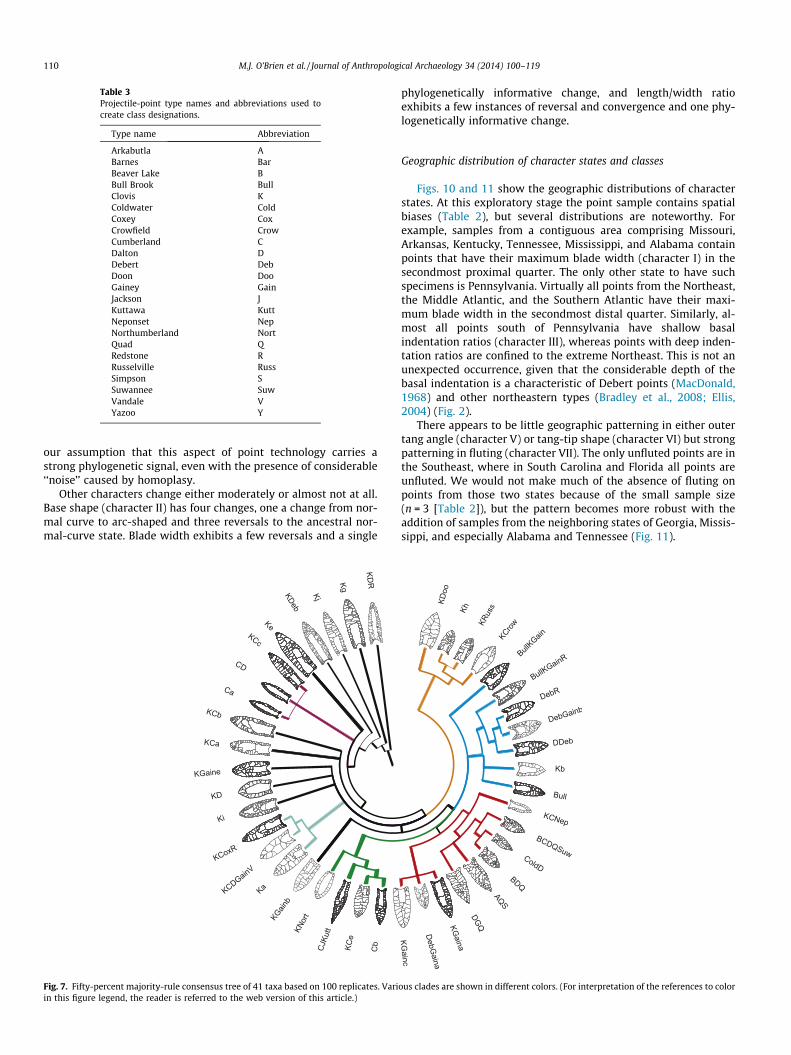
Each run returned multiple equally parsimonious trees. Conse-
quently, we calculated a 50% majority-rule consensus tree, which
places classes in their most common positions across the sample
of trees (Swofford, 1991), using the trees returned in the 100-rep-
licate sample. The tree (Fig. 7) has a consistency index of 0.34 and a
retention index of 0.72—values that are as high or higher than
some accepted trees for biological taxa (Collard et al., 2006).
Although several clades are clearly defined, we note the presence
of polytomies, or unresolved relationships among taxa—KGaine,
KD, and Ki, for example. There might be bifurcation points within
this group, but the phylogenetic signal is too weak to resolve them.
Alternatively, cultural transmission may frequently result in the
creation of polytomies, just as genetic transmission does (O’Brien
et al., 2001).
Character-state changes
One aspect of using cladistics for examining technological
change is that we can move down from the level of class to exam-
ine historical change in individual characters (Darwent and
O’Brien, 2006). In theory, almost every character change could rep-
resent a functional change in the performance of a point, any of
which could benefit or hinder its success as a weapon (Beck,
1998). Characters such as weight, blade shape, width, and haft all
affect how deeply a point penetrates its target, how much bleeding
it causes, how accurately it can be propelled to the target, how
far it can be effectively shot, how well the point will withstand
impact, and even ease of manufacture (Cheshier and Kelly, 2006;
Christenson, 1986; Hughes, 1998; Musil, 1988; Shott, 1997). The
design of every point represents a series of compromises among
these factors and reflects the needs that its manufacturer perceived
as necessary for successful use.
Given that our interest here is phylogeny, we by-pass discus-
sion of presumed functional changes in character states of Early
Paleoindian points and focus solely on how some of the changes
led to the creation of various classes. The tree shown in Fig. 8 con-
tains 48 character-state changes, represented by boxes. Each box is
labeled with a Roman numeral indicating the character that has
changed; the subscript Arabic numeral indicates the evolved char-
acter state (Fig. 5). White boxes indicate phylogenetically informa-
tive changes—those changes that result from descent with
modification and not from adaptive convergence or reversal. Black
boxes indicate convergent changes in character states, and half-
shaded boxes indicate reversals to ancestral states. Recall that for
purposes of phylogenetic analysis, only shared-derived character-
state changes (synapomorphies) are informative.
The first characters to change were location of maximum blade
width (character I) and constriction ratio (character IV). The former
changed from the first proximal quarter in the outgroup (KDR) to
Table 2
Number of projectile points, by state or province, used in the
phylogenetic analysis.
State Count
Alabama 40
Arkansas 8
Florida 2
Georgia 4
Indiana 2
Kentucky 16
Maine 12
Massachusetts 8
Mississippi 8
Missouri 20
New Brunswick 1
New Hampshire 1
New Jersey 1
New York 13
North Carolina 3
Nova Scotia 1
Ohio 1
Ontario 1
Pennsylvania 23
South Carolina 1
Tennessee 40
Vermont 2
Virginia 10
M.J. O’Brien et al. / Journal of Anthropological Archaeology 34 (2014) 100–119 107
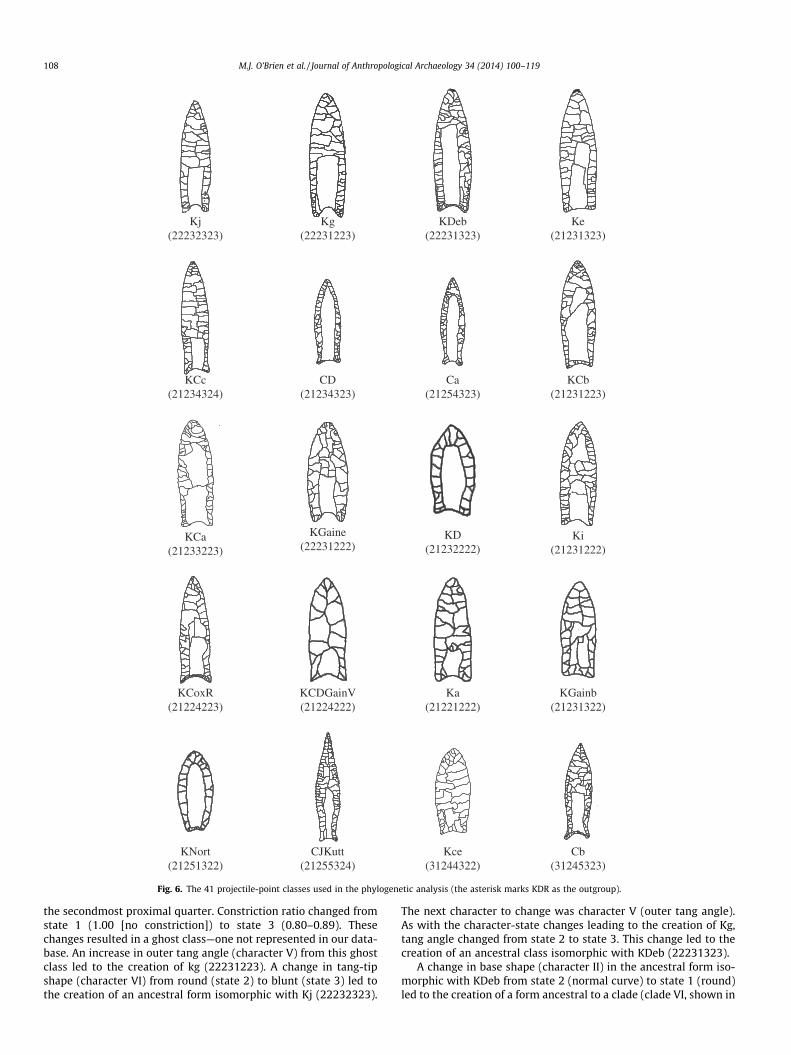
the secondmost proximal quarter. Constriction ratio changed from
state 1 (1.00 [no constriction]) to state 3 (0.80–0.89). These
changes resulted in a ghost class—one not represented in our data-
base. An increase in outer tang angle (character V) from this ghost
class led to the creation of kg (22231223). A change in tang-tip
shape (character VI) from round (state 2) to blunt (state 3) led to
the creation of an ancestral form isomorphic with Kj (22232323).
The next character to change was character V (outer tang angle).
As with the character-state changes leading to the creation of Kg,
tang angle changed from state 2 to state 3. This change led to the
creation of an ancestral class isomorphic with KDeb (22231323).
A change in base shape (character II) in the ancestral form iso-
morphic with KDeb from state 2 (normal curve) to state 1 (round)
led to the creation of a form ancestral to a clade (clade VI, shown in
Cb
(31245323)
Kce
(31244322)
CJKutt
(21255324)
KNort
(21251322)
KGainb
(21231322)
Ka
(21221222)
KCDGainV
(21224222)
KCoxR
(21224223)
Ki
(21231222)
KD
(21232222)
KGaine
(22231222)KCa
(21233223)
KCb
(21231223)
Ca
(21254323)
CD
(21234323)
KCc
(21234324)
Ke
(21231323)
KDeb
(22231323)
Kj
(22232323)
Kg
(22231223)
Fig. 6. The 41 projectile-point classes used in the phylogenetic analysis (the asterisk marks KDR as the outgroup).
108 M.J. O’Brien et al. / Journal of Anthropological Archaeology 34 (2014) 100–119

maroon in Figs. 7 and 8) of three classes: KCc, CD, and Ca. All these
classes contain points identified in the original reports as Cumber-
land (Figs. 2 and 3).
A reversal of tang-tip shape (character VI) from blunted (state
3) back to round (state 2) and a decrease in the length/width ratio
(character VIII) led to the creation of a class isomorphic with Ki,
and this form is ancestral to all other clades in our phylogeny
(excluding polytomies): Clade I, which contains high-shouldered,
narrow-based, pointed-tang forms; Clade II, which contains rela-
tively parallel-sided and mostly straight-tanged forms; Clade III,
which contains point forms with acute-angled tangs, including
all of the unfluted forms in the database; Clade IV, which contains
high-shouldered points with relatively shallow bases and narrow
basal constrictions; and Clade V, which contains forms with round
bases and shallow or slight basal constrictions.
Fig. 9 summarizes the frequencies of changes by character state
and type of change—phylogenetically informative or homoplasious
(convergence or reversal). Most changes are related to constriction
ratio (character IV), tang angle (character V), and tang-tip shape
(character VI). Note in particular all the instances of reversal and
convergence with respect to outer tang angle, with a trend toward
more acute angles, creating ‘‘fishtail’’ points (Fig. 5). All of these
characters—constriction ratio, outer tang angle, and tang-tip
shape—are related to the hafting elements of a point, reinforcing
KGainc
(21223322)
Kh
(11212122)
DebGaina
(22323322)
KGaina
(21223222)
KDoo
(21231122)
KRuss
(31232122)
KCrow
(3231122)
BullKGain
(21221322)
BullKGainR
(21222222)
DebR
(22322222)
DebGainb
(22322122)
DDeb
(22222222)
Kb
(21222122)
Bull
(21222322)
KCNep
(21224322)
BCDQSuw
(21234312)
ColdD
(21234212)
BDQ
(21235212)
AQS
(21224312)
DGQ
(21225312)
KDR*
(12212223)
Fig. 6 (continued)
M.J. O’Brien et al. / Journal of Anthropological Archaeology 34 (2014) 100–119 109
our assumption that this aspect of point technology carries a
strong phylogenetic signal, even with the presence of considerable
‘‘noise’’ caused by homoplasy.
Other characters change either moderately or almost not at all.
Base shape (character II) has four changes, one a change from nor-
mal curve to arc-shaped and three reversals to the ancestral nor-
mal-curve state. Blade width exhibits a few reversals and a single
phylogenetically informative change, and length/width ratio
exhibits a few instances of reversal and convergence and one phy-
logenetically informative change.
Geographic distribution of character states and classes
Figs. 10 and 11 show the geographic distributions of character
states. At this exploratory stage the point sample contains spatial
biases (Table 2), but several distributions are noteworthy. For
example, samples from a contiguous area comprising Missouri,
Arkansas, Kentucky, Tennessee, Mississippi, and Alabama contain
points that have their maximum blade width (character I) in the
secondmost proximal quarter. The only other state to have such
specimens is Pennsylvania. Virtually all points from the Northeast,
the Middle Atlantic, and the Southern Atlantic have their maxi-
mum blade width in the secondmost distal quarter. Similarly, al-
most all points south of Pennsylvania have shallow basal
indentation ratios (character III), whereas points with deep inden-
tation ratios are confined to the extreme Northeast. This is not an
unexpected occurrence, given that the considerable depth of the
basal indentation is a characteristic of Debert points (MacDonald,
1968) and other northeastern types (Bradley et al., 2008; Ellis,
2004) (Fig. 2).
There appears to be little geographic patterning in either outer
tang angle (character V) or tang-tip shape (character VI) but strong
patterning in fluting (character VII). The only unfluted points are in
the Southeast, where in South Carolina and Florida all points are
unfluted. We would not make much of the absence of fluting on
points from those two states because of the small sample size
(n = 3 [Table 2]), but the pattern becomes more robust with the
addition of samples from the neighboring states of Georgia, Missis-
sippi, and especially Alabama and Tennessee (Fig. 11).
Table 3
Projectile-point type names and abbreviations used to
create class designations.
Type name Abbreviation
Arkabutla A
Barnes Bar
Beaver Lake B
Bull Brook Bull
Clovis K
Coldwater Cold
Coxey Cox
Crowfield Crow
Cumberland C
Dalton D
Debert Deb
Doon Doo
Gainey Gain
Jackson J
Kuttawa Kutt
Neponset Nep
Northumberland Nort
Quad Q
Redstone R
Russelville Russ
Simpson S
Suwannee Suw
Vandale V
Yazoo Y
Fig. 7. Fifty-percent majority-rule consensus tree of 41 taxa based on 100 replicates. Various clades are shown in different colors. (For interpretation of the references to color
in this figure legend, the reader is referred to the web version of this article.)
110 M.J. O’Brien et al. / Journal of Anthropological Archaeology 34 (2014) 100–119

Projecting the consensus tree into geographic space—creating a
geophylogeny—allows us to observe the significance of the phylog-
eny in both time and space (Fig. 12). In particular, a geophylogeny
serves as something of an independent test of the validity of a cla-
distically based phylogenetic hypothesis because it allows us to
determine if an ancestor–descendant pair of taxa are in spatial
proximity to one another. If they are not, then it is likely that we
have not measured phylogeny but something else. To construct
the projection, we first calculated the mean geographic centroid
of the county in which each specimen was obtained. These
Fig. 8. The same maximum-parsimony tree as shown in Fig. 7 with boxes showing the 48 changes in character states. Roman numerals denote characters, and subscript
numbers denote character states. Open boxes indicate phylogenetically informative changes; shaded boxes indicate parallel or convergent changes (homoplasy); and half-
shaded boxes indicate characters that reverted to an ancestral state. Clades discussed in the text (I–VI) are shown in color, which match the colors in Fig. 7.
M.J. O’Brien et al. / Journal of Anthropological Archaeology 34 (2014) 100–119 111

4/1
4/2
4/3
4/4
crA
lamroN
ralugnairT
diomosloF
talF
xevnoC
enoN
wollahS
peeD
peeDyreV
1
99.-9.
98.-8.
97.-7.
96.-6.
95.-5.
511-39
29-88
78-18
08-66
56-15
05
detnioP
dnuoR
tnulB
tnesbA
tneserP
99.1-1
99.2-2
99.3-3
99.4-4
99.5-5
6
segnahCfo.oNP
hylo
ge
ne
tica
lly In
form
ativ
e
Co
nve
rge
nce
Re
ve
rsa
l
I. Max. Blade
Width
II. Base Shape
III. Indentation
Ratio
IV. Constriction
Ratio
V. Outer
Tang Angle
VI. Tang-tip
Shape
VII. Fluting
VIII. Length\Width
Ratio
0
54321
Fig.9.Frequencie
sbytypeofthe48ch
aracte
r-state
changessh
ownin
Fig.8.
Fig.10.Geographic
distrib
utio
nsofsta
tesofch
aracte
rsI–IV:locatio
nofmaxim
um
bladewidth,base
shape,basalindentatio
nratio
,andco
nstrictio
nratio
.
112
M.J.
O’Brien
etal./Jo
urnalofAnthropologica
lArch
aeo
logy34(2014)100–119

coordinates were then used to calculate a spatial envelope repre-
senting the geographic distribution of each class. The spatial cen-
troids were then calculated to create a weighted mean
representing the center point of each class’s distribution. Before
discussing the results of this analysis, we again stress that the sam-
ple has spatial biases (Table 2).
The classes in Clade I all contain specimens identified as Clovis
points, and all are restricted to the Midwest. Classes in Clade II are
skewed toward the Northeast and Middle Atlantic regions. Key
constituents of the classes are types described as having deep basal
indentations—Bull Brook (Byers, 1954), Debert (MacDonald, 1968),
and Gainey (Simons et al., 1984) (Figs. 2 and 3). Classes in Clade III
show a split distribution: The subclade comprising KGaina, DebGa-
ina, and KGainc is restricted to the northern portion of the study
area, whereas all other classes in Clade III have distributions in
the southern portion. This is not particularly surprising, given that
a key constituent of the subclade is Gainey, a point type that occurs
primarily along the southern edge of the Great Lakes eastward,
although it is found sporadically throughout eastern North Amer-
ica (Morrow and Morrow, 2002). As noted above, Gainey is also
well represented in classes in Clade II.
Classes in Clade IV occur in a northeast/southwest-trending
band from the Tennessee River valley northward, generally follow-
ing the Ohio River valley. This is also not surprising, given the large
number of Cumberland points (Fig. 2), a key component of classes
in Clade IV, that are found in the Tennessee and central Ohio River
valleys (Anderson et al., 2010). Classes in Clade V occur, like those
in Clade II, in the Middle Atlantic and Northeast. Classes in Clade VI
cluster in the Midwest eastward to the Tennessee River valley.
Constituent types include the long, narrow, heavily fluted
Cumberland point. Interestingly, Clade VI shows minimal taxo-
nomic diversity and diverges from the superclade comprising the
other clades early in the phylogeny.
Of particular interest, for reasons discussed in the following sec-
tion, are the unresolved classes—those that do not fall into one of
the six clades. These are represented in black in Figs. 8 and 12.
Unresolved classes occur in the Upper Midwest near the junction
of the Mississippi and Ohio rivers, northeastward along the Ohio
River, and southeastward along the Cumberland River. Class
KGaine is the most northeastward of the unresolved classes.
Discussion
The analysis described here, although preliminary, represents
another layer of data directed at understanding the social complex-
ities of the Paleoindian cultural landscape. Phylogeny is important
in its own right for what it can tell us about character-state
changes over time and how those changes are related, but here
we are interested in what it might tell us, even in preliminary fash-
ion, about cultural transmission in eastern North America between
ca. 13,300 calBP and 11,900 calBP. As a starting point, we are inter-
ested in how the data relate to what at first glance appear to be
competing proposals for regional differences in Paleoindian point
shape.
As background, recall the earlier discussion of studies of Clovis
point shape, some of which found that shape was fairly consistent
across North America, with variation attributable to drift (Buchanan
and Hamilton, 2009; Hamilton, 2008; Hamilton and Buchanan,
2009; Morrow and Morrow, 1999), and another study that found
Fig. 11. Geographic distributions of states of characters V–VIII: outer tang angle, tang-tip shape, fluting, and length/width ratio.
M.J. O’Brien et al. / Journal of Anthropological Archaeology 34 (2014) 100–119 113

significant differences between eastern and western Clovis points
as well as between points from different subregions (Buchanan
et al., 2014). Why the difference—one that has implications for
how we interpret cultural transmission among Clovis populations?
We can think of at least two possibilities. First, the studies used dif-
ferent samples. The Buchanan and Hamilton (2009) study, for
example, used 26 assemblages and the Buchanan et al. (2014)
study 30 assemblages. Second, the studies employed different ap-
proaches to measuring point shape. Buchanan and Hamilton
(2009), for example, used interlandmark distances to capture point
shape, whereas Buchanan et al. (2014) employed geometric mor-
phometrics. The latter approach is known to detect shape similar-
ities and differences better than the former approach (O’Higgins,
2000; Slice, 2007), and so it seems likely that the Buchanan et al.
(2014) study picked up subtle variation that was undetected by
the techniques used by Buchanan and Hamilton (2009).
Despite the finding by Buchanan et al. (2014) of significant sub-
regional differences in the East, they were confined to the North-
east relative to each of the other three subregions. The Middle
Atlantic, Great Lakes, and Midcontinent did not differ significantly
from each other (Buchanan et al., 2014). Perhaps this is not surpris-
ing in light of the late dates from the Northeast compared to those
from other regions of North America. Recall that with the excep-
tion of radiocarbon dates from Shawnee-Minisink in Pennsylvania
(Dent, 2007; Gingerich, 2007), at ca. 12,865 calBP, the earliest dates
from fluted-point sites in the Northeast are later than the earliest
fluted-point dates in the West (Bradley et al., 2008; Haynes et al.,
1984; Levine, 1990; Robinson et al., 2009). The Northeast was
one of the last regions to experience deglaciation, ca. 12,800 calBP
or slightly later (Borns et al., 2004; Dorion et al., 2001; Richard and
Occhietti, 2005; see also Chapdelaine, 2012), which perhaps
accounts for the later Paleoindian dates as well as for the lack of
evidence for direct association of humans with Pleistocene mega-
fauna (Boulanger and Lyman, 2014). Fig. 12 shows this graphically.
Note that almost without exception, the five most northeastern
classes—KCNep, DebGaina, DebGainb, DebR, and Bull—are highly
derived as well as fairly well resolved. This applies especially to
the three classes in Clade II (shown in light blue).
To place the findings of the Buchanan et al. (2014) study in per-
spective, we turn briefly to the recent work of Sholts et al. (2012),
who used laser scanning and Fourier analysis to examine flake-scar
patterns on a sample of 34 Clovis points from 7 sites in the South-
west, Southern Plains, and Northern Plains, 5 specimens from the
Meekins Neck site in Dorchester County, Maryland (Lowery and
Phillips, 1994), and 11 modern replicates. Their analyses suggested
that flaking patterns are similar across regions (but not with re-
spect to the replicates), and they concluded that there was a con-
tinent-wide standardization of Clovis technology. Again, there are
at least two possible reasons for the difference in results of this
study and that by Buchanan et al. (2014). First, the sample of points
from the Middle Atlantic subregion that Buchanan et al. (2014)
used did not include the Meekins Neck specimens, and it is possi-
ble that difference in point samples is driving the difference in re-
sults. In our view, however, the alternate reason is more likely:
Patterns of flake removal—the focus of the Sholts et al. (2012)
study—are less sensitive to adaptive change driven by environmen-
tal conditions than is point shape because flaking is less strongly
linked to performance than is point shape (Buchanan et al.,
2014). In other words, Clovis flintknappers across eastern North
America used the same methods to produce points that were sim-
ilar in flaking pattern yet, where needed, were adapted to different
environmental conditions.
Fig. 12. Geographic distribution of clades.
114 M.J. O’Brien et al. / Journal of Anthropological Archaeology 34 (2014) 100–119
What specific cultural transmission process(es) within a general
framework of social learning could have led to the patterns we see
for Clovis points? There appear to be two possibilities. First, knap-
pers could simply copy what they saw. Second, they could be
trained in the proper way of making a Clovis point. Given the com-
plexities involved in manufacturing a Clovis point, which can take
up to two hours to produce (Whittaker, 2004), we doubt that copy-
ing was a profitable strategy. In fact, we are sure it was not. As
Sholts et al. (2012) document, even highly skilled modern replica-
tors, although they can mimic Clovis shape precisely—in some
cases to the point of fooling professionals and highly knowledge-
able collectors—they cannot consistently mimic the flake-removal
techniques of Clovis artisans. More likely, they argue, Clovis
artisans shared their technical knowledge through one knapper
showing another the ‘‘proper’’ way to flake a Clovis point, and so
on down the line—or, more precisely, across the landscape.
This conclusion is consistent with the proposal by Hamilton
(2008) and Hamilton and Buchanan (2009) that Clovis point shape
was a product of strong biased transmission (e.g., Boyd and Richer-
son, 1985; Henrich, 2001) as opposed to individual learning and
guided variation (see below). Within certain subregions, however,
point knappers were adjusting shape to fit particular environments
while still maintaining basic flaking patterns. Thus the findings of
Buchanan et al. (2014) and Hamilton and Buchanan (2009), for
example, are not necessarily at odds.
Biased transmission, of whatever form (Laland, 2004; Mesoudi,
2011), is an important process in human learning (Henrich, 2001).
Thus it is understandable why biased learning strategies would
have played a key role in fluted-point technologies. The manufac-
ture of a Clovis or Folsom point is a complex procedure that would
have required a significant amount of investment both in terms of
time and energy to learn effectively (Bradley et al., 2010; Crabtree,
1966; Whittaker, 2004). Under these conditions, it is likely that
there was significant variation among the level of skill exhibited
by toolmakers (Bentley and O’Brien, 2011; Henrich, 2004, 2006)—
one does not become a flintknapper, let alone an accomplished
one, overnight (Olausson, 2008; Pigeot, 1990)—such that recog-
nized craftsmen could have held considerable prestige (Hamilton,
2008). Prestige bias—learning from (not simply copying) certain
individuals to whom others freely show deference or respect in or-
der to increase the amount and accuracy of information available
to the learner (Henrich and Gil-White, 2001; Reyes-Garcia et al.,
2008)—allows a learner in a novel environment to quickly choose
from whom to learn (provided the population is not so large as
to ‘‘swallow up’’ highly skilled individuals [Bentley and O’Brien,
2011]), thus maximizing his or her chances of acquiring adaptive
behavioral solutions to a specific task or enterprise without having
to assess directly the adaptiveness of every potential model’s
behavior (Atkisson et al., 2012). In a fast-moving and fast-growing
population subject to the widespread environmental changes of,
say, the North American late Pleistocene landscape, prestige bias
would have been a highly effective strategy for social learning
(Hamilton, 2008) because under circumstances where ecological
conditions change is, say, on a generational scale, the mean trait
value is often optimal, leading to frequency-dependent bias, or
conformism (Henrich and Boyd, 1998). However, if ecological con-
ditions change faster, social learning may favor individual trial and
error or even a combination of the two (Mesoudi, 2008; Toelch
et al., 2009).
In their classic model of Clovis colonization of North America,
Kelly and Todd (1988) suggest that the speed of colonization was
driven by high rates of residential mobility because of the large for-
aging areas required of a primarily carnivorous diet. Hamilton and
Buchanan (2007) note that Clovis colonists would have moved rap-
idly through large river systems such as the Missouri and Missis-
sippi drainages, leading to an initially rapid rate of colonization
through the midcontinent, which would have then slowed dramat-
ically as diet breadths broadened with the increased biodiversity of
the eastern forests (Steele et al., 1998), and as prey size, abun-
dance, and availability changed (Meltzer, 1988).
The phylogenetic tree shown in Fig. 12 lends support to the
model of initial rapid colonization. Note the locations of the unre-
solved classes (shown in black). As we pointed out earlier, they oc-
cur in the Upper Midwest near the junction of the Mississippi and
Ohio rivers, northeastward along the Ohio River, and southeast-
ward along the Cumberland River. All 11 classes, including the
two outgroups, contain specimens identified in the original litera-
ture as Clovis points. In some cases, all specimens were identified
as Clovis, and in others some were classified as Gainey, Cumber-
land, Redstone, Debert, and/or Dalton. A working hypothesis based
on this distribution would be that the unresolved classes were the
products of groups moving rapidly across the landscape—so rapid,
in fact, that there was not enough time for a strong phylogenetic
signal to develop. There were technological changes, to be sure—
they are what define the classes in the first place (Fig. 8)—but there
were not enough changes to allow much resolution of phylogeny
(Figs. 8 and 12). This conclusion is similar to that reached by
Buchanan and Hamilton (2009) as a reason for the lack of regional
variation in their study of Clovis point shape. Even though their
analysis failed to find the shape variation that sets off the North-
east from other eastern regions (Buchanan et al., 2014), their
reasoning is valid.
We suspect, however, that the situation changed in the East
sometime after ca. 12,500 calBP—a rough date for the rapid prolif-
eration of fluted-point forms. Reasons for the change perhaps had
more to do with shifts in the use of space (territories) by Paleoin-
dian groups than it did with adaptive changes relative to game ani-
mals and the physical environment (Anderson and Faught, 2000),
or, more likely, it was a combination of the two. Those changes
in turn had implications for how information about point technol-
ogy and performance was transmitted. The difference in transmis-
sion, we believe, is analogous to what was documented by
Bettinger and Eerkens (1999) in their study of projectile points
from the Great Basin. There, points from two adjacent regions dif-
fered in the degree to which their attributes, such as weight, width,
and length, correlated with each other. Bettinger and Eerkens
(1999) attributed the differences to the manner in which prehis-
toric people of the two regions acquired and transmitted point
technology, with one group using primarily guided variation—
unbiased transmission plus individual trial-and-error experimen-
tation—and the other using prestige bias (they used the term
‘‘indirect bias’’), whereby individuals learned the design of a single
successful model (Boyd and Richerson, 1985; Mesoudi, 2011;
Mesoudi and O’Brien, 2008a, 2008b).
If, as we have hypothesized, the unresolved classes shown
in black in Fig. 12 are associated primarily with Clovis groups, then
a related hypothesis is that the more-resolved classes, those
in clades II–IV, represent later Early Paleoindian points. Fig. 8
shows the numerous character-state changes that produced those
classes. Note that all but one change, the loss of fluting (VII2 ? VII1)
in Clade III, are either instances of convergence or reversal to an
ancestral state. The 22 instances of homoplasy argue strongly that
Paleoindian knappers were no longer learning the design of a
single successful model but rather were experimenting with
numerous aspects of points (Lyman et al., 2008, 2009). More
evidence in support of this shift in behavior comes from the fact
that the 23 character-state changes in clades II–IV represent
almost half of all 48 character-state changes represented in Fig. 8.
This apparent pattern of increased experimentation is exactly
what one would expect from the guided-variation model, which
shows that, in the absence of selection for a particular trait, a pop-
ulation will move toward whichever trait is favored by people’s
M.J. O’Brien et al. / Journal of Anthropological Archaeology 34 (2014) 100–119 115

individual-learning biases. This occurs even when the strength of
guided variation is weak (Mesoudi, 2011). Future work will be di-
rected at developing a better understanding of the ‘‘fitness’’ of
character states in terms of performance and how and why groups
from widely different regions during the late half of the Early
Paleoindian period landed on the same fitness peaks in terms of
character states—in other words, finding similar solutions to com-
mon adaptive problems (O’Brien and Bentley, 2011). Understand-
ing the phylogenetic history of fluted points in the East,
especially in terms of the often small changes in characters that oc-
curred through time, provides a solid starting point for delving into
some of these highly complex issues.
Conclusions
Phylogenetic analysis represents a break with more traditional
approaches to understanding the archaeological record. Still pres-
ent are issues of chronology and culture change—the mainstays
of archaeology—but phylogenetic analysis shifts the emphasis from
simple historical continuity—A comes before B—to heritable conti-
nuity—A not only preceded B but gave rise to it (O’Brien and
Lyman, 2000). In other words, A and B share a homologous relation.
This, of course, is not news to most archaeologists working in the
Americas, who have long recognized the difference between
homologous similarities and analogous similarities—those that
arise through similar, yet unrelated, adaptations to similar envi-
ronmental conditions. They have also realized the difficulties in
distinguishing between the two kinds of traits in the archaeologi-
cal and ethnological records (e.g., Binford, 1968; Kroeber, 1931).
This is where cladistics plays an important role: not only does it
allow us to separate homologous and analogous traits but it also
allows us to identify the kinds of analogs, such as what are shown
in Fig. 8. Cladistics is not the only method for determining degree
of similarity among sets of objects, but it is the only one that offers
a means of assessing ancestor–descendant relationships.
We in no way want to leave readers with the mistaken belief
that archaeological applications of cladistics are limited to individ-
ual classes of items, such as we highlight with points from eastern
North America. Recall our earlier discussion of Jennings and
Waters’ (2014) cladistic analysis of the Buttermilk Creek Complex
tool assemblage from the Debra L. Friedkin site in central Texas
and assemblages from several other sites in western North Amer-
ica, using a protocol developed by Buchanan and Collard (2008a)
for a similar analysis. These analyses have proved valuable, but
we agree with Jennings and Waters’ (2014, p. 41) advice: ‘‘It is
highly probable that assemblage sample-size and site-function dif-
ferences represent serious problems for assemblage-level cladistics
analyses. For future research, looking at the evolution of specific
technological lineages may be necessary to overcome the difficul-
ties of examining assemblages in their entirety, the composition
of which may vary with site function.’’ We hope our work reported
here will spur other researchers to follow Jennings and Waters’
advice.
Acknowledgments
We thank John O’Shea and an anonymous reviewer for sugges-
tions for greatly improving the original manuscript. We also thank
Kristin Safi and Mark Madsen for inviting us to participate in the
2012 Society for American Archaeology symposium on cultural
transmission in which we presented some of the ideas that are ex-
panded here. MC is supported by the Canada Research Chairs Pro-
gram, the Canada Foundation for Innovation, the British Columbia
Knowledge Development Fund, the Social Sciences and Humanities
Research Council, and Simon Fraser University.
References
Ahler, S., 1971. Projectile Point Form and Function at Rodgers Shelter, Missouri.Missouri Archaeological Society Research Series No. 8, Columbia.
Ahler, S.A., Geib, P.R., 2000. Why flute? Folsom point design and adaptation. J.Archaeol. Sci. 27, 799–820.
Amick, D.S., 1995. Patterns of technological variation among Folsom and Midlandprojectile points in the American Southwest. Plains Anthropol. 40, 23–38.
Anderson, D.G., 1990. The Paleoindian colonization of eastern North America: aview from the southeastern United States. In: Tankersely, K.B., Isaac, B.L. (Eds.),Early Paleoindian Economies of Eastern North America. JAI Press, Greenwich,CT, pp. 163–216.
Anderson, D.G., 1991. Examining prehistoric settlement distribution in easternNorth America. Archaeol. Eastern North Am. 19, 1–22.
Anderson, D.G., Faught, M.K., 1998. The distribution of fluted Paleoindian projectilepoints: update 1998. Archaeol. Eastern North Am. 26, 163–187.
Anderson, D.G., Faught, M.K., 2000. Palaeoindian artefact distributions: evidenceand implications. Antiquity 74, 507–513.
Anderson, D.G., Gillam, J.C., 2000. Paleoindian colonization of the Americas:implications from an examination of physiography, demography, and artifactdistribution. Am. Antiq. 65, 43–66.
Anderson, D.G., O’Steen, L.D., Sassaman, K.E., 1996. Chronological considerations. In:Anderson, D.G., Sassaman, K.E. (Eds.), The Paleoindian and Early ArchaicSoutheast. University of Alabama Press, Tuscaloosa, pp. 3–15.
Anderson, D.G., Miller, D.S., Yerka, S.J., Gillam, J.C., Johanson, D.T., Goodyear, A.C.,Smallwood, A.M., 2010. Paleoindian database of the Americas 2010: currentstatus and findings. Archaeol. Eastern North Am. 38, 63–90.
Atkisson, C., O’Brien, M.J., Mesoudi, A., 2012. Adult learners in a novel environmentuse prestige-biased social learning. Evol. Psychol. 10, 519–537.
Beck, C., 1995. Functional analysis and the differential persistence of Great Basindart forms. J. Calif. Great Basin Anthropol. 17, 222–243.
Beck, C., 1998. Projectile point types as valid chronological units. In: Ramenofsky,A.F., Steffen, A. (Eds.), Unit Issues in Archaeology: Measuring Time, Space, andMaterial. University of Utah Press, Salt Lake City, pp. 21–40.
Beck, C., Jones, G.T., 2007. Early Paleoarchaic point morphology and chronology. In:Graf, K., Schmitt, D.N. (Eds.), Paleoindian or Paleoarchaic? Great Basin HumanEcology at the Pleistocene-Holocene Transition. University of Utah Press, SaltLake City, pp. 23–41.
Bentley, R.A., O’Brien, M.J., 2011. The selectivity of cultural learning and the tempoof cultural evolution. J. Evol. Psychol. 9, 125–141.
Bettinger, R.L., Eerkens, J., 1999. Point typologies, cultural transmission, and thespread of bow-and-arrow technology in the prehistoric Great Basin. Am. Antiq.64, 231–242.
Binford, L.R., 1968. Archeological perspectives. In: Binford, S.R., Binford, L.R. (Eds.),New Perspectives in Archeology. Aldine, Chicago, pp. 5–32.
Boldurian, A.T., Cotter, J.L., 1999. Clovis Revisited: New Perspectives on PaleoindianAdaptations from Blackwater Draw, New Mexico. University Museum,University of Pennsylvania, Philadelphia.
Borns Jr., H.W., Doner, L.A., Dorion, C.C., Jacobson Jr., G.L., Kaplan, M.R., Kreutz, K.J.,Lowell, T.V., Thompson, W.B., Weddle, T.K., 2004. The deglaciation of Maine,U.S.A. In: Ehlers, J., Gibbard, P.L. (Eds.), Quaternary Glaciations—Extent andChronology, Part II: North America. Elsevier, Amsterdam, pp. 89–109.
Bouckaert, R., Lemey, P., Dunn, M., Greenhill, S.J., Alekseyenko, A.V., Drummond, A.J.,Gray, R.D., Suchard, M.A., Atkinson, Q.D., 2012. Mapping the origins andexpansion of the Indo-European language family. Science 337, 957–960.
Boulanger, M.T., Lyman, R.L., 2014. Northeastern North American Pleistocenemegafauna chronologically overlapped minimally with Paleoindians. Quatern.Sci. Rev. 85, 35–46.
Bowern, C., 2012. The riddle of Tasmanian languages. Proc. Roy. Soc. B 279, 4590–4595.
Boyd, R., Richerson, P.J., 1985. Culture and the Evolutionary Process. University ofChicago Press, Chicago.
Bradley, B.A., 1993. Paleo-Indian flaked stone technology in the North AmericanHigh Plains. In: Sofer, O., Praslov, N.D. (Eds.), From Kostenki to Clovis: UpperPaleolithic–Paleo-Indian Adaptations. Plenum, New York, pp. 251–262.
Bradley, B.A., 1997. Sloan site biface and projectile point technology. In: Morse, D.F.(Ed.), Sloan: A Paleoindian Dalton Cemetery in Arkansas. SmithsonianInstitution Press, Washington, DC, pp. 53–57.
Bradley, J.W., Spiess, A., Boisvert, R.A., Boudreau, J., 2008. What’s the point? Modalforms and attributes of Paleoindian bifaces in the New England–MaritimesRegion. Archaeol. Eastern North Am. 36, 119–172.
Bradley, B.A., Collins, M.B., Hemmings, A., 2010. Clovis Technology. InternationalMonographs in Prehistory, Ann Arbor, MI.
Brennan, L.A., 1982. A compilation of fluted points of eastern North America by countand distribution: an AENA Project. Archaeol. Eastern North Am. 10, 27–46.
Brown, J.H., Lomolino, M.V., 1998. Biogeography, second ed. Sinauer, Sunderland,MA.
Bryan, A.L., 1991. The fluted-point tradition in the Americas—one of severaladaptations to late Pleistocene American environments. In: Bonnichsen, R.,Turnmire, K.L. (Eds.), Clovis: Origins and Adaptations. Center for the Study ofthe First Americans, Corvallis, OR, pp. 15–33.
Buchanan, B., 2006. An analysis of Folsom projectile point resharpening usingquantitative comparisons of form and allometry. J. Archaeol. Sci. 33, 185–199.
Buchanan, B., Collard, M., 2007. Investigating the peopling of North Americathrough cladistic analyses of Early Paleoindian projectile points. J. Anthropol.Archaeol. 26, 366–393.
116 M.J. O’Brien et al. / Journal of Anthropological Archaeology 34 (2014) 100–119

Buchanan, B., Collard, M., 2008a. Phenetics, cladistics, and the search for the Alaskanancestors of the Paleoindians: a reassessment of relationships among the Clovis,Nenana, and Denali archaeological complexes. J. Archaeol. Sci. 35, 1683–1694.
Buchanan, B., Collard, M., 2008b. Testing models of early Paleoindian colonizationand adaptation using cladistics. In: O’Brien, M.J. (Ed.), Cultural Transmission andArchaeology: Issues and Case Studies. Society for American Archaeology,Washington, DC, pp. 59–76.
Buchanan, B., Collard, M., 2010. A geometric morphometrics-based assessment ofblade shape differences among Paleoindian projectile point types from westernNorth America. J. Archaeol. Sci. 37, 350–359.
Buchanan, B., Hamilton, M.J., 2009. A formal test of the origin of variation in NorthAmerican Early Paleoindian projectile points. Am. Antiq. 74, 279–298.
Buchanan, B., Kilby, J.D., Huckell, B.B., O’Brien, M.J., Collard, M., 2012. Amorphometric assessment of the intended function of cached Clovis points.PLoS One 7 (2), e30530.
Buchanan, B., O’Brien, M.J., Collard, M., 2014. Continent-wide or region-specific? Ageometric-morphometrics-based assessment of variation in Clovis point shape.Archaeol. Anthropol. Sci., in press.
Buckley, C.D., 2012. Investigating cultural evolution using phylogenetic analysis:the origins and descent of the Southeast Asian tradition of warp Ikat weaving.PLoS One 7 (12), e52064.
Bullen, R.P., 1968. A Guide to the Identification of Florida Projectile Points. FloridaState Museum, Gainesville.
Byers, D.S., 1954. Bull Brook: a fluted point site in Ipswich, Massachusetts. Am.Antiq. 19, 343–351.
Cap, H., Delporte, P., Joachim, J., Reby, D., 2008. Male vocal behavior and phylogenyin deer. Cladistics 24, 917–931.
Chapdelaine, C. (Ed.), 2012. Late Pleistocene Archaeology and Ecology in the FarNortheast. Texas A&M University Press, College Station.
Cheshier, J., Kelly, R.L., 2006. Projectile point shape and durability: the effect ofthickness: length. Am. Antiq. 71, 353–363.
Christenson, A.L., 1986. Projectile point size and projectile aerodynamics: anexploratory study. Plains Anthropol. 31, 109–128.
Collard, M., Wood, B.A., 2001. Homoplasy and the early hominid masticatorysystem: inferences from analyses of living hominoids and papionins. J. Hum.Evol. 41, 167–194.
Collard, M., Shennan, S.J., Tehrani, J.J., 2006. Branching, blending and the evolutionof cultural similarities and differences among human populations. Evol. Hum.Behav. 27, 169–184.
Collard, M., Buchanan, B., Hamilton, M.J., O’Brien, M.J., 2010. Spatiotemporaldynamics of the Clovis–Folsom transition. J. Archaeol. Sci. 37, 2513–2519.
Collard, M., Buchanan, B., Hamilton, M.J., O’Brien, M.J., 2011. Points and prey: aquantitative test of the hypothesis that prey size influences early Paleoindianprojectile point form. J. Archaeol. Sci. 38, 852–864.
Colless, D.H., 1985. On ‘‘character’’ and related terms. Syst. Zool. 34, 229–233.Cotter, J.L., 1937. The occurrence of flints and extinct animals in pluvial deposits
near Clovis, New Mexico: Part IV, Report on excavation at the gravel pit, 1936.Proc. Acad. Nat. Sci. Philadel. 89, 1–16.
Cotter, J.L., 1938. The occurrence of flints and extinct animals in pluvial depositsnear Clovis, New Mexico: Part VI, Report on field season of 1937. Proc. Acad.Nat. Sci. Philadel. 90, 113–117.
Cox, S.L., 1986. A re-analysis of the Shoop site. Archaeol. Eastern North Am. 14, 101–170.
Crabtree, D.E., 1966. A stoneworker’s approach to analyzing and replicating theLindenmeier Folsom. Tebiwa 9, 3–39.
Curran, M.L., 1996. Palaeoindians in the Northeast: the problem of dating flutedpoint sites. Rev. Archaeol. 17, 2–11.
Currie, T.E., Mace, R., 2011. Mode and tempo in the evolution of socio-politicalorganization: reconciling ‘Darwinian’ and ‘Spencerian’ approaches inanthropology. Philos. Trans. Roy. Soc. B 366, 1108–1117.
Currie, T.E., Greenhill, S.J., Gray, R.D., Hasegawa, T., Mace, R., 2010. Rise and fall ofpolitical complexity in island South-East Asia and the Pacific. Nature 467, 801–804.
Darwent, J., O’Brien, M.J., 2006. Using cladistics to construct lineages of projectilepoints from northeastern Missouri. In: Lipo, C.P., O’Brien, M.J., Collard, M.,Shennan, S.J. (Eds.), Mapping Our Ancestors: Phylogenetic Approaches inAnthropology and Prehistory. Aldine, New York, pp. 185–208.
Dempsey, P., Baumhoff, M., 1963. The statistical use of artifact distributions toestablish chronological sequence. Am. Antiq. 28, 496–509.
Dent, R.J., 2007. Seed collecting and fishing at the Shawnee Minisink Paleoindiansite. In: Walker, R.B., Driskell, B.N. (Eds.), Foragers of the Terminal Pleistocene inNorth America. University of Nebraska Press, Lincoln, pp. 116–132.
Dorion, C.C., Balco, G.A., Kaplan, M.R., Kreutz, K.J., Wright, J.D., Borns Jr., H.W., 2001.Stratigraphy, paleoceanography, chronology, and environment duringdeglaciation of eastern Maine. In: Weddle, T.K., Retelle, M.J. (Eds.), DeglacialHistory and Relative Sea-level Changes, Northern New England and AdjacentCanada. Geological Society of America, Special Paper 351, pp. 215–242.
Driese, S.G., Nordt, L.C., Waters, M.R., Keene, J.L., 2013. Analysis of site formationhistory and potential disturbance of stratigraphic context in vertisols at theDebra L. Friedkin archaeological site in central Texas, USA. Geoarchaeology 28,221–248.
Dunnell, R.C., 1971. Systematics in Prehistory. Free Press, New York.Dunnell, R.C., 1986. Methodological issues in Americanist artifact classification.
Adv. Archaeol. Meth. Theory 9, 149–207.Eldredge, N., Cracraft, J., 1980. Phylogenetic Patterns and the Evolutionary Process.
Columbia University Press, New York.
Ellis, C., 2004. Understanding ‘‘Clovis’’ fluted point variability in the Northeast: aperspective from the Debert site, Nova Scotia. Can. J. Archaeol. 28, 205–253.
Eren, M.I., Patten, R.J., O’Brien, M.J., Meltzer, D.J., 2013. Refuting the technologicalcornerstone of the Ice-Age Atlantic Crossing hypothesis. J. Archaeol. Sci. 40,2934–2941.
Eren, M.I., Patten, R.J., O‘Brien, M.J., Meltzer, D.J., 2014. More on the rumor ofintentional overshot flaking and the purported Ice-Age Atlantic crossing. LithicTechnol. 39, 46–54.
Farris, J.S., 1989a. The retention index and the rescaled consistency index. Cladistics5, 417–419.
Farris, J.S., 1989b. The retention index and homoplasy excess. Syst. Zool. 18, 1–32.Faught, M.K., 2006. Paleoindian archaeology in Florida and Panama: two Circumgulf
regions exhibiting waisted lanceolate projectile points. In: Morrow, J., Gnecco,C. (Eds.), Ice Age Occupations of the Americas: A Hemispheric Perspective.University Press of Florida, Gainesville, pp. 164–183.
Faught, M.K., Anderson, D.G., Gisiger, A., 1994. North American PaleoindianDatabase—an update. Curr. Res. Pleist. 11, 32–35.
Figgins, J.D., 1927. The antiquity of man in America. Nat. Hist. 27, 229–239.Flenniken, J.J., Raymond, A.W., 1986. Morphological projectile point typology:
replication experimentation and technological analysis. Am. Antiq. 51, 603–614.
Fortunato, L., Jordan, F., 2010. Your place or mine? A phylogenetic comparativeanalysis of marital residence in Indo-European and Austronesian societies.Philos. Trans. Roy. Soc. B 365, 3913–3922.
García Rivero, D., O’Brien, M.J., 2014. Phylogenetic analysis shows that Neolithicslate plaques from the southwestern Iberian Peninsula are not genealogicalrecording systems. PLoS One 9 (2), e88296.
Gingerich, J.A.M., 2007. Picking up the pieces: new Paleoindian research in theUpper Delaware Valley. Archaeol. Eastern North Am. 35, 117–124.
Gingerich, J.A.M., 2011. Down to seeds and stones: a new look at the subsistenceremains from Shawnee-Minisink. Am. Antiq. 76, 127–144.
Goebel, T., Waters, M.R., O’Rourke, D.H., 2008. The late Pleistocene dispersal ofmodern humans in the Americas. Science 319, 1497–1502.
Goodyear, A.C., 1974. The Brand Site: A Techno-functional Study of a Dalton Site inNortheast Arkansas. Arkansas Archeological Survey Research Series No. 7.Fayetteville.
Goodyear, A.C., 1982. The chronological position of the Dalton horizon in thesoutheastern United States. Am. Antiq. 47, 382–395.
Graham, R.W., Haynes, C.V., Johnson, D.L., Kay, M., 1981. Kimmswick: a Clovis–mastodon association in eastern Missouri. Science 213, 1115–1117.
Gramly, R.M., 1982. The Vail Site: A Palaeo-Indian Encampment in Maine. Bulletinof the Buffalo Society of Natural Sciences, vol. 30. Buffalo.
Gray, R.D., Atkinson, Q.D., 2003. Language-tree divergence times support theAnatolian theory of Indo-European origin. Nature 426, 435–439.
Gray, R.D., Jordan, F.M., 2000. Language trees support the express-train sequence ofAustronesian expansion. Nature 405, 1052–1055.
Gray, R.D., Drummond, A.J., Greenhill, S.J., 2009. Language phylogenies revealexpansion pulses and pauses in Pacific settlement. Science 323, 479–483.
Grayson, D.K., 2007. Deciphering North American Pleistocene extinctions. J.Anthropol. Res. 63, 185–213.
Griffin, J.B., 1977. A commentary on early man studies in the northeast. Ann. N. Y.Acad. Sci. 288, 3–15.
Griffin, J.B., 1983. What’s the point of the survey? Archaeol. Eastern North Am. 11,21–22.
Hamilton, M.J., 2008. Quantifying Clovis Dynamics: Conforming Theory withModels and Data across Scales. Ph.D. Dissertation, Department ofAnthropology, University of New Mexico, Albuquerque.
Hamilton, M.J., Buchanan, B., 2007. Spatial gradients in Clovis-age radiocarbon datesacross North America suggest rapid colonization from the north. Proc. Natl.Acad. Sci. 104, 15625–15630.
Hamilton, M.J., Buchanan, B., 2009. The accumulation of stochastic copying errorscauses drift in culturally transmitted technologies: quantifying Clovisevolutionary dynamics. J. Anthropol. Archaeol. 28, 55–69.
Haynes, C.V., 1964. Fluted projectile points: their age and dispersion. Science 145,1408–1413.
Haynes, C.V., 1983. Fluted points in the East and West. Archaeol. Eastern North Am.11, 24–26.
Haynes, G., 2002. The Early Settlement of North America: The Clovis Era. CambridgeUniversity Press, Cambridge.
Haynes Jr., C.V., Hemmings, E.T., 1968. Mammoth-bone shaft wrench from MurraySprings, Arizona. Science 159, 186–187.
Haynes, C.V., Jr., Huckell, B.B. (Eds.), 2007. Murray Springs: A Clovis Site withMultiple Activity Areas in the San Pedro Valley, Arizona. University of ArizonaPress, Tucson.
Haynes, C.V., Donahue, D.J., Jull, A.J.T., Zabel, T.H., 1984. Application of acceleratordating to fluted point Paleoindian sites. Archaeol. Eastern North Am. 12, 184–191.
Hemmings, E.T., 1970. Early Man in the San Pedro Valley, Arizona. Ph.D.Dissertation, Department of Anthropology, University of Arizona. Tucson.
Hennig, W., 1950. Grundzüge einer Theorie der Phylogenetischen Systematik.Deutscher Zentralverlag, Berlin.
Hennig, W., 1965. Phylogenetic systematics. Annu. Rev. Entomol. 10, 97–116.Hennig, W., 1966. Phylogenetic Systematics. University of Illinois Press, Urbana.Henrich, J., 2001. Cultural transmission and the diffusion of innovations: adoption
dynamics indicate that biased cultural transmission is the predominant force inbehavioral change. Am. Anthropol. 103, 992–1013.
M.J. O’Brien et al. / Journal of Anthropological Archaeology 34 (2014) 100–119 117
Henrich, J., 2004. Demography and cultural evolution: why adaptive culturalprocesses produced maladaptive losses in Tasmania. Am. Antiq. 69, 197–214.
Henrich, J., 2006. Understanding cultural evolutionary models: a reply to Read’scritique. Am. Antiq. 71, 771–782.
Henrich, J., Boyd, R., 1998. The evolution of conformist transmission and theemergence of between-group differences. Evol. Hum. Behav. 19, 215–241.
Henrich, J., Gil-White, F.J., 2001. The evolution of prestige: freely conferreddeference as a mechanism for enhancing the benefits of cultural transmission.Evol. Hum. Behav. 22, 165–196.
Hester, J.J., 1972. Blackwater Locality No. 1: A Stratified Early Man Site in EasternNew Mexico. Fort Burgwin Research Center Publication, No. 8. Ranchos de Taos,New Mexico.
Hoffman, C.M., 1985. Projectile point maintenance and typology: assessment withfactor analysis and canonical correlation. In: Carr, C. (Ed.), For Concordance inArchaeological Analysis: Bridging Data Structure, Quantitative Technique, andTheory. Westport, Kansas City, MO, pp. 566–612.
Holden, C.J., Mace, R., 2003. Spread of cattle pastoralism led to the loss of matrilinyin Africa: a co-evolutionary analysis. Proc. Roy. Soc. B 270, 2425–2433.
Holliday, V.T., 2000. The evolution of Paleoindian geochronology and typology onthe Great Plains. Geoarchaeology 15, 227–290.
Hughes, S.S., 1998. Getting to the point: evolutionary change in prehistoricweaponry. J. Archaeol. Meth. Theory 5, 345–408.
Jennings, T.A., 2012. Clovis, Folsom, and Midland components at the Debra L.Friedkin site, Texas: context, chronology, and assemblages. J. Archaeol. Sci. 39,3239–3247.
Jennings, T.A., Waters, M.R., 2014. Pre-Clovis lithic technology at the Debra L.Friedkin site, Texas: comparisons to Clovis through site-level behavior,technological trait-list and cladistics analyses. Am. Antiq. 79, 25–44.
Jordan, P., Shennan, S.J., 2003. Cultural transmission, language and basketrytraditions amongst the California Indians. J. Anthropol. Archaeol. 22, 42–74.
Jordan, F.M., Gray, R.D., Greenhill, S.J., Mace, R., 2009. Matrilocal residence isancestral in Austronesian societies. Proc. Roy. Soc. B 276, 1957–1964.
Judge, W.J., 1970. Systems analysis and the Folsom-Midland question. Southwest. J.Anthropol. 26, 40–51.
Kelly, R.L., Todd, L.C., 1988. Coming into the country: early Paleoindian hunting andmobility. Am. Antiq. 53, 231–244.
Kimball, L.R., 1996. Early Archaic settlement and technology: lessons from Tellico.In: Anderson, D., Sassaman, K. (Eds.), Paleoindian and Early Archaic Research inthe Lower Southeast. University of Alabama Press, Tuscaloosa, pp. 149–186.
Kluge, A.G., Farris, J.S., 1969. Quantitative phyletics and the evolution of anurans.Syst. Zool. 18, 1–32.
Kolaczkowski, B., Thornton, J.W., 2004. Performance of maximum parsimony andlikelihood phylogenetics when evolution is heterogeneous. Nature 431, 980–984.
Krieger, A.D., 1954. A comment on ‘‘Fluted point relationships’’ by John Witthoft.Am. Antiq. 19, 273–275.
Kroeber, A.L., 1931. Historical reconstruction of culture growths and organicevolution. Am. Anthropol. 33, 149–156.
Laland, K.N., 2004. Social learning strategies. Learning Behav. 32, 4–14.Levine, M.A., 1990. Accommodating age: radiocarbon results and fluted point sites
in northeastern North America. Archaeol. Eastern North Am. 18, 33–63.Lewis, T.M.N., 1954. The Cumberland point. Oklahoma Anthropol. Soc. Bull. 2, 7–8.Lowery, D.L., Phillips, T., 1994. The Meekins Neck Paleoindian site complex,
Dorchester County, Maryland: a development of a Paleoindian settlementmodel for the Delmarva Peninsula. Maryland Archaeol. 30 (2), 29–36.
Lycett, S.J., Collard, M., McGrew, W.C., 2007. Phylogenetic analyses of behaviorsupport existence of culture among wild chimpanzees. Proc. Natl. Acad. Sci. 104,17588–17592.
Lyman, R.L., O’Brien, M.J., 2000. Chronometers and units in early archaeology andpaleontology. Am. Antiq. 65, 691–707.
Lyman, R.L., VanPool, T.L., O’Brien, M.J., 2008. Variation in North American dartpoints and arrow points when one or both are present. J. Archaeol. Sci. 35,2805–2812.
Lyman, R.L., VanPool, T.L., O’Brien, M.J., 2009. The diversity of North Americanprojectile-point classes, before and after the bow and arrow. J. Anthropol.Archaeol. 28, 1–13.
MacDonald, G.F., 1968. Debert: A Palaeo-Indian Site in Central Nova Scotia. NationalMuseum of Man, Anthropology Papers, No. 16, Ottawa.
Maddison, W.P., Donoghue, M.J., Maddison, D.R., 1984. Outgroup analysis andparsimony. Syst. Zool. 33, 83–103.
Mallegni, F., 2007. The Ceprano skull and the earliest people of Europe: overviewand perspectives. Hum. Evol. 21, 261–268.
Mason, R.J., 1962. The Paleo-Indian tradition in eastern North America. Curr.Anthropol. 3, 227–278.
Matthews, L.J., Tehrani, J.J., Jordan, F.M., Collard, M., Nunn, C.L., 2011. Testing fordivergent transmission histories among cultural characters: a study usingBayesian phylogenetic methods and Iranian tribal textile data. PLoS One 6 (4),e14810.
Meltzer, D.J., 1988. Late Pleistocene human adaptations in eastern North America. J.World Prehist. 2, 1–52.
Meltzer, D.J., 1993. Is there a Clovis adaptation? In: Soffer, O., Praslov, N.D. (Eds.),From Kostenki to Clovis: Upper Paleolithic–Paleo-Indian Adaptations. Plenum,New York, pp. 293–310.
Meltzer, D.J., Mead, J.I., 1983. The timing of Late Pleistocene mammalian extinctionsin North America. Quatern. Res. 19, 130–135.
Mesoudi, A., 2008. An experimental simulation of the ‘‘copy-successful-individuals’’cultural learning strategy: adaptive landscapes, producer–scrounger dynamics,and informational access costs. Evol. Hum. Behav. 29, 350–363.
Mesoudi, A., 2011. Cultural Evolution: How Darwinian Theory Can Explain HumanCulture and Synthesize the Social Sciences. University of Chicago Press, Chicago.
Mesoudi, A., O’Brien, M.J., 2008a. The cultural transmission of Great Basinprojectile-point technology I: an experimental simulation. Am. Antiq. 73, 3–28.
Mesoudi, A., O’Brien, M.J., 2008b. The cultural transmission of Great Basinprojectile-point technology II: an agent-based computer simulation. Am.Antiq. 73, 627–644.
Miller, D.S., Gingerich, J.A.M., 2013. Regional variation in the terminal Pleistoceneand early Holocene radiocarbon record of eastern North America. Quatern. Res.79, 175–188.
Moeller, R.W., 1983. There is a fluted baby in the bath water. Archaeol. EasternNorth Am. 11, 27–29.
Morrow, J.E., 1995. Fluted point manufacture: a perspective from the Ready LincolnHills site, 11JY46, Jersey County, Illinois. Midcontinent. J. Archaeol. 20, 167–191.
Morrow, J.E., Morrow, T.A., 1999. Geographic variation in fluted projectile points: ahemispheric perspective. Am. Antiq. 64, 215–231.
Morrow, J.E., Morrow, T.A., 2002. Exploring the Clovis–Gainey–Folsom continuum:technological and morphological variation in midwestern fluted points. In:Clark, J.E., Collins, M.B. (Eds.), Folsom Technology and Lifeways. LithicTechnology, Special Publication, No. 4, pp. 141–157.
Morrow, J.E., Fiedel, S.J., Johnson, D.L., Kornfeld, M., Rutledge, M., Wood, W.R., 2012.Pre-Clovis in Texas? A critical assessment of the ‘‘Buttermilk Creek Complex’’. J.Archaeol. Sci. 39, 3677–3682.
Musil, R.R., 1988. Functional efficiency and technological change: a hafting traditionmodel for prehistoric North America. In: Willig, J.A., Aikens, C.M., Fagan, J.L.(Eds.), Early Human Occupation in Far Western North America: The Clovis-Archaic Interface. Nevada State Museum, Anthropological Papers, no. 21, pp.373–387. Carson City.
Nelson, G., 1978. Ontogeny, phylogeny, paleontology, and the biogenetic law. Syst.Zool. 27, 324–345.
Nelson, G., Platnick, N., 1981. Systematics and Biogeography: Cladistics andVicariance. Columbia University Press, New York.
O’Brien, M.J., 2005. Evolutionism and North America’s archaeological record. WorldArchaeol. 37, 26–45.
O’Brien, M.J., 2010. The future of Paleolithic studies: a view from the NewWorld. In:Lycett, S.J., Chauhan, P.R. (Eds.), New Perspectives on Old Stones: AnalyticalApproaches to Paleolithic Technologies. Springer, New York, pp. 311–334.
O’Brien, M.J., Bentley, R.A., 2011. Stimulated variation and cascades: two processesin the evolution of complex technological systems. J. Archaeol. Meth. Theory 18,309–335.
O’Brien, M.J., Lyman, R.L., 2000. Applying Evolutionary Archaeology: A SystematicApproach. Kluwer Academic/Plenum, New York.
O’Brien, M.J., Lyman, R.L., 2002. The epistemological nature of archaeological units.Anthropol. Theory 2, 37–57.
O’Brien, M.J., Lyman, R.L., 2003. Cladistics and Archaeology. University of Utah Press,Salt Lake City.
O’Brien, M.J., Wood, W.R., 1998. The Prehistory of Missouri. University of MissouriPress, Columbia.
O’Brien, M.J., Darwent, J., Lyman, R.L., 2001. Cladistics is useful for reconstructingarchaeological phylogenies: Palaeoindian points from the southeastern UnitedStates. J. Archaeol. Sci. 28, 1115–1136.
O’Brien, M.J., Lyman, R.L., Saab, Y., Saab, E., Darwent, J., Glover, D.S., 2002. Two issuesin archaeological phylogenetics: taxon construction and outgroup selection. J.Theor. Biol. 215, 133–150.
O’Brien, M.J., Lyman, R.L., Collard, M., Holden, C.J., Gray, R.D., Shennan, S.J., 2008.Transmission, phylogenetics, and the evolution of cultural diversity. In: O’Brien,M.J. (Ed.), Cultural Transmission and Archaeology: Issues and Case Studies.Society for American Archaeology, Washington, DC, pp. 77–90.
O’Brien, M.J., Buchanan, B., Collard, M., Boulanger, M.T., 2012. Cultural cladistics andthe early history of North America. In: Pontarotti, P. (Ed.), Evolutionary Biology:Mechanisms and Trends. Springer, New York, pp. 23–42.
O’Brien, M.J., Collard, M., Buchanan, B., Boulanger, M.T., 2013. Trees, thickets, orsomething in between? Recent theoretical and empirical work in culturalphylogeny. Israel J. Ecol. Evol. 59 (2), 49–61.
O’Brien, M.J., Boulanger, M.T., Collard, M., Buchanan, B., Tarle, L., Straus, L.G., Eren,M.I., 2014. On thin ice: problems with Stanford and Bradley’s proposedSolutrean colonization of North America. Antiquity, in press.
O’Higgins, P., 2000. Quantitative approaches to the study of craniofacial growth andevolution: advances in morphometric techniques. In: O’Higgins, P., Cohn, M.(Eds.), Vertebrate Ontogeny and Phylogeny: Implications for the Study ofHominid Skeletal Evolution. Academic Press, London, pp. 163–185.
Olausson, D., 2008. Does practice make perfect? Craft expertise as a factor inaggrandizer strategies. J. Archaeol. Method Theory 15, 28–50.
O’Leary, M.A., Gatesy, J., 2008. Impact of increased character sampling on thephylogeny of Cetartiodactyla (Mammalia): combined analysis including fossils.Cladistics 24, 397–442.
Painter, F., 1983. Two basic Paleo-Indian lithic traditions evolving from asoutheastern hearth (a revolutionary idea). Archaeol. Eastern North Am. 11,65–79.
Pigeot, N., 1990. Technical and social actors: flint knapping specialists andapprentices at Magdalenian Etiolles. Archaeol. Rev. Cambridge 9, 126–141.
Platnick, N.I., Cameron, D., 1977. Cladistic methods in textual, linguistic, andphylogenetic analysis. Syst. Zool. 26, 380–385.
118 M.J. O’Brien et al. / Journal of Anthropological Archaeology 34 (2014) 100–119

Polyak, V.J., Asmerom, Y., Burns, S.J., Lachniet, M.S., 2012. Climatic backdrop to theterminal Pleistocene extinction of North American mammals. Geology 40,1023–1026.
Prasciunas, M.M., 2011. Mapping Clovis: projectile points, behavior, and bias. Am.Antiq. 76, 107–126.
Prufer, O.H., Baby, R.S., 1963. Paleo-Indians of Ohio. Ohio Historical Society,Columbus.
Rexová, K., Frynta, D., Zrzávy, J., 2003. Cladistic analysis of languages: Indo-European classification based on lexicostatistical data. Cladistics 19, 120–127.
Reyes-Garcia, V., Molina, J.L., Broesch, J., Calvet, L., Huanca, T., Saus, J., et al., 2008. Dothe aged and knowledgeable men enjoy more prestige? A test of predictionsfrom the prestige-bias model of cultural transmission. Evol. Hum. Behav. 29,275–281.
Richard, P.J.H., Occhietti, S., 2005. 14C chronology for ice retreat and inception ofChamplain Sea in the St. Lawrence Lowlands, Canada. Quatern. Res. 63, 353–358.
Ritchie, W.A., 1961. New York Projectile Points: A typology and nomenclature. NewYork State Museum, Bulletin 384. Albany.
Robinson, B.S., Ort, J.C., Eldridge, W.A., Burke, A.L., Pelletier, B.G., 2009. Paleoindianaggregation and social context at Bull Brook. Am. Antiq. 74, 423–447.
Roosa, W.B., 1965. Some great lakes fluted point types. Michigan Archaeol. 11 (3–4),89–102.
Rowe, J.H., 1959. Archaeological dating and cultural process. Southwest. J.Anthropol. 15, 317–324.
Sanchez, M.G., 2001. A synopsis of Paleo-Indian archaeology in Mexico. Kiva 67,119–136.
Sanderson, M.J., Donoghue, M.J., 1989. Patterns of variation in levels of homoplasy.Evolution 43, 1781–1795.
Sanderson, M.J., Hufford, L. (Eds.), 1996. Homoplasy: The Recurrence of Similarity inEvolution. Academic Press, New York.
Shaw, A.B., 1969. Adam and Eve, paleontology, and the non-objective arts. J.Paleontol. 43, 1085–1098.
Sholts, S.B., Stanford, D.J., Flores, L.M., Wärmländer, S.K.T.S., 2012. Flake scarpatterns of Clovis points analyzed with a new digital morphometrics approach:evidence for direct transmission of technological knowledge across early NorthAmerica. J. Archaeol. Sci. 39, 3018–3026.
Shott, M.J., 1997. Stones and shafts redux: the metric discrimination of chipped-stone dart and arrow points. Am. Antiq. 62, 86–101.
Simons, D.B., Shott, M.J., Wright, H.T., 1984. The Gainey site: variability in a GreatLakes Paleo-Indian assemblage. Archaeol. Eastern North Am. 12, 266–279.
Slice, D.E., 2007. Geometric morphometrics. Ann. Rev. Anthropol. 36, 261–281.Smallwood, A.M., 2012. Clovis technology and settlement in the American
Southeast: using biface analysis to evaluate dispersal models. Am. Antiq. 77,689–713.
Smith, H.F., Grine, F.E., 2008. Cladistic analysis of early Homo crania fromSwartkrans and Sterkfontein, South Africa. J. Hum. Evol. 54, 684–704.
Sokal, R.R., Sneath, P.H.A., 1963. Principles of Numerical Taxonomy. Freeman, SanFrancisco.
Stanford, D.J., 1991. Clovis origins and adaptations: an introductory perspective. In:Bonnichsen, R., Turnmire, K.L. (Eds.), Clovis: Origins and Adaptations. Center forthe Study of the First Americans, Corvallis, OR, pp. 1–13.
Stanford, D.J., Bradley, B.A., 2012. Across Atlantic Ice: The Origin of America’s ClovisCulture. University of California Press, Berkeley.
Steele, J., Adams, J., Sluckin, T., 1998. Modelling Paleoindian dispersals. WorldArchaeol. 30, 286–305.
Storck, P.L., Spiess, A.E., 1994. The significance of new faunal identificationsattributed to an early Paleoindian (Gainey complex) occupation at the Udorasite, Ontario. Am. Antiq. 59, 121–142.
Straus, L., 2000. Solutrean settlement of North America: a review of reality. Am.Antiq. 65, 219–226.
Straus, L., Meltzer, D.J., Goebel, T., 2005. Ice Age Atlantis? Exploring the Solutrean-Clovis ‘‘connection’’. World Archaeol. 37, 506–531.
Swofford, D., 1991. When are phylogeny estimates from morphological andmolecular data incongruent? In: Miyamoto, M.M., Cracraft, J. (Eds.),Phylogenetic Analysis of DNA Sequences. Oxford University Press, New York,pp. 295–333.
Swofford, D., 1998. PAUP�: Phylogenetic Analysis Using Parsimony (�and OtherMethods (Version 4). Sinauer, Sunderland, MA.
Tehrani, J.J., 2013. The phylogeny of Little Red Riding Hood. PLoS One 8 (11),e78871.
Tehrani, J., Collard, M., 2002. Investigating cultural evolution through biologicalphylogenetic analyses of Turkmen textiles. J. Anthropol. Archaeol. 21, 443–463.
Tehrani, J.J., Collard, M., Shennan, S.J., 2010. The cophylogeny of populations andcultures: reconstructing the evolution of Iranian tribal craft traditions usingtrees and jungles. Philos. Trans. Roy. Soc. B 365, 3865–3874.
Thulman, D.K., 2006. A Reconstruction of Paleoindian Social Organization in NorthCentral Florida. Ph.D. Dissertation, Department of Anthropology, Florida StateUniversity, Tallahassee.
Thulman, D.K., 2007. A typology of fluted points from Florida. Florida Anthropol. 60(4), 63–75.
Thulman, D.K., 2012. Discriminating Paleoindian point types from Florida usinglandmark geometric morphometrics. J. Archaeol. Sci. 39, 1599–1607.
Toelch, U., van Delft, M.J., Bruce, M.J., Donders, R., Meeus, M.T.H., Reader, S.M., 2009.Decreased environmental variability induces a bias for social information use inhumans. Evol. Hum. Behav. 30, 32–40.
Tunnell, C., Johnson, L., 1991. Comparing Dimensions for Folsom Points and TheirByproducts from the Adair-Steadman and Lindenmeier Sites and OtherLocalities. Texas Historical Commission Archeological Reports Series, No. 1,Austin.
Waguespack, N.M., 2007. Why we’re still arguing about the Pleistocene occupationof the Americas. Evol. Anthropol. 16, 63–74.
Waters, M.R., Stafford Jr., T.W., 2007. Redefining the age of Clovis: implications forthe peopling of the Americas. Science 315, 1122–1126.
Waters, M.R., Forman, S.L., Jennings, T.A., Nordt, L.C., Driese, S.G., Feinberg, J.M.,Keene, J.L., Halligan, J., Lindquist, A., Pierson, J., Hallmark, C.T., Collins, M.B.,Wiederhold, J.E., 2011. The Buttermilk Creek Complex and the origins of Clovisat the Debra L. Friedkin site, Texas. Science 331, 1599–1603.
Whittaker, J.C., 2004. American Flintknappers: Stone Age Art in the Age ofComputers. University of Texas Press, Austin.
Willey, G.R., Phillips, P., 1958. Method and Theory in American Archaeology.University of Chicago Press, Chicago.
Wilmsen, E.N., 1970. Lithic Analysis and Cultural Inference: A Paleo-Indian Case.University of Arizona Press, Tucson.
Witthoft, J., 1952. A Paleo-Indian site in eastern Pennsylvania: an early huntingculture. Proc. Am. Philos. Soc. 96, 464–495.
Witthoft, J., 1954. A note on fluted point relationships. Am. Antiq. 19, 271–273.Wormington, H.M., 1957. Ancient Man in North America. Denver Museum of
Natural History Popular Series, No. 4, Denver.
M.J. O’Brien et al. / Journal of Anthropological Archaeology 34 (2014) 100–119 119