josé maria piñero campos oecd fiscal federalism
DESCRIPTION
Tax autonomy and decentralisation in OECD countries. Network on Fiscal relations across levels of Government. José Maria Piñero Campos OECD Fiscal Federalism. INDEX. Tax autonomy and decentralisation Tax decentralisation Tax autonomy Tax Decentralisation vs. Tax Autonomy - PowerPoint PPT PresentationTRANSCRIPT

Tax autonomy and decentralisation in OECD countries.Network on Fiscal relations across levels of Government
José Maria Piñero CamposOECD Fiscal Federalism

INDEX
• Tax autonomy and decentralisation
– Tax decentralisation
– Tax autonomy
– Tax Decentralisation vs. Tax Autonomy
– Tax autonomy structure
– Pros and cons of tax Autonomy
– Tax Autonomy and disparities
– Tax autonomy and tax rate evolution
• Network on Fiscal relations across levels of government
– Documents
– Workshops
– Statistical databases
– Current Tasks

Tax Decentralisation
0
10
20
30
40
50
60
70
80
Belgi
um
Germ
any
Cana
da
Spain
Unite
d St
ates
Switz
erlan
d
Austr
ia
Swed
en
Austr
ia
Switz
erlan
d
Denm
ark
Czec
h Re
publi
c
Finla
nd
Fran
ce
Italy
Japa
n
Norw
ay
Germ
any
Portu
gal
Kore
a
Luxe
mbo
urg
Belgi
um
Spain
Hung
ary
Unite
d Ki
ngdo
m
Gree
ce
Irelan
d
Neth
erlan
ds
States/regions Municipalities
% of total revenues

Tax Autonomy
0
10
20
30
40
50
60
70
Can
ada
Uni
ted
Stat
es
Switz
erla
nd
Spai
n
Belg
ium
Ger
man
y
Aust
ria
Swed
en
Switz
erla
nd
Den
mar
k
Finl
and
Nor
way
Japa
n
Fran
ce
Luxe
mbo
urg
Spai
n
Belg
ium
Italy
Kore
a
Ger
man
y
Portu
gal
Hun
gary
Uni
ted
King
dom
Net
herla
nds
Gre
ece
Cze
ch R
epub
lic
Aust
ria
Irela
nd
States/regions Municipalities
% of total revenues

Tax Decentralisation vs. Tax Autonomy
Canada STA
United States STA
Switzerland STA
Spain STA
Germany STAAustria STA
Sweden LOC
Switzerland LOC
Denmark LOCFinland LOCNorway LOC
Japan LOC
Spain LOC France LOCLuxembourg LOCBelgium LOC Italy LOCKorea LOC
Germany LOC
Portugal LOCHungary LOC
United Kingdom LOCNetherlands LOC
Greece LOCCzech Republic LOC
Austria LOCIreland LOC0
5
10
15
20
25
30
35
40
45
50
55
60
65
70
0 10 20 30 40 50 60 70
Autonomous tax revenues (% of Total revenues)
Tax revenues (% of Total revenues)

Ideal Tax autonomy structure
• Taxes which are growth-enhancing at sub-central level are the same as the ones which are growth-enhancing at central level
• But, there are some additional requirements :– Link between taxes paid and public services received– SCG Taxes should be non-mobile– Non redistributive– Non cyclical– Tax base should be evenly distributed across jurisdictions
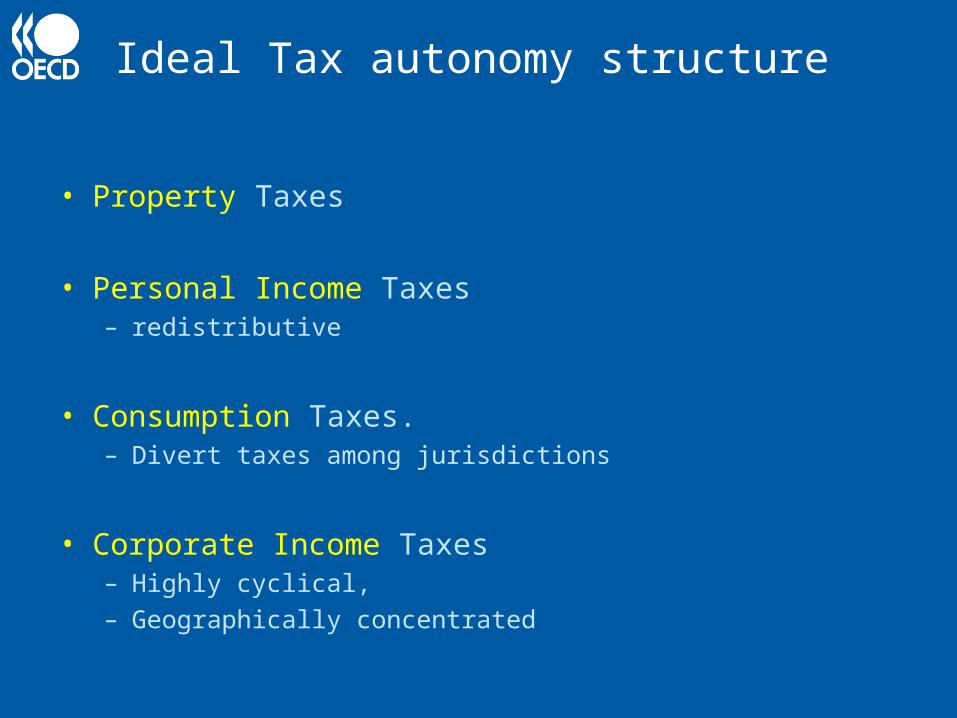
Ideal Tax autonomy structure
• Property Taxes
• Personal Income Taxes– redistributive
• Consumption Taxes.– Divert taxes among jurisdictions
• Corporate Income Taxes– Highly cyclical, – Geographically concentrated

Real Tax autonomy structure
0
10
20
30
40
50
60
70
Can
ada
Uni
ted
Stat
es
Switz
erla
nd
Spai
n
Belg
ium
Ger
man
y
Aust
ria
Swed
en
Switz
erla
nd
Den
mar
k
Finl
and
Nor
way
Japa
n
Fran
ce
Luxe
mbo
urg
Spai
n
Belg
ium
Italy
Kore
a
Ger
man
y
Portu
gal
Hun
gary
Uni
ted
King
dom
Net
herla
nds
Gre
ece
Cze
ch R
epub
lic
Aust
ria
Irela
nd
CIT Consumption PIT Property Others
States/regions Municipalities
% of total revenues

Pros and cons or Tax autonomy• Pros
– Make governments more responsive to citizens’ tastes and preferences
– Improve budget management efficiency. A more reduced size of sub-central governments have been reported (Rodden (2003), Fiva (2006), Sorens (2008))
– Promote democratic accountability– Provide incentives for growth-oriented economic and fiscal policies– Could reduce disparities when small jurisdictions could benefit from
bigger neighbour jurisdictions
• Cons– Could increase disparities. If equalisation is not enough poorer
jurisdictions could be obliged to do a bigger effort– Could deteriorate SCG revenues (race to the bottom). – Could deteriorate SCG fiscal stability, if it is based on more volatile
taxes as Corporate or consumption taxes

Tax Autonomy and disparirites. What happen when equalisation is small?:
0
20
40
60
80
100
120
140
160
180
200
0 30 60 90 120 150 180 210 240 270 300
Implicit tax rate (in % of average)
Tax raising capacity per capita (in % of average)
1997
2006
0
20
40
60
80
100
120
140
160
180
200
0 30 60 90 120 150 180 210 240 270 300
Implicit tax rate (in % of average)
Tax raising capacity per capita (in % of average)
1998
2006
0
20
40
60
80
100
120
140
160
180
200
0 30 60 90 120 150 180 210 240 270 300
Implicit tax rate (in % of average)
Tax raising capacity per capita (in % of average)
2002
2007
0
20
40
60
80
100
120
140
160
180
200
0 30 60 90 120 150 180 210 240 270 300
Tax rate (in % of Regional average)
Tax raising capacity per capita (in % of average)
CASTILLA LA MANCHA (Municipios de más de 10.000 hab.)
CANADA S/R SWITZERLAND S/R
FRANCE (Departments)

Tax Autonomy and disparirites. What happen when equalisation is high?:
0
20
40
60
80
100
120
140
160
180
200
0 30 60 90 120 150 180 210 240 270 300
Implicit tax rate (in % of average)
Tax raising capacity per capita (in % of average)
1997
2007
0
20
40
60
80
100
120
140
160
180
200
0 30 60 90 120 150 180 210 240 270 300
Implicit tax rate (in % of average)
Tax raising capacity per capita (in % of average)
1997
2007
0
20
40
60
80
100
120
140
160
180
200
0 30 60 90 120 150 180 210 240 270 300
CIT and Property tax (CA or IMI) Implicit tax rate (in % of average)
Aggregate tax base per capita (in % of average)
2002
2007
0
20
40
60
80
100
120
140
160
180
200
0 30 60 90 120 150 180 210 240 270 300
Implicit tax rate (in % of average)
Tax raising capacity per capita (in % of average)
1997
2007
SWEDEN LOCPORTUGAL LOC
DENMARK LOC FINLAND LOC
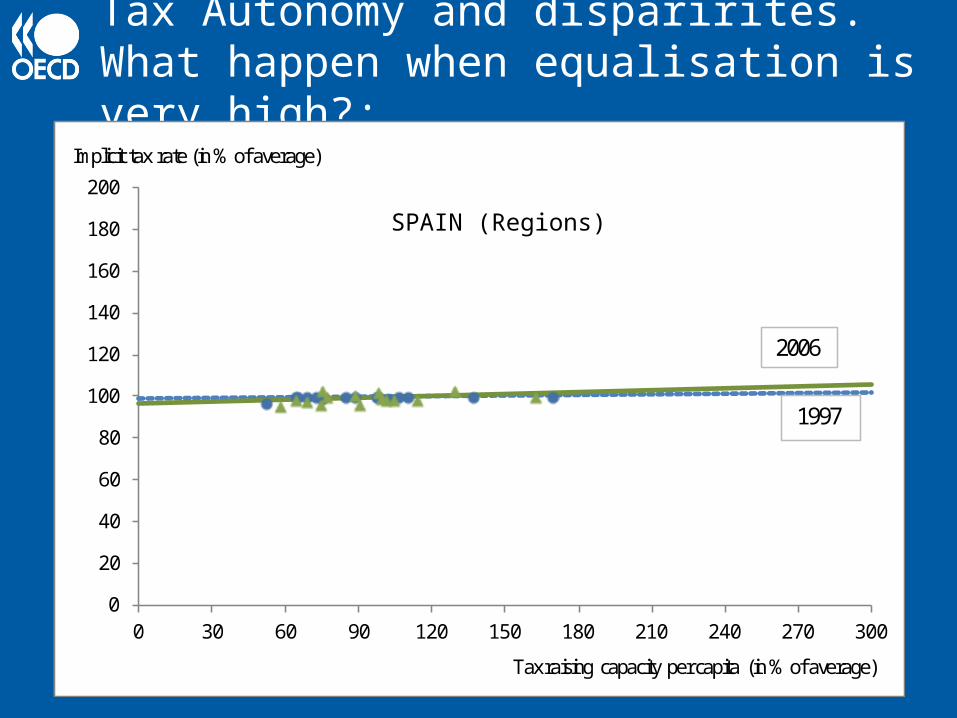
Tax Autonomy and disparirites. What happen when equalisation is very high?:
0
20
40
60
80
100
120
140
160
180
200
0 30 60 90 120 150 180 210 240 270 300
Implicit tax rate (in % of average)
Tax raising capacity per capita (in % of average)
1997
2006
SPAIN (Regions)
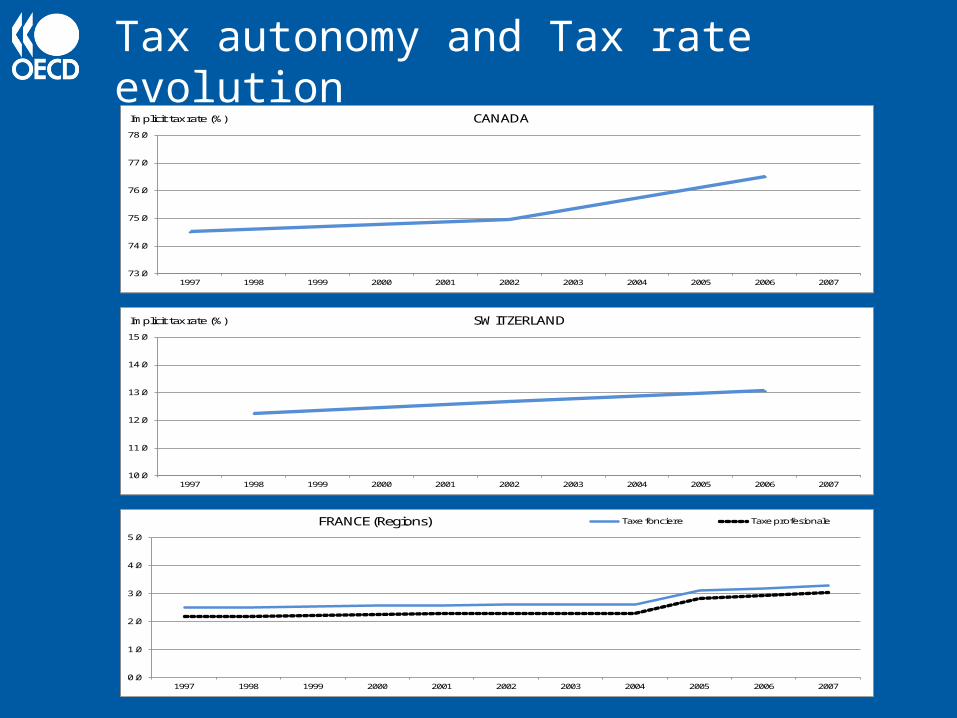
Tax autonomy and Tax rate evolution
73.0
74.0
75.0
76.0
77.0
78.0
1997 1998 1999 2000 2001 2002 2003 2004 2005 2006 2007
CANADAImplicit tax rate (%)
10.0
11.0
12.0
13.0
14.0
15.0
1997 1998 1999 2000 2001 2002 2003 2004 2005 2006 2007
SWITZERLANDImplicit tax rate (%)
0.0
1.0
2.0
3.0
4.0
5.0
1997 1998 1999 2000 2001 2002 2003 2004 2005 2006 2007
Taxe fonciere Taxe profesionaleFRANCE (Regions)
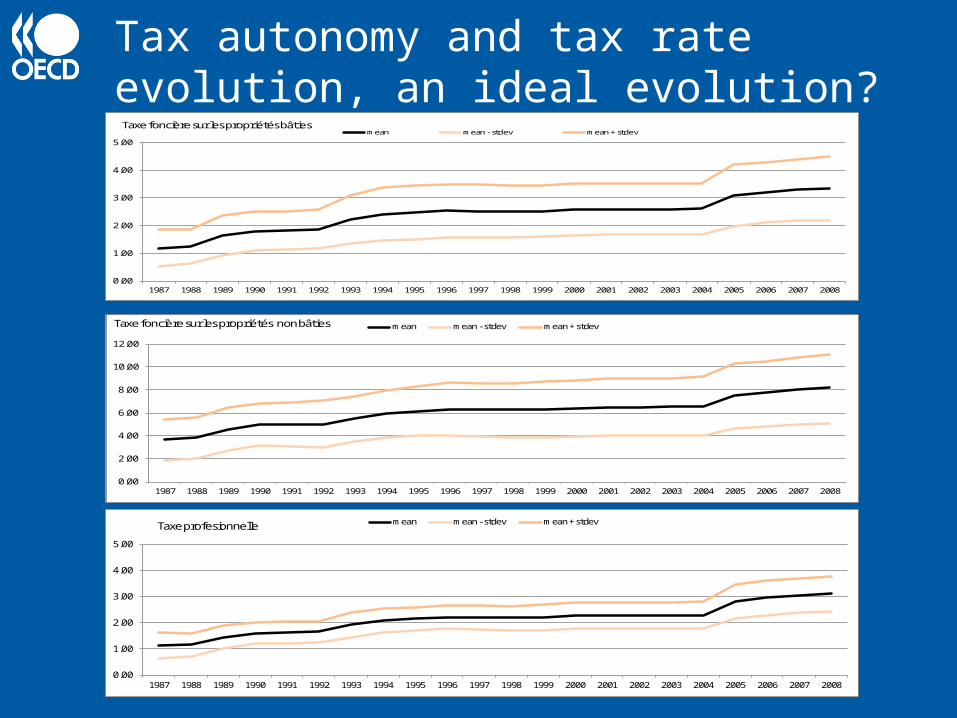
Tax autonomy and tax rate evolution, an ideal evolution?
0.00
1.00
2.00
3.00
4.00
5.00
1987 1988 1989 1990 1991 1992 1993 1994 1995 1996 1997 1998 1999 2000 2001 2002 2003 2004 2005 2006 2007 2008
mean mean - stdev mean + stdevTaxe foncière sur les propriétés bâties
0.00
2.00
4.00
6.00
8.00
10.00
12.00
1987 1988 1989 1990 1991 1992 1993 1994 1995 1996 1997 1998 1999 2000 2001 2002 2003 2004 2005 2006 2007 2008
mean mean - stdev mean + stdevTaxe foncière sur les propriétés non bâties
0.00
1.00
2.00
3.00
4.00
5.00
1987 1988 1989 1990 1991 1992 1993 1994 1995 1996 1997 1998 1999 2000 2001 2002 2003 2004 2005 2006 2007 2008
mean mean - stdev mean + stdevTaxe profesionnelle
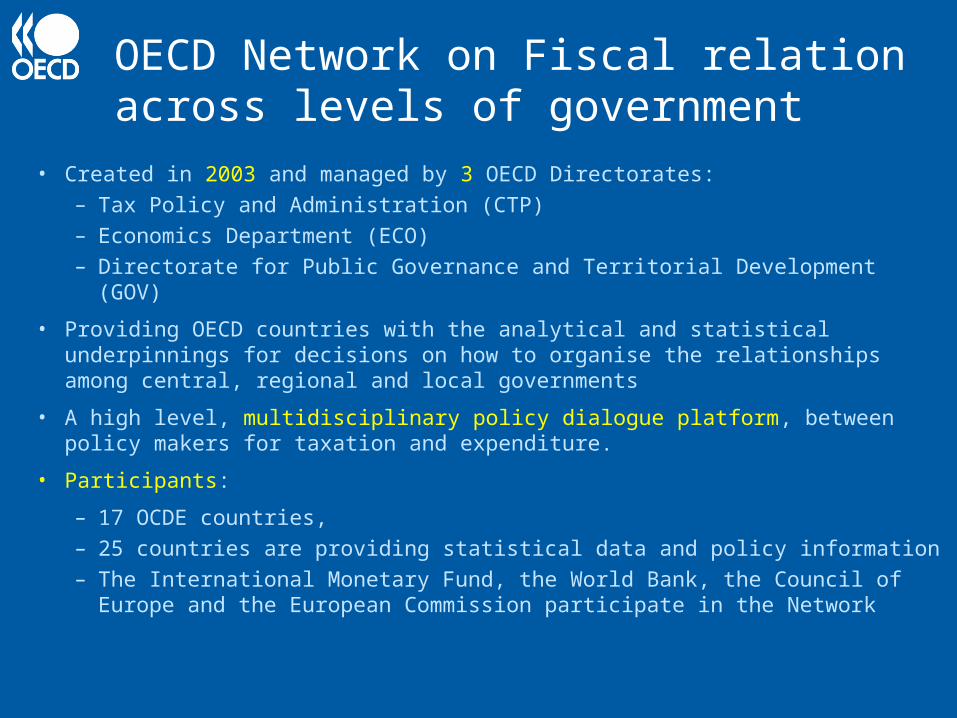
OECD Network on Fiscal relation across levels of government
• Created in 2003 and managed by 3 OECD Directorates:
– Tax Policy and Administration (CTP)
– Economics Department (ECO)
– Directorate for Public Governance and Territorial Development (GOV)
• Providing OECD countries with the analytical and statistical underpinnings for decisions on how to organise the relationships among central, regional and local governments
• A high level, multidisciplinary policy dialogue platform, between policy makers for taxation and expenditure.
• Participants:
– 17 OCDE countries,
– 25 countries are providing statistical data and policy information
– The International Monetary Fund, the World Bank, the Council of Europe and the European Commission participate in the Network

Fiscal Network. Documents • Fiscal policy across levels of government in times of crisis
• Explaining the Sub-National Tax-Grants Balance in OECD Countries
• Finding the Dividing Line between Tax Sharing and Grants: A Statistical Investigation
• The Fiscal Autonomy of Sub-Central Governments: An Update
• The Spending Power of Sub-Central Governments: A Pilot Study
• Taxes and Grants: On the Revenue Mix of Sub-Central Governments
• Market Mechanisms in Sub-Central Public Service Provision
• Promoting Performance: Using Indicators to Enhance the Effectiveness of Sub Central Spending
• Fiscal Equalisation in OECD countries
• Intergovernmental transfers and decentralised public spending
• Fiscal autonomy of sub-central governments
• Fiscal rules for sub-central governments: design and impact

Fiscal Network. Workshops
• Tax competition at Sub-central level. Bern, May-June 2010
• Economic Crisis and Sub-central Fiscal Policy. Paris, June 2009
• Taxes versus Grants. Vienna, May 2008
• Fiscal Equalisation in OECD Countries. Zaragoza, June 2006
• The Efficiency of Sub-central Spending. Paris, May 2006

Fiscal Network. Statistical database
• Intergovernmental transfers: update of National Accounts data
• Taxing power of local and regional governments in OECD countries
• Revenue structure of sub central government
• Intergovernmental grants
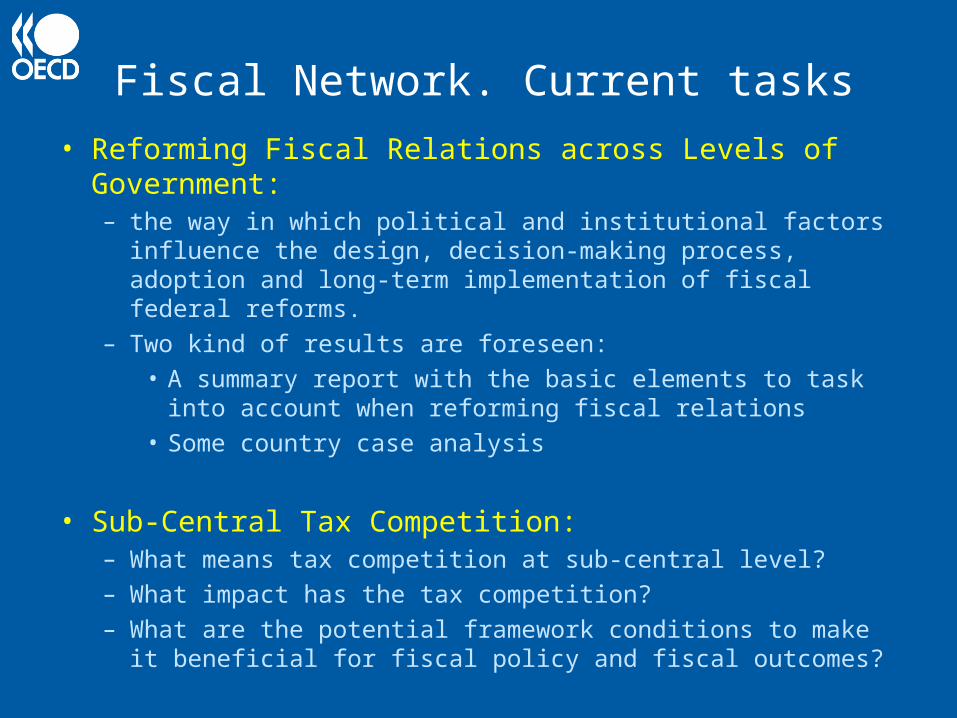
Fiscal Network. Current tasks
• Reforming Fiscal Relations across Levels of Government: – the way in which political and institutional factors influence the
design, decision-making process, adoption and long-term implementation of fiscal federal reforms.
– Two kind of results are foreseen:• A summary report with the basic elements to task into
account when reforming fiscal relations• Some country case analysis
• Sub-Central Tax Competition:– What means tax competition at sub-central level?– What impact has the tax competition?– What are the potential framework conditions to make it beneficial
for fiscal policy and fiscal outcomes?

Seminar about Fiscal decentralisation of Public AdministrationsCartagena, 2-6 November 2010
In collaboration with Instituto de Estudios Fiscales• To share Spain and OECD knowledge in fiscal federalism• To create a policy dialog platform about the most relevant trends and the
exchange of experienceies and information about regional and local financing, fiscal rules and budgetary discipline
The inscription is open till 24th September in the Centro de Formation de la AECID de Cartagena de Indias webpage:
http://www.aecidcf.org.co/aeci_cartagena/on_line/

Seminar about Fiscal decentralisation of Public AdministrationsCartagena, 2-6 November 2010
ISSUES• Sub-central governments financing: Basic principles. Tax financing and
transfer financing. International existing models.
• Taxes as financing source of sub-central governments. Taxes adequate for decentralisation. Tax decentralisation and tax autonomy. Consequences of tax decentralisation. Tax competition. Equalisation
• Fiscal decentralisation and budgetary stability. Budgetary consolidation. Sub central governments debt.
• Management of a fiscal decentralised system. Responsibilities distribution. Principles: institutional loyalty and co-ordination, transparency, etc. Decentralized public services provision. Indicators, market mechanisms in the provision of public services. The new technologies.