joint effects of pharmaceuticals and chemicals … effects of pharmaceuticals and chemicals...
TRANSCRIPT

61/2017 TEXTE
Joint effects of pharmaceuticals and chemicals regulated under REACH in wastewater treatment plant effluents Evaluating concepts for a risk assessment by means of experimental scenarios


TEXTE 61/2017
Environmental Research of the Federal Ministry for the Environment, Nature Conservation, Building and Nuclear Safety
Project No. (FKZ) 3712 64 419 Report No. (UBA-FB) 002450/ENG
Joint effects of pharmaceuticals and chemicals regulated under REACH in wastewater treatment plant effluents Evaluating concepts for a risk assessment by means of experimental scenarios
by
Anja Coors, Pia Vollmar ECT Oekotoxikologie GmbH, Flörsheim am Main
Frank Sacher, Astrid Thoma DVGW-Technologiezentrum Wasser (TZW), Karlsruhe
with contributions from Dirk Maletzki, Christian Polleichtner, Patrick Schwarz
On behalf of the German Environment Agency

Imprint
Publisher: Umweltbundesamt Wörlitzer Platz 1 06844 Dessau-Roßlau Tel: +49 340-2103-0 Fax: +49 340-2103-2285 [email protected] Internet: www.umweltbundesamt.de
/umweltbundesamt.de /umweltbundesamt
Study performed by: ECT Oekotoxikologie GmbH Böttgerstraße 2 – 14 65439 Flörsheim am Main Study completed in: December 2016 Edited by: Working Group „Ecotoxicology and Bioaccumulation“ Daniela Gildemeister, Ute Kühnen, Enken Hassold Publication as pdf: http://www.umweltbundesamt.de/publikationen ISSN 1862-4804 Dessau-Roßlau, August 2017 The project underlying this report was financed by the Federal Ministry for the Environment, Nature Conservation, Building and Nuclear safety under project number FKZ 3712 64 419. The responsibility for the content of this publication lies with the author(s).

Joint effects of pharmaceuticals and chemicals regulated under REACH
5
Abstract
The environmental risk assessment (ERA) focusses on individual chemicals, while non-target organ-isms in the environment are exposed simultaneously to a multitude of substances from various sources. In the aquatic environment, effluents of wastewater treatment plants (WWTPs) represent a key source for co-incidental mixtures of chemicals from various uses. The aim of the present project was to explore the consideration of mixtures of chemicals released via WWTPs in an ERA. Based on a literature survey and own data on human pharmaceuticals and other substances typically present in the effluents of WWTPs, 20 substances were selected. In total, 33 single-substance and 24 mixtures were assessed in chronic toxicity tests with cyanobacteria, green algae, the water plant Lemna minor and the freshwater crustacean Daphnia magna. The results from the mixture tests provided consistent evidence that the aquatic toxicity of mixtures with regard to chronic endpoints can be predicted by the concept of concentration addition (CA) with less than 3-fold deviation. Evidence for synergistic inter-action with respect to CA of the two antibiotics sulfamethoxazole and trimethoprim in primary pro-ducers was detected, which calls for further investigations. Furthermore, mixture tests demonstrated that the presence of 50% (v:v) WWTP effluent in the test medium did not impact the predictability of mixture toxicity. With regard to mixture concentrations changing during the exposure time, as it is typical for WWTP effluents, the average mixture concentrations appeared to underestimate chronic mixture effects on reproduction of D. magna, while the peak concentrations provided a better esti-mate. Single-substance risk assessments were compared to risk assessments for selected mixture sce-narios based on different approaches. A mixture assessment factor applied in the ERA of single sub-stances and its appropriate size is discussed in view of a prospective consideration of environmental mixtures of unknown composition in the single-substance ERA.
Kurzbeschreibung
Die Umweltrisikobewertung (ERA) bezieht sich üblicherweise auf einzelne Chemikalien, während Or-ganismen in der Umwelt einer Vielzahl verschiedener Substanzen aus unterschiedlichen Quellen gleichzeitig ausgesetzt sind. Kläranlagenabläufe stellen einen Haupteintragspfad für unbeabsichtigte Mischungen von Chemikalien dar. Die Umweltwirkungen solcher Mischungen wurden in dem vorlie-genden Projekt näher untersucht. Basierend auf einer Literaturrecherche und eigenen Daten zum Vor-kommen von Arzneimitteln und anderen Chemikalien in Kläranlagenabläufen wurden 20 Substanzen für das Projekt ausgewählt. Insgesamt wurden 33 Einzelsubstanzen und 24 Mischungen in chroni-schen Toxizitätsstudien mit Cyanobakterien, Grünalgen, der Wasserpflanze Lemna minor und dem Süßwasser-Kleinkrebs Daphnia magna untersucht. Die Ergebnisse der Mischungstests belegen, dass die aquatische Toxizität von Mischungen im Hinblick auf chronische Endpunkte mit dem Konzept der Konzentrations-Additivität mit einer weniger als dreifachen Abweichung vorhergesagt werden kann. Es wurden Hinweise für eine synergistische Interaktion zwischen den zwei Antibiotikawirkstoffen Sul-famethoxazol und Trimethoprim in Primärproduzenten gefunden, die weitere Untersuchungen not-wendig erscheinen lassen. Weiterhin wurde gezeigt, dass ein Anteil von 50% Kläranlagenablauf (v:v) in der Testlösung die Vorhersagbarkeit der Mischungstoxizität nicht beeinträchtigt. In Bezug auf die typischerweise schwankenden Mischungskonzentrationen in Kläranlagenabläufen, zeigten die Unter-suchungen, dass die Mischungsvorhersage basierend auf mittleren Konzentrationen zu einer Unter-schätzung der chronischen Effekte auf die Reproduktion von D. magna führen kann, während die An-nahme der maximalen Konzentrationen zu einer besseren Vorhersage führt. Umweltrisikoabschätzun-gen auf Einzelstoff-Ebene wurden mit denen verschiedener Mischungsszenarien verglichen, basierend auf den verschiedenen Konzepten. Ein Sicherheitsfaktor für Mischungen, der in der Einzelstoffbewer-tung anzuwenden wäre, und seine angemessene Größe wird diskutiert als prospektiver Ansatz zur Be-rücksichtigung der Risiken von unbekannten Umweltmischungen.

Joint effects of pharmaceuticals and chemicals regulated under REACH
6
Table of Contents
List of Figures ........................................................................................................................................ 9
List of Tables ....................................................................................................................................... 10
List of Abbreviations ............................................................................................................................ 13
Summary ............................................................................................................................................ 15
Zusammenfassung ............................................................................................................................... 19
1 Introduction ............................................................................................................................... 24
2 Selection criteria for test substances and mixtures ....................................................................... 27
2.1 Relevance of exposure .......................................................................................................... 27
2.2 Relevance of effects.............................................................................................................. 29
2.3 Practicability ........................................................................................................................ 31
2.4 Pharmaceuticals and other chemicals detected in the aquatic environment............................. 31
3 Selected test substances ............................................................................................................. 34
3.1 Fungicides ............................................................................................................................ 34
3.2 Antibacterials ....................................................................................................................... 36
3.3 Lipid modifying agents .......................................................................................................... 43
3.4 Other test substances among pharmaceuticals....................................................................... 45
3.5 Chemicals regulated under REACH......................................................................................... 47
3.6 Predicted and measured effluent concentrations ................................................................... 48
3.6.1 Predicted environmental concentrations ......................................................................... 48
3.6.2 Measured concentrations in WWTP effluents................................................................... 49
4 Selected mixture scenarios.......................................................................................................... 54
4.1 Effect-based mixture composition ......................................................................................... 56
4.2 Exposure-based mixture composition .................................................................................... 56
4.3 Mixtures with a background of wastewater treatment plant effluent ...................................... 58
4.4 Mixtures with varying composition over time......................................................................... 58
5 Performance of experimental tests with individual substances and mixtures ................................. 60
5.1 Testing growth inhibition of Lemna minor .............................................................................. 61
5.2 Testing growth inhibition of cyanobacteria............................................................................. 61
5.3 Testing growth inhibition of green algae ................................................................................ 62
5.4 Testing chronic toxicity to Daphnia magna ............................................................................. 63
5.5 Testing of mixtures ............................................................................................................... 64
5.5.1 Testing of mixtures with WWTP effluent background ....................................................... 64
5.5.2 Testing of mixtures with varying concentrations over time................................................ 64

Joint effects of pharmaceuticals and chemicals regulated under REACH
7
5.6 Analytical verification of test concentrations .......................................................................... 65
5.7 Data analysis ........................................................................................................................ 65
5.8 Mixture calculations ............................................................................................................. 66
6 Effects of individual test substances............................................................................................. 69
6.1 Lemna minor ........................................................................................................................ 69
6.2 Cyanobacteria ...................................................................................................................... 71
6.3 Green algae.......................................................................................................................... 75
6.4 Daphnia magna .................................................................................................................... 77
6.5 Derivation of predicted no effect concentrations.................................................................... 79
7 Predicted and observed toxicity in the tested mixtures ................................................................. 82
7.1 Mixtures in Lemna minor ...................................................................................................... 82
7.1.1 Mixture 1: Three azoles in absence and presence of WWTP effluent ................................. 82
7.1.2 Mixture 3: Nine substances at about equipotent ratios ..................................................... 82
7.1.3 Mixture 4: Varying sulfamethoxazole and constant trimethoprim concentrations .............. 83
7.2 Mixtures in cyanobacteria ..................................................................................................... 84
7.2.1 Mixture 1: Sulfamethoxazole and trimethoprim in S. leopoliensis ...................................... 84
7.2.2 Mixture 2a: Sulfamethoxazole and clarithromycin in S. leopoliensis................................... 86
7.2.3 Mixture 2b: Clarithromycin and linezolid in A. flos-aquae .................................................. 87
7.2.4 Mixture 3: Ten substances at an about equipotent ratio in A. flos-aquae in absence and presence of WWTP effluent ...................................................................................... 87
7.2.5 Mixture 4: Three antibiotics at an equipotent ratio in A. flos-aquae................................... 89
7.3 Mixtures in green algae......................................................................................................... 89
7.3.1 Mixture 1: Three azoles in absence and presence of WWTP effluent ................................. 89
7.3.2 Mixture 2: Ten substances at an exposure-based ratio...................................................... 90
7.3.3 Mixture 3: Ten substances at an equipotent ratio in absence and presence of WWTP effluent .......................................................................................................................... 92
7.3.4 Mixture 4: Three substances at an equipotent ratio in absence and presence of WWTP effluent ............................................................................................................... 93
7.4 Mixtures in Daphnia magna................................................................................................... 95
7.4.1 Mixture 1: Three azoles at an equipotent ratio ................................................................. 95
7.4.2 Mixture 2: Nine substances at an exposure-based ratio .................................................... 95
7.4.3 Mixture 3: Nine substances at an about equipotent ratio in absence and presence of wastewater effluent ....................................................................................................... 96
7.4.4 Mixture 4: Three substances at an equipotent ratio and with constant or varying total mixture concentrations ........................................................................................... 98
7.5 Conclusions from mixture tests ............................................................................................. 99

Joint effects of pharmaceuticals and chemicals regulated under REACH
8
7.5.1 Predictability of chronic mixture effects by CA.................................................................. 99
7.5.2 Evidence for synergistic interaction ............................................................................... 101
7.5.3 Toxicity of WWTP effluent and impact on mixture toxicity predictions............................. 102
7.5.4 Predictability of the toxicity of mixtures varying in concentration or composition ............ 103
8 Consideration of mixtures in an environmental risk assessment .................................................. 105
8.1 PEC/PNEC summation ......................................................................................................... 105
8.2 MEC instead of PEC............................................................................................................. 107
8.3 Approaches based on toxic units ......................................................................................... 109
8.4 Acute versus chronic toxicity estimates in the mixture risk assessment.................................. 110
8.5 Approaches with regard to EQS ........................................................................................... 111
8.6 Restrict assessment to dominating substance(s) ................................................................... 111
8.7 Mixture assessment factor .................................................................................................. 112
8.8 Outlook.............................................................................................................................. 113
9 References ............................................................................................................................... 115
10 Confidential Annex ................................................................................................................... 126

Joint effects of pharmaceuticals and chemicals regulated under REACH
9
List of Figures
Figure 1: Visual comparison of median measured concentrations of selected test compounds in WWTP effluents............................................... 53
Figure 2: Calculation of Model Deviation Ratio (MDR) based on nominal as well as mean initial measured concentrations of the mixture components ................................................................................. 67
Figure 3: Yield (left) and growth rate (right) of S. leopoliensis and A. flos-aquae in dependence of increasing concentrations of sulfamethoxazole ... 71
Figure 4: Yield (left) and growth rate (right) of S. leopoliensis in dependence of increasing concentrations of mixture 1 (sulfamethoxazole and trimethoprim) .............................................................................. 85
Figure 5: Modelled concentration-response curves of mixture 2 in green algae ........................................................................................... 92
Figure 6: Concentration-response curves for mixture 3 in D. magna .............. 97

Joint effects of pharmaceuticals and chemicals regulated under REACH
10
List of Tables
Table 1: List of sources used to compile information on the presence of potential test substances in WWTP effluents and surface waters .... 28
Table 2: ATC groups with the number of pharmaceuticals per group that were reported as present in WWTP effluents and surface water ............. 32
Table 3: Features of the DMI-fungicides fluconazole, climbazole and propiconazole .............................................................................. 35
Table 4: Features of the antibacterials sulfamethoxazole and trimethoprim . 37
Table 5: Features of the antibacterials clarithromycin and erythromycin ...... 39
Table 6: Features of the antibacterial clindamycin....................................... 40
Table 7: Features of the antibacterial amoxicillin ........................................ 41
Table 8: Features of the antibacterial ciprofloxacin ..................................... 42
Table 9: Features of the antibacterial linezolid ............................................ 43
Table 10: Features of the lipid modifying agents bezafibrate, fenofibric acid, and simvastatin ............................................................................ 44
Table 11: Features of the pharmaceuticals fluoxetine, amlodipine, and metoprolol selected as test substances.......................................... 46
Table 12: Features of the REACH-regulated chemicals TCPP, 5-methylbenzotriazole and methylparaben....................................... 47
Table 13: PEC estimates derived for the human pharmaceuticals................... 49
Table 14: Measured concentrations (MC) of the 20 test substances in the 7 samples of WWTP effluent that were used for toxicity testing in the present study ............................................................................... 50
Table 15: Statistical distribution of measured concentrations (MC) of the 20 test substances in WWTP effluents derived from literature data (including the 7 WWTP effluent samples shown in Table 14)........... 51
Table 16: Comparison of the statistical data from this study with data from the literature ..................................................................................... 52
Table 17: Overview on the single substances in the tested mixtures .............. 54
Table 18: Overview on key aspects of the mixtures tested in the different test organisms .................................................................................... 55
Table 19: Compilation of typical concentrations of the selected test substances in municipal WWTP and available PEC values to support the decision on the exposure-based composition of mixtures tested in the present project ......................................................................................... 57
Table 20: Summary of toxicity estimates (mg/l) determined for individual test substances in the growth inhibition test with the aquatic plant Lemna minor after 7 days of static exposure ............................................. 70

Joint effects of pharmaceuticals and chemicals regulated under REACH
11
Table 21: Summary of toxicity estimates (mg/l) determined for the individual test substances in the growth inhibition test with the cyanobacterium Anabaena flos-aquae after 3 days of static exposure ...................... 73
Table 22: Summary of toxicity estimates (mg/l) determined for the individual test substances in the growth inhibition test with the cyanobacterium Synechococcus leopoliensis .......................................................... 74
Table 23: Summary of toxicity estimates (mg/l) determined for the individual test substances in the growth inhibition test with the green algae Pseudokirchneriella subcapitata after 3 days of static exposure ...... 76
Table 24: Summary of toxicity estimates (mg/l) determined for the individual test substances in the reproduction test with the freshwater micro-crustacean Daphnia magna after 21 days of semi-static exposure ... 78
Table 25: Predicted no effect concentrations (PNEC) derived for the individual test substances ............................................................................ 81
Table 26: MDR values determined for mixture 1 (three azoles) in L. minor with and without wastewater background ............................................ 82
Table 27: MDR values determined for mixture 3 (nine substances at about equipotent ratio) in L. minor ......................................................... 83
Table 28: MDR values determined for mixture 4 in L. minor .......................... 84
Table 29: MDR values determined for mixture 1 in S. leopoliensis.................. 85
Table 30: MDR values determined for mixture 2 in S. leopoliensis.................. 86
Table 31: MDR values determined for mixture 2 in A. flos-aquae ................... 87
Table 32: MDR values determined for mixture 3 (ten substances at an about equipotent ratio) in A. flos-aquae with and without wastewater background.................................................................................. 88
Table 33: MDR values determined for mixture 4 (three antibiotics at an equipotent ratio) in A. flos-aquae .................................................. 89
Table 34: MDR values determined for mixture 1 (three azoles) in green algae with and without wastewater background ..................................... 90
Table 35: MDR values determined for mixture 2 (ten substances at an exposure-based ratio) in green algae ............................................. 91
Table 36: MDR values determined for mixture 3 (ten substances at an equipotent ratio) in green algae with and without wastewater background.................................................................................. 93
Table 37: MDR values determined for mixture 4 (three substances at an equipotent ratio) in green algae with and without wastewater background.................................................................................. 94
Table 38: MDR values determined for mixture 1 (three azoles) in D. magna ... 95
Table 39: MDR values determined for mixture 2 (nine substances) in D. magna ......................................................................................... 96

Joint effects of pharmaceuticals and chemicals regulated under REACH
12
Table 40: MDR values determined for mixture 3 (nine substances at an equipotent ratio) in D. magna with and without wastewater background.................................................................................. 97
Table 41: MDR values determined for mixture 4 (three substances) in D. magna ......................................................................................... 99
Table 42: Toxicity estimate for A. flos-aquae and measured concentrations of test substances in WWTP effluent together with resulting toxic units and summed toxic units in the test solutions.................................103
Table 43: PEC/PNEC ratios derived for the individual test substances and the mixtures .....................................................................................106
Table 44: MEC/PNEC ratios derived for the individual test substances and the mixtures .....................................................................................108
Table 45: Mixture risk assessment for the nine or ten substances for which chronic toxicity data were available in the respective four test species........................................................................................110

Joint effects of pharmaceuticals and chemicals regulated under REACH
13
List of Abbreviations
(AA-)EQS (Annual average) environmental quality standard
AF Assessment Factor
API Active Pharmaceutical Ingredient
ATC Anatomical Therapeutic Chemical
CA Concentration Addition
CAS Chemical Abstracts Services
DDD Defined Daily Dose
DMI De-Methylase Inhibitor
EnCx Concentration with x% effect on the measured response variable n
ERA Environmental Risk Assessment
GWRC Global Water Research Coalition
IA Independent Action
IPBC Iodocarb (3-Iod-2-propinylbutylcarbamat)
LOEC Lowest Observed Effect Concentration
LOQ Limit of Quantification
MAF Mixture Assessment Factor
MCR Maximum Cumulative Ratio
MDR Model Deviation Ratio
MEC Measured Environmental Concentration
MoA Mode of Action
NOEC No Observed Effect Concentration
OECD Organization for Economic Co-operation and Development
PEC Predicted Environmental Concentration
PNEC Predicted No Effect Concentration
QSAR Quantitative Structure–Activity Relationship
REACH Registration, Evaluation, Authorisation and Restriction of Chemicals
RQ Risk Quotient
STU Sum of Toxic Units
TCEP Tris(2-chloroethyl)phosphate
TCPP Tris(2-chloropropyl)phosphate
TU Toxic Unit
twa Time-weighted average
UBA Federal Environment Agency Germany

Joint effects of pharmaceuticals and chemicals regulated under REACH
14
WFD Water Framework Directive
WHO World Health Organization
WWTP Wastewater Treatment Plant
Joint effects of pharmaceuticals and chemicals regulated under REACH
15
Summary
The environmental risk assessment (ERA) for anthropogenic chemicals traditionally focusses on indi-vidual substances. Yet, non-target organisms in the environment are exposed simultaneously to a mul-titude of substances from various sources. Exposure to such mixtures of substances can elicit stronger effects than exposure to the individual substances at the same concentrations. Since the ERA for indi-vidual substances may not be protective enough to cover such joint effects of chemicals in the environ-ment, there have been increasingly calls for the consideration of mixture toxicity within the ERA pro-cess and, consequently, integration of mixture considerations into regulations concerning the evalua-tion and authorisation of chemicals has been implemented to some degree. Yet, no regulatory frame-works currently exist that address the risks of mixtures encountered in the environment, i.e. the coin-cidental mixtures resulting from the various independently occurring releases of different chemicals. Wastewater collected in sewers can be seen as a system where such unintentional mixtures of anthro-pogenic chemicals are initially ‘created’ and, after degradation and transformation in a wastewater treatment plant (WWTP), are finally released into the environment. For the aquatic environment, ef-fluents of WWTPs thereby represent a key point source for unintentionally formed mixtures of chemi-cals from various uses, specifically for human pharmaceuticals as well as chemicals released from con-sumer products and industrial production processes.
The aim of the present project was to explore existing and eventually develop new concepts address-ing the consideration of mixtures of chemicals released via WWTPs into the aquatic environment in the ERA. This study focusses accordingly on wastewater effluents and chemicals typically present therein as the key point source for organic micro-pollutants in the aquatic environment. The approach applied in the present project involved the following steps:
► Survey of human pharmaceuticals and substances regulated under REACH (Registration, Evalua-tion, Authorisation and Restriction of Chemicals) that are typically present in the effluents wastewater treatment plants
► Selection of mixture composition scenarios based on this survey and other considerations ► Experimental testing to investigate the predictability of mixture toxicity and reliability of the pre-
diction for realistic mixtures typically present in wastewater effluents. Thereby, o particularly address the predictability of sub-lethal chronic effects that represent ERA rele-
vant endpoints, but have been rarely assessed systematically in mixture toxicity studies yet,
o particularly address potentially confounding influence of the wastewater effluent matrix on the predictability of effects, and
o particularly address the predictability of effects of mixtures that vary in their concentra-tion over time as it is typical for wastewater effluents.
► Discussion of potential concepts to consider mixture toxicity in WWTP effluents by applying these concepts to the experimentally investigated mixtures.
The exposure survey based on data until 2012 identified 236 active pharmaceutical ingredients (API) and 19 API-metabolites that had been reported at least once as present in WWTP effluents and/or sur-face waters. A large number of chemicals were retrieved in the exposure analysis that were either de-tected in WWTP effluents and surface waters or listed as being of potential concern for other reasons. The selection process considered reported presence of chemicals in WWTP effluents, practicability of testing (availability of substance and analytical method as well as reasonable water solubility and sta-bility in exposure solutions), potential for synergistic interactions due to inhibition of cytochrome P450 enzymes or indication for synergistic interaction reported in the literature, and substances prior-

Joint effects of pharmaceuticals and chemicals regulated under REACH
16
itized by the Umweltbundesamt (UBA). In total, 20 test substances were selected for the present pro-ject: 8 antibiotics (amoxicillin, clarithromycin, clindamycin, ciprofloxacin, erythromycin, linezolid, sul-famethoxazole, and trimethoprim), 7 non-antibiotic human pharmaceuticals (amlodipine, bezafibrate, fenofibric acid, fluconazole, fluoxetine, metoprolol, and simvastatin), 4 substances regulated under REACH (climbazole, 5-methylbenzotriazole, methylparaben, and tris(2-chloropropyl)phosphate), and 1 biocide/plant protection product (propiconazole). Due to lack of effects and hydrolytic instability, respectively, bezafibrate and simvastatin were dropped from the final list of substances included in mixture tests. It is important to note that the resulting mixture scenarios based on the selected test substances is ‘realistic’ in the meaning that it can occur in WWTP effluents (along with other possible scenarios), but that it cannot be considered as representative as it focussed strongly on substances for which already data are available. It is thereby biased against substances that received so far no or little attention in environmental research. However, a few selected substances (linezolid, amlodipine, and fenofibric acid) represent exceptions from this, as hardly any or no information on their environmen-tal presence and effects were available at the project start.
Existing data on the selected test substances, i.e. available ecotoxicological data and measured concen-trations in WWTP effluents were compiled during an extensive literature survey. These data were complemented in the present project by repeated analytical measurements in the WWTP effluent that was used in mixture testing. With regard to ecotoxicological data, single-substance tests conducted in the project provided concentration-response curves for various chronic endpoints in Lemna minor, Daphnia magna, Pseudokirchneriella subcapitata, Anabaena flos-aquae, and Synechococcus leopoliensis. In total, 33 valid chronic toxicity tests with single substances were conducted in the project according to the relevant OECD test guidelines. Determined toxicity estimates from these tests were corrected for measured concentrations if those deviated by more than 20% from the nominal test concentra-tions. Subsequently to the single-substance tests, 17 independent aquatic chronic mixture toxicity tests were conducted with the same five different species. In total, 24 mixtures were thereby investi-gated as fixed-ratio dilutions at five to seven concentration levels. Most of them were designed as equi-potent mixtures, based on the key chronic endpoint. This key endpoint was 10% growth inhibition (ErC10) in primary producers and 10% reproduction inhibition (EC10) in D. magna. Selected mixtures were tested in parallel without and with 50% of WWTP effluent. Two mixtures (in L. minor and D. magna) were tested in parallel, once at constant concentrations and once with varying mixture con-centrations. Similar to single-substance tests, toxicity estimates were derived based on nominal con-centrations and corrected, if necessary, for measured test substance concentrations. As a measure for mixture toxicity predicted by the concept of concentration addition (CA) and the experimentally deter-mined mixture toxicity, the Model Deviation Ratio (MDR) was calculated as quotient of predicted and observed toxicity estimates for a range of endpoints.
The results from the mixture tests provided comprehensive and consistent evidence that the aquatic toxicity of mixtures with regard to chronic endpoints can in many cases be fairly well predicted by the CA concept, i.e. with a less than 3-fold deviation. So far, the suitability of CA for predicting the toxicity of mixtures of substances with similar as well as dissimilar mode of action has almost exclusively been demonstrated for acute toxicity endpoints. The present study indicates that the suitability of CA ex-tends also to chronic endpoints with a less than 3-fold underestimation of mixture toxicity. Overesti-mation of chronic mixture toxicity by CA was more frequent, and was stronger for algae (up to 3.7-fold) than for Daphnia (up to 2.6-fold). In addition, compliance between predicted and observed tox-icity was greatest for median responses, slightly worse for low effect levels (i.e. EC10), and worst with non-systematic deviations if threshold concentrations such as the no observed effect concentration (NOEC) was used in the calculation. These patterns are most likely related to mathematical-statistical issues, among others the greater problem to closely fit a model to the extreme ends of a concentration-response curve.

Joint effects of pharmaceuticals and chemicals regulated under REACH
17
The two antibiotics sulfamethoxazole and trimethoprim were present together or along with other substances in several tests with primary producers. All tests except one with L. minor provided evi-dence for synergistic interaction of these two antibiotics. Yet, the evidence was not consistent and fully convincing as the indication on synergistic interaction and its degree strongly depended on effect lev-els, response variables (growth rate or yield), test species, presence of other mixture components, and assumptions on the concentration-response curves to be fitted. Therefore, further research is needed to confirm and verify synergistic interaction of sulfamethoxazole and trimethoprim in primary produc-ers, which reached in the present study up to an 8.4-fold greater toxicity than predicted by CA.
From the testing of five mixtures with WWTP effluent background, it can be concluded that the matrix of treated wastewater does not interfere with the predictability of mixture toxicity. This holds true even in the case of enhancing effects (seen in D. magna) and to a lesser degree also in case of toxic ef-fects of the effluent itself as found for cyanobacteria.
The test with varying mixture concentrations in a Daphnia reproduction study provided evidence that using the average concentrations of the mixture components over time may not be protective for the key endpoint reproduction, while peak concentrations appeared to achieve better compliance with mixture predictions. Yet, the toxicity of this three-component mixture was 5-fold overestimated by CA for the more integrative endpoint population growth rate based on peak concentrations of the varying exposure scenario. In contrast, a test with varying concentrations of sulfamethoxazole but constant trimethoprim concentrations in L. minor indicated that the time-weighted average concentration of this varying exposure scenario provided similar deviations between predicted and observed mixture toxicity as the constant exposure scenario in a parallel test.
From the determined single-substance toxicity estimates together with data compiled from literature and other projects, predicted no effect concentrations (PNECs) were derived. PNECs were based on endpoints for chronic toxicity with an applied assessment factor of 10, 50, or 100, depending on data richness. In addition, predicted environmental concentrations (PECs) for the human pharmaceuticals were calculated according to the relevant environmental risk assessment guideline. PEC values for chemicals regulated under REACH are not publicly available. These substances could therefore not be considered in PEC-based mixture assessments. Measured concentration in WWTP effluents were com-piled from literature sources and own data, and translated into measured environmental concentra-tions (MECs) using a dilution factor of 10. PEC or MEC values were related to the derived PNEC values in an ERA of the single substances and of their mixtures.
Various approaches have been proposed in the literature for an assessment of mixtures in the environ-ment that differ mainly in the used exposure- and effect-related estimates for the mixture. Usually CA is implicitly or explicitly the basis for the effect-related mixture estimates, while the concept of inde-pendent action (IA) or combined concepts may be suggested for higher tier assessments. The present study applied in a tiered approach these suggested concepts: starting with the PEC/PNEC summation as the most conservative mixture risk assessment concept, continuing with the replacement of the PEC by reliable MEC values (i.e., increasing realism at the exposure side), and finally turning to the Toxic Unit (TU) approach as the one closest to applying the CA concept. Obtained results were compared and the different approaches further illustrated with examples from the literature, where available. The PEC/PNEC summation indicated risk for the mixture of 13 substances with available PECs as well as for the mixture of 8 antibiotics. Yet, an environmental risk could already not be excluded at the level of the single-substance assessments. Refining the exposure estimates in the risk assessment by using MEC values resulted in no indication of environmental risk at the single-substance level. A risk at the mixture level was only indicated for a mixture of all test substances when assuming the 90% percen-tile concentration from the MEC distribution of each substance. The TU approach finally indicated no risk for the different mixture scenarios of nine or ten substances that were tested in the four taxa groups (cyanobacteria, green algae, crustacean, and water plants) when assuming an AF of 10. In all

Joint effects of pharmaceuticals and chemicals regulated under REACH
18
taxa groups except cyanobacteria, the TU approach for the mixture allowed for an AF of 50 without in-dicating risk, which may be deemed more appropriate since no TU-based assessment could be con-ducted for fish due to lack of data.
It is one key pattern of mixture assessment approaches relying on concepts of mixture toxicity such as CA that they can only address defined mixtures. Hence, the mixture risk assessment can only be ap-plied retrospectively to evaluate mixture risks and to identify the drivers of risks in a given mixture. The mixture assessment factor (MAF) is discussed here as a potential solution for a prospective mix-ture risk assessment. The MAF would be applied in every single-substance assessment as an additional assessment factor to account for ‘mixture uncertainty’. Apart from lacking justification to ‘blame’ each substance in the same way for potential additional mixture risk independently of its actual or potential contribution, the problem arises to establish an appropriate size of this additional safety factor. Availa-ble evidence from published mixture risk assessment studies indicates an up to 5-fold greater risk of environmental mixtures compared to their most ‘risky’ single component. With regard to the mixture scenarios assessed in the present study, the maximum cumulative ratio (MCR) as measure for the ad-ditional risk of the mixture did not exceed 2. Hence, a MAF of the size of up to 5 appears currently as best supported by the limited empirical evidence.
Comprehensive and scientifically sound monitoring is expected to deliver the information on the ac-tual composition of mixtures of chemicals in the environment, which would allow identifying priority mixtures and support a better-informed choice of an MAF. The selection of analytes to be covered in monitoring programs is strongly determining the success of such an attempt. It is concluded in the dis-cussion that the selection of compounds for monitoring should not be biased towards substances with already available data, and it should be based on prioritization of risk (i.e. neither exposure or hazard alone) in order to enable the identification of the drivers of mixture risk. Furthermore, chronic instead of acute toxicity data should be used in a mixture risk assessment and approaches for identifying the drivers of mixture risk, because particularly among pharmaceuticals acute-to-chronic ratios may strongly differ among trophic levels in a substance-specific way. Yet, this is hampered by the limited availability of chronic data for human pharmaceuticals (as well as for substances regulated under REACH). Antibiotics and their mixtures were identified in the present study as the group with the greatest risk among the assessed substances. Hence, the effects of antibiotic residues in WWTP efflu-ents and their joint effects in the environment appear to be of the greatest concern, and require fur-ther research and confirmation of synergistic interaction potential.

Joint effects of pharmaceuticals and chemicals regulated under REACH
19
Zusammenfassung
Die Umweltrisikobewertung (ERA) anthropogener Chemikalien bezieht sich üblicherweise auf Ein-zelsubstanzen. In der Umwelt sind Organismen jedoch einer Vielzahl von Substanzen aus unterschied-lichsten Quellen gleichzeitig ausgesetzt. Die Exposition gegenüber solchen Substanzmischungen kann stärkere Effekte hervorrufen als die Exposition gegenüber den Einzelsubstanzen in gleicher Konzent-ration. Da die ERA für Einzelsubstanzen Mischungseffekte von Umweltchemikalien möglicherweise nicht protektiv genug abdeckt, wird im Bewertungsprozess zunehmend die Berücksichtigung der Mi-schungstoxizität gefordert. Die Integration der Mischungsbewertung in Vorschriften, die die Zulassung von Chemikalien regeln, ist für einige Vollzüge bereits zu einem gewissen Grad erfolgt. Im Moment existieren jedoch keine rechtlichen Rahmenbedingungen, die die Risiken von in der Umwelt vorkom-menden bzw. dort entstehenden Mischungen regulieren. Umweltmischungen entstehen zufällig durch voneinander unabhängige Einträge verschiedener Chemikalien in die Umwelt. Abwasser ist ein Sys-tem, in dem solche unbeabsichtigten Mischungen anthropogener Chemikalien zunächst erzeugt, durch den Abbau in Kläranlagen (WWTPs) transformiert und schließlich in die Umwelt entlassen werden. Kläranlagenabläufe stellen also einen punktuellen Haupteintragspfad für unbeabsichtigte Mischungen von Chemikalien dar, insbesondere für Arzneimittel sowie Chemikalien aus Verbraucherprodukten und industriellen Produktionsprozessen.
Das Ziel dieses Projektes war es, bereits existierende Konzepte zu untersuchen und eventuell neue zu entwickeln, die sich mit der Berücksichtigung von Chemikalienmischungen aus Kläranlagen und deren Eintrag in die aquatische Umwelt in der Umweltrisikobewertung befassen. Die Studie konzentriert sich auf Abwasserabläufe, da diese typischerweise als Haupteintragspfad für organische Mikroschadstoffe in die aquatische Umwelt anzusehen sind.
Das Vorgehen in diesem Projekt beinhaltete folgende Schritte:
► Erfassung von Arzneimitteln und Chemikalien, die unter REACH reguliert werden, und die typi-scherweise in Kläranlagenabläufen vorkommen
► Auswahl von Mischungs-Szenarien für experimentelle Untersuchungen, basierend auf vorangegan-genen Untersuchungen und anderen Faktoren
► Experimentelle Untersuchungen, um die Vorhersagbarkeit der Mischungstoxizität und die Verläss-lichkeit der Vorhersage für realistische Mischungen, die typischerweise in Kläranlagenabläufen vorkommen, zu untersuchen. Der Fokus lag dabei insbesondere auf
o der Vorhersagbarkeit von sub-letalen, chronischen Effekten, die die relevanten Endpunkte der Umweltrisikobewertung darstellen, jedoch bisher kaum in Mischungstoxizitätsstudien untersucht wurden,
o dem möglicherweise verfälschenden Einfluss der Matrix des Kläranlagenablaufs auf die Vorhersagbarkeit der Toxizität und
o auf der Vorhersagbarkeit der Toxizität von Mischungen, deren Konzentration sich über die Zeit verändert, so wie es für Abwasser typisch ist.
► Diskussion der möglichen Konzepte, um Mischungstoxizität in Kläranlagenabläufen zu berücksich-tigen sowie Anwendung der verschiedenen Konzepte auf die experimentell untersuchten Mischun-gen.
Die Auswertung zum Vorkommen von Mikroschadstoffen in Kläranlagenabläufen identifizierte, basie-rend auf Daten bis 2012, 236 Arzneimittelwirkstoffe (API) und 19 API-Abbauprodukte, die zumindest einmal in Kläranlagenabflüssen und/oder Oberflächengewässern aufgefunden wurden. In der Exposi-tionsanalyse wurde eine große Anzahl an Industriechemikalien ermittelt, die entweder in Kläranla-genabläufen oder in Oberflächengewässern nachgewiesen oder aus anderen Gründen als potentiell besorgniserregend gelistet wurden.

Joint effects of pharmaceuticals and chemicals regulated under REACH
20
Der Auswahlprozess der Testsubstanzen berücksichtigte das nachgewiesene Auftreten in Kläranla-genabläufen, die Praktikabilität der Testung (Verfügbarkeit der Substanz und einer analytischen Nach-weismethode, sowie hinreichende Wasserlöslichkeit und Stabilität in Testlösungen), Anhaltspunkte für synergistische Interaktionen aufgrund der Hemmung von Cytochrom P450 Enzymen oder Hin-weise in der Literatur auf synergistische Interaktionen, und andere Erwägungen des Umweltbundes-amts (UBA). Insgesamt wurde 20 Testsubstanzen für dieses Projekt ausgewählt: 8 Antibiotika (Amoxi-cillin, Clarithromycin, Clindamycin, Ciprofloxacin, Erythromycin, Linezolid, Sulfamethoxazol, Trime-thoprim), 7 nicht-antibiotische Arzneimittel (Amlodipin, Bezafibrat, Fenofibrinsäure, Fluconazol, Fluo-xetin, Metoprolol, Simvastatin), 4 unter REACH regulierte Substanzen (Climbazol, 5-Methylbenzotria-zol, Methylparaben, Tris(2-chloropropyl)phosphat) und 1 Biozid/Pflanzenschutzmittel (Propicona-zol). Aufgrund geringer Effekte beziehungsweise hydrolytischer Instabilität, wurden Bezafibrat und Simvastatin nicht in Mischungstests eingesetzt. Die ausgewählten Mischungs-Szenarien sind in dem Sinne „realistisch“, dass die Mischungskomponenten in Kläranlagenabläufen auftreten (zusammen mit anderen möglichen Substanzen). Sie können aber nicht als repräsentativ betrachtet werden für Mi-schungen in Kläranlagenabläufen, da die Auswahl gut untersuchte Substanzen favorisiert hat. Einige der ausgewählten Arzneimittel (Linezolid, Amlodipin, Fenofibrinsäure) stellen dabei aber eine Aus-nahme dar, da bei Projektbeginn nur wenige oder keine Informationen über ihr Auftreten in der Um-welt und ihre Effekte verfügbar waren.
Im Rahmen einer umfangreichen Literaturrecherche wurden vorhandene Daten zu den ausgewählten Testsubstanzen zusammengestellt, insbesondere zu ökotoxikologischen Effekten und Konzentrationen in Kläranlagenabläufen, und durch Untersuchungen im Projekt ergänzt. Bezüglich ökotoxikologischer Effekte wurden in diesem Projekt in Einzelsubstanz-Tests vollständige Konzentrations-Wirkungs-Kur-ven für verschiedene chronische Endpunkte in Lemna minor, Daphnia magna, Pseudokirchneriella sub-capitata, Anabaena flos-aquae und Synechococcus leopoliensis erhoben. Insgesamt wurden 33 valide chronische Toxizitätstests mit Einzelsubstanzen gemäß der relevanten OECD Testrichtlinien durchge-führt. Die ermittelten Toxizitätskennwerte wurden anhand der analytisch bestimmten Konzentratio-nen in den Testlösungen korrigiert, sofern diese mehr als 20% von den nominalen Testkonzentratio-nen abwichen. Anschließend an die Einzelsubstanz-Tests folgten 17 unabhängige chronische Mi-schungstests mit denselben 5 Testorganismen. Dabei wurden insgesamt 24 Mischungen in einem fes-ten Konzentrationsverhältnis der Mischungskomponenten in fünf bis sieben Konzentrationsstufen un-tersucht. Die meisten wurden als äquipotente Mischungen geplant, basierend auf dem jeweils ent-scheidenden chronischen Endpunkt. Dieser entscheidende Endpunkt war 10%ige Hemmung der Wachstumsrate (ErC10) bei den Primärproduzenten und 10%ige Hemmung der Reproduktion (EC10) bei D. magna. Einige Mischungen wurden parallel sowohl mit als auch ohne 50%igen Anteil an Kläran-lagenablauf in der Testlösung untersucht. Zwei Mischungen (mit L. minor und D. magna) wurden pa-rallel sowohl bei konstanten als auch bei variierenden Mischungskonzentrationen getestet. Analog zu den Einzelsubstanz-Tests, wurden die Toxizitätskennwerte basierend auf den nominalen Konzentrati-onen ermittelt und ggf. basierend auf analytisch bestimmten Konzentrationen korrigiert. Um die Vor-hersage der Mischungstoxizität mit Hilfe des Konzepts der Konzentrations-Additivität (CA) und der experimentell ermittelten Mischungstoxizität zu bewerten, wurde das Modell-Abweichungs-Verhältnis (MDR) als Quotient aus den vorhergesagten und experimentell erhobenen Toxizitätskennwerten für verschiedene Endpunkte berechnet.
Die Ergebnisse der Mischungstests belegen, dass die aquatische Mischungstoxizität im Hinblick auf chronische Endpunkte mit dem CA-Konzept in den meisten Fällen gut vorhergesagt werden kann, d.h. mit einer weniger als 3-fachen Abweichung. Bisher wurde die Eignung des CA-Konzepts zur Vorher-sage der Mischungstoxizität von Substanzen mit gleichen als auch mit unterschiedlichen Wirkmecha-nismen fast ausschließlich für die akute Toxizität gezeigt. Die vorliegende Untersuchung belegt, dass sich die Eignung des CA-Konzeptes auch auf chronische Endpunkte erweitern lässt, bei einer weniger

Joint effects of pharmaceuticals and chemicals regulated under REACH
21
als 3-fachen Unterschätzung der Mischungstoxizität. Eine Überschätzung der chronischen Mi-schungstoxizität trat häufiger auf als eine Unterschätzung und war bei Algen stärker (bis 3,7-fach) als bei Daphnia (bis zu 2,5-fach). Außerdem war die Übereinstimmung zwischen vorhergesagter und be-obachteter Toxizität bei mittleren Effektgrößen am besten, etwas weniger gut bei niedrigen Effektgrö-ßen (wie z.B. dem EC10) und am schlechtesten, mit nicht-systematischen Abweichungen, bei Schwel-lenkonzentrationen wie der statistisch ermittelten „no-observed-effect-concentration“ (NOEC). Dies lässt sich vor allem auf mathematisch-statistische Gründe zurückführen, insbesondere das Problem, die Enden einer Konzentrations-Wirkungskurve mit einem mathematischen Modell anzupassen.
Die zwei Antibiotika Sulfamethoxazol und Trimethoprim wurden sowohl zusammen als auch in Kom-bination mit weiteren Substanzen in mehreren Tests mit Primärproduzenten untersucht. Mit Aus-nahme eines Lemna-Tests ergaben alle Tests Hinweise auf synergistische Interaktionen dieser zwei Antibiotika. Die Anhaltspunkte für eine synergistische Interaktion waren allerdings nicht vollständig überzeugend, da das Auftreten und das Ausmaß der synergistischen Interaktion sich als abhängig er-wiesen von der Effektgröße, den Messvariablen (Wachstumsrate oder Biomasse), Testorganismen, An-wesenheit von anderen Mischungskomponenten sowie Annahmen über die Konzentrations-Wirkungs-kurven. Daher sind weitere Untersuchungen notwendig, um eine synergistische Interaktion von Sulfa-methoxazol und Trimethoprim in Primärproduzenten (bis zu 8,4-fach höhere Mischungstoxizität als erwartet) zu bestätigen.
Die Untersuchung von 5 Mischungen mit Kläranlagenablauf als Hintergrund ergab, dass die Matrix aus behandeltem Abwasser nicht die Vorhersagbarkeit der Mischungstoxizität beeinflusst. Das trifft auch bei Reproduktionsförderung der Testorganismen (siehe D. magna) und zu einem geringeren Teil auch bei toxischen Effekten durch das Abwasser selbst zu.
Die Untersuchungen mit variierenden Mischungskonzentrationen in einem Reproduktionstest mit Daphnien ergaben, dass die mittlere Konzentration der Mischung über die Zeit voraussichtlich keine protektive Bewertung für den Hauptendpunkt Reproduktion erlaubt, während durch Annahme der Maximalkonzentrationen eine bessere Übereinstimmung mit den Mischungsvorhersagen erzielt wer-den konnte. Allerdings wurde basierend auf den Maximalkonzentrationen die Toxizität dieser 3-Kom-ponentenmischung durch das CA-Modell um den Faktor 5 überschätzt im Hinblick auf den mehr integ-rativen Endpunkt Populationswachstumsrate. Im Gegensatz dazu zeigte ein Test mit variierenden Sul-famethoxazol- und gleichbleibenden Trimethoprimkonzentrationen bei Annahme der mittleren Kon-zentrationen ähnliche Abweichungen zwischen vorhergesagter und beobachteter Mischungstoxizität wie ein paralleler Test mit einem konstanten Expositionsszenario.
Predicted no effect concentrations (PNECs), also Konzentrationen, bei welchen kein Effekt erwartet wird, konnten mithilfe der ermittelten Einzelsubstanz-Toxizitätskennwerte sowie der aus der Litera-tur und anderen Projekten erhobenen Daten abgeleitet werden. Alle PNECs basierten auf chronischen Endpunkten mit einem Sicherheitsfaktor von 10, 50 oder 100, abhängig von der Datenmenge. Zusätz-lich wurden predicted environmental concentrations (PECs), also vorhergesagte Umweltkonzentratio-nen, für die Arzneimittel gemäß der relevanten Richtlinie berechnet. Für die unter REACH regulierten Chemikalien liegen keine öffentlich verfügbaren PEC-Werte vor; diese Substanzen konnten daher in PEC-basierten Mischungsbewertungen nicht berücksichtigt werden. In Kläranlagenabläufen gemes-sene Konzentrationen wurden aus Literaturquellen und eigenen Daten zusammengestellt und mithilfe eines Verdünnungsfaktors von 10 in gemessene Umweltkonzentrationen (MECs) übersetzt. PEC- oder MEC-Werte wurden mit den ermittelten PNEC-Werten in einer Umweltrisikobewertung der Einzelsub-stanzen als auch ihrer Mischungen ins Verhältnis gesetzt.
In der Literatur werden verschiedene Vorschläge für die Bewertung von Mischungen in der Umwelt vorgeschlagen. Diese unterscheiden sich hauptsächlich in den verwendeten Expositions- oder Effekt-

Joint effects of pharmaceuticals and chemicals regulated under REACH
22
bezogenen Werten für die Mischungen. Üblicherweise dient das Konzept der Konzentrations-Additivi-tät (implizit oder explizit) als Basis für die Ableitung der Mischungseffekte, während das Konzept der unabhängigen Wirkung (IA) oder kombinierte Konzepte für Verfeinerungen vorgeschlagen werden.
Die vorliegende Studie hat in einer stufenweisen Abfolge diese Konzepte angewendet: Beginnend mit der PEC/PNEC-Summierung als konservativster Methode, gefolgt von einer Verfeinerung auf der Ex-positionsseite durch Verwendung von verlässlichen MEC- statt PEC-Werten und abschließend mit der Methode der toxischen Einheiten (TU), welche die größte Ähnlichkeit mit dem eigentlichen CA-Kon-zept aufweist. Die Ergebnisse wurden verglichen und die unterschiedlichen Vorgehensweisen wurden, falls vorhanden, mit weiteren Beispielen aus der Literatur illustriert. Die PEC/PNEC-Summierung zeigte ein Risiko für die Mischung mit 13 Substanzen mit verfügbaren PEC-Werten an sowie für die Mi-schung mit 8 Antibiotika. Ein Risiko für die Umwelt konnte allerdings schon auf der Ebene der Ein-zelsubstanzen nicht ausgeschlossen werden. Nach Verfeinerung durch die Verwendung der MEC-Werte zeigte die Einzelsubstanzbewertung kein Risiko mehr an. Ein Risiko für die Mischung allen 18 Testsubstanzen konnte aber nicht ausgeschlossen werden, sofern die konservativen 90%-Perzentil-Konzentrationen der MEC-Verteilung von jeder Substanz angenommen wurde. Die TU-Methode schließlich zeigte bei Annahme eines Sicherheitsfaktors von 10 kein Risiko für die verschiedenen Mi-schungen von neun oder zehn Substanzen an, die jeweils in den vier verschiedenen Taxa-Gruppen (Cyanobakterien, Grünalgen, Krebstiere und Wasserpflanzen) getestet worden waren. Bei allen Taxa-Gruppen, mit Ausnahme der Cyanobakterien, ergab auch ein Sicherheitsfaktor von 50 kein Risiko für die Mischung. Ein Sicherheitsfaktor von 50 kann als angemessen angesehen werden, da für Fische auf-grund fehlender Daten keine TU-basierte Bewertung durchgeführt werden konnte.
Eine Gemeinsamkeit aller Mischungsbewertungsansätze, die auf Konzepten der Mischungstoxizität wie dem CA-Konzept aufbauen, ist es, dass nur eindeutig definierte Mischungen betrachtet werden können. Daher kann eine Risikobewertung von Mischungen nur retrospektiv durchgeführt werden, um Mischungsrisiken einzuschätzen und die Hauptverursacher des Mischungsrisikos zu identifizieren.
Der Mischungssicherheitsfaktor (MAF) wird hier als eine mögliche Lösung für eine vorsorgliche Risi-kobewertung von Mischungen diskutiert. Der MAF würde in jeder Risikobewertung einer Einzelsub-stanz als ein zusätzlicher Sicherheitsfaktor eingesetzt werden, um die Unsicherheit durch Mi-schungstoxizität abzudecken. Abgesehen von einer fehlenden Rechtfertigung, jede Substanz in glei-chem Maße für ein additives Mischungsrisiko verantwortlich zu machen, unabhängig von ihrer eigent-lichen oder möglichen Beteiligung, entsteht das Problem die angemessene Größe eines solchen MAFs festzulegen. Vorliegende Belege aus publizierten Mischungsbewertungen von realen Proben zeigen ein bis zu fünffach größeres Risiko der Mischung im Vergleich zum Risiko der ‚problematischsten‘ Ein-zelsubstanz in dieser Mischung. Bei den in der vorliegenden Studie analysierten Mischungsszenarien überschritt die maximum cumulative ratio (MCR) als Maß für das zusätzliche Mischungsrisiko in kei-nem Fall den Wert von 2. Ein MAF in der Größenordnung von bis zu 5 kann daher bei der bisher gerin-gen empirischen Grundlage als am besten unterstützt angesehen werden.
Umfassendes und wissenschaftlich fundiertes Monitoring würde Informationen über die tatsächliche Zusammensetzung von Chemikalienmischungen in der Umwelt liefern. Solche Informationen erlauben es, die Mischungen mit der höchsten Priorität zu identifizieren und würden die Festlegung eines ange-messenen MAF unterstützen. Die Auswahl der Analyten für das Monitoring-Programm ist maßgeblich für den Erfolg eines solchen Ansatzes. Diese Auswahl sollte sich nicht auf gut untersuchte (und ggf. als problematisch gelistete) Substanzen beschränken und sie sollte risiko-basiert sein, um die Hauptver-ursacher von Mischungsrisiken identifizieren zu können. Außerdem sollten chronische anstelle von akuten Toxizitätsdaten in einer Mischungsrisiko-Bewertung von Arzneimitteln und eine Identifizie-rung der hauptverantwortlichen Substanzen verwendet werden, da sich gerade unter Arzneimitteln das Verhältnis von akuten zu chronischen Effekten zwischen den trophischen Ebenen und zwischen einzelnen Substanzen stark unterscheiden kann. Antibiotika und Mischungen von Antibiotika wurden

Joint effects of pharmaceuticals and chemicals regulated under REACH
23
in der vorliegenden Studie als die Gruppe mit dem größten Risiko unter den untersuchten Substanzen identifiziert. Daher erscheinen insbesondere die Effekte von Antibiotikarückständen in Kläranlagenab-läufen und ihre kombinierten Effekte in der Umwelt von großer Relevanz und sollten weiter unter-sucht werden, auch im Hinblick auf ihr Potential zu synergistischen Interaktionen.
Joint effects of pharmaceuticals and chemicals regulated under REACH
24
1 Introduction The environmental risk assessment (ERA) for anthropogenic chemicals traditionally focusses on indi-vidual substances. This ensures that producers and/or users of substances for which risks were identi-fied can be directly addressed to take responsibility for the necessary risk reduction, management and mitigation measures. Yet, non-target organisms in the environment are exposed simultaneously to a multitude of substances from various sources. Exposure to such mixtures of substances can elicit stronger effects than exposure to the individual substances at the same concentrations. These so-called mixture, combined or joint effects have been well documented in the scientific literature over the last decades, and have been addressed in several recent reviews and communications (Kortenkamp et al. 2009, EC 2012a, Altenburger et al. 2013, Cedergreen 2014, Backhaus 2016). Since the ERA for individual substances may not be protective enough to cover such joint effects of chemi-cals in the environment, there have been increasingly calls for the consideration of mixture toxicity within the ERA process and, consequently, integration into regulations concerning the authorisation of chemicals and protection of the environment (EC 2009a, EC 2011a, NC 2012). In the case of biocides and plant protection products, the relevant regulations (EC 2009b, EC 2012b) require the considera-tion of joint effects for intentional mixtures such as those represented by marketed products contain-ing more than one active substance and/or environmentally relevant formulation additives. Similarly, there are measures to deal with intentional mixtures of chemicals that are regulated under REACH (Registration, Evaluation, Authorisation and Restriction of Chemicals, EC 2006). The regulatory frame-work for human pharmaceuticals (EMEA 2006) currently does not request the consideration of mix-ture toxicity in the ERA of medicinal products that contain several active pharmaceutical ingredients (API). In contrast, the regulatory framework for veterinary pharmaceuticals does address such combi-nation products in the risk quotient approach (EMEA 2008). None of these regulatory frameworks deals with the risks of mixtures that are encountered finally in the environment, i.e. coincidental mix-tures resulting from the various independently occurring releases of the same or different chemicals.
Wastewater collected in sewers can be seen as a system where such unintentional mixtures of anthro-pogenic chemicals are initially ‘created’ and, after degradation and transformation in a wastewater treatment plant (WWTP), finally released into the environment. For the aquatic environment, effluents of WWTPs thereby represent a key point source for unintentional mixtures of chemicals from various uses e.g. in private households, health care institutions, commercial businesses and industrial produc-tion. Wastewater is the key entry path into the environment particularly for human pharmaceuticals as well as chemicals released from consumer products and industrial production processes. WWTPs are historically designed and optimized to remove nutrients and organic matter from wastewater, be-cause these lead to oxygen depletion and eutrophication in receiving surface waters (Ternes et al. 2004). Some anthropogenic chemicals, which are typically present at low concentrations in the wastewater stream and therefore called micro-pollutants, are as well removed from the wastewater to some degree during the treatment processes. However, the removal efficacy varies strongly among chemicals and depends on the applied treatment processes (Luo et al. 2014, Gerbersdorf et al. 2015).
Part of the ERA of mainly wastewater-born substances such as human pharmaceuticals and many chemicals regulated under REACH is the prospective estimation of concentrations in WWTP effluents. Concentrations in surface waters are predicted using a standard dilution factor of 10 (EMEA 2006, ECHA 2016) to account for the dilution of discharged WWTP effluent by the receiving water body. On the other hand, the Water Framework Directive (WFD, EC 2000, EC 2011b) as another part of Euro-pean legislation, relates to the protection of the aquatic environment. In this context, environmental quality standards (EQS) are established for priority pollutants (listed in Annex X of the WFD) in the aquatic environment that may not be exceeded to ensure good ecological and chemical status. These EQS are derived by a single-substance assessment fairly similar to the prospective ERA conducted dur-ing the regulatory authorisation and registration of chemicals. Yet, an EQS does not discriminate

Joint effects of pharmaceuticals and chemicals regulated under REACH
25
among sources of the chemical in question (e.g. pharmaceutical or biocidal use), but relates to the summed concentration of all releases of the same chemical. While the technical guidance for deriving EQS recommends the toxic unit approach according to Altenburger & Greco (2009) for the considera-tion of mixtures, this addresses only ‘well-defined mixtures’ such as petroleum, but not mixtures of substances from various sources that are formed ad hoc in the aquatic environment. A recent study has questioned the protectiveness of established (or proposed) EQS values in view of possible joint effects (Carvalho et al. 2014).
Hence, within the context of prospective ERAs for individual substances in various regulatory frame-works and the assessment of environmental quality based on the WFD, there is currently no estab-lished approach to deal with the joint effects of mixtures of chemicals entering the aquatic environ-ment due to various uses and processes. The aim of the present project was therefore to explore exist-ing and eventually develop new concepts addressing the consideration of mixtures of chemicals re-leased via WWTPs into the aquatic environment. This study focusses accordingly on WWTP effluents and chemicals typically present therein as the key point source for organic micro-pollutants in the aquatic environment.
An ERA consists of three parts: firstly, the exposure assessment, secondly, the effects assessment and thirdly, the combination of the two in the risk assessment. With regard to the effect assessment, the concept of concentration addition (CA, introduced by Loewe & Muischnek 1926) is recommended as default model for the prediction of additive effects of mixtures of chemicals by regulatory documents (e.g. ECHA 2014) as well as by scientific publications (e.g. Cedergreen et al. 2008, Kortenkamp et al. 2009, ECETOC 2011, Backhaus & Faust 2012). The concept of independent action (IA, introduced by Bliss 1939) is deemed scientifically more appropriate to predict additive effects of substances with dissimilar mode of action (MoA), while CA is more appropriate for substances with similar MoA. How-ever, IA predictions require a greater deal of information regarding the effects of individual substances (i.e. all parameters of the fitted concentration-response curves); information that is rarely available in a usual regulatory setting. In addition, the predictions of additive mixture toxicity only slightly differ between IA and CA, with CA being mostly (although not necessarily always) providing the more con-servative estimate (Junghans et al. 2006). Besides, it has been argued that most micro-pollutants exert non-specific baseline toxicity and, hence, similar MoA in non-target organisms (Escher et al. 2011) de-spite their dissimilar MoA in target organisms (i.e., in patients in the case of human pharmaceuticals). While this last argument would still need experimental confirmation, the present study mainly applied CA as established default concept in mixture predictions.
A central paradigm of all mixture toxicity models is that they can exclusively predict the toxicity of a clearly defined mixture. This implies that all mixture components, including their concentrations and individual effects, must be known or estimated. The presence of relevant, but due to lack-of-infor-mation not considered mixture components is the most straightforward explanation for deviations be-tween predicted and actually observed mixture toxicity. The definition of the mixture components and their individual concentrations in the mixture is therefore a crucial step in the exposure assessment part for a mixture. Once this definition is achieved, the summed exposure estimates of all mixture com-ponents represent then simply the exposure estimate for the mixture. For artificial mixtures such as those tested in laboratory mixture tests, the definition of mixture exposure concentrations is a simple matter of applying appropriate analytical methods. For environmental mixtures of a priory unknown composition, this step is not only crucial but highly demanding, particularly if the composition of a mixture shall be predicted in the context of a prospective ERA. Regardless of the complexity and ap-proach for exposure and effects assessment, the final step of an ERA remains fairly the same in relating the derived exposure and effect estimates in some way to each other.
In this context, the present 4-years research project was funded by the German Environment Agency (UBA) with the objective to evaluate and improve concepts for a mixture risk assessment of WWTP

Joint effects of pharmaceuticals and chemicals regulated under REACH
26
effluents by experimental and conceptual means. The approach applied by the present project in-volved the following steps:
► Survey of human pharmaceuticals and substances regulated under REACH that are typically pre-sent in WWTP effluents
► Selection of mixture composition scenarios based on this survey and other considerations for ex-perimental testing
► Experimental testing to investigate the predictability of mixture toxicity and reliability of the pre-diction for realistic mixtures typically present in wastewater effluents. Thereby,
o particularly address the predictability of sub-lethal chronic effects that represent the ERA relevant endpoints, but have been rarely assessed in mixture toxicity studies yet,
o particularly address potentially confounding influence of the wastewater effluent matrix on the predictability of effects, and
o particularly address the predictability of effects of mixtures that vary in their composition over time as it is typical for wastewater effluents.
► Review and discussion of potential concepts to consider mixture toxicity in WWTP effluents by ap-plying these concepts to the experimentally investigated mixtures.

Joint effects of pharmaceuticals and chemicals regulated under REACH
27
2 Selection criteria for test substances and mixtures It was the aim of this project to assess experimental scenarios representing ‘realistic’ environmental mixtures of pharmaceuticals and chemicals that are regulated under REACH. ‘Realistic’ in this context cannot mean to identify and test the typical WWTP effluent, simply because the variation over time and space of effluent compositions is far too large to allow such an approach. Hence, a ‘realistic’ mix-ture means here that all mixture components are (more or less frequently) present in WWTP effluents and that the relative proportions of the components in the tested mixtures take into account the con-centrations reported for each component in WWTP effluents.
The selection process for test substances started therefore with an ‘exposure analysis’ that aimed to produce a (non-exhaustive) list of chemicals present in WWTP effluents and surface waters influenced by such effluents and to identify concentration ranges in which these chemicals typically occur. The next step involved a kind of ‘effect analysis’ that aimed to identify test substances from this initial list that appeared suitable for the aim of the project, relating to their effects. In a last step, the feasibility of obtaining and actually testing the substance in a standard test design was considered. In the following, the criteria and procedure for these three selection steps will be described in more detail. Thereafter, the selection will be discussed separately for human pharmaceuticals and REACH-regulated chemicals (including biocides and other wastewater-associated chemicals).
The selection of test organisms was based on regulatory requirements for human pharmaceuticals (EMA 2006): chronic toxicity tests with one green algae and Daphnia magna, with cyanobacteria re-placing green algae in the case of antibiotics. Chronic fish toxicity tests were beyond the budget (and therefore the scope) of the project. Lemna minor was selected as additional test organism based on its reported high susceptibility for azoles (Richter et al. 2013).
2.1 Relevance of exposure The presence of pharmaceuticals and other chemicals in WWTP effluents and receiving surface waters is taken here as evidence for a potential ecological relevance of these substances. In other words, the selection of tests substances should preferably only include those that had been detected in these com-partments before. Exceptions were possible, e.g. for substances that have not been included in analyti-cal surveys so far or substances with a highly relevant mode of action or with high toxicity. While this selection process based on reported findings of compounds in WWTP effluents aims deriving a ‘realis-tic mixture scenario’, it is import to note that it is at the same time strongly biased towards substances that have been investigated in the past. Hence, substances that have not received much or any atten-tion with regard to their environmental occurrence or their effects so far, will inevitably be overlooked regardless of their potential environmental relevance. This phenomenon has been called the “Matthew effect”, and the problem and consequences have been intensely discussed recently (Daughton 2014). Therefore, the finally selected mixture scenarios can be assumed ‘realistic’ in the meaning that they may actually occur in WWTP effluents (along with many other possible scenarios), but they cannot be assumed as being truly representative for WWTP effluents.
In order to derive a list of substances that have frequently been detected in the effluents of WWTP and receiving surface waters in Europe, an extensive literature review was conducted. Information was separately collected for pharmaceuticals, chemicals that are regulated under REACH, pesticides, and biocides. Several secondary literature sources, i.e. compilations of other authors, were used. In addi-tion, primary literature, unpublished results from on-going research projects (including monitoring programmes, e.g. of environmental state authorities), and information obtained from the UBA were included. Thereby, substances that have been targeted only recently in monitoring projects were in-corporated in the selection process. The used sources for the selection of candidate compounds had been agreed upon during the project kick-off meeting and are listed in Table 1.

Joint effects of pharmaceuticals and chemicals regulated under REACH
28
Table 1: List of sources used to compile information on the presence of potential test substances in WWTP effluents and surface waters
Running number
Source
1 Ahting M., Berkner S., Blondzik K., Ebert I., Hein A., Jäger S., Matezki S., Pickl C. and Wogram J. (2012) Informationen zu Stoffen mit wahrscheinlicher ökotoxikologischer Ge-wässerrelevanz. Umweltbundesamt, Stand April 2012
2 Reddersen K. (2004) Das Verhalten von Arzneimittelrückständen im Wasserkreislauf Ber-lins. Dissertation TU Berlin
3 Adam A. M. (2010) Vorkommen und Bewertung von Pharmakarückständen im Berliner Ge-wässerkreislauf. Dissertation TU Berlin
4 Prasse C., Schlüssener M., Schulz R. and Ternes T. (2010) Antiviral Drugs in Wastewater and Surface Waters: A New Pharmaceutical Class of Environmental Relevance? Environ. Sci. Technol. 44, 1728–1735
5 Keller M., Bänsch-Baltruschat B., Claus E., Coors A., Hommen U. and Rüdel H. (2012) Nut-zung des Umweltmonitorings für das Risikomanagement bedenklicher Stoffe unter beson-derer Berücksichtigung von PBT-Stoffen (NUMoRi). Interim Report on behalf of the Fed-eral Environment Agency (UBA). FKZ 3710 63 420
6 ARW (2011) Results of a monitoring program of the Association of Waterworks along river Rhine 2007 – 2011
7 AWBR (2011) Results of a monitoring program of the Association of the Waterworks in the Lake Constance – Rhine region 2007 – 2011
8 LUBW (2012) Unpublished results of an on-going monitoring program in Baden-Württem-berg
9 Unpublished data from research projects within “Risk Management of Emerging Com-pounds and Pathogens in the Water Cycle (RiSKWa)" a research framework funded by the Federal Ministry of Education and Research (BMBF) from 2011-2014
10 Bergmann A., Fohrmann R. and Weber F. A. (2010) Zusammenstellung von Monitoringda-ten zu Umweltkonzentrationen von Arzneimitteln. Report on behalf of the Federal Envi-ronment Agency (UBA). FKZ 360 14 013
11 Nordic Council of Ministers (2012) Chemical cocktails – a serious matter of concern. Co-penhagen, Denmark. PPCP monitoring in the Nordic Countries – Status Report. TemaNord 519.
12 Fick J., Lindberg R. H., Kaj L. and Brorström-Lundén E. (2011) Results from the Swedish Na-tional Screening Programme 2010. (Subreport 3. Pharmaceuticals) Swedish Environmental Research Institute
13 Internal list of substances identified as relevant for the aquatic environment provided by the Umweltbundesamt (UBA). Stand 2012
14 GWRC (2008) Development of an international priority list of pharmaceuticals relevant for the water cycle. Report of the Global Water Research Coalition. London

Joint effects of pharmaceuticals and chemicals regulated under REACH
29
In all cases, information was directly taken from the literature source. Only for the selected test sub-stances, this information was in a second step verified by cross-checking with the primary literature. In a further step, additional literature sources were screened in order to collect further information on the concentration levels of the target compounds in WWTP effluents in Europe and North America.
From all these data sources information was collected on the compounds that have been analysed, on the occurrence of individual compounds as well as on the measured concentrations in WWTP effluents and rivers. For evaluation of the data, the detailed information was compiled in comprehensive tables to enable a rapid screening of the compound list and to facilitate the selection of priority compounds. At this stage, no information on individual treatment plants or rivers or even sampling sites was col-lected.
During data processing, the compounds were divided into three groups according to their reported concentrations for WWTP effluents or surface waters:
+++: > 1 µg/l; ++: 0.1 – 1 µg/l; +: < 0.1 µg/l
If several concentrations were reported in different sources, the highest concentration was used for classification. Beside the sources of information that report concentrations from monitoring programs, compounds from an internal list of the UBA were included as well as pharmaceuticals classified as rel-evant for the water cycle by the Global Water Research Coalition (GWRC), an international association of water research institutes (source numbers 13 and 14 in Table 1). Both lists do not include infor-mation about measured concentrations. GWRC developed an international priority list of pharmaceuti-cals that are most likely found in raw waters used for drinking water preparation and that may have significant impacts on human and environmental health. For this, they defined seven relevant criteria, namely regulation, consumption/sales data, physical-chemical properties, human toxicity and ecotoxi-city, occurrence, resistance to treatment, and degradability (persistence). Based on the data from the GWRC, the compounds were additionally grouped into three priority classes, which are defined as fol-lowed:
► Class I: High priority pharmaceuticals (pharmaceuticals that are mentioned in five or more of the base documents cited, and that fulfil more than four of the seven criteria)
► Class II: Priority pharmaceuticals (pharmaceuticals that are mentioned in more than two of the base documents cited, and that fulfil more than two criteria)
► Class III: Lower priority pharmaceuticals (pharmaceuticals that are mentioned in two documents of the base documents cited, and fulfil two or more criteria)
The evaluation of the sources listed in Table 1 resulted in a considerable number of substances (>200 pharmaceuticals, and >300 REACH chemicals and pesticides), which was deemed sufficient as basis for the selection of exposure-relevant test substances in the present project. Consequently, no other sources were searched in addition at this stage. Therefore, the list of substances detected in the efflu-ents of WWTP and surface waters presented in this report may by no means be considered as com-plete.
2.2 Relevance of effects To further narrow down the list of potential test substances, several criteria relating to their effects were considered:
Joint effects of pharmaceuticals and chemicals regulated under REACH
30
► The present project relates to different regulatory contexts. Therefore, the test substances in the mixtures should also represent different regulatory groups. Of particular interest are here combi-nations of substances from different regulatory groups that have the same mode of action (MoA). Examples may be found among fungicides that are used as pharmaceuticals as well as biocides, in personal care and consumer products, and as plant protection products.
► Substances with different as well as (presumed) similar MoA should be included in the mixtures. This allows assessing differences in the outcome of a risk assessment based on different mixture toxicity concepts.
► Since mixture toxicity concepts cover additive effects, more-than-additive (i.e., synergistic) effects represent the worst-case scenario. Therefore, available indications for synergistic interactions were considered in the selection process to increase the likelihood of including worst-case scena-rio mixtures in the experimental testing. Such indications may be evidenced from published litera-ture as well as side effects, drug-drug interactions and contra-indications reported in pharmaceuti-cal product leaflets. Evidence for antagonistic interaction is seen as negative trigger for selecting substance combinations, since antagonistic interactions would rather jeopardize investigating po-tential worst-case scenarios.
► Some MoA appear of particular relevance with regard to potential synergistic interactions such as inhibition of enzymes that are involved in the degradation of other chemicals. The classical exam-ple of such a synergistic interaction related to pharmacokinetic is piperonylbutoxide, an effective inhibitor of cytochrome P450 enzymes (Varsano et al. 1992). Drug-drug interactions relating to CYP3A4, the enzyme responsible for metabolism of most xenobiotics in humans, are of the greatest concern in pharmacology (Zhou et al. 2007). Cytochrome P450 enzymes are highly conserved and drug-drug interactions observed in pharmacotherapy may therefore point at potential interactions in other organisms, particularly Daphnia and fish. Therefore, including known inhibitors of cyto-chrome P450 enzymes is seen here as a promising strategy to cover at least one (among three) theoretical mechanisms of interaction in mixture toxicity, namely environmental availability, toxi-cokinetic and toxicodynamic (Spurgeon et al. 2010).
► The selected test substances should be of relevance with regard to ecotoxicological effects, i.e. they should exhibit toxicity towards the selected test organisms. Thereby, exposure-relevant sub-stances with reported low ecotoxicity were excluded. Included were, on the other hand, substances that have been reported to be toxic towards at least some of the here selected test organisms and substances for which no ecotoxicological information is available yet.
► Substances with a highly specific MoA were not further considered in the selection process if ef-fects cannot be assessed with the selected endpoints in the present study. Such substances are for example pharmaceuticals that influence specifically the hormone system of vertebrates. Therefore, sex hormones and endocrine therapeutics as well as substances labelled as (potential) endocrine disruptors under REACH were excluded since fish tests with the relevant endpoints were beyond the scope of the present study.
Next to estrogenic active substances, diclofenac is the only pharmaceutical listed in the proposed amendment to the Water Framework Directive (WFD). The proposed AA-EQS (annual average envi-ronmental quality standard) for diclofenac in freshwater is 0.1 µg/l (EC 2011c). This value is derived from a NOEC of 1.0 µg/l observed for histopathological effects (e.g. kidney) in chronically exposed fish. This endpoint is not covered in the present study since no chronic fish tests were planned. Relevant effect data of diclofenac for the test organisms and endpoints covered in the present study are consid-erably higher than this NOEC (no observed effect concentration). Hence, the present study would not allow evaluating the protectiveness of the AA-EQS for diclofenac in view of mixture toxicity issues and diclofenac is therefore not included as test substance.

Joint effects of pharmaceuticals and chemicals regulated under REACH
31
2.3 Practicability Given the limitations of the project, it was a basic precondition that the selected ecotoxicological tests could be conducted with the test substances based on standard test designs. This means that compli-cated-to-test substances should be avoided, i.e. substances with high volatility, high adsorption to test vessels and low stability. Fortunately, such substances are not very likely to occur in the aqueous phase of WWTP effluents anyway. Furthermore, analytical methods should be available or easy to de-velop to allow accompanying chemical analysis. Finally, the test substances should be available on the market with a suitable purity and at reasonable prices (taking into account the amount of substance needed for the tests).
2.4 Pharmaceuticals and other chemicals detected in the aquatic environment Since the selection of test substances as first step in the project was conducted in 2012, only literature published until this year was taken into account and will be cited in the following. The finally selected test compounds and their concentration ranges in WWTP effluents were updated in 2016 (see Chapter 3.6.2) in order to derive estimates used in the risk assessment (Chapter 8).
The literature survey resulted in a list of 236 active pharmaceutical ingredients (API) and 19 API-me-tabolites that had been reported at least once as present in WWTP effluents and/or surface waters. Two more API and one metabolite were listed by GWRC, but not reported as detected in the evaluated sources. The pharmaceuticals were categorized according to the Anatomical Therapeutic Chemical (ATC) classification system at the second level, i.e., the level of therapeutic subgroups. ATC classifica-tions were extracted from the relevant webpage (WHO 2012) and the German ATC Index (DIMDI 2012). Excluding metabolites and all pharmaceuticals without ATC code (e.g., a number of veterinary pharmaceuticals) retrieved 222 human pharmaceuticals for the next steps of selecting potential test substances. The covered ATC groups and number of pharmaceuticals per group are summarized in Ta-ble 2.
It is important to note that the tabulation of frequency of detected pharmaceuticals from various ATC groups does not necessarily correlate with the actual frequency or concentration levels of pharmaceu-ticals from these groups in the environment. This is because a substantial bias in the detection fre-quency can be assumed: monitoring programmes do not select their analytes randomly among all mar-keted pharmaceuticals, but rather take into account analytical limitations such as availability of meth-ods and standards, suspected (eco)toxicological relevance, or other relevant information (e.g. pre-scription volumes). Because of this presumed bias, the selection of test substances did not aim to achieve mirroring the frequency of the represented ATC groups.
A large number of other chemicals were retrieved in the exposure analysis that were either detected in WWTP effluents and surface waters or listed as of potential concern for other reasons. However, many REACH-regulated chemicals appear to be of little concern when their environmental concentration is set into relation to their acute aquatic toxicity (Schäfer et al. 2011). This is partly due to the fact that chemicals addressed in monitoring programmes (e.g. priority substances defined in the WFD) are of-ten rather lipophilic. They are therefore predominantly bound to suspended solids while their concen-tration in the water phase is relatively low.
Test substances among the REACH-regulated chemicals were selected here on the one hand among the fungicides (for the reasons discussed above) and on the other hand among those that are reasonably water-soluble, detected at rather high concentrations in the environment, or prioritized by competent authorities (for other reasons than endocrine disruption potential).

Joint effects of pharmaceuticals and chemicals regulated under REACH
32
Table 2: ATC groups with the number of pharmaceuticals per group that were reported as pre-sent in WWTP effluents and surface water
ATC code ATC Therapeutic group Number of pharmaceuti-cals detected per group
J01 Antibacterials 51
N05 Psycholeptics 18
N06 Psychoanaleptics 16
N02 Analgesics 12
C07 Beta blockers 10
M10 Antiinflammatory and antirheumatic agents 10
V08 Contrast media 9
R06 Antihistamines 9
J05 Antivirals 7
C09 Renin-angiotensin system agents 8
N03 Antiepileptics 7
G03 Sex hormones 7
C10 Lipid modifying agents 6
C03 Diuretics 5
C08 Calcium channel blockers 4
R05 Antitussive agents 4
R03 Obstructive airway disease drugs 4
A10 Antidiabetics 4
G04 Urological drugs 3
C01 Antiarrhythmics 3
A02 Acid related disorder drugs 3
N04 Anti-Parkinson drugs 3
J02 Antimycotics 2
L02 Endocrine therapeutics 2
L01 Antineoplastic agents 2
M03 Muscle relaxants 2

Joint effects of pharmaceuticals and chemicals regulated under REACH
33
D01 Antifungals for dermatological use 2
A07 Antidiarrheals 1
S01 Antiinfectives 1
J04 Antimycobacterials 1
C04 Peripheral vasodilators 1
A03 Functional gastrointestinal disorders drugs 1
N07 Nervous system drugs 1
V03 Antidotes 1
R01 Sympathomimetic drugs 1
G01 Gynecological antiinfectives 1

Joint effects of pharmaceuticals and chemicals regulated under REACH
34
3 Selected test substances Given the high number of different pharmaceuticals and other chemicals detected in WWTP effluents, the selection of test substances for the testing of mixtures cannot take into account all potentially available information on reported or expected effects and interactions. Therefore, the selection pro-cess did not exclude any substances based on available information, but rather aimed to identify sub-stances that do fulfil the criteria mentioned above. In addition, substances prioritized by UBA were taken into account. Key features of the selected test substances and reasons for their selection will be described in the following.
In total, 20 test substances were selected: 15 human pharmaceuticals (among them 8 antibacterials), 4 substances regulated under REACH and 1 biocide/plant protection product.
Following the initial selection of target compounds, a more detailed literature search was conducted. For the pre-selected compounds, the scientific literature of the last decade was screened for data on their occurrence in WWTP effluents. Whenever available, the literature search focussed on European municipal WWTP. Data that were implausible when compared to findings published in other papers as well as concentrations that were influenced by special local situations (e.g. discharges from manufac-turers) were not taken into account. The resulting findings are included in the following tables. When-ever possible, the primary literature is cited.
3.1 Fungicides Fungicides, particularly from the chemical group of azoles, are represented among biocides, plant pro-tection products, cosmetics, and pharmaceuticals. As mentioned before, they are therefore a class of chemicals well suited to select test substances with the same mode of action from different regulatory frameworks. Key features of the three azole fungicides selected as test substances are summarized in Table 3. All three azole derivatives inhibit ergosterol biosynthesis in fungi by binding to C-14 deme-thylase (De-Methylase Inhibitor, DMI). In addition, they are all inhibitors of cytochrome P450 en-zymes. The three fungicides were tested in Daphnia, green algae, and Lemna.
Among the pharmaceuticals listed in Table 2 were four fungicides with two of them belonging to the therapeutic group of antimycotics (fluconazole and miconazole) and the other two to the antifungals for dermatological use (clotrimazole and nystatin). There were three azole fungicides identified that have been detected in WWTP effluents. For all three fungicides, little to no data is available regarding ecotoxicity. For fluconazole, absence of acute toxicity has been shown for fish and a freshwater crusta-cean (Kim et al. 2009). However, algae are expected to be much more sensitive given the ecotoxicity profile of other azoles (Richter et al. 2013). For clotrimazole combined with four other differently act-ing substances, about concentration-additive behaviour has been reported with regard to effects on marine periphyton (Backhaus et al. 2011). Both miconazole and clotrimazole are rather lipophilic as indicated by the high log Kow, resulting in very limited water solubility. Their measured concentra-tions in WWTP effluents are below 0.1 µg/l (Fick et al. 2011), which may be linked to their lipophilic behaviour causing adsorption to organic material such as sewage sludge. In contrast to these two azole derivatives, the triazole fluconazole is less lipophilic and better water-soluble. Measured WWTP efflu-ent concentrations of fluconazole are also higher with up to 1.1 µg/l (Fick et al. 2011). Among these three azole pharmaceuticals fluconazole is the strongest inhibitor of cytochrome P450 enzymes and the one for which most drug-drug interactions are reported (DrugBank 2012). Because of these fea-tures, fluconazole was selected as test substance representing azoles among the pharmaceuticals.

Joint effects of pharmaceuticals and chemicals regulated under REACH
35
Table 3: Features of the DMI-fungicides fluconazole, climbazole and propiconazole
Fluconazole Climbazole Propiconazole
Molecular structure
ATC sub-group
triazole derivative imidazole triazole derivative
Usage systemic and dermatological anti-fungal
conservative and anti-dandruff agent
plant protection product and wood preservative
Mode of ac-tion
interacts with C14-demethylase and thereby inhibits ergosterol bio-synthesis; may interact with mem-brane phospholipids, inhibit purine uptake, and impair triglyceride and/or phospholipid biosynthesis
interacts with C14-demethylase and thereby inhibits er-gosterol biosynthesis
interacts with C14-deme-thylase and thereby in-hibits ergosterol biosyn-thesis
Known inter-actions
strong inhibitor of various cyto-chrome P450 enzymes; inhibitor of multidrug resistance protein 1
inhibitor of cyto-chrome P450 en-zymes
inhibitor of cytochrome P450 enzymes
Reported side effects
rash, headache, dizziness, gastroin-testinal problems, liver damage, and cardiac problems
not applicable not applicable
CAS 86386-73-4 38083-17-9 60207-90-1
IUPAC name 2-(2,4-difluoro-phenyl)-1,3-bis(1H-1,2,4-triazol-1-yl)-propan-2-ol
(RS)-1-(4-chloro-phe-noxy)-1-imid-azol-1-yl-3,3-di-methyl-butan-2-one
1-[[2-(2,4-dichloro-phenyl)-4-propyl-1,3-di-oxolan-2-yl]methyl]-1,2,4-triazole
Water solu-bility
1 mg/l * 50 mg/l 30 mg/l
Log Kow 0.4 3.33 3.72
Reported concentra-tions in WWTP efflu-ents
0.072 to 1.1 μg/l 1; 0.028 to 0.083 μg/l 2; 0.10 to 0.14 μg/l 3
0.31 to 0.44 μg/l 4 0.006 to 0.040 μg/l 2; 0.010 to 0.014 μg/l 4; 0.01 μg/l 5; 0.016 to 0.058 μg/l 6
Information obtained from DrugBank (2012) unless otherwise noted; n.a.: no data available; 1: Fick et al. 2011; 2: Kahle et al. 2008; 3: Lindberg et al. 2010; 4: Wick et al. 2010; 5: Wick et al. unpubl.; 6: Van de Steene et al. 2010; * much higher water solubility observed in practice (U. Kunkel, personal communication)

Joint effects of pharmaceuticals and chemicals regulated under REACH
36
Climbazole is an imidazole DMI-fungicide regulated under REACH. As anti-dandruff ingredient of shampoos and as preservative in cosmetics, it is expected to be released to the aquatic environment via wastewater. Indeed, it has been detected in WWTP effluents in Germany at concentrations around 0.4 µg/l and up to 0.53 µg/l in surface waters (Wick et al. 2010), a finding that could be reproduced for other WWTP effluents (Wick et al. unpublished data). Within a research project at ECT, climbazole has been tested for its ecotoxicity extensively. Therefore, effect data produced according to standard guidelines are available with regard to fish embryo toxicity (EC50 48 h of 8.2 mg/l), acute Daphnia tox-icity (EC50 48 h of 16 mg/l), and growth inhibition of green algae (EbC50 72 h of 0.214 mg/l), but not with regard to chronic toxicity to Daphnia and growth inhibition of cyanobacteria (Richter et al. 2013).
Concentration additive behaviour between the DMI-fungicide propiconazole and the fungicide IPBC as well as the insecticide fenoxycarb has been demonstrated for fish embryos, green algae, and Daph-nia reproduction and survival (Coors et al. 2012a,b). Due to these projects on behalf of UBA, relevant single-substance toxicity data for propiconazole according to standard guidelines are available. In a meta-analysis of formulated plant protection products with more than one active substance Coors & Frische (2011) found that for the majority of products the aquatic toxicity of the products can be pre-dicted by CA based on the toxicity of the active substances. That finding was also true for combinations of azoles with other pesticide with only one exception, the combination of DMI-fungicides with fungi-cides that inhibit a different enzyme in the ergosterol biosynthesis (fungicides from the latter group are not included in the present study). Propiconazole is used as plant protection product and as bio-cide, namely as wood preservative. Due to the latter usage, release into the environment through WWTP effluents cannot be excluded and has been confirmed for WWTP effluents (about 0.01 µg/l, Wick et al. 2010 and unpublished data). This is in agreement with other findings (Kahle et al. 2008, van de Steene et al. 2010) except one extremely high WWTP effluent concentration reported as 3.6 µg/l (van de Steene et al. 2010). According to the authors this can be explained by some pharmaceutical and industrial companies located in the catchment of the WWTP. Receiving wastewaters from inten-sive industrial usage (e.g. wood industry) might be the explanation for the high levels of propicona-zole. Thus this extremely high value cannot be regarded as representative for the occurrence of pro-piconazole in municipal WWTPs and was therefore not included in Table 3 and subsequent calcula-tions.
3.2 Antibacterials The therapeutic group of antibacterials clearly dominated the list of human pharmaceuticals detected in WWTP effluents and surface waters. However, it cannot be decided if this is the case because they occur indeed very frequently or just because they are more frequently searched for. Among the listed antibacterials, the following were prioritized by GWRC (2008), with the chemical subgroups as 4th level of ATC classification given in brackets: amoxicillin (extended spectrum penicillin), cefalexin (first generation cephalosporin), ciprofloxacin (fluoroquinolone), clarithromycin (macrolide), doxycycline (tetracycline), erythromycin (macrolide), lincomycin (lincosamide), ofloxacin (fluoroquinolone), sulfa-methoxazole (sulfonamide), and trimethoprim (trimethoprim). Two of them (clarithromycin and sul-famethoxazole) are also prioritized by UBA (Ahting et al. 2012).
Based on the EMA guideline, cyanobacteria instead of green algae were tested with antibiotics in the present project. In total, eight antibacterials were selected as test substances: sulfamethoxazole, trime-thoprim, clarithromycin, erythromycin, amoxicillin, clindamycin, ciprofloxacin, and linezolid.
Sulfamethoxazole inhibits one enzyme in the tetrahydrofolate synthesis, while trimethoprim inhib-its a different enzyme in a later step of the same biochemical pathway. Key features of these two se-lected test substances are summarized in Table 4.

Joint effects of pharmaceuticals and chemicals regulated under REACH
37
Table 4: Features of the antibacterials sulfamethoxazole and trimethoprim
Sulfamethoxazole Trimethoprim
Molecular structure
ATC subgroup sulfonamide trimethoprim
Target organisms gram negative and gram positive bacte-ria
gram negative and gram positive bacte-ria
Mode of action inhibits the enzymatic conversion of pteridine and p-aminobenzoic acid (PABA) to dihydropteroic acid, an inter-mediate of tetrahydrofolic acid (THF), by competing with PABA for binding to dihydrofolate synthetase
inhibits the reduction of dihydrofolic acid (DHF) to tetrahydrofolic acid (THF) by competitive binding to dihydrofolate reductase; THF is an essential precursor in the synthesis of bacterial DNA syn-thesis
Known interactions inhibitor of cytochrome P450 enzymes, which may decrease metabolism of other drugs
inhibitor and substrate of various cyto-chrome P450 enzymes; inhibitor of multidrug resistance protein 1 (efflux pump)
Reported side ef-fects
nausea, vomiting, diarrhea, hypersensi-tivity reactions, and hematologic ef-fects
not available
CAS 723-46-6 738-70-5
IUPAC name 4-amino-N-(5-methylisoxazol-3-yl)ben-zenesulfonamide
5-(3,4,5-tri-methoxybenzyl)-pyrimidine-2,4-diamine
Water solubility 610 mg/l 12,100 mg/l; 300-400 mg/l 6
Log Kow 0.7 1.3
Reported concen-trations in WWTP effluents
> 1 μg/l (+++) 1; average of 0.070 μg/l 2; 0.10 to 0.37 μg/l, average of 0.23 μg/l 3; 0.62 μg/l 4; 0.050 to 0.091 μg/l 5; 0.22 μg/l and 3.2 μg/l 6; < 0.080 to 0.30 μg/l 7
> 1 μg/l (+++) 1; average of 0.093 μg/l 2; average of 0.099 μg/l and maximum of 0.15 μg/l 3; average of 0.34 μg/l 4; 1.1 μg/l 6; 0.083 to 0.27 μg/l 8; 0.22 to 0.32 μg/l 9; 0.070 to 0.31 μg/l and average of 0.29 μg/l 10; 0.046 to 0.32 μg/l 11; 1.0 μg/l 12; average of 0.13 μg/l and maxi-mum of 1.3 μg/l 13; 0.61 to 1.9 μg/l 14
Information obtained from DrugBank (2012) unless otherwise noted; 1: Bergmann et al. 2010; 2: Khan et al. 2012; 3: Rosal et al. 2010b; 4: Ternes et al. 2007; 5: Clara et al. 2005; 6: Senta et al. 2008; 7: Lindberg et al. 2005; 8: Hilton and Thomas 2003; 9: Roberts and Thomas 2006; 10: Gros et al. 2006; 11: Castiglioni et al. 2005; 12: Kasprzyk-Hordern et al. 2008; 13: Ashton et al. 2004; 14: Lindberg et al. 2006

Joint effects of pharmaceuticals and chemicals regulated under REACH
38
Toxicity to cyanobacteria is reported with an EC50 of 26.8 µg/l for sulfamethoxazole (Ferrari et al. 2004) and an EC50 between 11 and > 200 mg/l for trimethoprim (Ando et al. 2007, Halling-Sorensen et al. 2000). For sulfamethoxazole, the reported toxicity toward green algae is lower than toward cyano-bacteria with EC50 values between 146 µg/l and 1900 µg/l (Eguchi et al. 2004; Ferrari et al. 2004, Isi-dori et al. 2005, Yang et al. 2008), while the toxicity of trimethoprim is about similar for green algae with EC50 values between 40 mg/l and 130 mg/l (Holten-Lützhoft et al. 1999, Halling-Sorensen et al. 2000, Eguchi et al. 2004, Ando et al. 2007, Yang et al. 2008). In the case of trimethoprim, the endpoint for chronic toxicity toward Daphnia magna (NOEC reproduction of 6 mg/l, Park & Choi 2008) is more sensitive than some for algal toxicity.
A lot of data are available on the occurrence of sulfamethoxazole and trimethoprim in WWTP effluents. Concentrations range from 0.05 µg/l to 3.2 µg/l for sulfamethoxazole and from 0.04 µg/l to 1.3 µg/l for trimethoprim (Table 4). Particularly for sulfamethoxazole the range of reported effluent concentra-tions is considerably large, spanning three orders of magnitude, which is explained in the respective publications as influence of temporal variation and specific consumption patterns. However, this ex-planation is not fully convincing as it would hold true for other pharmaceuticals as well.
There are a number of combination products registered in Germany containing both antibacterials (e.g. “Cotrimaxol AL”, “Eusaprim forte”, and “Cotrim-Sandoz”) according to the webpage PharmNet.Bund (2012). The combination of sulfamethoxazole and trimethoprim exhibited synergistic effects in laboratory tests that were not confirmed in clinical studies, which was likely due to different pharmacokinetics of the two substances in humans (Howe & Spencer 1996). However, susceptible eco-toxicological test organisms may show synergistic effects under combined exposure similar to those observed in pre-clinical tests. Indeed, Eguchi et al. (2004) tested varying concentrations of sulfameth-oxazole in combination with a fixed concentration of trimethoprim in green algae and reported syner-gistic interaction. A recalculation of the provided test results (Eguchi et al. 2004) based on CA derived, however, a predicted EC50 for the mixture of 51.27 mg/l that exceeded only by factor 2 the nominal ob-served EC50 of 25.78 mg/l. Yang et al. (2008) tested an equipotent combination of trimethoprim and sulfamethoxazole also in green algae and reported a synergistic interaction with a sum of toxic units of 0.41 for the mixture (equals 1/0.41=2.4-fold exceeded toxicity compared to CA prediction). It remains open and highly interesting if synergistic effects are to be detected in cyanobacteria, i.e., organisms that are more susceptible to the mode of action of these two substances. Both antibacterials are inhibi-tors (and substrates) of cytochrome P450 enzymes. As inhibitors, they may decrease the metabolism of other drugs. Particularly trimethoprim is a substrate of CYP2C9, and is reported to show reduced metabolisation in combination with strong CYP2C9 inhibitors, among them several azoles (DrugBank 2012).
Clarithromycin was considered as environmentally relevant by UBA because of its ecotoxicity, detec-tions in monitoring programmes, and increasing consumption volume (Ahting et al. 2012). Erythromy-cin is another macrolide with the same mode of action as clarithromycin (Poehlsgaard & Douthwaite 2005), and is also frequently detected in effluents and surface waters. Key features of these two se-lected test substances are summarized in Table 5. Reported WWTP effluent concentrations range from few ng/l up to more than 10 µg/l for clarithromycin, while for erythromycin a maximum concentration of 1.8 µg/l is found in literature. However, reported concentrations are most frequently below 1 µg/l.

Joint effects of pharmaceuticals and chemicals regulated under REACH
39
Table 5: Features of the antibacterials clarithromycin and erythromycin
Clarithromycin Erythromycin
Molecular struc-ture
ATC subgroup macrolide macrolide
Target organisms gram negative and gram positive bac-teria; mycobacteria
gram negative and gram positive bacteria; mycobacteria
Mode of action binds to the 50 S subunit of the bacterial ribosome (rRNA) and blocks the binding of tRNA (transfer RNA), thereby inhibiting translocation of peptides and protein synthe-sis
Known drug in-teractions
inhibitor, substrate and inducer of several cytochrome P450 enzymes; in-hibitor of multidrug resistance protein 1 (efflux pump) and solute carrier family 22 member 7
inhibitor and substrate of cytochrome P450 isoenzymes from the CYP3A superfamily; in-hibitor of multidrug resistance protein 1 (ef-flux pump) and solute carrier family 22 member 7 and family member 1A2
Reported side ef-fects
diarrhea, nausea, abnormal taste, dyspepsia, abdominal discomfort, and hepatic dysfunctions
gastrointestinal disturbances (diarrhea, nau-sea, abdominal pain, and vomiting)
CAS 81103-11-9 114-07-8
IUPAC name (3R,4S,5S,6R,7R,9R,11S,12R,13S,14S)-6-{[(2S,3R,4S,6R)-4-(dimethylamino) 3-hydroxy-6-methyloxan-2-yl]-oxy}-14-ethyl-12,13-dihydroxy-4-{[(2R,4S,5S,6S)-5-hydroxy-4-methoxy-4,6-di-methyloxan-2-yl]-oxy}-7-meth-oxy-3,5,7,9,11,13-hexa-methyl-1-oxacyclo-tetradecane-2,10-dione
(3R,4S,5S,6R,7R,9R,11R,12R,13S,14R)-6-{[(2S,3R,4S,6R)-4-dimethylamino)-3-hy-droxy-6-methyloxan-2-yl]oxy}-14-ethyl-7,12,13-tri-hydroxy-4-{[(2R,4R,5S,6S)-5-hy-droxy-4-methoxy-4,6-di-methyloxan-2-yl]-oxy}-3,5,7,9,11,13-hexamethyl-1-oxacyclo-tetradecane-2,10-dione
Water solubility 0.33 mg/l 1.44 mg/l
Log Kow 3.2 3.1
Reported con-centrations in WWTP effluents
> 1 μg/l (+++) 1; average of 0.01 μg/l 2; average of 0.21 μg/l 3; 0.008 to 0.073 μg/l 4; 0.1 and 1.0 μg/l 5; maximum of 14.6 μg/l 6
> 1 μg/l (+++) 1; average of 0.10 μg/l 2; aver-age of 0.62 μg/l 3; 0.009 to 0.35 μg/l 4; 0.13 to 0.18 μg/l 7; 0.15 to 0.29 μg/l 8; average of 0.33 μg/l and maximum of 0.79 μg/l 9; aver-age of 0.11 μg/l and maximum of 1.8 μg/l 10
Information obtained from DrugBank (2012) unless otherwise noted; 1: Bergmann et al. 2010; 2: Khan et al. 2012; 3: Ternes et al. 2007; 4: Castiglioni et al. 2005; 5: Senta et al. 2008; 6: Gäll i et al. 2009; 7: Hilton and Thomas 2003; 8: Roberts and Thomas 2006; 9: Rosal et al. 2010b; 10: Ashton et al. 2004

Joint effects of pharmaceuticals and chemicals regulated under REACH
40
Including these two exposure-relevant macrolides among the selected antibacterials ensures repre-sentation of at least two substances with the same mode of action in a mixture of antibiotics. Both are inhibitors, substrates and partly inducers of cytochrome P450 enzymes. Clarithromycin as a strong inhibitor of CYP3A4 is particularly known for drug-drug interactions with a great number of other pharmaceuticals from different therapeutic groups (DrugBank 2012). Erythromycin is a moderate in-hibitor of CYP3A4, but may decrease the metabolisation of other drugs as it binds highly competitive as a substrate to CYP3A isoenzymes. Similar to clarithromycin, many drug-drug interactions are re-ported for erythromycin (DrugBank 2012). For cyanobacteria, EC50 values for erythromycin range from 23 to 430 µg/l (Ando et al. 2007), while no published data were available for clarithromycin at the start of the present project. For green algae, published EC50 values of 2 µg/l (Isidori et al. 2005) and 46 µg/l (Yang et al. 2008) are available, while the green algae EC50 values for erythromycin range from 20 µg/l to 240 µg/l (Isidori et al. 2005, Munch Christensen et al. 2006, Ando et al. 2007). Chronic toxicity toward D. magna and acute toxicity toward fish is considerably lower with values in the mg/l range (Isidori et al. 2005, Ji et al. 2012).
Table 6: Features of the antibacterial clindamycin
Clindamycin
Molecular structure
ATC subgroup lincosamide
Target organisms anaerobic bacteria and protozoans
Mode of action inhibits bacterial protein synthesis by binding to bacterial 50S ribosomal subunits
Known drug interactions inhibitor and substrate of cytochrome P450 3A4
Reported side effects nausea, diarrhea, pseudomembranous colitis, allergic reactions, hepatox-icity, transient neutropenia and eosinophilia and agranulocytosis
CAS 18323-44-9
IUPAC name methyl 7-chloro-6,7,8-trideoxy-6-{[(4R)-1-methyl-4-propyl-L-prolyl]-amino}-1-thio-L-threo-α-D-galacto-octo-pyranoside
Water solubility 31 mg/l
Log Kow 2.2
Reported concentra-tions in WWTP effluents
0.1 to 1 μg/l (++) 1; 0.015 to 0.033 μg/l 2; maximum of 0.18 μg/l 3
Information obtained from DrugBank (2012) unless otherwise noted; 1: Bergmann et al. 2010; 2: Spongberg and Wit-ter 2008; 3: Gäll i et al. 2009

Joint effects of pharmaceuticals and chemicals regulated under REACH
41
Clindamycin is a lincosamide antibiotic that inhibits the 50S subunit of the bacterial ribosome. The binding sites of lincosamides such as clindamycin and macrolides such as erythromycin and clarithro-mycin at the 50S subunit partly overlap, resulting in co-resistance and competitive binding (Poehlsgaard & Douthwaite 2005). Key features of clindamycin are summarized in Table 6. Only few data on environmental concentrations of clindamycin are available in the literature. Reported Euro-pean WWTP effluent concentrations range from 0.01 µg/l to 0.18 µg/l. No data on the ecotoxicity of clindamycin were found in the literature.
Amoxicillin is a broad-spectrum penicillin that inhibits bacterial cell wall synthesis and thereby rep-resents a different mode of action than macrolides and the lincosamide. It has no serious side effects in patients and appears to be only toxic at very high doses. In addition, it is not known for many drug-drug interactions and therefore not expected to interact synergistically. Key features of amoxicillin are summarized in Table 7. Reported data on the occurrence of amoxicillin in WWTP effluents yield maxi-mum concentrations of up to 0.12 µg/l. Limited stability of amoxicillin due to hydrolysis and enzy-matic cleavage of the penicillin ring system was reported (Kümmerer 2003). Toxicity toward cyano-bacteria is reported with an EC50 of 3.7 µg/l (Holten-Lützhoft et al. 1999), while EC50 values for toxicity to green algae, D. magna and fish are all above 100 mg/l (Holten-Lützhoft et al. 1999, Park & Choi 2008).
Table 7: Features of the antibacterial amoxicillin
Amoxicillin
Molecular structure
ATC subgroup extended spectrum penicillin
Target organisms enteric bacteria and other eubacteria
Mode of action binds to protein inside bacterial cell wall and inhibits last stage of bacte-rial cell wall synthesis
Known drug interactions possible antagonist of tetracyclines; inhibitor of solute carrier and oligo-peptide transporters
Reported side effects none reported
CAS 26787-78-0
IUPAC name (2S,5R,6R)-6-{[(2R)-2-amino-2-(4-hydroxyphenyl)-acetyl]amino}-3,3-di-methyl-7-oxo-4-thia-1-azabicyclo[3.2.0]heptane-2-carboxylic acid
Water solubility 958 mg/l
Log Kow 0.75
Reported concentrations in WWTP effluents
0.1 to 1 μg/l (++) 1; 0.015 to 0.12 μg/l 2; 0.12 μg/l 3; < LOQ (LOQ not given) 4
Information obtained from DrugBank (2012) unless otherwise noted; 1: Bergmann et al. 2010; 2: Castiglioni et al. 2005; 3: Adreozzi et al. 2004; 4: Kasprzyk-Hordern et al. 2008

Joint effects of pharmaceuticals and chemicals regulated under REACH
42
Ciprofloxacin represents another mode of action in addition to the previously selected antibacterials. Its key features are summarized in Table 8. Numerous publications report ciprofloxacin occurrence in WWTP effluents and surface waters. Concentrations in WWTP effluents range up to a maximum con-centration of 5.7 µg/l. EC50 values determined for cyanobacteria range from 5 µg/l to 17 µg/l (Halling-Sorensen et al. 2000, Robinson et al. 2005, Ebert et al. 2011), while endpoints for green algae, D. magna, fish, and other organisms were generally above 100 µg/l (Halling-Sorensen et al. 2000, Robin-son et al. 2005, Yang et al. 2008, Ebert et al. 2011, Zaleska-Radziwill et al. 2011, Martins et al. 2012).
Table 8: Features of the antibacterial ciprofloxacin
Ciprofloxacin
Molecular structure
ATC subgroup fluoroquinolone
Target organisms enteric bacteria and other eubacteria
Mode of action inhibits topoisomerases that are required for bacterial DNA replication and repair
Known drug interac-tions
inhibitor of CYP3A isoenzymes; inhibitor of multidrug resistance protein; forms complexes with metal kations
Reported side effects gastrointestinal irritation
CAS 85721-33-1
IUPAC name 1-cyclopropyl-6-fluoro-4-oxo-7-(piperazin-1-yl)-quinoline-3-carboxylic acid
Water solubility 1.1 mg/l; >2000 mg/l 1; soluble in dilute aqueous acid 2
Log Kow 2.3; 1.24 1
Reported concentra-tions in WWTP efflu-ents
>1 μg/l (+++) 3; <0.030 to 0.13 μg/l 4; average of 2.4 μg/l and maximum of 5.7 μg/l 5; 0.027 to 0.51 μg/l 6; <0.006 to 0.06 μg/l 7; 0.065 to 0.12 μg/l 8; 0.038 to 0.054 μg/l 9
Information obtained from DrugBank (2012) unless otherwise noted; 1: Hall ing-Sorensen et al. 2000; 2: Sigma-Aldrich (2013); 3: Bergmann et al. 2010; 4: Vieno et al. 2007; 5: Rosal et al. 2010b; 6: Castiglioni et al. 2005; 7: Lindberg et al. 2005; 8: Urtiaga et al. 2013; 9: Lindberg et al. 2006
Linezolid represents a seventh mode of action among the selected antibacterials. Its key features are summarized in Table 9. In addition to its antibacterial activity, linezolid is also an inhibitor of mono-amine oxidase and thereby interacts with adrenergic and serotonergic drugs such as fluoxetine. No data on its occurrence in the aquatic environment were found in the published literature. The only published toxicity endpoint is a NOEC for D. magna with 24 mg/l (Constantine & Huggett 2010).

Joint effects of pharmaceuticals and chemicals regulated under REACH
43
Table 9: Features of the antibacterial linezolid
Linezolid
Molecular structure
ATC subgroup other antibacterials (first antibiotic of class of oxazolidinone)
Target organisms gram negative and gram positive bacteria
Mode of action linezolid binds to the bacterial 23S ribosomal RNA of the 50S subunit and prevents the formation of a functional 70S initiation complex, which is an essential component of the bacterial translation process
Known drug interactions catalyzes the oxidative deamination of biogenic and xenobiotic amines and has important functions in the metabolism of neuroactive and vas-oactive amines in the central nervous system and peripheral tissues
Reported side effects decreased activity, ataxia, vomiting, and tremors
CAS 165800-03-3
IUPAC name (S)-N-({3-[3-fluoro-4-(morpholin-4-yl)phenyl]-2-oxo-1,3-oxazolidin-5-yl}-methyl)acetamide
Water solubility 3 g/l
Log Kow 0.9
Reported concentrations in WWTP effluents
not available
Information obtained from DrugBank (2012)
3.3 Lipid modifying agents Six lipid modifying agents (four fibrates and two statins) have been reported to occur at relatively high concentrations in the aquatic environment (Table 2). Therefore, one fibrate and one statin were ini-tially selected as test substances; both are prioritized by GWRC and UBA. In addition, fenofibric acid was selected, which is the main active metabolite of fenofibrate (basically a pro-drug), but also author-ized as active pharmacological ingredient on its own. The key features of these three substances are summarized in Table10. Fibrates such as bezafibrate and fenofibric acid can be prescribed in combina-tion with statins such as simvastatin.

Joint effects of pharmaceuticals and chemicals regulated under REACH
44
Table 10: Features of the lipid modifying agents bezafibrate, fenofibric acid, and simvastatin
Bezafibrate Fenofibric acid Simvastatin
Molecular structure
ATC subgroup fibrates fibrates HMG CoA reductase inhibitors
Mode of action decreases cholesterol, triglycerides and low density lipoproteins and increases high den-sity lipoproteins. Agonist of the peroxisome proliferator-activated receptor, which acti-vates transcription of acyl-CoA oxidase and thereby controls the peroxisomal beta-oxi-dation pathway of fatty acids
competitively inhibits 3-hydroxy-3-methylglutaryl coenzyme A reductase, which is the rate-limiting enzyme in cho-lesterol biosynthesis. May also interfere with steroid hormone production. Due to induction of hepatic LDL receptors, increased breakdown of LDL cholesterol
Known interac-tions
inhibitor, substrate and inducer of different cytochrome P450 enzymes
inhibitor, substrate and inducer of cyto-chrome P450 enzymes; inhibitor of mul-tidrug resistance protein 1 and solute carrier family members 1A2 and 1B1
Reported side effects
hepatic toxicity, myo-pathy, and rhabdomy-olysis (severe break down of damaged muscles)
myopathy (muscu-lar diseases), and rhabdomyolysis
diarrhea, indigestion, hepatic toxicity, myopathy, and rhabdomyolysis, and memory loss
CAS 41859-67-0 42017-89-0 79902-63-9
IUPAC name 2-(4-{2-[(4-chloroben-zoyl)-amino]-ethyl}-phenoxy)-2-methylpropanoic acid
2-[4-(4-chloroben-zoyl)phenoxy]-2-methylpropionic acid
(1S,3R,7S,8S,8aR)-8-{2-[(2R,4R)-4-hy-droxy-6-oxo-tetrahydro-2H-pyran-2-yl]ethyl}-3,7-dimethyl-1,2,3,7,8,8a-hexa-hydronaphthalen-1-yl 2,2-dimethyl-bu-tanoate
Water solubility 1.55 mg/l (500 mg/l*) not available 0.03 mg/l
Log Kow 3.98 3.90 4.68
Reported con-centrations in WWTP efflu-ents
>1 μg/l (+++) 1; 0.033 to 0.28 2; 0.13 μg/l 3; 0.0003 to 0.12 μg/l 4; 0.42 μg/l 5; 2.2 (me-dian) and 4.6 μg/l (max) 6; max. 0.84 μg/l 7; 0.69-4.8 μg/l 8
<0.008 to 0.13 with average of 0.078 μg/l 2; average of 0.13 μg/l 3; median of 0.38 and maxi-mum of 1.2 μg/l 6; 0.14 to 0.28 μg/l 9
<0.1 μg/l (+) 1; <LOQ (not given) 3,10; 0.09 μg/l 11
Information obtained from DrugBank (2013) unless otherwise noted; 1: Bergmann et al. 2010; 2: Rosal et al. 2010b; 3: Ternes et al. 2007; 4: Castiglioni et al. 2005; 5: Kasprzyk-Hordern et al. 2008; 6: Ternes 1998; 7: Lindqvist et al. 2005; 8: Clara et al. 2005; 9: Urtiaga et al. 2013; 10: Kosma et al. 2014; 11: Ottmar et al. 2012; * according to MSDS of Cayman Chemical Company

Joint effects of pharmaceuticals and chemicals regulated under REACH
45
Bezafibrate is detected in WWTP effluents with maximum concentrations up to 4.8 µg/l. EC50 values for green algae and acute D. magna toxicity are above 60 mg/l (Rosal et al. 2010a, Boltes et al. 2012), while Isidori et al. (2005) reported a population growth NOEC for C. dubia of 0.023 mg/l using DMSO as solvent.
Fenofibric acid has been found in WWTP effluents with maximum concentrations of up to 1.2 µg/l. No ecotoxicological data are available for fenofibric acid in the literature except an EC50 for acute toxicity in D. magna of 4.9 mg/l (Rosal et al. 2010a).
Simvastatin is by far the statin with the highest prescription volume in Germany (Schwabe & Paffrath 2012). However, it is detected in the aquatic environment at concentrations below 0.1 µg/l, which is due to its poor water solubility and probably to efficient removal in WWTP. Among other inhibitors of cytochrome P450 enzymes, fluconazole and clarithromycin are reported to increase the toxicity of simvastatin, e.g. the risk of myopathy and rhabdomyolysis (DrugBank 2013). With regard to fungi (yeast), additive and synergistic effects have recently been reported for combinations of azoles (among others, clotrimazole) and statins (Cabral et al. 2012). No information on the ecotoxicity of simvastatin is available except an LC50 value of 2.68 mg/l in fish (Key et al. 2009), which is questiona-ble in view of the poor water solubility of simvastatin.
3.4 Other test substances among pharmaceuticals Three more pharmaceuticals were selected that represent a therapeutic group and mode of action not covered so far. Their key features are summarized in Table 11.
The psychoanaleptic fluoxetine has been detected in WWTP effluents at concentrations up to 0.93 µg/l. It is known as strong cytochrome P450 inhibitor with numerous drug-drug interactions. Re-ported synergistic interaction between fluoxetine and clofibric acid in Daphnia magna (Flaherty & Dodson 2005) may be related to this inhibitory activity. There are reliable experimental toxicity data available for the effects of fluoxetine on the growth of green algae and the reproduction of Daphnia magna (Oakes et al. 2010). In human patients, fluoxetine may increase the bradycardic effect of the beta-blocker, metoprolol (DrugBank 2012). Hence, fluoxetine was selected as test substance not only because of its reported environmental concentration but also because of its potentially synergistic in-teraction with other test substances. Most single-substance studies can be spared in the present study because raw data for complete concentration responses are already available from a previous project (Oakes et al. 2010).
Amlodipine is a calcium channel blocker that is often combined with either sartans (Bekki et al. 2010) or with statins (Jukema & van der Hoorn 2004) because of enhanced efficacy. While its mode of action may be relevant for ecotoxicity, there are no data available regarding effects on standard test organ-isms such as Daphnia, fish or algae. There are only few data available on the environmental occurrence of amlodipine with a maximum WWTP effluent concentration of 0.017 µg/l in Malaysia reported in the primary literature.
Metoprolol is a selective beta blocker used to treat cardiovascular diseases, in particular hyperten-sion. It is found at relatively high concentrations in the aquatic environment and prioritized by GWRC and UBA. Monitoring data demonstrate a wide-spread occurrence of metoprolol in the aquatic envi-ronment with WWTP effluent concentrations of up to 1.7 µg/l. Toxicity of metoprolol toward green algae has been reported with an EC50 of 7.9 mg/l (Cleuvers 2005), and toward D. magna with acute EC50 values of 64 mg/l (Huggett et al. 2002) and 438 mg/l (Cleuvers 2005), and with a chronic (9 day) NOEC of 3.1 mg/l (Dzialowski et al. 2006). No lethal effects on fish and fish embryos were observed up to 100 mg/l (Huggett et al. 2002, van den Brandhof & Montforts 2010).

Joint effects of pharmaceuticals and chemicals regulated under REACH
46
Table 11: Features of the pharmaceuticals fluoxetine, amlodipine, and metoprolol selected as test substances
Fluoxetine Amlodipine Metoprolol
Molecular structure
ATC subgroup selective serotonin reuptake inhibitor
calcium channel blocker (dihydropyridine deriva-tive)
selective beta blocker
Mode of ac-tion
blocks the reuptake of ser-otonin at the reuptake pump of the neuronal membrane, enhancing the actions of serotonin
binds to voltage-depend-ent calcium channels in muscles cells and inacti-vates them; may also af-fect calcium flux by other mechanisms
competitively and selec-tively blocks cardiac β-1-adrenergic receptors thereby decreasing heart rate, cardiac output, and blood pressure
Known inter-actions
substrate and strong inhib-itor of various cytochrome P450 enzymes; inhibitor of multidrug resistance pro-tein 1
substrate and inhibitor of various cytochrome P450 enzymes; inhibitor of mul-tidrug resistance protein 1
substrate and inhibitor of various cytochrome P450 enzymes; inhibitor of mul-tidrug resistance protein 1
Reported side effects
nervous system effects and gastrointestinal ef-fects
blood pressure effects (hy-potension) and gastroin-testinal effects
bradycardia, hypotension, bronchospasm, and car-diac failure
CAS 54910-89-3 88150-42-9 37350-58-6
IUPAC name (RS)-N-methyl-3-phenyl-3-[4-(tri-fluoromethyl)-phe-noxy]propan-1-amine
(RS)-3-ethyl-5-methyl-2-[(2-aminoethoxy)methyl]-4-(2-chlorophenyl)-6-me-thyl-1,4-dihydropyridine-3,5-dicarboxylate
(RS)-1-(isopropyl-amino)-3-[4-(2-methoxyethyl)-phenoxy]propan-2-ol
Water solubil-ity
0.05 mg/l 75.3 mg/l 16.9 g/l
Log Kow 4.1 2.2 1.88
Reported con-centrations in WWTP efflu-ents
<1 μg/l (++) 1; 0.085-0.13 μg/l 2; 0.034-0.93 μg/l 3; <0.010 to 0.076 μg/l 4; 0.056-0.060 μg/l 5
0.1 to 1 μg/l (++) 1; maxi-mum of 0.017 μg/l 6
>1 μg/l (+++) 1; up to 0.038 μg/l 3; 0.28-1.6 μg/l 7; 1.7 μg/l 8; 0.91-1.1 μg/l 9; 0.18-0.40 μg/l 10
Information obtained from DrugBank (2012) unless otherwise noted; 1: Bergmann et al. 2010; 2: Unceta et al. 2010; 3: Rosal et al. 2010b; 4: Writer et al. 2013; 5: Hedgespeth et al. 2012; 6: Al-Odaini et al. 2013; 7: Vieno et al. 2007; 8: Ternes et al. 2007; 9: Vieno et al. 2006; 10: Lee et al. 2007

Joint effects of pharmaceuticals and chemicals regulated under REACH
47
3.5 Chemicals regulated under REACH Three REACH-regulated chemicals were selected: a trialkylphosphate, a benzotriazole, and a paraben. Their key features are summarized in Table 12. Ecotoxicological data for the selected chemicals are available under REACH in the ECHA data base and in addition in the literature (e.g. Yamamoto et al. 2011, Seeland et al. 2012). They will be compared to the results obtained in the present study.
Table 12: Features of the REACH-regulated chemicals TCPP, 5-methylbenzotriazole and methylparaben
Tris(2-chloropropyl)-phosphate (TCPP)
5-Methylbenzotriazole Methylparaben
Molecular structure
Chemical subgroup trialkylphosphates benzotriazoles hydroxybenzoate esters
Usage flame retardant corrosion inhibitor, anti-freeze and de-icing agent
fungicidal preservative in personal care prod-ucts
Tonnage band 10,000 - 100,000 t per annum
not included in ECHA da-tabase
1,000 - 10,000 t per an-num
CAS 13674-84-5 136-85-6 99-76-3
IUPAC name tris(2-chloro-1-methyl-ethyl) phosphate
5-methyl-1H-benzotria-zole
methyl 4-hydroxy-ben-zoate
Water solubility 1080 mg/l 9.5 g/l 2.5 g/l
Log Kow 2.68 1.98 1.96
Reported concentra-tions in WWTP efflu-ents
2.3 μg/l 1; 0.34 and 2.6 μg/l 2; 0.23 to 0.61 μg/l 3; 0.68 to 6.6 μg/l 4; me-dian of 0.57 μg/l 5; 0.27 to 1.4 μg/l 6; 0.05 to 0.40 μg/l 7;
>1 μg/l (+++) 8; median of 0.82 and maximum of 1.7 μg/l 9; average of 1.2 μg/l 10; average of 2.0 μg/l 11,12; 0.8 to 1.2 μg/l 13
0.11 μg/l 14; <0.005 μg/l 15; 0.006 to 0.050 μg/l with median of 0.019 μg/l 16; 0.002 μg/l 17; < 0.016 μg/l 18; <0.025 μg/l 19
Information obtained from ECHA database (REACH) unless noted otherwise; 1: Bendz et al. 2005; 2: Rodil et al. 2009; 3: Bester 2005; 4: Meyer and Bester 2004; 5: Rodil et al. 2012 ; 6: Martinez-Carballo et al. 2007; 7: Andresen et al. 2004; 8: Thoma et al. 2011; 9: Glassmeyer et al. 2005; 10: Weiss et al. 2006; 11: Weiss and Reemtsma 2005; 12: Voutsa et al. 2006; 13: Reemtsma et al. 2010; 14: Blanco et al. 2009; 15: Pedrouzo et al. 2009; 16: Gonzalez-Marino et al. 2011; 17: Benijts et al. 2004; 18: Regueiro et al. 2009; 19: Canosa et al. 2006
Recently, a review was published about trialkylphosphates, a group of phosphorus flame retardants that are replacing brominated flame retardants increasingly and that are frequently detected in the environment (van der Veen & de Boer 2012). They exhibit aquatic toxicity in the low to high mg/l range as indicated by the available data summarized in that review. TCPP (tris(2-chloropropyl)phos-
PO
OO
OHC
CH
CHCH3
CH3
CH2CH2
H3C H2C
ClCl
Cl

Joint effects of pharmaceuticals and chemicals regulated under REACH
48
phate) is currently among the trialkylphosphates with the highest usage volume and will probably in-crease as it is supposed to replace TCEP (tris(2-chloroethyl) phosphate). While TCPP is described in one paper as relatively volatile (van der Veen & de Boer 2012), which may pose problems in ecotoxico-logical tests, the WHO report on TCPP (WHO 1998) states in contrast low volatility. Measured WWTP effluent concentrations range from 0.05 µg/l to 6.6 µg/l.
Among the large group of benzotriazoles were three that are detected at concentrations above 1 µg/l (Thoma et al. 2011): 4-methylbenzotriazole (CAS 29878-31-7), 5-methylbenzotriazole (CAS 136-85-6), and 1H-benzotriazole (CAS 95-14-7). From the two isomers, 5-methylbenzotriazole is more toxic than 4-methylbenzotriazole (Pillard et al. 2001) and appears therefore more suitable for the present study. Independently from their relatively low ecotoxicity, benzotriazoles should be included in the present study because of their environmental concentrations. As pointed out by Giger et al. (2006) benzotriazole and tolyltriazole (mixtures of 4-methylbenzotriazole and 5-methylbenzotriazole) “are ubiquitous contaminants in the aquatic environment and [...] belong to the most abundant individual water pollutants.” This is supported by investigations in German surface waters and WWTP effluents (Reemtsma et al. 2010, Thoma et al. 2011). Numerous studies report WWTP effluent concentrations for 5-methylbenzotriazole between 0.8 and 2 µg/l.
Methylparaben is a fungicidal preservative used in cosmetics and other personal care products. It was detected in surface waters in Japan at concentrations below 1 µg/l (Yamamoto et al. 2011). In Eu-ropean surface water maximum concentrations were as well below 1 µg/l with an observed median concentration of 30 ng/l (Gracia-Lor et al. 2012).
3.6 Predicted and measured effluent concentrations The evaluation of the ecotoxicological relevance of the selected test substances is based on a compari-son of experimentally determined effect levels and environmental concentrations. The latter either can be derived theoretically (predicted environmental concentrations, PEC) or can be taken from results of monitoring programmes (measured environmental concentrations, MEC). The disadvantage of using PEC values is that for many compounds not all data for a reliable calculation are available. While pro-duction numbers and rates of human metabolism are quite often (but not always) well known, infor-mation on environmental transformation or elimination during wastewater is often lacking. Quite of-ten, default values are used. Individual MEC values on the other hand might be biased by site-specific local effects and thus might not be representative. Additionally, not all compounds are covered by monitoring programmes, e.g. due to a lacking of appropriate analytical methods. For the present pro-ject, PEC and MEC values were calculated from available information.
3.6.1 Predicted environmental concentrations
PECs are considered confidential for substances regulated under REACH and are therefore not publicly available from their ECHA dossiers. Propiconazole is used as biocide and plant protection product. Therefore, no consolidated summed concentration estimate for WWTP effluent is available. Hence, PECs could only be calculated for the human pharmaceuticals. Their initial PEC for surface water (PECini) was calculated according to the EMEA guideline (EMEA 2006) as
dilutionWasteWFDose
PECinhab
penaiini ∗
∗=
with Doseai being the defined daily dose (DDD) of the active ingredient (WIdO 2016), Fpen being the market penetration factor (default of 0.01), WasteWinhab being the daily discharge volume of waste wa-ter per inhabitant (default of 200 L per inhabitant per day), and dilution being the factor for dilution of WWTP effluent in the receiving surface water (default of 10). Note that as a first estimate the DDD was used here, but not the maximum recommended dose as required by the EMEA guideline (EMEA 2006).

Joint effects of pharmaceuticals and chemicals regulated under REACH
49
Table 13: PEC estimates derived for the human pharmaceuticals
Test substance PECini (µg/l)
Fluconazole 1.0
Sulfamethoxazole 10.00
Trimethoprim 2.00
Clarithromycin 5.00
Erythromycin 10.00
Clindamycin 9.00
Amoxicillin 5.00
Ciprofloxacin 5.00
Linezolid 6.00
Fenofibric acid * 0.88
Fluoxetine 0.10
Amlodipine 0.03
Metoprolol 0.75
* DDD for fenofibrate (the pro-drug of fenofibric acid) used
3.6.2 Measured concentrations in WWTP effluents
For the determination of MEC values, literature published during the last 15 years was screened for monitoring programmes in WWTP effluents covering the selected pharmaceuticals and other chemi-cals. The literature survey focussed on data from European WWTPs, but a few papers from the US and Canada were also included. The results of the literature survey were complemented by internal TZW data on the occurrence of micro-pollutants in WWTP effluents and by data collected during the current study. In total, more than 50 publications were evaluated. In most of them concentrations from indi-vidual measurements were given while few papers only reported concentration ranges or mean val-ues. All individual data were collected in a table and statistically evaluated. As far as possible, data that were influenced by local conditions (e.g. production sites) were excluded. Whenever larger data sets were reported in one study (e.g. data from different WWTPs or data from different samplings at the same WWTP), each measurement was included as individual data point in the statistical evaluation.
As expected, the data base for the individual test substances was rather heterogeneous. While for am-lodipine and linezolid only data from the measurements performed during the current project were available, more than 100 individual measured concentration data were found for sulfamethoxazole.
Table 14 summarizes the results of the chemical analyses of the WWTP effluent samples that were used in the toxicity tests in the present study, while Table 15 gives the compiled information from the statistical evaluation of all data (including those generated in the present study). From the available data set, the number of detects, the median and arithmetic mean concentration as well as the 90% per-centile concentration were calculated. Reported non-detects, i.e. measurement below limit of quantifi-

Joint effects of pharmaceuticals and chemicals regulated under REACH
50
cation (<LOQ), were counted as zero. The tables provide also information on the minimum and maxi-mum concentrations encountered during the survey. For further evaluation, mainly median concentra-tions rather than arithmetic means were used as this value is regarded as a better descriptor of distri-bution in case of <LOQ samples. When using the median, it makes no difference whether < LOQ values are set to zero or ½ LOQ.
A comparison of the data in the two tables yields a good correlation, proving the representativeness of the WWTP effluent samples used for the present study.
Table 14: Measured concentrations (MC) of the 20 test substances in the 7 samples of WWTP ef-fluent that were used for toxicity testing in the present study
Test substance LOQ (µg/l)
Number of detects (n)
Median (mean) MC (µg/l)
Minimum - maxi-mum MC (µg/l)
Fluconazole 0.01 3 (3) 0.044 (0.050) 0.028 - 0.077
Climbazole 0.01 6 (6) 0.121 (0.152) 0.068 - 0.350
Propiconazole 0.01 3 (3) 0.012 (0.014) 0.011 - 0.020
Sulfamethoxazole 0.01 7 (7) 0.440 (0.413) 0.140 - 0.690
Trimethoprim 0.01 1 (1) n.d. 0.087
Clarithromycin 0.01 7 (7) 0.230 (0.233) 0.038 - 0.380
Erythromycin 0.01 2 (2) n.d. 0.077 - 0.170
Clindamycin 0.01 1 (1) n.d. 0.120
Amoxicillin 0.01 1 (1) n.d. 0.013
Ciprofloxacin 0.01 2 (2) n.d. 0.093 - 0.930
Linezolid 0.01 1 (6) 0.0 (0.006) 0 - 0.037
Fenofibric acid 0.01 4 (4) 0.110 (0.143) 0.05 - 0.30
Fluoxetine 0.01 4 (6) 0.024 (0.025) 0 - 0.035
Amlodipine 0.01 4 (4) 0.047 (0.047) 0.017 - 0.077
Metoprolol 0.01 6 (6) 1.235 (1.242) 0.69 - 1.8
TCPP 0.5 2 (2) n.d. 0.74 - 1.70
5-Methylbenzotriazole 0.5 1 (1) n.d. 0.930
Methylparaben 0.1 0 (3) n.d. n.d.
Simvastatine 0.1 0 (1) n.d. n.d.
Bezafibrate 0.05 7 (7) 0.32 0.18 - 0.48
LOQ: l imit of quantification; number of detects: number of samples with analyte >LOQ; n: number of samples ana-lysed with the given LOQ; n.d.: not determined

Joint effects of pharmaceuticals and chemicals regulated under REACH
51
Table 15: Statistical distribution of measured concentrations (MC) of the 20 test substances in WWTP effluents derived from literature data (including the 7 WWTP effluent samples shown in Table 14)
Test substance Number of detects (n)
Median (mean) MC (µg/l)
Minimum - maxi-mum MC (µg/l)
90% upper per-centile MC (µg/l)
Fluconazole 16 (19) 0.044 (0.050) 0-0.14 0.086
Climbazole 9 (9) 0.150 (0.192) 0.066-0.440 0.368
Propiconazole 24 (27) 0.012 (0.022) 0-0.13 0.042
Sulfamethoxazole 92 (125) 0.150 (0.315) 0-6.0 0.696
Trimethoprim 33 (33) 0.230 (0.446) 0.04-1.88 1.00
Clarithromycin 74 (96) 0.10 (0.176) 1-1.0 0.480
Erythromycin 17 (23) 0.064 (0.107) 0-0.39 0.272
Clindamycin 6 (10) 0.019 (0.128) 0-1.0 0.208
Amoxicillin 11 (18) 0.005 (0.021) 0-0.120 0.069
Ciprofloxacin 43 (44) 0.073 (0.299) 0-5.6 0.486
Linezolid 1 (6) 0.0 (0.006) 0-0.037 0.018
Fenofibric acid 4 (4) 0.110 (0.143) 0.05-0.30 0.255
Fluoxetine 50 (59) 0.035 (0.040) 0-0.127 0.078
Amlodipine 4 (4) 0.047 (0.047) 0.017-0.077 0.074
Metoprolol 89 (89) 1.10 (1.30) 0.068-3.50 2.220
TCPP 90 (91) 0.740 (1.189) 0-10.0 2.30
5-Methylbenzotriazole 81 (83) 0.920 (1.076) 0-4.50 1.80
Methylparaben 4 (13) 0.920 (1.076) 0-4.50 1.80
Simvastatine 1 (2) 0.045 (0.045) 0-0.09 0.081
Bezafibrate 90 (96) 0.205 (0.326) 0-4.80 0.645
Information obtained from Kahle et al., 2008; Lindberg et al., 2010; Wick et al., 2010; Van de Steene et al., 2010; Senta et al., 2008; Lindberg et al., 2005; Hilton and Thomas, 2003; Roberts and Thomas, 2006; Castiglioni et al., 2005; Kasprzyk-Hordern et al., 2008; Lindberg et al., 2006; Spongberg and Witter, 2008; Andreozzi et al., 2004; García-López et al., 2010; Unceta et al., 2010; Writer et al. 2013; Hedgespeth et al., 2012; Clara et al., 2005; Ottmar et al., 2012; Lee et al., 2007; Bendz et al., 2005; Rodil et al., 2009; Bester 2005; Weiss et al., 2006; Weiss and Reemtsma, 2005 ; Reemtsma et al., 2010; Blanco et al., 2009; Pedrouzo et al., 2009; Benijts et al., 2004; Canosa et al., 2006; Universität Dortmund 2003; Batt et al., 2006; Carballa et al.; 2004; Chen et al., 2012; Golet et al.,2003; Gonzalez-Marino et al.; 2009; Zorita et al., 2009; TZW (own data); this study.
A comparison of the statistical data in Table 15 with information published in literature also shows good agreement. Table 16 gives a comparison of the statistical data from the present study and the

Joint effects of pharmaceuticals and chemicals regulated under REACH
52
data published by Loos et al. (2013) who investigated the occurrence of organic micro-pollutants in 90 WWTP effluents across Europe, Ternes et al. (2006) who reported mean effluent concentrations for a German WWTP, and Rosal et al. (2010a) who studied 12 WWTP effluents in Spain. A mostly good agreement between the data sets can be seen, proving the representativeness of the statistical data used in this study. A graphical presentation of the comparison of data is also given in Figure 1.
Table 16: Comparison of the statistical data from this study with data from the literature
Test substance This study
Median (mean) MC
(µg/l)
This study
90% per-centile (µg/l)
Loos et al. (2013)
Median (mean) MC
(µg/l)
Loos et al. (2013)
90% per-centile (µg/l)
Ternes et al. (2006)
Mean MC (µg/l)
Rosal et al. (2010a)
Mean MC (µg/l)
Fluconazole 0.044 (0.050)
0.086 0.068 (0.108)
0.287 - -
Sulfamethoxa-zole
0.150 (0.315)
0.696 0.164 (0.280)
0.618 0.62 0.23
Trimethoprim 0.230 (0.446)
1.00 0.178 (0.229)
0.552 0.34 0.10
Clarithromycin 0.10 (0.176) 0.480 - - 0.21 -
Clindamycin 0.019 (0.128)
0.208 0.0459 (0.0704)
0.151 - -
Ciprofloxacin 0.073 (0.299)
0.486 0.0821 (0.963)
0.197 - -
Erythromycin 0.064 (0.107)
0.272 - - 0.62 0.33
Fluoxetine 0.035 (0.040)
0.078 0.0 (0.0021) 0.0078 - 0.22
TCPP 0.740 (1.189)
2.30 0.62 (1.231) 2.10 - -
Bezafibrate 0.205 (0.326)
0.645 0.0035 (0.0254)
0.0819 0.13 0.13
Fenofibric acid 0.110 (0.143)
0.255 - - 0.13 0.078
Metoprolol 1.10 (1.30) 2.22 - - 1.7 0.019

Joint effects of pharmaceuticals and chemicals regulated under REACH
53
Substances with notable differences (about factor 10) in MC are fluoxetine and bezafibrate. Substances with notable differences (about factor 10) in MC are fluoxetine and bezafibrate. Since particularly for fluoxetine, no measured concentrations for European WWTP effluents were available before the study of Loos et al. (2013), the data from North American WWTP were strongly influencing the estimates of the present study.
Figure 1: Visual comparison of median measured concentrations of selected test compounds in WWTP effluents

Joint effects of pharmaceuticals and chemicals regulated under REACH
54
4 Selected mixture scenarios The decision on the composition of the mixtures to be tested was a key aspect of the project. Table 17 provides an overview on the identity and number of components (ranging from 2 up to 10) contained in the four different mixtures that were tested in each taxa group. The relative concentration of each mixture component (i.e. its proportion in the mixture) determines how much each component contrib-utes, in dependence of its individual toxicity, to the overall toxicity. There are in principle two options to decide on the proportions of given components in mixtures: firstly, the composition can be based on concentrations of the test substances – this would be an exposure-based mixture scenario. Secondly, the composition can be based on the toxicological potency of each test substance – this would be an effect-based mixture scenario. Both options were realized within the present project.
Table 17: Overview on the single substances in the tested mixtures
Test organism Lemna Cyanobacteria# Green algae Daphnia
Mixture 1 2 3 4 1 2 3 4 1 2 3 4 1 2 3 4
Fluconazole X X X X X X X X
Climbazole X X X X X X X X X X
Propiconazole X X X X X X X X
Sulfamethoxazole X X S S A
Trimethoprim X X S A
Clarithromycin S,A A A
Erythromycin A A
Clindamycin A A
Amoxicillin A
Ciprofloxacin X A
Linezolid A A X X
Fenofibric acid X X X
Fluoxetine A X X X X
Amlodipine X X X
Metoprolol A X X X X X X
TCPP X X X X X
5-Methylbenzo-triazole
X X X X X
Methylparaben X X X X X
#Two different cyanobacteria species were tested, Anabaena flos-aquae (A) and Synechococcus leopoliensis (S).

Joint effects of pharmaceuticals and chemicals regulated under REACH
55
As a rule, mixtures were tested as fixed-ratio dilutions, i.e. with the relative proportion of each mixture component being constant across the full range of tested mixture concentrations. This general rule was not followed in very few cases as explained below. Table 18 summarizes the tested mixtures for the respective test organisms with regard to the test design. These key aspects and the rationale for testing the individual mixtures will be explained in the following.
Table 18: Overview on key aspects of the mixtures tested in the different test organisms
Mix-ture
Test organisms Rational Proportion of mixture components
Additional aspects
1 Lemna, green al-gae, Daphnia
3 fungicides (azoles) with similar MoA from differ-
ent regulatory frame-works
effect-based (equipo-tent)
with and without wastewater efflu-ent as background
1 Cyanobacteria 2 antibiotics with poten-tial synergistic interac-
tion
similar to proportion in combination products of the two antibiotics
none
2 Green algae, Daphnia
all 9 or 10 single sub-stances with data for the
respective organism *
exposure-based (similar proportions as in WWTP effluents)
none
2 Cyanobacteria 2 antibiotics with dissimi-lar MoA
effect-based (equipo-tent)
two different mix-tures in the two
cyanobacteria spe-cies
3 Lemna, green al-gae, Daphnia
all 9 or 10 single sub-stances with data for the
respective organism *
effect-based (equipo-tent as far as possible)
with and without wastewater efflu-ent as background
3 Cyanobacteria all 10 single substances (mostly antibiotics) with
data for cyanobacteria
effect-based (equipo-tent)
none
4 Lemna 2 antibiotics with poten-tial synergistic interac-
tion
no fixed proportions as one component at fixed
concentration
constant and vary-ing concentrations
over time
4 Daphnia 3 components with dis-similar MoA
effect-based (equipo-tent)
constant and vary-ing concentrations
over time
4 Green algae 3 components with dis-similar MoA
effect-based (equipo-tent)
with and without wastewater efflu-ent as background
4 Cyanobacteria 3 antibiotics with similar targets in bacteria
effect-based (equipo-tent)
none
* composition varied among the different organisms

Joint effects of pharmaceuticals and chemicals regulated under REACH
56
4.1 Effect-based mixture composition The special case of an effect-based mixture is the equipotent mixture where all substances are ex-pected to contribute equally to the mixture. This composition was chosen for mixture 3 in each of the test organisms as well as for mixture 1 (except cyanobacteria) and mixture 4 (except Lemna). The end-point for which the mixtures were designed to be equipotent was selected for each test organism based on the regulatory requirements (EMEA 2006). That was namely the EC10 of growth rate inhibi-tion based on frond number in Lemna minor, the EC10 of growth rate inhibition in cyanobacteria and green algae, and the EC10 of reproduction inhibition based on offspring number in Daphnia magna.
For Lemna, green algae and Daphnia, mixture 1 consisted of fluconazole, climbazole, and propicona-zole. Hence, the mixture of these three azoles represented a mixture of substances that are regulated in different regulatory frameworks (human-use pharmaceuticals, REACH, and biocides/plant protec-tion products). Moreover, they represent a mixture of three substances with a similar intended MoA in the target organism. Assuming that they would also all exhibit the same MoA in non-target organisms, the concept of CA is expected to be most suitable for predicting mixture effects.
For cyanobacteria, mixture 1 contained sulfamethoxazole and trimethoprim in order to verify the sus-pected synergism of these two antibiotics (see Chapter 3). Their proportions in the mixture were based on the proportions with which these two antibiotics are present in combination products that are frequently used in patient treatment. S. leopoliensis was selected as test species for this mixture as it appeared more sensitive for the single substance sulfamethoxazole than A. flos-aquae.
Mixture 3 consisted for all four taxa groups of all tested single substances (Table 17) that showed ef-fects in the respective test species. Hence, mixture 3 contained nine or ten components at an equipo-tent ratio. 5-Methylbenzotriazole and methylparaben were an exception to the equipotent design of mixture 3 in Daphnia. Because of their effect estimates being determined as greater-than concentra-tions, they were present at the highest tested mixture concentration at these greater-than concentra-tions, resulting in an expected relative contribution of less than 10% of the total mixture toxicity.
Mixture 4 was designed to be equipotent in all test organisms except L. minor. For cyanobacteria, mix-ture 4 was a replicate of mixture 3 with fewer mixture components. For green algae, mixture 4 served as an additional mixture tested with and without wastewater background (see below). For L. minor and D. magna, mixture 4 represented a mixture with varying concentrations over time (see below).
While mixtures were designed to be equipotent, either analytical measurements of actual test concen-trations or corrections of single-substance input data after the mixture had been tested resulted in slight deviations from this objective in some cases. This item will be pointed out, where relevant, for the individual mixtures in the following chapter. (see annex for details)
4.2 Exposure-based mixture composition The data sets on WWTP effluent concentrations compiled early in the project were used to support the exposure-based composition of 9 to 10 substances (mixture 2) in green algae and D. magna. Mixture 2 was not tested in L. minor. An update of the WWTP effluent concentration compilation has been pro-vided in Chapter 3 together with measurements conducted in the WWTP effluent used for mixture tests in the present study. These updated concentrations agreed still very well with the concentrations assumed for deriving an exposure-based mixture scenario (Table 19). It is important to note that the absolute concentrations of the exposure-based mixture scenario are of no relevance for selecting test concentrations, as much higher concentration ranges were actually tested in order to determine effec-tive toxicity estimates. The concentration of each substance in the exposure-based mixture scenario listed in Table 19 was transferred into relative proportions dependent on the selection of test com-pounds in the mixture. These individual relative proportions were then used to compose the finally

Joint effects of pharmaceuticals and chemicals regulated under REACH
57
tested mixture as an exposure-based mixture 2 where the relative proportions of the test compounds resembled those typically found in WWTP effluents.
Table 19: Compilation of typical concentrations of the selected test substances in municipal WWTP and available PEC values to support the decision on the exposure-based compo-sition of mixtures tested in the present project
Substance Exposure-based mixture scenario (µg/l)
Proportion in mixture 2, green algae
Proportion in mixture 2, D. magna
Fluconazole 0.1 0.0284 0.0277
Climbazole 0.2 0.0568 0.0554
Propiconazole 0.1 0.0284 0.0277
Linezolid 0.1 0.0284 -
Fenofibric acid 0.1 - 0.0277
Fluoxetine 0.1 (0.001) * 0.0003 0.0277
Amlodipine 0.01 0.0028 -
Metoprolol 1 0.2840 0.2770
TCPP 1 0.2840 0.2770
5-Methylbenzotriazole 1 0.2840 0.2770
Methylparaben 0.01 0.0028 0.0028
* The updated concentration of fluoxetine, which was used for designing mixture 2 in green algae, is given in brackets
Results from an EU-wide monitoring study published later on (Loos et al. 2013) confirmed that several of the selected test substances can be seen as high priority based on the exposure likelihood indicated in this monitoring study. Methylbenzotriazoles and TCPP were detected in 100% of the analysed 90 WWTP samples of the EU-wide monitoring. Fluconazole, trimethoprim, ciprofloxacin, sulfamethoxa-zole, and clindamycin were also detected at high frequencies, i.e. in 98%, 93%, 90%, 81%, and 73% of the samples, respectively. Fluoxetine was detected in only 22% of the samples and amoxicillin in none of them. The other test substances of the present project were not covered in the monitoring study by Loos et al. (2013). Fluoxetine is among the substances with an intermediate concentration of 0.1 µg/l in the exposure scenario of the present study. This may not be justified given the EU-wide monitoring study that reported a maximum concentration of 0.02 µg/l (Loos et al. 2013) and a median concentra-tion of 0.035 µg/l based on compiled literature data (Table 15). Therefore, the fluoxetine concentra-tion was reduced in the exposure-based mixture scenario from 0.1 µg/l to 0.001 mg/l. Accordingly, the proportion of fluoxetine in the mixture 2 tested in algae was considerably reduced in the case of algae, but not in the case of Daphnia as this test was conducted earlier.

Joint effects of pharmaceuticals and chemicals regulated under REACH
58
4.3 Mixtures with a background of wastewater treatment plant effluent An additional aspect of the present project was the testing of generic mixtures in the presence of a real wastewater effluent matrix. This work was motivated by the question whether compliance of CA pre-diction with observed mixture toxicity would also hold in a matrix of a plethora of substances present at low concentrations as it is represented by wastewater. Observed mixture toxicity may deviate from the additive prediction because of
► antagonistic interactions such as reduced bioavailability due to binding to organic substances in the effluent or competitive exclusion with regard to uptake into organisms
► synergistic interactions such as discussed by Frische et al. (2009) as synergistic modulation ► fake synergistic interactions due to the presence of toxic substances in the wastewater that had
not been considered in the prediction.
In the present project, WWTP effluent (24 h composite samples) from a medium-sized treatment plant in Germany (50,000 inhabitant equivalents) was used. The treatment of this plant consists of a me-chanical treatment followed directly (i.e., without primary settlement) by activated sludge treatment with nitrification and denitrification and subsequent secondary settlement. In all tests with wastewater background, the effluent was mixed with an equal volume of a two-fold concentrated stock solution of the mixture. Thereby, a mixture was tested in parallel in the absence and presence of efflu-ent, with both dilution series (absence and presence) being prepared from the very same stock solu-tion of the mixture components. In addition, the effluent was diluted by factor 2, which is below the default dilution factor of 10 used for calculation of PEC values, and thereby represents a worst-case scenario.
Mixtures tested with and without wastewater background directly in parallel were mixture 1 in Lemna, mixture 1, 3, and 4 in green algae as well as mixture 3 in cyanobacteria and Daphnia (see Table 18). They contained between 3 and 10 of the test substances at a concentration level allowing to quan-tify effects. All wastewater samples were analysed for some or all of the test substances of the project. In Chapter 3.6.2, results of these analyses have already been provided.
4.4 Mixtures with varying composition over time The concentrations of most micro-pollutants in wastewater vary over time, both on a short scale (i.e. weekly, daily or hourly) and on a long-term scale, e.g. seasonally (Gerbersdorf et al. 2015). Therefore, monitoring programs often rely on composite samples (e.g. 24 h composite samples) to obtain an ‘av-erage’ value of each analyte over time, and in the best a case statistical distribution of measured con-centrations that can be used for an environmental risk assessment such as for example in Chen & Ying (2015) and Straub (2016). If mixtures of substances shall be assessed that vary in their concentration over time, it is necessary to assume a representative composition to apply the IA or CA concept. These mixture concepts can only predict the toxicity of a mixture that is clearly defined in composition, i.e. changes in the (relative) composition of the components and/or in the total mixture concentration must be ignored. A lot of work has been done in the area of pulsed or fluctuating concentrations of (in-dividual) pesticides, and under which conditions which concentration estimate shall be considered as representative, e.g. time-weighted average, geometric mean, maximum or some percentile of the dis-tribution of measured concentrations (Brock et al. 2010). Even in this well-researched area of pesti-cides, however, this has not been systematically extended to mixtures yet.
With mixture 4 tested in D. magna and L. minor, the present project aimed to explore this open ques-tion. Mixture 4 was hence tested in both species as a mixture with constant concentrations over the whole exposure period and directly in parallel as a mixture varying in concentrations. To limit com-

Joint effects of pharmaceuticals and chemicals regulated under REACH
59
plexity, mixture 4 consisted of only two (Lemna) or three (Daphnia) components with a dissimilar in-tended MoA. As candidates for representative mixture concentrations, the maximum (peak) and me-dian concentrations were assumed as well as the time-weighted average concentrations in order to evaluate which assumptions would best resemble the constant toxicity-exposure profile. The time-weighted average concentration is required in several OECD test guidelines as the concentration to be assumed if dissipation occurs during the exposure (i.e., the exposure concentration changes). It can be assumed as hypothesis, hence, that the toxicity profile of a mixture changing in composition of time should also be best described by its time-weighted average concentration and related composition.

Joint effects of pharmaceuticals and chemicals regulated under REACH
60
5 Performance of experimental tests with individual substances and mixtures
The selected substances were tested singly to determine their individual toxicity toward water lentils, cyanobacteria, green algae, and/or freshwater micro-crustaceans. The purity of all test substances was above 95%, except that of amoxicillin with >90%. If salts were used for the tests such as for some pharmaceuticals, all concentrations and toxicity estimates in the present report relate to the active moiety of the test substance, i.e. the active pharmaceutical ingredient (API), not to the salt. In two cases (bezafibrate and simvastatin), acetone was used as carrier to dissolve the substance, and effects in the treatments were compared to the respective solvent-control. In all other cases, solvent controls were not necessary as no carriers or solvents were used to dissolve any of the test substances. Based on the assessed single-substance toxicity, mixture tests were designed and performed subsequently under identical conditions as the single substance tests. All tests were conducted based on the respec-tive OECD guidelines, i.e. OEDC guideline N°201 (algal growth inhibition, OECD 2006a), N°221 (growth inhibition of Lemna, OECD 2006b), and N°211 (reproduction of Daphnia magna, OECD 2012).
The verification of exposure concentrations by chemical analysis was conducted for initial concentra-tions, and in some cases also for concentrations at test end as required by the above listed OECD guidelines. This deviation from the guidelines was based on the fact that most of the test substances were regularly detected in wastewater effluents, which demonstrates their stability in aqueous me-dium, i.e., no loss due to hydrolytic dissipation or degradation over the exposure period was to be ex-pected. For some test substances, however, this assumption was confirmed (or disproven) by analyti-cal measurements at test end.
Reference tests were conducted regularly (at least twice per year) with the various test organisms as prescribed by the respective guidelines. In the case of D. magna and P. subcapitata, these reference tests with potassium dichromate demonstrated, based on the criteria of the respective guidelines, suf-ficient and constant susceptibility of the test organisms across the full period in which tests for the present project were performed. For L. minor, 3,5-dichlorophenol was used as reference substance and the results of the two conducted reference tests during the project period were within the laboratory’s reference range defined by test results of the last five years. In the case of cyanobacteria, reference tests with potassium dichromate were conducted about twice per year for A. flos-aquae during the pro-ject period. In the case of A. flos-aquae, an about 100-fold maximum difference in sensitivity (ErC50 be-tween 10.0 mg/l and 110.4 mg/l) toward the reference item potassium dichromate was observed in the 10 reference tests during 2011 to 2016. A new culture of A. flos-aquae from the same source (UTEX B 1444) in 2016 showed a higher sensitivity toward the reference item (ErC50 of 0.7 and 1.6 mg/l in two separate tests). However, the sensitivity toward the antibiotic clarithromycin did not differ among two tests conducted February 2014 and August 2016. In the case of S. leopoliensis, no reference values were available to compare to the result of the one reference test with S. leopoliensis in 2015.
While a number of different endpoints were determined in these studies, the key response variables were selected based on the regulatory requirements for the environmental risk assessment of human pharmaceuticals (EMEA 2006) as
► Concentration with 10% effect on the growth rate (based on frond number) of L. minor, ErC10 ► Concentration with 10% effect on the growth rate of cyanobacteria and green algae, ErC10 ► Concentration with 10% effect on the reproduction of D. magna, EC10
The laboratory of the German Environmental Agency (UBA) in Marienfelde, Berlin, conducted the tests with L. minor and cyanobacteria, while tests with green algae and D. magna were conducted at ECT
Joint effects of pharmaceuticals and chemicals regulated under REACH
61
Oekotoxikologie, Flörsheim/Main. The DVGW-Technologiezentrum Wasser (TZW) in Karlsruhe pro-vided the chemical analysis for all tests.
The performance of the tests and analytical measurements as well as data analysis and statistical eval-uations are only briefly summarized here. Detailed descriptions are documented in the individual study reports (confidential Annex I). The general description for each test organism applies to single-substance tests as well as to mixture tests.
5.1 Testing growth inhibition of Lemna minor Growth inhibition tests with the water lentil Lemna minor were performed according to OECD guide-line 221 (OECD 2006b). Steinberg medium was used for culturing and tests. There were six replicate vessels for the control and three for each test concentration level. Each replicate vessel contained 500 ml test solution, and was inoculated with 12 fronds from a stock culture at test start. After 3 and 5 d of exposure as well as at the end of the test after 7 d of static exposure, pictures were taken from every test vessel using a digital camera. Fronds were counted and the biomass of every replicate was determined by using a special accuracy scale. Biomass and growth rate based on frond numbers were used as response variables in the present project.
Temperature and pH were measured during all tests. Temperature ranged between 22°C and 25.4°C, which is in accordance with the temperature range required by the guideline (24±2°C). The pH ranged from 5.7 to 7.7. The change of pH during the exposure was only in one test slightly greater (1.8 units) than allowed by the guideline (1.5 units). In the mixture test with wastewater effluent, the pH values were higher with a maximum value of 9.4. In the test with mixture 1, both with and without WWTP effluent, the pH value changed slightly more than the limit of 1.5 units, prescribed by the guideline (1.8 units). As these deviations are only minor, they are not deemed to invalidate the test results.
All final tests conducted within the present project fulfilled the validity criteria of the OECD 221 guide-line with regard to the doubling time of frond number in the control (less than 2.5 days, corresponding to an about 7-fold increase of frond number in seven days and a growth rate of 0.275 per day).
5.2 Testing growth inhibition of cyanobacteria Two species of cyanobacteria were selected as representatives for blue-green algae in the present pro-ject. The filamentous Anabaena flos-aquae (UTEX B 1444 supplied by University of Texas at Austin, Texas) and the unicellular Synechococcus leopoliensis (SAG 1402-1, supplied by the University of Göt-tingen). The same medium was used in all tests and culturing of both algae, which was the AAP me-dium according to the OECD guideline 201 (OECD 2006a) with the modification of a 10-fold increased sodium hydrogen carbonate concentration.
Cyanobacteria were statically exposed to a series of concentrations of the test item (single substance or mixture of substances) in aqueous solution in parallel with a control (algal growth medium without the test substance) for a test period of 72 hours. There were nine or six replicate vessels for the con-trol for S. leopoliensis or A. flos-aquae, respectively, and three replicate vessels for each concentration level. Between 5 and 7 concentrations were tested, and the spacing factor of the geometric dilution se-ries never exceed 3.2 as prescribed by the guideline. In three tests, no geometric dilution series was used and some of the individual spacing factors exceeded 3.2 (up to factor 10 in one case). Each repli-cate test vessel contained a volume of 90 to 100 ml test solution, and was inoculated with 3.26*104 cells/ml up to 40.4*104 cells/ml (S. leopoliensis) or 0.64*104 cells/ml up to 3.4*104 cells/ml (A. flos-aq-uae) taken from a pre-culture. Experimental vessels of each test were shaken by hand several times per day. Exposure conditions were according to the guideline and regularly measured. Temperature ranged between 22.5°C and 24°C, which is in accordance with the temperature range required by the

Joint effects of pharmaceuticals and chemicals regulated under REACH
62
guideline (21-24°C). In one test (mixture 4), the temperature range was slightly exceeded by 1°C (max-imum 25°C). Test vessels received permanent light at a light intensity between 40 µE m-2 s-1 and 66 µE m-2 s-1. Recommended by the guideline is a light intensity of 40 to 60 µE m-2 s-1. The pH ranged be-tween 5.9 and 10.3. In three of the conducted tests the pH value in the test vessels changed with up to 2.3 units slightly more than the limit of 1.5 units change that is prescribed by the guideline. As the ex-ceedances are only minor and all validity criteria were fulfilled, it was concluded that the slight devia-tions had no impact on the quality of the studies.
Yield and growth rate inhibition were determined by measuring optical density as surrogate parame-ter for cell density. Measurements were made at test start, after 24 h, 48 h, and 72 h of exposure. Opti-cal density measurements were converted into cell density (cells/ml) based on a calibration curve that was generated from a dilution series of the control at the end of the test. The response variables yield and growth rate were calculated according to the guideline.
All final tests reported here fulfilled the validity criteria of the OECD 201 guideline for cyanobacteria with regard to the mean biomass increase (at least 16-fold induction), the mean coefficient for the sec-tion-by-section growth rate in the control (equal or less than 35%), and the coefficient of variation of growth rate in the controls (equal or less than 10%).
5.3 Testing growth inhibition of green algae The unicellular freshwater microalgae Pseudokirchneriella subcapitata (SAG 61.81, supplied by Georg-August-Universität Göttingen) was selected as representative test species for green algae in the pre-sent project. P. subcapitata had been re-named Raphidocelis subcapitata during the lifetime of the pre-sent project. However, in the present report the former name will be used consistently. The algal me-dium used in all tests and culturing of the algae confirmed with the algae medium described in the OECD 201 guideline (OECD 2006a) with the exception that it was modified by a 10-fold increased con-tent of iron salts.
In all tests, P. subcapitata was statically exposed to a series of concentrations of the test item (single substances or mixtures) in aqueous solution in parallel with a control (algal growth medium without the test substance) for a test period of 72 hours. In all definitive concentration-response tests, there were six replicate vessels for the control and three replicate vessels for each concentration level. Al-ways seven concentrations were tested in a geometric dilution series, and the spacing factor between the concentration levels never exceeded 3.2 as prescribed by the guideline. In case of a limit test, the replicate number in the one tested treatment was increased to six as well. Each replicate test vessel contained a volume of 100 ml test solution, and was inoculated with 0.5*104 cells/ml taken from an exponentially growing pre-culture. Experimental vessels of each test were continuously shaken (placed in a random order on the shaker), and received permanent light at a light intensity between 60 µE m-2 s-1 and 120 µE m-2 s-1 as confirmed by measurements.
Yield and growth inhibition of algae were determined by measuring fluorescence as surrogate parame-ter for cell density. The results of the measurement (relative fluorescence units, corrected for fluores-cence of blank measurements) were converted into cell density (cells/ml) based on a calibration curve that was generated from a dilution series of the pre-culture at the day of each test start, i.e. prepared separately for each individual test. Yield was calculated as the biomass (cell density) at the end of the test minus the nominal inoculate. Growth rate (slope of the growth curve) was calculated as the loga-rithmic increase in the biomass over time according to the guideline.
While the tests were generally conducted according to OECD guideline 201, there were some devia-tions:

Joint effects of pharmaceuticals and chemicals regulated under REACH
63
► Growth was not assessed daily, but only at the start and after 72 h at the end of the exposure pe-riod. Therefore, the mean coefficient of variation for the section-by-section growth rate in the con-trol as one of the validity criteria could not be assessed. However, numerous algal growth inhibi-tions tests conducted fully according to guideline confirmed that the standard procedure applied at ECT ensured an exponentially growing pre-culture that continued exponential growth without a time lag when used as inoculum for a definitive test.
► The temperature range for the exposure period prescribed by the guideline is 21 to 24°C con-trolled at ±2°C. This range was slightly exceeded in two tests (minimum of 20.2°C and 20.6°C), but fulfilled in all other tests. This small deviation from the temperature range is not deemed to have any impact on the reliability of the results.
► In five tests, the change of the pH during the exposure period slightly exceeded the maximum of 1.5 pH units allowed by the guideline (maximum change of 2.4 units). These exceedances occurred in the controls and at low test concentrations, and were caused by bicarbonate depletion due to strong growth. Since no impact on growth was observed, the pH exceedance apparently did not indicate growth-limiting conditions. These slight deviations from the prescribed pH range are therefore not deemed to have any impact on the reliability of the results.
All final tests reported here fulfilled the validity criteria of the OECD 201 guideline with regard to the mean biomass increase (at least 16-fold induction) and the coefficient of variation of growth rate in the controls (equal or less than 7%).
5.4 Testing chronic toxicity to Daphnia magna The freshwater micro-crustacean Daphnia magna Straus (clone M10, supplied by the KU Leuven, Bel-gium) was used as test organism. Elendt medium M4 as described in the relevant OECD guideline 211 (OECD 2012) was used for culturing D. magna and in the tests.
In all tests, D. magna was exposed to a series of concentrations of the test item (single substances or mixtures) in aqueous solution in parallel with a control (M4 medium without the test substance) for a test period of 21 days. The test solutions were exchanged three times per week (semi-static exposure). The test solutions were always prepared freshly for each renewal. However, stock solutions of single substances or mixtures were stored refrigerated in the dark for up to five days (i.e., used for three re-newals) if pre-tests demonstrated stability of the compounds during this storage. In all definitive con-centration-response tests, there were eleven replicate vessels for the control and ten replicate vessels for each concentration level. Between 5 and 7 concentrations of a test item (single substance or mix-ture) were tested, and the spacing factor of the geometric dilution series never exceed 3.2 as pre-scribed by the guideline. One test was originally planned as pre-test and therefore had a spacing factor of 10. Each replicate test vessel contained a volume of 50 ml test solution, and received at test start one individual D. magna, less than 24 h old. Feeding, exposure conditions and measurements were all according to the relevant OECD guideline. The temperature range for the exposure period prescribed by the guideline is 18 to 22°C controlled at ±1°C. This range was slightly exceeded in five tests (mini-mum of 16.0°C, maximum of 24.2°C), but otherwise fulfilled in all tests. These minor temperature devi-ations are not deemed to have any impact on the reliability of the results. Oxygen content, change of pH, and light intensity were in all tests according to guideline as confirmed by repeated measure-ments.
Four response variables were recorded and statistically evaluated: survival of parental test animals until the end of the test, reproduction (cumulative number of living offspring per parental animal that survived until the end of the test), body size (length of surviving parental test animals at the end of the test), and population growth rate (intrinsic rate of population increase, r).

Joint effects of pharmaceuticals and chemicals regulated under REACH
64
All definitive tests reported here were valid based on the validity criteria of the OECD guideline 211, i.e. there was 20% or less mortality of test animals in the control until the end of the test and at least 60 offspring per surviving female in the control. This latter criterion was achieved in one test (single-substance test of metoprolol) only after prolongation of the test period until day 22.
5.5 Testing of mixtures All mixtures (except mixture 4 in Lemna, see below) were tested as a dilution series with a fixed ratio of the mixture components. To this end, a stock solution or the highest test solution was prepared by dissolving appropriate amounts of the test substances in the respective culture medium, and subse-quently preparing dilutions of this solution using culture medium. The only exceptions from this method of preparation were the growth inhibition tests with cyanobacteria. Here, each test concentra-tion level of the mixtures was prepared from stock solutions of the individual mixture components, not from a stock solution of the mixture. Since the test solutions were thereby not prepared by dilution from a common solution, it is not fully ensured that the relative proportions of the mixture compo-nents were indeed identical all along the dilution series.
5.5.1 Testing of mixtures with WWTP effluent background
Five selected mixtures were tested in parallel with and without WWTP effluent background. These were the mixtures of three azoles and several equipotent mixtures with up to 10 components (i.e., mix-tures 1, 3, and 4 in P. subcapitata, mixture 1 in L. minor, and mixture 3 in D. magna and A. flos-aquae). The 24-h composite WWTP effluent samples for each test were stored at about 4°C, and used in the tests within 12 h (algae) or stored refrigerated for up to 5 days (D. magna, L. minor). Hence, three dif-ferent composite effluent samples were used in the chronic tests with D. magna, while in all other tests the same effluent sample was used throughout the test due to the static exposure.
Generally, a twofold concentrated stock solution of the mixture was prepared in twofold concentrated culture medium of the respective test organism. From this stock solution, one dilution series was pre-pared using deionised water and culture medium, resulting in a series of mixture concentrations in standard culture medium. This series represents the mixture without WWTP effluent and will be named PUR in the following. A second dilution series was prepared from the very same stock solution using the WWTP effluent and standard culture medium, resulting in a series of mixture concentrations in 1:1 diluted WWTP effluent. This series represents the mixture with wastewater background and will be called KA in the following. By this way of preparing the individual test solutions, it was ensured that both dilution series (PUR and KA) originated from the very same stock solution and that in both test series essential elements and nutrients reached at least the concentrations prescribed by the guideline. Hence, the influence of these two potentially confounding factors on the comparison of the test organisms’ performance exposed to mixtures in presence and absence of WWTP effluent was min-imised as far as possible.
In each of these tests, there were two controls: organisms kept in standard culture medium without the test item (PUR control) and organisms exposed to twofold concentrated standard culture medium diluted 1:1 with effluent (KA control).
In the tests with green algae, auto-fluorescence of the fresh wastewater effluent was found when measuring blank samples (i.e., without algae). Therefore, separate blanks were used for the PUR and KA dilution series.
5.5.2 Testing of mixtures with varying concentrations over time
Two mixtures (mixture 4 in L. minor and D. magna) were tested with the concentrations of the com-pounds varying over time (see 4.4), i.e. with each water exchange. In the case of the Lemna test, the concentration of one mixture component (sulfamethoxazole) was varied, while the concentration of

Joint effects of pharmaceuticals and chemicals regulated under REACH
65
the other component (trimethoprim) was held constant. Thereby, the relative proportions of the two mixture components changed with each water exchange (the only mixture without fixed ratio). In the case of the Daphnia test, two mixture dilution series were tested in parallel. One dilution series, abbre-viated as CONST, represented a fixed-ratio dilution series at an equipotent ratio of the three mixture compounds, i.e., a mixture as tested in all other mixture tests. In the other dilution series, abbreviated as VARY, the concentrations changed at each medium renewal (three times per week), but the relative proportions of the three mixture components were kept constant throughout the test. Both series were prepared from the same stock solution. The concentrations for the VARY series were calculated in a way that the nominal time-weighted average (twa) concentration of this series over the full test duration of 21 days was identical to the nominal concentrations of the CONST series. The concentra-tions in the VARY series varied around the median concentration level by factor 10, i.e. the low and high concentrations were by factor 10 lower or higher, respectively, than the median concentrations. Hence, both mixture dilution series had the same ‘area under the curve’ regarding the concentration-over-time profile and thereby similar average exposure concentrations, but differed in their peak and minimum concentrations by factor 10. Toxicity estimates for the VARY series were calculated by relat-ing the observed responses to i) the average mixture concentrations (i.e., the twa-concentration over the whole duration, identical to the test concentrations in the CONST series), ii) the median concentra-tions (i.e. the median test concentration levels to which the daphnids were actually exposed only dur-ing 1/3 of the whole exposure period), and iii) the peak concentrations (i.e. the highest test concentra-tions to which the daphnids were also actually exposed only during 1/3 of the whole exposure period).
5.6 Analytical verification of test concentrations In all definitive tests the initial concentrations (i.e. concentrations in freshly prepared test medium) were verified by analytical measurement at a low, a medium and a high concentration level. Samples were stored frozen in dark glass flasks without any pre-treatment until analysis.
Since most of the test substances were detected in WWTP effluents, it can be assumed that they are stable under test conditions, i.e. no strong adsorption and no degradation occurred. This assumption was verified in some cases by analysing stock solutions after storage for several days (data not shown), and by analysing test solutions additionally at the end of the exposure phase. As measured ini-tial concentrations usually deviated by less than 20% from the nominal concentrations in the single-substance tests, all toxicity estimates are based on nominal concentrations in the following, except where stated otherwise.
As a rule, analysis of the test substances was done by direct injection into a HPLC-MS-MS system (liq-uid chromatograph 1260 Infinity from Agilent Technologies (Waldbronn, Germany) coupled via an electrospray interface to an API 5500 tandem mass spectrometer (AB Sciex, Langen, Germany). If needed (due to low test concentrations), solid-phase extraction was used for pre-concentration. Quan-tification was done against a calibration in test medium. Details of the analytical methods and the re-sults are reported in the study reports building the confidential annex.
5.7 Data analysis Concentrations with x% effect (ECx), lowest-observed-effect-concentrations (LOEC), and no-observed-effect-concentrations (NOEC) were determined by appropriate statistical methods for each of the re-sponse variables in each test.
For LOEC/NOEC determination, hypothesis testing was applied using e.g. Fisher’s exact binomial test with Bonferroni correction, Dunnett’s or William’s test, or Welch’s t-test for inhomogeneous variances with Bonferroni-Holm correction. The applied post-hoc test was selected based on pre-testing the as-sumptions of normal error distribution (Shapiro-Wilk’s test) and variance homogeneity (Levene’s test) at alpha=0.01. Hypothesis testing to derive LOEC/NOEC was then conducted one-sided at alpha=0.05.

Joint effects of pharmaceuticals and chemicals regulated under REACH
66
All hypothesis tests were performed in the software ToxRat Professional, version 2.10, release 20.02.2010 (ToxRat Solutions GmbH, Alsdorf, Germany).
Effect concentrations were estimated by non-linear concentration-response modelling with the free software R version 3.2.2 (R Development Core Team 2011) using the most recent version of the pack-age “drc” (Ritz & Streibig 2005, Ritz et al. 2015). In most cases, a two (for binary response variables) or three (for (pseudo)metric response variables) parameter log-logistic function achieved good fits, while in some cases a five parameter model (with the fifth parameter describing asymmetry) or a Weibull model produced better fits. Confidence intervals (95%) for all ECx values were obtained with the im-plemented function “ED” of the “drc” package using the delta method and the t-distribution.
Concentration-response curves determined in absence and presence of wastewater effluent were com-pared with each other using the ratio test (Wheeler et al. 2006) for each PUR/KA pair of fitted model parameters. If the parameters of two concentrations-response curves do not significantly differ in the ratio test (two-sided, alpha=0.05), the curves themselves do also not differ significantly. In this case, the WWTP effluent had no influence on the toxicity of the mixture and its predictability.
5.8 Mixture calculations The toxicity of each mixture was predicted according to the CA concept based on nominal concentra-tions as well as based on measured concentrations (see below) and compared to the observed toxicity.
The relative proportion Pi of each mixture component is defined by its individual concentration in the mixture (Ci) and the total concentration of all considered components in the mixture as
𝑃𝑃𝑖𝑖 = 𝐶𝐶𝑖𝑖∑𝐶𝐶𝑖𝑖
Based on the relative proportions, which were constant across the dilution series of a mixture, and the individual toxicity estimate of each component (ECx,i) the predicted toxicity estimates for the mixture (ECx,mix), both at the same effect level x, were calculated according to the concept of concentration ad-dition (CA) as
𝐸𝐸𝐶𝐶𝑥𝑥,𝑚𝑚𝑖𝑖𝑥𝑥 = 1
∑ 𝑃𝑃𝑖𝑖𝐸𝐸𝐶𝐶𝑥𝑥,𝑖𝑖
In addition, the toxic units (TUi) and the relative toxic units (%STU) as a measure for the relative con-tribution of each component to the overall toxicity were calculated as
%𝑆𝑆𝑆𝑆𝑆𝑆 = 𝑆𝑆𝑆𝑆𝑖𝑖∑𝑆𝑆𝑆𝑆𝑖𝑖
with
𝑆𝑆𝑆𝑆𝑖𝑖 = 𝐶𝐶𝑖𝑖𝐸𝐸𝐶𝐶𝑥𝑥,𝑖𝑖
For the tested mixtures, these parameters were calculated for all toxicity estimates, i.e. effect concen-trations of yield and growth rate at effect levels of 10, 20, and 50% as well as for the respective NOECs, although NOECs do not necessarily represent the same defined effect in each test with the same test organism.
For one example mixture, the toxicity predicted by the IA concept was calculated. To this end, the ef-fects of components at the concentrations with which they were present in the mixture were predicted using the function “predict()” in the drc package. These effects were related to the maximum growth

Joint effects of pharmaceuticals and chemicals regulated under REACH
67
rate (upper limit of each single substance model fit) in order to obtain proportional effects that were subsequently enter in the IA formulae given as
𝐸𝐸𝑚𝑚𝑖𝑖𝑥𝑥 = 1 −�(1− 𝐸𝐸𝑖𝑖)𝑖𝑖
With Emix and Ei being the proportional effects of the mixture and each single substance i, respectively. The proportional mixture effect was then re-scaled to the absolute response (growth rate) using the upper limit of the fitted mixture model. In order to allow direct comparisons, experimentally observed and CA-predicted response were also re-scaled using this maximum response.
As measure for the deviance between predicted and observed toxicity, the Model Deviation Ratio (MDR) introduced by Belden et al. (2007) was calculated for each toxicity estimate as
𝑀𝑀𝑀𝑀𝑀𝑀 = 𝑝𝑝𝑝𝑝𝑝𝑝𝑝𝑝𝑝𝑝𝑝𝑝𝑝𝑝𝑝𝑝𝑝𝑝 𝑝𝑝𝑡𝑡𝑡𝑡𝑝𝑝𝑝𝑝𝑝𝑝𝑝𝑝𝑡𝑡 𝑝𝑝𝑒𝑒𝑝𝑝𝑝𝑝𝑒𝑒𝑒𝑒𝑝𝑝𝑝𝑝𝑡𝑡𝑜𝑜𝑒𝑒𝑝𝑝𝑝𝑝𝑜𝑜𝑝𝑝𝑝𝑝 𝑝𝑝𝑡𝑡𝑡𝑡𝑝𝑝𝑝𝑝𝑝𝑝𝑝𝑝𝑡𝑡 𝑝𝑝𝑒𝑒𝑝𝑝𝑝𝑝𝑒𝑒𝑒𝑒𝑝𝑝𝑝𝑝
An MDR above 1 indicates that the toxicity of the mixture is underestimated by the CA prediction, while an MDR below 1 indicates that it is overestimated. An MDR between 0.5 and 2 (i.e. indicating a deviation between prediction and observation of up to factor 2) has been interpreted as indicating compliance with CA given the inherent variability of biological test results (Belden et al. 2007, Cedergreen at al. 2008, Coors & Frische 2011, Cedergreen 2014).
Toxicity estimates derived based on nominal concentrations and proportions were additionally cor-rected for measured concentrations of mixture components. These were usually measured initial con-centrations (i.e., measured in freshly prepared test solutions). In some test, concentrations were meas-ured as well at the end of the exposure duration or, in the semi-static Daphnia test, before water ex-change. In these cases, time-weighted average concentrations were calculated according to OECD guideline 211, Annex 6 (OECD 2012) assuming an exponential dissipation of the test substance during the exposure period.
Parameters that were experimentally determined are shown in bold, while those that were defined by the composi-tion of the tested mixture are shown in italics. All other parameters were calculated according to the given scheme.
Figure 2: Calculation of Model Deviation Ratio (MDR) based on nominal as well as mean ini-tial measured concentrations of the mixture components

Joint effects of pharmaceuticals and chemicals regulated under REACH
68
In order to correct the toxicity estimates, the recovery rate of each substance, averaged across the ana-lysed concentration levels, was used. The predicted toxicity estimates were corrected as well, using the corrected proportions of the mixture components. This is essential to ensure that predicted and ob-served toxicity estimates are compared only for identically composed mixtures. Figure 2 provides a scheme that illustrates the calculation of nominal and corrected MDR values. This way of calculating MDR values based on measured mixture concentrations has already been applied in previous projects (Coors et al. 2012b, Coors et al. 2014)

Joint effects of pharmaceuticals and chemicals regulated under REACH
69
6 Effects of individual test substances The performance of the tests and obtained results, including test conditions such as pH value and oxy-gen content, are reported in detail in the study reports building the confidential annex. Toxicity esti-mates derived from these tests will here only be summarized briefly and compared to available data from the literature for the respective test organism.
6.1 Lemna minor The toxicity estimates determined for the test substances in L. minor are summarized in Table 20.
Toxicity of fluconazole and climbazole was not determined within the present study, because toxicity estimates for L. minor were available from previous studies conducted at ECT according to guideline (Richter et al. 2013, 2016).
Toxicity estimates determined for sulfamethoxazole and trimethoprim were similar or slightly higher than those reported in the literature (Straub 2013, Straub 2016). Toxicity estimates used here for ciprofloxacin (Ebert et al. 2011) were in the same range or below as other literature data, i.e. an EC50 in L. minor of 0.203 mg/l (Robinson et al. 2005) or 3.75 mg/l (Martins et al. 2012).
For propiconazole, TCPP, methylparaben, and 5-methylbenzotriazole no other toxicity estimates were available for Lemna sp. in the literature or regulatory dossiers.
No toxicity toward L. minor up to 250 mg/l (measured concentration) was observed for metoprolol, which is in agreement with other findings (Cleuvers 2005).

Joint effects of pharmaceuticals and chemicals regulated under REACH
70
Table 20: Summary of toxicity estimates (mg/l) determined for individual test substances in the growth inhibition test with the aquatic plant Lemna minor after 7 days of static exposure
Test substance Key response variable ErC10 (95% confidence
interval)
Yield Growth rate Recovery (%)
NOEC EC10 EC20 EC50 NOEC EC20 EC50
Fluconazole 1 0.473 (0.369-0.577) 0.30 0.371 0.529 0.969 0.30 0.783 1.851 121
Climbazole 1,2,3 0.0080 (0.0056-0.010) 0.0022 0.0055 0.0077 0.0137 0.0022 0.0120 0.0240 70.5
Propiconazole 3,4 0.356 (0.276-0.428) <0.066 0.263 0.371 0.668 0.198 0.531 1.069 132.2
Sulfamethoxazole 4 0.34 (0.19-0.49) 0.250 0.18 0.39 1.48 0.250 0.92 5.02 84.2
Trimethoprim 4 65.0 (53.7-76.2) 50.0 58.8 72.8 104.8 50.0 90.3 158.5 88.7
Ciprofloxacin 3,5 0.007 (0-0.036) 0.010 0.009 0.017 0.062 0.010 0.028 0.413 66.7
Metoprolol 3,4 >156 >156 >156 >156 >156 >156 >156 >156 62.5
TCPP 4 44.7 (28.6-60.8) 10.0 12.5 34.6 197.7* 10.0 126.4* 747.3* 90.7
5-Methylbenzotriazole 4 13.81 (10.25-17.36) <1.05 10.26 15.39 30.75 n.d. 23.07 55.50 98.0
Methylparaben 4 16.3 (10.6-21.9) 15.0 14.0 16.5 22.0 15.0 19.7 27.2 91.7
Given are toxicity estimates (in mg/l) based on nominal concentrations for the response variables yield and growth rate, both based on frond number; NOEC: no observed effect concentration; ECx: concentration causing x% effect; n.a.: not available; *: extrapolated beyond measured test concentrations. Recovery is calculated as mean initial measured concentration in the test as per cent of the nominal test concentration; 1: Richter et al. (2016), recovery as mean of all concentration levels at day 0 and day 7; 2: Richter et al. (2013); 3: corrected for measured concentrations; 4: test conducted by Federal Environment Agency, Marienfelde, within the present project; 5: test conducted by Federal Environment Agency, Marienfelde, within another project, Ebert et al. (2011)

Joint effects of pharmaceuticals and chemicals regulated under REACH
71
6.2 Cyanobacteria The toxicity estimates determined for the individual test substances are summarized in Table 20 for the cyanobacterium Anabaena flos-aquae and in Table 21 for Synechococcus leopoliensis together with the respective mean measured test substance concentration in relation to its nominal concentration (% recovery).
The toxicity of sulfamethoxazole differed considerably (by up to factor 65) between the two species, with S. leopoliensis being the more sensitive one. The concentration-response curves for sulfamethoxa-zole from which the toxicity estimates were derived are shown for both cyanobacteria species in Fig-ure 3. In A. flos-aquae, maximum inhibition was reached at the highest test concentration, while lower concentrations (0.32 to 33.6 mg/l) showed an extremely flat concentration-response curve. In the case of S. leopoliensis, there was no maximum inhibition reached up to the highest tested concentration, but the response remained at a plateau at a concentration of 2 mg/l and above. When fitting a 4-parameter log-logistic model (dotted line in Figure 3), this plateau was modelled as lower limit. When fitting a 3-parameter log-logistic model, the lower limit (i.e., the fourth parameter) was fixed at zero. Conse-quently, different toxicity estimates were derived from these two different fitted models. Both model fits and resulting toxicity estimates can be questioned, either because of a rather poor fit to the data (3-parameter model) or because of the ECx not representing the inhibition in relating to the theoreti-cally maximum possible inhibition (4-parameter model). With regard to the key endpoint, the EC10 of growth rate, the estimate of the two models did not differ at all, while the 4-parameter model provided lower estimates for the EC20 and EC50 of growth rate (Table 21). For yield, none of the two models pro-vided consistently the more sensitive estimate.
Black and red symbols represent responses of S. leopoliensis and A. flos-aquae, respectively. The full l ines represent the 3-parameter log-logistic fit to the data (i.e., lower l imit fixed at zero), while the dotted l ine represents the 4-para-meter log-logistic fit to the same data (lower l imit as modelled parameter). Yield relates to 10,000 cells/ml for A. flos-aquae, but 100,000 as indicated on the Y-axis for S. leopoliensis.
Figure 3: Yield (left) and growth rate (right) of S. leopoliensis and A. flos-aquae in dependence of in-creasing concentrations of sulfamethoxazole

Joint effects of pharmaceuticals and chemicals regulated under REACH
72
Toxicity estimates for sulfamethoxazole such as a NOEC of 5.9 µg/l and an EC50 of 26.8 µg/l for S. leopo-liensis as reported by Ferrari et al. (2004) is not supported by the present study. Since concentration-response curves for sulfamethoxazole were not presented or discussed in Ferrari et al. (2004), it re-mains open whether a response plateau and a related influence on the toxicity estimates may explain the differences.
The here observed toxicity of trimethoprim to cyanobacteria agreed well with the values reported in the literature, i.e. an EC50 between 11 and >200 mg/l for trimethoprim (Ando et al. 2007, Halling-Sorensen et al. 2000, Kolar et al. 2014). These results support the conclusion of Dias et al. (2015) that cyanobacteria show relatively low susceptibility to trimethoprim.
The toxicity estimates of clarithromycin provided in Table 21 for A. flos-aquae originated presumably from a different statistical evaluation of the test reported by Baumann et al. (2015), who derived an ErC50 of 2.6 µg/l. S. leopoliensis (Table 22) proved anyway to be slightly more sensitive than A. flos-aq-uae.
The published EC50 values for erythromycin in cyanobacteria range from 23 to 430 µg/l (Ando et al. 2007), which is in agreement with the here obtained results.
For amoxicillin, the here determined yield-based EC50 of 61 µg/l was about factor 20 higher than the literature-reported EC50 values of 3.7 µg/l (Holten-Lützhoft et al. 1999) and 2.22 µg/l for S. leopoliensis (Andreozzi et al. 2004).
Ciprofloxacin EC50 values used here are at the lower end of those determined for cyanobacteria rang-ing from 5 µg/l to 17 µg/l (Halling-Sorensen et al. 2000, Robinson et al. 2005, Ebert et al. 2011).
There were no data found in the literature regarding the toxicity of clindamycin, linezolid, fluoxetine, or metoprolol toward cyanobacteria.

Joint effects of pharmaceuticals and chemicals regulated under REACH
73
Table 21: Summary of toxicity estimates (mg/l) determined for the individual test substances in the growth inhibition test with the cyanobacterium Anabaena flos-aquae after 3 days of static exposure
Test substance Key response variable ErC10 (95% confidence
interval)
Yield Growth rate Recovery (%)
NOEC EC10 EC20 EC50 NOEC EC20 EC50
Sulfamethoxazole 1 36.62 (27.16-46.08) 0.10 0.44 1.86 21.6 0.10 47.5 73.9 84.3
Trimethoprim 1 69.42 (61.58-77.25) 36.0 41.6 56.5 95.6 54.0 99.4 183.7 100.6
Clarithromycin 2 0.0075 (0.006-0.009) <0.0008 0.0019 0.0031 0.0067 n.a. 0.0093 0.0132 n.a.
Erythromycin 3 0.1018 (0.092-0.111) 0.0300 0.0495 0.0717 0.1346 0.0300 0.1597 0.3449 88.5
Clindamycin 2 0.010 (0.0083-0.0116) 0.0061 0.0062 0.0081 0.0129 0.0061 0.0149 0.0296 n.a.
Amoxicillin 1 0.0488 (0.040-0.058) 0.0040 0.0306 0.0395 0.0608 0.0090 * 0.0636 0.1001 111.1
Ciprofloxacin 2 0.0058 (0.003-0.009) 0.0026 0.0052 0.0069 0.0112 0.0026 0.0116 0.0373 87-126
Linezolid 1 0.73 (0.58-0.88) 0.44 0.37 0.54 1.04 0.132 1.08 2.12 100.1
Fluoxetine 1,4 0.384 (0.294-1.063) 0.110 0.168 0.242 0.453 0.110 * 0.576 1.01 86.9
Metoprolol 1 95.1 (61.3-128.8) 41.9 34.8 52.9 108.2 125.8 139.6 269.3 92.6
Given are toxicity estimates (based on nominal concentrations, in mg/l) for the response variables yield and growth rate as determined in single-substance tests. * deter-mined for 24 h or 48 h exposure, not 72 h. NOEC: no observed effect concentration; ECx: concentration causing x% effect. Recovery is calculated as mean measured concen-tration in the test as per cent of the nominal test concentration; n.a.: not available; 1: test conducted by German Environment Agency, Marienfelde, within the present project; 2: test conducted by German Environment Agency, Marienfelde, within a different project (Ebert et al. 2011); 3: test conducted by ECT Oekotoxikologie GmbH within project FKZ 360 14 023; 4: log-logistic model for growth rate with 5 instead of 3 parameters (lower l imit fixed at zero)

Joint effects of pharmaceuticals and chemicals regulated under REACH
74
Table 22: Summary of toxicity estimates (mg/l) determined for the individual test substances in the growth inhibition test with the cyanobacterium Synechococcus leopoliensis
Test substance Key response varia-ble ErC10 (95% confi-
dence interval)
Yield Growth rate Recovery (%)
NOEC EC10 EC20 EC50 NOEC EC20 EC50
Sulfamethoxazole 1 0.56 (0-1.88) 0.5 0.05 0.24 3.88 0.5 4.49 159.8 * 100.0
Sulfamethoxazole 1,2 0.56 (0.28-0.84) 0.5 0.46 0.60 0.97 0.5 0.73 1.18 100.0
Trimethoprim 1 73.0 (64.8-81.1) 20.0 40.3 52.9 84.0 40.0 102.2 182.0 * 91.7
Clarithromycin 1,3 0.0021 (0.001-0.003) 0.0011 0.0016 0.0024 0.0046 0.0011 0.0044 0.0152 77.8
Given are toxicity estimates (based on nominal concentrations, in mg/l) for the response variables yield and growth rate as determined in single-substance tests. * extrapo-lated beyond tested concentrations. NOEC: no observed effect concentration; ECx: concentration causing x% effect. Recovery is calculated as mean measured concentration in the test as per cent of the nominal test concentration. 1: test conducted by Federal Environment Agency, Marienfelde, within the present project; 2: estimates derived from a fitted 4-parameter model, i .e. higher level was not fixed at 100% inhibition as for all other fits; 3: estimates corrected for mean recovery.

Joint effects of pharmaceuticals and chemicals regulated under REACH
75
6.3 Green algae The toxicity estimates determined for the individual test substances are summarized in Table 23 to-gether with the respective mean measured test substance concentration in relation to its nominal con-centration (% recovery). In addition to the results of the eight tests, toxicity estimates and recovery rates for three more substances (climbazole, propiconazole, and fluoxetine) are provided. The raw data of the respective tests were available for re-calculation of the toxicity estimates, if necessary, and the performance of these tests was similar enough to the here conducted tests to be used in the con-text of this study.
For primary producer, the endpoint listed for propiconazole in the biocidal dossier (EC 2007a) is a NOEC of 0.016 mg/l obtained with Desmodesmus subspicatus. This value is about 10-fold lower than the lowest here determined NOEC with P. subcapitata.
For metoprolol, Cleuvers (2005) reported an EC50 of 7.9 mg/l for growth rate inhibition in D. subspi-catus based on nominal concentrations that were not verified by analytical measurements. It is not clear whether this value relates to metoprolol or to the actual test item metoprolol tartrate, and if the exposure period was indeed 72 h as both pieces of information are not explicitly reported in this publi-cation. This EC50 value is about factor 6 lower than the EC50 observed in the here conducted study with P. subcapitata. Maszkowska et al. (2014) reported a 24-h EbC50 of 58.6 mg/l for metoprolol in Scenedes-mus vacuolatus, which is higher than the here determined value.
For 5-methylbenzotriazole Seeland et al. (2012) reported a 72h-EC10 of 2.86 mg/l for biomass inhibi-tion of D. subspicatus. In addition, a LOEC of 5 mg/l (equal to the highest tested concentration) and a NOEC of 2.5 mg/l was reported (Seeland et al. 2012). All these toxicity estimates were based on nomi-nal concentrations that were not verified by analytical measurements. This reported EC10 as well as the LOEC and NOEC are all about factor 8 lower than the respective toxicity estimates determined in the here conducted study.
For two chemicals, data regarding algal growth inhibition were submitted in the context of REACH and are publicly available in the ECHA database (www.echa.europa.eu). There, 72 h toxicity estimates for growth rate for P. subcapitata are reported for methylparaben as EC10 of 31 mg/l and EC50 of 91 mg/l, and for TCPP as EC10 of 42 mg/l and EC50 of 82 mg/l. For TCPP, respective values with regard to bio-mass inhibition were EC10 of 14 mg/l and EC50 of 33 mg/l. These toxicity estimates are all based on nominal concentrations, which were verified by analytical measurement in the case of TCPP. All these toxicity estimates differ by less than factor 1.5 from the respective values determined in the here con-ducted studies.

Joint effects of pharmaceuticals and chemicals regulated under REACH
76
Table 23: Summary of toxicity estimates (mg/l) determined for the individual test substances in the growth inhibition test with the green algae Pseudokirchneriella subcapitata after 3 days of static exposure
Test substance Key response variable ErC10 (95% confidence interval)
Yield Growth rate Recovery (%)
NOEC EbC10 EbC20 EbC50 NOEC ErC20 ErC50
Fluconazole 26.75 (9.7-43.7) <3.7 0.27 * 1.38 * 23.1 <3.7 82.0 557.6 * 91.8
Climbazole 1 0.3147 (0.2226-0.4069) 0.022 0.0287 0.0603 0.2144 0.022 0.5144 1.191 85.0
Propiconazole 2 1.01 (0.49-1.53) 0.143 0.08 0.22 1.23 0.143 3.37 26.4 * 82.6
Linezolid 0.18 (0.06-0.3) 0.16 0.17 0.24 0.46 0.16 0.47 2.35 100.7
Fluoxetine 3 0.0010 (n.a.) <0.0006 0.00095 0.0012 0.0019 0.0006 0.0017 0.0038 n.a.
Amlodipine 0.34 (0.11-0.57) 0.13 0.18 0.21 0.30 0.13 0.38 0.45 118.4
Metoprolol 22.48 (17.78-27.18) 2.44 3.96 6.38 14.4 2.44 29.7 47.6 102.2
TCPP 40.27 (36.83-43.74) <5.6 10.2 15.5 31.6 <5.6 51.7 79.2 102.3
5-Methylbenzotriazole 39.86 (33.68-46.03) 20.0 22.7 28.7 42.8 20.0 50.5 75.6 96.6
Methylparaben 34.21 (20.33-48.08) <13.2 4.42 7.54 18.9 13.2 45.4 73.8 99.2
Fenofibric acid 4 >10.0 >10.0 > 0.0 >10.0 > 0.0 >10.0 >10.0 >10.0 129.0
Given are toxicity estimates (based on nominal concentrations, in mg/l) for the response variables yield and growth rate as determined in single-substance tests within this project unless noted otherwise. NOEC: no observed effect concentration; ECx: concentration causing x% effect; n.a.: not available *: extrapolated beyond measured test concentrations. Recovery is calculated as mean initial measured concentration in the test as per cent of the nominal test concentration. 1: Richter et al. 2013, not corrected for recovery; 2: Coors et al. 2012b, 2014; 3: Oakes et al. 2010, recalculated, estimates based on mean measured concentrations, Desmodesmus subspicatus as test organism; 4: Limit test with one concentration of 10.0 mg/l

Joint effects of pharmaceuticals and chemicals regulated under REACH
77
6.4 Daphnia magna Two of the tested substances were not found suitable for further investigation in mixture tests. One substance was simvastatin, and the other substance was bezafibrate. Already shortly after preparation of the test media, less than 50% of the nominal simvastatin concentration was determined on average. Additional experiments demonstrated that simvastatin dissipated very quickly (within minutes to a few hours), most likely due to limited hydrolytic stability and low water solubility (0.03 mg/l). For this reason, simvastatin is not expected to be present in relevant amounts in WWTP effluents. In addition, it would be technically extremely complicated to ensure a constant concentration of simvastatin in mixture tests. For bezafibrate, only a pre-test without chemical analysis and with reduced replicate number was conducted. No final test was conducted because no toxicity was observed up to the high-est tested nominal concentration of 2 mg/l, which is exceeding the reported water solubility limit of this substance. Fenofibric acid substituted these two substances and represents thereby lipid modify-ing agents in the mixture tests.
The toxicity estimates determined for the nine individual test substances included in further mixture tests are summarized in Table 24 together with the respective mean measured initial test substance concentration in relation to its nominal concentration (% recovery).
For fluconazole and climbazole, no chronic toxicity estimates for D. magna were available in the litera-ture. For the third azole, propiconazole, the endpoint listed in the biocidal dossier (EC 2007a) is a NOEC for a 21-day test of 0.31 mg/l, which is fairly similar to the here derived value.
The acute toxicity of fenofibric acid was predicted by QSAR as 26 mg/l (Sanderson et al. 2003). This prediction of acute toxicity was not contradicted in the present study as the D. magna the range find-ing test indicated no mortality up to day 12 at concentrations up to 50 mg/l. However, chronic toxicity and particularly effects on reproduction were substantial with an NOEC for reproduction as low as 0.015 mg/l. In addition, considerable mortality occurred in the test, resulting in an EC50 for mortality over 21 days of 4.16 mg/l.
Toxicity estimates and recovery rates for fluoxetine were available from previous tests (Oakes et al. 2010). The raw data of this test was available for re-calculation of the toxicity estimates, if necessary, and the performance of this test was similar enough to the here conducted tests to be used in the con-text of this study.
Among the tested pharmaceuticals only for metoprolol relevant toxicity data for D. magna were availa-ble in the literature. These data encompass an EC50 (48 h) for acute toxicity of 438 mg/l (Cleuvers 2005) and 63.9 mg/l (Huggett et al. 2002), and a LOEC of 6.0 mg/l with a related NOEC of 3.1 mg/l for reproduction in D. magna after 9 days of exposure (Dzialowski et al. 2006). The here conducted chronic test determined a similar NOEC (2.5 mg/l) and demonstrated that reproduction is a more sen-sitive endpoint for the effects of metoprolol in D. magna than survival.
For two of the chemicals regulated under REACH results from D. magna reproduction tests are re-ported in the ECHA data base (www.echa.europa.eu). In the case of TCPP, the here obtained results in-dicate a greater toxicity of TCPP toward D. magna than indicated by ECHA data. There, a NOEC of 32 mg/l is reported for survival with 100% mortality at 56 mg/l. The here determined NOEC for survival was about factor 3 lower and in addition, reproduction was found to be the more sensitive endpoint. In the case of methylparaben, the toxicity estimates contained in the ECHA database (all below 1 mg/l) indicated greater toxicity than was found in the here conducted test (estimates >5 mg/l, mostly >10 mg/l). For 5-methylbenzotriazole a LOEC of >10 mg/l was determined for survival and reproduction that does not disagree with literature data (reproduction LOEC of 12.8 mg/l and NOEC of 6.4 mg/l, Seeland et al. 2012).

Joint effects of pharmaceuticals and chemicals regulated under REACH
78
Table 24: Summary of toxicity estimates (mg/l) determined for the individual test substances in the reproduction test with the freshwater micro-crustacean Daphnia magna after 21 days of semi-static exposure
Test substance Key response vari-able EC10 reproduc-
tion (95% confi-dence interval)
Survival Reproduction Population growth rate
Body length
Recovery (%)
NOEC EC50 NOEC EC20 EC50 EC10 EC50 EC10
Fluconazole 20.0 (0-42.3) ≥500 >500 <15.6 34.3 86.2 146.1 185.3 39.5 99.8
Climbazole 0.45 (0.06-0.85) 1.0 1.18 0.25 0.48 0.53 0.48 0.57 0.70 97.7
Propiconazole 0.87 (0.69-1.04) 2.01 1.96 0.90 0.94 1.07 1.19 1.37 1.52 89.5
Fluoxetine 1 0.113 (n.a.) 0.294 0.216 0.060 0.120 0.134 0.101 0.144 n.a. -
Fenofibric acid 0.04 (0.006-0.068) 1.50 4.16 0.015 0.08 0.32 0.20 1.09 0.12 114.2
Metoprolol 6.10 (0-17.13) ≥25 >25 2.50 6.81 8.22 6.49 9.14 >25 91.1
TCPP 2.87 * (1.99-3.74) 11.2 13.8 <5.62 4.08 7.42 9.10 13.4 6.06 99.1
5-Methylbenzotriazole >10 ≥10 >10 ≥10 >10 >10 >10 >10 >10 92.0
Methylparaben >10 ≥10 5.84 ≥10 >10 >10 >10 >10 >10 91.6
Given are toxicity estimates (in mg/l) based on nominal concentrations for the response variables survival, fecundity, population growth rate, and body length as determined in single-substance tests within this project unless noted otherwise; NOEC: no observed effect concentration; ECx: concentration causing x% effect; n.a.: not available; *: extrapo-lated beyond measured test concentrations. Recovery is calculated as mean initial measured concentration in the test as per cent of the nominal test concentration; 1: Oakes et al. 2010, recalculated, estimates based on mean measured concentrations

Joint effects of pharmaceuticals and chemicals regulated under REACH
79
6.5 Derivation of predicted no effect concentrations Predicted no effect concentrations (PNECs) are here derived to be used in the subsequent single-sub-stance and mixture risk assessment. These PNECs (Table 25) do not claim regulatory acceptance, be-cause they are partly based on literature data that have not been assessed for reliability and relevance, e.g. according to the CRED system (Moermond et al. 2016). The scope of the project does not include the derivation of reliable and regulatory acceptable PNECs for the individual test substances. Hence, while their derivation follows established rules (EC 2011b, ECB 2003), the PNECs mainly serve here the purpose to enable comparisons among different concepts of mixture toxicity assessments and with single-substance assessments.
During the lifetime of the project, an extensive review on the occurrence and effects of azoles was pub-lished that included climbazole and fluconazole (Chen & Ying 2015). Based on this review and on own literature research, there are no chronic fish toxicity estimates available for these two azoles. Acute toxicity toward fish is considerably lower than acute toxicity to primary producers. Chronic toxicity to the water plant L. minor was clearly the most sensitive endpoint for fluconazole and climbazole, while chronic toxicity toward the water flea D. magna was slightly greater than that to another primary pro-ducer, green algae. Since chronic data are available for two trophic levels, among them the presumably most sensitive one, an assessment factor (AF) of 50 is used for deriving the PNEC.
L. minor was also the most sensitive test species for the third azole, propiconazole, although the differ-ence to green algae and D. magna was not as great as with the other two azoles. There are comprehen-sive regulatory dossiers available for propiconazole, which is authorised as biocide as well as plant protection product in the EU. The endpoints used for propiconazole as biocide (EC 2007a) comprise a NOEC for a chronic fish test of 0.43 mg/l, and a NOEC for the unicellular green algae Desmodesmus sub-spicatus of 0.016 mg/l. Hence, primary producers are the most sensitive trophic group, and the value from the biocidal dossier is used for deriving the PNEC in the present study with an AF of 10.
For antibiotics, it is generally assumed that primary producers and among them particularly cyanobac-teria are the most sensitive taxa group. As discussed by Baumann et al. (2015), an AF of 10 (instead of 50) may be justifiable for antibiotics if cyanobacteria as the most sensitive species had been tested.
A comprehensive recent review on sulfamethoxazole (Straub 2016) compiled chronic toxicity data for a number of different species covering all three trophic levels. Straub (2016) derived a PNEC of 0.59 µg/l based on the toxicity estimate provided by Ferrari et al. (2004), which represented the lowest toxicity estimate in the data set. The same value is used in the present study, although the here con-ducted experiments raise some doubts on the reliability of the values reported by Ferrari et al. (2004); a study without analytical verification of actual test concentrations and rather limited description of experimental methods and obtained results.
The results for trimethoprim obtained in the present project support the conclusion of Dias et al. (2015) that some cyanobacteria show low susceptibility to trimethoprim. Various toxicity estimates were reported for other species of cyanobacteria (Ando et al. 2007), covering a broad range of toxicity estimates and including 6-day exposure NOECs for A. flos-aquae and S. leopoliensis about factor 1.5 to 22 lower than the EC10 values observed here. The toxicity of trimethoprim with a base pKa of 6.6 to 7.6 depends strongly on pH, and higher toxicity, e.g. toward marine algae, may be explained by a more basic pH in the test medium (Straub 2013). Yet, the tests reported in Ando et al. (2007) were run at a pH of 8, i.e. similar to the pH in the present study. Straub (2013) published a comprehensive review on trimethoprim that presented several new data sets (e.g. chronic fish toxicity data), and derived finally a PNEC based on a marine diatom. This approach is not followed here as the present study is focussing on WWTP effluents, which are usually released into freshwater systems. Instead, the lowest freshwa-ter cyanobacteria endpoint (3.1 mg/l) was selected from Ando et al. (2007) to derive a PNEC with an AF of 10.

Joint effects of pharmaceuticals and chemicals regulated under REACH
80
For clarithromycin, the cyanobacterium S. leopoliensis was found most sensitive. In agreement with Baumann et al. (2015) an AF of 10 was used to derive the PNEC as data for other species support the conclusion that cyanobacteria are the most sensitive taxa group for chronic effects of clarithromycin.
For erythromycin, NOEC values for freshwater cyanobacteria range from 2.0 to 100 µg/l (Ando et al. 2007). Green algae, D. magna and fish are considerably less sensitive (Isidori et al. 2005, Munch Chris-tensen et al. 2006, Yang et al. 2008, Ji et al. 2012). Similar to trimethoprim, the PNEC for erythromycin is derived from a 6-day exposure NOEC reported by Ando et al. (2007), although the results of this study may not necessarily be deemed reliable for a regulatory established endpoint such as an EQS, because the microtiter plate assays of Ando et al. (2007) deviated in several aspects considerably from a guideline study of algal growth inhibition.
There are no data in the literature on the toxicity of clindamycin toward Daphnia, fish, or cyanobacte-ria. Villain et al. (2016) report an EbC50 of 0.01 mg/l for P. subcapitata determined in a miniaturised algal growth assay. Due to the lack of other data, an AF of 100 is applied to the ErC10 of A. flos-aquae to derive the PNEC.
For amoxicillin, high toxicity toward cyanobacteria is reported (Holten-Lützhoft et al. 1999, Andreozzi et al. 2004), while green algae, Daphnia and fish show little susceptibility (Andreozzi et al. 2004). A bi-omass-based NOEC for S. leopoliensis of 0.78 µg/l (Andreozzi et al. 2004) was the lowest toxicity esti-mate, from which a PNEC was derived with an AF of 10.
Cyanobacteria and Lemna minor were the most sensitive organisms for ciprofloxacin, while endpoints for green algae, D. magna, fish, and other organisms were generally above 100 µg/l (Halling-Sorensen et al. 2000, Robinson et al. 2005, Yang et al. 2008, Ebert et al. 2011, Zaleska-Radziwill et al. 2011, Mar-tins et al. 2012). The ErC10 for cyanobacteria was selected and an AF of 10 applied for PNEC derivation.
For linezolid, the only published toxicity endpoint is a NOEC of 24 mg/l and 31 mg/l for reproduction of D. magna and Ceriodaphnia dubia, respectively (Constantine & Huggett 2010). The green algae P. subcapitata was found more sensitive in the present project than the cyanobacterium A. flos-aquae. Hence, the green algae endpoint was used for the PNEC derivation with an assessment factor of 50 as there is no sufficiently convincing evidence that green algae are indeed the most sensitive species.
For fenofibric acid, no chronic toxicity estimates were available in the literature. Since no chronic algal toxicity was observed, an AF of 50 was applied to the NOEC for D. magna obtained in the present study.
For fluoxetine, a comprehensive environmental risk assessment compiling all available data was pub-lished by Oakes et al. (2010). The most sensitive species that was accordingly used for derivation of the PNEC was the green algae, i.e. the toxicity estimate used in the present study. Cyanobacteria did not prove to be more sensitive here. Since an extensive dataset is available for fluoxetine, including chronic studies with fish and Daphnia, an AF of 10 is applied.
For amlodipine, no toxicity data are available in the literature at all. The observed endpoint for P. sub-capitata is therefore used with an AF of 100 for deriving a PNEC.
For metoprolol, a proposal for an EQS value was published recently (Moermond & Smit 2016). Based on the compiled available literature data for metoprolol (including a number of chronic fish tests), the authors identified chronic toxicity in Daphnia as most sensitive endpoint. Chronic Daphnia toxicity is selected as well in the present study as the relevant endpoint for metoprolol. Yet, an AF of 10 is used as with the here obtained results a guideline-confirm study over 21 days with semi-static exposure is now available, while Moermond & Smit (2016) relied on a 9-day test using an AF of 50.
For the three REACH-regulated chemicals, there are no data available for chronic fish toxicity, while the here conducted studies together with data from the registration dossiers and the literature cover two trophic levels and, with L. minor, three organisms. An AF of 100 is applied, however, due to the

Joint effects of pharmaceuticals and chemicals regulated under REACH
81
lack of fish data due the relevant endpoints taken from the chronic Daphnia studies. In the case of methylparaben, survival was stronger affected in the chronic test than reproduction.
Overall, the derived PNECs for the 18 test substances range from 0.08 µg/l to 310 µg/l, with two anti-biotics representing the extreme cases (amoxicillin and trimethoprim). Various AF (10, 50, or 100) were applied for deriving the PNECs, thereby indicating the different degrees of uncertainty in the sub-sequent environmental risk assessment. The PNECs were derived based on different taxa groups (i.e., freshwater crustaceans, green algae, cyanobacteria, and water plants), which reflects the diverse set of test compounds and their mode of actions. Only fish was not represented as providing a relevant end-point. It is important to note that all PNECs were derived from endpoints of chronic toxicity, which is in accordance with the legally required environmental risk assessment for human pharmaceuticals in the EU (EMEA 2006).
Table 25: Predicted no effect concentrations (PNEC) derived for the individual test substances
Test substance Relevant endpoint Assessment factor
PNEC (µg/l)
Fluconazole 0.473 mg/l; L. minor ErC10 50 9.46
Climbazole 0.008 mg/l; L. minor ErC10 50 0.16
Propiconazole 0.016 mg/l; D. subspicatus NOEC 10 1.60
Sulfamethoxazole 0.0059 mg/l; S. leopoliensis ErC10 10 0.59
Trimethoprim 3.1 mg/l; A. variabilis NOECbiomass 10 310.00
Clarithromycin 0.0021 mg/l; S. leopoliensis ErC10 10 0.21
Erythromycin 0.002 mg/l; S. leopoliensis NOECbiomass 10 0.20
Clindamycin 0.010 mg/l; A. flos-aquae ErC10 100 0.10
Amoxicillin 0.00078 mg/l; S. leopoliensis NOECbiomass 10 0.08
Ciprofloxacin 0.0058 mg/l; A. flos-aquae ErC10 10 0.58
Linezolid 0.18 mg/l; P. subcapitata ErC10 50 3.60
Fenofibric acid 0.04 mg/l; D. magna EC10 reproduction 50 0.8
Fluoxetine 0.001 mg/l; D. subspicatus ErC10 10 0.1
Amlodipine 0.34 mg/l; P. subcapitata ErC10 100 3.4
Metoprolol 6.1 mg/l; D. magna EC10 reproduction 10 610
TCPP 2.87 mg/l; D. magna EC10 reproduction 100 28.7
5-Methylbenzotriazole >10 mg/l; D. magna EC10 reproduction 100 100.0
Methylparaben 5.84 mg/l; D. magna EC50 survival 100 58.4

Joint effects of pharmaceuticals and chemicals regulated under REACH
82
7 Predicted and observed toxicity in the tested mixtures In the following, the results from the mixture tests and comparisons to predicted mixture toxicity are summarized. Detailed study reports are provided as confidential annexes. Only some concentration-response curves are shown here to illustrate specific aspects, while the study reports contain complete concentrations-response curves for all tests. The last subchapter integrates the results of all mixture tests in a discussion of key points and provides some conclusions.
7.1 Mixtures in Lemna minor 7.1.1 Mixture 1: Three azoles in absence and presence of WWTP effluent
Mixture 1 for L. minor was composed of fluconazole, climbazole and propiconazole at about equipotent ratios. The test was conducted with two dilution series in parallel, one with (KA) and the other without (PUR) WWTP effluent as background. The mean measured initial concentrations for propiconazole and climbazole deviated by more than 20% from the nominal concentrations in both dilution series. Therefore, all toxicity estimates and related calculations for the mixture were corrected for mean measured initial concentrations, in addition to the MDR calculated based on nominal concentrations (Table 26).
The determined MDR values for effect concentration estimates all indicate a less than 2.5-fold devia-tion between predicted and observed mixture toxicity. Based on NOEC values, the deviation increased to still less than 4.5-fold. MDR values based on measured initial concentrations were closer to 1 than those based on nominal concentrations, thereby indicating better compliance. The concentration-re-sponse curves of the mixture did not differ between the PUR and the KA series (i.e., none of the param-eter ratios differed significantly from 1). Hence, presence of WWTP effluent had no impact on the growth of L. minor or influence on the predictability of mixture toxicity.
Table 26: MDR values determined for mixture 1 (three azoles) in L. minor with and without wastewater background
Toxicity estimate MDR in absence of effluent (PUR) MDR in presence of effluent (KA)
Growth rate, ErC10 0.93 (1.16) 0.61 (0.75)
Growth rate, ErC20 0.89 (1.11) 0.64 (0.79)
Growth rate, ErC50 0.81 (1.03) 0.68 (0.85)
Growth rate, NOEC 0.46 (0.58) 4.56 (5.72)
Yield, EbC10 0.65 (0.81) 2.20 (2.71)
Yield, EbC20 0.71 (0.88) 1.57 (1.93)
Yield, EbC50 0.82 (1.02) 0.88 (1.09)
Yield, NOEC 0.32 (0.43) 3.23 (4.27)
Model Deviation Ratios (MDR) were calculated for toxicity estimates based on nominal concentrations as well as based on initial measured concentrations (provided in brackets) of the three azoles
7.1.2 Mixture 3: Nine substances at about equipotent ratios
Mixture 3 for L. minor was composed of fluconazole, climbazole, propiconazole, 5-methylbenzotria-zole, methylparaben, TCPP, sulfamethoxazole, trimethoprim, and ciprofloxacin at an about equipotent ratio. The relative nominal proportions in the mixture ranged from 0.0007 (ciprofloxacin) to 0.3148

Joint effects of pharmaceuticals and chemicals regulated under REACH
83
(TCPP) due to the very different toxicities of the mixture components. The mean measured initial con-centrations deviated by more than 20% from the nominal concentrations for propiconazole, TCPP, sul-famethoxazole, and ciprofloxacin. Therefore, all toxicity estimates and related calculations for the mix-ture were corrected for mean measured initial concentrations, in addition to the MDR calculated based on nominal concentrations (Table 27).
All determined MDR values indicated a less than 5-fold deviation between predicted and observed mixture toxicity. MDR values based on measured initial concentrations did not differ notably from those based on nominal concentrations. The key endpoint, ErC10, was predicted with a less than 2.5-fold deviation.
Table 27: MDR values determined for mixture 3 (nine substances at about equipotent ratio) in L. minor
Toxicity estimate MDR based on nominal concentra-tions
MDR based on measured initial concentrations
Growth rate, ErC10 0.45 0.43
Growth rate, ErC20 0.21 0.22
Growth rate, ErC50 1.11 1.20
Growth rate, NOEC 2.64 2.90
Yield, EbC10 0.41 0.44
Yield, EbC20 0.48 0.51
Yield, EbC50 0.52 0.56
Yield, NOEC 0.29 0.31
Model Deviation Ratios (MDR) were calculated for toxicity estimates based on nominal concentrations as well as based on initial measured concentrations of the two substances.
7.1.3 Mixture 4: Varying sulfamethoxazole and constant trimethoprim concentrations
Both dilution series of mixture 4 contained the same concentrations of trimethoprim, ranging nomi-nally from 363.4 mg/l at the highest to 6.50 mg/l at the lowest tested concentration level. Sulfameth-oxazole was present in the series with constant concentrations throughout the exposure period (CONST), nominally at 0.034 mg/l to 1.90 mg/l at the lowest and highest tested concentration level, respectively. The resulting relative proportions were 0.005 (sulfamethoxazole) and 0.995 (trime-thoprim). In the series with varying concentrations (VARY), the concentrations of sulfamethoxazole changed at each of the three water exchanges. The time-weighted average concentrations of sulfa-methoxazole over the whole test duration were identical to those in the series CONST, while the mini-mum and maximum (peak) concentrations differed by factor 10 in each direction, respectively, from the median concentration. Consequently, the relative proportions of the two mixture compounds changed during the exposure period of seven days. Since there is no mixture concept that can predict toxicity for mixtures that change in their relative composition, constant proportions have to be as-sumed. In the case of the VARY mixture 4, the median concentration was assumed as well as the time-weighted average and the peak concentration in order to evaluate which assumption provides the best estimate of the mixture toxicity. While measured concentrations of trimethoprim were within 20% of the nominal concentrations in freshly prepared test solutions, those of sulfamethoxazole were in all

Joint effects of pharmaceuticals and chemicals regulated under REACH
84
cases below 80% of the nominal concentrations. Therefore, MDR values derived in this test (Table 28) are based on measured initial concentrations of the two mixture compounds.
The MDR values derived for the CONST mixture indicated considerable underestimation of the toxicity of the mixture. The greatest deviation of up to 6-fold was observed for the endpoint ErC10, while higher effect levels showed less underestimation. A similar pattern was observed for the VARY mixture. Inde-pendently of which concentration was assumed (median, twa, or peak), the ErC10 indicated the greatest level of toxicity underestimation. Assuming twa concentrations produced MDR values most similar to that of the CONST series, which indicates that time-weighted average concentrations well represent mixtures changing in concentration over time with regard to chronic toxicity to L. minor.
Table 28: MDR values determined for mixture 4 in L. minor
Toxicity estimate CONST – con-stant mixture
concentrations
VARY – based on median concen-
trations
VARY – based on time-weighted
average concen-trations
VARY – based on peak concentra-
tions
Growth rate, ErC10 6.15 7.84 5.33 2.79
Growth rate, ErC20 5.80 5.99 4.76 2.99
Growth rate, ErC50 4.36 3.51 3.25 2.62
Growth rate, NOEC 4.54 6.58 4.42 2.28
Yield, EbC10 3.99 8.89 5.14 2.34
Yield, EbC20 4.53 7.29 4.99 2.63
Yield, EbC50 4.78 4.77 4.02 2.74
Yield, NOEC 4.54 6.58 4.42 2.28
Model Deviation Ratios (MDR) were calculated for toxicity estimates based on measured initial concentrations for the mixtures with constant (CONST) and varying (VARY) mixture concentrations as well as varying proportions. For the mixture VARY, peak, median as well as time-weighted average concentrations were assumed for the prediction
7.2 Mixtures in cyanobacteria In total five independent mixture tests were conducted with cyanobacteria in the present project with one of the tests involving two parallel dilution series in absence and presence of WWTP effluent. Apart from mixture 3 that involved also fluoxetine and metoprolol, all mixture components in the tests with cyanobacteria were antibacterials.
7.2.1 Mixture 1: Sulfamethoxazole and trimethoprim in S. leopoliensis
Mixture 1 for S. leopoliensis was composed of sulfamethoxazole and trimethoprim at a concentration ratio of 5:1 (w/w), because this is the ratio at which the two substances are often combined in medical products for human use. As a consequence of this ratio, sulfamethoxazole was expected to dominate the toxicity of the mixture with 99.8% STU when assuming no synergistic interaction.
The mean measured initial concentrations for sulfamethoxazole and trimethoprim were very close to the nominal concentrations (mean recoveries of 106.8% and 91.0%, respectively). Nevertheless, all toxicity estimates and related calculations were corrected for mean initial measured concentrations, and presented in addition to results calculated based on nominal concentrations. Yet, correcting for initial measured concentrations had no relevant impact on MDR values (Table 29).

Joint effects of pharmaceuticals and chemicals regulated under REACH
85
Table 29: MDR values determined for mixture 1 in S. leopoliensis
Toxicity estimate MDR based on fitting 3-parameter models
MDR based on fitting 4-parameter models
Growth rate, ErC10 7.18 (6.72) 1.36 (1.28)
Growth rate, ErC20 5.01 (4.69) 1.57 (1.47)
Growth rate, ErC50 2.38 (2.28) 2.05 (1.92)
Growth rate, NOEC 2.85 (2.67) 2.85 (2.67)
Yield, EbC10 0.33 (0.31) 1.14 (1.07)
Yield, EbC20 0.95 (0.89) 1.35 (1.27)
Yield, EbC50 6.24 (5.85) 1.87 (1.75)
Yield, NOEC 2.84 (2.66) 2.84 (2.66)
Model Deviation Ratios (MDR) were calculated for toxicity estimates based on nominal concentrations as well as based on initial measured concentrations (in brackets) of the two substances. MDR values were derived using a 3- or 4-parameter model fit for the mixture and a 3- or 4-parameter model fit for sulfamethoxazole, respectively. Trime-thoprim estimates were all derived with a 3-parameter model.
Figure 4: Yield (left) and growth rate (right) of S. leopoliensis in dependence of increasing concen-trations of mixture 1 (sulfamethoxazole and trimethoprim)
The full l ine represents the 3-parameter log-logistic fit to the data (i.e., lower l imit fixed at zero), while the dotted l ine represents the 4-parameter log-logistic fit to the same data (lower l imit as modelled parameter)
Similar to the single-substance test with sulfamethoxazole in S. leopoliensis, the test with mixture 1 also resulted in a concentration-response curve with a plateau at the higher concentration levels. Therefore, the data from the mixture test were also fitted with a 3-parameter model (lower limit fixed at zero) as well as with a 4-parameter model (lower limit treated as model parameter), resulting in dif-

Joint effects of pharmaceuticals and chemicals regulated under REACH
86
ferent toxicity estimates for the mixture. The ErC10 for the mixture was estimated as 0.09 mg sum sub-stances/l and 0.49 mg sum substances/l for the 3- and 4-parameter model fit, respectively. MDR val-ues were calculated using the toxicity estimates for sulfamethoxazole and the mixture, both either from the 3-parameter model fit or the 4-parameter model fit (Figure 3). Based on the 4-parameter fit, the deviation between predicted and observed toxicity was up to about factor 2 for the ECx values. Based on the 3-parameter model, i.e., ignoring the response plateau observed consistently at higher concentrations of sulfamethoxazole both in the single-substance and in the mixture test, the deviation between prediction and observation was up to about factor 7. Particularly at the lower effect levels re-garding growth rate and median effect levels regarding yield, the toxicity of the mixture was underesti-mated based on this model, pointing at potential synergistic interactions. However, the 3-parameter model resulted in a poor fit particularly at the lower concentration level, while the 4-parameter model closely fitted the observed data. Hence, an indication for synergistic interaction for this mixture was largely due to assumptions on the underlying concentration-response curves and related statistical issues.
7.2.2 Mixture 2a: Sulfamethoxazole and clarithromycin in S. leopoliensis
Mixture 2 tested with S. leopoliensis was composed of sulfamethoxazole and clarithromycin at an equi-potent ratio with regard to the ErC10. As a consequence of the much greater toxicity of clarithromycin, the nominal mass proportion of sulfamethoxazole (0.996) was much greater than that of clarithromy-cin (0.004). The mean measured initial concentrations for sulfamethoxazole and clarithromycin were very close to the nominal concentrations (mean recoveries of 106.1% and 88.1%, respectively). Never-theless, all toxicity estimates and related calculations were corrected for mean initial measured con-centrations, and presented in addition to the results calculated based on nominal concentrations (Ta-ble 30).
Table 30: MDR values determined for mixture 2 in S. leopoliensis
Toxicity estimate MDR based on 3-parameter fit for sulfamethoxazole
MDR based on 4-parameter fit for sulfamethoxazole
Growth rate, ErC10 2.93 (3.02) 2.93 (3.02)
Growth rate, ErC20 5.38 (5.86) 2.62 (2.64)
Growth rate, ErC50 8.43 (9.52) 1.97 (1.93)
Growth rate, NOEC 1.12 (1.18) 1.12 (1.18)
Yield, EbC10 0.88 (0.85) 4.35 (4.50)
Yield, EbC20 2.23 (2.20) 3.94 (4.05)
Yield, EbC50 5.74 (6.22) 3.34 (3.41)
Yield, NOEC 3.57 (3.78) 3.57 (3.78)
Model Deviation Ratios (MDR) were calculated for toxicity estimates based on nominal concentrations as well as based on initial measured concentrations (in brackets) of the two substances. MDR values were derived using toxicity estimates for sulfamethoxazole from a 3- or 4-parameter model. Estimates for clarithromycin and mixture 2a were all derived with a 3-parameter model.
In contrast to the single-substance test with sulfamethoxazole and trimethoprim (mixture 1), where toxicity was dominated by sulfamethoxazole, no plateau was observed in the response of S. leopoliensis to mixture 2, but a perfectly monotonous concentration-response curve. Therefore, a 4-parameter model delivered toxicity estimates very similar to the finally used 3-parameter model (data not
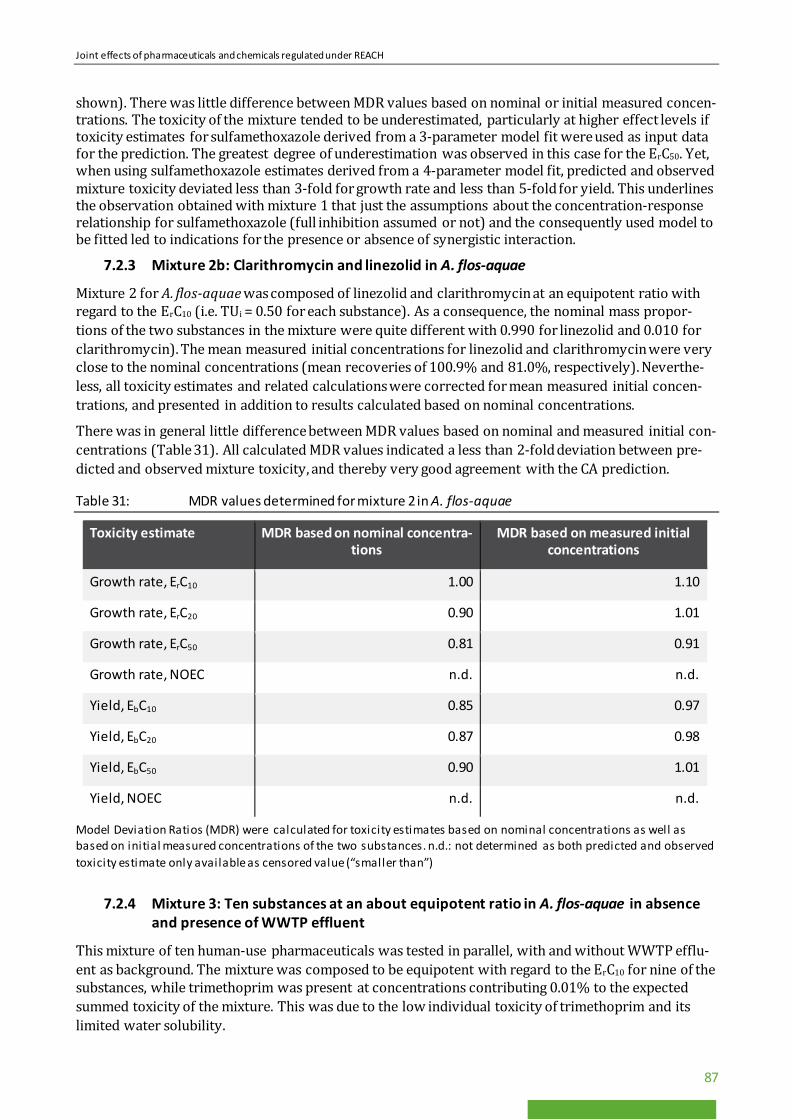
Joint effects of pharmaceuticals and chemicals regulated under REACH
87
shown). There was little difference between MDR values based on nominal or initial measured concen-trations. The toxicity of the mixture tended to be underestimated, particularly at higher effect levels if toxicity estimates for sulfamethoxazole derived from a 3-parameter model fit were used as input data for the prediction. The greatest degree of underestimation was observed in this case for the ErC50. Yet, when using sulfamethoxazole estimates derived from a 4-parameter model fit, predicted and observed mixture toxicity deviated less than 3-fold for growth rate and less than 5-fold for yield. This underlines the observation obtained with mixture 1 that just the assumptions about the concentration-response relationship for sulfamethoxazole (full inhibition assumed or not) and the consequently used model to be fitted led to indications for the presence or absence of synergistic interaction.
7.2.3 Mixture 2b: Clarithromycin and linezolid in A. flos-aquae
Mixture 2 for A. flos-aquae was composed of linezolid and clarithromycin at an equipotent ratio with regard to the ErC10 (i.e. TUi = 0.50 for each substance). As a consequence, the nominal mass propor-tions of the two substances in the mixture were quite different with 0.990 for linezolid and 0.010 for clarithromycin). The mean measured initial concentrations for linezolid and clarithromycin were very close to the nominal concentrations (mean recoveries of 100.9% and 81.0%, respectively). Neverthe-less, all toxicity estimates and related calculations were corrected for mean measured initial concen-trations, and presented in addition to results calculated based on nominal concentrations.
There was in general little difference between MDR values based on nominal and measured initial con-centrations (Table 31). All calculated MDR values indicated a less than 2-fold deviation between pre-dicted and observed mixture toxicity, and thereby very good agreement with the CA prediction.
Table 31: MDR values determined for mixture 2 in A. flos-aquae
Toxicity estimate MDR based on nominal concentra-tions
MDR based on measured initial concentrations
Growth rate, ErC10 1.00 1.10
Growth rate, ErC20 0.90 1.01
Growth rate, ErC50 0.81 0.91
Growth rate, NOEC n.d. n.d.
Yield, EbC10 0.85 0.97
Yield, EbC20 0.87 0.98
Yield, EbC50 0.90 1.01
Yield, NOEC n.d. n.d.
Model Deviation Ratios (MDR) were calculated for toxicity estimates based on nominal concentrations as well as based on initial measured concentrations of the two substances. n.d.: not determined as both predicted and observed toxicity estimate only available as censored value (“smaller than”)
7.2.4 Mixture 3: Ten substances at an about equipotent ratio in A. flos-aquae in absence and presence of WWTP effluent
This mixture of ten human-use pharmaceuticals was tested in parallel, with and without WWTP efflu-ent as background. The mixture was composed to be equipotent with regard to the ErC10 for nine of the substances, while trimethoprim was present at concentrations contributing 0.01% to the expected summed toxicity of the mixture. This was due to the low individual toxicity of trimethoprim and its limited water solubility.

Joint effects of pharmaceuticals and chemicals regulated under REACH
88
The measured initial concentrations of most substances were very close to the nominal concentrations in both dilution series (PUR and KA). In the dilution series without effluent (PUR) the mean measured initial concentrations of amoxicillin and ciprofloxacin deviated more than 20% from the nominal ones. In the dilution series with effluent (KA) the mean measured concentrations of amoxicillin, ciprofloxa-cin and clarithromycin deviated more than 20% from the nominal concentrations. Therefore, all tox-icity estimates and related calculations were corrected for mean initial measured concentrations, and presented in addition to results calculated based on nominal concentrations (Table 32).
Concentration-response curves of the mixture differed significantly in presence and absence of WWTP effluent as evidenced by the fact that the ratios of all three model parameters were significantly differ-ent from 1 (all p<0.05 in the ratio test). In the presence of WWTP effluent, the algal growth in the con-trols was significantly reduced and the response curve was significantly flatter. As a result of the dif-ferent slopes, the median toxicity of the mixture was significantly reduced in the presence of wastewater (i.e., the EC50 significantly greater), while the ErC10 values were lower in presence than in absence of WWTP effluent.
Table 32: MDR values determined for mixture 3 (ten substances at an about equipotent ratio) in A. flos-aquae with and without wastewater background
Toxicity estimate MDR in absence of effluent (PUR)
MDR in presence of effluent (KA)
Growth rate, ErC10 4.65 (4.53) 7.74 (6.89)
Growth rate, ErC20 3.61 (3.50) 2.53 (2.22)
Growth rate, ErC50 2.25 (2.17) 0.36 (0.31)
Growth rate, NOEC n.d. n.d.
Yield, EbC10 0.64 (0.63) 1.20 (1.16)
Yield, EbC20 1.33 (1.31) 1.65 (1.54)
Yield, EbC50 2.57 (2.52) 1.55 (1.37)
Yield, NOEC n.d. n.d.
Model Deviation Ratios (MDR) were calculated for toxicity estimates based on nominal concentrations as well as based on initial measured concentrations (provided in brackets) of the ten substances; n.d.: not determined as both predicted and observed toxicity estimate only available as censored value (“smaller than”)
For both response variables and regardless of the presence of wastewater effluent, the MDR values were mostly within a range of 0.3 and 3, indicating a deviation of less than factor 3 between predicted and observed toxicity. The only exceptions were MDR values based on low effect estimates, where up to almost 8-fold underestimation of mixture toxicity occurred. Eight of the ten test substances were measured in the WWTP effluent used for the test. Their final concentrations in the test (i.e., 50% of that in the effluent in each concentration level), amounted to a STU of 0.04 with regard to the ErC10. Three antibacterials (clarithromycin, clindamycin, and ciprofloxacin) dominated this STU of 0.04, while all other substances contributed 1% or less. Given that the STU is well below 1, the summed con-centrations of the test substances added by the effluent were not expected to exhibit as much as 10% inhibition, i.e. a measurable contribution in comparison the nominal test substance concentrations. Hence, the difference in the MDR values between PUR and KA can only be partly explained by the pres-ence of the test substances in the wastewater. This may, in consequence, indicate the presence of other

Joint effects of pharmaceuticals and chemicals regulated under REACH
89
substances in the effluent that were relevant (i.e. had a measurable impact on the growth of the cyano-bacteria), but that were not taken into account in the prediction. The analytes covered by the analyti-cal multi-method did not include any other antibacterials. Additionally, the MDR in the absence of ef-fluent (PUR series) indicates already underestimation of toxicity by about factor 4.5 which points ei-ther at questionable input data or synergistic interaction. The latter may relate to sulfamethoxazole and trimethorpim for which synergistic interaction in S. leopoliensis could not be fully excluded due to the non-monotonous concentration-response curve of sulfamethoxazole, which was also observed (but ignored) in the case of A. flos-aquae.
7.2.5 Mixture 4: Three antibiotics at an equipotent ratio in A. flos-aquae
Mixture 4 tested with A. flos-aquae was composed of clarithromycin, clindamycin and erythromycin at an equipotent ratio with regard to the ErC10 (i.e. nominal TUi = 0.33 for each substance). Measured ini-tial concentrations exceeded the nominal concentrations for two of the three antibiotics. Therefore, all toxicity estimates and related calculations were corrected for mean measured initial concentrations, and presented in addition to the results calculated based on nominal concentrations.
Calculated MDR values based on nominal concentrations (Table 33) indicate a less than 3-fold devia-tion between CA-predicted and observed mixture toxicity. MDR values corrected for measured initial concentrations indicate generally good agreement, i.e. less than 2-fold deviation.
Table 33: MDR values determined for mixture 4 (three antibiotics at an equipotent ratio) in A. flos-aquae
Toxicity estimate MDR based on nominal concen-trations
MDR based on measured initial concentrations
Growth rate, ErC10 2.38 0.73
Growth rate, ErC20 2.56 0.78
Growth rate, ErC50 2.81 0.85
Growth rate, NOEC n.d. n.d.
Yield, EbC10 1.92 0.70
Yield, EbC20 2.10 0.73
Yield, EbC50 2.42 0.77
Yield, NOEC <1.48 <0.53
Model Deviation Ratios (MDR) were calculated for toxicity estimates based on nominal concentrations as well as based on initial measured concentrations of the three antibiotics; n.d.: not determined as both predicted and ob-served toxicity estimate only available as censored value (“smaller than”)
7.3 Mixtures in green algae 7.3.1 Mixture 1: Three azoles in absence and presence of WWTP effluent
There were two independent tests of mixture 1: fixed-ratio dilution series tested once without and once, in parallel, with and without WWTP effluent as background. The mixtures were composed to be equipotent with regard to the ErC10 (i.e. TUi = 0.333 for each azole). As a consequence, the nominal pro-portions Pi of the three azoles in the mixture were 0.953 (fluconazole), 0.011 (climbazole), and 0.036 (propiconazole) in both tests.

Joint effects of pharmaceuticals and chemicals regulated under REACH
90
In the first test, the mean measured initial concentrations for fluconazole and propiconazole were very close to the nominal concentrations (mean recoveries of 95.3% and 90.5%, respectively), while that of climbazole deviated by more than 20% (mean recovery of 61.0%). In the second test, the measured initial concentrations of all three azoles were very close to the nominal concentrations in both dilution series. For the sake of consistency, all toxicity estimates and related calculations were corrected for mean initial measured concentrations, and presented in Table 34 in addition to the MDR calculated based on nominal concentrations.
The determined MDR values ranged from 0.19 to 2.35, thereby indicating an up to 4-fold deviation be-tween predicted and observed mixture toxicity with a tendency rather to overestimation than under-estimation of mixture toxicity. There was little difference between MDR values based on nominal and measured initial concentrations. There was also little difference between MDR values determined in absence and presence of WWTP effluent, which relates to the fact that WWTP effluent had no signifi-cant influence on the concentration-response curves of the mixture (none of the parameter ratios dif-fered significantly from 1, data not shown). MDR values differed, however, depending for which tox-icity estimate they were calculated. Although the mixtures were designed to be equipotent for the ErC10, the greatest deviation between prediction and observation was observed for this endpoint.
Table 34: MDR values determined for mixture 1 (three azoles) in green algae with and without wastewater background
Toxicity estimate Test 1 – PUR Test 2 – PUR Test 2 – KA
Growth rate, ErC10 0.24 (0.29) 0.27 (0.27) 0.19 (0.19)
Growth rate, ErC20 0.40 (0.52) 0.39 (0.39) 0.39 (0.38)
Growth rate, ErC50 0.79 (1.15) 0.89 (0.88) 1.04 (1.03)
Growth rate, NOEC n.d. <0.65 (<0.65) n.d.
Yield, EbC10 0.24 (0.26) 0.49 (0.52) 1.76 (1.85)
Yield, EbC20 0.40 (0.45) 0.73 (0.77) 2.19 (2.26)
Yield, EbC50 0.70 (0.88) 1.10 (1.10) 2.35 (2.35)
Yield, NOEC n.d. <0.65 (<0.65) n.d.
Model Deviation Ratios (MDR) were calculated for toxicity estimates based on nominal concentrations as well as based on initial measured concentrations (provided in brackets) of the three azoles; n.d.: not determined as both pre-dicted and observed toxicity estimate only available as censored value (“smaller than”)
7.3.2 Mixture 2: Ten substances at an exposure-based ratio
This mixture was planned as an exposure-based mixture scenario related to typical WWTP effluent concentrations (see Chapter 4.2). Based on the resulting nominal proportions of the ten substances and their individual toxicity toward algae, three substances were expected to contribute each more than 20% to the overall mixture toxicity (climbazole with 26.3% STU, linezolid with 23.0% STU, and fluoxetine with 41.4% STU), while the other seven substances (fluconazole, propiconazole, amlodipine, metoprolol, TCPP, 5-methylbenzotriazole, and methylparaben) were expected to contribute each less than 5% STU.
The measured initial concentrations deviated by more than 20% from the nominal concentrations in case of amlodipine and TCPP, while they ranged within 20% deviation for the other eight mixture com-ponents. Concentrations measured at the end of the 72 h exposure period deviated by less than 20%

Joint effects of pharmaceuticals and chemicals regulated under REACH
91
from the measured initial concentrations for eight of the substances. Dissipation during the exposure period was indicated for amlodipine (65.9% of initial measured concentration) and methylparaben (less than 15.9% of initial measured concentration, i.e. below limit of quantification). Time-weighted average concentrations were calculated for all ten substances and MDR values accordingly derived based on nominal as well as measured concentrations (Table 35).
There was little difference between CA-predicted MDR values based on nominal versus those based on measured concentrations. This is due to the fact that measured concentrations of the toxicity-dominat-ing substances (climbazole, linezolid, and fluoxetine) were close to nominal concentrations at test start as well as test end. The determined MDR values generally indicated good agreement (at most 2.6-fold deviation) between predicted and observed mixture toxicity. CA predictions rather tended to overesti-mate than underestimate the chronic algal toxicity of the mixture, particularly at lower effect levels.
Table 35: MDR values determined for mixture 2 (ten substances at an exposure-based ratio) in green algae
Toxicity estimate MDR based on nominal concentrations and Con-
centration Addition
MDR based on measured concentrations and Con-
centration Addition
MDR based on nominal concentrations and Inde-
pendent Action
Growth rate, ErC10 0.38 (0.35) 0.43 0.48
Growth rate, ErC20 0.46 (0.39)) 0.52 0.51
Growth rate, ErC50 0.51 (0.46) 0.60 0.55
Growth rate, NOEC
<0.47 <0.46 n.d.
Yield, EbC10 0.75 0.73 n.d.
Yield, EbC20 0.78 0.79 n.d.
Yield, EbC50 0.81 0.86 n.d.
Yield, NOEC <0.47 <0.47 n.d.
Model Deviation Ratios (MDR) were calculated for toxicity estimates based on nominal concentrations as well as based on time-weighted average measured concentrations of the ten substances; in order to apply IA, responses had to be re-scaled to the maximum growth rate observed in the control of the mixture, which was done similarly for CA and resulted in sl ightly different MDR values (shown in brackets); n.d.: not determined
For mixture 2 in green algae, the IA concept was applied additionally to evaluate whether overestima-tion of mixture toxicity by CA would be reduced when using the more applicable IA concept for this mixture of ten substances with different modes of action. As shown in Table 33, the deviation between predicted and observed mixture toxicity was only slightly reduced by applying the IA concept. Hence, this comparison conducted in the present study only for this exemplary mixture clearly shows the lim-ited influence of the actually applied concept (IA or CA) on the correctness of the mixture toxicity pre-diction.
Figure 5 additionally illustrates the three models fitted to the observed mixture responses as well as the response curves predicted by CA and IA. Note that all responses were re-scaled to the upper limit of growth rate in the mixture test in order to make them comparable. Predicted response curves are located left of the observed response curve, and the curves for IA and CA differ most at the low effect level. This is in agreement with the calculated MDR values. Both IA and CA concentration-response curves remain left of the actually observed curve, i.e. they still indicate toxicity overestimation when

Joint effects of pharmaceuticals and chemicals regulated under REACH
92
only the three dominating substances of this mixture are taken into account (climbazole, linezolid, and fluoxetine). The curves for CA and IA, however, show slightly less difference from each other, which indicates that the stronger overestimation by CA is mainly due to the consideration of components that actually contributed little to the actual mixture toxicity (i.e., all other test substances in the mix-ture).
Figure 5: Modelled concentration-response curves of mixture 2 in green algae
Shown are the curves fitted with a 3-parameter log-logistic model for experimentally observed mixture data (black), CA-predicted mixture responses (green), and IA-predicted mixture responses (red). All ten substances are included in the left graph, while the right graph shows the results considering only the three dominating mixture compounds, cl imbazole, l inezolid, and fluoxetine.
7.3.3 Mixture 3: Ten substances at an equipotent ratio in absence and presence of WWTP effluent
The measured initial concentrations of mixture components deviated by less than 20% from the nomi-nal concentrations, except for linezolid, amlodipine and fluoxetine. Concentrations were not deter-mined at the end of the 72 h exposure period, but, based on the results for mixture 2, relevant dissipa-tion may be assumed for amlodipine and methylparaben. MDR values were calculated based on nomi-nal as well as based on measured initial concentrations (Table 36).
Despite the differences between initial measured and nominal concentrations for three substances, the MDR values based on nominal and measured concentrations differed only slightly. Predicted toxicity deviated less than 5-fold with regard to yield and less than 2-fold with regard to growth rate. There was little difference in the MDR values determined in absence and presence of wastewater effluents, demonstrating that the effluent had no influence on the mixture toxicity predictability. In accordance, the ratio test indicated no significant differences between the concentration-response curves. The only exception was the parameter b (related to the steepness of the curves) for the response variable yield that was just significantly different in presence and absence of wastewater effluent (p=0.047).

Joint effects of pharmaceuticals and chemicals regulated under REACH
93
Table 36: MDR values determined for mixture 3 (ten substances at an equipotent ratio) in green algae with and without wastewater background
Toxicity estimate MDR in absence of effluent (PUR) MDR in presence of effluent (KA)
Growth rate, ErC10 0.71 (0.67) 0.97 (0.79)
Growth rate, ErC20 0.90 (0.83) 1.16 (0.92)
Growth rate, ErC50 1.08 (0.96) 1.28 (0.96)
Growth rate, NOEC n.d. <1.14 (<1.04)
Yield, EbC10 0.24 (0.24) 0.28 (0.29)
Yield, EbC20 0.45 (0.44) 0.78 (0.75)
Yield, EbC50 0.79 (0.74) 1.93 (1.65)
Yield, NOEC n.d. <1.14 (<1.04)
Model Deviation Ratios (MDR) were calculated for toxicity estimates based on nominal concentrations as well as based on initial measured concentrations (provided in brackets) of the ten substances; n.d.: not determined as both predicted and observed toxicity estimate only available as censored value (“smaller than”)
7.3.4 Mixture 4: Three substances at an equipotent ratio in absence and presence of WWTP effluent
This equipotent mixture was tested to confirm the absence of an impact of WWTP effluent on the mix-ture toxicity predictability in green algae. The measured initial concentrations were within 20% of the nominal concentrations in the two dilution series for climbazole and metoprolol, but deviated by more than 20% for amlodipine in the KA dilution series. Concentrations measured at the end of the expo-sure duration indicated no dissipation for climbazole and metoprolol, but some dissipation (up to 29.1%) for amlodipine. These findings are in agreement with previous results, i.e. from testing of mix-ture 2.
MDR values were calculated based on nominal as well as based on time-weighted average (measured) concentrations (Table 37). In contrast to previous growth inhibition tests with green algae in absence and presence of WWTP effluent, a significant influence of the effluent on the concentration-response curve was indicated in the tests with mixture 4. All parameter ratios were significantly different from 1 for the response variable yield, but not for growth rate. However, for growth rate the curve fit was ra-ther poor as indicated by wide confidence intervals for the toxicity estimates. The fit could not be im-proved by using other curve fitting models or methods (such as linearizing the responses by dividing them through the mean control response).
Determined MDR values (Table 37) indicated nevertheless relatively good agreement between pre-dicted and observed mixture toxicity with at most 3-fold deviations. Toxicity tended to be rather un-derestimated in absence and slightly overestimated in presence of WWTP effluent, which was at least partly due to the relative poor fit at low effect levels.

Joint effects of pharmaceuticals and chemicals regulated under REACH
94
Table 37: MDR values determined for mixture 4 (three substances at an equipotent ratio) in green algae with and without wastewater background
Toxicity estimate MDR in absence of effluent (PUR) MDR in presence of effluent (KA)
Growth rate, ErC10 2.45 (2.98) 0.46 (0.61)
Growth rate, ErC20 2.47 (3.06) 0.57 (0.78)
Growth rate, ErC50 2.35 (2.99) 0.78 (1.13)
Growth rate, NOEC 0.74 (0.85) 0.74 (0.87)
Yield, EbC10 2.08 (2.39) 1.60 (1.91)
Yield, EbC20 2.45 (2.86) 1.54 (1.87)
Yield, EbC50 3.07 (3.68) 1.32 (1.69)
Yield, NOEC >0.74 (>0.85) >0.74 (>0.87)
Model Deviation Ratios (MDR) were calculated for toxicity estimates based on nominal concentrations as well as based on time-weighted average measured concentrations (provided in brackets) of the three substances

Joint effects of pharmaceuticals and chemicals regulated under REACH
95
7.4 Mixtures in Daphnia magna 7.4.1 Mixture 1: Three azoles at an equipotent ratio
Mixture 1 was tested as equipotent fixed-ratio dilution series (i.e. TUi = 0.333 for each azole). As a con-sequence of the different single substance toxicities, the nominal proportions Pi of the three azoles in the mixture were 0.938 (fluconazole), 0.021 (climbazole), and 0.041 (propiconazole). The mean meas-ured initial concentrations of the three azoles deviated mostly by more than 20% from to the nominal concentrations. Therefore, all toxicity estimates and related calculations were corrected for mean measured initial concentrations, and in addition to the MDR calculated based on nominal concentra-tions (Table 38).
For all endpoints, the determined MDR values based on effect concentrations deviated less than 2-fold between CA-predicted and observed mixture toxicity. MDR values based on measured concentrations indicated better compliance than those based on nominal concentrations. Hence, the CA concept pro-vided a good estimate for the chronic toxicity of a mixture of presumably similarly acting substances toward D. magna.
Table 38: MDR values determined for mixture 1 (three azoles) in D. magna
Toxicity estimate MDR based on nominal con-centrations
MDR based on measured con-centrations
Reproduction, EC10 0.77 1.08
Reproduction, EC20 0.79 1.12
Reproduction, EC50 0.76 1.08
Reproduction, NOEC <0.74 <0.99
Survival, EC50 1.06 1.57
Survival, NOEC ≥1.45 ≥2.09
Population growth rate, EC10 0.82 1.14
Population growth rate, EC50 0.79 1.11
Body length, EC10 1.25 1.74
Model Deviation Ratios (MDR) were calculated for toxicity estimates based on nominal concentrations as well as based on initial measured concentrations of the three azoles
7.4.2 Mixture 2: Nine substances at an exposure-based ratio
The relative proportions of the nine test substances in this mixture were set according to the expo-sure-based mixture scenarios. For fluoxetine, the higher concentration (0.1 µg/l) was assumed. Result-ing from these set proportions and the individual toxicity of the test substances, the expected contribu-tion of the nine components to the overall mixture toxicity was quite different. Based on nominal pro-portions and with regard to the EC10 of reproduction, fenofibric acid was expected to dominate the tox-icity with more than 50% STU. Fluoxetine ranged second with more than 10% STU expected contribu-tion, followed by climbazole and TCPP with more than 5% STU. All others were expected to contribute less. Measured initial concentrations deviated for fluoxetine by more than 20% of the nominal concen-tration (average of 135.7%). Therefore, all toxicity estimates and MDR values were additionally calcu-lated based on measured initial concentrations.

Joint effects of pharmaceuticals and chemicals regulated under REACH
96
Since for each endpoint, at least for one of the test substances no definitive concentration but only a censored value (‘greater-than’) had been determined in the single substance tests, all MDR values for mixture 2 were calculated as censored values as well (Table 39). None of the derived MDR values pro-vided evidence that the toxicity of the mixture was seriously (more than 3-fold) over- or underesti-mated by the CA prediction. Excluding the two substances without a definitive EC10 (5-methylbenzotri-azole and methylparaben) from the calculation yielded a definitive MDR value indicating slight (less than 3-fold) mixture toxicity overestimation.
Table 39: MDR values determined for mixture 2 (nine substances) in D. magna
Toxicity estimate MDR based on nominal concentrations
MDR based on measured concentrations
Reproduction, EC10, excluding 5-me-thyl-benzotriazole and methylparaben
0.39 0.39
Reproduction, EC10 >0.54 >0.50
Reproduction, EC20 >0.61 >0.56
Reproduction, EC50 >0.57 >0.51
Reproduction, NOEC n.d. n.d.
Survival, EC50 >0.59 >0.51
Survival, NOEC ≥1.03 ≥0.94
Population growth rate, EC10 >0.54 >0.48
Population growth rate, EC50 >0.42 >0.37
Body length, EC10 >0.67 >0.70
Model Deviation Ratios (MDR) were calculated for toxicity estimates based on nominal concentrations as well as based on measured initial concentrations of the nine substances. Fluoxetine was not included in the MDR calculation for body length as no toxicity estimate for this endpoint was available; n.d.: not determined.
7.4.3 Mixture 3: Nine substances at an about equipotent ratio in absence and presence of wastewater effluent
This mixture was planned to be equipotent with regard to the EC10 of reproduction. Yet, for two of the mixture components (5-methylbenzotriazole and methylparaben), the individual EC10 values were de-termined as >10 mg/l (see Chapter 6.4), Hence, no exact concentration could be determined at which the two substances would contribute each 1/9 to the overall toxicity. Therefore, the mixture was planned as equipotent regarding the other seven substances, ignoring 5-methylbenzotriazole and methylparaben. These two were present at the highest tested mixture with 10 mg/l (5-methylbenzo-triazole) and 1 mg/l (methylparaben), and subsequently diluted together with all other mixture com-ponents in the dilution series. The concentration of methylparaben was selected in order to limit test animal mortality during the test (methylparaben’s EC50 for long-term survival was determined as 5.84 mg/l).
Measured initial concentrations of all test substances deviated in both dilution series (PUR and KA) by less than 21% from the nominal concentrations. Concentrations measured after 2 to 3 days of expo-sure indicated some dissipation for fluoxetine (loss of about 60% during the exposure period) and

Joint effects of pharmaceuticals and chemicals regulated under REACH
97
strong dissipation for methylparaben (below limit of quantification, i.e. loss of more than 90%). There-fore, time-weighted average concentrations were calculated for all test substances in the mixture, and MDR values based on these corrected concentrations are shown in addition to those based on nominal concentrations in Table 40.
Table 40: MDR values determined for mixture 3 (nine substances at an equipotent ratio) in D. magna with and without wastewater background
Toxicity estimate MDR in absence of effluent (PUR)
MDR in presence of effluent (KA)
Reproduction, EC10, excluding 5-methyl-benzotriazole and methylparaben
0.78 (0.83) 0.84 (0.90)
Reproduction, EC10 >0.73 (>0.78) >0.78 (>0.84)
Reproduction, EC20 >0.73 (>0.79) >0.78 (>0.85)
Reproduction, EC50 >0.66 (>0.72) >0.69 (>0.77)
Reproduction, NOEC n.d. n.d.
Survival, EC50 >0.28 (>0.32) >0.28 (>0.32)
Survival, NOEC ≥0.38 (≥0.41) ≥0.38 (≥0.42)
Population growth rate, EC10 >0.65 (>0.72) >0.94 (>1.08)
Population growth rate, EC50 >0.48 (>0.53) >0.58 (>0.66)
Body length, EC10 >0.89 (>0.91) >0.61 (>0.62)
Model Deviation Ratios (MDR) were calculated for toxicity estimates based on nominal concentrations as well as based on time-weighted measured concentrations (in brackets) of the nine substances. Fluoxetine was not included in the MDR calculation for body length as no toxicity estimate for this endpoint was available. n.d.: not determined as both predicted and observed toxicity estimate only available as censored value (“smaller than”)
Shown are the 3-parameter log-logistic fits of the response variables offspring (left) and population growth rate r (right) in dependence of nominal mixture concentrations in absence (black) and presence (red) of WWTP effluent
Figure 6: Concentration-response curves for mixture 3 in D. magna

Joint effects of pharmaceuticals and chemicals regulated under REACH
98
The concentration-response curves for the mixture did not differ significantly in absence and presence of WWTP effluent for population growth rate and survival (Figure 6). With regard to the concentra-tion-response curve for reproduction, only one parameter, the upper limit, differed significantly (p<0.001, ratio test), demonstrating better reproduction in the control in the presence of WWTP efflu-ent than in the absence. The concentration-response curve for body length differed for all three pa-rameters significantly (p<0.05, ratio test), again with better performance of test animals in the pres-ence of effluent. Hence, no negative impact of the WWTP effluent on D. magna in a chronic toxicity test was detected, but instead better performance that may be related to improved food conditions due to the bacterial load of the effluent (D. magna as filter feeder also feeds on suspended bacteria).
Similar to the results for mixture 2, the MDR values for mixture 3 in D. magna provide no evidence that the toxicity of the mixture is seriously under- or overestimated by the CA concept. When not taking the two compounds without definitive toxicity estimates into account (i.e., 5-methylbenzotriazole and methylparaben), the MDR values were very close to 1. The correction for time-weighted average con-centrations did not have a notable influence on the MDR values. Likewise, MDR values hardly differed among the test with and without wastewater effluent. Hence, while the wastewater effluent had a posi-tive effect on the performance of D. magna, it did not influence the predictability of mixture toxicity.
7.4.4 Mixture 4: Three substances at an equipotent ratio and with constant or varying to-tal mixture concentrations
Mixture 4 was composed as an equipotent mixture of three components for which quantifiable toxicity toward D. magna had been observed on most endpoints in the single substance tests (metoprolol, climbazole, and fenofibric acid). Two series of fixed-ratio dilutions of mixture 4 were tested in parallel. One series (CONST) was planned with constant mixture concentrations during the 21-day semi-static test, while the total mixture concentrations changed by factor 10 at each exchange of test solution, i.e., three times per week, in the other series (VARY). More details are provided in Chapter 5.5 and in the study report in the confidential annex. Since measured concentrations were generally within 20% of the nominal concentrations in freshly prepared test solutions and within 20% of measured initial con-centrations after 2 to 3 days of exposure, no corrections of concentrations and proportions and, hence, for mixture calculations were conducted for this test.
MDR values are provided for the CONST series together with those for the VARY series in Table 41. MDR values for the VARY series were derived by relating responses either to the median of the three tested concentration levels, the highest (peak) of the three concentration levels, or the time-weighted average concentration levels. The MDR values derived for the CONST mixture demonstrate that the toxicity of the mixture of these three substances can be predicted by CA with a good precision, i.e. an up to 2-fold deviation only. Therefore, under- or overestimation of mixture toxicity for the VARY mix-ture indicate that the assumed VARY concentrations for the respective prediction do not reflect the ac-tual toxicity-exposure profile experienced by the test organisms. The results demonstrated that the correct prediction of the chronic toxicity of an equipotent mixture varying in total concentration by factor 100 over time depends to a great degree on which concentrations are assumed representative for the exposure. This prediction was best, particularly for low-effect chronic endpoints such as EC10 of fecundity, if the peak concentrations were assumed rather than time-weighted average concentrations of the mixture. Hence, it can be concluded that the toxicity of mixtures that vary in total concentration over time is mostly driven by the peak concentration with regard to the key endpoint reproduction and that accordingly peak concentrations should be used to derive a protective mixture toxicity esti-mate. Yet, for other endpoints (i.e., population growth rate, which integrates effects on survival and reproduction over time), this approach lead to an about 5-fold overestimation of mixture toxicity. Us-ing the median of the three different concentration levels during the exposure period resulted in a strongest underestimation of chronic mixture toxicity toward D. magna.

Joint effects of pharmaceuticals and chemicals regulated under REACH
99
Table 41: MDR values determined for mixture 4 (three substances) in D. magna
Toxicity estimate CONST – con-stant mixture
concentrations
VARY – based on time-
weighted aver-age concentra-
tions
VARY – based on median
concentrations
VARY – based on peak con-centrations
Reproduction, EC10 2.03 6.24 23.11 2.29
Reproduction, EC20 1.68 3.52 13.02 1.30
Reproduction, EC50 1.01 1.11 4.11 0.41
Reproduction, NOEC 0.89 <1.79 <6.64 <0.66
Survival, EC50 >0.70 >1.16 >4.29 >0.43
Survival, NOEC ≥1.04 ≥1.04 ≥3.86 ≥0.39
Population growth rate, EC10 0.77 0.52 1.91 0.19
Population growth rate, EC50 0.67 0.47 1.87 0.17
Body length, EC10 >1.51 >2.28 >8.44 >0.84
Model Deviation Ratios (MDR) were calculated for toxicity estimates based on nominal concentrations for the mix-tures with constant (CONST) and varying (VARY) mixture concentrations. For the mixture VARY, peak, median as well as time-weighted average concentrations were used for the prediction
7.5 Conclusions from mixture tests In the present project, 17 independent aquatic chronic single substance toxicity tests were conducted with five different species. In total, 24 mixtures were investigated. With the exception of the mixture of three azoles, the mixtures contained components exhibiting (at least with regard to the pharmaceuti-cals) profoundly different intended MoA. While it remains open if the substances would consequently also show (dis)similar MoA in the different tested non-target organism, (dis)similarity of intended MoA has been proposed (and critically discussed) as a criterion for appropriateness of applying CA or IA for mixture predictions (Altenburger et al. 2004, Borgert et al. 2004, Cedergreen et al. 2008, Escher et al. 2011). One aspect in the selection process of the components had been their potential to inhibit cytochrome P450 enzymes and thereby potentially inhibit the biodegradation of other mixture compo-nents, which is a toxicokinetic mechanism of synergistic interaction well known for pharmaceuticals (Spurgeon et al. 2010, Backhaus 2016). Despite of these two aspects, the results of the here conducted mixture tests provide comprehensive and consistent evidence that the aquatic toxicity of mixtures with regard to chronic endpoints can in many cases be fairly well predicted by the CA concept. This statement however relates only to CA predictions based on effect estimates (ECx values), while CA pre-dictions based on threshold concentrations (NOEC values) demonstrated greater and non-systematic deviations from NOECs experimentally determined for the tested mixture.
7.5.1 Predictability of chronic mixture effects by CA
CA has been demonstrated as a reliable prediction tool for acute aquatic mixture toxicity in a number of studies (reviewed in Deneer 2000, Belden et al. 2007, Kortenkamp et al. 2009). So far, there is only very limited evidence in the literature showing the suitability of CA for chronic aquatic toxicity end-points (assuming that EC50 values for algal toxicity represent acute toxicity, while EC10 values repre-

Joint effects of pharmaceuticals and chemicals regulated under REACH
100
sent chronic toxicity). For D. magna, the predictability of various chronic effects of mixtures of deme-thylase-inhibiting fungicides within factor 2 deviation from the observation has been reported re-cently (Hassold & Backhaus 2014). Similarly, other studies (Hermens et al. 1984, Coors et al. 2014) de-tected no indication for underestimation of chronic mixture toxicity in D. magna by CA. The results of the present project generally confirmed the CA-predictability of chronic toxicity to D. magna, and point rather at a tendency for overestimation than at a danger of systematic underestimation. The same was found for chronic endpoints in the other tested species, i.e. three different primary producers (with the exception of mixtures containing sulfamethoxazole and trimethoprim, see below). Based on five inde-pendent mixture tests, observed mixture toxicity in green algae deviated with regard to the key end-point (ErC10) at most 5-fold from the toxicity predicted by the CA concept. Again, there was a clear ten-dency for mixture toxicity overestimation, since the degree of toxicity underestimation was less than 3-fold. This tendency for overestimation of mixture toxicity by CA may point at the better suitability of the IA concept due to most mixture components having dissimilar (intended) MoA. Yet, as the example of the mixture with ten components in green algae (mixture 2) illustrated, the degree of overestima-tion was only slightly reduced by applying IA. This finding is in agreement with theoretical considera-tions on the maximum possible difference between IA and CA predictions (Junghans et al. 2006). The chronic toxicity (ErC10) of four different mixtures tested in cyanobacteria and L. minor was also pre-dictable by CA with a less than 3-fold deviation and tended to be rather overestimated than underesti-mated.
It was a general pattern found in all five test species that the compliance between predicted and ob-served toxicity was consistently better for median effect levels (EC50) than for lower effect levels (EC10 and EC20). One possible explanation is that non-additive interactions are more present at lower effect levels, independently of the mixture components and test species. The observation that apparently an-tagonistic interactions dominated at low effect levels, may point at compensation reactions occurring in the chronically exposed organisms, e.g. the induction of detoxifying enzymes by one or several com-pounds with these enzymes in turn eliminating not only the inducing but also the other substances. Such a hypothesis of underlying toxicokinetic mechanisms would clearly need more experimental evi-dence as confirmation. Another possible explanation of greater deviation at lower effect levels relates to the simple and well-known mathematical problem of fitting particularly the lower effect part of a concentration-response curve (Scholze et al. 2001, Chapman 2015). A good fit is often only achieved when sufficient data points support the curve in this part. Since it was the aim of the tests to produce full concentration-response curves, it was often not possible to devote enough concentration levels to the lower effect part although the number of concentration levels was already increased in compari-son to standard tests (mostly seven instead of five levels). The trade-off between the objective of full concentration-response curves and good support of the lower effect part was particularly present in the case of algae, where the two response variables yield and growth rate usually show quite different sensitivities. This explains the greater deviation between observed and predicted low-effect-level tox-icity in algae compared to D. magna.
Overall, it can be concluded that the toxicity for key chronic endpoints of primary producers and crus-taceans used in the environmental risk assessment of human pharmaceuticals can be predicted by CA with less than 3-fold underestimation. A recent study of Watanabe et al. (2016) investigated the tox-icity of 10 wastewater-born substances in green algae, Ceriodaphnia dubia and fish embryos, and also concluded that low-effect level(sub)chronic endpoints can be sufficiently well predicted by CA. Accept-ing an up to 3-fold under- or overestimation as acceptable appears also realistic and pragmatic in view of the fact that in a typical regulatory setting the input data for a mixture prediction will come from aquatic toxicity tests with various species conducted at different laboratories.

Joint effects of pharmaceuticals and chemicals regulated under REACH
101
7.5.2 Evidence for synergistic interaction
The only exception from the general evidence for CA-predictability of mixture toxicity were some, but not all mixtures tested in primary producers that contained sulfamethoxazole. In L. minor, a 6-fold un-derestimation of toxicity was found for the key endpoint ErC10, and at least 4-fold underestimation for other endpoints in mixture 4 (CONST), which contained only sulfamethoxazole and trimethoprim (at a ratio of 1:191 w/w). In contrast, good agreement (2.2-fold overestimation of toxicity) was found in L. minor for mixture 3, which contained sulfamethoxazole and trimethoprim at the same mass ratio as in mixture 4 plus seven other compounds, including one more antibiotic. The CA-predicted mixture tox-icity is the harmonic mean of the toxicity of the mixture components weighted by their proportions in the mixture, and extreme values (i.e., those due to synergistic enhancement) are therefore averaged. This averaging effect increases and leads to better agreement with the CA-prediction with an increas-ing number of considered mixture components. This thought of synergistic interactions being levelled out in multiple component mixtures was termed the ‘funnel hypothesis’ (Warne & Hawker 1995). As-suming a synergizing effect of sulfamethoxazole and trimethoprim in mixture 3 resulted in a lower predicted ErC10 and, hence, in a stronger overestimation of mixture toxicity by CA. Mixture toxicity was then 4.8-fold overestimated (MDR of 0.21). The difference to the 6-fold synergizing effect of two com-ponents illustrates the averaging effect. The funnel hypothesis, hence, does not explain the lack of syn-ergism in mixture 3 despite the evidence for synergism in mixture 4, because there was no underesti-mation of toxicity but already slight overestimation in mixture 3 without consideration of synergistic enhancement.
In the cyanobacterium S. leopoliensis, mixture 1 consisting of only sulfamethoxazole and trimethoprim at a mass ratio if 5:1 exhibited synergistic effects (MDR of about 7 for the key endpoint ErC10), but only in dependence on assumptions about the single-substance concentration response curve of sulfameth-oxazole. Indication for (lower) synergism was also found in mixture 2 that contained sulfamethoxazole but not trimethoprim. Here, the key endpoint exhibited greatest compliance between prediction and observation (only 3-fold deviation), while other endpoints, particularly yield, had MDR values as high as 8.4. In contrast, effects on yield of A. flos-aquae were well predicted by CA, while effects on growth rate were more than 4-fold underestimated for mixture 3, which contained sulfamethoxazole and tri-methoprim at a mass ratio of 530:1. Hence, there was an overall repeated indication for synergistic in-teraction of sulfamethoxazole and trimethoprim in primary producers. Yet, the pattern of mixture tox-icity underestimation by CA was not consistent across effects levels, response variables, and species. Mixture 1 and 2 with S. leopoliensis demonstrated that a considerable part of the apparent synergism can be explained by the non-monotonous concentration-response curve of sulfamethoxazole that was observed in both tested cyanobacteria. Statistical issues such as decisions on the type of model to be fitted to the data determined whether a synergistic interaction was indicated or not.
There are several aspects that support the finding of “true” synergism of sulfamethoxazole and trime-thoprim in primary producers:
► Some calculated MDR values are clearly above 2 and reach up to 8.4. ► Most tested mixtures with sulfamethoxazole and trimethoprim showed indication for synergism at
least for some endpoints, although not always the key endpoint ► Indication for synergism in another primary producer (green algae) is supported by literature data
with a MDR of 2.4 (Yang et al. 2008). ► Synergistic interaction is known for this antibiotic combination in laboratory tests, and the phar-
macological MoA of the two antibiotics (inhibition of different enzymes in the same biochemical pathway) is among those proposed as mechanism of synergistic interaction (Spurgeon et al. 2010).
Yet, there are also a number of arguments that speak against “true” synergism:

Joint effects of pharmaceuticals and chemicals regulated under REACH
102
► The degree of observed synergism would be relatively small, with consistently less than 10-fold enhancement compared to concentration-additive toxicity.
► It remains open whether the pharmacological MoA is indeed linked to synergism and if so, whether this MoA is also exhibited and affected in all primary producers tested here.
► There was one mixture with sulfamethoxazole and trimethoprim that showed no synergism at the key endpoint and another mixture that indicated slight synergism (MDR of 3) in a mixture with sulfamethoxazole, but without trimethoprim. This pattern is hard to explain, particularly when as-suming the MoA of the two antibiotics as mechanistic explanation for the synergism.
► A considerable part of the deviation from the predicted toxicity can be explained by the unusual concentration-response curve of sulfamethoxazole. The differences in evidence for synergism among endpoints reflect this and may raise doubts, meaning that the indication for synergism is rather an artefact resulting from curve-fitting problems and sensitivity of response variables.
► Low, if any synergism in another primary producer (green algae) is indicated by literature data with a MDR of <2 (Eguchi et al. 2004).
► Indication for synergism may be due to a change in sensitivity as the single-substance and mixture tests were not conducted in parallel and sensitivity of S. leopoliensis may have changed between the tests.
► Dissipation of sulfamethoxazole in the mixture test with L. minor could not be fully ruled out as ex-planation since no measurements just before water ex-change was conducted. Yet, in single-sub-stance tests with cyanobacteria, sulfamethoxazole as well as trimethoprim did not show dissipa-tion during 3-day exposure.
A recent publication (Marx et al. 2015) assumed a synergistic enhancement factor between 4.1 to 6.3 for mixtures of sulphonamides (such as sulfamethoxazole) and diamonipyrimidines (such as trime-thoprim), which agrees with the MDR values for such mixtures determined in some tests of the pre-sent study. However, the assumed factors of Marx et al. (2015) rely on the studies of Eguchi et al. (2004) and Yang et al. (2008) with low synergism (less than factor 3), and studies with V. fisheri and D. magna, i.e., no primary producers. A tendency for “a synergistic overall effect” of mixtures of antibiot-ics as proposed by Marx et al. (2015) was not supported by the results of the present study, which in-cluded several cases where combined effects of various antibiotics were well predictable by CA. Over-all, the here provided evidence for a synergistic interaction of sulfamethoxazole and trimethoprim may not be deemed fully convincing, but certainly calls for further investigations to confirm any such claims.
7.5.3 Toxicity of WWTP effluent and impact on mixture toxicity predictions
WWTP effluent did not notably impact the predictability of mixture toxicity. The MDR values differed in only one of the three algal growth inhibition tests in absence and presence of wastewater, though only within a range of factor 3 deviation between prediction and observation. In L. minor and D. magna, no influence of wastewater presence on the MDR was observed at all. Only in cyanobacteria (mixture 3 in A. flos-aquae, mostly antibiotics at an equipotent ratio) the concentration-response curves significantly differed in presence and absence of WWTP effluent. In this case, the effluent alone had also a negative impact as demonstrated in the significant difference between the two controls. In all other species, the WWTP effluent showed no negative influence on the test organism’s perfor-mance, and an enhancement of reproduction of D. magna. The absence of effects on most test organ-isms is in accordance with other studies exposing these and other organisms chronically toward WWTP effluent. If impacts were observed such as in Schlüter-Vorberg et al. (submitted), they could be traced back to classical water quality parameters (specifically ammonium and nitrite concentrations) rather than to micro-pollutants. The here observed enhanced reproduction of D. magna under the in-fluence of WWTP effluent most likely relates to the improved food conditions due to the presence of bacteria, an additional food resource for the filter-feeder D. magna.

Joint effects of pharmaceuticals and chemicals regulated under REACH
103
Cyanobacteria were an exemption from the observed non-toxicity of WWTP effluent. In order to evalu-ate whether micro-pollutants in the effluent were responsible for this effect, the TU of each test sub-stances measured in the effluent sample and the resulting STU were calculated (Table 42). The result-ing STU is factor 26 below 1 (i.e. an effect of 10%), which indicates that these background concentra-tions were not the reason for the observed significant growth inhibition of A. flos-aquae in the control with effluent background. This holds also true if a synergistic interaction of sulfamethoxazole and tri-methoprim (enhancement by factor 6) is assumed. It remains open, however, whether other micro-pollutants in the effluent sample were present at concentrations toxic to cyanobacteria.
Table 42: Toxicity estimate for A. flos-aquae and measured concentrations of test substances in WWTP effluent together with resulting toxic units and summed toxic units in the test solutions
Test substance ErC10 (mg/l) Measured concen-tration in effluent
(µg/l)
Toxic Unit in test so-lution (50% effluent)
Toxic Unit in test so-lution (50% effluent) assuming synergism
Sulfamethoxazole 36.6 0.2 0.000003 0.000024
Trimethoprim 69.4 0.087 0.000001
Clarithromycin 0.0075 0.35 0.023240 0.023240
Erythromycin 0.102 0.077 0.000378 0.000378
Clindamycin 0.010 0.12 0.006024 0.006024
Amoxicillin 0.0488 0.013 0.000133 0.000133
Ciprofloxacin 0.0058 0.093 0.007962 0.007962
Linezolid 0.73 <0.01 <0.000001 <0.000001
Fluoxetine 0.384 <0.01 <0.000001 <0.000001
Metoprolol 95.1 0.69 0.000004 0.000004
Sum toxic units 0.0377 0.0047
Overall, it can be concluded from the testing with WWTP effluent background that the matrix of treated wastewater does not interfere with the measurement of toxicity and, hence, the predictability of mixture toxicity. This holds true even in the case of enhancing effects (seen in D. magna) and to a lesser degree also in case of toxic effects of the effluent itself – the MDR in the cyanobacteria test with effluent background indicated about 7-fold underestimation of toxicity compared to about 4.5-fold un-derestimation without effluent.
7.5.4 Predictability of the toxicity of mixtures varying in concentration or composition
The two mixtures tested in Lemna and Daphnia, respectively, with varying mixture exposure profiles over time differed in many respects, i.e. test species, mixture components, change in relative composi-tion versus fluctuation in total mixture concentration, and CA-predictability of the mixture toxicity in the parallel mixture with constant exposure profile. The results of the tests therefore provide some suggestions and a common conclusion can be drawn that need, however, confirmation in more such studies.
For L. minor, the compliance with CA for the mixture of two antibiotics with varying exposure of sulfa-methoxazole was best if peak concentrations were assumed. However, the similarity with the constant

Joint effects of pharmaceuticals and chemicals regulated under REACH
104
mixture tested in parallel was greatest if time-weighted average concentrations were assumed. This was due to the fact that the toxicity of the mixture with constant exposure was already about 6-fold underestimated, possibly related to synergistic interaction between the two mixture components sul-famethoxazole and trimethoprim (see Chapter 7.5.2). For D. magna, similarity in the mixture predic-tion of the key endpoint was greatest between the mixture with varying and the mixture with constant exposure profile if peak concentrations were assumed. Yet, the mixture toxicity of other endpoints such as population growth rate was in this case overestimated.
Overall, it can be concluded that for some ecotoxicological endpoints mixture toxicity predictions based on average concentrations may not be protective. The degree of toxicity underestimation can be substantial, as for example the EC10 for D. magna reproduction inhibition was more than 20-fold un-derestimated by CA assuming average mixture composition and concentration. This agrees with a pre-vious model-based study that found 4-fold underestimation of mortality in the crustacean Gammarus pulex when time-weighted average concentrations were assumed to represent the in fact fluctuating concentrations of the insecticide diazinon (Ashauer et al. 2011). When it comes to predicting effects of given environmental mixtures such as WWTP effluents, it may therefore be the more predictive and conservative approach to not use mean or median measured concentrations of the individual sub-stances in the effluents for the prediction, but rather rely on maximum estimates. This covered even for the apparent synergistic effects in the case of the sulfamethoxazole/trimethoprim mixture tested in L. minor. In order to exclude outliers (due e.g. to treatment failure or specific locations), an upper per-centile (e.g. the upper 90%) of the distribution of measured concentrations obtained in monitoring studies appears to be advisable.

Joint effects of pharmaceuticals and chemicals regulated under REACH
105
8 Consideration of mixtures in an environmental risk assessment Various approaches have been proposed for an assessment of mixtures in the environment that are in some way all based on a risk estimate, i.e. the quotient of an exposure- and an effect-related estimate. The approaches differ mainly in the used exposure- and effect-related estimates for the mixture. Usu-ally CA is implicitly or explicitly the basis for the effect-related mixture estimates, while IA or com-bined concepts may be suggested for higher tier assessments. Some publications describe conceptual frameworks for a mixture risk assessment that can be highly complex. Examples include the decision tree proposed by Price et al. (2012a) for environmental and human health mixture assessments. With the help of the decision tree, a given mixture scenario is identified either as being of concern already at the single-substance level, being of concern at the mixture level but not at the level of any of the indi-vidual substances, or of no concern for individual substances as well as the mixture. De Zwart & Posthuma (2005) dealt with mixtures at the multi-species level and propose the msPAF (multi-sub-stance potentially affected fraction of species) derived from species-sensitivity distributions as a tool. With regard to pharmaceuticals, however, this approach appears at least currently too data-demand-ing to be applicable. Oldenkamp et al. (2015) addressed this problem of data scarcity by deriving prob-abilistic msPAF estimates using Bayesian statistics. A proposal for deriving water quality standards for groups of similarly acting substances is also based on species-sensitivity distributions (Chèvre et al. 2008). The example for pharmaceuticals is represented by beta-blockers, the probably most data-rich group among human pharmaceuticals, but even this example suffers from underrepresentation partic-ularly of fish species. Backhaus & Faust (2012) proposed a tiered system that starts with the most con-servative and least data-demanding approach (PEC/PNEC summation) and elevates to more sophisti-cated approaches if risks cannot be excluded at lower tiers. More examples of conceptual approaches specifically with regard to REACH are summarized and described in a recent UBA report (Bunke et al. 2014).
Conceptually different approaches will be discussed in the following and illustrated using the results of the here experimentally investigated test substances and mixtures thereof. Where available, examples from the literature will be integrated in this illustration. The following three subchapters take up the idea of a tiered framework, with refinements of the assessment being triggered by indication of possi-ble risk and being limited by data availability (e.g. Backhaus & Faust 2012): starting with the PEC/PNEC summation as the most conservative mixture risk assessment concept, continuing with the replacement of the PEC by MEC values (i.e., increasing realism at the exposure side), and finally turn-ing to the TU approach as the one closest to applying the CA concept. The next sub-chapters address two specific aspects: mixture risk assessment with regard to Environmental Quality Standards (EQS) and restricting the assessment to the toxicity dominating substances. Finally, the mixture assessment factor (MAF) as a fundamentally different approach is discussed, followed by an outlook.
8.1 PEC/PNEC summation The summation of risk quotients such as the PEC/PNEC ratio
𝑃𝑃𝐸𝐸𝐶𝐶𝑚𝑚𝑖𝑖𝑥𝑥𝑃𝑃𝑃𝑃𝐸𝐸𝐶𝐶𝑚𝑚𝑖𝑖𝑥𝑥
= �𝑃𝑃𝐸𝐸𝐶𝐶𝑖𝑖𝑃𝑃𝑃𝑃𝐸𝐸𝐶𝐶𝑖𝑖
= �𝑃𝑃𝐸𝐸𝐶𝐶𝑖𝑖
𝑒𝑒𝑝𝑝𝑚𝑚𝑝𝑝𝑒𝑒𝑚𝑚𝑒𝑒(𝑝𝑝𝑡𝑡𝑡𝑡𝑝𝑝𝑝𝑝𝑝𝑝𝑝𝑝𝑡𝑡 𝑝𝑝𝑒𝑒𝑝𝑝𝑝𝑝𝑒𝑒𝑒𝑒𝑝𝑝𝑝𝑝𝑖𝑖 𝑒𝑒𝑎𝑎𝑎𝑎𝑒𝑒𝑝𝑝,𝑝𝑝𝑒𝑒𝑝𝑝ℎ𝑚𝑚𝑝𝑝𝑒𝑒,𝑓𝑓𝑝𝑝𝑒𝑒ℎ) ∗ 𝐴𝐴𝐴𝐴
represents a simple and pragmatic approach for a mixture risk assessment that has been proposed for different regulatory frameworks (e.g. ECHA 2014, Frische et al. 2014, Backhaus 2016). It is important to note that while this approach may resemble the CA concept, it is fundamentally different unless the PNEC values are derived for all substances i based on the very same endpoint and with the same as-sessment factor (AF) as explained in detail in Backhaus & Faust (2012). This will in most circum-stances not be the case, and renders the PEC/PNEC summation a generally more conservative ap-proach than applying the CA concept separately for defined endpoints or at least separately for taxo-nomic or trophic levels (as in the TU approach, see below). For this reason, PEC/PNEC summation may

Joint effects of pharmaceuticals and chemicals regulated under REACH
106
serve as an initial, first tier or screening step that should be followed by less conservative approaches if a mixture risk cannot be excluded. As input data, the PEC and PNEC values of all mixture components are required. Hence, the mixture composition must be clearly defined in terms of component identity and concentrations. The PEC/PNEC approach was applied the test substances of the present study (Ta-ble 43).
Table 43: PEC/PNEC ratios derived for the individual test substances and the mixtures
Test substance Taxonomic group relevant for PNEC
PNEC (µg/l) PECini (µg/l) PECini / PNEC
Fluconazole macrophyte 9.46 1.0. 0.11
Climbazole macrophyte 0.16 n.a. n.a.
Propiconazole green algae 1.60 n.a. n.a.
Sulfamethoxazole cyanobacteria 0.59 10.00 16.95
Trimethoprim cyanobacteria 310.00 2.00 0.01
Clarithromycin cyanobacteria 0.21 5.00 23.81
Erythromycin cyanobacteria 0.20 10.00 50.00
Clindamycin cyanobacteria 0.10 9.00 90.00
Amoxicillin cyanobacteria 0.08 5.00 62.50
Ciprofloxacin cyanobacteria 0.58 5.00 8.62
Linezolid green algae 3.60 6.00 1.67
Fenofibric acid * invertebrate 0.8 0.88 1.10
Fluoxetine green algae 0.1 0.10 1.00
Amlodipine green algae 3.4 0.03 0.01
Metoprolol invertebrate 610 0.75 0.001
TCPP invertebrate 28.7 n.a. n.a.
5-Methylbenzotriazole invertebrate 100.0 n.a. n.a.
Methylparaben invertebrate 58.4 n.a. n.a.
Sum for mixture of all 13 substances with data 255.92
Sum for mixture of all 8 antibiotics 253.55
* DDD for fenofibrate (the pro-drug of fenofibric acid) used; n.a.: not publicly available
PNEC values for the test substances have been derived in Chapter 6.5 and PEC values in Chapter 3.6.1, as far as possible. For most of the assessable test compounds, the individual PECini/PNEC ratios are above 1, i.e. indicate that a risk cannot be excluded. Risk at the single-substance level was particularly indicated for all of the antibiotics except trimethoprim. Consequently, the mixture assessment comes to the same conclusion. Since the PECini estimation is based on a number of worst-case assumptions
Joint effects of pharmaceuticals and chemicals regulated under REACH
107
(no metabolisation in the patient, no removal in the sewer system or the WWTP, and treatment of 1% of the human population), the exposure estimates of the individual substances would first warrant re-finement in accordance with the EMEA guideline.
In a recent study, the PEC/PNEC approach was applied to hospital wastewater (Escher et al. 2011) us-ing modelled PEC values that accounted for actual usage in the hospital, metabolisation in patients, and in various scenarios also for removal in the sewer system or WWTP. The PNEC values in that study were derived from acute toxicity data (more than 80% were predicted by QSAR models) apply-ing an AF of 1000. Since green algae were found to be most sensitive for the assessed top-100 usage pharmaceuticals of the hospital, the PNEC was always based on this taxonomic group. There were eleven substances in common with the present study (amoxicillin, ciprofloxacin, clarithromycin, sulfa-methoxazole, trimethoprim, clindamycin, fluconazole, erythromycin, amlodipine, fluoxetine, and metoprolol). The PEC estimates for the same substance differed among the two studies by up to factor 10. Yet, only three of the ten common substances achieved in the study of Escher et al. (2011) an indi-vidual risk quotient above 0.01 (amoxicillin, clarithromycin, and fluoxetine), but none of them was above 1. This considerable difference to the present study must be rooted in the PNEC values. At least for the antibiotics, this discrepancy can be easily explained as only green algae but not cyanobacteria were taken into consideration by Escher et al (2011). Since cyanobacteria are much more sensitive to antibiotics than green algae (which is why the guideline requests cyanobacteria data for antibiotics), this leads to much higher PNEC estimates and lower risk quotients for antibiotics than in the present study. The reason for the discrepancies regarding the other substances may relate to the use of (mod-elled) acute toxicity data with a high AF in contrast to the here used chronic toxicity data with an AF ≤100. This comparison illustrates that the selection of toxicity endpoints has a great impact on the out-come of risk-ranking of substances within a mixture assessment and on the mixture assessment itself. In the study of Escher et al. (2011), antibiotics were not identified as the risk-dominating substances in the hospital wastewater.
8.2 MEC instead of PEC Due to the worst-case assumptions, PECini values tend to be higher than actual measured concentra-tions in WWTP effluents and the receiving surface waters. Yet, the difference between PEC and MEC is substance-specific as illustrated by the test substances of the present study: PECini values were be-tween 5.3-fold (amlodipine) to 10,000-fold (amoxicillin) higher than derived MEC values (including a dilution factor of 10 similar to the derivation of PEC values). Using measured instead of predicted con-centrations increases the realism of the risk assessment and allows including the non-pharmaceuticals among the test substances for which no PEC estimates were publicly available. If only pharmaceuticals were to be considered here, a refinement of the PECini values, e.g. based on actual consumption data, metabolisation, and/or elimination in WWTPs, would be the logical next step. However, in order to in-clude also the substances regulated in other regulatory frameworks, MEC values are used here instead of refined PEC values.
The testing of mixtures with varying concentrations (mixture 4) indicated that median concentrations may not sufficiently well predict mixture effect. Therefore, the median as well as the 90% percentile MEC values were related here to the PNEC values of the individual substances (Table 44). The individ-ual ratios were summed to obtain a risk estimate for the mixture, similar to the PEC/PNEC summation approach.
Based on median MEC values, all substances had a ratio below 1, indicating no unacceptable risk. The sum of the risk quotients of the 18 substances was also below 1, indicating no unacceptable risk for the mixture. When using the 90% percentile MEC, individual risk quotients were again all below 1, but the sum for all 18 substances was above 1. Hence, a risk cannot be excluded for this scenario in a mixture risk assessment, although no risk was indicated in a single-substance assessment. Four substances

Joint effects of pharmaceuticals and chemicals regulated under REACH
108
contributed each more than 10% to the overall mixture risk in this scenario and could therefore be la-belled as the ‘risk drivers’: climbazole as well as the three antibiotics clarithromycin, erythromycin and clindamycin. The summed risk quotient for the mixture of the antibiotics alone indicated no risk, however.
Table 44: MEC/PNEC ratios derived for the individual test substances and the mixtures
Test substance PNEC (µg/l)
Median MEC (µg/l)
90% percen-tile MEC (µg/l)
Median MEC/PNEC
90% percen-tile MEC/PNEC
Fluconazole 9.46 0.0044 0.0086 0.0005 0.0009
Climbazole 0.16 0.0150 0.0368 0.0938 0.2300
Propiconazole 1.60 0.0012 0.0042 0.0008 0.0026
Sulfamethoxazole 0.59 0.0150 0.0696 0.0254 0.1180
Trimethoprim 310.00 0.0230 0.1000 0.0001 0.0003
Clarithromycin 0.21 0.0100 0.0480 0.0476 0.2286
Erythromycin 0.20 0.0064 0.0272 0.0320 0.1360
Clindamycin 0.10 0.0019 0.0208 0.0190 0.2080
Amoxicillin 0.08 0.0005 0.0069 0.0063 0.0863
Ciprofloxacin 0.58 0.0073 0.0486 0.0126 0.0838
Linezolid 3.60 0 0.0019 <0.0001 0.0005
Fenofibric acid 0.8 0.0110 0.0255 0.0138 0.0319
Fluoxetine 0.1 0.0035 0.0078 0.0350 0.0780
Amlodipine 3.4 0.0047 0.0074 0.0014 0.0022
Metoprolol 610 0.1100 0.2220 0.0002 0.0004
TCPP 28.7 0.0740 0.2300 0.0026 0.0080
5-Methylbenzotriazole 100.0 0.0920 0.1800 0.0009 0.0018
Methylparaben 58.4 0 0.0006 <0.0001 <0.0001
Sum for mixture of all 18 test substances 0.2917 1.2172
Sum for mixture of all 8 antibiotics 0.0179 0.1077
MEC: measured environmental concentration, derived from measured WWTP effluent concentration in Table 15 as-suming a dilution factor of 10
Other studies also applied the MEC/PNEC summation approach (e.g. Backhaus & Karlsson 2014, Tho-maidi et al. 2015). Backhaus & Karlsson (2014) applied the MEC/PNEC summation approach to seven samples of WWTP effluents for which measured data on 26 pharmaceuticals were available (that rep-resent thereby single time points and not in some way averaged measured concentrations). Among

Joint effects of pharmaceuticals and chemicals regulated under REACH
109
those, 4 were identical with the present study (ciprofloxacin, metoprolol, sulfamethoxazole, and trime-thoprim). The PNEC values were derived from acute toxicity data (including many QSAR-predicted and in vitro test-based estimates) applying an AF of 1000. In contrast to Escher et al. (2011), data for cya-nobacteria were included. The summed risk quotients of the 26 compounds exceeded 10 in all 7 efflu-ent scenarios, i.e. would exceed 1 if a dilution factor of 10 was additionally applied. Hence, a risk for the mixture could not be excluded in any case. It remains unclear, however, if individual risk quotients for any of the substances exceeded already the threshold of 10 (not including dilution in surface wa-ter).
8.3 Approaches based on toxic units The TU approach derives a toxicity estimate for the mixture separately for each taxonomic group or trophic level (e.g. algae, Daphnia, and fish) by summing the toxic units of the individual substances that are based on one specified tropic or taxonomic level. Thereafter, an assessment factor is applied (Backhaus & Faust 2012, Frische et al. 2014). The stricter the endpoint (including taxonomic group or trophic level) is defined, the more closely related is the TU approach to the original CA concept. Here, the sum of toxic units (STU) was calculated separately for different species (P. subcapitata, A. flos-aq-uae, L. minor and D. magna) as
𝑆𝑆𝑆𝑆𝑆𝑆𝑠𝑠𝑠𝑠𝑠𝑠𝑠𝑠𝑖𝑖𝑠𝑠𝑠𝑠 = �𝑀𝑀𝐸𝐸𝐶𝐶𝑖𝑖
𝐸𝐸𝐶𝐶10,𝑖𝑖 ,𝑠𝑠𝑠𝑠𝑠𝑠𝑠𝑠𝑖𝑖𝑠𝑠𝑠𝑠
Primary producers could have been lumped into one trophic group, but not all substances had been tested with each primary producer.
No assessment factor was applied, because it would be a different aspect to discuss which AF should be applied to the mixture if different AF were to be used for deriving PNECs for the individual sub-stances (as in the present study). Instead, the distance from the resulting mixture risk quotient from 1 is discussed in view of the ‘room’ for an additional assessment factor. This distance can be evaluated by comparing the STU directly to the AF. Given that the condition for ‘acceptable mixture risk’ is that the risk quotient of the mixture (RQmix) is below 1, the following applies: 𝑆𝑆𝑆𝑆𝑆𝑆𝑠𝑠𝑠𝑠𝑠𝑠𝑠𝑠𝑖𝑖𝑠𝑠𝑠𝑠 ∗ 𝐴𝐴𝐴𝐴𝑚𝑚𝑖𝑖𝑥𝑥 = 𝑀𝑀𝑅𝑅𝑚𝑚𝑖𝑖𝑥𝑥 with
𝑀𝑀𝑅𝑅𝑚𝑚𝑖𝑖𝑥𝑥 < 1 results in the condition
𝑆𝑆𝑆𝑆𝑆𝑆𝑠𝑠𝑠𝑠𝑠𝑠𝑠𝑠𝑖𝑖𝑠𝑠𝑠𝑠 <1
𝐴𝐴𝐴𝐴𝑚𝑚𝑖𝑖𝑥𝑥
Table 45 summarizes the STU calculated for the four species for which EC10 values were available for the nine or ten substances that constituted mixture 3 in each case. Note that mixture 3 composition is different for the different species. Since not every species was tested with every test substance, the TU approach cannot be conducted here with the mixture of all 18 mixture test substances in direct anal-ogy to the PEC/PNEC approach. STU was calculated with either the median or the 90% percentile MEC, and was in all cases and for all species below 0.1. Hence, all STU allow for an AF of 10 as the resulting value would still be below 1. The TU approach thereby results in the finding of ‘acceptable risk’ for the mixture scenario 3 based on (conservative) MEC values. In all cases, except cyanobacteria, the STU would allow for an AF of 50 (i.e., result in a value still below 1), which may be seen more appropriate given that no TU approach for fish was possible due to lack of data. Only in the case of cyanobacteria, an AF of 50 would result in a value greater than 1 (0.034 * 50 = 1.7). Hence, this indicates that a risk of the mixture of the ten substances (mostly antibiotics) composing mixture 3 for cyanobacteria cannot be excluded.

Joint effects of pharmaceuticals and chemicals regulated under REACH
110
Table 45: Mixture risk assessment for the nine or ten substances for which chronic toxicity data were available in the respective four test species
Test substance A. flos-aquae P. subcapitata L. minor D. magna
STU with median MEC 0.0063 0.0036 0.0030 0.0004
STU with 90% MEC 0.034 0.008 0.012 0.001
STU with 90% MEC and AF of 10 0.34 0.08 0.12 0.01
STU with 90% MEC and AF of 50 1.7 0.4 0.6 0.5
MCR median MEC (90% MEC) 1.32 (1.48) 1.02 (1.02) 1.59 (1.70) 1.40 (1.42)
Sum of Toxic Units (STU) were calculated for the mixture 3, i .e. the mixture with all substances tested in the respective species (see Table 17) assuming either median or 90% percentile MEC for each mixture component; MCR: Maximum Cumulative Ration according to Price & Han 2011, Price et al. 2012a
In addition, the Maximum Cumulative Ratio (MCR) was calculated according to Price & Han (2011) and Price et al. (2012a) as the STU divided by the greatest individual TU contributing to that STU. The MCR provides information on the additional risk due to the mixture toxicity in comparison to the single ‘most risky’ mixture component. In the example of the mixture 3 components at their MECs, the MCR ranged from 1.02 to 1.59 for the median MEC and from 1.02 to 1.70 for the 90% percentile MEC. These MCR values reflect that the toxicity of mixture 3 toward P. subcapitata is dominated by the lowest number of compounds (actually just one, fluoxetine), while that for L. minor is distributed most equally among the components (dominating substances are climbazole and ciprofloxacin).
The results of the TU approach and the MEC/PNEC summation approach hardly differed in the study of Backhaus & Karlsson (2014), which was due to the fact that algae were in most cases the trophic level used to derive the PNEC. Ginebreda et al. (2014) represents another study that applied the TU approach to several surface water samples, and found that all STU for algae and Daphnia were below 1. Yet, one was above 0.1, thereby not even allowing for an AF of 10 for this mixture risk assessment based on acute toxicity data. Dominating substances were mostly pesticides, i.e. insecticides and herbi-cides for Daphnia and algae, respectively.
8.4 Acute versus chronic toxicity estimates in the mixture risk assessment Many studies relied on acute endpoints or even QSAR-derived estimates for acute toxicity in a (prelim-inary) mixture assessment or prioritisation approach (e.g. Escher et al. 2011, Santos et al. 2013, Back-haus & Karlsson 2014, Ginebreda et al. 2014). This was due to unavailability of chronic data for all the considered substances, and the authors generally acknowledged that chronic endpoints should be used according to current regulation for pharmaceuticals. The acute toxicity data were mostly used with high assessment factors (1000). The resulting risk quotients for single substances as well as mix-tures may therefore considerably differ from PNECs derived on chronic toxicity data with an assess-ment factor of 10.
Escher et al. (2011) state explicitly that the AF of 1000 accounts for an acute-to-chronic ratio of 100, which “should be protective for most toxic MoA except endocrine disruption”. Yet, a comprehensive study on 102 pharmaceuticals demonstrated that PNECs derived on acute toxicity data are on average, but not always, protective for PNECs derived on chronic data (Vestel et al. 2016). The underlying large acute-to-chronic ratio may indicate that a specific mode of toxicity in non-target organisms occurs in fact not only for hormones. One key pattern is that algae are identified as most sensitive trophic level when PNECs were based on acute toxicity data (Escher et al. 2011, Backhaus & Karlsson 2014). This is

Joint effects of pharmaceuticals and chemicals regulated under REACH
111
most likely simply due to the fact that the acute toxicity estimate for algae (EC50 growth inhibition) is rather a (sub)chronic endpoint in contrast to EC50 estimates for Daphnia and fish being based on sur-vival. In contrast, only 22 out of 87 chronic PNECs were based on algae (either green algae or cyano-bacteria) in the study of Vestel et al. (2016).
Therefore, a risk assessment based on acute toxicity data with a high AF of 1000 may be on average as protective as a risk assessment based on chronic data. Yet, it appears not suitable to identify drivers of mixture risk with regard to chronic effects in the aquatic environment (particularly not regarding other organisms than algae). Given this discrepancy and the fact that the ERA for human pharmaceuti-cals should be based on chronic toxicity data (EMEA 2006), this should clearly warn against using PEC/PNEC mixture approaches based on acute toxicity data for the identification and prioritization of environmental mixtures and the drivers of mixture toxicity.
8.5 Approaches with regard to EQS Within the above described approaches, EQS values can be used instead of PEC or MEC values when summing risk quotients for a mixture assessment as exercised for example by Price et al. (2012b) and Chèvre et al. (2008). Calamari & Vighi (1992) already proposed the TU approach for substances with similar MoA, using water quality standards as concentration estimate in the TU equation. The ap-proach can also be restricted to a mixture assessment within trophic groups, if the information on which endpoints the established EQS was based is kept along the with actual values (Junghans et al. 2013). An experimental approach to assess the protectiveness of EQS values under the premises of joint toxicity represents the study of Carvalho et al. (2014). Mixtures of 14 or 19 substances with each substance present at its established or proposed x-fold EQS were tested in a large range of test organ-isms. Effects on some biomarkers were observed at 0.2 to 1-fold EQS mixtures, i.e. where each compo-nent was below or at its (proposed) EQS. These biomarker responses were photosystem II quantum yield inhibition in miniaturized algae tests, relative prevalence of algae pigments in a marine micro-cosm study, and gene expression (as most sensitive biomarker endpoint) in the bacterium Escherichia coli and the nematode Caenorhabditis elegans. Effects on apical endpoints typically used in the ERA oc-curred at 10-fold EQS mixtures (survival in D. magna) and at 3 to14-fold EQS mixtures (growth rate in freshwater algae). Sublethal effects in fish embryos (such as malformation) appeared to be the most sensitive among all tested whole-organism endpoints and occurred at a 1-fold EQS mixture concentra-tion.
All these approaches of applying mixture toxicity in the context of water quality standards addressed defined mixtures, either actual environmental samples or generic mixtures produced in the laboratory. There is no concept so far for introducing the mixture consideration into the actual derivation of EQS beyond the case where mixture released as such shall be regulated. Faust & Backhaus (2015) discuss this aspect specifically in a Perspectives column of ET&C. The knowledge on the composition of envi-ronmental mixtures and the drivers of mixture toxicity therein is key to a mixture assessment. That knowledge would allow moving from identification of ‘priority substances’ to ‘priority mixtures’.
8.6 Restrict assessment to dominating substance(s) Several proposals mention or provide detailed suggestions on how and under which conditions a mix-ture assessment can be reduced to an assessment of one or a few of the components (Groten et al. 2001, CEFIC 2009, Price et al. 2012a, ECHA 2014, Bunke et al. 2014, Frische et al. 2014, CEFIC/VCI 2016). This was motivated by the finding that often only a few substances dominate the toxicity of a given mixture. As an example, in the study of Backhaus & Karlsson (2014), the top-10 API explained >95% of STU in all mixtures and for all three acute toxicity endpoints. For the most sensitive endpoint, algae, just one substance (ofloxacin) contributed more than 50% to the STU in all samples.

Joint effects of pharmaceuticals and chemicals regulated under REACH
112
Restricting the risk assessment to the dominating substances is actually simple once they are known. Yet, it is impossible to surely identify the dominating substances without actually conducting the mix-ture assessment first.
8.7 Mixture assessment factor One key pattern is that the above discussed conceptual mixture assessment approaches addressed and were applied to defined mixtures – usually actual samples of wastewater or surface water. Hence, mix-ture risk assessment is thereby applied retrospectively to evaluate mixture risks and to identify the drivers of risks in a given mixture. This is a useful approach in elucidating causes for environmental deterioration and develop risk management strategies on a local scale (e.g., an individual WWTP). For a prospective risk assessment, however, approaches relying on an a priori clear identification of the mixture appear to be of limited suitability, at least at the moment. The mixture assessment factor (MAF) may represent a potential solution for a prospective mixture risk assessment. The MAF would be applied in every single-substance assessment as an additional assessment factor to account for ‘mixture uncertainty’ (Backhaus 2016). Applying the same MAF to each substance would mean to ‘blame’ each substance in the same way for potential additional mixture risk, independently if that spe-cific substance is indeed the driver of or contributes at all to mixture risk in any environmental sce-nario. Therefore, this step of ‘blaming all’ has been seen as too far reaching in consequences without any further justification in other discussions of the MAF as potential mixture risk assessment solution (ECETOC 2001, Bunke et al. 2014).
In addition to the arguments regarding proper justification for using a MAF in a prospective risk as-sessment of all substances, the MAF approach moves the problem from defining the mixture to the problem of defining the appropriate size of a MAF. It has been stated elsewhere (see e.g. Price & Han 2011, Backhaus 2016) that a mixture of additively acting components can only be n-fold more toxic than the most toxic single mixture component with n being the number of mixture components. On the other hand, mixtures may occur where just one of the components is fully dominating the mixture tox-icity, resulting in a close to ‘1-fold’ higher (i.e. not increased) mixture toxicity. Hence, a general MAF applied in all single-substance assessments should be between 1 and n. Since n shall not be needed to be defined (this is the advantage of the MAF approach – no need to define the mixture composition), it appears necessary to achieve a ‘best guess’ for the factor by which mixture toxicity typically differs from single-substance toxicity. The upper limit, n, can be further narrowed down following the defini-tion of the MCR (Price & Han 2011). The MCR is the quotient of the mixture toxicity and the highest single-component toxicity. Hence, the mixture is MCR-fold more toxic than the most toxic single com-ponent, and at least MCR-fold more toxic than any of its components alone. Using the MCR as MAF in the single-substance assessment of all potential mixture components would safely account for addi-tional mixture toxicity, yet by the price for targeting all components equally. The MCR is identical to n in equipotent mixtures. Evidence from various mixture assessments, however, demonstrates that envi-ronmental mixtures consist usually of only few drivers, resulting in an MCR well below n. Groten et al. (2011) suggest considering the top-10 components, which was found to explain >95% of toxicity in samples investigated by Backhaus & Karlsson (2014). Closer inspection of the figures in this publica-tion suggests that already the top-5 components are sufficient to explain mixture toxicity. In agree-ment with this, the MCR did not exceed 5 in that study. The MCR of ecological endpoints in 559 mix-tures analysed in Price et al. (2012b) did not exceed 6, with only 3 samples showing an MCR above 5. The comprehensive study of Carvalho et al. (2014) did not enable derivation of MCR estimates as no information was given on the toxicity of the single substances with regard to the assessed endpoints. Yet, the x-fold EQS concentrations at which effects were observed allow concluding that a MAF of 5 for each single substance in the EQS derivation would have resulted in no observed effects below a 1-fold EQS mixture concentration, because the lowest concentration at which effects had been observed (gene expression) was 0.2-fold EQS. This MAF-enhanced mixture EQS would even be protective for the in vitro assay- and biomarker-based endpoints in that study although such endpoints shall generally

Joint effects of pharmaceuticals and chemicals regulated under REACH
113
not be used for the derivation of an EQS. Hence, the so far available studies addressing mixture assess-ment of real-world samples or EQS-based mixtures indicate that a MAF of 5 would be protective. The artificially composed mixtures assessed in the present project would all be ‘safe’ with a MAF 5, even for the most sensitive organism group, the cyanobacteria. Yet, it must be noted that the number of studies and real environmental mixtures assessed in a way that empirically support derivation of a MAF is still very limited.
8.8 Outlook Extensive monitoring and improvement of existing monitoring programs have been suggested by dif-ferent groups as essential step towards an environmental mixture risk assessment (Price et al. 2012a, Backhaus & Karlsson 2014, Gerbersdorf et al. 2015). Comprehensive and scientifically sound monitor-ing is expected to deliver information on the actual composition of mixtures of chemicals in the envi-ronment, which is one crucial piece of information lacking for a proper mixture risk assessment. Based on such monitoring data, at least probabilistic models about coincidental co-occurrence of micro-pol-lutants in WWTP effluents and receiving water bodies could be developed. This would be a step for-ward in defining ‘priority mixtures’, and it would allow deriving more empirical data on the MCR typi-cal for environmental samples and thereby inform the setting of the size of an appropriate protective, yet not unnecessarily over-protective MAF. A retrospective analysis of samples measured in often very comprehensive monitoring programmes may already enhance the knowledge on the typical size of an MCR. As a first step, for chemicals that are analytically determined in the samples of environmental monitoring programmes (chronic) toxicity data for the three trophic levels should be compiled (either from public resources or via agreed access to confidential data). In a second step, the sum of toxic units for individual samples would be derived based on the measured concentrations of all co-occurring substances and their individual toxicity. Similar to the approaches of Price et al. (2012) and Backhaus & Karlsson (2014), the MCR could then be calculated for a broad range of environmental samples. Based on the mixture toxicity investigations conducted in the present studies, it can be assumed that CA predictions would reflect rather well the toxicity of the mixtures (i.e., no actual mixture testing would be required). A systematic evaluation of monitoring results with regard to the statistical distri-bution of MECs could support the exposure side of such a comprehensive mixture assessment. The question if rather median or e.g. 90% percentile values from the MEC distribution should be employed in the risk assessment, cannot be answered straightforward based on the two varying-exposure sce-narios investigated in the present study. Yet, the evidence for underestimation of mixture risks if an assessment is based on averaged concentrations points at further research needs in this area.
The selection of analytes covered in monitoring programs is strongly determining the success of the above described attempts. In the planning of future monitoring programmes, focussing on well-known and/or suspected ‘relevant’ micro-pollutants would just reiterate what we already know, although with a better data set. It would not allow us to find the unexpected or so far overlooked problematic substances, but rather direct us towards a more detailed inspection of the tip of the iceberg (Daughton 2014). Gerbersdorf et al. (2015) recommend monitoring of indicator substances that are selected based on their biodegradability and water solubility. This is an approach suited to evaluate and com-pare improvements in wastewater treatment processes with regard to the elimination of micro-pollu-tants. Yet, such an exclusive focus on the exposure part of the risk would not enable the unbiased search for drivers of mixture risks in the environment. Escher et al. (2011) on the other hand recom-mend focussing on the effect part, i.e. a hazard-based prioritisation of micro-pollutants. Such a hazard-oriented prioritisation could be extended from toxicity to bioaccumulation and persistence potential and thereby cover a main regulatory concern. Yet again, a focus on only one part of the risk quotient would not enable an unbiased search for drivers of mixture risks. It would also carry the substantial risk of wasting resources on compounds that are actually not present in the aquatic environment, be-cause e.g. they are already well eliminated during wastewater treatment. Hence, any unbiased selec-tion of compounds for monitoring programs aiming to identify environmental mixture and mixture

Joint effects of pharmaceuticals and chemicals regulated under REACH
114
risk drivers should be based on a risk-driven prioritisation that is not limited a priori to substances with already available data. This holds true both for pharmaceuticals as well as for chemicals regulated under REACH. In order to include substances “without (sufficient) data”, prioritisation using (addition-ally) modelling tools may be a solution. For chemicals regulated under REACH, such modelling tools (e.g. the QSAR prediction tool box from the OECD) are already available. Since currently established QSAR models for aquatic toxicity were all developed based on data for neutral substances with non-specific modes of action, their applicability domain usually does not cover pharmaceuticals, which are often ionisable compounds with a potentially specific mode of toxic action in non-target organisms. Tools for predicting acute and chronic effects in aquatic standard test species are currently under de-velopment in the research project iPiE (‘Intelligence-led Assessment of Pharmaceuticals in the Envi-ronment’, www.i-pie.org) funded by a public-private partnership of the European Union and the phar-maceutical industry.
Due to the lack of chronic ecotoxicity data, applications of mixture risk assessment approach have so far relied on acute toxicity data (e.g. Backhaus & Karlsson 2014, Escher et al. 2011) or a mixture of acute and chronic data (Price et al. 2012b, Junghans et al. 2013). The problem of the scarcity of ecotox-icological data for pharmaceuticals and the unavailability of such proprietary data for public research may be solved by publicly available environmental risk assessments that relate to API, not to pharma-ceutical products. A recent initiative of the pharmaceutical industry towards an industry eco-phar-maco-stewardship program presented at an international conference in spring 2016 (Snape et al. 2016) would foster improvement on the effect part of an environmental risk assessment of mixtures of pharmaceuticals.
With regard to chemicals regulated under REACH, the confidentiality of PEC values to the scientific community hinders independent exemplary mixture toxicity assessment and an informed selection of candidates for monitoring. While chronic aquatic toxicity data may not always be available for these chemicals, extrapolations from acute to chronic effects using standard assessment factors appear more defendable than for pharmaceuticals given the usually non-specific narcotic mode of toxicity of the chemicals regulated under REACH. Substances that interfere with hormone systems of non-target or-ganisms (i.e. potential endocrine disruptors among the REACH-regulated chemicals and pharmaceuti-cals targeting hormone systems in patients) may be of particular concern as their effects alone as well as in mixtures are currently hardly predictable based on the results of standard acute or chronic aquatic toxicity tests.
Pharmaceuticals generally showed a greater contribution to the mixture risk than the REACH-regu-lated chemicals or the one biocide/pesticide included in the present study. Climbazole, which is regu-lated under REACH, represented an exception to this finding as it contributed a considerable part to the overall risk of the mixture of 18 components. Yet, in contrast to the typical chemicals regulated un-der REACH, climbazole as a fungicide has an intended highly specific mode of action that is likely re-lated to the high toxicity in non-target primary producers (Richter et al. 2013). Antibiotics and their mixtures were identified in the present study as the human pharmaceutical group with the greatest risk among those that were assessed. This is in agreement with some other studies addressing mix-tures of pharmaceuticals (e.g. Backhaus & Karlsson 2014). Among the antibiotics was also the only evi-dence for synergistic interactions. Hence, the effects of antibiotic residues in WWTP effluents and their joint effects in the environment appear to be of the greatest concern, and require further research and confirmation of synergistic interaction potential.

Joint effects of pharmaceuticals and chemicals regulated under REACH
115
9 References Adam AM (2010) Vorkommen und Bewertung von Pharmakarückständen im Berliner Gewässerkreislauf. Dissertation TU Berlin.
Ahting M, Berkner S, Blondzik K, Ebert I , Hein A, Jäger S, Matezki S, Pickl C, Wogram J (2012) Informationen zu Stoffen mit wahr-
scheinlicher ökotoxikologischer Gewässerrelevanz. Umweltbundesamt, Stand April 2012.
Al -Odaini NA, Zakaria MP, Yaziz MI, Surif S, Abdulghani M (2013) The occurrence of human pharmaceuticals in wastewater effluents
and surface water of Langat River and its tributaries, Malaysia. Int. J. Envi ron. An. Ch. 93, 245-264.
Al tenburger R, Backhaus T, Boedeker W, Faust M, Scholze M (2013) Simplifying complexity: mixture toxicity assessment in the last
20 years . Environ. Toxicol. Chem. 32, 1685-1687.
Al tenburger R, Greco WR (2009) Extrapolation concepts for dealing with multiple contamination in environmental contamination in
envi ronmental risk assessment. Integr. Envi ron. Assess. Manag. 5(1), 62-68.
Al tenburger R, Walter H, Grote M (2004) What contributes to the combined effect of a complex mixture? Environ. Sci. Technol. 38,
6353-6362.
Ando T, Nagase H, Eguchi K, Hi rooka T, Nakamura T, Miyamoto K, Hi rata K (2007) A novel method using cyanobacteria for ecotoxi-
ci ty test of veterinary antimicrobial agents. Environ. Toxicol. Chem. 26, 601-606.
Andreozzi R, Caprio V, Ciniglia C, de Champdore M, LoGiudice R, Marotta R, Zuccato E (2004) Antibiotics in the environment: occur-
rence in Italian STPs, fate, and preliminary assessment on algal toxicity of amoxicillin. Environ. Sci. Technol. 38, 6832-6838.
Andresen JA, Grundmann A, Bester K (2004) Organophosphorus flame retardants and plasticisers in surface waters. Sci. Total Envi-
ron. 332, 155-166.
ARW (2011) Results of a monitoring program of the Association of Waterworks a long river Rhine 2007 – 2011.
Ashauer R, Wittmer I, Stamm C, Escher BI (2011) Envi ronmental risk assessment of fluctuating diazinon concentrations in an urban
and agricultural catchment using toxicokinetic-toxicodynamic modelling. Environ. Sci Technol. 45, 9783-9792.
Ashton D, Hilton M, Thomas KV (2004) Investigating the envi ronmental transport of human pharmaceuticals to s treams in the
United Kingdom. Sci. Total Envi ron. 333, 167-184.
AWBR (2011) Results of a monitoring program of the Association of the Waterworks in the Lake Constance – Rhine region 2007 –
2011.
Backhaus T (2016) Envi ronmental risk assessment of pharmaceutical mixtures: demands, gaps, and possible bridges. The AAPS Jour-
na l 18 (4), 804-813.
Backhaus T, Faust M (2012) Predictive environmental risk assessment of chemical mixtures: a conceptual framework. Environ. Sci.
Technol. 46, 2564-2573.
Backhaus T, Karlsson M (2014) Screening level mixture ri sk assessment of pharmaceuticals in STP effluents. Water Res. 49, 157-165.
Backhaus T, Porsbring T, Arrhenius A, Brosche S, Johansson P, Blanck H (2011) Single-substance and mixture toxicity of five pharma-
ceuticals and personal care products to marine periphyton communities. Environ. Toxicol. Chem. 30, 2030-2040.
Batt AL, Bruce IB, Aga DS (2006) Eva luating the vulnerability of surface waters to antibiotic contamination from varying wastewater
treatment plant discharges. Environ. Poll. 142, 295-302.
Baumann M, Weiss K, Maletzki D, Schüssler W, Schudoma D, Kopf W, Kühnen U (2015) Aquatic toxicity of the macrolide antibiotic
clari thromycin and its metabolites. Chemosphere 120, 192-198.
Bekki H, Yamamoto K, Sone M, Homma T, Nakata M, Nohara M, Fukami K, Okuda S, Yamagishi S (2010) Efficacy of combination
therapy with telmisartan plus amlodipine in patients with poorly controlled hypertension. Oxid. Med. Cell. Longev. 3, 342-346.
Belden JB, Gilliom RJ, Lydy MJ (2007) How well can we predict the toxicity of pesticides mixtures to aquatic life? Integr. Envi ron.
Assess. Manag. 3, 364-372.
Bendz D, Paxeus NA, Ginn TR, Loge FJ (2005) Occurrence and fate of pharmaceutically active compounds in the environment, a case
s tudy: Hoje River in Sweden. J. Hazard. Mater. 122, 195-204.
Beni jts T, Lambert W, De Leenheer A (2004) Analysis of multiple endocrine disruptors in envi ronmental waters via wide-spectrum
sol id-phase extraction and dual-polarity ionization LC-ion trap-MS/MS. Anal. Chem. 76, 704-711.

Joint effects of pharmaceuticals and chemicals regulated under REACH
116
Bergmann A, Fohrmann R, Weber FA (2010) Zusammenstellung von Monitoringdaten zu Umweltkonzentrationen von Arzneimit-
teln. Abschlussbericht zum UBA-Forschungsvorhaben 360 14 013.
Bester K (2005) Comparison of TCPP concentrations in sludge and wastewater in a typical German sewage treatment plant compari-
son of sewage s ludge from 20 plants. J. Environ. Monit. 7, 509-513.
Blanco E, Casais MC, Mejuto MC, Cela R (2009) Combination of off-line solid-phase extraction and on-column sample s tacking for
sensitive determination of parabens and p-hydroxybenzoic acid in waters by non-aqueous capillary electrophoresis. Anal. Chim.
Acta 647, 104-111.
Bl i ss CI (1939) The toxicity of poisons applied jointly. Ann. Appl. Biol. 26, 585-615.
Bol tes K, Rosal R, Garcia-Calvo E (2012) Toxicity of mixtures of perfluorooctane sulphonic acid with chlorinated chemicals and l ipid
regulators. Chemosphere 86, 24-29.
Borgert CJ, Qui ll TF, McCarthy LS, Mason AM (2004) Can mode of action predict mixture toxicity for risk assessment? Toxicol. Appl.
Pharmacol. 201, 85-96.
Brock TCM, Al ix A, Brown CD, Capri E, Gottesbüren BFF, Heimbach F, Lythgo CM, Schulz R, Streloke M (Eds.) (2010) Linking Aquatic
Exposure and Effects – Risk Assessment of Pesticides. Society of Environmental Toxicology and Chemistry, Pensacola, Florida.
Bunke D, Groß R, Ka lberlah F, Oltmanns J, Schwarz M, Reihlen A, Reineke N (2014) Mixtures in the environment – development of
assessment s trategies for the regulation of chemicals under REACH. UBA Texte 65/2014. Project report on behalf of the Federal
Envi ronment Agency (Germany).
Ca lamari D, Vighi M (1992) A proposal to define the quality objectives for aquatic life for mixtures of chemical substances. Chemo-
sphere 25, 531-542.
Canosa P, Rodriguez I, Rubi E, Bollain MH, Cela R (2006) Optimisation of a solid-phase microextraction method for the determina-
tion of parabens in water samples at the low ng per l itre level. J. Chromatogr. A 1124, 3-10.
Carballa M, Omil F, Lema M, Llompart M, Garcia-Jares C, Rodriguez I , Gomez M, Ternes TA (2004) Behavior of pharmaceuticals, cos-
metics and hormones in a sewage treatment plant. Water Res. 38, 2918–2926.
Carva lho RN, Arukwe A, Ai t-Aissa S et al. (2014) Mixtures of chemical pollutants at European legislation safety concentrations: how
safe are they? Toxicol. Sci. 141(1), 218-233.
Castiglioni S, Bagnati R, Ca lamari D, Fanelli R, Zuccato E (2005) A multiresidue analytical method using solid-phase extraction and
high-pressure liquid chromatography tandem mass spectrometry to measure pharmaceuticals of different therapeutic classes in
urban wastewaters. J. Chromatogr. A 1092, 206-215.
Cedergreen (2014) Quantifying synergy: A systematic review of mixture toxicity s tudies within environmental toxicology. PLoS ONE
9(5), e96580.
Cedergreen N, Munch-Christensen A, Kamper A, Kudsk P, Mathiassen SK, Streibig J, Sorensen H (2008) A review of independent
action compared to concentration addition as reference models for mixtures of compounds with different molecular target sites.
Envi ron. Toxicol. Chem. 27, 1621-1632.
CEFIC/VCI (2016) REACH Practical Guide on Safe Use Information for Mixtures under REACH – The Lead Component Identification (LCID) Methodology. The European Chemical Industry Council (CEFIC) and Verband der Chemischen Industrie e.V. (VCI), January
2016. Ava i lable at http://www.cefic.org
Chapman PM (2015) Including or excluding toxicity test data for development of a geometric mean. Environ. Toxicol. Chem. 34,
1691-1692.
Chen Z-F, Ying G-G (2015) Occurrence, fate and ecological risk of five typical azole fungicides as therapeutic and personal care prod-
ucts in the environment: a review. Environ. Int. 84, 142-153.
Chen Z-F, Ying G-G, La i H-J, Chen F, Su H-C, Liu Y-S, Peng F-Q, Zhao J-L (2012) Determination of biocides in different environmental
matrices by use of ultra-high-performance l iquid chromatography-tandem mass spectrometry. Anal. Bioanal. Chem. 404, 3175–
3188.

Joint effects of pharmaceuticals and chemicals regulated under REACH
117
Chèvre N, Mai llard E, Loepfe C, Becker-van Slooten K (2008) Determination of water quality standards for chemicals mixtures: ex-tens ion of a methodology developed for herbicides to a group of insecticides and a group of pharmaceuticals. Ecotoxicology Envi -
ronmental Safety 71, 740-748.
Clara M, Strenn B, Gans O, Martinez E, Kreuzinger N, Kroiss H (2005) Removal of selected pharmaceuticals, fragrances and endo-
crine disrupting compounds in a membrane bioreactor and conventional wastewater treatment plants. Water Res. 39, 4797-4807.
Cleuvers M (2005) Initial risk assessment for three ß-blockers found in the aquatic environment. Chemosphere 59, 199-205.
Constantine LA, Huggett DB (2010) A comparison of the chronic effects of human pharmaceuticals on two cladocerans, Daphnia
magna and Ceriodaphnia dubia. Chemosphere 80, 1069-1074.
Coors A, Dobrick J, Möder M, Kehrer A (2012a) Mixture toxicity of wood preservative products in the fish embryo toxicity test. Envi-
ron. Toxicol. Chem. 31(6), 1239-1248.
Coors A, Fri sche T (2011) Predicting the aquatic toxicity of commercial pesticide mixtures. Env. Sci . Eur. 23:22.
Coors A, Löffler I , Noronha-Jänsch P, Weisbrod B, Schoknecht U, Sacher F (2012b) Ecotoxicological combined effects from chemical
mixtures. Part 2: Development of ecotoxicological tests with biocidal products and eluates: investigating the suitability of biotests with a lgae and daphnids to estimate mixture toxicity. Report on behalf on the Federal Environment Agency, Germany. FKZ 3709 65
404.
Coors A, Weisbrod B, Schoknecht U, Sacher F, Kehrer A (2014) Predicting acute and chronic effects of wood preservative products
in Daphnia magna and Pseudokirchneriella subcapitata based on the concept of concentration addition. Envi ron. Toxicol. Chem.
33(2), 382-393.
Daughton CG (2014) The Matthew Effect and widely prescribed pharmaceuticals lacking environmental monitoring: Case s tudy of
an exposure-assessment vulnerability. Sci. Total Environ. 466-467, 315-325.
De Zwart D, Posthuma L (2005) Complex mixture toxicity for s ingle and multiple species: proposed methodologies. Environ. Toxicol.
Chem. 24, 2665-2676.
Deneer JW (2000) Toxicity of mixtures of pesticides in aquatic systems. Pest. Manag. Sci. 56, 516-520.
Dias E, Oliveira M, Jones-Dias D, Vasconcelos V, Ferreira E, Manageiro V, Canica M (2015) Assessing the antibiotic susceptibility of
freshwater Cyanobacteria spp. Front. Microbiol. 6:799.
DIMDI (2012) Anatomisch-therapeutisch-chemische-Klassifikation mit Tagesdosen. Amtliche Fassung des ATC-Index mit DDD-Anga-
ben für Deutschland im Jahre 2012. Deutsches Institut für Medizinische Dokumentation und Information (DIMDI) im Auftrag des
Bundesministeriums für Gesundheit. Köln, Germany.
DrugBank (2012, 2013) Open data drug & drug target database. Supported by Genome Alberta & Genome Canada, a not-for-profit organization with $600 mi llion in funding from the federal government. http://www.drugbank.ca. Accessed December 2012 and
March 2013.
Dzialowski EM, Turner PK, Brooks BW (2006) Physiological and reproductive effects of beta adrenergic receptor antagonists in
Daphnia magna. Arch. Envi ron. Contam. Toxicol. 50, 503–510.
Ebert I , Bachmann J, Kühnen U, Küster A, Kussatz C, Maletzki D, Schlüter C (2011) Toxicity of the fluoroquinolone antibiotics en-
rofloxacin and ciprofloxacin to photoautotrophic aquatic organisms. Envi ron. Toxicol. Chem. 30, 2786-2792.
EC (2000) Directive 2000/60/EC of the European Parliament and of the Council of 23 October 2000 establishing a framework for
Community action in the field of water policy. Official Journal of the European Communities L327/1.
EC (2006) Regulation (EC) No 1907/2006 of the European Parliament and of the Council of 18 December 2006 concerning the Regis-
tration, Eva luation, Authorisation and Restriction of Chemicals (REACH), establishing a European Chemicals Agency, amending Di-rective 1999/45/EC and repealing Council Regulation (EEC) No 793/93 and Commission Regulation (EC) No 1488/94 as well as Coun-
ci l Directive 76/769/EEC and Commission Directives 91/155/EEC, 93/67/EEC, 93/105/EC and 2000/21/EC. Official Journal of the
European Communities L 396/1.
EC (2007) Assessment report for inclusion of the active substances Propiconazole in Annex I or IA to Directive 98/8/EC. Product type 8 (wood preservatives). Finalised in the Standing Committee on Biocidal Products at i ts meeting on 29 November 2007 in view of its
inclusion in Annex I to Directive 98/8/EC.

Joint effects of pharmaceuticals and chemicals regulated under REACH
118
EC (2009a) Council of the European Union – Combination effects of chemicals – Council Conclusions. Adopted by the Council on 22
December 2009. 17820/09.
EC (2009b) Regulation (EC) No 1107/2009 of the European Parliament and of the Council of 21 October 2009 concerning the placing
of plant protection products on the market.
EC (2011a) Toxicity and assessment of chemical mixtures. Scientific Opinion approved by Scientific Committee on Health and Envi-
ronmental Risks, SCHER, Scientific Committee on Emerging and Newly Identified Health Risks, SCENIHR, and Scientific Committee
on Consumer Safety, SCCS. European Commission, Brussels.
EC (2011b) Common implementation s trategy for the Water Framework Directive (WFD). Technical guidance for deriving Envi ron-
mental Quality Standards. European Commission, Guidance Document N° 27.
EC (2011c) Proposal for a Directive amending Directives 2000/60/EC and 2008/105/EC as regards priority substances in the field of
water policy. European Commission, Brussels, 31 January 2012. COM(2011) 876 final.
EC (2012a) The combination effect of chemicals – Chemical mixtures. Communication from the Commission to the Council. Euro-
pean Commission, May 2012, Brussels.
EC (2012b) Regulation (EU) No 528/2012 of the European Parliament and of the Council of 22 May 2012 concerning the making
ava ilable on the market and use of biocidal products. (OJ L 167, 27 June 2012).
ECB (2003) Technical guidance in support of Commission Directive 93/67/EEC on risk assessment for new notified substances, Com-
mission Regulation (EC) No 1488/94 on ri sk assessment for existing substances, Directive 98/8/EC of the European Council and of
the Council concerning the placing of biocidal products on the market. Part I I. European Chemicals Bureau.
ECETOC (2001) Aquatic toxicity of mixtures. Technical Report No. 80. European Centre for Ecotoxicology and Toxicology of Chemi-
ca ls, Brussels.
ECETOC (2011) Development of guidance for assessing the impact of mixtures of chemicals in the aquatic environment. Technical
Report No. 111. European Centre for Ecotoxicology and Toxicology of Chemicals, Brussels.
ECHA (2014) Transitional Guidance on the Biocidal Products Regulation – Transitional Guidance on mixture toxicity assessment for
biocidal products for the in environment. European Chemicals Agency, Helsinki, May 2014.
ECHA (2016) Guidance on information requirements and chemical safety assessment. Chapter R.16: Envi ronmental Exposure As-
sessment. Version 3.0, February 2016. European Chemicals Agency, Helsinki.
Eguchi K, Nagase H, Ozawa M, Endoh YS, Goto K, Hi rata K, Miyamoto K, Yoshimura H (2004) Eva luation of antimicrobial agents for
veterinary use in the ecotoxicity test using microalgae. Chemosphere 57, 1733-1738.
EMEA (2006) Guideline on the environmental ri sk assessment of medicinal products for human use. Committee for Medicinal Prod-
ucts for Human Use, European Medicines Agency, London, 01 June 2006. Doc. Ref. EMEA/CHMP/SWP/4447/00.
EMEA (2008) Revised guideline on envi ronmental impact assessment for veterinary medicinal products. Committee for medicinal
products for veterinary use (CVMP, European Medicines Agency, London, 17 November 2008. Doc. Ref.
EMEA/CVMP/ERA/418282/2005-Rev.1.
Escher BI, Baumgartner R, Koller M, Treyer K, Lienert J, McArdell CS (2011) Envi ronmental toxicology and ri sk assessment of phar-
maceuticals from hospital wastewaters. Water Res. 45, 75-92.
Ferrari B, Mons R, Vollat B, Fraysse B, Paxeus N, Lo Giudice R, Pollio A, Garric J (2004) Envi ronmental risk assessment of six human
pharmaceuticals: are the current environmental ri sk assessment procedures sufficient for the protection of the aquatic environ-
ment? Envi ron. Toxicol. Chem. 23, 1344-1354.
Fick J, Lindberg RH, Ka j L, Brorström-Lundén E (2011) Results from the Swedish National Screening Programme 2010. (Subreport 3.
Pharmaceuticals) Swedish Environmental Research Institute.
Flaherty CM, Dodson SI (2005) Effects of pharmaceuticals on Daphnia survival, growth, and reproduction. Chemosphere 61, 200-
207.
Fri sche T, Faust M, Meyer W, Backhaus T (2009) Toxic masking and synergistic modulation of the estrogenic activity of chemical
mixtures in a yeast estrogen screen (YES). Envi ron. Sci . Pollut. Res. 16, 593-603.

Joint effects of pharmaceuticals and chemicals regulated under REACH
119
Fri sche T, Matezki S, Wogram J (2014) Envi ronmental risk assessment of pesticide mixtures under regulation 1107/2009/EC: a regu-
latory review by the German Federal Environment Agency (UBA). J. Verbr. Lebensm. 9, 377-389.
Gäl li R, Ort C, Schärer M (2009) Mikroverunreinigungen in den Gewässern. Bewertung und Reduktion der Schadstoffbelastung aus
der Siedlungsentwässerung. Umwelt-Wissen Nr. 0917. Bundesamt für Umwelt, Bern. S. 103.
García-López M, Rodríguez I, Cela R (2010) Mixed-mode solid-phase extraction followed by liquid chromatography–tandem mass
spectrometry for the determination of tri - and di-substituted organophosphorus species in water samples. J. Chromatogr. 1217,
1476–1484.
Gerbersdorf SU, Cimatoribus C, Class H, Engesser K-H, Helbich S, Hollert H, Lange C, Kranert M, Metzger J, Nowak W, Seiler T-B,
Steger K, Steinmetz H, Wieprecht S (2015) Anthropogenic Trace Compounds (ATCs) in aquatic habitats – Research needs on
sources, fate, detection and toxicity to ensure timely elimination strategies and ri sk management. Environment International 79,
85-105.
Giger W, Schaffner C, Kohler H-PE (2006) Benzotriazole and tolyltriazole as aquatic contaminants. 1. Input and occurrence in rivers
and lakes. Environ. Sci. Technol. 40, 7186-7192.
Ginebreda A, Kuzmanovic M, Guasch H, López de Alda M, López-Doval J, Munoz I, Ricart M, Romaní AM, Sabater S, Barceló D (2014)
Assessment of multi-chemical pollution in aquatic ecosystems using toxic units: Compound prioritization, mixture characterization
and relationships with biological descriptors. Sci. Total Environ. 468-469, 715-723.
Glassmeyer ST, Furlong ET, Kolpin DW, Cahill JD, Zaugg SD, Werner SL, Meyer MT, Kryak DD (2005) Transport of chemical and mi-
crobial compounds from known wastewater discharges: potential for use as indicators of human fecal contamination. Environ. Sci.
Technol. 39, 5157-5169.
Golet EM, Xi fra I , Siegrist H, Alder AC, Giger W (2003) Envi ronmental exposure assessment of fluoroquinolone antibacterial agents
from sewage to soil. Envi ron. Sci. Techn. 37, 3243-3249.
Gonzalez-Marino I, Quintana JB, Rodriguez I, Cela R (2009) Simultaneous determination of parabens, triclosan and triclocarban in
water by l iquid chromatography/electrospray ionisation tandem mass spectrometry. Rapid Commun. Mass Spectrom. 23, 1756–
1766.
Gonzalez-Marino I, Quintana JB, Rodriguez I, Cela R (2011) Eva luation of the occurrence and biodegradation of parabens and halo-genated by-products in wastewater by accurate-mass liquid chromatography-quadrupole-time-of-flight-mass spectrometry (LC-
QTOF-MS). Water Res. 45, 6770-6780.
Gracia-Lor E, Martinez M, Sancho JV, Penuela G, Hernandez F (2012) Multi-class determination of personal care products and phar-
maceuticals in environmental and wastewater samples by ultra-high performance liquid-chromatography-tandem mass spectrome-
try. Ta lanta 99, 1011-1023.
Gros M, Petrovic M, Barcelo D (2006) Development of a multi-residue analytical methodology based on liquid chromatography-
tandem mass spectrometry (LC-MS/MS) for screening and trace level determination of pharmaceuticals in surface and
wastewaters. Talanta 70, 678-690.
GWRC (2008) Development of an international priority l ist of pharmaceuticals relevant for the water cycle. Report of the Global
Water Research Coalition. London.
Hal ling-Sorensen B, Holten Lützhoft H-C, Andersen HR, Ingerslev F (2000) Envi ronmental ri sk assessment of antibiotics: comparison
of meci llinam, trimethoprim and ciprofloxacin. J. Antimicrob. Chemoth. 46, Suppl. S1, 53-58.
Hassold E, Backhaus T (2014) The predictability of mixture toxicity of demethylase inhibiting fungicides to Daphnia magna depends
on l i fe-cycle parameters. Aquat. Toxicol. 152, 205-214.
Hedgespeth ML, Sapozhnikova Y, Pennington P, Clum A, Fairey A, Wirth E (2012) Pharmaceuticals and personal care products
(PPCPs) in treated wastewater discharges into Charleston Harbor, South Carolina. Sci. Total Environ. 437, 1-9.
Hermens J, Canton H, Janssen P, De Jong R (1984) Quantitative s tructure-activity relationships and toxicity s tudies of mixtures of
chemicals with anaesthetic potency: acute lethal and sublethal toxicity to Daphnia magna. Aquat. Toxicol. 5, 143-154.
Hi l ton MJ, Thomas KV (2003) Determination of selected human pharmaceutical compounds in effluent and surface water samples
by high-performance liquid chromatography-electrospray tandem mass spectrometry. J. Chromatogr. A 1015, 129-141.

Joint effects of pharmaceuticals and chemicals regulated under REACH
120
Holten Lützhoft H-C, Halling-Sorensen B, Jorgensen SE (1999) Algal toxicity of antibacterial agents applied in Danish fish farming.
Arch. Envi ron. Contam. Toxicol. 36, 1-6.
Huggett DB, Brooks BW, Peterson B, Foran CM, Schlenk D (2002) Toxicity of select beta adrenergic receptor-blocking pharmaceuti-
ca ls (ß-blockers) on aquatic organisms. Arch. Environ. Contam. Toxicol. 43, 229–235.
Is idori M, Lavorgna M, Nardelli A, Pascarella L, Parrella A (2005) Toxic and genotoxic evaluation of six antibiotics on non-target or-
ganisms. Sci . Total Environ. 346, 87-98.
Ji K, Kim S, Han S, Seo J, Lee S, Park Y, Choi K, Kho Y-L, Kim P-G, Park J, Choi K (2012) Risk assessment of chlortetracycline, oxytetra-cycl ine, sulfamethazine, sulfathiazole, and erythromycin in aquatic environment: are the current environmental concentrations
safe? Ecotoxicology 21, 2031-2050.
Jukema JW, van der Hoorn JW (2004) Amlodipine and atorvastatin in atherosclerosis: a review of the potential of combination ther-
apy. Expert Opin. Pharmaco. 5, 459-468.
Junghans M, Backhaus T, Faust M, Scholze M, Grimme LH (2006) Application and validation of approaches for the predictive hazard
assessment of realistic pesticide mixtures. Aquat. Toxicol. 76, 93-110.
Junghans M, Kunz P, Werner I (2013) Toxizität von Mischungen. AQUA & GAS 5, 54-61.
Kahle M, Buerge IJ, Hauser A, Muller MD, Poiger T (2008) Azole fungicides: occurrence and fate in wastewater and surface waters.
Envi ron. Sci. Technol. 42, 7193-7200.
Kasprzyk-Hordern B, Dinsdale RM, Guwy AJ (2008) Multiresidue methods for the analysis of pharmaceuticals, personal care prod-
ucts and illicit drugs in surface water and wastewater by solid-phase extraction and ultra performance l iquid chromatography-elec-
trospray tandem mass spectrometry. Anal. Bioanal. Chem. 391, 1293-1308.
Kel ler M, Bänsch-Baltruschat B, Claus E, Coors A, Hommen U, Rüdel H (2012) Nutzung des Umweltmonitorings für das Risikoma-
nagement bedenklicher Stoffe unter besonderer Berücksichtigung von PBT-Stoffen (NUMoRi). Interim Report on behalf of the Fed-
era l Environment Agency (UBA). FKZ 3710 63 420.
Key PB, Hoguet J, Chung KW, Venturella JJ, Pennington PL, Fulton MH (2009) Lethal and sublethal effects of simvastatin, i rgarol, and
PBDE-47 on the estuarine fish, Fundulus heteroclitus. J. Envi ron. Sci. Heal. B 44(4), 379-382.
Khan GA, Lindberg R, Grabic R, Fick J (2012) The development and application of a system for simultaneously determining anti-in-
fectives and nasal decongestants using on-line solid-phase extraction and l iquid chromatography-tandem mass spectrometry. J.
Pharmaceut. Biomed. 66, 24-32.
Kim J-W, Ishibashi H, Yamauchi R, Ichikawa N, Takao Y, Hi rano M, Koga M, Arizono K (2009) Acute toxicity of pharmaceutical and
personal care products on freshwater crustaceans (Thamnocephalus platyurus) and fish (Oryzias latipes). J. Toxicol. Sci. 34, 227-232.
Kolar B, Arnus L, Jeretin B, Gutmaher A, Drobne D, Durjava MK (2014) The toxic effects of oxytetracycline and trimethoprim in the
aquatic environment. Chemosphere 115, 75-80.
Kortenkamp A, Backhaus T, Faust M (2009) State of the art report on mixture toxicity. Final Report to the European Commission
under Contract Number 070307/2007/485103/ETU/D.1. 2009.
Kosma CI, Lambropoulou DA, Albanis TA (2014) Investigation of PPCPs in wastewater treatment plants in Greece: occurrence, re-
moval and environmental ri sk assessment. Sci. Total Environ. 466-467, 421-438.
Kümmerer K (2003) Eintrag von Antibiotika in die aquatische Umwelt. Abschlussbericht zum UBA-Forschungsvorhaben FKZ 298 63
722.
Lee HB, Sarafin K, Peart TE (2007) Determination of beta-blockers and beta2-agonists in sewage by solid-phase extraction and liquid
chromatography-tandem mass spectrometry. J. Chromatogr. A 1148, 158-167.
Lindberg RH, Fick J, Tysklind M (2010) Screening of antimycotics in Swedish sewage treatment plants-waters and sludge. Water Res.
44, 649-657.
Lindberg RH, Olofsson U, Rendahl P, Johansson MI, Tysklind M, Andersson BA (2006) Behavior of fluoroquinolones and trimetho-
prim during mechanical, chemical, and active sludge treatment of sewage water and digestion of s ludge. Environ. Sci. Technol. 40,
1042-1048.

Joint effects of pharmaceuticals and chemicals regulated under REACH
121
Lindberg RH, Wennberg P, Johansson MI, Tysklind M, Andersson BA (2005) Screening of human antibiotic substances and determi-
nation of weekly mass flows in five sewage treatment plants in Sweden. Environ. Sci. Technol. 39, 3421-3429.
Lindqvist N, Tuhkanen T, Kronberg L (2005) Occurrence of acidic pharmaceuticals in raw and treated sewages and in receiving wa-
ters . Water Res. 39, 2219-2228.
Loewe S, Muischnek H (1926) Über Kombinationswirkungen: 1. Mitteilung: Hilfsmittel der Fragestellung. Naunyn-Schmiedebergs
Arch Exp Pathol Pharmacol 114, 313–326.
Loos R, Carva lho R, Antonio DC, Comero S, Locoro G, Tavazzi S, Paracchini B, Ghiani M, Lettieri T, Blaha L, Jarosova B, Voorspoels S, Servaes K, Haglund P, Fick J, Lindberg RH, Schwesig D, Gawlik BM (2013) EU-wide monitoring survey on emerging polar organic
contaminants in wastewater treatment plant effluents. Water Res. 47, 6475-6487.
Luo Y, Guo W, Ngo HH, Nghiem LD, Hai FI, Zhang J, Liang S, Wang XC (2014) A review on the occurrence of micropollutants in the
aquatic environment and their fate and removal during wastewater treatment. Sci. Total Environ. 473, 619-641.
Martinez-Carballo E, Gonzalez-Barreiro C, Si tka A, Scharf S, Gans O (2007) Determination of selected organophosphate esters in the
aquatic environment of Austria. Sci. Total Envi ron. 388, 290-299.
Martins N, Pereira R, Abrantes N, Pereira J, Goncalves F, Marques CR (2012) Ecotoxicological effects of ciprofloxacin on freshwater
species: data integration and derivation of toxicity thresholds for risk assessment. Ecotoxicology 21, 1167-1176.
Marx C, Mühlbauer V, Krebs P, Kuehn V (2015) Envi ronmental risk assessment of antibiotics including synergistic and antagonistic
combinations. Sci Total Environ. 524-525, 269-279.
Maszkowska J, Stolte S, Kumirska J, Lukaszewicz P, Mioduszewska K, Puckowski A, Caban M, Wagil M, Stepnowski P, Bialk-Bielinska
A (2014) Beta-blockers in the environment: Part I I. Ecotoxicity s tudy. Sci. Total Environ. 493, 1122-1126.
Meyer J, Bester K (2004) Organophosphate flame retardants and plasticisers in wastewater treatment plants. J. Environ. Monit. 6,
599-605.
Moermond CTA, Kase R, Korkaric M, Agerstrand M (2016) CRED: Cri teria for reporting and evaluating ecotoxicity data. Envi ron. Tox-
icol . Chem. 35, 1297-1309.
Moermond CTA, Smit CE (2016) Derivation of water quality s tandards for carbamazepine, metoprolol, and metformin and compari-
son with monitoring data. Environ. Toxicol. Chem. 35, 882-888.
Munch Christensen A, Ingerslev F, Baun A (2006) Ecotoxicity of mixtures of antibiotics used in aquaculture. Environ. Toxicol. Chem.
25, 2208-2215.
NC (2012) Chemical cocktails – a serious matter of concern. Nordic Council of Ministers, Copenhagen, Denmark.
Nordic Council of Ministers (2012) Chemical cocktails – a serious matter of concern. Copenhagen, Denmark. PPCP monitoring in the
Nordic Countries – Status Report. TemaNord 519.
Oakes KD, Coors A, Escher BI, Fenner K, Garric J, Gust M, Knacker T, Küster A, Kussatz C, Metcalfe CD, Monteiro S, Moon TW, Men-nigen JA, Parrott J, Péry ARR, Ramil M, Roennefahrt I, Tarazona JV, Sánchez-Argüello P, Ternes TA, Trudeau VL, Boucard T, Van Der
Kraak GJ, Servos MR (2010) An environmental risk assessment for the serotonin re-uptake inhibitor fluoxetine - a case study utiliz-
ing the European ri sk assessment framework. Integr. Environ. Assess. Manag. 6, Suppl. 1, 524-539.
OECD (2006a) OECD Guideline for the Testing of Chemicals, No. 201: "Freshwater Alga and Cyanobacteria, Growth Inhibition Test”.
Adopted 23 March 2006 and annex 5 corrected 28 July 2011, Organisation for Economic Co-Operation and Development, Paris.
OECD (2006b) OECD Guideline for Testing of Chemicals No. 221: "Lemna sp. Growth Inhibition Test". Adopted 23 March 2006, Or-
ganisation for Economic Co-Operation and Development, Paris.
OECD (2012) OECD Guideline for Testing of Chemicals No. 211: "Daphnia magna Reproduction Test". Adopted 2 October 2012, Or-
ganisation for Economic Co-Operation and Development, Paris.
Oldenkamp R, Hendriks HWM, van de Meent D, Ragas AMJ (2015) Hierarchical Bayesian approach to reduce uncertainty in the
aquatic effect assessment of realistic chemical mixtures. Environ. Sci. Technol. 49, 10457-10465.
Ottmar KJ, Colosi LM, Smith JA (2012) Fate and transport of atorvastatin and simvastatin drugs during conventional wastewater
treatment. Chemosphere 88, 1184-1189.

Joint effects of pharmaceuticals and chemicals regulated under REACH
122
Park S, Choi K (2008) Hazard assessment of commonly used agricultural antibiotics on aquatic ecosystems. Ecotoxicology 17, 526-
538.
Pedrouzo M, Borrull F, Marce RM, Pocurull E (2009) Ul tra-high-performance liquid chromatography-tandem mass spectrometry for
determining the presence of eleven personal care products in surface and wastewaters. J. Chromatogr. A 1216, 6994-7000.
PharmNet.Bund (2012) Das Portal für Arzneimittelinformationen des Bundes und der Länder. Deutsches Institut für Medizinische
Dokumentation und Information (DIMDI) in Kooperation mit dem Bundesministerium für Gesundheit. http://www.phar-
mnet.bund.de//. Accessed December 2012.
Pi l lard DA, Cornell JS, Dufresne DL, Hernandez MT (2001) Toxicity of benzotriazole and benzotriazole derivatives to three aquatic
species. Water Res. 35, 557-560.
Poehlsgaard J, Douthwaite S (2005) The bacterial ribosome as a target for antibiotics. Nat. Rev. Microbiol. 3, 870-881.
Prasse C, Schlüssener M, Schulz R, Ternes T (2010) Antiviral Drugs in Wastewater and Surface Waters: A New Pharmaceutical Class
of Envi ronmental Relevance? Environ. Sci. Technol. 44, 1728–1735.
Price P, Dhein E, Hamer M, Han Y, Heneweer M, Junghans M, Kunz P, Magyar C, Penning H, Rodriguez C (2012a) A decision tree for
assessing effects from exposures to multiple substances. Environmental Sciences Europe 24:26.
Price P, Han X (2011) Maximum Cumulative Ratio (MCR) as a tool for assessing the value of performing a cumulative ri sk assess-
ment. Int. J. Envi ron. Res. Public Health 8, 2212-2225.
Price P, Han X, Junghans M, Kunz P, Watts C, Leverett D (2012b) An application of a decision tree for assessing effects from expo-
sures to multiple substances to the assessment of human and ecological effects from combined exposures to chemicals observed in
surface waters and waste water effluents. Environmental Sciences Europe 24:34.
R Development Core Team (2013) R: A language and environment for statistical computing. Version 3.0.1. R Foundation for Statisti-
ca l Computing, Vienna, Austria. www.R-project.org.
Reddersen K (2004) Das Verhalten von Arzneimittelrückständen im Wasserkreislauf Berlins. Dissertation TU Berlin.
Reemtsma T, Miehe U, Duennbier U, Jekel M (2010) Polar pollutants in municipal wastewater and the water cycle: Occurrence and
removal of benzotriazoles. Water Res. 44, 596-604.
Regueiro J, Llompart M, Ps illakis E, Garcia-Monteagudo JC, Garcia-Jares C (2009) Ul trasound-assisted emulsification-microextraction
of phenolic preservatives in water. Ta lanta 79, 1387-1397.
Richter E, Roller E, Kunkel U, Ternes TA, Coors A (2016). Phytotoxicity of wastewater-born micropollutants – characterisation of
three antimycotics and a cationic surfactant. Environ. Pollut. 208, 512-522.
Richter E, Wick A, Ternes T, Coors A (2013) Ecotoxicity of climbazole, a fungicide contained in anti-dandruff shampoo. Environ. Toxi-
col . Chem. 32, 2816-2825.
Ri tz C, Baty F, Streibig JC, Gerhard D (2015) Dose-response analysis using R. PLoS ONE 10(12): e0146021. doi:10.1371/jour-
na l .pone.0146021.
Ri tz C, Streibig JC (2005) Bioassay Analysis using R. J. Statist. Software 12. Package drc.
Roberts PH, Thomas KV (2006) The occurrence of selected pharmaceuticals in wastewater effluent and surface waters of the lower
Tyne catchment. Sci . Total Environ. 356, 143-153.
Robinson AA, Belden JB, Lydy M (2005) Toxici ty of fluoroquinolone antibiotics to aquatic organisms. Envi ron. Toxicol. Chem. 24,
423-430.
Rodi l R, Quintana JB, Concha-Grana E, Lopez-Mahia P, Muniategui-Lorenzo S, Prada-Rodriguez D (2012) Emerging pollutants in sew-
age, surface and drinking water in Galicia (NW Spain). Chemosphere 86, 1040-1049.
Rodi l R, Quintana JB, Lopez-Mahia P, Muniategui-Lorenzo S, Prada-Rodriguez D (2009) Multi-residue analytical method for the de-
termination of emerging pollutants in water by solid-phase extraction and liquid chromatography-tandem mass spectrometry. J.
Chromatogr. A 1216, 2958-2969.
Rosal R, Rodea-Palomares I , Boltes K, Fernandez-Pinas F, Leganés F, Gonzalo S, Petre A (2010a) Ecotoxicity assessment of lipid regu-
lators in water and biologically treated wastewater using three aquatic organisms. Environ. Sci. Pollut. Res. 17, 135-144.

Joint effects of pharmaceuticals and chemicals regulated under REACH
123
Rosal R, Rodriguez A, Perdigon-Melon JA, Petre A, Garcia-Calvo E, Gomez MJ, Aguera A, Fernandez-Alba AR (2010b) Occurrence of emerging pollutants in urban wastewater and their removal through biological treatment followed by ozonation. Water Res. 44,
578-588.
Santos LHMLM, Gros M, Rodriguez-Mozaz S, Delerue-Matos C, Pena A, Barceló D, Montenegro MCBSM (2013) Contribution of hos-
pi ta l effluents to the load of pharmaceuticals in urban wastewaters: Identification of ecologically relevant pharmaceuticals. Sci.
Tota l Environ. 461-462, 302-316.
Schäfer RB, von der Ohe PC, Kühne R, Schüürmann G, Liess M (2011) Occurrence and toxicity of 331 organic pollutants in large riv-
ers of North Germany over a decade (1994 to 2004). Envi ron. Sci. Technol. 45, 6167-6174.
Schlüter-Vorberg L, Knopp G, Cornel P, Ternes T, Coors A (submitted) Survival, reproduction, growth, and parasite resistance of
aquatic organisms exposed in-situ to wastewater treated by advanced treatment processes. August 2016.
Scholze M, Boedeker W, Faust M, Backhaus T, Al tenburger R, Grimme LH (2001) A general best-fit method for concentration-re-
sponse curves and the estimation of low-effect concentrations. Environ. Toxicol. Chem. 20, 448-457.
Schwabe U, Paffrath D (Eds.) (2012) Arzneiverordnungs-Report 2012: Aktuelle Daten, Kosten, Trends und Kommentare; Springer-
Verlag 2012.
Seeland A, Oetken M, Kiss A, Fries E, Oehlmann J (2012) Acute and chronic toxicity of benzotriazoles to aquatic organisms. Environ.
Sci . Pol lut. Res. 19, 1781-1790.
Senta I, Terzić S, Ahel M (2008) Simultaneous determination of sulfonamides, fluoroquinolones, macrolides and trimethoprim in
wastewater and river water by LC-tandem-MS. Chromatographia 68, 747-758.
Sigma-Aldrich (2013) www.sigma-aldrich.com accessed in 2013.
Snape J, Constantine L, Davidson T, Straub JO, Journel R, Ryan J, Länge R, Tell J, Meyerhoff R (2016) Post-approval environmental
management of human medicinal products: An extended environmental risk assessment (eERA) framework. Presentation at the
Annual meeting of the European Branch of the Society of Environmental Toxicology and Chemistry (SETAC-EU), May 2016, Nantes,
France.
Spongberg AL, Witter JD (2008) Pharmaceutical compounds in the wastewater process stream in Northwest Ohio. Sci. Total Envi-
ron. 397, 148-157.
Spurgeon DJ, Jones OAH, Dorne J-LCM, Svendsen C, Swain S, Stürzenbaum SR (2010) Systems toxicology approaches for under-
s tanding the joint effects of environmental chemical mixtures. Sci. Total Environ. 408, 3725-3734.
Straub JO (2013) An environmental ri sk assessment for human-use trimethoprim in European surface waters. Antibiotics 2, 115-
162.
Straub JO (2016) Aquatic environmental ri sk assessment for human use of the old antibiotic sulfamethoxazole in Europe. Environ.
Toxicol. Chem. 35, 767-779.
Ternes TA (1998) Occurrence of drugs in German sewage treatment plants and rivers. Water Res. 32, 3245-3260.
Ternes TA, Bonerz M, Herrmann N, Teiser B, Andersen HR (2007) Irrigation of treated wastewater in Braunschweig, Germany: an
option to remove pharmaceuticals and musk fragrances. Chemosphere 66, 894-904.
Ternes TA, Joss A, Siegrist H (2004) Scrutinizing pharmaceuticals and personal care products in wastewater treatment. Environ Sci
Technol 38, 392A-399A.
Thoma A, Graf C, Kurzenberger I , Sacher F (2011) Benzotriazole im Rhein – Vorkommen und Bedeutung für die Trinkwasserversor-
gung. ARW-Jahresbericht 2010 67, 99-122.
Thomaidi VS, Stasinakis AS, Borova VL, Thomaidis NS (2015) Is there a risk for the aquatic environment due to the existence of
emerging organic contaminants in treated domestic wastewater? Greece as a case-study. J Hazard. Mat. 283, 740-747.
Unceta N, Sampedro MC, Abu Bakar NK, Gomez-Caballero A, Goicolea MA, Barrio RJ (2010) Multi-residue analysis of pharmaceuti-ca l compounds in wastewaters by dual solid-phase microextraction coupled to liquid chromatography electrospray ionization ion
trap mass spectrometry. J. Chromatogr. A 1217, 3392-3399.
Universität Dortmund, Fachbereich Chemietechnik, Lehrstuhl Umwelttechnik (2003) Untersuchungen zum Eintrag und zur Elimina-
tion von gefährlichen Stoffen in kommunalen Kläranlagen Teil 1. Abschlussbericht zu einem Forschungsvorhaben. Dortmund.

Joint effects of pharmaceuticals and chemicals regulated under REACH
124
Urtiaga AM, Pérez G, Ibánez R, Ortiz I (2013) Removal of pharmaceuticals from a WWTP secondary effluent by ul trafiltration/re-
verse osmosis followed by electrochemical oxidation of the RO concentrate. Desalination 331, 26-34.
Van De Steene JC, Stove CP, Lambert WE (2010) A field study on 8 pharmaceuticals and 1 pesticide in Belgium: removal rates in
waste water treatment plants and occurrence in surface water. Sci. Total Envi ron. 408, 3448-3453.
Van den Brandhof E-J, Montforts M (2010) Fish embryo toxicity of carbamazepine, diclofenac and metoprolol. Ecotox. Envi ron.
Safe. 73, 1862-1866.
Van der Veen I, de Boer J (2012) Phosphorus flame retardants: Properties, production, environmental occurrence, toxicity and anal-
ys is . Chemosphere 88, 1119-1153.
Varsano R, Rabinowitch HD, Rubin B (1992) Mode of action of piperonyl butoxide as herbicide synergist of atrazine and terbutryn in
maize. Pestic. Biochem. Phys. 44, 174-182.
Vestel J, Ca ldwell DJ, Constantine L, d’Aco VJ, Davidson T, Dolan DG, Millard SP, Murray-Smith R, Parke N, Ryan JJ, Straub JO, Wi lson
P (2016) Use of acute and chronic ecotoxicity data in environmental ri sk assessment of pharmaceuticals. Environ. Toxicol. Chem.
35, 1201-1212.
Vieno NM, Tuhkanen T, Kronberg L (2006) Analysis of neutral and basic pharmaceuticals in sewage treatment plants and in recipi-
ent rivers using solid phase extraction and l iquid chromatography-tandem mass spectrometry detection. J. Chromatogr. A 1134,
101-111.
Vieno NM, Tuhkanen T., Kronberg L. (2007) El imination of pharmaceuticals in sewage treatment plants in Finland. Water Res. 41,
1001-1012.
Vi l lain J, Minguez L, Ha lm-Lemeille M-P, Durrieu G, Bureau R (2016) Acute toxicities of pharmaceuticals towards green a lgae, mode
of action, biopharmaceutical drug disposition classification system and quantile regression models. Ecotox. Envi ron. Safe. 124, 337-
343.
Voutsa D, Hartmann P, Schaffner C, Giger W (2006) Benzotriazoles, alkylphenols and bisphenol A in municipal wastewaters and in
the Glatt River, Switzerland. Environ. Sci. Pollut. Res. 13, 333-341.
Warne MSJ, Hawker DW (1995) The number of components in a mixture determines whether synergistic and antagonistic or addi-
tive toxicity predominate: The Funnel Hypothesis. Ecotox. Environ. Safe. 31, 23-28.
Watanabe H, Tamura I, Abe R, Takanobu H, Nakamura A, Suzuki T, Hi rose A, Nishimura T, Tatarazako N (2016) Chronic toxicity of an
envi ronmentally relevant mixture of pharmaceuticals to three aquatic organisms (alga, daphnid, and fish). Environ. Toxicol. Chem.
35, 996-1006.
Weiss S, Jakobs J, Reemtsma T (2006) Discharge of three benzotriazole corrosion inhibitors with municipal wastewater and im-
provements by membrane bioreactor treatment and ozonation. Envi ron. Sci . Technol. 40, 7193-7199.
Weiss S, Reemtsma T (2005) Determination of benzotriazole corrosion inhibitors from aqueous envi ronmental samples by l iquid
chromatography-electrospray ionization-tandem mass spectrometry. Anal. Chem. 77, 7415-7420.
Wheeler MW, Park RM, Bailer AJ (2006) Comparing median lethal concentration values using confidence interval overlap or ratio
tests. Envi ron. Toxicol. Chem. 25(5), 1441–1444.
WHO (1998) Flame retardants: Tris(chloropropyl)phosphate and tris(2-chloroethyl)phosphate. Environmental Health Cri teria 209.
World Health Organization, Geneva, Switzerland.
WHO (2012) International language for drug utilization research – ATC/DDD system. WHO Collaborating Centre for Drug Statistics
Methodology, Norwegian Institute of Public Health. http://www.whocc.no/. Accessed December 2012.
Wick A, Fink G, Ternes TA (2010) Comparison of electrospray ionization and atmospheric pressure chemical ionization for multi-res idue analysis of biocides, UV-filters and benzothiazoles in aqueous matrices and activated sludge by liquid chromatography–
tandem mass spectrometry. J. Chromatogr. A 1217, 2088–2103.
WIdO (2016) Anatomisch-therapeutischchemische Klassifikation mit Tagesdosen. Amtliche Fassung des ATC-Index mit DDD-Anga-
ben für Deutschland im Jahre 2016. Ers tellt vom GKV-Arzneimittelindex im Wissenschaftlichen Institut der AOK (WIdO). Herausge-
geben vom Deutschen Institut für Medizinische Dokumentation und Information, Köln.

Joint effects of pharmaceuticals and chemicals regulated under REACH
125
Wri ter JH, Ferrer I , Barber LB, Thurman EM (2013) Widespread occurrence of neuro-active pharmaceuticals and metabolites in 24
Minnesota rivers and wastewaters. Sci. Total Environ. 461-462, 519-527.
Yamamoto H, Tamura I, Hirata Y, Kato J, Kagota K, Katsuki S, Yamamoto A, Kagami Y, Tatarazako N (2011) Aquatic toxicity and eco-
logical risk assessment of seven parabens: Individual and additive approach. Sci. Total Environ. 410-411, 102-111.
Yang L-H, Ying G-G, Su H-C, Stauber J, Adams M, Binet M (2008) Growth-inhibiting effects of 12 antibacterial agents and their mix-
tures on the freshwater microalga Pseudokirchneriella subcapitata. Envi ron. Toxicol. Chem. 27, 1201-1208.
Za leska-Radziwill M, Łebkowska M, Affek K, Zarzeczna A (2011) Envi ronmental risk assessment of selected pharmaceuticals present
in surface waters in relation to animals. Arch. Envi ron. Prot. 37, 31-42.
Zhou S-F, Xue CC, Yu X-Q, Li C, Wang G (2007) Cl inically important drug interactions potentially involving mechanism-based inhibi-
tion of cytochrome P450 3A4 and the role of therapeutic drug monitoring. Ther. Drug Monit. 29, 687-710.
Zori ta S, Mårtensson L, Mathiasson L (2009) Occurrence and removal of pharmaceuticals in a municipal sewage treatment system
in the south of Sweden. Sci. Total Environ. 407, 2760-2770.

Joint effects of pharmaceuticals and chemicals regulated under REACH
126
10 Confidential Annex A. Study reports of growth inhibition tests with the green algae Pseudokirchneriella subcapitata A1. Coors A., Löffler I., Sacher F.: Metoprolol: A Study on the Toxicity to Algae. ECT Oekotoxikologie GmbH, April 2016. 19 pages.
A2. Coors A., Löffler I., Sacher F.: Methylparaben: A Study on the Toxicity to Algae. ECT Oekotoxikologie GmbH, April 2016.
19 pages.
A3. Coors A., Löffler I., Sacher F.: 5-Methylbenzotriazole: A Study on the Toxicity to Algae. ECT Oekotoxikologie GmbH, April 2016.
20 pages.
A4. Coors A., Löffler I., Sacher F.: Tri s(2-chloroisopropyl)phosphate (TCPP): A Study on the Toxicity to Algae. ECT Oekotoxikologie
GmbH, Apri l 2016. 19 pages.
A5. Coors A., Löffler I., Sacher F.: Fluconazole: A Study on the Toxicity to Algae. ECT Oekotoxikologie GmbH, April 2016. 19 pages.
A6. Coors A., Löffler I., Sacher F.: Amlodipine: A Study on the Toxicity to Algae. ECT Oekotoxikologie GmbH, April 2016. 19 pages.
A7. Coors A., Löffler I., Sacher F.: Linezolid: A Study on the Toxicity to Algae. ECT Oekotoxikologie GmbH, April 2016. 19 pages.
A8. Coors A., Volovei T., Heusner E., Sacher F.: Fenofibric Acid: A Study on the Toxicity to Algae. ECT Oekotoxikologie GmbH, April
2016. 14 pages.
A9. Coors A., Volovei T., Heusner E., Sacher F.: Mixture of Cl imbazole, Fluconazole, and Propiconazole: A Study on the Toxicity to
Algae. ECT Oekotoxikologie GmbH, April 2016. 26 pages.
A10. Coors A., Volovei T., Heusner E., Sacher F.: Mixture of Climbazole, Fluconazole, and Propiconazole: A Study on the Toxicity to
Algae in the Presence and Absence of Wastewater Effluent. ECT Oekotoxikologie GmbH, May 2016. 31 pages.
A11. Vol lmar P., Coors A., Sacher F.: Mixture of Ten Substances at an Equipotent Ratio: A Study on the Toxicity to Algae in the Pres-
ence and Absence of Wastewater Effluent. ECT Oekotoxikologie GmbH, May 2016. 28 pages.
A12. Coors A., Vol lmar P., Sacher F.: Mixture of Ten Substances at an Equipotent Ratio: A Study on the Toxicity to Algae in the Pres-
ence and Absence of Wastewater Effluent. ECT Oekotoxikologie GmbH, May 2016. 36 pages.
A13. Vol lmar P., Sacher F., Coors A.: Mixture of Metoprolol, Cl imbazole, and Amlodipine: A Study on the Toxicity to Algae in the
Presence and Absence of Wastewater Effluent. ECT Oekotoxikologie GmbH, May 2016. 29 pages.
B. Study reports of Daphnia magna reproductions tests B1. Coors A., Werschke C., Sacher F.: Cl imbazole: A Study on the Chronic Toxicity to Daphnia magna. ECT Oekotoxikologie GmbH,
October 2013. 21 pages.
B2. Coors A., Werschke C., Goth M., Sacher F.: Methylparaben: A Study on the Chronic Toxicity to Daphnia magna. ECT Oekotox-
ikologie GmbH, October 2013. 21 pages.
B3. Coors A., Werschke C., Goth M., Sacher F.: 5-Methylbenzotriazole: A Study on the Chronic Toxicity to Daphnia magna. ECT
Oekotoxikologie GmbH, October 2013. 20 pages.
B4. Coors A., Werschke C., Goth M., Sacher F.: Simvastatin: A Study on the Chronic Toxicity to Daphnia magna. ECT Oekotoxikologie
GmbH, October 2013. 22 pages.
B5. Coors A., Werschke C., Volovei T., Sacher F.: Fluconazole: A Study on the Chronic Toxicity to Daphnia magna. ECT Oekotoxikolo-
gie GmbH, April 2014. 20 pages.
B6. Coors A., Werschke C.: Bezafibrate: A Pre-Test on the Chronic Toxicity to Daphnia magna. ECT Oekotoxikologie GmbH, October
2013. 15 pages.
B7. Coors A., Werschke C., Goth M., Sacher F.: Metoprolol: A Study on the Chronic Toxicity to Daphnia magna. Apri l 2014. 21 pages.
B8. Coors A., Werschke C., Volovei T., Sacher F.: Tri s(2-chloroisopropyl )phosphate (TCPP): A Study on the Chronic Toxicity to Daph-
nia magna. ECT Oekotoxikologie GmbH, April 2014. 20 pages.
B9. Coors A., Volovei T., Sacher F.: Fenofibric Acid: A Study on the Chronic Toxicity to Daphnia magna. ECT Oekotoxikologie GmbH,
Apri l 2014. 20 pages.

Joint effects of pharmaceuticals and chemicals regulated under REACH
127
B10. Coors A., Werschke C., Sacher F.: Propiconazole: A Study on the Chronic Toxicity to Daphnia magna. ECT Oekotoxikologie
GmbH, September 2014. 22 pages.
B11. Coors A., Volovei T., Sacher F.: Mixture of Cl imbazole, Fluconazole, and Propiconazole: A Study on the Chronic Toxicity to
Daphnia magna. ECT Oekotoxikologie GmbH, January 2015. 28 pages.
B12. Coors A., Vol lmar P., Werschke C., Sacher F.: Nine Substances Mixed at an Exposure-based Ratio: A Study on the Chronic Tox-
ici ty to Daphnia magna. ECT Oekotoxikologie GmbH, April 2015. 32 pages.
B13. Coors A., Vol lmar P., Werschke C., Sacher F.: Mixture of Nine Substances at an Effect-based Ratio: A Study on the Chronic Tox-ici ty to Daphnia magna in the Presence and Absence of Wastewater Effluent. ECT Oekotoxikologie GmbH, November 2015. 43
pages.
B14. Vol lmar P., Werschke C., Sacher F., Coors A.: Mixture of Three Substances at an Effect-based Ratio: A Study on the Chronic
Toxici ty to Daphnia magna at Constant and Varying Mixture Concentrations. ECT Oekotoxikologie GmbH, April 2016. 37 pages.
C. Study reports of growth inhibition tests with the cyanobacteria Anabaena flos-aquae and Syn-echococcus leopoliensis C1. Maletzki D., Sacher F., Coors A.: Sulfamethoxazole: A Study on the Toxicity to Cyanobacteria. Ökotoxikologielabor, Umweltbun-
desamt Berlin, March 2014. 18 pages.
C2. Maletzki D., Sacher F., Coors A.: Amoxicillin: A Study on the Toxicity to Cyanobacteria. Ökotoxikologielabor, Umweltbundesamt
Berl in, March 2014. 18 pages.
C3. Maletzki D., Sacher F., Coors A.: Trimethoprim: A Study on the Toxicity to Cyanobacteria. Ökotoxikologielabor, Umweltbun-
desamt Berlin, March 2014. 18 pages.
C4. Maletzki D., Sacher F., Coors A.: Fluoxetine: A Study on the Toxicity to Cyanobacteria. Ökotoxikologielabor, Umweltbundesamt
Berl in, March 2014. 18 pages.
C5. Schwartz P., Sacher F., Coors A.: Metoprolol: A Study on the Toxicity to Anabaena flos-aquae (Cyanobacteria). Ökotoxikolo-
gielabor, Umweltbundesamt Berlin, April 2015. 18 pages.
C6. Schwartz P., Sacher F., Coors A.: Sulfamethoxazole: A Study on the Toxicity to Synechococcus leopoliensis (Cyanobacteria). Öko-
toxikologielabor, Umweltbundesamt Berlin, April 2015. 18 pages.
C7. Schwartz P., Sacher F., Coors A.: Trimethoprim: A Study on the Toxicity to Synechococcus leopoliensis (Cyanobacteria). Ökotox-
ikologielabor, Umweltbundesamt Berlin, May 2015. 18 pages.
C8. Schwartz P., Sacher F., Coors A.: Linezolid: A Study on the Toxicity to Anabaena flos-aquae (Cyanobacteria). Ökotoxikolo-
gielabor, Umweltbundesamt Berlin, November 2015. 18 pages.
C9. Schwartz P., Sacher F., Coors A.: Clarithromycin: A Study on the Toxicity to Synechococcus leopoliensis (Cyanobacteria). Ökotox-ikologielabor, Umweltbundesamt Berlin, November 2015. 18 pages.
C10. Schwartz P., Maletzki D., Sacher F., Coors A.: Mixture of Sulfamethoxazole and Trimethoprim: A Study on the Toxicity to Syn-echococcus leopoliensis (Cyanobacteria). Ökotoxikologielabor, Umweltbundesamt Berlin, June 2016. 25 pages.
C11. Schwartz P., Maletzki D., Sacher F., Coors A.: Mixture of Sulfamethoxazole and Clarithromycin: A Study on the Toxicity to Syn-echococcus leopoliensis (Cyanobacteria). Ökotoxikologielabor, Umweltbundesamt Berlin, June 2016. 23 pages.
C12. Schwartz P., Maletzki D., Sacher F., Coors A.: Mixture of Linezolid and Clarithromycin at an Equipotent Ratio: A Study on the Toxici ty to Anabaena flos-aquae (Cyanobacteria). Ökotoxikologielabor, Umweltbundesamt Berlin, May 2016. 25 pages.
C13. Schwartz P., Maletzki D., Sacher F., Coors A.: Mixture of Ten Substances at an Equipotent Ratio: A Study on the Toxicity to Ana-baena flos-aquae (Cyanobacteria) in the Presence and Absence of Wastewater Effluent. Ökotoxikologielabor, Umweltbundesamt Berl in, May 2016. 36 pages.
C14. Maletzki D., Sacher F., Coors A.: Mixture of Clarithromycin, Cl indamycin and Erythromycin: A Study on the Toxicity to Ana-baena flos-aquae (Cyanobacteria). Ökotoxikologielabor, Umweltbundesamt Berlin, August 2016. 25 pages.
D. Study reports of growth inhibition tests with Lemna minor D1. Pol leichtner C.: Tri s(chloropropyl)phosphate (TCPP): A Study on the Toxicity to Lemna minor (Family: Araceae). Ökotoxikolo-gielabor, Umweltbundesamt Berlin, January 2015. 19 pages.

Joint effects of pharmaceuticals and chemicals regulated under REACH
128
D2. Pol leichtner C.: Metoprolotartrate: A Study on the Toxicity to Lemna minor (Family: Araceae). Ökotoxikologielabor, Umweltbun-desamt Berlin, May 2015. 19 pages.
D3. Pol leichtner C.: Propiconazole: A Study on the Toxicity to Lemna minor (Family: Araceae). Ökotoxikologielabor, Umweltbun-desamt Berlin, May 2015. 19 pages.
D4. Pol leichtner C.: Sul famethoxazole: A Study on the Toxicity to Lemna minor (Family: Araceae). Ökotoxikologielabor, Umweltbun-desamt Berlin, November 2015. 19 pages.
D5. Pol leichtner C.: 5-Methyl-1H-benzotriazole: A Study on the Toxicity to Lemna minor (Family: Araceae). Ökotoxikologielabor, Umweltbundesamt Berlin, February 2015. 19 pages.
D6. Pol leichtner C.: Methylparaben: A Study on the Toxicity to Lemna minor (Family: Araceae). Ökotoxikologielabor, Umweltbun-desamt Berlin, October 2015. 19 pages.
D7. Pol leichtner C.: Trimethoprim: A Study on the Toxicity to Lemna minor (Family: Araceae). Ökotoxikologielabor, Umweltbun-desamt Berlin, March 2015. 19 pages.
D8. Pol leichtner C.: Erythromycin: A Study on the Toxicity to Lemna minor (Family: Araceae). Ökotoxikologielabor, Umweltbun-desamt Berlin, February 2015. 18 pages.
D9a. Pol leichtner C.: Mixture 2 – Sul famethoxazole & Trimethoprim: A Study on the Toxicity to Lemna minor (Family: Araceae). Part 1: Approach with constant concentrations. Ökotoxikologielabor, Umweltbundesamt Berlin, June 2015. 22 pages.
D9b. Pol leichtner C.: Mixture 2 – Sul famethoxazole & Trimethoprim: A Study on the Toxicity to Lemna minor (Family: Araceae). Part 2: Approach with variable concentrations. Ökotoxikologielabor, Umweltbundesamt Berlin, June 2015. 22 pages.
D10a. Pol leichtner C.: Mixture 1 – Azoles: Fluconazole, Cl imbazole & Propiconazole: A Study on the Toxicity to Lemna minor (Family: Araceae). Ökotoxikologielabor, Umweltbundesamt Berlin, July 2015. 21 pages.
D10b. Pol leichtner C.: Mixture 1 – Azoles: Fluconazole, Cl imbazole & Propiconazole: A Study on the Toxicity to Lemna minor (Fam-i ly: Araceae). Part 1: Wastewater Treatment Plant Discharge. Ökotoxikologielabor, Umweltbundesamt Berlin, July 2015. 21 pages.
D11. Pol leichtner C.: Mixture 3: TCPP, Cl imbazole, Fluconazole, Propiconazole, Ciprofloxacin, Sulfamethoxazole, Trimethoprim, 5-Methyl -1H-benzotriazole & Methylparaben: A Study on the Toxicity to Lemna minor (Family: Araceae). Ökotoxikologielabor, Um-weltbundesamt Berlin, August 2016. 29 pages.
E. Refined predicted environmental concentrations for pharmaceuticals among the test sub-stances based on confidential consumption data