johnnatanmessias advisor: fabrÍciobenevenutojohnme/pdf/master-thesis_johnnatan... ·...
TRANSCRIPT

Characterizing InterconnectionsandLinguisticPatternsinTwitter
JOHNNATAN MESSIAS
ADVISOR:FABRÍCIO BENEVENUTO
HTTP://JOHNNATAN.ME

ContentsqIntroductionoMotivationoGoalsoContributions
qRelatedWorksqDemographicInformationDatasetqInequalityinVisibility
HTTP://JOHNNATAN.ME
qLinguisticPatternsqDemographicGroupInterconnectionsqLeverageDemographicAspectstoDesignTransparentSystemsqConclusionqFutureWorkqPublications

IntroductionüSocialnetworkingsitesarepowerfulüFacebook:1.7bimonthlyactiveusersin2016üTwitter:317mimonthlyactiveusersin2016üPeopleposteverythingüPromotedebatesüDemographicinformationischallengetoobtainüWhyisimportanttostudydemographicaspects?
HTTP://JOHNNATAN.ME

MotivationüPerspectiveofSystemsüSociologicalpointofviewüLinguisticDifferencesüGenderandRaceDisparitiesüGenderandRaceInequalities
HTTP://JOHNNATAN.ME
üGlassCeilingüNotavailableinTwitterAPIüChallengeüDesignTransparentSystems

GoalsüInvestigateInequitiesinTermsofVisibilityüInvestigateLinguisticAspectsandTopicsofInterestsüCharacterizeInterconnectionsüDesignaSystemthatProvidesDataTransparency
HTTP://JOHNNATAN.ME

ContributionsüClearInsightintoHowGroupsofUsersConnectinTwitterüLinguisticStyleofWritingandTopicofInterestsofDemographicGroupsüInterconnectionsandInteractionsüWhoMakesTrends?Web-basesystemüPublishedWork
HTTP://JOHNNATAN.ME

RelatedWorküDemographicsinSocialMediaüInequalityinTwitterVisibilityüDemographicsandLinguisticAnalysisüAlgorithmicandDataTransparencyüRecommendationDiversityüFairness
HTTP://JOHNNATAN.ME

DemographicInformationDatasetüTwitterDataset
üCrawlingDemographicInformation
üBaselineDataset
üGatheringTweets
üExtractionofTopics
üLinguisticMeasures
üGatheringSocialConnectionsandInteractions
üPotentialLimitations
HTTP://JOHNNATAN.ME

TwitterDatasetüTwitterStreamAPIü1%RandomSampleüJuly– September2016ü341,457,982tweetsü50,270,310usersü6,286,477usersfromU.S.andEnglishtweetüTimezonefiltering
HTTP://JOHNNATAN.ME

CrawlingDemographic InformationüProfilePicturesURLüFace++API:Gender,Race,Age,andotherattributesü4.6miusersdiscarded(73.42%)◦Userschangedtheirprofilepicture◦ Pictures.donothaveaface◦ Pictureshavemorethanoneface
ü1,670,862U.S.userswithoneface
HTTP://JOHNNATAN.ME

BaselineDataset
16 Chapter 3. Demographic Information Dataset
3.2 Crawling Demographic Information
Most of the existing studies related to demographics of users in Twitter have lookedinto gender and age. Some efforts attempt to infer the user’s gender from the username Blevins and Mullen [2015]; Karimi et al. [2016]; Liu and Ruths [2013]; Misloveet al. [2011]. However, some users may not use their proper names, consequently, theirgender could not be inferred properly Liu and Ruths [2013]. Others have attemptedto identify patterns like ‘25 yr old’ or ‘born in 1990’ in Twitter profile description toidentify the user age Sloan et al. [2015].
Here, we use a different strategy that allows us to study another demographicaspect: the user’s race. To do that, we crawl the profile picture Web link of all Twitterusers identified as located within the United States. In December 2016, we crawled theprofile picture’s URLs of about 6 million users, discarding 4, 317, 834 (68.68%) of them.We discarded users in two situations, first when the user does not have a profile pictureand second when the user has changed her picture since our first crawl. When userschange their picture, their profile picture URL changes as well, making it impossiblefor us to gather these users in a second crawl.
From the remaining 1, 968, 643 users, we submitted the profile picture Web linksinto the Face++ API. Face++ is a face recognition platform based on deep learning Fanet al. [2014]; Yin et al. [2015] able to identify the gender (i.e. male and female), age,race (limited to asian, black, and white), such as more attributes related to smiling,face positions, glasses information from recognized faces in images. In this dissertation,we focus on gender and race attributes.
We have also discarded those users whose profile pictures do not have a recogniz-able face or have more than one recognizable face, according to Face++. Our baselinedataset, also used by Chakraborty et al. [2017], contains 1, 670, 863 users located in U.S.with identified demographic information. Table 3.1 shows the demographic distributionof users in our baseline dataset across the different demographic groups. The phasesof our data crawling and the amount of data discarded on each step are summarizedin Table 3.2.
Table 3.1: Absolute demographic distribution of 1.6 million users in baseline dataset.
Race
Gender
Total
Male Female
Asian 120, 950 (7.24%) 177, 205 (10.61%) 298, 155 (17.85%)Black 130, 954 (7.84%) 107, 827 (6.45%) 238, 781 (14.29%)White 538, 625 (32.23%) 595, 302 (35.63%) 1, 133, 927 (67.86%)Total 790, 529 (47.31%) 880, 334 (52.69%) 1, 670, 863 (100%)
HTTP://JOHNNATAN.ME
ü 1.6miusersü U.S.ü 1recognizedface

BaselineDataset
18 Chapter 3. Demographic Information Dataset
Table 3.3: Demographic distribution of 304, 477 users with linguistic attributes. Thenumbers in the parenthesis correspond to the Z-values.
Race (%)
Gender (%)
Total (%)
Male Female
Asian 7.07 (�3.85) 10.05 (�11.28) 17.12 (�10.90)Black 8.17 (8.53) 6.74 (7.68) 14.91 (11.69)White 32.88 (8.49) 35.09 (�7.69) 67.97 (1.20)Total 48.12 (10.91) 51.88 (�10.91) 100.00
Table 3.4: Basic statistical description of null models. k = 100 samples with a popula-tion of 304, 477 randomly selected users. We use confidence intervals of 95% confidencelevel.
Demographic Mean Z-value S.D. Min 25-perc Median 75-perc Max
Male 144, 035.1± 44.86 10.91 228.88 143,544 143,883.00 144,054.5 144,156.50 144,680
Female 160, 441.9± 44.86 -10.91 228.88 159,797 160,320.50 160,422.5 160,594.00 160,933
Asian 54, 311.5± 39.17 -10.90 199.87 53,907 54,177.25 54,296.5 54,444.00 54,803
Black 43, 514.01± 31.72 11.69 161.85 43,196 43,380.75 43,503.5 43,633.50 43,887
White 206, 651.49± 46.82 1.20 238.91 205,921 206,490.25 206,666.5 206,789.25 207,110
Asian Male 22, 043.64± 26.24 -3.85 133.88 21,674 21,958.75 22,040.5 22,115.50 22,429
Asian Female 32, 267.86± 28.92 -11.28 147.56 31,900 32,153.50 32,262.0 32,371.75 32,667
Black Male 23, 857.98± 23.81 8.53 121.48 23,634 23,777.75 23,858.0 23,930.00 24,197
Black Female 19, 656.03± 21.82 7.68 111.34 19,342 19,585.25 19,660.5 19,737.75 19,944
White Male 98, 133.48± 45.61 8.49 232.73 97,538 97,995.25 98,130.5 98,297.50 98,623
White Female 108, 518.01± 43.04 -7.69 219.62 108,025 108,348.25 108,501.5 108,688.00 109,015
3.4 Gathering Tweets
We are interested in correlating linguistic features of Twitter users with demographicinformation. We crawled the recent 3, 200 tweets of 304, 477 users for the purpose oflinguistic analysis. Table 3.3 shows the demographic breakdown of users in this datasetacross the different demographic groups. We can note a prevalence of females (51.88%)in comparison to males (48.12%) and a predominance of whites (67.97%) in comparisonto blacks (14.91%) and asians (17.12%). This means if we pick users randomly in ourdataset, we would expect demographic groups with these proportions. Table 3.5 showsthe statistical descriptions of the number of tweets with confidence intervals of 95%confidence level for each demographic groups.
3.5 Extraction of Topics
We extracted the information about topics of interests for active users using the WhoLikes What2 Web-based service Bhattacharya et al. [2014]. The produced topics are
2http://twitter-app.mpi-sws.org/who-likes-what
HTTP://JOHNNATAN.ME
3.3. Baseline Dataset 17
Table 3.2: Dataset construction
Phase Number of Users
Crawling 3 months of Tweets 50 millionFiltering U.S. users 6 million
U.S. users with profile image 1.9 millionBaseline: U.S. users with one face 1.6 million
Dataset 1: Recognized U.S. users with linguistic attributes 304, 477Dataset 2: Social connections and interactions 428, 697
3.3 Baseline Dataset
In this section, we use the null model as a method to estimate the statistical significanceof the observed trend in the given data. We compare the distribution of randomsamples created by the null model with the one of the original dataset and we measurethe statistical significance. This step is important due to some limitations to gatherall tweets and linguistic attributes for 1.6 million users. Therefore, to circumvent thislimitation, we prefer to randomly select 304, 477 users from the 1.6 million datasetand show the statistical significance of this sub-dataset which we use to show resultsregarding race and gender inequalities and linguistic patterns of Twitter users.
Table 3.1 shows the distribution of gender and race in the baseline dataset of the⇡ 1.6 million Twitter users between July and September 2016. Additionally, Table 3.3shows the demographic breakdown of the 304, 477 randomly selected users across thedifferent demographic groups. To construct a null model, we create k random samplesfrom the whole population (our crawled dataset with demographic aspects), where eachsample has exactly 304, 477 users. For each sample, we count how many asians, blacks,whites, males, and females are included. Then, the ZWhite is computed as follows:
ZWhite =|UWhite|�mean(|SWhite|)
std(|SWhite|)(3.1)
where mean(·) is the mean and std(·) is the standard deviation of the values frommultiple samples. We use the same equation for the other gender and race aspects.Table 3.4 presents a detailed description of the comparison with null model. Addition-ally, Table 3.3 presents the demographic distribution of 304, 477 users with linguisticattributes. The numbers in the parenthesis correspond to the Z-values.
Intuitively, when the absolute value of Z-value becomes bigger (either positiveor negative), the trend (more or less number, respectively) is less likely observed bychance. In this work, the size of population is 304, 477, and k=100.
ü Limitationsü 304,477randomusersü Nullmodelü 100randomsamples

BaselineDataset
18 Chapter 3. Demographic Information Dataset
Table 3.3: Demographic distribution of 304, 477 users with linguistic attributes. Thenumbers in the parenthesis correspond to the Z-values.
Race (%)
Gender (%)
Total
Male Female
Asian 7.07 (�3.85) 10.05 (�11.28) 17.12 (�10.90)Black 8.17 (8.53) 6.74 (7.68) 14.91 (11.69)White 32.88 (8.49) 35.09 (�7.69) 67.97 (1.20)Total 48.12 (10.91) 51.88 (�10.91) 100.00
Table 3.4: Basic statistical description of null models. k = 100 samples with a popula-tion of 304, 477 randomly selected users. We use confidence intervals of 95% confidencelevel.
Demographic Mean Z-value S.D. Min 25-perc Median 75-perc Max
Male 144, 035.1± 44.86 10.91 228.88 143,544 143,883.00 144,054.5 144,156.50 144,680
Female 160, 441.9± 44.86 -10.91 228.88 159,797 160,320.50 160,422.5 160,594.00 160,933
Asian 54, 311.5± 39.17 -10.90 199.87 53,907 54,177.25 54,296.5 54,444.00 54,803
Black 43, 514.01± 31.72 11.69 161.85 43,196 43,380.75 43,503.5 43,633.50 43,887
White 206, 651.49± 46.82 1.20 238.91 205,921 206,490.25 206,666.5 206,789.25 207,110
Asian Male 22, 043.64± 26.24 -3.85 133.88 21,674 21,958.75 22,040.5 22,115.50 22,429
Asian Female 32, 267.86± 28.92 -11.28 147.56 31,900 32,153.50 32,262.0 32,371.75 32,667
Black Male 23, 857.98± 23.81 8.53 121.48 23,634 23,777.75 23,858.0 23,930.00 24,197
Black Female 19, 656.03± 21.82 7.68 111.34 19,342 19,585.25 19,660.5 19,737.75 19,944
White Male 98, 133.48± 45.61 8.49 232.73 97,538 97,995.25 98,130.5 98,297.50 98,623
White Female 108, 518.01± 43.04 -7.69 219.62 108,025 108,348.25 108,501.5 108,688.00 109,015
3.4 Gathering Tweets
We are interested in correlating linguistic features of Twitter users with demographicinformation. We crawled the recent 3, 200 tweets of 304, 477 users for the purpose oflinguistic analysis. Table 3.3 shows the demographic breakdown of users in this datasetacross the different demographic groups. We can note a prevalence of females (51.88%)in comparison to males (48.12%) and a predominance of whites (67.97%) in comparisonto blacks (14.91%) and asians (17.12%). This means if we pick users randomly in ourdataset, we would expect demographic groups with these proportions. Table 3.5 showsthe statistical descriptions of the number of tweets with confidence intervals of 95%confidence level for each demographic groups.
3.5 Extraction of Topics
We extracted the information about topics of interests for active users using the WhoLikes What2 Web-based service Bhattacharya et al. [2014]. The produced topics are
2http://twitter-app.mpi-sws.org/who-likes-what
HTTP://JOHNNATAN.ME
ü 95%confidencelevel

GatheringTweets
3.6. Linguistic Measures 19
Table 3.5: Basic statistical descriptions of number of tweets with confidence intervalsof 95% confidence level.
Demographic Mean Median Max
Male 11, 624.76± 109.40 3, 874 1, 683, 948Female 12, 933.40± 105.89 4, 885 1, 132, 964Asian 14, 020.92± 183.73 5, 544 1, 108, 525Black 18, 949.91± 248.46 8, 245 973, 225White 10, 432.49± 85.28 3, 637 1, 683, 948
derived from the list of the friends (other users the user is following) of each user.Then, we sort the produced topics based on the frequency to conclude the 20 mostcommon topics from the Twitter users, including them as binary variables (1 if theuser is interested in this topic, 0 otherwise). We manually cleaned several top topiclabels following the same procedure as Nilizadeh et al. [2016]. Therefore, we mergetopics like businesses and biz, group topics into similarity (e.g. celebrities and famous,actors and actor), and remove some topics like best, br, bro, new. Table 3.6 presents alist of the 20-top topics and the merged sub-topics in each one as well as the numberof users that belong to them.
3.6 Linguistic Measures
To quantify gender and race dimensions in the language of Twitter users, we use thepsycholinguistic lexicon Linguistic Inquiry and Word Count (LIWC) Tausczik and Pen-nebaker [2010]. The crawled tweets of a user were gathered in a supertext (the con-catenation of all tweets) in order to extract a variety of linguistic metrics. The featuresare categorized into 3 main categories, (1) affective attributes; (2) cognitive attributes;and (3) linguistic style attributes, as De Choudhury et al. [2017] propose. For thiswork, we considered 36 features from LIWC categorized in 6 groups in order to findthe main differences across each demographic group.
The affective attributes contemplate features that show how strong is the expres-sion of feelings like anger, anxiety, sadness, and swear. Cognitive attributes are relatedto the process of knowledge acquisition through perception. The lexical density andawareness group gather features related to the language itself and its structure. Tem-poral references are related to the tense expressed in the writing, while interpersonalfocuses in present features related to the speech. The social/personal concerns groupcomprises features that express characteristics inherent to the individual as well his/herrelation to the environment where he/she lives.
HTTP://JOHNNATAN.ME
ü TwitterRestAPIü 3,200morerecentlytweetsü 304,477usersü TwitterLimitation
ü 95%confidencelevel

ExtractionofTopicsüWhoLikesWhatWeb-baseServiceüListofthefriendsüManuallycleanedsub-topicsinto:◦ celebrities ==famous◦ actors ==actor◦ business ==biz◦ Removed:best,br,bro,new
üTop20:by frequency
HTTP://JOHNNATAN.ME

HTTP://JOHNNATAN.ME
20 Chapter 3. Demographic Information Dataset
Table 3.6: 20-top topics of user’s interests
Topic Sub-Topics Total
World world, earth, hollywood, usa, canada, texas,international, nyc, country, city, boston, san francisco,france, america, los angeles, brasil, london, india
290, 030
Celebrities celebrities, famous, stars, celebs, celebrity, star, celeb 245, 125Entertainment entertainment 244, 956Music music, pop, hip hop, rap, gospel, hiphop 227, 986TV tv, television 225, 682Life life, lifestyle, health, healthcare, fitness, food, style,
smile, drink157, 032
Fun fun, funny, humor, lol, laugh 154, 058Info info, information 147, 567Artists musicians, singers, artist, singer, musician, rappers,
bands141, 519
Actors actors, actresses, actress, actor 140, 647Media sports news, tech news, newspapers, music news,
breaking news, world news, news media, radio, internet,social media, youtube, sports media, magazines,magazine
135, 849
Writers writers 126, 051Bloggers bloggers, blogs, blog 110, 699Business business, biz, businesses 107, 361Sports sports, football, basketball, baseball, soccer, futbol,
basket, martial arts, sport, mma, golf, cricket, boxing,motorsports, f1, racing
93, 611
Movie movie, movies, film, films 88, 863Organizations organizations, nfl, nba, mlb, nhl, ufc, lfc, lgbt 82, 568Technology technology, tech, iphone, digital, geek, software,
computer, electronic, android, xbox, mac, gadgets,programming, geeks
72, 137
Politics politics, government, political, politicians, politician 64, 735Companies companies, apple, company, microsoft, google 53, 128
ExtractionofTopics

20 Chapter 3. Demographic Information Dataset
Table 3.6: 20-top topics of user’s interests
Topic Sub-Topics Total
World world, earth, hollywood, usa, canada, texas,international, nyc, country, city, boston, san francisco,france, america, los angeles, brasil, london, india
290, 030
Celebrities celebrities, famous, stars, celebs, celebrity, star, celeb 245, 125Entertainment entertainment 244, 956Music music, pop, hip hop, rap, gospel, hiphop 227, 986TV tv, television 225, 682Life life, lifestyle, health, healthcare, fitness, food, style,
smile, drink157, 032
Fun fun, funny, humor, lol, laugh 154, 058Info info, information 147, 567Artists musicians, singers, artist, singer, musician, rappers,
bands141, 519
Actors actors, actresses, actress, actor 140, 647Media sports news, tech news, newspapers, music news,
breaking news, world news, news media, radio, internet,social media, youtube, sports media, magazines,magazine
135, 849
Writers writers 126, 051Bloggers bloggers, blogs, blog 110, 699Business business, biz, businesses 107, 361Sports sports, football, basketball, baseball, soccer, futbol,
basket, martial arts, sport, mma, golf, cricket, boxing,motorsports, f1, racing
93, 611
Movie movie, movies, film, films 88, 863Organizations organizations, nfl, nba, mlb, nhl, ufc, lfc, lgbt 82, 568Technology technology, tech, iphone, digital, geek, software,
computer, electronic, android, xbox, mac, gadgets,programming, geeks
72, 137
Politics politics, government, political, politicians, politician 64, 735Companies companies, apple, company, microsoft, google 53, 128

LinguisticMeasuresüLinguisticInquiryandWordCount
(LIWC)üSupertextoftweetsü3categories:oAffectiveoCognitiveoLinguisticStyle
ü36features
HTTP://JOHNNATAN.ME
ü6groups:◦ AffectiveAttributes◦ CognitiveAttributes◦ LexicalDensityandAwareness◦ TemporalReferences◦ Social/PersonalConcerns◦ InterpersonalFocus

GatheringSocialConnectionsandInteractionsüFollowersandFriends
üUnfeasibleduetoFace++
üRandomlySelect6,000users
üGathertheirfriends(maxof5,000)◦ Mostrecent◦ Allfriends:98.51%
üGatherdemographicinformation◦ Atleast5%ofusers◦ Avg.10.15%andmedian:9.40%
HTTP://JOHNNATAN.ME
üInteractionsbasedonRTandmentions
üCrawledalltweets(maxof3,200)foreachuser
üIdentifiedusersmentionedorretweeted
üGatherDemographicInformation◦ 5%ofretweeters andwhomentioned

GatheringSocialConnectionsandInteractions
HTTP://JOHNNATAN.ME
22 Chapter 3. Demographic Information Dataset
Table 3.7: Number of Friends in each Group
White Black Asian Total
Male 151, 840 52, 437 24, 299 228, 576Female 137, 010 31, 011 32, 100 200, 121Total 288, 850 83, 448 56, 399 428, 697
Table 3.8: Number of Interactions in each Group
White Black Asian Total
Male 246, 879 109, 744 51, 370 407, 993Female 202, 338 60, 108 71, 137 333, 583Total 449, 217 169, 852 122, 507 741, 576
our analysis. Table 3.8 summarizes the amount of crawled users for each demographicgroup.
Our study about the connections among demographic groups (Chapter 6) is basedon this specific dataset.
3.8 Potential Limitations
The gender and race inference are challenge tasks, and as other existing strategies havelimitations and the accuracy of Face++ inferences is an obvious concern in our effort.The limitations of our data are discussed next.
Accuracy of the inference by Face++: Face++ itself returns the con-fidence levels for the inferred gender and race attributes, and it returns an error rangefor inferred age. In our data, the average confidence level reported by Face++ is95.22 ± 0.015% for gender and 85.97 ± 0.024% for race, with a confidence interval of95%. Recent efforts have used Face++ for similar tasks and reported high confidencein manual inspections An and Weber [2016]; Zagheni et al. [2014]; Chakraborty et al.[2017]. Our dataset may also constitute the existence of fake accounts and bots. Previ-ous studies provide evidence for an important rate of fake accounts Freitas et al. [2015];Messias et al. [2013] in Twitter.
Data: Finally, we note that our approach to identify users located in U.S.may bring together some users located in the same U.S. time zone, but from differentcountries. We, however, believe that these users might represent a small fraction of theusers, given the predominance of active U.S. users in Twitter Cheng et al. [2009]. Also,we are using the 1% random sample of all tweets. However, the 1% random sample isnot the best data to capture all the dynamics happening in Twitter, its limitations are
ØNumberofFriends
ØNumberofInteractions

PotentialLimitations
HTTP://JOHNNATAN.ME

InequalityinVisibilityüAnalyzetheAssociationofDemographicAspectswithVisibilityüDiscoverPossibleInequalitiesüAudienceSize:FollowersandListsüGenderInequalityüRaceInequalityüTakingTogetherGenderandRaceInequality
HTTP://JOHNNATAN.ME
GenderInequality
HTTP://JOHNNATAN.ME
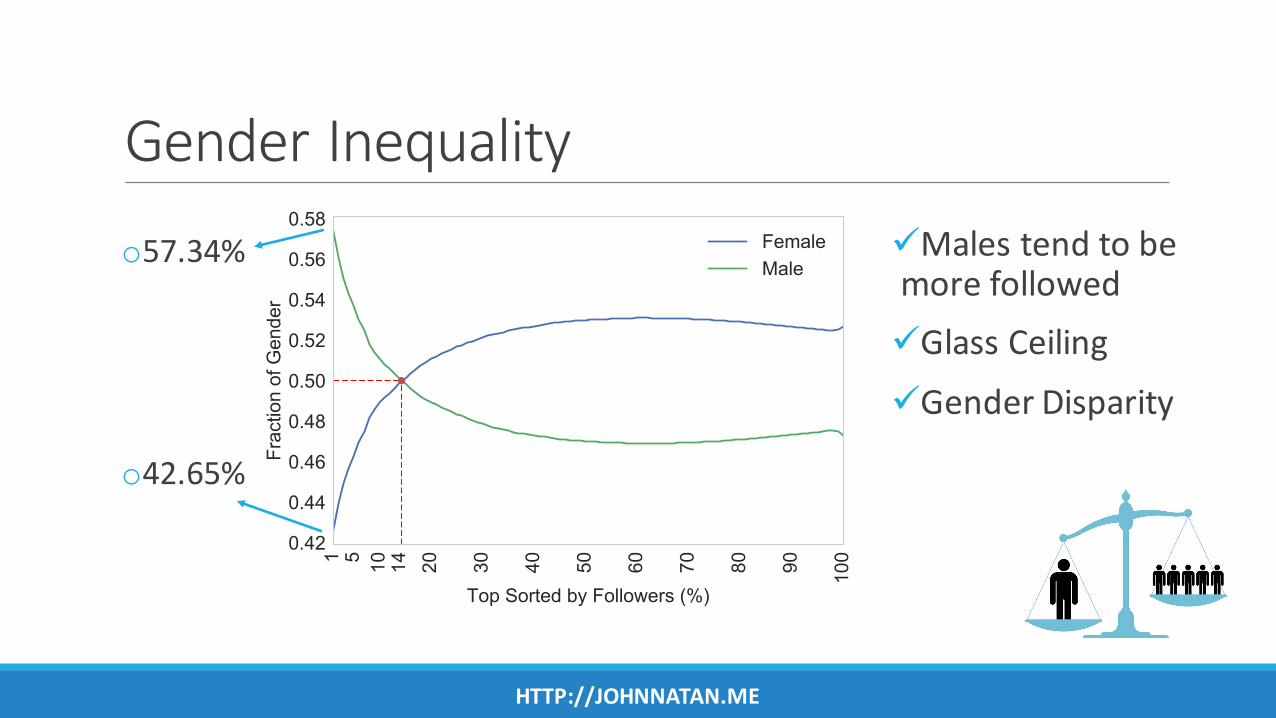
üMalestendtobemorefollowedüGlassCeilingüGenderDisparity
o57.34%
o42.65%

GenderInequality
HTTP://JOHNNATAN.ME
üMalestendtobemorelistedüGlassCeilingüGenderDisparity
o51.23%
o48.64%

RaceInequality
HTTP://JOHNNATAN.ME
üWhitetendtobemorefollowedüGlassCeilingüRaceDisparity

RaceInequality
HTTP://JOHNNATAN.ME
üWhitetendtobemorelistedüGlassCeilingüRaceDisparity

TakingTogetherGenderandRaceInequality
HTTP://JOHNNATAN.ME
üWhitemaletendtobemorefollowedüAlsoGlassCeilingformalesüGroupDisparity

TakingTogetherGenderandRaceInequality
HTTP://JOHNNATAN.ME
üWhitemaletendtobemorelistedüAlsoGlassCeilingformalesüGroupDisparity

TakingTogetherGenderandRaceInequality
HTTP://JOHNNATAN.ME
30 Chapter 4. Inequality in Visibility
Table 4.1: Relative proportion of each demographic group in the top 1% rank of userswith more followers (Followers column) and the most listed (listed column) in compar-ison to the baseline expected population.
Race
Followers Listed
Male Female Male FemaleAsian -10.60 -32.70 -16.36 -29.61Black +7.17 -57.73 -15.90 -34.20White +28.56 -5.84 +18.15 +5.04
4.4 Concluding Remarks
In this chapter, we analyzed the association of demographic status with visibility anddiscovering possible inequalities. We showed that the Twitter glass ceiling effect, typ-ically applied to females, also occurs in Twitter for males, if they are black or asian.Our analysis reinforces evidence about gender inequality in terms of visibility andintroduces race as a significant demographic aspect, which reveals hiding prejudicesbetween demographic groups. In the next chapter, we investigate how demographicgroups differ from each other in terms of linguistic and topic interests.
üTop1%

LinguisticPatternsüLinguisticDifferences◦MeanAbsoluteDifferences◦WilcoxonRankSumTest◦ Attributes◦ Affective◦ Cognitive◦ LexicalDensityandAwareness◦ TemporalReferences◦ InterpersonalFocus
üDifferencesinTopicInterests
HTTP://JOHNNATAN.ME

LinguisticDifferences
0
2
4
6
8
10
12
14
Affective
Attributes
Cognitive
Attributes
Lexicaldensity
andawareness
Temporal
references
Social/personal
concerns
Interpersonal
focus
Absolutedifferencebetween
MenandW
oman(%)
HTTP://JOHNNATAN.ME
MeanAbsoluteDifferencesBetweenMaleandFemaleUsers

LinguisticDifferences
0
5
10
15
20
25
Aff
ective
Att
ribute
s
Cognitiv
e
Att
ribute
s
Lexic
aldensity
anda
ware
ness
Tem
pora
lre
fere
nces
Socia
l/pers
onal
concern
s
Inte
rpers
onal
focus
Absolu
ted
iffe
renceb
etw
een
Whitea
ndB
lack/A
sia
n(
%)
HTTP://JOHNNATAN.ME
MeanAbsoluteDifferencesBetweenWhiteandBlack/AsianUsers

LinguisticDifferences
0
5
10
15
20
25
Aff
ective
Att
ribute
s
Cognitiv
e
Att
ribute
s
Lexic
aldensity
anda
ware
ness
Tem
pora
lre
fere
nces
Socia
l/pers
onal
concern
s
Inte
rpers
onal
focus
Absolu
ted
iffe
renceb
etw
een
Bla
cka
ndW
hite/A
sia
n(
%)
HTTP://JOHNNATAN.ME
MeanAbsoluteDifferencesBetweenBlackandWhite/AsianUsers

LinguisticDifferences
0
2
4
6
8
10
12
14
16
Affective
Attributes
Cognitive
Attributes
Lexicaldensity
andawareness
Temporal
references
Social/personal
concerns
Interpersonal
focus
Absolutedifferencebetween
AsianandW
hite/Black(%)
HTTP://JOHNNATAN.ME
MeanAbsoluteDifferencesBetweenAsianandWhite/BlackUsers

• femalestendtouseanxietyandsadnesstermsandphrases.
• malesexpresswithangerintheirtweets
• femalesaremorelikelytowritephrasesthatexpresscognitionandperception.
• femalesexpressmoreconfidenceandfeelingsintheirwriting.
• femalesmakemoreuseofverbs,auxiliaryverbs,conjunctions,andadverbs,whilemalesusemorearticlesandprepositions.
• Thetemporalreferencesattributesaremorepresentinthefemales.
• Social/PersonalConcernssuchasfamily,bio,friends,social,health,areusedmorebyfemales
• Concernofachievementisexpressedmoreinmale
• Femalesalsohaveahighertendencytowriteinthefirstpersonsingularandinsecondperson
• Malesusethefirstpersonplural
40 Chapter 5. Linguistic Patterns
Table 5.1: Differences between tweets from male and female users based on linguisticmeasures. µ(male) and µ(female) are the median value of the feature for male andfemale respectively. Statistical significance is count based on Wilcoxon rank sum tests.Linguistic features presents extremely significant except from hear (*:=significant)based on p-values.
µ(male) µ(female) z
Affective attributes
anger 0.0055 0.0056 4.733
anxiety 0.0016 0.0019 -74.534
sadness 0.0029 0.0034 -74.394
swear 0.0023 0.0026 -7.411
Cognitive attributes
Cognition
causation 0.0101 0.0104 -18.627
certainty 0.0101 0.0111 -60.593
tentativeness 0.0136 0.0141 -14.641
Perception
see 0.00957 0.0099 -24.538
hear 0.0055 0.0056 -0.033
⇤
feel 0.0035 0.0041 -70.766
percepts 0.0207 0.0218 -41.373
insight 0.0115 0.0125 -46.806
relative 0.1014 0.0999 18.026
Lexical Density and Awareness
verbs 0.1103 0.1170 -45.808
auxiliary verbs 0.0539 0.0583 -46.441
articles 0.0370 0.0340 77.303
prepositions 0.0843 0.0817 32.596
conjunctions 0.0279 0.0314 -72.098
adverbs 0.0317 0.0355 -66.915
Temporal references
present tense 0.0802 0.0871 -62.110
future tense 0.0103 0.0106 -15.118
Social/Personal Concerns
family 0.0026 0.0034 -93.252
friends 0.0028 0.0033 -66.168
social 0.0938 0.1021 -77.896
health 0.0037 0.0044 -76.446
religion 0.0024 0.0025 -26.485
bio 0.0157 0.0203 -102.681
body 0.0045 0.0056 -58.386
achievement 0.0116 0.0105 65.265
home 0.0022 0.0026 -74.049
sexual 0.0011 0.0012 -18.691
death 0.0014 0.0013 29.463
Interpersonal focus
1st p. singular 0.0245 0.0340 -97.329
1st p. plural 0.0046 0.0045 4.309
2nd p. 0.0160 0.0198 -88.482
3rd p. 0.0030 0.0031 -3.371
⇤⇤⇤

• BlackuserstendtoexpressmoreangerandswearthanWhite/Asian.
• Cognitiveattributes,almostallfeaturesweremorepresentinBlackuserstexts
• Blackusershavemorepresenceinfeatureslikeverbs,auxiliaryverbs,conjunctions,andadverbs
• PrepositionsaremorepresentamongWhiteusers.
• Blackpeopletendmoretousetermsrelatedtofamily,social,religion,andbody.
• ThereisapredominanceintheuseoffirstpersonpluralforWhite
• firstpersonsingular,secondpersonandthirdpersonaremoreprominentintheBlackgroup.
5.3. Concluding Remarks 41
Table 5.2: Differences between tweets from white, black, and asian users based onlinguistic measures. µ(White), µ(Black) and µ(Black) is the median value of featuresfor each demographic group respectively. Statistical significance is count based onWilcoxon rank sum tests. The p-values present extremely significant for all linguisticfeatures. We test the correlation of each unique demographic group with the others.
µ(White) µ(Black) µ(Asian) zW/B�A zB/W�A zA/W�B
Affective attributes
anger 0.0051 0.0081 0.0056 -67.261 94.610 -5.236
anxiety 0.0017 0.0019 0.0016 -0.696 33.789 -30.517
sadness 0.0031 0.0034 0.0032 -20.814 28.205 -0.625
swear 0.0021 0.0064 0.0027 -90.375 107.344 11.329
Cognitive attributes
Cognition
causation 0.0104 0.0105 0.0096 29.931 19.465 -54.832
certainty 0.0105 0.0116 0.0101 -19.404 62.239 -33.955
tentativeness 0.0138 0.0152 0.0130 -8.958 55.174 -40.226
Perception
see 0.0098 0.0098 0.0095 18.756 6.970 -29.506
hear 0.0055 0.0062 0.0054 -26.349 62.137 -25.331
feel 0.0037 0.0044 0.0039 -44.180 63.963 -5.128
percepts 0.0212 0.0223 0.0210 -14.067 43.711 -23.308
insight 0.0122 0.0128 0.0112 11.133 40.420 -51.201
relative 0.1020 0.1012 0.0936 50.614 15.841 -76.870
Lexical Density and Awareness
verbs 0.1125 0.1222 0.1082 -16.435 64.214 -39.436
auxiliary verbs 0.0554 0.0612 0.0529 -12.202 58.285 -39.130
articles 0.0366 0.0339 0.0314 96.532 -26.056 -94.363
prepositions 0.0851 0.0817 0.0743 77.024 1.032 -95.556
conjunctions 0.0291 0.0319 0.0286 -11.852 43.571 -25.898
adverbs 0.0329 0.0363 0.0325 -17.239 48.159 -23.542
Temporal references
present tense 0.0825 0.0912 0.0798 -21.972 69.126 -37.196
future tense 0.0103 0.0119 0.0099 -28.333 79.181 -38.719
Social/Personal Concerns
family 0.0029 0.0040 0.0032 -74.318 86.721 10.755
friend 0.0031 0.0033 0.0033 -26.248 25.332 8.717
social 0.0956 0.1101 0.0971 -60.389 90.830 -10.166
health 0.0040 0.0044 0.0039 -9.579 45.973 -30.920
religion 0.0024 0.0031 0.0024 -53.672 85.163 -13.154
bio 0.0176 0.0204 0.0179 -32.215 53.914 -10.492
body 0.0048 0.0067 0.0052 -62.906 86.903 -3.428
achievement 0.0114 0.0109 0.0097 69.227 -1.632 -83.506
home 0.0025 0.0024 0.0022 50.362 -4.554 -57.624
sexual 0.0011 0.0019 0.0012 -51.768 71.799 -3.084
death 0.0014 0.0015 0.0013 4.356 31.454 -34.554
Interpersonal focus
1st p. singular 0.0268 0.0355 0.0296 -51.874 63.492 4.760
1st p. plural 0.0048 0.0042 0.0039 77.425 -28.107 -68.994
2nd p. 0.0169 0.0227 0.0177 -63.930 95.495 -10.148
3rd p. 0.0030 0.0039 0.0028 -36.070 87.717 -37.143

LinguisticDifferences42 Chapter 5. Linguistic Patterns
Table 5.3: Ranking differences of gender top phrases. We use ne for no existing phrasesin a group.
Rank(female) Rank(male) Diff(F-M)
i do n’t 1 1 0i ca n’t 2 2 0
you do n’t 3 3 0i ’m not 4 4 0
ca n’t wait 5 8 3i ’m so 6 19 13
i love you 7 15 8do n’t know 8 11 3
i want to 9 24 15more for virgo 10 55 45
more for cancer 11 29 18i wan na 12 28 16
! i ’m 13 25 12you ca n’t 14 16 2
more for libra 15 39 24it ’s a 16 10 6
and i ’m 17 33 16more for pisces 18 ne -
i need to 19 34 15do n’t have 20 27 7
Table 5.4: Ranking differences of race top phrases. We use ne for no existing phrasesin a group.
Rank(White) Rank(Black) Rank(Asian) Diff(W-B) Diff(W-A) Diff(B-A)i do n’t 1 1 1 0 0 0
i ca n’t 2 2 2 0 0 0
ca n’t wait 3 18 7 15 4 11
you do n’t 4 4 3 0 1 1
i ’m not 5 8 6 3 1 2
i love you 6 33 4 27 2 29
i ’m so 7 16 6 9 1 10
do n’t know 8 19 11 11 3 8
it ’s a 9 26 16 17 7 10
one of the 10 48 20 38 10 28
i want to 11 47 10 36 1 37
! i ’m 12 46 29 34 17 17
if you ’re 13 28 19 15 6 9
thank you for 14 126 28 112 14 98
it ’s not 15 34 32 19 17 2
and i ’m 16 58 21 42 5 37
you ca n’t 17 17 17 0 0 0
i ’m at 18 53 26 35 8 27
n’t wait to 19 100 51 81 32 49
i liked a 20 7 ne 13 - -
HTTP://JOHNNATAN.ME
• Phrasesexpressingnegationareinthetoppositionsforbothmalesandfemales.Itisalsocleartoseethat
• Femalesaremoreintosignsthanmalessincephraseswiththiskindofcontentpresenthigherdifferencesinthegenderranking.
• Itiscommontheusageofslangslike”don’t”,”can’t”and”wanna”forbothgenders.
• 6,000users

LinguisticDifferences
42 Chapter 5. Linguistic Patterns
Table 5.3: Ranking differences of gender top phrases. We use ne for no existing phrasesin a group.
Rank(female) Rank(male) Diff(F-M)
i do n’t 1 1 0i ca n’t 2 2 0
you do n’t 3 3 0i ’m not 4 4 0
ca n’t wait 5 8 3i ’m so 6 19 13
i love you 7 15 8do n’t know 8 11 3
i want to 9 24 15more for virgo 10 55 45
more for cancer 11 29 18i wan na 12 28 16
! i ’m 13 25 12you ca n’t 14 16 2
more for libra 15 39 24it ’s a 16 10 6
and i ’m 17 33 16more for pisces 18 ne -
i need to 19 34 15do n’t have 20 27 7
Table 5.4: Ranking differences of race top phrases. We use ne for no existing phrasesin a group.
Rank(White) Rank(Black) Rank(Asian) Diff(W-B) Diff(W-A) Diff(B-A)i do n’t 1 1 1 0 0 0
i ca n’t 2 2 2 0 0 0
ca n’t wait 3 18 7 15 4 11
you do n’t 4 4 3 0 1 1
i ’m not 5 8 6 3 1 2
i love you 6 33 4 27 2 29
i ’m so 7 16 6 9 1 10
do n’t know 8 19 11 11 3 8
it ’s a 9 26 16 17 7 10
one of the 10 48 20 38 10 28
i want to 11 47 10 36 1 37
! i ’m 12 46 29 34 17 17
if you ’re 13 28 19 15 6 9
thank you for 14 126 28 112 14 98
it ’s not 15 34 32 19 17 2
and i ’m 16 58 21 42 5 37
you ca n’t 17 17 17 0 0 0
i ’m at 18 53 26 35 8 27
n’t wait to 19 100 51 81 32 49
i liked a 20 7 ne 13 - -
HTTP://JOHNNATAN.ME
• Phrasescontainingexpressionslike”i don’t”,”ican’t”and”i’m not”appearinthetoppositionsforalltheracialgroups.
• Differenceinrankingoftheexpression”i loveyou”• WhiteandAsianusers
seemtobemorelikelytotweetcontentswiththisexpression thanBlackusers.
• Theexpression”i wantto”appearsmoreofteninthewritingofWhiteandAsianusersthanintheBlacks.
• 6,000users

Differences inTopics
�0.2 �0.1 0.0 0.1 0.2 0.3
log(Male/Female)
Life
Actors
Movie
Artists
Fun
Music
Entertainment
Celebrities
TV
World
Business
Bloggers
Companies
Media
Politics
Info
Writers
Technology
Organizations
Sports
HTTP://JOHNNATAN.ME
MalevsFemale

Differences inTopics
�0.15 �0.10 �0.05 0.00 0.05 0.10 0.15 0.20 0.25
log(White/Asian)
Artists
Actors
Music
Life
Celebrities
Entertainment
Fun
TV
World
Companies
Movie
Info
Sports
Media
Technology
Business
Bloggers
Organizations
Writers
Politics
HTTP://JOHNNATAN.ME
WhitevsAsian

Differences inTopics
�0.15 �0.10 �0.05 0.00 0.05 0.10 0.15 0.20 0.25
log(White/Black)
Artists
Life
Music
Celebrities
Entertainment
Sports
Actors
World
TV
Business
Fun
Media
Organizations
Info
Writers
Bloggers
Companies
Politics
Movie
Technology
HTTP://JOHNNATAN.ME
WhitevsBlack

Differences inTopics
�0.15 �0.10 �0.05 0.00 0.05 0.10 0.15
log(Asian/Black)
Business
Sports
Organizations
Life
Writers
Music
Media
Entertainment
World
Celebrities
Politics
Artists
TV
Bloggers
Fun
Info
Actors
Technology
Companies
Movie
HTTP://JOHNNATAN.ME
AsianvsBlack

DemographicGroupInterconnectionsüAnalyzetheInterconnectionsandInteractionsofDemographicGroups
üGenderanditsInterconnections◦ ProbabilisticGraph
üRaceanditsInterconnections◦ ProbabilisticGraph
üDemographyofInterconnections◦ RelativeIncreaseorDecreasefromWhatWeWouldExpect
üDataset◦ 448,697users
HTTP://JOHNNATAN.ME

male female0.50
0.44
0.56
0.50
GenderanditsInterconnections
HTTP://JOHNNATAN.ME
üWhatwewouldexpect
male female0.47
0.36
0.64
0.53
18 Chapter 3. Demographic Information Dataset
Table 3.3: Demographic distribution of 304, 477 users with linguistic attributes. Thenumbers in the parenthesis correspond to the Z-values.
Race (%)
Gender (%)
Total (%)
Male Female
Asian 7.07 (�3.85) 10.05 (�11.28) 17.12 (�10.90)Black 8.17 (8.53) 6.74 (7.68) 14.91 (11.69)White 32.88 (8.49) 35.09 (�7.69) 67.97 (1.20)Total 48.12 (10.91) 51.88 (�10.91) 100.00
Table 3.4: Basic statistical description of null models. k = 100 samples with a popula-tion of 304, 477 randomly selected users. We use confidence intervals of 95% confidencelevel.
Demographic Mean Z-value S.D. Min 25-perc Median 75-perc Max
Male 144, 035.1± 44.86 10.91 228.88 143,544 143,883.00 144,054.5 144,156.50 144,680
Female 160, 441.9± 44.86 -10.91 228.88 159,797 160,320.50 160,422.5 160,594.00 160,933
Asian 54, 311.5± 39.17 -10.90 199.87 53,907 54,177.25 54,296.5 54,444.00 54,803
Black 43, 514.01± 31.72 11.69 161.85 43,196 43,380.75 43,503.5 43,633.50 43,887
White 206, 651.49± 46.82 1.20 238.91 205,921 206,490.25 206,666.5 206,789.25 207,110
Asian Male 22, 043.64± 26.24 -3.85 133.88 21,674 21,958.75 22,040.5 22,115.50 22,429
Asian Female 32, 267.86± 28.92 -11.28 147.56 31,900 32,153.50 32,262.0 32,371.75 32,667
Black Male 23, 857.98± 23.81 8.53 121.48 23,634 23,777.75 23,858.0 23,930.00 24,197
Black Female 19, 656.03± 21.82 7.68 111.34 19,342 19,585.25 19,660.5 19,737.75 19,944
White Male 98, 133.48± 45.61 8.49 232.73 97,538 97,995.25 98,130.5 98,297.50 98,623
White Female 108, 518.01± 43.04 -7.69 219.62 108,025 108,348.25 108,501.5 108,688.00 109,015
3.4 Gathering Tweets
We are interested in correlating linguistic features of Twitter users with demographicinformation. We crawled the recent 3, 200 tweets of 304, 477 users for the purpose oflinguistic analysis. Table 3.3 shows the demographic breakdown of users in this datasetacross the different demographic groups. We can note a prevalence of females (51.88%)in comparison to males (48.12%) and a predominance of whites (67.97%) in comparisonto blacks (14.91%) and asians (17.12%). This means if we pick users randomly in ourdataset, we would expect demographic groups with these proportions. Table 3.5 showsthe statistical descriptions of the number of tweets with confidence intervals of 95%confidence level for each demographic groups.
3.5 Extraction of Topics
We extracted the information about topics of interests for active users using the WhoLikes What2 Web-based service Bhattacharya et al. [2014]. The produced topics are
2http://twitter-app.mpi-sws.org/who-likes-what
üFriendship
üInteractionüMaleandfemaleuserstakeresponsibility

18 Chapter 3. Demographic Information Dataset
Table 3.3: Demographic distribution of 304, 477 users with linguistic attributes. Thenumbers in the parenthesis correspond to the Z-values.
Race (%)
Gender (%)
Total (%)
Male Female
Asian 7.07 (�3.85) 10.05 (�11.28) 17.12 (�10.90)Black 8.17 (8.53) 6.74 (7.68) 14.91 (11.69)White 32.88 (8.49) 35.09 (�7.69) 67.97 (1.20)Total 48.12 (10.91) 51.88 (�10.91) 100.00
Table 3.4: Basic statistical description of null models. k = 100 samples with a popula-tion of 304, 477 randomly selected users. We use confidence intervals of 95% confidencelevel.
Demographic Mean Z-value S.D. Min 25-perc Median 75-perc Max
Male 144, 035.1± 44.86 10.91 228.88 143,544 143,883.00 144,054.5 144,156.50 144,680
Female 160, 441.9± 44.86 -10.91 228.88 159,797 160,320.50 160,422.5 160,594.00 160,933
Asian 54, 311.5± 39.17 -10.90 199.87 53,907 54,177.25 54,296.5 54,444.00 54,803
Black 43, 514.01± 31.72 11.69 161.85 43,196 43,380.75 43,503.5 43,633.50 43,887
White 206, 651.49± 46.82 1.20 238.91 205,921 206,490.25 206,666.5 206,789.25 207,110
Asian Male 22, 043.64± 26.24 -3.85 133.88 21,674 21,958.75 22,040.5 22,115.50 22,429
Asian Female 32, 267.86± 28.92 -11.28 147.56 31,900 32,153.50 32,262.0 32,371.75 32,667
Black Male 23, 857.98± 23.81 8.53 121.48 23,634 23,777.75 23,858.0 23,930.00 24,197
Black Female 19, 656.03± 21.82 7.68 111.34 19,342 19,585.25 19,660.5 19,737.75 19,944
White Male 98, 133.48± 45.61 8.49 232.73 97,538 97,995.25 98,130.5 98,297.50 98,623
White Female 108, 518.01± 43.04 -7.69 219.62 108,025 108,348.25 108,501.5 108,688.00 109,015
3.4 Gathering Tweets
We are interested in correlating linguistic features of Twitter users with demographicinformation. We crawled the recent 3, 200 tweets of 304, 477 users for the purpose oflinguistic analysis. Table 3.3 shows the demographic breakdown of users in this datasetacross the different demographic groups. We can note a prevalence of females (51.88%)in comparison to males (48.12%) and a predominance of whites (67.97%) in comparisonto blacks (14.91%) and asians (17.12%). This means if we pick users randomly in ourdataset, we would expect demographic groups with these proportions. Table 3.5 showsthe statistical descriptions of the number of tweets with confidence intervals of 95%confidence level for each demographic groups.
3.5 Extraction of Topics
We extracted the information about topics of interests for active users using the WhoLikes What2 Web-based service Bhattacharya et al. [2014]. The produced topics are
2http://twitter-app.mpi-sws.org/who-likes-what
white0.70
0.10
0.79
black
asian
0.32
0.16
RaceanditsInterconnections
HTTP://JOHNNATAN.ME
üWhatwewouldexpect
üFriendship üInteractionwhite
0.62
0.15
0.74
black
asian
0.38
0.21
üWhiteuserstendtobethemostfollowedbyusers

asianfemale
-6%
-3%
asianmale
+49%
whitemale
+130%
blackmale
+9%
whitefemale
+86%
blackfemale
-25%
-22%
+28%
-31%
-17%
-22%
-25%
+28%
-7%
+18%
DemographyofInterconnections
HTTP://JOHNNATAN.ME
üFriendship üInteraction
asianfemale
+41%
+66%
asianmale
+61%
whitemale
+232%
blackmale
+9%
whitefemale
+164%
blackfemale
+4%
-7%
+28%
-34%
-31%
-38%
-25%
+28%
-30%
+5%
üWhitemalesaremoreover-represented
üHighinteractionsamongBlacks
üAsians areunder-represented

LeverageDemographicAspectstoDesignTransparentSystemsüDemographicsaspectsarevaluabletoprovidetransparencyüWhiteHouseSuggestsMoreTransparencyinSystemsüTwitterTrendingTopics◦WhoMakesTrends?Web-basedSystem
üGoogleSuggestion
HTTP://JOHNNATAN.ME

WhoMakesTrends?üReal-timeWeb-basedSystemüTrendPromotersüTrendAdoptersüGender,Race,andAgeüUS-basedTwitterUsersü1%RandomSampleühttp://twitter-app.mpi-sws.org/who-makes-trends/
HTTP://JOHNNATAN.ME

WhoMakesTrends?
HTTP://JOHNNATAN.ME

WhoMakesTrends?
HTTP://JOHNNATAN.ME

Datacollectionü1%RandomSampleUSTweetsinEnglishü1%Worldwide<1%US
üBoundingBoxüTrendingTopicsofTwitter(every5-min)üESTTimeZoneüTwitterStreamAPIüSinceJanuary2017üDemographicInformationFromFace++
HTTP://JOHNNATAN.ME

TrendingTopicAnalysis
HTTP://JOHNNATAN.ME
7.1. Who Makes Trends? 53
Adopters; and (iii) Expected Distribution, similarly to the methodology in Section 3.2,we submitted the profile picture Web links into the Face++ API. We have also dis-carded those users whose profile pictures do not have a recognizable face or have morethan one recognizable face, according to Face++. Finally, the service is able to showthe demographic distribution of Twitter Trending Topics.
7.1.2 Trending Topic Analysis
To compare the demographics of Twitter users with the demographics of the offlinepopulation, we collect the demographics of U.S. residents from the U.S. Census Bureau5
6 and present in Table 7.1. We see that some demographic groups present more inTwitter compared to their share of U.S. population. As an illustration, the presenceof asians in Twitter is about 3.06 times more than in the overall U.S. population.Similarly, the adolescent and young people present much more in Twitter. However,mid-aged and old population have comparatively significantly less presence in Twitter.Our findings corroborate with a recent survey on social media population conductedby Pew Research7.
Table 7.1: Comparing the demographics of the population in U.S., and the demograph-ics of U.S.-based Twitter users, whose tweets were included in the 1% random sampleduring January – May 2017, and whose demographic information could be inferred.
Baseline
Gender (%) Race (%) Age Group (%)Male Female White Black Asian Adolescent Young Mid-aged Old
U.S.Population 49.20 50.80 72.40 12.60 4.80 13.60 26.70 33.20 13.50
TwitterPopulation 45.97 54.03 73.05 12.25 14.70 26.37 62.58 10.80 0.25
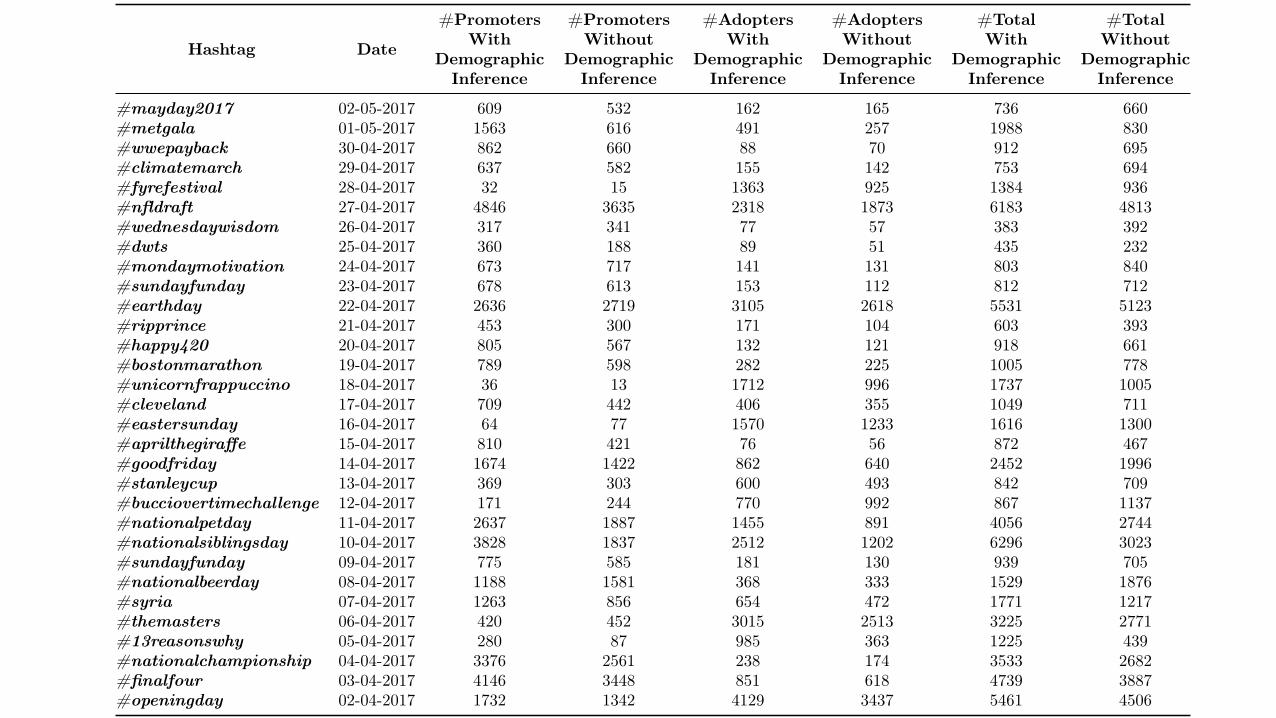
Table 7.2, shows the amount of promoters, adopters, and the total users withinferred demographic information and also the total of users we could not infer thedemographics who used the specific trending hashtag from April 2nd to May 2nd,2017, sorted in a descending order based on the date. As an interesting finding, sometrending hashtags appears to be promoted by Twitter even when there are not somany users posting tweets about this topic. We believe it may happen due to someimportant and well-known events. Therefore, to give more visibility to those contents,Twitter choose them as trending. For example, the trending hashtags #fyrefestival,#unicornfrappuccino, and #eastersunday.
5https://www.census.gov/topics/population/age-and-sex.html
6http://census.gov/prod/cen2010/briefs/c2010br-02.pdf
7http://pewinternet.org/2016/11/11/social-media-update-2016
HTTP://JOHNNATAN.ME
7.1.W
ho
Makes
Tren
ds?
55
Table 7.2: Top hashtags during 31 days from April 2nd to May 2nd, 2017. They are sorted in a descending order based on thedate. This Table shows the number of promoters, adopters, and the total users with inferred demographic information. Also, itshows the number of total users who we could not infer the demographic information. The hashtags are clickable links that pointto their demographic distribution on Who Makes Trends? service.
Hashtag Date
#PromotersWith
DemographicInference
#PromotersWithout
DemographicInference
#AdoptersWith
DemographicInference
#AdoptersWithout
DemographicInference
#TotalWith
DemographicInference
#TotalWithout
DemographicInference
#mayday2017 02-05-2017 609 532 162 165 736 660#metgala 01-05-2017 1563 616 491 257 1988 830#wwepayback 30-04-2017 862 660 88 70 912 695#climatemarch 29-04-2017 637 582 155 142 753 694#fyrefestival 28-04-2017 32 15 1363 925 1384 936#nfldraft 27-04-2017 4846 3635 2318 1873 6183 4813#wednesdaywisdom 26-04-2017 317 341 77 57 383 392#dwts 25-04-2017 360 188 89 51 435 232#mondaymotivation 24-04-2017 673 717 141 131 803 840#sundayfunday 23-04-2017 678 613 153 112 812 712#earthday 22-04-2017 2636 2719 3105 2618 5531 5123#ripprince 21-04-2017 453 300 171 104 603 393#happy420 20-04-2017 805 567 132 121 918 661#bostonmarathon 19-04-2017 789 598 282 225 1005 778#unicornfrappuccino 18-04-2017 36 13 1712 996 1737 1005#cleveland 17-04-2017 709 442 406 355 1049 711#eastersunday 16-04-2017 64 77 1570 1233 1616 1300#aprilthegiraffe 15-04-2017 810 421 76 56 872 467#goodfriday 14-04-2017 1674 1422 862 640 2452 1996#stanleycup 13-04-2017 369 303 600 493 842 709#bucciovertimechallenge 12-04-2017 171 244 770 992 867 1137#nationalpetday 11-04-2017 2637 1887 1455 891 4056 2744#nationalsiblingsday 10-04-2017 3828 1837 2512 1202 6296 3023#sundayfunday 09-04-2017 775 585 181 130 939 705#nationalbeerday 08-04-2017 1188 1581 368 333 1529 1876#syria 07-04-2017 1263 856 654 472 1771 1217#themasters 06-04-2017 420 452 3015 2513 3225 2771#13reasonswhy 05-04-2017 280 87 985 363 1225 439#nationalchampionship 04-04-2017 3376 2561 238 174 3533 2682#finalfour 03-04-2017 4146 3448 851 618 4739 3887#openingday 02-04-2017 1732 1342 4129 3437 5461 4506

Demo
HTTP://JOHNNATAN.ME
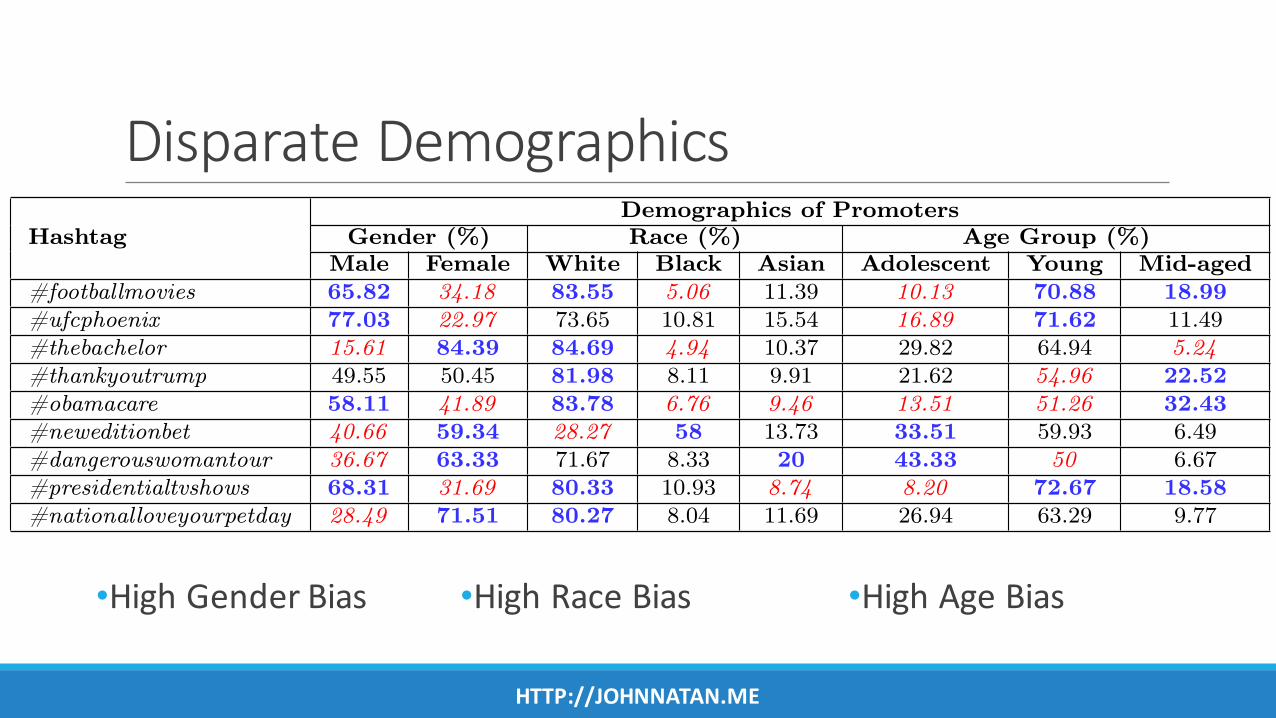
DisparateDemographics
•HighGenderBias
HTTP://JOHNNATAN.ME
56Chapter 7. Leverage Demographic Aspects to Design Transparency
Systems
Table 7.3: Demographics of promoters of Twitter trends. Demographic groups shownin bold blue are represented more (over-expected), and groups in red italics are rep-resented less (under-expected) among the promoters. We consider differences of 5%as the threshold. The hashtags are clickable links that point to their demographicdistribution on Who Makes Trends? service.
Demographics of PromotersGender (%) Race (%) Age Group (%)Hashtag
Male Female White Black Asian Adolescent Young Mid-aged#footballmovies 65.82 34.18 83.55 5.06 11.39 10.13 70.88 18.99#ufcphoenix 77.03 22.97 73.65 10.81 15.54 16.89 71.62 11.49#thebachelor 15.61 84.39 84.69 4.94 10.37 29.82 64.94 5.24
#thankyoutrump 49.55 50.45 81.98 8.11 9.91 21.62 54.96 22.52#obamacare 58.11 41.89 83.78 6.76 9.46 13.51 51.26 32.43#neweditionbet 40.66 59.34 28.27 58 13.73 33.51 59.93 6.49#dangerouswomantour 36.67 63.33 71.67 8.33 20 43.33 50 6.67#presidentialtvshows 68.31 31.69 80.33 10.93 8.74 8.20 72.67 18.58#nationalloveyourpetday 28.49 71.51 80.27 8.04 11.69 26.94 63.29 9.77
7.2 Concluding Remarks
In this chapter, we developed and deployed the Who Makes Trends? Web-based ser-vice in order to make the demographic biases in Twitter trends more transparent. Toaccomplish this design, we presented our methodology to build the system. Therefore,we described the data collection and trending topic analysis steps. We also observedthat different trends are promoted by user-groups having highly disparate demograph-ics. We classify these disparate demographics into three categories: (i) high genderbias; (ii) high racial bias; and (iii) high age bias. The Who Makes Trends? Web-basedservice is available at http://twitter-app.mpi-sws.org/who-makes-trends/. Inthe next chapter, we conclude this dissertation, discuss some limitations, and proposefuture research directions.
•HighRaceBias •HighAgeBias

ConclusionüDemographicAspectsareValuable
üGenderandRaceInequalityExistsinTwitter
üGlassCeilingalsoHappensforMaleUsers
üDemographicGroupshaveitsOwnPreferences◦ LinguisticStyle◦ ForTopicInterests
üTheConnectionsAmongDemographicGroupsHelptoExplainInequality
üProvideTransparentSystemsisImportant◦ WhoMakesTrends?
üPotentialLimitations
HTTP://JOHNNATAN.ME

Conclusion
HTTP://JOHNNATAN.ME

FutureWorküExploreAgeasaDemographicAspectüLinguisticandSocialfeaturesforGenderandRacePredictionüInformationPropagationThroughDemographicGroupsüCompiletheResultsandSubmittoaJournalüReleaseourDemographicDatasetunderRequest
HTTP://JOHNNATAN.ME

Publications
ØConferences◦ 2xIEEE/ACMASONAM2016◦ BraSNAM 2015◦ ACMCSCW2017◦ 2xACMHypertext2017◦ AAAIICWSM2017◦ SBBD2015◦ SOUPS2016◦Webmedia 2015◦WI2017
HTTP://JOHNNATAN.ME
ØJournals◦ IEEEInternetComputing2017◦ SpringerSNAM2017
Thefull listofthepapersareavailableathttp://johnnatan.me
13papers

Publications:DemographicsWhite,Man,andHighlyFollowed:GenderandRaceInequalitiesinTwitter.Johnnatan Messias,Pantelis Vikatos,andFabrício Benevenuto.InProceedingsoftheIEEE/WIC/ACMInternationalConferenceonWebIntelligence(WI'17).Leipzig,Germany.August2017 .
DemographicsofNewsSharingintheU.S.Twittersphere.JulioC.S.Reis,Haewoon Kwak,Jisun An,JohnnatanMessias,andFabrício Benevenuto.In Proceedingsofthe28thACMConferenceonHypertextandSocialMedia(HT'17).Prague,CzechRepublic.July2017.
LinguisticDiversitiesofDemographicGroupsinTwitter.Pantelis Vikatos,JohnnatanMessias,Manoel Miranda,andFabrício Benevenuto.InProceedingsofthe28thACMConferenceonHypertextandSocialMedia(HT'17).Prague,CzechRepublic.July2017.
WhoMakesTrends?UnderstandingDemographicBiasesinCrowdsourced Recommendations.AbhijnanChakraborty,Johnnatan Messias,Fabrício Benevenuto,Saptarshi Ghosh,Niloy Ganguly,andKrishnaP.Gummadi.InProceedingsoftheInt'lAAAIConferenceonWebandSocial(ICWSM’17).Montreal,Canada.May2017.
QuantifyingSearchBias:InvestigatingSourcesofBiasforPoliticalSearchesinSocialMedia.Juhi Kulshrestha,Motahhare Eslami,Johnnatan Messias,MuhammadBilalZafar,Saptarshi Ghosh,KrishnaP.Gummadi,andKarrieKarahalios.InProceedingsoftheACMConferenceonComputerSupportedCooperativeWorkandSocialComputing(CSCW'17).Portland,Oregon,USA,February2017.
HTTP://JOHNNATAN.ME

Publications:OtherTopicsAnEvaluationofSentimentAnalysisforMobileDevices.Johnnatan Messias,João P.Diniz,EliasSoares,MillerFerreira,Matheus Araújo,LucasBastos,Manoel Miranda,andFabrício Benevenuto. InSpringerNatureSocialNetworkAnalysisandMining.Volume7,Issue1,2017.
LongitudinalPrivacyManagement inSocialMedia:TheNeedforBetterControls.Mainack Mondal,Johnnatan Messias,SaptarshiGhosh,KrishnaP.Gummadi,andAniket Kate.IEEEInternetComputing(SpecialIssueonUsablePrivacy&Security).Volume21,Issue3,May-June,2017.
FromMigrationCorridorstoClusters:TheValueofGoogle+DataforMigrationStudies.JohnnatanMessias,Fabrício Benevenuto,IngmarWeber,andEmilioZagheni.InProceedingsofthe IEEE/ACMInternationalConferenceonAdvancesinSocialNetworksAnalysisandMining(ASONAM’16).SanFrancisco,USA.August2016.
TowardsSentimentAnalysisforMobileDevices.Johnnatan Messias,João P.Diniz,EliasSoares,MillerFerreira,Matheus Araújo,LucasBastos,Manoel Miranda,andFabrício Benevenuto. InProceedingsoftheIEEE/ACMInternationalConferenceonAdvancesinSocialNetworksAnalysisandMining(ASONAM’16).SanFrancisco,USA.August2016.
HTTP://JOHNNATAN.ME

Publications:OtherTopicsForgettinginSocialMedia:UnderstandingandControllingLongitudinalExposureofSociallySharedData.Mainack Mondal,Johnnatan Messias,Saptarshi Ghosh,KrishnaP.Gummadi,andAniket Kate.InProceedingsofthe12thSymposiumonUsablePrivacyandSecurity(SOUPS'16),Denver,CO,USA,June2016.Algoritmos deAprendizado deMáquina paraPredição deResultados dasLutas deMMA.LeandroA.A.Silva,Johnnatan Messias,Mirella M.Moro,PedroO.SVaz deMelo,andFabrício Benevenuto.InProceedingsofthe30thBrazilianSymposiumonDatabases(SBBD'15).Petrópolis,Brazil.October,2015.BrazilAroundtheWorld:CharacterizingandDetectingBrazilianEmigrantsUsingGoogle+.JohnnatanMessias,GabrielMagno,Fabrício Benevenuto,AdrianoVeloso,andVirgílio Almeida.InProceedingsof21stBrazilianSymposiumonMultimedia andtheWeb(WebMedia'15).Manaus,Brazil.October,2015.Bazinga!Caracterizando eDetectando Sarcasmo eIronia noTwitter.PollyannaGonçalves,DanielDalip,JulioC.S.Reis,Johnnatan Messias,FilipeRibeiro,Philipe Melo,LeandroA.A.Silva,MarcosGonçalves,andFabrício Benevenuto. InProceedingsoftheProceedingsoftheBrazilianWorkshoponSocialNetworkAnalysisandMining(BraSNAM).Recife,Brazil.July,2015.
HTTP://JOHNNATAN.ME

HTTP://JOHNNATAN.ME