john wayne airport economic impact study wayne airport economic impact study – final report march...
TRANSCRIPT

FINAL REPORT: John Wayne Airport
Economic Impact Study
Prepared for
John Wayne Airport, Orange County
Prepared by InterVISTAS Consulting LLC
March 4, 2014

John Wayne Airport Economic Impact Study – FINAL REPORT
March 4, 2014
i
Executive Summary
John Wayne Airport, Orange County engaged InterVISTAS Consulting LLC (InterVISTAS) to conduct a study of the economic impact of the airport’s operations for calendar year 2012. This report summarizes the economic contribution of the airport, its airlines, their partner businesses, and in-bound visitors to the Orange County region. Airports make substantial contributions to regional economies. They facilitate the movement of people, goods, and services throughout the nation and the world, allowing the economy to operate more efficiently. As the head of the Federal Aviation Administration’s Air Traffic Organization noted, “In today’s ever-changing and innovative world, aviation provides a vital link to economic opportunities at home and abroad. In the wake of global economic and financial uncertainties, runways have become the new main streets for cities and towns to get down to business and soar once more.”1 Aviation is also critical for local and regional tourism. Air transportation is a major means of bringing in tourists and their related spending on food, hotel, entertainment, and other items. Airports are also centers of significant economic activity themselves, as the locus of activity directly associated with passenger and cargo air travel. Direct economic impact measures the employment and economic impact directly associated with the airport. This includes employment from organizations such as airlines, ground handling, airport operations, airport concessionaires, and air traffic control firms. In addition, air services at John Wayne Airport (JWA) bring in visitors, who spend money on hotels, taxis, meals, and entertainment in the region. The annual direct impacts of ongoing operations at JWA and of spending by visitors arriving at JWA were estimated to be 22,000 direct jobs (or 19,500 direct full-time equivalent jobs), earning approximately $790 million in direct wages and salaries. Direct employment generated $1.5 billion in direct gross domestic product and $2.8 billion in direct economic output in the regional economy annually. Total impacts are calculated by adding together the direct operations impacts, direct visitor spending impacts, indirect impacts and induced impacts.2 Including indirect and induced multiplier
Annual Direct Impacts: 22,000 jobs
19,500 full-time equivalent jobs
$790 million in earnings
$1.5 billion in gross domestic product (GDP)
$2.8 billion in economic output
Note: Results are based on a review of 2012 operations and visitor spending.
1 U.S. Department of Transportation, Federal Aviation Administration, The Economic Impact of Civil Aviation on the U.S. Economy, August 2011, Washington, D.C. 2 The impacts of the directly-related parties’ business on supplier industries (e.g., off-site catering of aircraft) are indirect impacts. In addition, because the employees of the firms and organizations directly and indirectly related to the airport spend their wages on other goods and services and that spending supports other employment and economic activity (e.g., at home repair stores, dry cleaners, restaurants, etc.), activity and employment at the airport exerts induced impacts on the regional economy.

John Wayne Airport Economic Impact Study – FINAL REPORT
March 4, 2014
ii
impacts, ongoing 2012 economic impacts of JWA included a total of 43,000 jobs (38,200 full-time equivalent jobs). Total earnings of all employees amount to $1.7 billion in wages and salaries. Furthermore, JWA operations contribute an estimated $3.3 billion and $6.0 billion, in total gross domestic product (GDP) and total economic output, respectively, to the local economy.
Table ES-1: Total Economic Impacts of John Wayne Airport, 2012
Type of Impact Employment (Jobs)
Employment (Full-time
Equivalent Jobs)
Earnings ($ Billions)
GDP ($ Billions)
Economic Output
($ Billions)
Direct Impacts
JWA Operations 6,100 5,400 $0.3 $0.5 $0.9
Visitor Spending 15,900 14,100 $0.5 $1.0 $1.9
Direct Impacts 22,000 19,500 $0.8 $1.5 $2.8
Indirect 9,200 8,200 $0.4 $0.8 $1.5
Induced 11,800 10,500 $0.5 $1.0 $1.7
Total Impacts 43,000 38,200 $1.7 $3.3 $6.0
InterVISTAS separately estimated the economic impacts associated with the airport’s capital expenditures because the capital spending can vary significantly over time on a project-by-project basis. In 2012, JWA spent approximately $80 million dollars in capital expenditures. That spending generated 580 direct jobs (510 full-time equivalent jobs) and $30 million in direct earnings. Once the indirect and induced effects are taken into account, the total economic impact of the airport’s 2012 capital expenditures reached 1,150 FTEs, $60 million in earnings, and $190 million in economic output. If added to the amounts shown in the above table, the impacts of the airport’s operations in 2012 equated to 39,350 FTEs, $1.8 billion in earnings, and $6.2 billion in economic output. Not only does JWA sustain itself financially through fees and charges without receiving any support from Orange County’s general fund, the airport generates significant revenues to various levels of government. In 2012, taxes paid by passengers, employers and employees at JWA totaled $231 million. The majority of the amount collected (73%) accrued to the state
Annual Contributions to Governments
• State Government: $169 million (73% of total)
• Federal Government: $48 million (21% of total)
• Local Government: $14 million (6% of total)

John Wayne Airport Economic Impact Study – FINAL REPORT
March 4, 2014
iii
government, mostly via sales taxes. The federal government received approximately $48 million in income taxes and employment-related taxes (e.g., social security contributions). County and city governments also received approximately $14 million based on activity at JWA, through special user assessment fees and sales taxes. Separately and in addition, passengers at JWA contributed another $105 million to the Federal government through taxes and fees levied specifically on air transportation, such as the federal passenger ticket tax. These taxes and fees offset the costs of air traffic control, passenger security screening, and other federal services directly related to air transport.

John Wayne Airport Economic Impact Study – FINAL REPORT
March 4, 2014
iv
Contents
Executive Summary ...................................................................... i
1 Introduction ....................................................................... 1 1.1 John Wayne Airport .............................................................. 1
1.1.1 Passenger Traffic and Aircraft Movements .......................... 2 1.1.2 Airport Expansion & Recent Changes ................................. 4
1.2 Geographic Coverage Area ..................................................... 6 1.2.1 Orange County Industry and Economy ............................... 7 1.2.2 Other Counties in the Area ............................................ 8
1.3 What is Economic Impact? ...................................................... 8 1.4 Economic Impact of John Wayne Airport ..................................... 9
2 Methodology ..................................................................... 11 2.1 Introduction ...................................................................... 11 2.2 Estimating Current Economic Impact ........................................ 12 2.3 Surveying Direct Employment ................................................. 12 2.4 Inferring Employment .......................................................... 13 2.5 Estimating Non-Local Visitor Spending Impacts ............................ 13 2.6 Estimating Indirect and Induced Impacts with Economic Multipliers .... 13 2.7 Study Time Frame .............................................................. 15 2.8 Jobs vs. Full-Time Equivalent Jobs ........................................... 15 2.9 Estimating Capital Expenditure Impacts ..................................... 15 2.10 Estimating Tax Revenue Impacts ............................................. 15
3 Direct Employment Impacts of Airport Operations....................... 16 3.1 Introduction ...................................................................... 16 3.2 Direct Employment and Earnings ............................................. 16 3.3 Direct Full-time, Part-Time, Seasonal and Contract Employment ....... 17
3.3.1 Contract Employment ................................................. 17 3.4 Direct Employment by Industry Type ........................................ 18 3.5 Direct Employment by Job Category ......................................... 19 3.6 Direct Employment by Residency ............................................. 21
4 Visitor Spending Impacts ...................................................... 22 4.1 Introduction ...................................................................... 22 4.2 Visitor Spending Analysis ....................................................... 22
4.2.1 Estimated Visitors ...................................................... 22 4.2.2 Visitor Spending Patterns ............................................. 23
4.3 Direct Visitor Spending Impacts ............................................... 24
5 Indirect and Induced Employment Impacts ................................ 25 5.1 Introduction ...................................................................... 25 5.2 Indirect Employment ........................................................... 25 5.3 Induced Employment ........................................................... 26 5.4 Total Employment Impacts .................................................... 26
6 Other Economic Impacts of Airport Operations ........................... 27

John Wayne Airport Economic Impact Study – FINAL REPORT
March 4, 2014
v
6.1 Introduction ...................................................................... 27 6.2 Gross Domestic Product and Economic Output ............................. 28
7 Capital Expenditure Impacts ................................................. 29 7.1 Economic Impact of 2012 Capital Expenditures at JWA ................... 29
8 Contributions to Government ................................................ 31 8.1 Introduction ...................................................................... 31 8.2 Summary of Tax Contributions by Level of Government .................. 32 8.3 Summary of Contributions by Payer .......................................... 33
9 Summary of Economic Impact Results ...................................... 35 9.1 Ongoing Economic Impacts .................................................... 35 9.2 2012 Capital Expenditure Impacts ............................................ 36 9.3 Annual Tax Contribution ....................................................... 37
Appendix A: Employment Survey .................................................. 38 Identification of the Survey Population .............................................. 38 Questionnaire Design .................................................................... 38 Conducting the Survey .................................................................. 40
Appendix B: Sample Survey ......................................................... 41
Appendix C: Summary of Total Jobs and Full-Time Equivalent Jobs, Airport Operations Only ......................................................................... 50
Appendix D: Inferred Employment ................................................ 51
Appendix E: Contract Employment ................................................ 52
Appendix F: Tax Contributions by Passengers, Employers and Employees, and John Wayne Airport ............................................................... 53
Introduction .............................................................................. 53 Tax Revenues Attributable to Airport Passengers ................................... 55
State and Local Sales Tax ...................................................... 55 Tax on Airport Concessions .................................................... 55 Tax on Ground Transportation, Parking, and Car Rentals ................. 56 Tax on Accommodation Costs (Single-Night Stay Passengers) ............ 56 Tax on Visitor Spending ........................................................ 57
Tax Revenues Attributable to Airport Employers and Employees ................. 58 JWA Direct Employment ....................................................... 58 Personal Income Tax (Federal and State) ................................... 58 Corporate Income Tax (Federal and State) ................................. 59 Medicare ......................................................................... 59 Social Security ................................................................... 60 Unemployment Insurance ...................................................... 60 Aviation Fuel Tax ............................................................... 61 Tax on Accommodation Costs (Airline Crew) ............................... 61 Property Taxes .................................................................. 62
Tax Revenues Attributable to John Wayne Airport ................................. 62

John Wayne Airport Economic Impact Study – FINAL REPORT
March 4, 2014
vi
Property Taxes .................................................................. 62 Tax Revenues Attributable to Airfare Taxes and Fees.............................. 62
Appendix G: Glossary of Terms ..................................................... 66

John Wayne Airport Economic Impact Study – FINAL REPORT
March 4, 2014
1
1 Introduction
John Wayne Airport (JWA) generates important employment and economic contributions to the regional economy. The best way to show these impacts is through an economic impact study. Economic impact studies are an important tool in communicating the significance and role of an airport, like JWA, to the community. This study examines the current economic impacts of the operations and activities of the airport.
1.1 John Wayne Airport John Wayne Airport, owned and operated by the County of Orange, is the only commercial service airport in Orange County, California. It is located approximately 35 miles south of Los Angeles, between the cities of Costa Mesa, Irvine, and Newport Beach. The service area includes more than three million people within the 34 cities and unincorporated areas of Orange County. It also attracts passengers from a wider geographic area. In 2012, nearly 8.9 million passengers were served. One of only two airports in the County that accommodate general aviation, JWA is served by two full service fixed base operators and one limited use general aviation facility (no fuel sales) and is home to approximately 450 general aviation aircraft. Two runways serve commercial and private aircraft: a 5,700-foot main runway and a 2,887-foot general aviation runway.
John Wayne Airport
8.9 million passengers in 2012
255,700 aircraft movements in 2012
17,900 tons of air cargo in 2012
10 commercial air carriers
2 all-cargo air carriers
2 runways
Orange County, CA
3.1 million population in 2012
3rd most populous county in California
6th most populous county in the U.S.
Responsible for 10% of California’s Gross State Product
Measurements of Economic Impact
Employment (Jobs & Full-Time Equivalent Jobs)
Earnings
Gross Domestic Product (GDP)
Economic Output

John Wayne Airport Economic Impact Study – FINAL REPORT
March 4, 2014
2
1.1.1 Passenger Traffic and Aircraft Movements Figure 1-1 illustrates the change in total passenger traffic at JWA from 2001-2012. JWA had steady growth in passenger traffic up until 2008, when traffic dropped during the financial crisis and subsequent recession. 2012 was the first year since 2008 with positive passenger traffic growth (2.9%). A total of 8.9 million passengers arrived and departed from JWA in 2012. Figure 1-1: Total Passenger Traffic at John Wayne Airport, 2001-2012
Source: John Wayne Airport, Facts at a Glance, 2013
As of December 2013, 10 commercial air carriers operated at JWA, providing air services to destinations across the country, as well as to Canada and Mexico.3 FedEx and UPS are the two all-cargo airlines operating out of John Wayne Airport. In 2012, air cargo tonnage moved through JWA, by the freighter aircraft of the all-cargo airlines and in the bellyspace of the commercial air carriers, amounted to 17,870 tons. This is equivalent to a 14.8% increase year-over-year. Figure 1-2 provides a year-round route map of scheduled commercial services at JWA. The airport primarily receives origin-destination traffic, meaning passengers originate their trips at JWA or
3 These carriers were AirTran Airways, Alaska Airlines, American Airlines, Delta Air Lines, Frontier Airlines, Interjet, Southwest Airlines, United Airlines, US Airways, and WestJet. American and US Airways merged in December 2013. Southwest and AirTran merged in 2011 and received a single “operating certificate” from the FAA in 2012, technically marking the end of AirTran as a stand-alone airline.
7.37.9
8.59.3 9.6 9.6 10.0
9.0 8.7 8.7 8.6 8.9
0
2
4
6
8
10
12
2001 2002 2003 2004 2005 2006 2007 2008 2009 2010 2011 2012
Tota
l Pas
seng
erss
(Mill
ions
)
FinancialCrisis

John Wayne Airport Economic Impact Study – FINAL REPORT
March 4, 2014
3
complete their trips at JWA, rather than using it to connect through to other airports. While the majority of JWA services are to domestic destinations across the U.S., Mexico and Canada are also served with nonstop flights.
Figure 1-2: John Wayne Airport Route Map
Source: Profit Essentials, July 2013 and February 2014 Schedules Figure 1-3 details the total aircraft operations at the airport from 2007-2012. There were approximately 255,700 aircraft movements at JWA in 2012, an increase of 1.1% from the previous year. “Aircraft movements” include both take-offs and landings and include commercial, general aviation, commuter and military operations. In 2012, general aviation was the major source of movements at the airport with over 65% of total movements; this is consistent with the previous years, as well. While commercial movements (including commuter aircraft) have fluctuated over the time period, as a percent of total movements it has continued to remain steady, comprising approximately 30% of the total aircraft movements from 2007-2012.
Legend
Seasonal
Year-Round

John Wayne Airport Economic Impact Study – FINAL REPORT
March 4, 2014
4
Figure 1-3: Total Aircraft Operations at John Wayne Airport, 2007-2012
Source: John Wayne Airport, Airport Statistics
1.1.2 Airport Improvement & Recent Changes In 2011, JWA completed the majority of the “Airport Improvement Program,” a multi-year effort that included construction of a new South Remain-Over-Night (RON) aircraft parking area, a third multi-level Terminal C with six new commercial passenger gates, two commuter terminals, new security checkpoints, additional dining and shopping venues, greater baggage screening capabilities, an international arrivals area, Parking Structure C with 2,000+ parking spaces, and a Central Utility Plant.
Source: John Wayne Airport
0
50
100
150
200
250
300
350
2007 2008 2009 2010 2011 2012
Airc
raft
Mov
emen
ts (T
hous
ands
)
Total Movements General Aviation Commercial & Commuter

John Wayne Airport Economic Impact Study – FINAL REPORT
March 4, 2014
5
Scheduled air services at JWA have also evolved over the past few years. Table 1-1 and Table 1-2 show the change in available non-stop seat capacity from July 2005 to July 2013 and November 2005 to November 2013. Similar weeks in July and November were chosen as they represent different seasonal traffic volumes for the airport, as service is generally higher during the summer months. Schedules from 2005 were compared to the current year, as the last economic impact study conducted for the airport was based on 2005 operations. In 2005, the airport did not have any international arrivals/departures, but since then, JWA has added services to/from three Mexican cities, as well as Vancouver, B.C., Canada. Of the airlines serving JWA, Southwest has the highest number of weekly seats scheduled to arrive at JWA for July 2013, with approximately 40% of the total weekly seats. Overall scheduled weekly capacity at JWA has decreased by 7% for the month of July and 14% for the month of November in 2013 compared to 2005. Table 1-1: Direct Non-stop Scheduled Flights Arriving at John Wayne Airport, July 2005 vs. July 2013
Country Weekly Seat Capacity 2005
Weekly Seat Capacity 2013 % Change
U.S. 126,792 111,515 -12%
Mexico - 4,977 100%
Canada - 952 100%
Total 126,792 117,444 -7% Source: Diio Schedule Data
Table 1-2: Direct Non-stop Scheduled Flights Arriving at John Wayne Airport, November 2005 vs. November 2013
Country Weekly Seat Capacity 2005
Weekly Seat Capacity 2013 % Change
U.S. 125,062 102,506 -18%
Mexico - 4,018 100%
Canada - 952 100%
Total 125,062 107,476 -14% Source: Diio Schedule Data

John Wayne Airport Economic Impact Study – FINAL REPORT
March 4, 2014
6
1.2 Geographic Coverage Area In consultation with John Wayne Airport and based on the survey of employment, this study focuses on the economic impact of JWA’s operations on four counties: Orange County, Los Angeles County, Riverside County and San Bernardino County, as shown in Figure 1-4. The area of interest is restricted based on two major factors: where employees of the airport and firms directly associated with the airport’s operations live, and where those companies associated with the airport (either directly or indirectly, in a supplier relationship) are located. In addition, air transportation plays a significant role in the region by providing the necessary transportation access and linkages to major industries. Serving as an important facilitator in the growth of trade and tourism in the region, aviation contributes to the growth of the overall economy of the employment area. The geographic area of interest for an economic impact study is distinct from the airport’s “catchment area,” which refers to the region where passengers who fly from the airport live. For example, JWA may attract passenger traffic from residents of Imperial County. However, because few if any employees of the airports and companies that do business there live in Imperial County, that county is not separately and specifically included in this study’s analysis.
Figure 1-4: Area Map

John Wayne Airport Economic Impact Study – FINAL REPORT
March 4, 2014
7
1.2.1 Orange County Industry and Economy Orange County is the third largest county in California by population and sixth largest in the United States, falling behind San Diego and Los Angeles counties in California.4 Over three million people lived in Orange County in 2012, an increase of 2.7% over the 2010 population estimates.5 The largest cities in Orange County are Anaheim (344,000), Santa Ana (328,000) and Irvine (224,000), based on 2012 population estimates.6 The population in Orange County is forecasted to rise to over 3.4 million by 2035, an increase of 13%.7 In 2012, per capita personal income in Orange County exceeded $52,300, or 13 percent higher than the average per capita personal income in the State of California.8 Median household earnings were $76,000, which is more than 20% higher than the average for all of California.9 The unemployment rate in Orange County was 6.5% in July 2013, which was lower than the state and national rates at the time.10 The estimated gross county product for 2012 was $195 billion, which is approximately 10% of the gross state product.11 Exports in the region grew in 2011, up 20% from 2010; the largest exports in the region are from the technology industry, as well as transportation equipment, food and chemicals among others.12 Furthermore, Orange County is home to renowned theme parks and beaches, welcoming 42 million visitors each year.13 Air services make it convenient for guests to arrive and visit the county’s attractions, supporting tourism development in Orange County.
4 The Community Foundation, “Orange County Community Indicators Project 2013”. 5 US Census Bureau, “State & County Quick Facts - Orange County, California”, 2013. 6 County of Orange, “Facts & Figures 2013”. 7 The Community Foundation, “Orange County Community Indicators Project 2013”. 8 U.S. Bureau of Economic Analysis, Regional Data for 2012, data table CA30. 9 US Census Bureau, “State & County Quick Facts - Orange County, California”, 2013. Data are for the 60 month period 2007-2011. 10 Bureau of Labor Statistics, Local Area Unemployment Statistics. 11 County of Orange, “Facts & Figures 2013”. 12 The Community Foundation, “Orange County Community Indicators Project 2013”. 13 Orange County Visitors Association, “About OCVA”, 2013.
Source: Anaheim/Orange County Visitor & Convention Bureau

John Wayne Airport Economic Impact Study – FINAL REPORT
March 4, 2014
8
1.2.2 Other Counties in the Area In addition to Orange County, the study includes Los Angeles County, Riverside County, and San Bernardino County. These counties are included because approximately 20 percent of total employment associated with JWA operations reside there – with most of those living in Los Angeles County.
1.3 What is Economic Impact? Economic impact is a measure of the spending and employment associated with a sector of the economy, a specific project, or a change in government policy or regulation. Economic impact is most commonly measured in several ways, including employment, income, gross domestic product (GDP) and economic output, as explained in Figure 1-5.
Figure 1-5: Measurements of Economic Impact
• Full-time equivalent (FTE) jobs or person years of employment generated. Because many jobs may be only part-time or seasonal, the number of jobs is greater than the number of FTE jobs.
Employment (Full-Time Equivalent
Jobs)
• Includes wages, salaries, and benefits associated with employment tied to the sector, project or policy/regulatory change.
Earnings
• A measure of the money value of final goods and services produced locally as a result of economic activity. This measure does not include the value of intermediate goods and services used up to produce the final goods and services.
Gross Domestic Product (GDP)
• The dollar value of industrial output produced. Sometimes referred to as “economic activity,” it reflects the spending (i.e., capital improvement plus revenue) by firms, organizations and individuals. In the case of organizations that do not generate revenue (e.g., government-provided air traffic control services), annual operating expenses are counted.
Economic Output

John Wayne Airport Economic Impact Study – FINAL REPORT
March 4, 2014
9
1.4 Economic Impact of John Wayne Airport The three major components of economic impact are direct, indirect and induced impacts. These distinctions are used as a base for the estimation of total economic impact of an airport. Each of these three components requires different tools of analysis. Employment impact analysis determines the economic impact in terms of jobs created and salaries and wages paid out. In the case of the airport, the direct, indirect, induced and total numbers of full-time equivalent jobs created at the airport are examined to produce a snapshot of airport operations. Direct aviation sector impacts account for the economic activity of the target sector itself.
Direct employment impacts are measured by counting those individuals who work in a particular sector of the economy. In the case of an airport, all of those people who work in an aviation-related capacity either on-site or off-site would be considered direct employment (e.g. customer service, airline crew based in Orange County, ground handling, cleaning, maintenance and airport staff members, etc.). o Direct visitor spending impacts from non-local visitors to a region that arrive and depart
via the airport, rather than by other means, is considered a relevant economic impact. This includes visitor spending on lodging, meals, entertainment, transportation and retail. The direct employment associated with these categories of spending are counted as part of the economic impact of the airport.
Indirect impacts are those that result because of the direct impacts. For an airport, indirect impacts encompass the economic activities of off-site firms that serve airport users. Indirect employment includes the portion of employment in supplier industries which are dependent on sales to the air transport sector. An example would be food wholesalers that supply food for catering on flights.
Induced impacts are economic impacts created by the spending of wages, salaries and profits earned in the course of the direct and indirect economic activities. Induced employment is employment generated from expenditures by individuals employed indirectly or directly. For instance, if an airline maintenance firm employee decides to remodel his/her home, this would result in additional (induced) employment hours in the general economy. The home renovation project would support hours of induced employment in the construction industry, the construction materials industry, etc. Induced impact is often called the household‐spending effect.
Total impacts are the sum of direct, indirect and induced effects.

John Wayne Airport Economic Impact Study – FINAL REPORT
March 4, 2014
10
Figure 1-6: Economic Impact Overview

John Wayne Airport Economic Impact Study – FINAL REPORT
March 4, 2014
11
2 Methodology
2.1 Introduction InterVISTAS conducted this economic impact study during the summer and fall of 2013. The study estimates the economic impact of JWA’s operations in 2012. To calculate the direct employment impacts, the study team surveyed all the employers associated with the operation of JWA (e.g., airlines, ground handling firms, accommodations, ground transport firms, etc.). The survey produced estimates of the number of individuals employed in directly-related occupations, as well as the total amount of earnings paid to all employees. The firms surveyed as part of this study are located both on the airport (on-site) and off the airport site (off-site). The employment survey was used to classify the total employment and average earnings paid by business type. InterVISTAS estimates the indirect and induced effects using economic multipliers developed by the U.S. Bureau of Economic Analysis (BEA), that are derived from models of how the U.S. and regional economies operate. InterVISTAS utilizes a proprietary model in order to conduct multiplier analysis and estimate indirect and induced impacts. We used the data from the survey to calculate the associated tax impacts (government revenue) generated by the airport’s operations. To derive estimates of the impact of domestic and international visitors arriving and departing from JWA, InterVISTAS used domestic and international visitor spending patterns and travel characteristics from TNS TravelsAmerica and the Anaheim/Orange County Visitor & Convention Bureau. We applied U.S. BEA economic multipliers to estimate the effects of domestic and international visitor spending.
Survey Response Rate
80% of businesses and organizations responded to survey
77% of total full-time equivalents covered by survey
Study Time Frame
2012 operations
Economic Multipliers Source
U.S. Bureau of Economic Analysis (BEA) Regional Input-Output Modeling System (RIMS II)
Geographic Coverage Area
Orange County
Los Angeles County
Riverside County
San Bernardino County
Visitor Impacts Sources
Anaheim/Orange County Visitor & Convention Bureau
Visit California
TNS TravelsAmerica

John Wayne Airport Economic Impact Study – FINAL REPORT
March 4, 2014
12
2.2 Estimating Current Economic Impact The direct employment base related to ongoing operations at JWA is measured first. Employment figures are generally more understandable by the public than more abstract measures, such as economic output or GDP. Employment figures also have the advantage of being a more accurate measure, both because the firms are more likely to provide data on employment, as opposed to information on revenues, wages and other monetary amounts, and because there is less chance of double counting economic activity. The economic impact study then assesses the indirect and induced (or “multiplier”) employment supported by JWA’s operations, as well as economic activity in terms of economic output and GDP using U.S. BEA multipliers. The tax revenue generated annually by operations at JWA is also estimated.
2.3 Surveying Direct Employment Employment attributable to ongoing JWA operations was measured by surveying 200 tenants and related businesses and organizations economically linked to the airport. The surveyed firms include on-site and off-site businesses that fall under four categories: air carrier, accommodations, ground transportation, and general.14 Specifics of the survey methodology are contained in the appendices, including a description of the sampling techniques in Appendix A. E-mail and telephone follow-ups were conducted to ensure a strong response rate. In total, 80% of the businesses and organizations contacted responded to the survey, representing approximately 77% of total FTE jobs covered by the survey. A summary is provided in Figure 2-1. Appendix A shows a breakdown of survey responses by firm type.
Figure 2-1: Response Rate for John Wayne Airport Economic Impact Employment Survey
14 The “general” category includes but is not limited to: federal government agencies (U.S. Customs and Border Protection and the Transportation Security Adminisrtation, for example), fixed base operators, aircraft sales, airport terminal services, airport operators, airport retail services, construction and building maintenance.
80%
20%
77%
23%
Survey Response Direct FTE Jobs Covered by Survey Respondents
Responding Non-Responding

John Wayne Airport Economic Impact Study – FINAL REPORT
March 4, 2014
13
Specific multipliers were chosen for the analysis: Orange County
Los Angeles County
Riverside County
San Bernardino County
2.4 Inferring Employment For non-responding firms, employment was conservatively estimated using a proven and accepted methodology. This includes referencing the survey results for firms of similar business types, or using credible external sources such as the U.S. Bureau of Labor Statistics. There may be firms that were not surveyed because their existence was not known. Employment for these non-surveyed firms was not estimated because there was no basis for assessment. We expect that the volume of missed employment would be minimal.
2.5 Estimating Non-Local Visitor Spending Impacts JWA lies within a region that receives a significant amount of international and domestic visitor spending at a number of key attractions and locations. Air services at JWA bring in visitors who spend money on hotels, taxis, meals, and entertainment in the region. For this reason, the estimation of the impact of visitor spending at JWA is a critical component of this study. This study includes an estimate of the visitor spending in the study region. For this study, the economic impact of expenditures of visitors arriving at JWA is treated as a separate direct impact. This is because visitor impacts on local employment are estimated using U.S. BEA multipliers that are based on spending rather than direct surveys of employment at hotels, restaurants, retailers, recreation providers, and others. To estimate the impacts of visitors arriving on the air services at JWA, we applied data on visitor spending patterns and travel characteristics obtained from TNS TravelsAmerica and the Anaheim/Orange County Visitor & Convention Bureau. The U.S. BEA's economic multipliers are used to estimate the direct employment generated by each dollar of non-local visitor spending, as well as earnings and GDP.
2.6 Estimating Indirect and Induced Impacts with Economic Multipliers Measurement of indirect and induced economic activity is difficult. While it may be possible to conduct a survey of downstream employers, the survey would need to cover thousands of firms in order to completely cover indirect employment. For induced employment, the entire economy would need to be scrutinized. In addition to the time and financial resources needed to conduct such surveys, the quality of responses would be suspect.

John Wayne Airport Economic Impact Study – FINAL REPORT
March 4, 2014
14
As an alternative to costly and inaccurate surveys, indirect and induced effects are typically measured using economic multipliers.15 Multipliers are derived from models of the general economy. They come in a variety of forms and differ greatly in definition and application. Thus, great care must be exercised in choosing the appropriate set of multipliers to use. Multiplier impacts must be interpreted with caution since they may be illusory when the economy experiences high employment and output near industry capacity. When they are reported, it is recommended that the reader be reminded of the limitations on the use of multipliers. Mindful of these limitations, this study has undertaken multiplier analysis to estimate indirect and induced employment. In addition, the use of multiplier analysis is limited by a number of factors, these being: the accuracy of the structure and parameters of the underlying model; the level of unemployment in the economy; the assumption of constant returns to scale in production; the assumption that the economy's structure is static over time; and the assumption that there are no displacement effects. InterVISTAS purchased the multipliers used for this study from the U.S. Bureau of Economic Analysis (BEA). The multipliers are based on the BEA’s most recent Regional Input-Output Modeling System (RIMS II).16 RIMS II is based on a highly detailed accounting of national and regional economic structures or relationships. The model tracks how the goods and services produced by industry are used by other industries and final users. RIMS II adjusts these national relationships to account for regional supply conditions. The specific multipliers selected for this study effectively model the economy of industries in the JWA area.17 The regions chosen include the following counties: Orange County, Los Angeles County, Riverside County and San Bernardino County.18 These regions were chosen over other geographical areas, such as all of Southern California, based on the concentration of airport employees and airport-related employees in the area. The economic relationship among those firms and organizations, as well as the residency of the vast majority of employees was also taken into consideration.
15 The combined multiplier impacts (indirect and induced) for airport operations and tourism are estimated. Indirect and induced impacts of airport operations are adjusted to remove tourism from aviation and avoid double-counting. 16 The U.S. BEA derives them from its national input-output tables to reflect each region’s unique industrial structure and trading patterns. These multipliers are updated with Consumer Price Indices to account for inflation. 17 The multiplier effects of this study were validated and measured against recognized and reliable external sources, such as data from the U.S. Bureau of Labor Statistics and the California Employment Development Department. 18 InterVISTAS worked with officials from Orange County, John Wayne Airport to select the appropriate geographic area for the multipliers.

John Wayne Airport Economic Impact Study – FINAL REPORT
March 4, 2014
15
Capital expenditure at an airport is an important one-time generator of economic impact.
2.7 Study Time Frame The employment survey was conducted between July and October 2013. The results reflect employment and operations from 2012.
2.8 Jobs vs. Full-Time Equivalent Jobs Traditionally, one measures employment by the number of jobs. However, when part-time and/or seasonal workers are used, this can be a misleading measure resulting in an overstatement of economic impact. Whenever possible, employment impacts are measured both in terms of the number of jobs and the number of full-time equivalent (FTE) jobs.19 In our model, hours worked by part-time and/or seasonal employees are converted into FTE jobs.
2.9 Estimating Capital Expenditure Impacts The airport’s capital expenditures also generate significant impacts to the regional economy. The capital expenditures include spending on construction, which supports employment, earnings, GDP, and economic output. Using the U.S. BEA multipliers, the economic impacts of the airport’s capital expenditures in 2012 are estimated. The economic effects of an airport’s capital development are considered separate from an airport’s ongoing operations because the capital spending can vary significantly over time, depending on what projects may be underway or if a long-term sustained capital improvement is on-going.
2.10 Estimating Tax Revenue Impacts The study also estimates the payments to the federal, state, county and local/city governments that are associated with airport operations.20 This includes taxes paid by employers and employees (such as payroll taxes), passengers (such as sales taxes on expenditures) and JWA (such as special assessment user fees).
19 One full-time equivalent job corresponds to 1,800 hours of work. 20 Taxation impacts are based on 2012 tax rates.

John Wayne Airport Economic Impact Study – FINAL REPORT
March 4, 2014
16
3 Direct Employment Impacts of Airport Operations
3.1 Introduction This section describes the total employment, in both jobs and FTE jobs, and estimated payroll attributable to employers directly related to ongoing operations at JWA. This section also examines the employment due to ongoing operations at JWA in more detail. FTE jobs are broken down by: Full-time versus part-time and seasonal
employment; Employment by industry; and Employment by job category.
3.2 Direct Employment and Earnings Direct employment related to ongoing operations at JWA amounted to 6,100 direct jobs. After adjusting for part-time and seasonal employment, the 6,100 jobs equated to 5,400 FTE jobs.21 Employees at JWA and related firms receive an estimated $0.3 billion in earnings, providing an average of $55,000 per FTE job. Employment figures are summarized in Table 3-1 for wages, as well as jobs and FTE jobs.
21 Of this total, 1,400 FTEs (26% of total direct employment) were inferred for firms that did not respond to the survey.
Annual operations at John Wayne Airport support:
6,100 direct jobs
5,400 direct full-time equivalent jobs
$0.3 billion in direct earnings
Direct employment related to John Wayne Airport operations includes:
99% permanent jobs
1% seasonal jobs
The larger employers at John Wayne Airport are:
Airlines, Airline Support Services and General Aviation (29%)
Ground Transportation (20%)
Government Agencies (15%)
Contract Operations (15%)
Retail Concessions (15%)
In Orange County, the majority of direct employment related to JWA reside in:
Santa Ana (41%)
Orange (6%)
Costa Mesa (5%)

John Wayne Airport Economic Impact Study – FINAL REPORT
March 4, 2014
17
Table 3-1: Annual Direct Employment and Earnings of Operations at John Wayne Airport
Type of Impact Employment (Jobs)
Employment (Full-time
Equivalent Jobs) Earnings
($ Billions)
Direct Employment 6,100 5,400 $0.3
3.3 Direct Full-time, Part-Time, Seasonal and Contract Employment A total of 6,100 direct jobs are attributable to JWA operations and other airport related businesses. Based on information provided by our survey of employers, 99% of the jobs are permanent jobs while seasonal employment represented only 1% of jobs. Approximately 78% of these permanent jobs are full-time positions. This demonstrates that JWA and its related businesses are a source of stable, year-round employment.
Figure 3-1: Full-Time Versus Part-Time Permanent Employment at John Wayne Airport22
3.3.1 Contract Employment Some employers contract out services to individuals and other firms. Based on responses to the survey, we estimated that contracted individuals and firms account for 329 jobs, equivalent to 295 FTE jobs. 22 Note: This chart does not include ground transport and excludes contract and inferred employment. The survey instrument did not ask ground transport firms to differentiate part-time vs. full time employment.
78%
22%
84%
16%
FTE Jobs Jobs
Full-time Part-time

John Wayne Airport Economic Impact Study – FINAL REPORT
March 4, 2014
18
3.4 Direct Employment by Industry Type A breakdown of direct employment at JWA, by industry type, provides insight into the different industries directly related to the airport. The following summary details direct employment of each industry: Airlines, Airline Support Services and General Aviation combine to support 1,570 direct
FTE jobs (29% of direct employment). Contributions to this employment figure are provided by passenger and cargo carriers, ground handlers, aircraft maintenance firms and air charter services.
Ground Transportation supports the second highest amount of direct FTE jobs at JWA with 1,080 direct FTE jobs (20% of direct employment). This industry is propelled by the passengers received at JWA, which drive businesses such as taxi companies, coach firms and car rental companies.
Government Agencies account for the third highest proportion of direct employment at JWA (820 direct FTE jobs or 15% of direct employment). These organizations provide essential services for the airport such as air traffic control, Customs and Border Protection, and police and fire services. County of Orange airport staff is also included in this category.
Contract Operations contribute a total of 810 direct FTE jobs (15% of direct employment). This group includes building maintenance firms, janitorial services and engineering firms.
Retail Concessions contribute significantly to direct employment at JWA with 790 direct FTE jobs (15% of direct employment). This figure is driven by the recent completion of Terminal C, which is part of JWA’s airport improvement program. The new terminal includes new retail, food and beverage facilities.
Crew Accommodations account for the remaining 320 direct FTE jobs (6% of direct employment). This covers employment directly related to supporting overnighting airline flight crews and airport shuttle services.
A breakdown of direct employment at JWA, by industry, is illustrated in Figure 3-2.

John Wayne Airport Economic Impact Study – FINAL REPORT
March 4, 2014
19
Figure 3-2: Direct Employment by Industry Type at John Wayne Airport
3.5 Direct Employment by Job Category JWA is a source of a wide variety of job categories, with different positions spread on-site across the airport and off-site. A significant proportion of this employment is attributed to firms and employees supporting JWA terminal and air service operations. The various occupations associated with JWA can be grouped into the following job categories: Airport Support accounts for employment of other non-airline workers within the terminal,
including employees in air traffic control, security screening, customs and border protection, retail and restaurant, car rental and the airport operations attributed to air service. Airport support employment comprises the majority of direct employment at JWA with 1,710 direct FTE jobs (32% of direct employment).
Ground Support includes jobs in ramp crew, bag room, fueling, and aircraft cabin cleaning and catering. Also considered in this category are cargo agents and cargo supervisors. There are 810 direct FTE jobs within this category at JWA (15% of direct employment).
Managerial and Clerical employment accounts for management staff, as well as clerical positions which include administrative and office support workers. Managerial and clerical employment includes 630 direct FTE jobs at JWA, equivalent to 12% of direct employment.

John Wayne Airport Economic Impact Study – FINAL REPORT
March 4, 2014
20
Airline Services includes employment of pilots and flight attendants based at JWA. Also considered are the labor hours of airline employees within the terminal, including check-in agents, gate agents, customer service, supervisors and the airline’s overhead staff. Airline services accounts for 630 direct FTE jobs at JWA (12% of direct employment).
Off-Site accounts for all employees located off-airport working within the accommodation or ground transportation industries. This includes 610 accommodations employees associated with servicing airline crew and airport shuttle services, as well as taxi companies and coach firms transporting passengers to and from JWA (11% of direct employment).
Maintenance & Janitorial includes employment of maintenance and janitorial staff located on-site at the airport. There are 570 direct FTE jobs within this category at JWA (11% of direct employment).
Aircraft Maintenance provides employment of mechanics based at JWA. Aircraft maintenance accounts for 240 direct FTE jobs at JWA, equivalent to 4% of direct employment.
Other includes jobs such as engineers, IT specialists, project managers and waste collectors. Other employment comprises 200 direct FTE jobs at JWA (4% of direct employment).
Figure 3-3: Direct Employment by Job Category at John Wayne Airport
200
240
570
610
630
630
810
1,710
0 500 1,000 1,500 2,000
Other
Aircraft Maintenance
Maintenance & Janitorial
Off-Site
Airline Services
Managerial & Clerical
Ground Support
Airport Support
Direct FTE Jobs by Job Category

John Wayne Airport Economic Impact Study – FINAL REPORT
March 4, 2014
21
3.6 Direct Employment by Residency Survey results from interviews with JWA airport staff and with employers directly associated with the airport (e.g., airlines, retail concessionaires, ground handlers, caterers) confirmed that the majority of employees associated with JWA reside in Santa Ana and nearby cities.23
The City of Santa Ana and Los Angeles County are both home to the largest proportion of employees, accounting for 2,210 direct FTE jobs (41.2% of direct employment) and 670 FTEs (12.5%), respectively. Table 3-2 outlines the residency distribution of employees directly associated with JWA.
Table 3-2: Residency of Direct Employment at John Wayne Airport
City/Area Direct Employment (Full-time Equivalent Jobs)
% of Total Direct Employment
Santa Ana 2,210 41.2% Orange 300 5.6% Costa Mesa 290 5.4% Irvine 150 2.8% Anaheim 150 2.8% Huntington Beach 120 2.2% Tustin 100 1.9% Garden Grove 90 1.7% Westminster 70 1.3% Fountain Valley 50 0.9% Newport Beach 40 0.7% Aliso Viejo 40 0.7% Fullerton 30 0.6% Laguna Niguel 30 0.6% Corona del Mar 30 0.6% Mission Viejo 30 0.6% Lake Forest 20 0.4% Brea 20 0.4% Yorba Linda 20 0.4% Placentia 20 0.4% San Clemente 20 0.4% Buena Park 20 0.4% Stanton 20 0.4% Cypress 10 0.2% East Irvine 10 0.2% Rancho Santa Margarita 10 0.2% Laguna Hills 10 0.2% Other Orange County City/Area 40 0.7%
Orange County Total 3,950 73.6%
Los Angeles County 670 12.5% Other Southern California Counties 440 8.2% Outside California 310 5.8%
Total Direct Employment 5,370 100.0%
Note: Figures shown above are rounded.
23 Direct employment by residency was determined from survey results, wherein employers were asked to identify the communities in which their employees reside. Residency for non-responding firms was inferred based on responses from other responding firms.

John Wayne Airport Economic Impact Study – FINAL REPORT
March 4, 2014
22
4 Visitor Spending Impacts
4.1 Introduction The air services at JWA bring in domestic and international visitors looking to explore the region and its associated attractions. Visitors arriving on these air services at JWA spend money on items such as hotels, taxis, food and beverage, entertainment, etc. The monetary spending of these non-local air travelers contribute substantially to the regional economy. Visitor spending helps sustain jobs in the region and promote further spending. The direct economic impacts of visitors arriving via JWA are presented in this section.
4.2 Visitor Spending Analysis To estimate the economic impact of domestic and international visitor spending in the region, InterVISTAS used visitor spending data and travel characteristics, alongside U.S. BEA multipliers, to derive the economic impacts.
4.2.1 Estimated Visitors The number of visitors arriving at JWA is estimated by applying point of sale data to the number of enplaned travelers arriving at the airport in 2012.24 This provides an estimate of non-local passengers and serves as the basis for domestic and international spending estimates. Air services at JWA brought in approximately 2.4 million visitors to the region in 2012. This is comprised of 2.3 million domestic visitors from within the U.S., and 56,000 international visitors. International visitors arriving to the region via JWA include non-local passengers on-board the JWA air services from Mexico and Canada. (Service to Mexico began in
24 Point-of sale data was obtained from Diio Schedule Data, while annual passenger statistics were provided by John Wayne Airport.
Annual visitors arriving via John Wayne Airport:
2.3 million domestic visitors
56,000 international visitors
Total visitor spending by visitors arriving via John Wayne Airport:
$1.8 billion by domestic visitors
$40.4 million by international visitors
Direct visitor spending impacts of John Wayne Airport include:
15,900 direct jobs
14,100 direct full-time equivalent jobs
$0.5 billion in direct earnings
$1.0 billion in direct GDP
$1.9 billion in direct economic output

John Wayne Airport Economic Impact Study – FINAL REPORT
March 4, 2014
23
June 2012.) Figure 4-1 illustrates a breakdown of annual visitor arrivals at JWA. We would expect that the economic impact of international visitors would grow significantly if a full year’s arrivals from Mexico were taken into account.
Figure 4-1: Annual Estimated Domestic and International Visitors at John Wayne Airport
Source: Point-of sale data was obtained from Diio Schedule Data, while annual passenger statistics were provided by John Wayne Airport
4.2.2 Visitor Spending Patterns Domestic visitors arriving in the region via JWA spend approximately $1.8 billion per annum. This equates to an average of approximately $795 spent per trip by each domestic visitor. Total spending by international visitors sums to $40.4 million each year, with each international visitor spending approximately $717 per trip.25 Together, domestic and international visitors arriving via JWA spend approximately $1.9 billion in the region annually. Visitor spending patterns also vary between domestic and international visitors. While domestic visitors spend a large portion of their budget on local transportation within the region – such as car rental, taxis and shuttle service (35% of per trip spending), accommodations (27% of per trip spending), and food and beverages (19% of per trip spending), international visitors purchase more retail goods (35% of per trip spending), followed closely by food and beverages (18% of per trip spending). A breakdown of visitor spending patterns by expenditure category is illustrated in Figure 4-2 for both domestic and international visitors.
25 Visitor spending patterns were obtained from 2012 Domestic Travel to California, TNS TravelsAmerica 2012 for domestic visitor, and from the Anaheim/Orange County Visitor & Convention Bureau for international visitors. Domestic visitors have a higher average spend rate per trip as they spend more on accommodations than international visitors, as international visitors arriving via JWA are predominantly Mexican visitors with lower spend rates than other overseas visitors, in part because of reduced lodging costs due to their staying with friends and family. Other overseas visitors to the region (arriving via other airports) spend approximately $1,300 per trip, according to the Anaheim/Orange County Visitor & Convention Bureau and Visit California.
98%
2%
Total Visitors: 2.4 million
Domestic Visitors International Visitors

John Wayne Airport Economic Impact Study – FINAL REPORT
March 4, 2014
24
Figure 4-2: Domestic and International Visitor Expenditures by Category of Visitors Arriving via John Wayne Airport
Source: 2012 Domestic Travel to California, TNS TravelsAmerica 2012; and, Anaheim/Orange County Visitor and Convention Bureau
4.3 Direct Visitor Spending Impacts Spending in the region by visitors arriving by air via JWA generates employment in hotels, restaurants, retail, local transportation and entertainment industries. We estimated the direct employment generated by each dollar of visitor spending, as well as earnings, using BEA multipliers. The visitor spending impacts of JWA include 15,900 direct jobs (14,100 direct FTE jobs) in the region. The direct economic impacts of visitors arriving in the region through JWA are summarized in Table 4-1.
Table 4-1: Annual Direct Employment and Earnings Impacts of Visitor Spending of Visitors Arriving via John Wayne Airport
Type of Impact Employment (Jobs)
Employment (Full-time
Equivalent Jobs) Earnings
($ Billions)
Direct Employment 15,900 14,100 $0.5
35%
27%
19%
8%6% 4% 14%
14%
18%12%
35%
7%
AccommodationsTransportation in U.S. Food & Beverages
RetailEntertainment Other
Domestic Visitors International Visitors

John Wayne Airport Economic Impact Study – FINAL REPORT
March 4, 2014
25
5 Indirect and Induced Employment Impacts
5.1 Introduction The previous sections discussed how direct employment related to ongoing operations at JWA and spending impacts of the visitors arriving at JWA were measured. However, the employment impact of the airport does not end there, as other sectors of the economy are dependent on these employers’ businesses. Indirect employment is generated by suppliers to the businesses directly related to the airport. In addition, there may be a general stimulus to the overall state-wide economy when direct (and indirect) employees spend their wages. These employment effects are referred to as induced employment. Total employment effects therefore equal the sum of direct, indirect and induced effects.26
5.2 Indirect Employment Indirect employment is employment in non-airport industries that supply or provide services to this industry. This would include, for example, food service firms that supply food or other products to airline catering companies. Based on an analysis of the results of our survey of employers and the application of the regional economic multipliers, we estimated that 8,200 indirect FTE jobs are related to JWA’s operations and spending impacts of the visitors arriving at JWA. In other words, 8,200 FTE jobs are indirectly generated in industries that supply the businesses directly related to JWA. Earnings associated with the total indirect employment are estimated at $0.4 billion per annum.
26 Indirect and induced impacts are estimated using economic multipliers, as discussed in Section 2.5. Multipliers are derived from economic/statistical/accounting models of the general economy. While multiplier impacts are useful and important, the user should be mindful of their limitations. The multiplier effects of this study were validated and measured against recognized and reliable external sources, such as data from the U.S. Bureau of Labor Statistics and the California Employment Development Department.
Indirect employment impacts of John Wayne Airport include:
9,200 indirect jobs
8,200 indirect full-time equivalent jobs
$0.4 billion in indirect earnings
Induced employment impacts of John Wayne Airport include:
11,800 induced jobs
10,500 induced full-time equivalent jobs
$0.5 billion in induced earnings
Total employment impacts of John Wayne Airport include:
43,000 total jobs
38,200 total full-time equivalent jobs
$1.7 billion in total earnings

John Wayne Airport Economic Impact Study – FINAL REPORT
March 4, 2014
26
5.3 Induced Employment Induced employment is employment created because of expenditures by individuals employed both directly and indirectly by businesses directly related to the airport. It represents the demand for goods and services generated by wage earnings from economic activity directly related to the airport. Induced employment attributable to JWA is estimated at 10,500 FTE jobs. Induced employment is estimated to generate $0.5 billion per annum in earnings.
5.4 Total Employment Impacts Ongoing JWA airport operations and spending of the visitors arriving at JWA generate 43,000 jobs (equivalent to 38,200 FTE jobs) and $1.7 billion in economic earnings, including induced and indirect effects.27 Table 5-1 summarizes the direct, indirect, induced and total employment and earnings in the surrounding regional economy attributable to ongoing operations at JWA.
Table 5-1: Annual Direct and Total Employment Impacts of John Wayne Airport
Type of Impact Employment (Jobs)
Employment (Full-time
Equivalent Jobs) Earnings
($ Billions)
Direct 22,000 19,500 $0.8
Indirect 9,200 8,200 $0.4
Induced 11,800 10,500 $0.5
Total 43,000 38,200 $1.7
27 The combined multiplier impacts (indirect and induced) for airport operations and tourism are estimated. Indirect and induced impacts of airport operations are adjusted to remove tourism from aviation and avoid double-counting.

John Wayne Airport Economic Impact Study – FINAL REPORT
March 4, 2014
27
6 Other Economic Impacts of Airport Operations
6.1 Introduction Previous sections of the report focused on the employment impacts of operations at JWA and spending impacts of the visitors arriving at JWA. This section turns to the broader economic impacts of JWA that are measured using dollar values. The two most common measures of economic contribution (in addition to employment) are gross domestic product (GDP) and economic output. GDP is a measure of the money value of final goods and services produced as a result of economic activity and measures only value-added revenues. Economic output is the dollar value of industrial output produced and roughly corresponds to the gross revenue of goods or services produced by an economic sector. As such, GDP removes the revenues to suppliers of intermediate goods and services and only includes the revenues from value-added production. Alternatively, economic output adds all revenues at each stage of production together as a measure of total production in the economy. Economic output will always be greater than GDP. In service industries and the public sector, economic output is often simplified to equate to total wages paid. To estimate economic output for a sector, one might add up the gross revenues of the various firms in that sector. However, to find GDP for a sector, care must be taken to avoid double-counting. The revenues of one firm providing service to another are not incremental GDP. For example, in the automobile sector, one cannot add the value (gross revenue) of a finished auto to the value of the tires. The tires are already included in the value of the automobile.
Direct impacts of John Wayne Airport include:
$1.5 billion in direct GDP
$2.8 billion in direct economic output
Indirect impacts of John Wayne Airport include:
$0.8 billion in indirect GDP
$1.5 billion in indirect economic output
Induced impacts of John Wayne Airport include:
$1.0 billion in induced GDP
$1.7 billion in induced economic output
Total impacts of John Wayne Airport include:
$3.3 billion in total GDP
$6.0 billion in total economic output

John Wayne Airport Economic Impact Study – FINAL REPORT
March 4, 2014
28
One approach to measuring economic output and value-added GDP is to ask firms in a survey to provide information on their gross revenues, payments to suppliers, etc. However, there are problems with this approach. First, it is much too expensive. Second, the double counting problem makes this approach impractical. An alternative is to infer economic output and GDP for an economic sector from employment data using economic multipliers. The U.S. BEA produces economic multipliers for both U.S. states and regional counties. Using these economic multipliers is both cost effective and more accurate than obtaining the data from surveys. This method is the approach adopted here.
6.2 Gross Domestic Product and Economic Output The direct employment from ongoing JWA airport operations and spending impacts of the visitors arriving at JWA generates $1.5 billion in direct GDP and $2.8 billion in direct economic output. Including multiplier effects, operations at JWA and spending by visitors arriving at JWA support $3.3 billion total (direct, indirect and induced) GDP and $6.0 billion in economic output.28 Table 6-1 summarizes the GDP and economic output contributions of ongoing airport operations at JWA to the regional economy in 2012.
Table 6-1: Annual Direct and Total GDP and Economic Output Impacts of John Wayne Airport
Type of Impact GDP ($ Billions)
Economic Output ($ Billions)
Direct $1.5 $2.8
Indirect $0.8 $1.5
Induced $1.0 $1.7
Total $3.3 $6.0
28 The combined multiplier impacts (indirect and induced) for airport operations and tourism are estimated. Indirect and induced impacts of airport operations are adjusted to remove tourism from aviation and avoid double-counting.

John Wayne Airport Economic Impact Study – FINAL REPORT
March 4, 2014
29
7 Capital Expenditure Impacts
7.1 Economic Impact of 2012 Capital Expenditures at JWA In addition to the employment and other economic impacts of ongoing operations at JWA, there are also economic impacts associated with the airport’s capital expenditures. The expenditures include spending on capital improvement projects at the airport, which supports employment, GDP and economic output. This section assesses the economic impacts associated with the airport’s capital expenditures in 2012, in particular. According to the airport authority, JWA spent approximately $80 million dollars in capital expenditures during 2012. We estimated the economic impacts of the airport’s capital expenditures using BEA multipliers. Based on this analysis, we calculated that JWA’s capital spending supported approximately 580 direct jobs (510 direct FTE jobs), and $30 million in direct earnings. A summary of the economic impacts of 2012 capital expenditures at JWA is provided in Table 7-1.
John Wayne Airport’s 2012 Capital Expenditures:
$80 million
Direct impacts of John Wayne Airport’s 2012 capital expenditures include:
580 jobs
510 full-time equivalent jobs
$30 million in earnings
$40 million in GDP
$80 million in economic output
Total impacts of John Wayne Airport’s 2012 capital expenditures include:
1,300 jobs
1,150 full-time equivalent jobs
$60 million in earnings
$100 million in GDP
$190 million in economic output

John Wayne Airport Economic Impact Study – FINAL REPORT
March 4, 2014
30
Table 7-1: Total Economic Impact of JWA’s Capital Expenditures in 2012
Type of Impact Employment (Jobs)
Employment (Full-time
Equivalent Jobs)
Earnings ($ Millions)
GDP ($ Millions)
Economic Output
($ Millions)
Direct 580 510 $30 $40 $80
Indirect 280 250 $10 $30 $50
Induced 440 390 $20 $30 $60
Total Impacts 1,300 1,150 $60 $100 $190

John Wayne Airport Economic Impact Study – FINAL REPORT
March 4, 2014
31
8 Contributions to Government
8.1 Introduction The ongoing operation of JWA and associated economic activity in the region generate a significant amount of tax revenue for federal, state and local (county and city) governments. Tax revenues generated by airport operations are different from the economic output of the airport. Tax impacts stem from income taxes and sales taxes on visitor spending, while economic output measures the spending of firms and individuals. This section summarizes the contributions to government revenues that stem from JWA operations and associated economic activity. There are three main sources of government tax revenue.29 These sources are classified based on the party making the tax payment: Taxes paid by passengers. Passengers arriving
and departing from JWA contribute to government revenue streams via state and local sales taxes. For instance, passengers who make retail purchases or rent vehicles contribute sales taxes. Furthermore, visitors to the region contribute sales taxes associated with lodging, transportation, and entertainment.
Taxes paid by employers and employees. Employees and/or employers associated with the airport pay income taxes, payroll taxes (e.g., social security contributions and Medicare) and unemployment insurance premiums. Included in this category are property taxes and sales taxes paid by airline employers for crew member hotel accommodations. Most of these taxes are paid to the federal and state government; however, some are also paid to county and city governments.
Air transportation taxes and fees. Passengers traveling through JWA also separately contribute to the federal government (e.g., into the Airport &
29 See Appendix F for details on the calculations of taxes and fees.
Annual contribution to government revenues from operation of John Wayne Airport:
$231 million
Annual tax contributions of John Wayne Airport by level of government include:
$48 million to the federal government (21%)
$169 million to the state government (73%)
$12 million to county governments (5%)
$2 million to city governments (1%)
Annual tax contributions of John Wayne Airport by level of tax payer include:
$162 million by passengers
$68 million by employers and employees
$1 million by John Wayne Airport
Airfare taxes and fees generated from John Wayne Airport operations include:
$100 million by domestic passengers
$5 million by international passengers

John Wayne Airport Economic Impact Study – FINAL REPORT
March 4, 2014
32
Airway Trust Fund) through taxes and fees applied to air transportation. These taxes and fees directly support the Federal Aviation Administration’s provision of air traffic services and grants to airports and also offset the cost of TSA’s security screening. Passengers flying internationally pay additional fees that offset the costs of customs and agricultural inspection services. While an important impact worth noting in this section, this source and use of federal government revenue differs from the others; therefore, the figures are reported separately in all tables and descriptions.
This study restricts the sources of activity subject to taxes to direct impacts. That is, conceptually, the study excluded the following: Taxes associated with indirect or induced employment (i.e., multiplier effects). Excise or import taxes on cargo. Taxes paid by airport users outside of the airport. Property taxes paid by individuals (i.e., homeowners whose sole source of income is JWA-
related employment). It would be overly complex to broaden the scope of the tax base in this analysis to include taxes generated by indirect and induced employment. The level of detail collected on direct employment from the employment survey administered by InterVISTAS is critical to the tax impact analysis; however, similar information is not available for the indirect and induced employment. Estimating the tax impacts associated with indirect and induced employment would be a complex process, requiring speculation about the general economy and resulting in averages that would not necessarily be accurate. Therefore, the tax impact analysis in this report is limited to revenues generated from direct employment associated with JWA and visitor spending of those who travel to the region via JWA. For the most part, although some taxes were measured directly (e.g., tenant property taxes), this study estimated taxes paid from information on the passengers, employers and employees at the airport. In every case, we opted to use conservative estimation methods. Estimates are based on 2012 tax rates.
8.2 Summary of Tax Contributions by Level of Government Ongoing economic activity at JWA generates tax revenue for all levels of government. In 2012, total tax contributions from JWA-related direct employment to all levels of government were close to $231 million. Figure 8-1 provides a breakdown of tax impacts by level of government. The State of California received the largest amount of tax revenue, approximately $169 million
(73% of total tax revenue impacts). The vast majority of that total is attributable to sales taxes from visitor spending on retail, food, accommodations, ground transportation, and the like.
The federal government received just under $48 million (21% of total tax revenue impacts). This total comes from income taxes and contributions to Social Security, Medicare, and Unemployment Insurance.

John Wayne Airport Economic Impact Study – FINAL REPORT
March 4, 2014
33
Local county and city governments collected the remaining $14 million in tax revenue (6% of total tax revenue impacts). Most of this comes from sales taxes from visitor spending.
Figure 8-1: Annual Estimated Tax Revenues of John Wayne Airport by Level of Government
8.3 Summary of Contributions by Payer A summary of tax contributions by JWA passengers, employers and employees, and JWA is provided in Table 8-1. Passengers at JWA contributed $162 million in tax revenues to all levels of government, while tax payments by employers and employees amounted to $68 million. Below are some highlights of the tax contributions by tax payer. Approximately 71% of taxes were paid by air travelers, while 29% of taxes were paid by airport
associated employers and employees. Airport tenants paid over $1 million in property taxes to county government in 2012.
Table 8-1: Estimated Annual Tax Revenues Generated from John Wayne Airport Operations
Passengers Employers & Employees
John Wayne Airport Total
Total Tax Contributions ($ Millions) $162 $68 $1 $231
Federal, $48
million
State, $169
million
County, $12
million
City,$2
million
Total Contribution: $231 million

John Wayne Airport Economic Impact Study – FINAL REPORT
March 4, 2014
34
In addition, passengers traveling through JWA contributed an additional $105 million in fees and taxes to various federal agencies, including the Airport and Airway Trust Fund and the Department of Homeland Security. These taxes include the passenger ticket tax, international departure tax, the Animal and Plant Health Inspection Service (APHIS) fee, Customs Inspection, and passenger security (9/11) fee. JWA also levies a passenger facility charge to offset the costs of capital development. Table 8-2 provides a breakdown of the taxes and fees paid by passengers flying to or from JWA.
Table 8-2: Summary of Airfare Taxes and Fees Generated from John Wayne Airport Operations
Federal Government Airfare Taxes & Fees
Paid by Passengers
Domestic Flights
($ Millions)
International Flights
($ Millions) Total
($ Millions)
Federal Aviation Administration-related $70.4 $2.0 $72.4 Department of Homeland Security-related $10.7 $2.4 $13.1 Passenger Facility Charges $19.4 $0.5 $19.9 Total $100.5 $4.9 $105.4

John Wayne Airport Economic Impact Study – FINAL REPORT
March 4, 2014
35
9 Summary of Economic Impact Results
9.1 Ongoing Economic Impacts Ongoing operations at JWA and spending by visitors arriving at JWA supported a total of 43,000 jobs (equivalent to 38,200 FTE jobs) in the region in 2012, once multiplier impacts are included.30 Of this employment, 22,000 jobs (equal to 19,500 FTE jobs) are directly related to the airport. Because jobs related to the airport extend far beyond JWA, the total also includes both indirect (approximately 8,200 FTE jobs) and induced employment (10,500 FTE jobs). JWA contributes significantly to the regional economy, as well. The significance of the airport is demonstrated by the direct economic impact of the airport (both operations and visitor spending) on GDP and output, measured at $1.5 billion and $2.8 billion, respectively. Including indirect and induced impacts, the total impacts are approximately $3.3 billion and $6.0 billion, respectively. Table 9-1 summarizes the ongoing economic impacts of JWA.
30 The combined multiplier impacts (indirect and induced) for airport operations and tourism are estimated. Indirect and induced impacts of airport operations are adjusted to remove tourism from aviation and avoid double-counting.
Ongoing direct impacts of John Wayne Airport include:
22,000 direct jobs
19,500 direct full-time equivalent jobs
$0.8 billion in direct earnings
$1.5 billion in direct GDP
$2.8 billion in direct economic output
Ongoing total impacts of John Wayne Airport include:
43,000 total jobs
38,200 total full-time equivalent jobs
$1.7 billion in total earnings
$3.3 billion in total GDP
$6.0 billion in total economic output
Direct impacts of John Wayne Airport’s 2012 capital expenditure include:
580 direct jobs
510 direct full-time equivalent jobs
Annual tax contributions of John Wayne Airport amount to:
$231 million

John Wayne Airport Economic Impact Study – FINAL REPORT
March 4, 2014
36
Table 9-1: Annual Total Ongoing Economic Impacts of John Wayne Airport
Type of Impact Employment (Jobs)
Employment (Full-time
Equivalent Jobs)
Earnings ($ Billions)
GDP ($ Billions)
Economic Output
($ Billions)
Direct Impacts
JWA Operations 6,100 5,400 $0.3 $0.5 $0.9
Visitor Spending 15,900 14,100 $0.5 $1.0 $1.9
Direct Impacts 22,000 19,500 $0.8 $1.5 $2.8
Indirect 9,200 8,200 $0.4 $0.8 $1.5
Induced 11,800 10,500 $0.5 $1.0 $1.7
Total Impacts 43,000 38,200 $1.7 $3.3 $6.0
9.2 2012 Capital Expenditure Impacts There are separate economic impacts associated with the airport’s capital expenditures that we do not include as part of on-going operations in 2012. JWA spent approximately $80 million dollars in capital expenditures throughout 2012. That spending generated an estimated 580 direct jobs (equivalent to 510 FTE jobs) and $30 million in direct earnings. The total economic impact of the airport’s 2012 capital expenditures is summarized in Table 9-2.
Table 9-2: Total Economic Impact of John Wayne Airport’s Capital Expenditures in 2012
Type of Impact Employment (Jobs)
Employment (Full-time
Equivalent Jobs)
Earnings ($ Millions)
GDP ($ Millions)
Economic Output
($ Millions)
Direct 580 510 $30 $40 $80
Indirect 280 250 $10 $30 $50
Induced 440 390 $20 $30 $60
Total Impacts 1,300 1,150 $60 $100 $190

John Wayne Airport Economic Impact Study – FINAL REPORT
March 4, 2014
37
9.3 Annual Tax Contribution JWA is also an important generator of taxation revenues to all levels of government. Total taxes paid on an annual basis, by passengers, employers and employees, and JWA were estimated at $231 million in 2012. The majority of taxes collected accrue to the state and federal governments at 73% and 21%, respectively. The local county and city governments also benefit from JWA, such as through the collection of property taxes, sales taxes and hotel occupancy taxes amounting to $14 million, as shown in Figure 9-1.
Figure 9-1: Estimated Tax Revenues of John Wayne Airport, 2012
Federal, $48
million
State, $169
million
County, $12
million
City,$2
million
Total Contribution: $231 million

John Wayne Airport Economic Impact Study – FINAL REPORT
March 4, 2014
38
Appendix A: Employment Survey
Identification of the Survey Population A total of 200 firms received employment surveys for the JWA economic impact study. The different types of employment surveys distributed to tenants located on-site at JWA and directly related employers located off-site include: General Survey, Air Carrier Survey, Accommodations Survey and Ground Transport Survey.
Table A-1: Total Number of Firms Surveyed
Type of Survey Number of Firms Surveyed
Number of Responding Firms Response Rate
General 127 110 87%
Air Carrier 20 16 80%
Accommodation 30 18 60%
Ground Transportation 23 16 70%
Total 200 160 80%
Questionnaire Design The basic questionnaire was designed to obtain information, and to be as clear and easy to understand as possible for respondent firms. The basic questionnaire provided to airport tenants contained questions in the following areas: General Information Name of firm, address Contact person's name and title Phone and fax numbers Email and website address Principal business activity

John Wayne Airport Economic Impact Study – FINAL REPORT
March 4, 2014
39
Total Employment Numbers Total employees (2012) Number of on-site employees Number of off-site employees Part-time and Full-time Employment Full-time permanent employees Part-time permanent employees Full-time seasonal employees Part-time seasonal employees Average hours and weeks for part-time and seasonal employees Payroll and Wage Total payroll excluding benefits; or Average wage per employee Employment by Occupation A selection of job trades was provided to categorize employment Employment by Residency A list of Orange County communities, and surrounding counties was provided to categorize
employment Outsourcing and Contracting Out Number of individuals on contract Average hours and weeks for individuals on contract Number and names of firms on contract Average annual hours for firms on contract Property Taxes & Other Taxes Total property taxes paid (2012) Other state and local taxes paid (2012)

John Wayne Airport Economic Impact Study – FINAL REPORT
March 4, 2014
40
Business Related to John Wayne Airport Proportion of firm’s business revenues in Orange County related to JWA (2012) Business Revenue Related to Air Cargo Proportion of firm’s business revenues in Orange County related to air cargo servicing at JWA
(2012)
Conducting the Survey The survey was mailed out electronically by InterVISTAS Consulting, with a cover letter from John Wayne Airport Director, Alan L. Murphy. The letter explained the purpose of the study, the confidentiality of responses and encouraged members of the airport business community to participate. Following the initial electronic mail-out of the surveys and throughout the following weeks, non-responding firms were contacted by telephone to follow-up on the completion of the survey. Firms were encouraged to return the survey and new copies were offered if the originals were lost. The replacement surveys were emailed once again. Some survey responses were collected via a telephone interview with firms.

John Wayne Airport Economic Impact Study – FINAL REPORT
March 4, 2014
41
Appendix B: Sample Survey

John Wayne Airport Economic Impact Study – FINAL REPORT
March 4, 2014
42

John Wayne Airport Economic Impact Study – FINAL REPORT
March 4, 2014
43

John Wayne Airport Economic Impact Study – FINAL REPORT
March 4, 2014
44

John Wayne Airport Economic Impact Study – FINAL REPORT
March 4, 2014
45

John Wayne Airport Economic Impact Study – FINAL REPORT
March 4, 2014
46

John Wayne Airport Economic Impact Study – FINAL REPORT
March 4, 2014
47

John Wayne Airport Economic Impact Study – FINAL REPORT
March 4, 2014
48

John Wayne Airport Economic Impact Study – FINAL REPORT
March 4, 2014
49

John Wayne Airport Economic Impact Study – FINAL REPORT
March 4, 2014
50
Appendix C: Summary of Total Jobs and Full-Time Equivalent Jobs, Airport Operations Only
The table below includes a summary of the total surveyed employment, total inferred employment for non-respondents and total contract employment. Employment is presented in both jobs and FTE jobs.
Table C-1: Total Jobs and Full-Time Equivalent Jobs, Airport Operations Only
Employment Source Jobs Full-Time Equivalent Jobs
Surveyed employment1 4,400 3,900
Inferred employment for non-respondents2 1,400 1,200
Contract employment3 300 300
Total 6,100 5,400
Notes: 1 Appendix A 2 Appendix D 3 Appendix E

John Wayne Airport Economic Impact Study – FINAL REPORT
March 4, 2014
51
Appendix D: Inferred Employment
Because not all employers responded to our requests for information in the survey, we statistically inferred some employment data to replace that which otherwise would be missing. This allows us to estimate the total amount and type of employment, which provides the basis for other estimates of economic impact. In general, InterVISTAS’ approach bases these inferred estimates on information provided by responding firms for each business type and validated against information from other publicly available sources of data. This approach is conservative in that we assumed that the non-responding firms are smaller than responding firms. The employment data in this report was compiled from a combination of two sources: 1. Employment reported by employers on surveys submitted to InterVISTAS. 2. Employment inferred for employers who did not provide a survey response. Inferred
employment was based on employment information from those firms in each business type that did respond to the survey. The mean employment of respondents in each business type was calculated, excluding outliers, and then conservatively adjusted downwards. For instance, those firms with especially large employment levels were excluded from the "mean without outliers" to obtain conservative results. This "adjusted mean" employment for each business type was then applied to those firms who did not respond to the survey.

John Wayne Airport Economic Impact Study – FINAL REPORT
March 4, 2014
52
Appendix E: Contract Employment
Some firms contract out services that they do not have expertise in providing or when there are cost advantages to doing so. For example, many airport firms contract out janitorial, elevator and maintenance services. The employment survey asked firms to identify whether they contracted out some of their work, and to estimate the number of annual hours involved. Contract work was separated into two distinct categories in the employment survey: 1) individual “employees” paid through a contract, rather than via payroll, and 2) contracting out services to other firms. The employment results for individuals on contract were derived by counting the number of individual positions for the number of jobs and dividing the total hours of employment by 1,800 to estimate FTE jobs. The employment results for firms on contract were derived by dividing the total hours of employment by 1,800 to estimate FTE jobs.

John Wayne Airport Economic Impact Study – FINAL REPORT
March 4, 2014
53
Appendix F: Tax Contributions by Passengers, Employers and Employees, and John Wayne Airport
Introduction Sales tax liabilities associated with airport passengers are an important source of state and local government revenue. This appendix describes the assumptions made when calculating the estimated tax revenues generated from JWA airport users. In addition, tax liabilities associated with airport employers, including payroll taxes and unemployment insurance deductions, are key sources of revenues for local, state, and federal governments. This appendix summarizes the assumptions made to estimate tax revenues generated from JWA employers, as well as the approach used to estimate employer and employee tax contributions at the local, state and federal government level. This section also outlines the fees paid by JWA to the county. A complete summary of tax contributions by JWA passengers, employers and employees, and JWA is provided in Figure F-1. The summary also provides a breakdown by level of government: federal, state, county, and local/city. Passengers travelling through JWA also contribute to the federal government (e.g., into the Airport and Airway Trust Fund) through taxes and fees applied to airfare. A summary of airfare taxes and fees generated by operations at JWA is presented in Figure F-2.
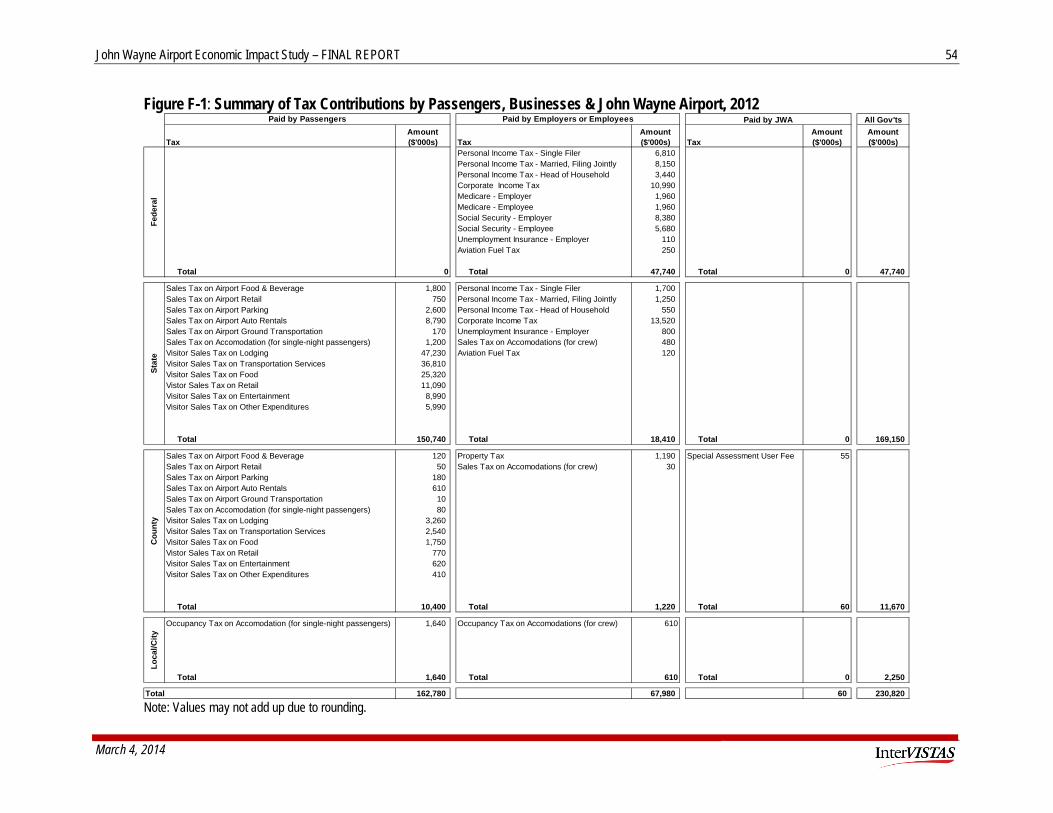
John Wayne Airport Economic Impact Study – FINAL REPORT
March 4, 2014
54
Figure F-1: Summary of Tax Contributions by Passengers, Businesses & John Wayne Airport, 2012
Note: Values may not add up due to rounding.
Paid by JWA All Gov'ts
TaxAmount ($'000s) Tax
Amount ($'000s) Tax
Amount ($'000s)
Amount ($'000s)
Personal Income Tax - Single Filer 6,810 Personal Income Tax - Married, Filing Jointly 8,150 Personal Income Tax - Head of Household 3,440 Corporate Income Tax 10,990 Medicare - Employer 1,960 Medicare - Employee 1,960 Social Security - Employer 8,380 Social Security - Employee 5,680 Unemployment Insurance - Employer 110 Aviation Fuel Tax 250
Total 0 Total 47,740 Total 0 47,740
Sales Tax on Airport Food & Beverage 1,800 Personal Income Tax - Single Filer 1,700 Sales Tax on Airport Retail 750 Personal Income Tax - Married, Filing Jointly 1,250 Sales Tax on Airport Parking 2,600 Personal Income Tax - Head of Household 550 Sales Tax on Airport Auto Rentals 8,790 Corporate Income Tax 13,520 Sales Tax on Airport Ground Transportation 170 Unemployment Insurance - Employer 800 Sales Tax on Accomodation (for single-night passengers) 1,200 Sales Tax on Accomodations (for crew) 480 Visitor Sales Tax on Lodging 47,230 Aviation Fuel Tax 120 Visitor Sales Tax on Transportation Services 36,810 Visitor Sales Tax on Food 25,320 Vistor Sales Tax on Retail 11,090 Visitor Sales Tax on Entertainment 8,990 Visitor Sales Tax on Other Expenditures 5,990
Total 150,740 Total 18,410 Total 0 169,150
Sales Tax on Airport Food & Beverage 120 Property Tax 1,190 Special Assessment User Fee 55Sales Tax on Airport Retail 50 Sales Tax on Accomodations (for crew) 30 Sales Tax on Airport Parking 180 Sales Tax on Airport Auto Rentals 610 Sales Tax on Airport Ground Transportation 10 Sales Tax on Accomodation (for single-night passengers) 80 Visitor Sales Tax on Lodging 3,260 Visitor Sales Tax on Transportation Services 2,540 Visitor Sales Tax on Food 1,750 Vistor Sales Tax on Retail 770 Visitor Sales Tax on Entertainment 620 Visitor Sales Tax on Other Expenditures 410
Total 10,400 Total 1,220 Total 60 11,670
Occupancy Tax on Accomodation (for single-night passengers) 1,640 Occupancy Tax on Accomodations (for crew) 610
Total 1,640 Total 610 Total 0 2,250
Total 162,780 67,980 60 230,820
Paid by Passengers Paid by Employers or Employees
Fede
ral
Stat
eC
ount
yLo
cal/C
ity

John Wayne Airport Economic Impact Study – FINAL REPORT
March 4, 2014
55
Figure F-2: Summary of Airfare Taxes and Fees Generated from John Wayne Airport Operations, 2012
Note: Values may not add up due to rounding.
Tax Revenues Attributable to Airport Passengers State and Local Sales Tax The definition of retail sales and what goods and services are taxable vary among different states and jurisdictions. Sales taxes, including those imposed by local governments, are generally administered at the state level. States imposing sales tax require retail sellers to collect tax from customers, file returns, and remit the tax to the state. In California, there are two levels of sales tax that can be applied to the purchase of goods and services: state and county. The combined tax rate is dependent on where the purchase is made within California and the type of purchase that is made. The total typical sales tax for most retail purchases in the study region is 7.75%.31 This includes the state and local sales taxes collected by the State of California, as well as district taxes collected by the county.
Tax on Airport Concessions As travelers pass through the airport, they have the opportunity to purchase various items from airport tenants, including food and beverage, news and retail items.32 Passengers are charged a sales tax for all goods or services purchased on-site at the airport that are subject to the state and local sales tax.
31 Rates effective 07/01/11-12/31/12 were used in the analysis. (http://www.boe.ca.gov/sutax/taxrateshist.htm) 32 Sales taxes are estimated for food and beverage expenditures for meals purchased at airport restaurants and fast food providers.
Airfare Taxes & FeesAmount ($'000s)
Domestic Flights:FAA-related 70,440 DHS-related 10,780 PFCs 19,400
International Flights:FAA-related 1,970 DHS-related 2,360 PFCs 530 Total 105,480
Paid by PassengersFe
dera
l

John Wayne Airport Economic Impact Study – FINAL REPORT
March 4, 2014
56
Estimation Method and Results Most purchases made within the airport are subject to a sales tax of 7.75%. Based on the information from JWA’s Revenue Report, total airport concession revenues were over $35.1 million in 2012. Tax on these expenditures is estimated to total $2.7 million, with $2.5 million in state tax revenues and $0.2 million in local tax revenues.
Tax on Ground Transportation, Parking, and Car Rentals JWA has on-site parking facilities that generate millions of dollars in revenue every year. When individuals purchase parking at the airport, applicable sales taxes are levied. In addition, many passengers pay to rent cars once they arrive at the airport; sales tax applies in these instances, as well. Other airport passengers use local ground transportation services, such as taxi, limousine and shuttle services, to and from the airport. Parking and car rental purchases, as well as ground transportation expenditures, are directly related to the operations of JWA, and therefore, the sales tax revenue generated for the state or local governments is assessed. Estimation Method and Results The sales tax rate applies to taxi, limousine and bus transportation, as well as to parking fees and car rentals. Based on the information from JWA’s 2011-2012 Revenue Report, total airport parking revenues were nearly $36 million, and total auto rental revenues were roughly $121 million in 2012. In the same year, ground transportation revenues were more than $2 million. Sales tax on parking and auto rentals revenues equate to $2.7 million and $9.4 million, respectively. Tax on ground transportation expenditures is estimated at over $0.2 million.
Tax on Accommodation Costs (Single-Night Stay Passengers) In cases of occasional flight cancellations, some travelers need to spend the night in a nearby hotel. Passengers with early morning flights may also sometimes arrive the day before and spend the night at a nearby hotel. These activities lead to expenditures by airport users on hotels around the airport site. Various levels of sales tax are applied to these expenditures, which thereby contribute government revenues streams. Estimation Method and Results The California sales tax rate of 7.75% applies to all accommodation expenditures within the state. In addition, many cities in California, including Santa Ana, Anaheim and Orange, apply additional hotel room occupancy taxes on top of the standard sales tax rate, to accommodation expenditures. To ensure the accuracy of this tax analysis, the combined sales tax rate for each of the hotels surveyed in our study was determined (based on the exact location of each of the hotels). According to the Anaheim/Orange County Visitor & Convention Bureau, the average occupancy rate in the region is 75%, and the average daily room rate is approximately $150.

John Wayne Airport Economic Impact Study – FINAL REPORT
March 4, 2014
57
To estimate the total accommodation costs of these single-night stay passengers, the average daily room rate was applied to the estimated passenger nights determined from the survey of hotels. In the end, the sales tax revenue generated from single-night stay passengers amounted to $2.9 million ($1.2 million for state and $1.7 million for local governments).
Tax on Visitor Spending Visitors spend money on a variety of goods and services during their time spent in the region. Due to the associated sales tax applied on goods and services, non-local visitor spending generates a significant amount of state and local tax revenue. Estimation Method and Results Non-local visitors that travel through JWA spent an estimated $1.8 billion in 2012. This value is based on the visitor spending analysis outlined in Section 6 of the report. As it is not possible to determine where visitors are spending their money when visiting the region, a conservative sales tax rate was used. The combined sales tax rate of 7.75% was the only rate applied to the visitor spending totals. The Lodging (Accommodation) tax calculation does not account for local level hotel room occupancy taxes that may be applied. This differs from the single-night stay passenger tax calculation process, which included all applicable sales and lodging taxes. Expenditure of visitors arriving via JWA generated $135.4 million in state tax revenues and $9.3 million in county tax revenues. Table F-1 provides a breakdown of the applicable state and county sales taxes associated with each category of visitor spending.
Table F-1: Sales Tax Generated from Visitor Spending via John Wayne Airport
Spending Category State Sales Tax ($ Millions)
County Sales Tax ($ Millions)
Lodging $47.2 $3.3
Transportation Services $36.8 $2.5
Food & Beverage $25.3 $1.7
Retail $11.1 $0.8
Entertainment $9.0 $0.6
Other $6.0 $0.4
Total Tax Revenue $135.4 $9.3

John Wayne Airport Economic Impact Study – FINAL REPORT
March 4, 2014
58
Tax Revenues Attributable to Airport Employers and Employees JWA Direct Employment The majority of the tax calculations in this report are based on the direct employment and direct earnings outlined in Section 3 of the report. The total direct employment used for the tax calculations is 6,100 jobs (equivalent to 5,400 FTE jobs). Direct employment inputs for each employer type (e.g., taxi driver, customs agent, etc.) are taken directly from the employment survey results.
Personal Income Tax (Federal and State) Employees who work for employers tied to JWA are taxed on their income and as a result, contribute to federal and state tax revenues. Estimation Method and Results The tax paid by a group of employees depends on the income distribution of those employees. Employers did not provide us with that information. Rather, we used the average annual income per employee (per employer type) as the basis for calculating personal income tax contributions. Federal and state income tax rates vary significantly depending on how the filer classifies themselves: Single filer Married, filing jointly Married, filing separately Head of a household To ensure the accuracy of the income tax calculations, external research was conducted to determine the proportion of income tax filers that fall under each of the filing categories. We used data from the U.S. Census Bureau to estimate the proportion of the California population that may file as single, married or head of a household.33 These proportions were then applied to the total person year and earnings data for JWA employers. We made simplifying assumptions about the deductions and exemptions that tax filers would claim. These included the application of the earned income tax credit, the application of standard deductions as opposed to itemized deductions, and the number of dependents. For applicable California taxes, we assumed that no State Credits or State Deductions were applied. Estimated income tax payable for all filing categories is $18.4 million in federal tax and $3.5 million in state tax.
33 U.S. Census Bureau – Quick Facts on California – California Households by Type. Based on this data, roughly 49% of California residents would qualify as married filers, 31% would qualify as single filers and 19% would qualify as head of a household.

John Wayne Airport Economic Impact Study – FINAL REPORT
March 4, 2014
59
Corporate Income Tax (Federal and State) Corporate income tax is imposed at the federal level on all entities treated as corporations. The corporate tax rate varies by the type and size of company, as well as by jurisdiction.34 Corporate income tax is based on net taxable income. Some transactions are not taxable, and certain credits and deductions are applicable. Government agencies are not subject to corporate income tax, nor are public agencies, including John Wayne Airport.35 Estimation Method and Results Calculating corporate income tax liability is very difficult. It requires knowledge of the total tax base and the proportion of the tax attributable to the states. Therefore, an approximate method has been used to calculate corporate income tax associated with operations at JWA. This method involves determining the total federal and state corporate income tax collections and dividing these values by the total federal and state employment numbers for 2012.36 The resulting figures are the average corporate income tax collected per employee (federal and state separately). The estimates for 2012 are outlined below: Federal corporate income tax collected per employee was $2,101 State corporate income tax collected per employee was $2,583 Using the 5,200 of taxable employment associated with JWA,37 we estimated corporate income tax paid per associated employers. This assumes that all companies pay corporate income tax at an average rate per employee. Based on this assumption, JWA-related employers paid close to $11.0 million in federal corporate income tax and $13.5 million in state corporate income tax.
Medicare Medicare is a separate payroll tax that is paid at the federal level by both employees and employers. The separate Medicare payroll tax rate of 1.45% for employees and 1.45% for employers is applied to the maximum payroll contribution (no limit).38 Estimation Method and Results The calculation of Medicare payments associated with JWA employers and employees is determined by using the Medicare employee and employer rate outlined above, and applying this
34 According to information from the IRS, the marginal federal corporate income tax rates fall between 15-35%. 35 As a public agency, JWA does not pay corporate income tax; however, it pays applicable sales tax on any and all purchases. 36 The total federal and state corporate income tax collections values were taken from the IRS 2012 Tax Statistics. The total national and state employment was obtained from the U.S. Bureau of Labor Statistics. 37 The taxable person years of employment associated with JWA in this case is 5,200 jobs. This number was calculated by subtracting the 900 person years of employment associated with federal government agencies (e.g., FAA) and JWA airport staff from the 6,100 total employment related to the airport. 38 OASI and SSI Program and Rates for 2012; taken from the official website of the U.S. Social Security Administration.

John Wayne Airport Economic Impact Study – FINAL REPORT
March 4, 2014
60
rate to the average salary per employer type. This Medicare rate is then applied to the applicable direct employment associated with each employer type at JWA. Based on the calculations, JWA employers and employees contributed close to $2.0 million each respectively in federal Medicare tax payments, totaling close to $4.0 million.
Social Security Social Security is funded largely through dedicated payroll taxes. The Federal Insurance Contributions Act (FICA) imposes a Social Security withholding tax equal to 6.2% for employers and 4.2% for employees of the gross wage amount, up to but not exceeding the Social Security Wage Base of $110,100.39 In 2012, employee contributions were 4.2% of pensionable earnings. The maximum annual employee contribution amount is $4,624. Estimation Methods and Results The employee contribution rate is applied to average payroll for employees who are earning less than $110,100 a year. Similarly, the employer contribution rate is also applied to the same average payroll figure. The estimated employer contribution is $8.4 million and the estimated employee contribution is $5.7 million. In total, JWA related employers and employees contribute close to $14.1 million in federal Social Security payments.
Unemployment Insurance Unemployment Insurance (UI) is a federal-state program jointly financed through federal and state employer payroll taxes. The Federal Unemployment Tax Act (FUTA) authorizes the IRS to collect a federal employer tax to fund state workforce agencies. In 2012, U.S. employers paid federal UI premiums equal to 6.0% of earnings up to a maximum taxable wage base of $7,000 per calendar year. Employers who pay the state UI tax in a timely manner receive an off-set credit of up to 5.4%, regardless of the tax rate paid to the state. As a result, the FUTA tax rate for employers in states not subject to a FUTA credit reduction is generally 0.6% (6.0% – 5.4% = 0.6%). This reduced rate results in a maximum FUTA tax of $42 per employee per year (0.6% of $7,000 = $42).40 In California, UI is paid for by employers; individual employees do not contribute to UI premiums. The California UI tax is a percentage of taxable wages up to a cap of $7,000 (taxable wage base). The California UI tax rate could range from 1.5% to 6.2%, depending on employer’s industry and “experience rating.”
39 OASI and SSI Program and Rates for 2012; taken from the official website of the U.S. Social Security Administration. 40 Rates and wage base information taken from the website of the United States Department of Labor: Employment & Training Administration.

John Wayne Airport Economic Impact Study – FINAL REPORT
March 4, 2014
61
Estimation Method and Results To calculate the JWA-related federal UI premiums paid, it is assumed that all related employers paid state taxes in a timely manner and were therefore able to take advantage of the 5.4% off-set credit. Based on these assumptions, JWA employers pay the maximum of $42 per employee per year. The estimated federal UI payment for JWA employers was about $114,000 in 2012. Calculating the UI premiums paid by JWA employers to the state government is a more difficult process, as this requires determining the unique experience rating and total taxable wages of each employer. Because this level of information is not available, assumptions are made to determine an average experience rating that can be applied. In 2012, the average weekly benefit was $295.14.41 Based on this information, we calculated an average experience rating of 4.2%. We then applied this average UI rate to total employee wages up to $7,000 per year. Based on this calculation, the estimated UI premium payment to the state as a result of JWA operations was $800,000 in 2012.
Aviation Fuel Tax The federal and state governments levy taxes on jet fuel. The aviation fuel tax rate at the federal level is $0.043 per gallon, while the aviation fuel tax rate at the state level is $0.020 per gallon.42 Estimation Method and Results Based on the information from JWA’s 2011-2012 Revenue Report, the amount of aviation fuel recorded as sold at JWA in 2012 was approximately 5.8 million gallons. Estimated aviation fuel tax revenues at JWA are based on this recorded fuel volume and amount to approximately $370,000. Of this total, $250,000 went to the federal government and the government of California collected nearly $120,000.
Tax on Accommodation Costs (Airline Crew) Airline crew members who have arrived at JWA often need to stay near the airport before taking off on their next scheduled flight. These activities lead to expenditures by airlines at hotels around the airport site. Various levels of sales tax are applied to these expenditures, which thereby contribute government revenues streams. Estimation Method and Results As noted above, the California sales tax rate of 7.75% applies to all accommodation expenditures within the state. In addition, many cities in California, including Santa Ana, Anaheim and Orange, apply additional hotel room occupancy taxes on top of the standard sales tax rate, to accommodation expenditures. To ensure the accuracy of this tax analysis, the combined sales tax
41 http://www.edd.ca.gov/about_edd/pdf/qsui-Avg_WBA.pdf 42 Federal aviation fuel tax rate taken from Airlines for America, Government-Imposed Taxes on Air Transportation (http://www.airlines.org/Pages/Government-Imposed-Taxes-on-Air-Transportation.aspx), and state aviation fuel tax rate taken from California Board of Equalization, Tax Rates - Special Taxes and Fees (http://www.boe.ca.gov/sptaxprog/tax_rates_stfd.htm#9a)

John Wayne Airport Economic Impact Study – FINAL REPORT
March 4, 2014
62
rate for each of the hotels surveyed in our study was determined (based on the exact location of each of the hotels). According to the Anaheim/Orange County Visitor & Convention Bureau, the average occupancy rate in the region is 75%, and the average daily room rate is approximately $150. To estimate the total accommodation costs of these airline crew members, the average daily room rate was applied to the estimated crew layover nights determined from the survey of hotels. In the end, the sales tax revenue generated from crew layover nights amounted to $1.1 million ($480,000 for state and $640,000 for local governments).
Property Taxes Local governments levy property taxes to help them finance local services. JWA is not subject to Orange County property taxes for the airport. However, JWA commercial tenants are subject to various levels of property tax payable to the local government. JWA employers paid collective property tax in the amount of $1.2 million in 2012.
Tax Revenues Attributable to John Wayne Airport Property Taxes Local governments levy special user assessment fees (in lieu of property taxes) to help them finance local services. According to the Orange County Treasurer’s Office, JWA paid a total of $55,000 in special assessment user fees in 2012.
Tax Revenues Attributable to Airfare Taxes and Fees Passengers traveling through JWA pay a number of federal taxes and fees that offset the cost of providing federal air traffic services and security services. In general, these taxes, fees, and charges provide funds to the FAA’s Airport and Airway Trust Fund, the Department of Homeland Security (including the Transportation Security Administration and Customs and Border Protection). In this way, JWA operations help to fund the federal agencies that ensure the successful operation of the larger airport system in the U.S.43 In addition, passengers at JWA pay a “Passenger Facility Charge” (PFC) that offsets the cost of airport infrastructure. These PFCs are used to fund FAA-approved projects that enhance safety, security, or capacity; reduce noise; or increase air carrier competition at U.S. airports. Taxes and fees are applied on top of the base domestic and international airfare paid by travelers. These fees are collected from passengers by airlines, but are then funneled to the applicable federal agencies. 43 The federal government also levies certain fees that do not apply directly to passengers. These include the cargo waybill tax and the U.S. Animal and Plant Health Inspection Service (APHIS) aircraft fee. We did not estimate the total collections associated with these charges.

John Wayne Airport Economic Impact Study – FINAL REPORT
March 4, 2014
63
For domestic airfare, fees and taxes are charged every time a passenger departs from a U.S. airport, regardless of whether they are a connecting or non-connecting passenger. Table F-2 provides an overview of the taxes and fees applied to domestic airfare paid by passengers departing from JWA.
Table F-2: Taxes & Fees Applied to Domestic Airfare from JWA, 2012
Name of Tax / Fee 2012 Rate Description
Passenger Ticket Tax 7.50% U.S. government ad valorem tax on base airfare.
Flight Segment Fee $3.80 U.S. government fee applied per flight segment (single landing and take-off).
September 11th Security Fee $2.50 U.S. government assessed fee per U.S. enplanement to offset cost of security.
Passenger Facility Charge $4.50 Charge levied by local airport authority.
Source: Breakdown of fees and taxes from airline sample bookings
For international airfare, applicable U.S. fees and taxes are charged both when a passenger leaves the U.S. for an international destination, and when a passenger returns to the U.S. from an international destination. The international specific taxes and fees apply only to non-connecting passengers who are using the federal Customs and Immigration facilities when landing at a U.S. airport. The September 11th security fee is applied to all passengers who depart from a U.S. airport to any destination, domestic or international. Table F-3 provides an overview of the taxes and fees applied to international airfare. PFCs are applied by the local airport authority.

John Wayne Airport Economic Impact Study – FINAL REPORT
March 4, 2014
64
Table F-3: Taxes & Fees Applied to International Air Service to/from JWA, 2012
Name of Tax / Fee 2012 Rate Description
U.S. International Departure/Arrival Tax
$16.70 U.S. government tax applied to international flights arriving in or departing from the U.S.
U.S. Immigration & Naturalization Fee
$7.00 U.S. government fee charged to returning passengers.
U.S. Customs User Fee $5.50 U.S. government fee charged to returning passengers.
U.S. Animal and Plant Health Inspection Service Fee
$5.00 U.S. government fee charged to returning passengers.
September 11th Security Fee $2.50 U.S. government fee assessed per U.S. enplanement.
Passenger Facility Charge $4.50 Charge levied by local airport authority.
Source: Breakdown of fees and taxes from airline sample bookings
Estimation Method and Results To determine the airfare taxes and fees generated from JWA’s operations, several methodological steps were taken to ensure that only the taxes and fees related to JWA were accounted for. The steps are outlined below: 1. Determined the number of domestic and international enplaned and deplaned passengers
traveling through JWA in 2012.44 This passenger traffic information was provided by JWA. 2. The average one-way base airfare from JWA was sourced from Diio Schedules Database.
These base fares do not include any taxes and fees. According to Diio, the average one-way domestic airfare from JWA was $167 and the average one-way international airfare from JWA was $265 in 2012. These values were used as the basis for estimating the average international and domestic airfare revenues from JWA in 2012. Based on the calculations, $720 million in domestic airfare revenue and $10 million in international airfare revenue was generated from JWA operations in 2012.
3. Applied the international and domestic airfare taxes and fees outlined in Table F-2 and Table F-3 to the 2012 passenger traffic and airfare revenue totals in order to estimate the total funds generated for the federal agencies.
44 Passenger traffic statistics provided by JWA.

John Wayne Airport Economic Impact Study – FINAL REPORT
March 4, 2014
65
Based on the application of the methodology described above, domestic airfare from JWA generated $100.5 million in funds for the federal agencies, while international airfare from JWA generated $4.9 million in funds for the federal agencies. In total, $105.4 million in fees and taxes were collected as a result of JWA airport operations.

John Wayne Airport Economic Impact Study – FINAL REPORT
March 4, 2014
66
Appendix G: Glossary of Terms
Contract Work: Any work which is done for a company by an individual who is not on the payroll or work done for a company by another company. Generally speaking, firms will contract out work in areas in which they do not have expertise or when there are cost advantages to doing so. Direct Employment: Direct employment is employment that can be directly attributable to the operations in an industry, firm, etc. It is literally a head count of those people who work in a sector of the economy. In the case of the airport, all of those people who work in an aviation related capacity would be considered direct employment. Economic Activity: (also Output, Production) The end product of transforming inputs into goods. The end product does not necessarily have to be a tangible good (for example, knowledge), nor does it have to create utility (for example, pollution). Or, more generally, the process of transforming the factors of production into goods and services desired for consumption. Economic Output: (also Economic Activity, Production) The end product of transforming inputs into goods. The end product does not necessarily have to be a tangible good (for example, knowledge), nor does it have to create utility (for example, pollution). Or, more generally, it is defined as the process of transforming the factors of production into goods and services desired for consumption. Employment Impact: Employment impact analysis determines the economic impact of employment in terms of jobs created and salaries and wages paid out. In the case of the airport, the direct, indirect, induced and total number of jobs or person years created at the airport is examined to produce a snapshot of airport operations. Full Time Equivalent (FTE): (also Person Year) One full time equivalent (FTE) year of employment is equivalent to the number of hours that an individual would work on a full time basis for one year. In this study, we have calculated one full time equivalent year to be equivalent to 1,800 hours. Full time equivalent years are useful because part time and seasonal workers do not account for one full time job.45 Gross Domestic Product: (GDP, also value-added) A measure of the money value of final goods and services produced as a result of economic activity in the nation. This measure is net of the value of intermediate goods and services used up to produce the final goods and services. Ground Transportation: Ground Transportation at the airport includes any vehicles which transport passengers from the airport to the cities or from the cities to the airport. This would include taxicab service, limousine service and shuttle service. Indirect Employment: Indirect employment is employment which results because of direct employment. For the airport, it would include that portion of employment in supplier industries which are dependent on sales to the air transport sector. In some cases, contract work would be considered indirect employment. Induced Employment: Induced employment is employment created because of expenditures by direct and indirect employees.
45 The Dictionary of Modern Economics, David W. Pearce, General Editor, The MIT Press, Cambridge Mass.,1984

John Wayne Airport Economic Impact Study – FINAL REPORT
March 4, 2014
67
Multiplier Analysis: Analysis using economic multipliers in which indirect and induced economic impacts is quantified. Essentially, a multiplier number is applied to the "directly traceable economic impact" to produce indirect, induced and total effects (see Multiplier). Multiplier: Economic multipliers are used to infer indirect and induced effects from a particular sector of the economy. They come in a variety of forms and differ in definition and application. A multiplier is a number which would be multiplied by direct effects in order to calculate indirect or induced effects. In the case of the airport, as in many other cases, multipliers can lead to illusory results, and thus must be used with great care. Passenger Facility Charge (PFC): A charge levied on enplaning passengers by the airport authority to help with funding capital improvements at the airport and mitigate noise impacts. The charge is sometimes referred to as a Passenger Facility Fee. Seasonality: Seasonality results when the supply and demand for a good is directly related to the season in which is consumed. For example, ski resorts experience changes in net income as a result of seasonality. Airports and airport services also experience seasonality as a result of vacation times for families (typically during the summer) and/or temperatures abroad (typically at Christmas time). As a result of seasonality in demand for flights, some air carriers increase frequency of flights to certain areas during the busy season. Tenant: A firm which pays a lease to a leasing company or to the airport authority directly. Value-Added: (also GDP) A measure of the money value of final goods and services produced as a result of economic activity in the nation. This measure is net of the value of intermediate goods and services used up to produce the final goods and service.

Prepared by
InterVISTAS Consulting LLC 1150 Connecticut Avenue, NW
Suite 601 Washington, DC
20036 Telephone: 202-688-2220 Facsimile: 202-688-2225
www.intervistas.com