john porter why this presentation? the forms data take for analysis are often different than the...
TRANSCRIPT

John Porter

Why this presentation?The forms data take for analysis are often
different than the forms data take for archival storageSpreadsheets are widely used for simple analyses
But they have poor archival qualities Different versions over time are not compatible Formulas are hard to capture or display
They allow (encourage) users to structure data in ways that are hard to use with other software
Our goal with archived data is to store the data in ways that it can be used in automated ways, with minimal human intervention

Data that can be automatedBelow is a picture of a data spreadsheet that
could NOT be easily automated….. Why not?

Ugly DataProblems
Dates are not stored consistently Sometimes date is stored with a label (e.g.,
“Date:5/23/2005”) sometimes in its own cell (10/2/2005)Values are labeled inconsistently
Sometimes “Conductivity Top” others “conductivity_top” For Salinity sometimes two cells are used for top and
bottom, in others they are combined in one cellData coding is inconsistent
Sometimes YSI_Model_30, sometimes “YSI Model 30” Tide State is sometimes a text description, sometimes a
numberThe order of values in the “mini-table” for a given
sampling date are different “Meter Type” comes first in the 5/23 table and second in
the 10/2 table

Ugly DataAdditional problems
Confusion between numbers and text For most software 39% or <30 are considered TEXT not
numbers (what is the average of 349 and <30?)Different types of data are stored in the same
columns Many software products require that a single column
contain either TEXT or NUMBERS (but not both!)The spreadsheet loses interpretability if it is sorted
Dates are related to a set of attributes only by their position in the file. Once sorted that relationship is lost.
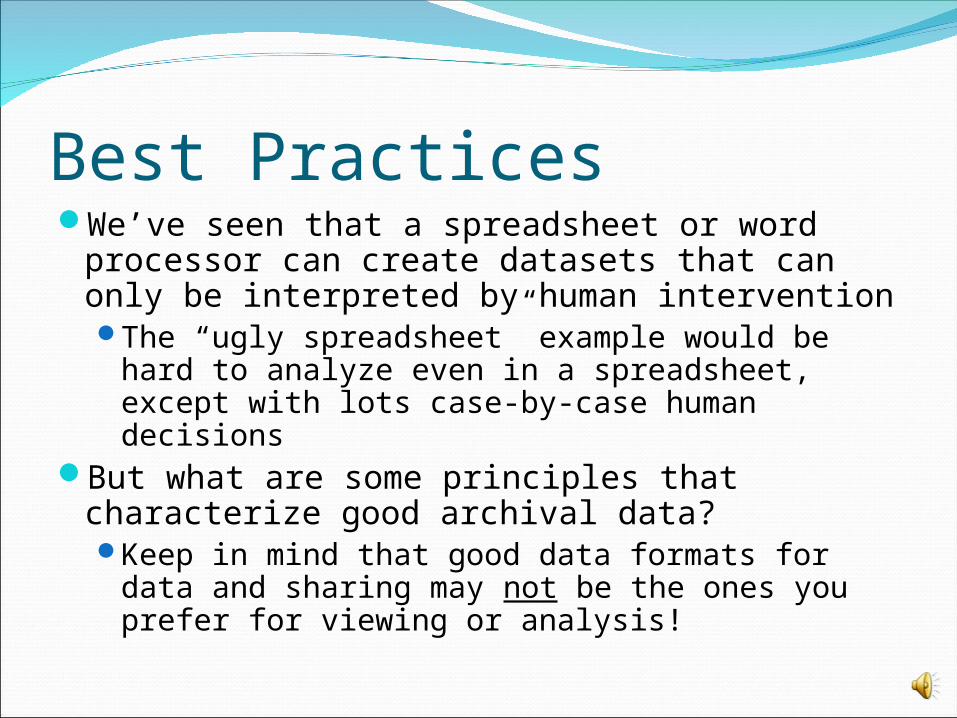
Best PracticesWe’ve seen that a spreadsheet or word
processor can create datasets that can only be interpreted by human interventionThe “ugly spreadsheet” example would be hard
to analyze even in a spreadsheet, except with lots case-by-case human decisions
But what are some principles that characterize good archival data?Keep in mind that good data formats for data
and sharing may not be the ones you prefer for viewing or analysis!

Best Practices for Archiving Many of these are taken from Cook et. al. 2001 Best Practices for
Preparing Ecological Data Sets to Share and Archive, Ecological Bulletin 2001.
Data formats should be consistent over timeAdding new data should not add new columns to a
data table, only new rowsColumns of data should be consistent. Each
column should include only a single kind of dataData columns should include the same type of data
Text or “string” data Integer numbers Floating point or real numbers

Best Practices for ArchivingLines or rows of data should be complete
Designed to be machine readable, not human readable
Don’t Ever Sort this!!!!!! Complete lines are OK to Sort

Best Practices for ArchivingData are easiest to archive if each column in a
data table has a single line at the top labeling the columns with a descriptive nameColumn names should start with a letter and not include
SPACES or Symbols (other than an underscore (e.g., My_Data) to take the place of a space) +,-,*,&,^ are often treated as operators, and so should
not be used in column names, because doing so causes confusion
Some software uses spaces to identify different columnsBAD GOOD Comment
Species Name Species_name No spaces!
Age-Class Age_Class or AgeClass
No symbols!
30cm deep temperature
Temp_30_cm_deep Start with a Letter and put what is being measured first

Best Practices for ArchivingAvoid storing data for separate sites or dates in
separate worksheets within a single spreadsheetEach worksheet is a separate data table, and so
needs to be documented and processed separately, greatly increasing the work needed
Usually you can just add a column for “site” and combine all the data into a single (large) data table OK because computers are good and dealing with large,
consistent blocks of data They don’t work as well with esoteric, segmented data

Special IssuesWhat should be done about Missing Data?
Often missing data values can be left blank, or a special value (e.g., 9999) inserted
Sometimes there are other special issues: Example, in meteorological data, days that had some
precipitation, but not enough to measure, were marked with a “T” for “trace” in data sheets Problem – mixes numbers (rain amounts) with a text string
What is the average of 10, 5 , T and 3? Solution(s)
Substitute a small amount (e.g., ½ of measureable value) so T becomes 0.005 if you can measure 0.01 cm of rain
Leave the rain column blank or 0, but add an additional column that contains “T” for trace, “N” for none, or “M” for measured This is an example of using a “Data Flag” – a column
that helps describe or qualify the data in another column
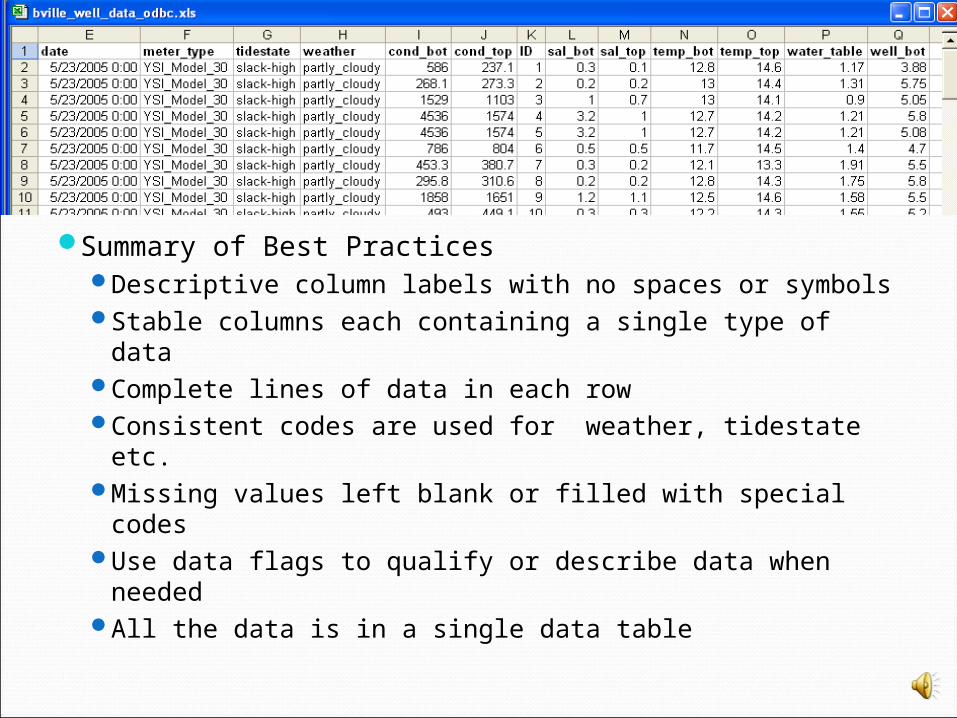
Summary of Best PracticesDescriptive column labels with no spaces or symbolsStable columns each containing a single type of dataComplete lines of data in each rowConsistent codes are used for weather, tidestate etc. Missing values left blank or filled with special codesUse data flags to qualify or describe data when
neededAll the data is in a single data table

Transforming DataBecause often the best way to enter or view the
data are not the best for archiving, we need to do transformations
Example – You have a set of permanent plots where you are tallying the ground cover of plants You have set up a spreadsheet with a row for each
date/plot with columns for cover of each of the species
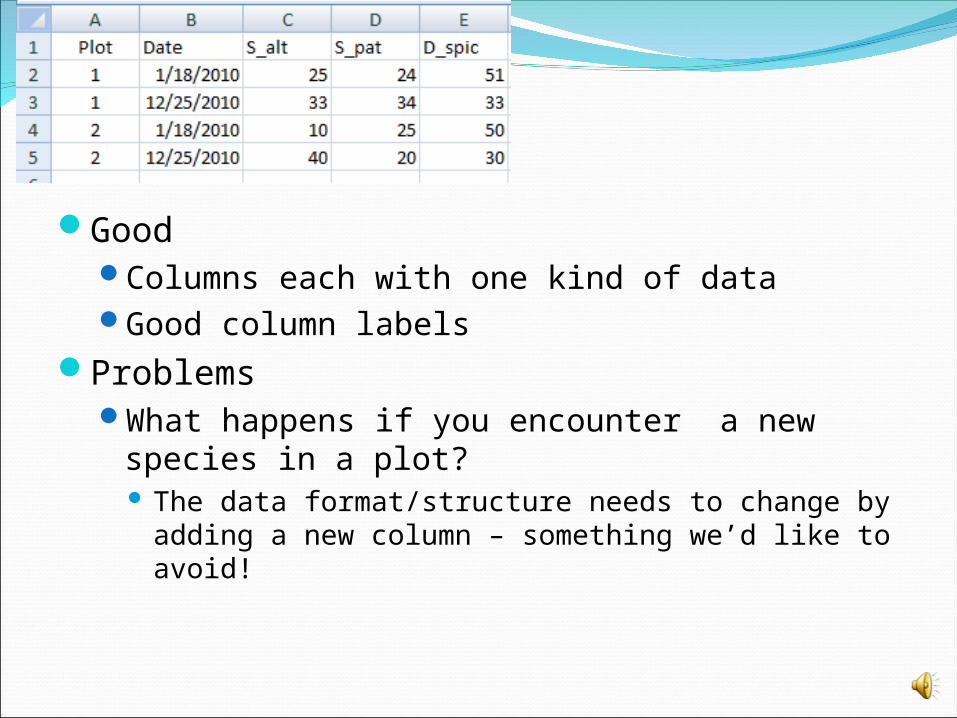
GoodColumns each with one kind of dataGood column labels
ProblemsWhat happens if you encounter a new species
in a plot? The data format/structure needs to change by
adding a new column – something we’d like to avoid!
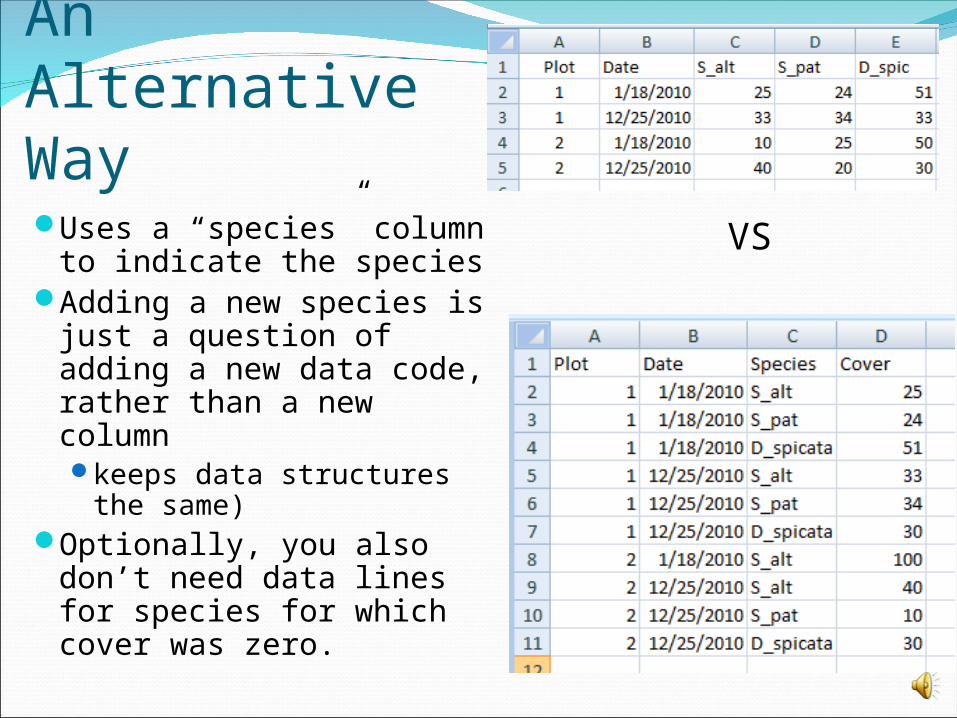
An Alternative WayUses a “species” column
to indicate the species Adding a new species is
just a question of adding a new data code, rather than a new column keeps data structures
the same)Optionally, you also
don’t need data lines for species for which cover was zero.
VS
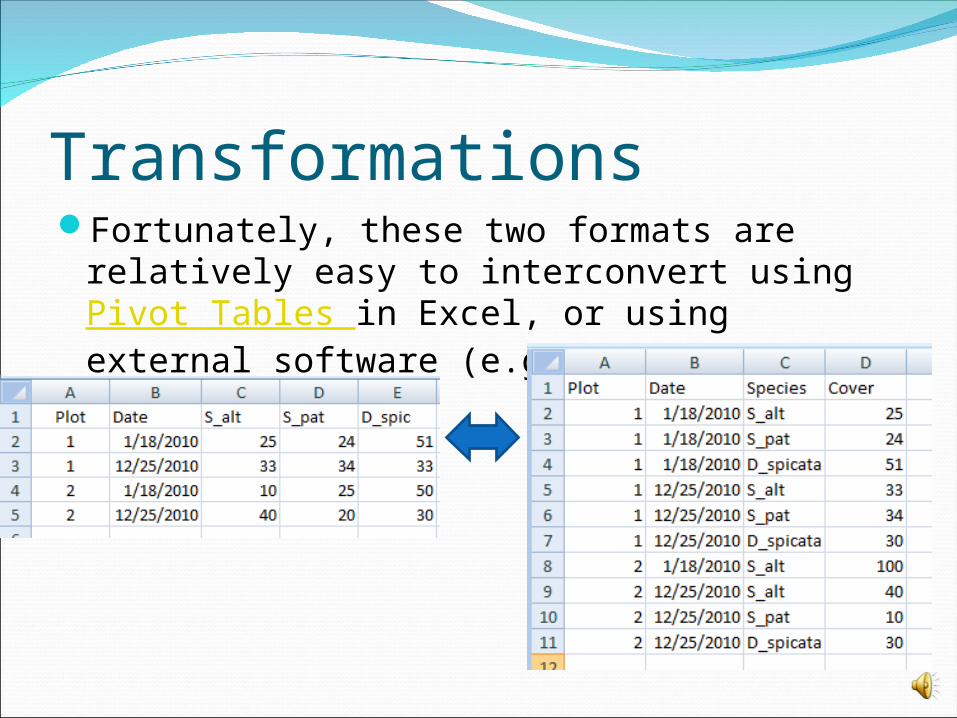
TransformationsFortunately, these two formats are relatively
easy to interconvert using Pivot Tables in Excel, or using external software (e.g., SPSS vars-to-cases)

Other ToolsThere are other tools, such as Database
Management Systems (DBMS) and statistical software (e.g., SAS, SPSS) that can also be used for managing dataUnlike spreadsheets the software enforces
many of the best practices that are the responsibility of the user in spreadsheets
They have additional tools that help with quality control and quality assurance
They are more trouble to set up initially than a spreadsheet, but in the long run can save time and trouble

Getting HelpFeel free to contact me to discuss your data
and how it might best be formatted for archiving
Once the data is ready to be archived the next step is to prepare Metadata – but that is another topic!