john m. bertoni, m.d., ph.d. creighton university multiple sclerosis
TRANSCRIPT

John M. Bertoni, M.D., Ph.D.
Creighton University
Multiple Sclerosis Multiple Sclerosis

Diagnosis of MS
MS is a clinical diagnosis
Supported by
–Imaging
–Spinal fluid analysis

Multiple Sclerosis – A to Z1. MS Pathology
• Inflammation• Neurodegeneration
2. Immunomodulatory Therapies (IMTs)• Glatiramer Acetate (Copaxone®)• Beta Interferons (Avonex®, Betaseron®, Rebif®)• Natalizumab (Tysabri®) – NOT CURRENTLY AVAILABLE
3. Magnetic Resonance Imaging (MRI)• Conventional MRI (T1, T2)• Non-conventional MRI (MRS, MTI, Brain Atrophy)
4. Clinical Data• Pivotal Trials• Open-Label Comparative Trial
5. Safety & Tolerability of the IMTs


Adapted with permission from Elsevier (The Lancet. 2002;359:1221-1231).
Repairing-Remitting Secondary Progression
Clinical Disability
Clinical Threshold
Brain Volume
Inflammation
Axonal Loss
Frequent inflammation,demyelination, axonaltransection, plasticity,and remyelination
Continuing inflammation,persistent demyelination
Infrequent inflammation,chronic axonal degeneration, gliosis
Inflammation and Axonal Loss in MS
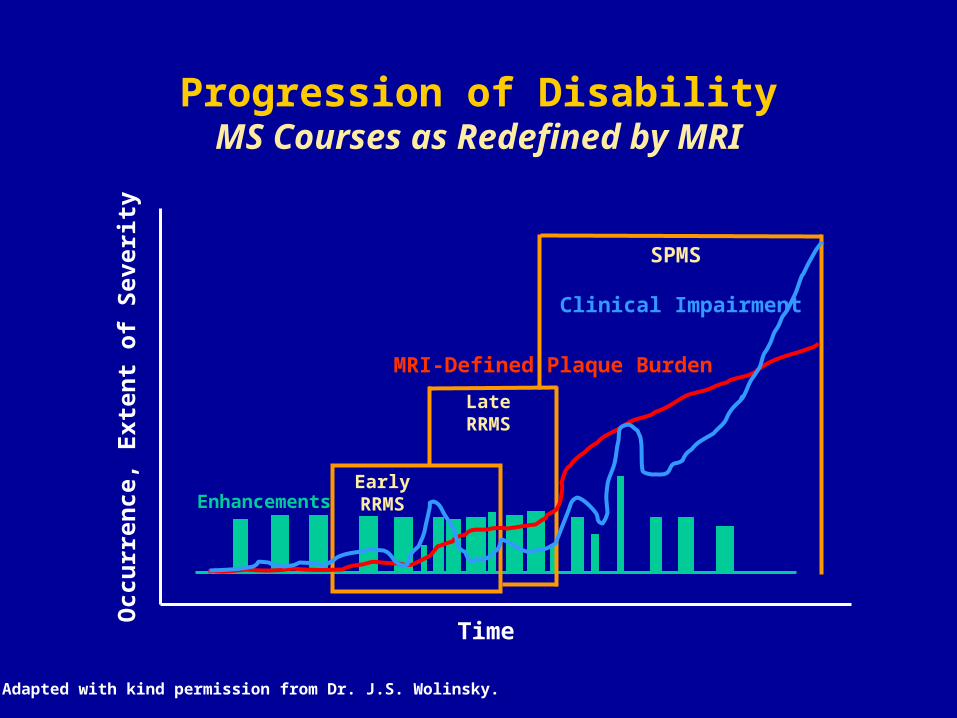
Progression of DisabilityMS Courses as Redefined by MRI
EnhancementsEarlyRRMS
LateRRMS
SPMS
Time
Occ
urr
ence
, E
xten
t o
f S
ever
ity
MRI-Defined Plaque Burden
Clinical Impairment
Adapted with kind permission from Dr. J.S. Wolinsky.

MS Is More Than a Demyelinating Disease
Adapted with permission from Waxman SG. N Engl J Med. 1998;338:323-325. Copyright © 2003 Massachusetts Medical Society. All rights reserved.
NormalMyelinated
Axon
AcutelyDemyelinated
Axon
ChronicallyDemyelinated
Axon
DegeneratedAxon
Conduction restored byIncrease in density of
sodium channels
Postsynapticneuron
Sodiumchannels
Action potential
End oftransected
axon
Myelinsheath
Postsynapticneuron
Action potential
DemyelinationAxon
A
B
C
D

Axonal Transection in MS Lesions
Reprinted with permission from Trapp BD et al. N Engl J Med. 1998;338:278-285.Copyright © 2003 Massachusetts Medical Society. All rights reserved.
64m 45m

MS Pathogenesis
CNS
Autoreactive T Cells
T
Periphery
Demyelination and Axon Loss
BBB
Transmigration
T
Danger Signal or Trigger
Activation, Differentiation,Clonal Expansion T
T
T
T
Local ReactivationT
T
APC
APC
Adhesion/Attraction
T
Release of Cytokines;Recruitment of M
Antibodies
B
MNO
IFN-
TNF-
TNF-
Adapted with kind permission from Prof. R. Hohlfeld.

Adapted with kind permission from Dr. W. Brück.
MS: A Disease of Severe Myelin, Axonal, and Neuronal Losses
Normal White Matter Plaque
Myelin
Axons
Astrocytes
NeuronsLymphocytes
Macrophages
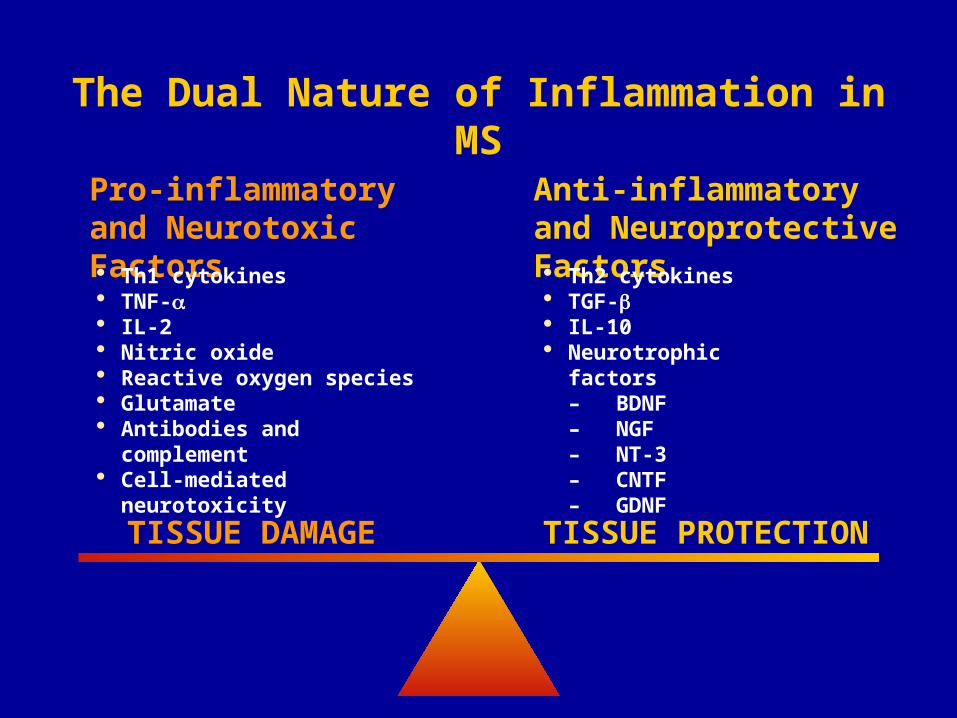
TISSUE DAMAGE TISSUE PROTECTION
Pro-inflammatory and Neurotoxic Factors Th1 cytokines TNF- IL-2 Nitric oxide Reactive oxygen species Glutamate Antibodies and complement Cell-mediated neurotoxicity
Anti-inflammatory and Neuroprotective Factors Th2 cytokines TGF- IL-10 Neurotrophic factors
– BDNF– NGF– NT-3– CNTF– GDNF
The Dual Nature of Inflammation in MS

Detrimental Inflammation in MS
Evidence from animal models implicates activated T cells in initiating MS pathology
Subsequent injury to CNS is mediated by T cells, B cells, and macrophages/microglia
Inflammatory components destroy myelin and oligodendrocytes
Inflammation is associated with axonal damage
Neuhaus O et al. Trends Pharmcol Sci. 2003;24:131-138.

Inflammatory Cells May Downregulate Detrimental Inflammation
Inflammatory cells produce growth factors
Inflammatory cells remove myelin-associated inhibitory molecules
Inflammatory cells may adapt a protective suppressor phenotype
Martino G et al. Lancet Neurology. 2002;1:499-509.

Multiple Sclerosis – A to Z1. MS Pathology
• Inflammation• Neurodegeneration
2. Immunomodulatory Therapies (IMTs)• Glatiramer Acetate (Copaxone®)• Beta Interferons (Avonex®, Betaseron®, Rebif®)• Natalizumab (Tysabri®) – NOT CURRENTLY AVAILABLE
3. Magnetic Resonance Imaging (MRI)• Conventional MRI (T1, T2)• Non-conventional MRI (MRS, MTI, Brain Atrophy)
4. Clinical Data• Pivotal Trials• Open-Label Comparative Trial
5. Safety & Tolerability of the IMTs

Type Polypeptide mixture
Recombinant protein
Recombinant protein
Recombinant protein
Recombinant monoclonal
antibody
FDA Indication
Reduction of the
frequency of relapse
Reduce the frequency
of clinical exacerbation
Decrease the frequency
of clinical exacerbation
Slow accumulation
of disability
Decrease the frequency
of clinical exacerbation
Slow accumulation
of disability
Reduce the frequency
of clinical exacerbation
Dosage and Administration
SC
Daily
20 mg
SC
Q O D
250 µg (8 MIU)
SC
3 X Wk
22 µg
44 µg
IM
Weekly
30 µg
IV infusion
Q 4 Weeks
300 mg
IFN -1a(Avonex®)
IFN -1a(Rebif®)
IFN -1b(Betaseron®)
Glatiramer Acetate
(Copaxone®)
Natalizumab(Tysabri®)
Immunomodulatory Therapies
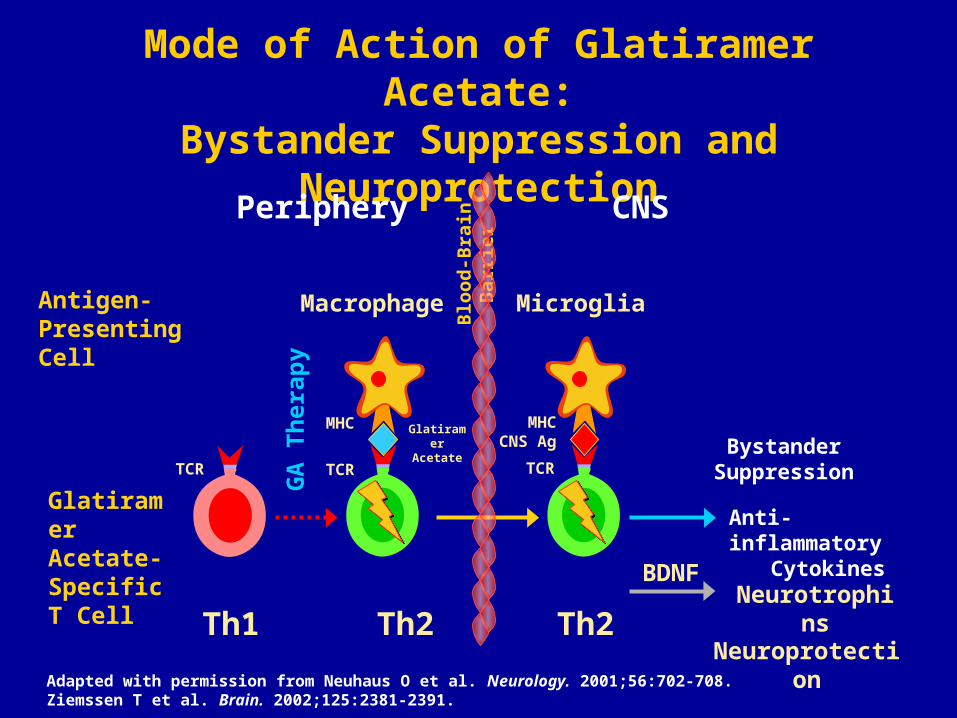
Mode of Action of Glatiramer Acetate:Bystander Suppression and Neuroprotection
Adapted with permission from Neuhaus O et al. Neurology. 2001;56:702-708. Ziemssen T et al. Brain. 2002;125:2381-2391.
Th1 Th2 Th2
Macrophage MicrogliaAntigen-PresentingCell
GlatiramerAcetate-SpecificT Cell
GA
Th
erap
y
Blo
od
-Bra
in B
arri
er
Anti-inflammatoryCytokines
Neuroprotection
Glatiramer Acetate Bystander
Suppression
Periphery CNS
TCR TCR
MHCCNS Ag
MHC
BDNFNeurotrophins
TCR

Progression to Disability—EDSS Steps
8.0 - 8.5 = Confined to bed or chair
7.0 - 7.5 = Confined to wheelchair
6.0 - 6.5 = Walking assistance is needed
5.0 - 5.5 = Increasing limitation in ability to walk
4.0 - 4.5 = Disability is moderate
3.0 - 3.5 = Disability is mild to moderate
2.0 - 2.5 = Disability is minimal
1.0 - 1.5 = No disability
0 = Normal neurologic exam
10.0 = Death due to MS
9.0 - 9.5 = Completely dependent
Walking ability
Confined to a
wheelchair or bed
Walks with aid(< 5 yards)
Walks with assistance
(22 - 110 yards or more)
Walks unaided (110 - 220
yards or more)
Walks unaided (330 - 550
yards or more)
Fully ambulatory

Long-term Disability: Time from Onset of MS to EDSS 4
Confavreux C et al. Brain 2003;126:770–82
1 = 0–19 years old1 = 0–19 years old
2 = 20–29 years old2 = 20–29 years old
3 = 30–39 years old3 = 30–39 years old
4 = 40–49 years old4 = 40–49 years old
5 = 5 = 40 years old40 years old


Imaging in Multiple Sclerosis
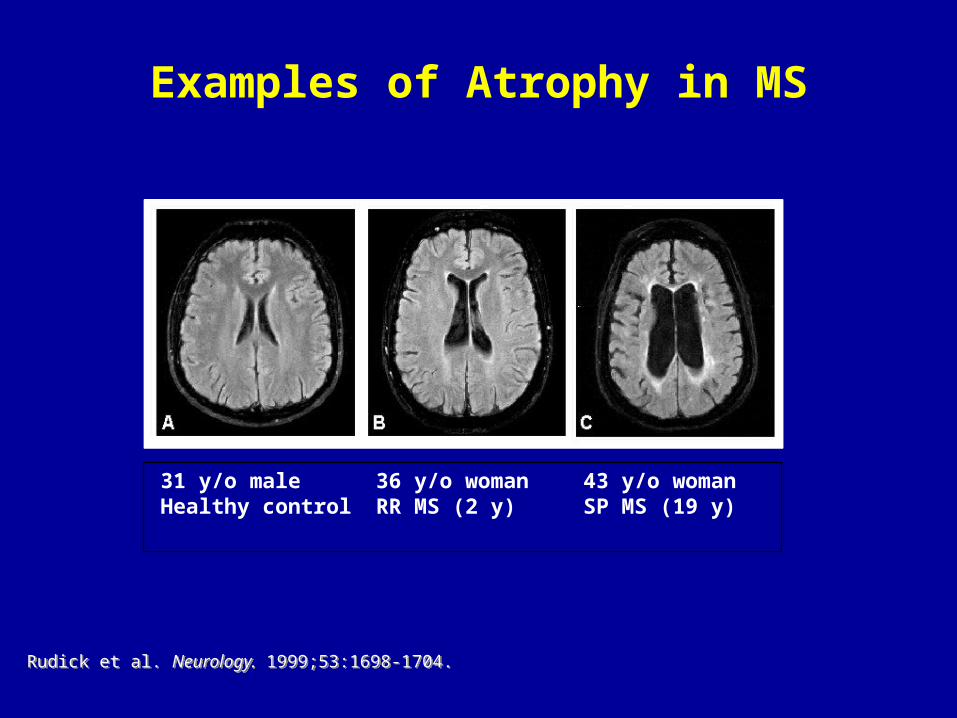
Examples of Atrophy in MS
36 y/o womanRR MS (2 y)
43 y/o womanSP MS (19 y)
31 y/o maleHealthy control
Rudick et al. Neurology. 1999;53:1698-1704.Rudick et al. Neurology. 1999;53:1698-1704.

Diagnosis and Monitoring MS
Subjective:
– detects minor sensory, visual, vestibuloauditory lesions
Clinical exam:
– Motor and sensory tracts, brainstem tegmentum
– Sensitive to multifocal, microscopic disease
Electrophysiology:
– Characterizes, localizes, detects silent disease in sensory tracts, sensitive to microscopic disease
CSF Exam:
– Detects chronic immune system activity in meninges
Neuropsychometric testing:
– Cognition and mood

MRI detects ‘silent activity’
There are approximately 7-10+ brain lesions for every clinical event
The symptomatic lesion is seen only 20% of time
Spinal cord MRI is insensitive for lesions
– Unless special techniques used and carefully inspected by reader

Typical callosal lesions

Brainstem lesion – Facial MyokymiaBrainstem lesion – Facial Myokymia
Proton density T2 FLAIR (adjusted) T1 post GAD
21 year old, mother with MS, presents with facial myokymia
Positive oligoclonal bands and elevated IgG index
Negative otherwise MRI
Lesion is subtle and requires anatomical knowledge to appreciate
Typical subpial position, equivocal enhancement

Optic nerve lesion – asymptomatic prior optic Optic nerve lesion – asymptomatic prior optic neuritisneuritis
Proton density T2 FLAIR
Optic neuritis 8 years before, complete recovery
Proton density usually sees better than T2

MRI spinal cord – Acute lesions, low contrast
T2 PD STIR T1 post GAD
These are very edematous (mass, STIR)
PD is more extensive than T2 (also old gliosis)
Minimal contrast extravasation

Heterogeneous Pathology of T2 hyperintense lesions Evolution of MS Lesions
Adopted from Paty and Ebers
BBB DisruptionBBB Disruption
InflammationInflammation
Increased InflammationIncreased Inflammation
DemyelinationDemyelination
Reactivated LesionsReactivated Lesions
GliosisGliosis
AxonalAxonal Loss Loss
Axo
nal
Lo
ssA
xon
al L
oss
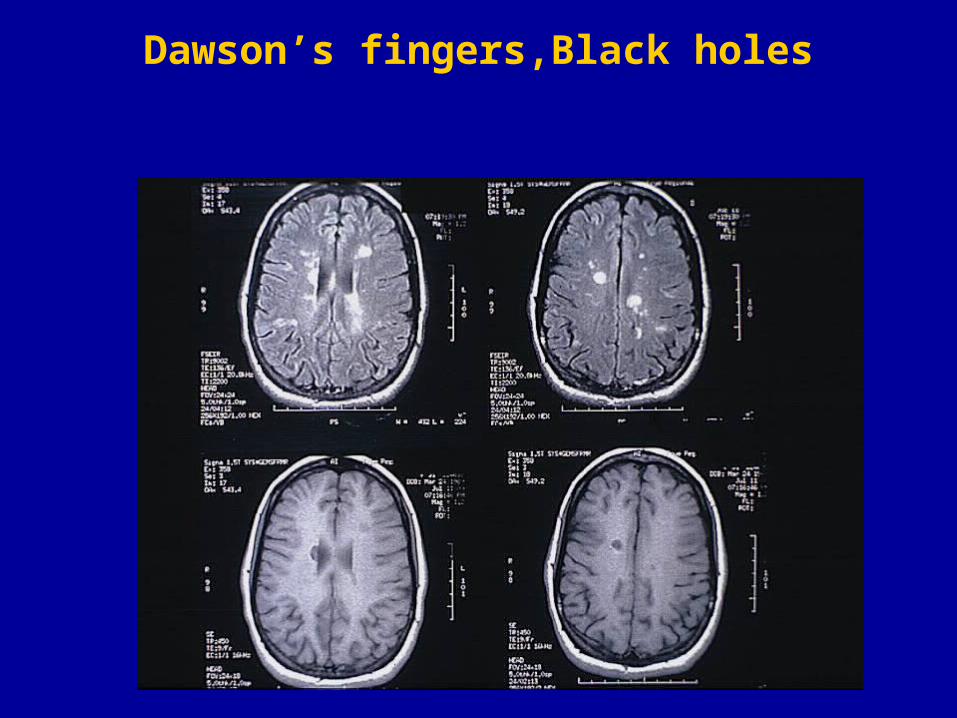
Dawson’s fingers,Black holes

Seeing the brain as never before
INSULAR FIBRES
TEMPORAL FIBRES
BROCA‘S AREAWERNICKE’S
AREA
LONG FIBRES
SHORT FIBRES
SHORT FIBRES
LONG FIBRES
Superior Longitudinal Fasciculus
Diffusion TractographyImages Courtesy of:
Dr. Derek Jones, Institute of Psychiatry, London UK

THE END