john h. armstrong, md, facs december 1, 2016 … h. armstrong, md, facs ... florida department of...
TRANSCRIPT

RICK SCOTT
Governor
JOHN H. ARMSTRONG, MD, F ACS
Surgeon General & Secretary Florida Department of Health
REBECC A POSTON, BPharm, MHL
Program Manager
December 1, 2016
Rick Scott Governor Celeste Philip, MD, MPH Surgeon General and Secretary Rebecca Poston, BPharm, MHL Program Manager E-FORCSE® 4052 Bald Cypress Way, Bin C-16 Tallahassee, FL 32399 (850) 245-4444 x 3700

1
Table of Contents
List of Figures ............................................................................................................................... 2 List of Tables ................................................................................................................................. 2 Acknowledgements ....................................................................................................................... 3 Message from the Surgeon General and Secretary ..................................................................... 4 Executive Summary ...................................................................................................................... 5 Introduction ................................................................................................................................... 6
Current Situation ....................................................................................................................... 6
Legal Framework .......................................................................................................................... 7 Summary of Statute ................................................................................................................... 7
Florida PDMP Funding .................................................................................................................. 8 Grant Funded Projects .................................................................................................................. 8
Harold Rogers Data Driven Multi-Disciplinary Approach to Reducing Prescription Drug Abuse Grant 2013-PM-BX-0010 - $399,950 ........................................................................................ 8
Harold Rogers PDMP Enhancement Grant 2015-PM-BX-0009- $499,991 ............................... 8
Department of Children and Families Partnerships for Success (PFS) Grant - $86,625 .......... 8
University of Florida Harold Rogers Prescription Drug Monitoring Program: Data-Driven Responses to Prescription Drug Abuse Grant 2016-PM-BX-K005 – $17,500 .......................... 8
Performance Measures ................................................................................................................. 9 Technical Notes ......................................................................................................................... 9
Outcomes .................................................................................................................................. 9
1. OUTCOME: Reduction of the rate of inappropriate use of prescription drugs through Department education and safety efforts. ...................................................................... 9
2. OUTCOME: Reduction of the quantity of pharmaceutical controlled substances obtained by individuals. ................................................................................................ 12
3. OUTCOME: Increased coordination among partners participating in the PDMP. ........ 18
4. OUTCOME: Involvement of stakeholders in achieving improved patient health care, safety, and reduction of prescription drug abuse and prescription drug diversion. ...... 21
Conclusion .................................................................................................................................. 27 References .................................................................................................................................. 28

2
List of Figures Figure 1. Prescribers with controlled substance prescriptive authority who issued one or more controlled substance prescriptions and were registered with E-FORCSE in Florida, by year. ... 12 Figure 2. Percentage of Schedule II-IV controlled substances prescribed per day by prescriber decile rank, CY2015. ................................................................................................................... 15 Figure 3. Prescription rates by drug class, sex and age group (females shown in black), Florida residents, CY2015. ..................................................................................................................... 16 Figure 4. Prescriptions per 1,000 county residents for all controlled substance prescriptions in schedules II - IV, opioids, stimulants, and benzodiazepines, current reporting period. .............. 17 Figure 5. The mean daily dosage per patient in morphine milligram equivalents (MMEs) and the percentage of patients on opioids receiving a dosage >100 MMEs. ........................................... 20 Figure 6. Number of Florida patients receiving concurrent prescriptions of an opioid, alprazolam and carisoprodol (OAC) in a month: 2011Q4 to 2016Q2. ........................................................... 21 Figure 7. Number of individuals obtaining controlled substance prescriptions in schedules II-IV from 5 (10) or more prescribers and 5 (10) or more dispensers within a 90-day period, October 2011 to June 2016. ..................................................................................................................... 22 Figure 8. Multiple provider episode rate per 100,000 residents for schedule II and III drugs by quarter/year and age group. ....................................................................................................... 23 Figure 9. Mortality rate for select licit and illicit drugs from 2005 to 2015. .................................. 24 Figure 10. Number of fentanyl-related law enforcement submissions and overdose deaths, and rate of fentanyl prescriptions, 2012-2015 .................................................................................... 25 Figure 11. Florida substance abuse treatment admissions, TEDS, 2005-2014. ......................... 26 Figure 12. Hospital discharges for drug poisoning in Florida, by substance, Florida Agency for Health Care Administration, 2005 to 2015. ................................................................................. 26
List of Tables Table 1. History of legislation by year and bill number. ................................................................ 7 Table 2. The number of individuals trained in the use of Florida’s PDMP, by reporting period. . 10 Table 3. Percentage of health care practitioners registered to use the PDMS compared to total number of licensees by license type. .......................................................................................... 11 Table 4. Number of indirect authorized users by agency type RY2015 compared to RY2016. .. 11 Table 5. The number of unique Florida residents and average number of prescriptions per person by controlled substance schedule. .................................................................................. 13 Table 6. Number of unique patients, prescribers and pharmacies in the PDMS, RY2013 to RY2016. ...................................................................................................................................... 14 Table 7. Number of controlled substance prescriptions per patient, prescriber and per capita: Florida residents, RY2013 to RY2016. ....................................................................................... 14 Table 8. The number of prescriptions and percentage of total prescriptions of the top 10 most commonly dispensed controlled substances to Florida residents. .............................................. 16 Table 9. Health care practitioner utilization by license type. ....................................................... 18 Table 10. Investigative agency registration and utilization by agency type. ............................... 19 Table 11. Investigative agency query request by purpose. ......................................................... 19 Table 12. Proactive notification reports by type, RY2016. .......................................................... 24

3
Acknowledgements
Grant No. 2015-PM-BX-0009 awarded by the Bureau of Justice Assistance (BJA), Office of Justice Programs, U.S. Department of Justice supports the 2015-2016 Prescription Drug Monitoring Program Annual Report. Its contents are solely the responsibility of the authors and do not necessarily represent the official views of the U.S. Department of Justice.
Technical Data Contacts: Bruce A. Goldberger, PhD, Chief, Director and Professor, Department of Pathology, Immunology and Laboratory Medicine, University of Florida College of Medicine [email protected] Chris Delcher, PhD, Assistant Professor, Department of Health Outcomes and Policy, University of Florida College of Medicine [email protected] Yanning Wang, MS, Statistical Research Coordinator, Department of Health Outcomes and Policy, University of Florida College of Medicine [email protected] Peter W. Kreiner, PhD, Senior Scientist, Institute for Behavioral Health and Principal Investigator, Prescription Behavior Surveillance System [email protected] Media Contact: Brad Dalton, Deputy Press Secretary, Florida Department of Health [email protected] Program Contacts: Rebecca Poston, BPharm, MHL, Program Manager, Prescription Drug Monitoring Program, [email protected] Erika Marshall, BS, Program Outreach Director, Prescription Drug Monitoring Program, [email protected] Additional Program Staff: Fritz Hayes, BPharm, Senior Pharmacist, Prescription Drug Monitoring Program, [email protected] Mike Watters, Senior Analyst, Prescription Drug Monitoring Program, [email protected]

4
Message from the Surgeon General and Secretary
It gives me great pleasure to present Florida’s 2015-2016 Prescription Drug Monitoring Program (PDMP) Annual Report. The PDMP exemplifies the Department of Health’s (Department) mission to protect, promote and improve the health of all people in Florida through integrated state, county and community efforts. This year the PDMP has helped Florida achieve remarkable health successes. Florida’s PDMP, E-FORCSE®, has proven to be an effective tool to protect public health and safety, while supporting sound clinical prescribing, dispensing, and use of controlled substances. Information maintained in the Prescription Drug Monitoring System (PDMS) can help identify sources of prescription drug diversion such as prescription fraud, forgeries, and improper prescribing and dispensing. Evidence continues to validate Florida’s PDMP as effective in improving clinical decision-making, reducing multiple provider episodes, preventing diversion of controlled substances and assisting in other efforts to curb the prescription drug abuse epidemic. A significant increase in registration, utilization and reduction of morphine equivalent dosing by prescribers reflects the usefulness of Florida’s PDMP. Today, there are over 198 million controlled substance prescription dispensing records maintained in the PDMS. In the first five years of operation, physicians and dispensers made more than 27 million requests to view their specific patients’ controlled substance dispensing history. This year, law enforcement has requested and received more than 6,284 investigative reports from E-FORCSE staff to assist in active criminal investigations involving controlled substances. While promising progress has been made, other concerning aspects of the opioid epidemic have emerged, such as increases in fentanyl and heroin-related deaths. Strong multi-disciplinary collaboration is required to address these new challenges and to maintain our progress on reducing drug misuse and abuse in our great state.
Celeste Philip, MD, MPH Surgeon General and Secretary

5
Executive Summary As required by section 893.055(8), Florida Statutes, the 2015-2016 Prescription Drug Monitoring Program (PDMP) Annual Report highlights this year’s accomplishments in achieving the following outcomes: reduction of the rate of inappropriate use of prescription drugs through education and safety efforts; reduction of the quantity of pharmaceutical controlled substances obtained by individuals attempting to engage in fraud and deceit; increased coordination among interested parties participating in the PDMP; and involvement of stakeholders in achieving improved patient health care and safety and reduction of prescription drug diversion. Report Highlights
Pharmacy Reporting Compliance – On average, each month 6,546 dispensers report controlled substance prescription information into the system, and 96 percent of dispensers complied with the mandated seven-day statutory limit for reporting. Of those dispensers, 66 percent reported information within 24 hours.
Increase in Prescriber Enrollment and Utilization – E-FORCSE staff have provided outreach and education to 45,618 health care practitioners and 1,309 individuals authorized to conduct investigations resulting in a 20.4 percent increase in registration and 41.8 percent increase in the number of query requests. In addition to attending association meetings to increase PDMP awareness, the Florida PDMP Foundation, Inc. and PDMP collaborated with the Florida Hospital Association and Florida Nurse Practitioner Network to develop a three-hour continuing education course on safe and effective controlled substance prescribing.
Impact on Prescriber Behavior – Identifying at-risk patients is a crucial first step toward improving patient safety and increasing prescriber awareness. The average morphine milligram equivalents (MMEs) prescribed is a key indicator to identify at-risk patients. The average MMEs prescribed between October 2011 and June 2016 decreased 38.9 percent.
Impact on Patient Behavior – Through monitoring and analysis of multiple provider episodes (MPEs), an increase in health care practitioner utilization, proactive notification to prescribers and law enforcement, Florida has seen a 76.2 percent reduction in the number of individuals having MPEs.
PrescriptionDrugAbuseEpidemic:FloridaTimeline
2009
• 1 in 8 deaths attributable to prescription drug overdose • June ‐ Governor signed SB 462 into law creating the PDMP • 2,488 overdose deaths
2010
• 90 of the top 100 physicians purchasing oxycodone were located in Florida • 2,710 overdose deaths
2011
• March‐ Governor created Statewide Drug Strike Force • June‐ Governor signed HB 7095 into law impacting controlled substance distribution, prescribing, and dispensing • July‐ Statewide public health emergency declared • September‐ implementation of the PDMP • 2,539 overdose deaths
2012
• CDC classified prescription drug abuse as an epidemic • Reduction in MPE • Reduction in overdose deaths • 2,090 overdose deaths
2013
• PDMP funded by General Revenue • Reduction in MPE • Reduction in overdose deaths • 1,916 overdose deaths

6
Introduction
Current Situation Heroin has had a resurgence in our nation and Florida is no exception with 779 heroin-related deaths from in 2015.1 Four in five new heroin users began misusing prescription pain medications.2 Especially hard hit counties have been Palm Beach (165), Orange (108) Miami-Dade (92), Broward (80), and Sarasota (68); raising fears, that heroin will soon impact the entire state. Deaths caused by heroin increased 79.7 percent in 2015 when compared with 2014.3
Multiple changes in state policy have contributed to declines in the number of controlled substance prescriptions, total prescription opioid volume written, MME per prescription, and the prescription opioid death rate.4-7 For example, from 2010 to 2014, the rate of oxycodone- and alprazolam-caused deaths declined 70.6 percent (from 8.0 to 2.4 per 100,000 population) and 45.1 percent (from 5.2 to 2.9 per 100,000 population), correspondently.8 The percentage of individuals prescribed greater than or equal to 100 MME per day among those receiving prescription opioids decreased from 16.8 percent in 4Q 2011 to 9.5 percent in 2Q 2016. Overall, there has been a 38.9 percent reduction in the average MMEs prescribed between October 2011 and June 2016 from 112.2 to 68.5 MME. The number of patients who had controlled substances prescribed by greater than or equal to five prescribers and dispensed at greater than or equal to five pharmacies in a 90-day period, a key indicator of MPEs declined by 76.2 percent. According to the U.S. Centers for Disease Control and Prevention (CDC), Florida experienced a 23 percent decline in drug poisoning deaths from 2010 to 2013, ranking it first among states and one of only two states that experienced a decrease from 2010 to 2014.9
The observed progress in some prescription drug-related outcomes is a positive development in Florida, but new challenges have emerged. For example, an increase in deaths associated with fentanyl and heroin-related drug use. National concerns have arisen that rapid declines in prescription opioid availability, in the absence of reducing demand driven by opioid use disorders, have resulted in opioid substitutions and other adverse outcomes.10,11
PrescriptionDrugAbuseEpidemic:FloridaTimeline(cont.)
2014
• Reduction in MPE • Reduction in oxycodone overdose deaths • 2,062 overdose deaths
2015
• June‐ Governor signed HB751 into law creating the Emergency Treatment & Recovery Act authorizing Naloxone use • PDMP funded by General Revenue • Reduction in MPEs • 2,530 overdose deaths
2016
• March‐ CDC releases Guidelines for Prescribing Opioids for Pain • April – Governor signed SB964 into law authorizing direct access by designees and indirect access by impaired practitioner consultants • April – Governor signed SB1604 into law creating a written pamphlet regarding controlled substances including specific information • Reduction in MPEs • Reduction in MMEs • PDMP funded by General Revenue

7
Legal Framework
Summary of Statute Section 893.055, Florida Statutes, creates the PDMP within the Department of Health (Department) and requires the Department to design and establish a comprehensive electronic database system to collect controlled substance prescription dispensing information, while not infringing upon the legitimate prescribing or dispensing of controlled substances by a prescriber or dispenser acting in good faith and in the course of professional practice. Below Table 1 summarizes PDMP and related legislation passed from 2009 through 2016.
Table 1. History of legislation by year and bill number.
Year Bill
Number Summary of Changes
2009 SB462 Created section 893.055, F.S., establishing the PDMP. SB440 Created section 893.0551, F.S., exempting information contained in the PDMP from
public record requirements. 2010 SB2772 Amended sections 893.055 and 893.0551, F.S., establishing a definition for “program
manager,” and requiring the program manager to work with certain stakeholders to promulgate rules setting forth indicators of controlled substance abuse. It also authorized the program manager to provide relevant information to law enforcement under certain circumstances.
2011 HB7095 Amended section 893.055, F.S., reassigning the duties of the Governor’s Office of Drug Control to the Department; to require reports be made to the PDMP within seven days of dispensing rather than 15 days; to prohibit the use of certain funds to implement the PDMP; and to require criminal background screening for all individuals who have direct access to the PDMP.
2013 HB1159 Appropriated $500,000 of nonrecurring general revenue funds for the general administration of the PDMP for fiscal year 2013-2014.
2014 HB7177 Amended sections 893.055 and 893.0551, F.S., renewing the public record exemption and requiring law enforcement and investigative agencies to enter into a user agreement with the Department. In addition, it limits the information shared with a criminal justice agency and requires the disclosing person or entity take steps to ensure the continued confidentiality of the information, redacting any non-relevant information at a minimum. Finally, any information related to a criminal case shared with a state attorney may only be released in response to a discovery demand and any unrelated information requires a court order to be released.
2015 SB2500A Appropriated $500,000 of general revenue funds for the general administration of the PDMP for fiscal year 2015-2016.
2015 HB751 Created section 381.887, F.S., establishing the Emergency Treatment and Recovery Act, authorizing certain health care practitioners to prescribe and dispense an emergency opioid antagonist to a patient or caregiver under certain conditions; authorizes storage, possession, and administration by a patient or caregiver and certain emergency responders; provides immunity from liability; and provides immunity from professional sanction or disciplinary action.
2016 SB964 Amended sections 893.055 and 893.0551, F.S., authorizing direct access to the information in the PDMP for designees of prescribers and dispensers and authorizing indirect access for impaired practitioner consultants.
2016 SB1604 Created section 893.30, F.S., establishing the “Victoria Siegel Controlled Substance Safety Education and Awareness Act” requiring the Department to develop a written pamphlet relating to controlled substances which includes specific educational information and make available to health care practitioners, and entities to disseminate and display. The Department shall also encourage consumers to discuss the risks of controlled substance abuse with their health care providers.

8
Florida PDMP Funding With the exception of three general revenue appropriations by the legislature of $500,000 for FY 2013-14, FY2015-16 and FY2016-17, no state funds support the PDMP. Through the innovation of the Department in leveraging federal grant money and funds raised by the Florida PDMP Foundation, Inc., the PDMP has sustainable funding through FY2019-2020. To date the Foundation has provided $1,010,513 to fund E-FORCSE and its fundraising efforts are ongoing. In addition, the Department received federal funding through six grants totaling $2,443,471. Since its inception in 2010, the PDMP has spent $3,615,939 for PDMS infrastructure and enhancements, personnel, and facility expenses. The Department remains committed to exploring innovative options for identifying projects and securing funds for the PDMP, and stands ready to work alongside our stakeholders and partners to ensure the future of the program.
Grant Funded Projects The PDMP has relied on grant funding to offset system enhancement costs to the PDMS. The Department has received federal funding through six grants to implement and enhance the PDMP. Each grant funds specific projects outlined in the grant application and below is a summary of current projects.
Harold Rogers Data Driven Multi-Disciplinary Approach to Reducing Prescription Drug Abuse Grant 2013-PM-BX-0010 - $399,950 Grant funds for this award are being used to establish and strengthen a long-term collaboration between the PDMP, law enforcement, public health and research community in Florida; collect and analyze data by centralizing existing data sources and completing practitioner surveys and a focus group; develop valid data-driven analytic strategies; enhance annual reporting with population-level prescribing trends; and establish a data analysis server. The project period ends March 31, 2017.
Harold Rogers PDMP Enhancement Grant 2015-PM-BX-0009- $499,991 Grant funds for this award are being used to enhance existing proactive reporting efforts to practitioners and law enforcement and analysis of the impact on prescriber behavior and law enforcement efforts; develop algorithms to further automate proactive notifications; and advocate for legitimate and appropriate use of controlled substances while not interfering with physician prescribing practices. The project period ends September 30, 2017.
Department of Children and Families Partnerships for Success (PFS) Grant - $86,625 Grant funds for this award are being used to ensure the PDMS includes additional alert features and computer based training, to encourage safer prescribing of controlled substances and reduce drug abuse and diversion within the state of Florida. The project period ends September 30, 2017.
University of Florida Harold Rogers Prescription Drug Monitoring Program: Data-Driven Responses to Prescription Drug Abuse Grant 2016-PM-BX-K005 – $17,500 Grant funds for this award will be used to link de-identified PDMP data with other key data sources to improve care coordination. The project period ends September 30, 2019.

9
Performance Measures This report contains information on the operation of the program including basic program and system metrics, status on key operational objectives, and findings from various program evaluation activities. The overall goal of this report is to provide information to guide the operation of the PDMP program, assess PDMP utilization, answer questions about the impact of PDMP information on clinical practice and patient outcomes, and evaluate the impact of the PDMS on community health.
Technical Notes The current report covers the period July 1, 2015 (Q3-Q4 2015) to June 30, 2016 (Q1-Q2 2016). This period is referred to as the current report year (RY). Direct year-to-year comparisons in the report are based on report years. The RY was changed from October 1 to September 30 for this report and prior year data were re-run for the prior report period to provide an accurate comparison. Trend analyses are based on calendar year (CY). In this report, controlled substance means any substance named or described in schedules II through IV of section 893.03, Florida Statutes.
Drug categories for maps and figures includes:
Opioids: Buprenorphine, Butorphanol, Codeine, Dezocine, Dihydrocodeine, Fentanyl, Fentanyl Long Acting (LA), Fentanyl Short Acting (SA), Hydrocodone LA, Hydrocodone SA, Hydromorphone, Meperidine, Methadone, Morphine LA, Morphine SA, Nalbuphine, Opiate Agonists, Oxycodone LA, Oxycodone SA, Oxymorphone LA, Oxymorphone SA, Pentazocine, Tapentadol, Tramadol, Tramadol LA and Tramadol SA and Other Opioids.
Stimulants: Amphetamine, Benzphetamine, Desoxyephedrine, Dexmethylphenidate, Dextroamphetamine, Lisdexamfetamine, Methylphenidate and Other Stimulants.
Benzodiazepines: Alprazolam, Chlordiazepoxide, Clonazepam, Clorazepate, Diazepam, Estazolam, Flurazepam, Lorazepam, Oxazepam, Temazepam, Triazolam and Other Benzodiazepines.
Outcomes To assist in fulfilling program responsibilities, the Department has identified and is reporting outcomes related to its efforts to reduce the rate of inappropriate use of prescription drugs through education and safety efforts; reduce the quantities of pharmaceutical controlled substances obtained by individuals attempting to engage in fraud and deceit; and to increase coordination among partners and stakeholders to achieve improved patient health care and safety and reduce prescription drug abuse and drug diversion.
1. OUTCOME: Reduction of the rate of inappropriate use of prescription drugs through Department education and safety efforts.
A. PERFORMANCE MEASURE: The number of licensed prescribers, dispensers, and authorized law enforcement officers trained in the use of the state’s PDMS.
E-FORCSE staff have provided outreach and education to 45,618 health care practitioners and 1,309 individuals authorized to conduct investigations (Table 2). Because of this education and outreach, registration for health care practitioners increased 20.4 percent (Table 3).

10
Health Care Practitioner Training and Outreach
E-FORCSE staff collaborated with the Florida PDMP Foundation, Inc., the Florida Hospital Association, and the Florida Nurse Practitioner Network to develop a three-hour continuing education course regarding controlled substance prescribing. The course is currently available and is marketed to Florida advanced registered nurse practitioners. Course material includes an overview on safe and effective prescribing of controlled substances.
Outreach and educational efforts to health care practitioners has also included formal and informal training (e.g., attendance at a continuing education conference or exhibition at a statewide association meeting) on the registration and query request processes. In an effort to promote utilization, the PDMP has provided numerous journal articles to associations for publication, as well as performance measures in its Quarterly Dashboard published online.12
Law Enforcement Training
Authorized users from law enforcement agencies received formal and informal training on the proper use of the confidential and exempt controlled substance prescription information requested and received from E-FORCSE staff. Training was provided to 1,309 individuals authorized to conduct investigations.
Table 2. The number of individuals trained in the use of Florida’s PDMP, RY2015 to RY2016.
Individuals Trained to Use E-FORCSE
RY2015 (No.)
RY2016 (No.)
Change (%)
Licensed prescribers in the state13 119,550 124,933 4.50
Licensed prescribers formally and informally trained in the use of E-FORCSE
26,993 34,290 27.03
Licensed pharmacists in the state14 28,749 30,093 4.67
Licensed pharmacists formally and informally trained to use E-FORCSE
20,331 11,328 -44.28
Certified Law Enforcement Officers15 49,959 50,010 0.10
Individuals authorized to conduct investigations formally and informally trained16 to request & receive information
4,629 1,309 -71.72
Individuals visited website www.e-forcse.com
116,845 254,093 117.46
B. PERFORMANCE MEASURE: The number of authorized users registered to use the PDMS.
The number of health care practitioners registered to have direct access to the controlled substance dispensing information maintained in the PDMS has increased 20.4 percent, from 30,500 to 36,718. Amid all health care practitioners, pharmacists have the highest registration rate, 54.5 percent. Among all prescribers, osteopathic physicians have the highest registration rate, 34.5 percent followed by physician assistants at 22.4 percent (Table 3). Overall, 23.7 percent of all licensed health care practitioners, as defined in section 893.055(1)(d), Florida Statutes, have registered to use the PDMS.

11
In February 2016, there was a remarkable increase in the number of registrations for allopathic physicians (1,102) and osteopathic physicians (107), compared to the average per month for the rest of RY2016 (157 and 40), respectively. This increase in registration coincided with the deadline for health care practitioners to demonstrate meeting the “meaningful use” of electronic health records technology objective from the U.S. Department Health and Human Services, Centers for Medicare & Medicaid Services. Meaningful use provides incentive payments to eligible professionals (EP) and eligible hospitals (EH) that are able to demonstrate the “meaningful use” of electronic health records technology. EPs and EHs must demonstrate meaningful use through a number of objectives. Of those objectives a small portion is related to reporting data to public health agencies. The PDMP meets the definition of a specialized registry and EPs can meet the “Meaningful Use Stage 2 Specialized Registry” objective by complying with one of the following: 1) EPs may submit patient specific controlled substance dispensing information electronically to the PDMS; or 2) EPs may electronically retrieve patient specific controlled substance dispensing information from the PDMS.17
Table 3. Percentage of health care practitioners registered to use the PDMS compared to total number of licensees by license type.
License Type
Total Licensees (No.)18
Registered Users
(RY2015)
Registered Users
(RY2016)
Change (%) (RY15-16)
% Registered (RY2016)
ARNP 20,944 1,708 2,266 32.67 10.82
DN 13,130 756 900 19.05 6.85
ME 70,558 9,768 12,599 28.98 17.86
OPC 3,167 8 11 37.50 0.35
OS 7,687 2,111 2,654 25.72 34.53
PA 7,613 1,337 1,703 27.37 22.37
PO 1,834 133 185 39.10 10.09
PS 30,093 14,679 16,400 11.72 54.50
TOTAL 155,026 30,500 36,718 20.39 23.69
Key: ARNP- Advanced Registered Nurse Practitioner; DN- Dentist; ME- Medical Doctor (Allopathic physician); OPC- Certified Optometrist; OS- Osteopathic Physician; PA- Physician Assistant; PO- Podiatric Physician; PS- Pharmacist
Certain law enforcement and investigative agencies do not have direct access to controlled substance dispensing information maintained in the PDMS, however may request and receive controlled substance prescription information from the program manager during the course of an active investigation. In February 2016, in order to strengthen accountability measures for the safekeeping of confidential prescription information after statutorily authorized release from the database, E-FORCSE made changes to Florida Administrative Code rules 64K-1.003 and 64K-1.005. These changes resulted in a 28.5 percent decrease in the number of indirect authorized users, from 347 in RY2015 to 248 in RY2016 (Table 4).
Table 4. Number of indirect authorized users by agency type RY2015 compared to RY2016.
Agency Authorized Users (No.)
RY2015
Authorized Users (No.)
RY2016
Change(%)
Law Enforcement 337 239 -29.1 Attorney General’s Medicaid Fraud Control Unit 8 8 0.0 Department of Health Regulatory Board 2 1 -50.0
Total 347 248 -28.5

12
C. PERFORMANCE MEASURE: The number of prescribers who issued one or more controlled substances and number of prescribers registered with E-FORCSE.
As of June 2016, 16,349 prescribers with controlled substance prescriptive authority were registered with E-FORCSE while 64,074 prescribers with controlled substance prescriptive authority issued one or more controlled substances in the current report year. The percentage increased from 14.8 percent in 2013 report year to 25.5 percent in 2016 report year. Figure 1 illustrates the percentage of Florida prescribers with controlled substance prescriptive authority registered with E-FORCSE who issued one or more controlled substance prescriptions per year.
Figure 1. Prescribers with controlled substance prescriptive authority who issued one or more
controlled substance prescriptions and were registered with E-FORCSE in Florida, by year.
D. PERFORMANCE MEASURE: The number of dispensers reporting to the PDMS within seven days of dispensing a controlled substance.
Dispensers who dispense controlled substances listed in schedules II-IV, as defined in section 893.03, Florida Statutes, are required to report to E-FORCSE within seven days each time a controlled substance is dispensed to an individual, unless it is one of the acts of dispensing or administering that are exempt from reporting under subsection 893.055(5), Florida Statutes.
There has been a 2.0 percent increase, from 6,417 to 6,546 in the number of dispensers reporting controlled substance dispensing information to E-FORCSE since the last reporting period. Although dispensers are required to report controlled substance dispensing information to the PDMS within seven days of dispensing, 66.0 percent of dispensers are reporting within 24 hours.
2. OUTCOME: Reduction of the quantity of pharmaceutical controlled substances obtained by individuals.
A. PERFORMANCE MEASURE: The number of controlled substance prescriptions dispensed to patients in various schedules.
Table 5 illustrates a 23.3 percent increase in unique individuals receiving schedule II controlled substances from 2,232,725 to 2,752,942 which corresponds with a 42.8 percent decrease in
14.8%
17.8%20.2%
25.5%
0.0%
5.0%
10.0%
15.0%
20.0%
25.0%
30.0%
0
10,000
20,000
30,000
40,000
50,000
60,000
70,000
RY2013 RY2014 RY2015 RY2016
Percentage
Num
ber
of p
resc
riber
s
% of E-FORCSE registered prescribers that issued one or more controlled substances
Prescribers registered with E-FORCSE
Prescribers issued one or more controlled substances

13
unique individuals receiving schedule III controlled substances from 703,747 to 402,321. Unique Florida residents receiving schedule II and IV controlled substances has increased 38.3 percent from 1,000,772 to 1,383,737. However, there has been a substantial decrease, 64 percent from 405,562 to 145,785 individuals receiving schedule II, III and IV controlled substances during the current report year.
On average, when drugs on a single schedule are prescribed, the average number of prescriptions per person is lower (range: 2.8-3.9) when compared to individuals prescribed drugs in multiple schedules (range: 6.4-16.7).
Table 5. The number of unique Florida residents and average number of prescriptions per person by controlled substance schedule.
Schedule RY2015
(No.) RY2016
(No.) Change
(%)
RY2015 Rx per person
RY2016 Rx per person
Schedule II 2,232,725 2,752,942 23.30 2.52 2.75
Schedule II and III
290,344 112,663 -61.20 6.45 6.35
Schedule II, III, and IV
405,562 145,785 -64.05 16.78 16.72
Schedule II and IV
1,000,772 1,383,737 38.27 9.17 10.27
Schedule III 703,747 402,321 -42.83 2.15 2.92
Schedule III and IV
261,479 153,155 -41.43 7.56 9.05
Schedule IV 2,331,984 2,437,281 4.52 3.84 3.92
Total 7,226,613 7,387,884 2.23 4.97 5.01
B. PERFORMANCE MEASURE: The number of unique individuals, prescribers, and pharmacies in the PDMS.
Table 6 describes the characteristics of the PDMS. There are 7,847,122 unique patients who have received one or more controlled substance prescriptions during this reporting period, a 2.4 percent increase. In addition, the number of unique prescribers has declined 2.2 percent from 212,869 to 208,238. The mean number of unique individuals per prescribers continues to increase from RY2013 to RY2016, and there is a 4.4 percent increase between RY2015 and RY2016.

14
Table 6. Number of unique individuals, prescribers and pharmacies in the PDMS, RY2013 to RY2016.
RY2013 Change
(%) 13-14
RY2014 Change
(%) 14-15
RY2015 Change
(%) 15-16
RY2016
Number of unique individuals
6,590,271 1.12 6,664,181 15.04 7,666,783 2.35 7,847,122
Number of unique prescribers
217,064 -1.08 214,710 -0.86 212,869 -2.18 208,238
Mean number of unique patients per prescriber
46.70 1.28 47.30 15.12 54.45 4.36 56.83
Number of Unique Pharmacies
6,057 1.21 6,130 4.68 6,417 2.01 6,546
Table 7 illustrates that during the last reporting period, 62,880 in-state prescribers issued 35,929,723 controlled substance prescriptions to 7,226,613 Florida residents or approximately 571.4 prescriptions per prescriber. In the current reporting period, 63,839 in-state prescribers issued 37,048,030 prescriptions to 7,387,884 Florida residents or approximately 580.3 prescriptions per prescriber. In this reporting period, approximately 5.0 prescriptions were filled per patient.
Table 7. Number of controlled substance prescriptions per patient, prescriber and per capita: Florida residents, RY2013 to RY2016.
RY2013 Change
(%) 13-14
RY2014 Change
(%) 14-15
RY2015 Change
(%) 15-16
RY2016
Number of Prescriptions to Florida residents
33,704,092 -0.64 33,489,309 7.29 35,929,723 3.11 37,048,030
Number of unique patients in Florida
6,202,492 .91 6,258,961 15.46 7,226,613 2.23 7,387,884
Number of unique in-state prescribers
59,937 1.68 60,945 3.17 62,880 1.53 63,839
Prescriptions per patient
5.43 -1.53 5.35 -7.08 4.97 0.86 5.01
Prescriptions per prescriber
562.33 -2.28 549.50 3.99 571.40 1.56 580.34
* Annual population estimates are from U.S. Census Bureau

15
C. PERFORMANCE MEASURE: Percentage of schedule II-IV controlled substances prescribed per day by prescriber decile rank.
Figure 2 illustrates the percentage of schedule II-IV controlled substances prescribed per day by prescriber decile rank for CY2015. The top one percent of controlled substance prescribers account for approximately 18.7 percent of total daily prescribing and the top 10 percent of prescribers account for approximately 63.7 percent of all prescribing. Taken alone, these data are not indicative of medical appropriateness of prescribing only volumes per prescriber.
Figure 2. Percentage of Schedule II-IV controlled substances prescribed per day by prescriber decile rank, CY2015.
D. PERFORMANCE MEASURE: Number of prescriptions and percentage of total prescriptions of the most commonly dispensed controlled substances.
Hydrocodone SA, alprazolam, and oxycodone SA are ranked the top three most commonly dispensed controlled substances, representing 37.1 percent of the total controlled substances dispensed in RY2016. Drugs with the largest year-to-year increases in dispensing were amphetamine (12.7 percent) and oxycodone SA (7.6 percent) and tramadol SA (6.3 percent). Drugs with the largest year-to-year decreases in dispensing were temazepam (-9.4 percent) and hydrocodone SA (-4.4 percent) and zolpidem (-2.2 percent).
Top
1%
0
10
20
30
40
50
60
70
1st-10th 11th-20th 21st-30th 31st-40th 41st-50th 51st-100th
% o
f con
trol
led
subs
tanc
e pr
escr
iptio
ns
Prescriber percentile rank

16
Table 8. The number of prescriptions and percentage of total prescriptions of the top 10 most commonly dispensed controlled substances to Florida residents.
Drug Drug Class
RY2015 RY2016
No. % No. % Change
(%) Hydrocodone SA O 5,359,325 14.81 5,123,070 13.81 -4.41 Alprazolam B 4,300,495 11.89 4,385,815 11.83 1.98 Oxycodone SA O 3,963,049 10.95 4,263,901 11.50 7.59 Tramadol SA* O 2,598,803 7.18 2,763,302 7.45 6.33 Zolpidem M 2,452,610 6.78 2,397,758 6.47 -2.24 Clonazepam B 2,034,561 5.62 2,117,128 5.71 4.06 Lorazepam B 1,706,759 4.72 1,788,012 4.82 4.76 Amphetamine S 1,406,733 3.89 1,585,922 4.28 12.74 Temazepam B 1,465,763 4.05 1,328,281 3.58 -9.38 Diazepam B 980,806 2.71 991,567 2.67 1.10
B=Benzodiazepine, O=Opioid, S=Stimulant, M=Miscellaneous, rank refers to the current reporting period. * Tramadol SA was moved from a legend prescription drug to a schedule IV controlled substance, August 2014.
E. PERFORMANCE MEASURE: Prescription rates of select controlled substances by
year, by drug class, sex and age group.
Figure 3 illustrates prescribing rates (per 1,000 state residents) of three classes of prescription drugs (opioids, stimulants, and benzodiazepines) observed by sex and age group in CY2015. Females are more frequently prescribed opioids, stimulants, and benzodiazepines in all age groups analyzed, except for opioids among patients aged 55-64 years. Regardless of sex, opioid prescribing begins to decline for individuals 65 and older whereas benzodiazepine prescribing continues to increase with age. Stimulant prescribing peaks for females in the age group of 35-44 years old.
Pre
scrip
tions
per
1,0
00
pop
ulat
ion
Age Group
Figure 3. Prescription rates by drug class, sex and age group (females shown in black), Florida residents, CY2015.
F. PERFORMANCE MEASURE: Prescribing rates per 1,000 population of controlled substances by Florida County.
After ranking prescribing rates per 1,000 population by quartiles, variation by geographic area and drug class is observed. It is beyond the scope of this report to examine the factors associated with this variation but they may reflect underlying differences in sociodemographics, health care utilization patterns, and other community-level dynamics. For example, Miami-Dade County is one of the high prescribing areas for benzodiazepines but one of the lowest areas for
0500
1,0001,5002,000
Opioids
0100200300400500
Stimulants
0
500
1,000
1,500
Benzodiazepines

17
opioids. Other counties with divergent rates by drug class can be seen on the maps in Figure 4 below. Clusters of counties with high and low rates can also be observed. For example, Holmes, Washington, and Bay in the panhandle region are among the highest in prescribing of opioids and benzodiazepines (see box on maps). Given the CDC’s indication that opioids and benzodiazepines represent a high-risk drug combination,19 the prescribing trends and pattern in these counties may deserve further examination.
Figure 4. Prescriptions per 1,000 county residents for all controlled substance prescriptions in schedules II - IV, opioids, stimulants, and benzodiazepines, current reporting period.
State Note: The quartiles referenced in Figure 4 are the points that divide a ranked set of data values into four equal groups.

18
3. OUTCOME: Increased coordination among partners participating in the PDMP.
A. PERFORMANCE MEASURE: The number of authorized users who have requested and received controlled substance dispensing information by user type.
The increased coordination among partners participating in the PDMP can be measured in terms of the number of authorized users who have requested and received controlled substance dispensing information. Overall, 28,984 (78.9 percent) of the 36,718 registered users have queried the PDMS. Health care practitioner queries increased 41.8 percent from 19,389,253 to 27,501,266, when compared to RY2015 (Table 9).
Table 9 illustrates pharmacists have the highest registration (16,400) and utilization rate (14,775), 90.1 percent, and have queried the PDMS 15,635,465 times. All other health care practitioners have queried 11,865,801 times. In particular, 8,547 of the 12,599 allopathic physicians registered to use the PDMS have queried 8,723,495 times, a 42.2 percent increase, when compared to RY2015.
Table 9. Health care practitioner utilization by license type.
License Type
Registered Users (No.)
Users who have
Queried (No.)
Users who have
Queried (%)
RY2015 Queries (No.)
RY2016 Queries (No.)
% Change
ARNP 2,266 1,663 73.39 450,186 672,492 49.38
DN 900 538 59.78 15,849 20,993 32.46
ME 12,599 8,547 67.84 6,134,184 8,723,495 42.21
OPC 11 3 27.27 3 6 100.00
OS 2,654 2,021 76.15 1,387,070 1,952,584 40.77
PA 1,703 1,332 78.21 348,302 492,057 41.27
PO 185 105 56.76 2,971 4,174 40.49
PS 16,400 14,775 90.09 11,050,688 15,635,465 41.49
TOTAL 36,718 28,984 78.94 19,389,253 27,501,266 41.84
ARNP=Advanced Registered Nurse Practitioner; DN=Dentist; ME=Medical Doctor/Allopathic Physician; OPC=Certified Optometrist; OS=Osteopathic Physician; PA=Physician Assistant; PO=Podiatric Physician; PS=Pharmacist Certain law enforcement and investigative agencies may request controlled substance prescription information from the program manager during the course of an active investigation related to prescribed controlled substances. During the reporting period, law enforcement and investigative agencies have appointed 248 authorized users of whom 243 have submitted requests. There has been a 15.3 percent reduction in the number of requests from 7,420 in 2015 to 6,284 (Table 10). This decrease in the number of requests is attributed to the implementation of the new law requiring law enforcement agencies to enter into a user agreement with the Department prior to requesting information, and requiring authorized users to meet certain requirements.

19
Table 10. Investigative agency registration and utilization by agency type.
Agency Users that
have Queried (No.)
Requests RY2015
(No.)
Requests RY2016
(No.)
Change (%)
Law Enforcement 239 7,333 6,234 -14.99
Attorney General’s Medicaid Fraud Unit
2 73 40 -45.21
Department Regulatory Board 2 14 10 -28.57
TOTAL 243 7,420 6,284 -15.31
Tracking query by purpose can provide E-FORCSE staff and agencies with additional information regarding the community’s controlled substance diversion and abuse challenges and provides justification for the query request. Law enforcement and investigative agencies also have an opportunity to upload documents for review.
During the current report period, law enforcement requested 6,284 queries, which includes active investigations involving potential criminal activity regarding prescribed controlled substances, fraud, theft, and other specific crimes related to controlled substances (Table 11). There were 5,904 requests regarding potential criminal activity, 284 requests related to fraud investigations as well as 53 cases involving theft of controlled substances.
Table 11. Investigative agency query request by purpose.
Query Purpose Number of Queries
An active investigation of potential criminal activity regarding prescribed controlled substances
5,904
An active investigation of potential fraud regarding prescribed controlled substances
284
An active investigation of theft regarding prescribed controlled substances 53
Other-identify the specific crimes being investigated in the space below 43
TOTAL 6,284
B. PERFORMANCE MEASURE: Percentage of the top 200 prescribers who are registered to access the PDMS and percentage of those registered who have queried patient specific controlled substance dispensing information.
In Florida, allopathic physicians make up 85.0 percent (170) and osteopathic physicians 15.0 percent (30) of the top 200 prescribers of controlled substances; 90.5 percent (181) of the top 200 prescribers have registered to use the PDMS of which 97.8 percent (177) have queried their specific patients’ controlled substance histories.
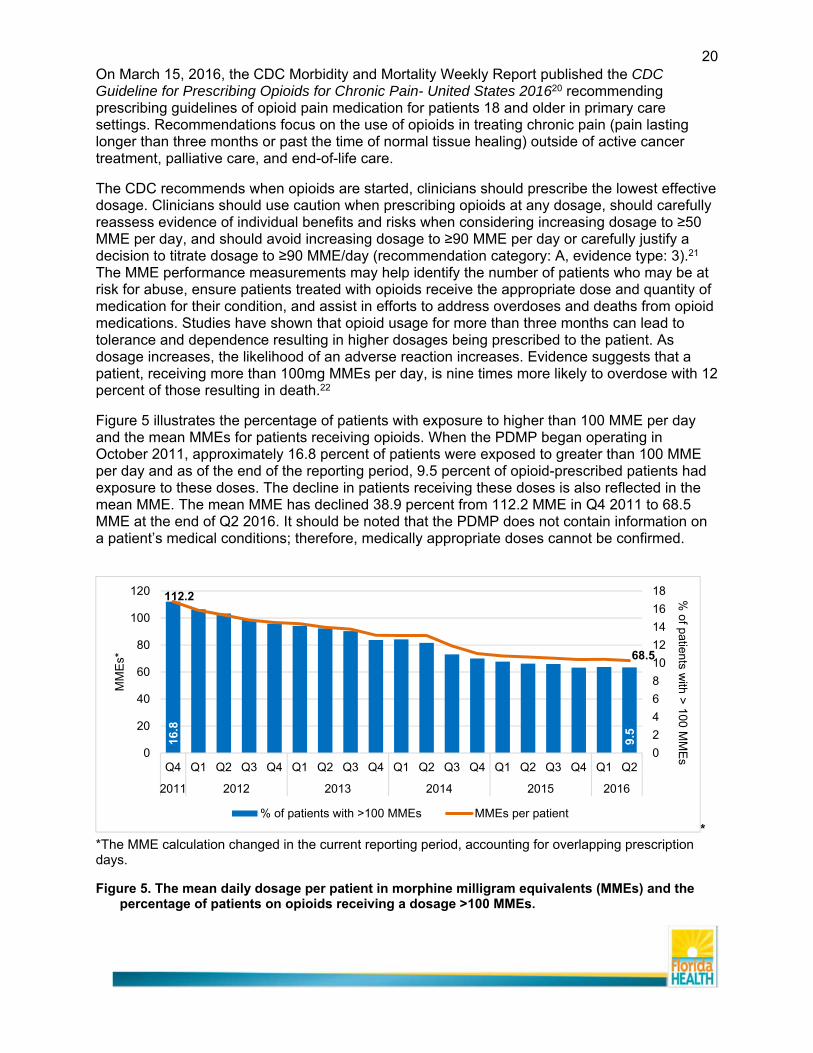
C. PERFORMANCE MEASURE: The mean daily dosage per patient in morphine milligram equivalents (MMEs) by quarter and year.
20
On March 15, 2016, the CDC Morbidity and Mortality Weekly Report published the CDC Guideline for Prescribing Opioids for Chronic Pain- United States 201620 recommending prescribing guidelines of opioid pain medication for patients 18 and older in primary care settings. Recommendations focus on the use of opioids in treating chronic pain (pain lasting longer than three months or past the time of normal tissue healing) outside of active cancer treatment, palliative care, and end-of-life care.
The CDC recommends when opioids are started, clinicians should prescribe the lowest effective dosage. Clinicians should use caution when prescribing opioids at any dosage, should carefully reassess evidence of individual benefits and risks when considering increasing dosage to ≥50 MME per day, and should avoid increasing dosage to ≥90 MME per day or carefully justify a decision to titrate dosage to ≥90 MME/day (recommendation category: A, evidence type: 3).21 The MME performance measurements may help identify the number of patients who may be at risk for abuse, ensure patients treated with opioids receive the appropriate dose and quantity of medication for their condition, and assist in efforts to address overdoses and deaths from opioid medications. Studies have shown that opioid usage for more than three months can lead to tolerance and dependence resulting in higher dosages being prescribed to the patient. As dosage increases, the likelihood of an adverse reaction increases. Evidence suggests that a patient, receiving more than 100mg MMEs per day, is nine times more likely to overdose with 12 percent of those resulting in death.22
Figure 5 illustrates the percentage of patients with exposure to higher than 100 MME per day and the mean MMEs for patients receiving opioids. When the PDMP began operating in October 2011, approximately 16.8 percent of patients were exposed to greater than 100 MME per day and as of the end of the reporting period, 9.5 percent of opioid-prescribed patients had exposure to these doses. The decline in patients receiving these doses is also reflected in the mean MME. The mean MME has declined 38.9 percent from 112.2 MME in Q4 2011 to 68.5 MME at the end of Q2 2016. It should be noted that the PDMP does not contain information on a patient’s medical conditions; therefore, medically appropriate doses cannot be confirmed.
* *The MME calculation changed in the current reporting period, accounting for overlapping prescription days.
Figure 5. The mean daily dosage per patient in morphine milligram equivalents (MMEs) and the percentage of patients on opioids receiving a dosage >100 MMEs.
16.8
9.5
112.2
68.5
0
2
4
6
8
10
12
14
16
18
0
20
40
60
80
100
120
Q4 Q1 Q2 Q3 Q4 Q1 Q2 Q3 Q4 Q1 Q2 Q3 Q4 Q1 Q2 Q3 Q4 Q1 Q2
2011 2012 2013 2014 2015 2016
% of patients w
ith > 100 M
ME
sM
ME
s*
% of patients with >100 MMEs MMEs per patient

21
D. PERFORMANCE MEASURE: Number of patients receiving concurrent prescriptions of an opioid, alprazolam and carisoprodol (OAC) in a month.
The concurrent dispensing of an opioid (hydrocodone or oxycodone), alprazolam and carisoprodol (OAC) was evaluated based on a similar analysis conducted by the Institute for Pharmaceutical Outcomes and Policy at the University of Kentucky. This combination is known as the ‘holy trinity’ on the street and has been associated with abuse.23 Patients who received a prescription for all three medications within a one-month period were defined as having concurrent prescriptions for OAC. Since October 2011, the number of patients receiving OAC has decreased 70.5 percent from 12,273 to 3,618 (Figure 6).
Figure 6. Number of Florida patients receiving concurrent prescriptions of an opioid, alprazolam and carisoprodol (OAC) in a month: 2011Q4 to 2016Q2.
4. OUTCOME: Involvement of stakeholders in achieving improved patient health care, safety, and reduction of prescription drug abuse and prescription drug diversion.
Through its 2013 Harold Rogers Data-Driven Multi-Disciplinary Approach to Reducing Prescription Drug Abuse Grant, the Department has established a long-term collaboration between the PDMP, law enforcement, public health and research community in Florida to collect and analyze data by centralizing existing data sources, completing practitioner surveys and establishing a focus group; increase the engagement of Florida’s public health community in PDMP use via early participation in technical design and development of practitioner metrics; work with interested parties and stakeholders to develop educational opportunities and brochures to educate health care practitioners regarding legitimate and appropriate use of controlled substances; and develop valid data-driven analytic strategies.
B. PERFORMANCE MEASURE: Multiple provider episode rates based on number of individuals visiting 5/10 number of prescribers and 5/10 number of dispensers in a 90-day period.
Using the data in this performance measure demonstrates the value of the PDMP as a clinical decision making tool to reduce prescription drug abuse, misuse and diversion. One common
0
2,000
4,000
6,000
8,000
10,000
12,000
14,000
2011 2012 2013 2014 2015 2016
Num
ber
of p
atie
nts
rece
ivin
g co
ncur
rent
O
AC
pre
scrip
tions

22
definition of an MPE is defined as use of five or more prescribers and five or more pharmacies within three months. Data supports that as registration and utilization of E-FORCSE by prescribers and dispensers increases, the number of multiple provider episodes decreases.
During the first quarter of E-FORCSE’s operation (October 1, 2011 to December 31, 2011), E-FORCSE data indicated there were 2,864 individuals who had one or more controlled substance prescription drugs prescribed to them by more than five prescribers and dispensed at more than five pharmacies in a 90-day period. By the end of the second quarter of 2016 (April 1, 2016 to June 30, 2016), there was a 76.2 percent reduction or 682 individuals visiting more than five prescribers and more than five pharmacies within 90 days (Figure 7). During the same initial period, 105 individuals had one or more prescription drugs prescribed to them by more than 10 prescribers and dispensed at more than 10 pharmacies in a 90-day period. By the end of the second quarter of 2016 (April 1, 2016 to June 30, 2016), there was an 80.0 percent reduction or 21 individuals visiting more than 10 prescribers and more than 10 pharmacies within 90 days (Figure 7).
Figure 7. Number of individuals obtaining controlled substance prescriptions in schedules II-IV from 5 (10) or more prescribers and 5 (10) or more dispensers within a 90-day period, October 2011 to June 2016.
C. PERFORMANCE MEASURE: Multiple provider episode rates by drug schedule and age group.
The reduction in the quantity of controlled substances obtained by individuals can be measured in terms of the number of multiple provider episode rates per 100,000 state residents by schedule and age group, reported by quarter and year. MPEs in Figure 8 are defined as the number of individuals receiving and filling a schedule II or III prescription at five or more prescribers and five or more pharmacies within a 90-day period.
Figure 8 illustrates the decline of multiple provider episodes rates for individuals receiving a schedule II or III controlled substance for all age groups with the highest rate of decline in age groups 35-54 followed by 55 and older.
2,86
4
2,17
4
2,01
7
1,86
1
1,72
6
1,61
3
1,68
0
1,41
5
1,46
8
1,25
4
1,19
8
1,35
5
1,41
7
1,10
3
1,05
6
1,00
6
910
773
682
105
68
45 43 46
36 38
31 35
28 31 35
40
20 20 20 17
11
21
0
20
40
60
80
100
120
0
500
1,000
1,500
2,000
2,500
3,000
3,500
2011 2012 2013 2014 2015 2016
Num
ber of patientsNum
ber
of p
atie
nts
5+ Prescribers and 5+ Pharmacies (Left Y-Axis) 10+ Prescribers and 10+ Pharmacies (Right Y-Axis)

23
Figure 8. Multiple provider episode rate per 100,000 residents for schedule II and III drugs by quarter/year and age group.
D. PERFORMANCE MEASURE: The number of proactive notification reports sent to prescribers and law enforcement.
In order to improve patient health and increase patient safety, PDMP staff developed and implemented a proactive reporting program encompassing prescribing practitioners and law enforcement. The goal of the program is to utilize MPE data to provide quarterly notifications for review by the appropriate professional.
Proactive prescriber notifications are designed to educate the prescriber that their patient has exceeded the threshold level of controlled substance prescriptions, as established by Florida Administrative Code. Notification allows the prescriber an opportunity to have a candid conversation with their patient about their chronic pain and treatment options. Proactive law enforcement notifications are designed to educate investigators on situations where individuals may be exploiting communication gaps in the health care environment to obtain multiple controlled substance prescriptions (i.e. MPEs).
During the period of July 1, 2015 and June 30, 2016, PDMP staff provided 225 prescriber proactive notifications and 24 law enforcement proactive notifications (Table 12). These programs have only recently been implemented; therefore, there has not been sufficient time to accumulate definitive outcome results. However, positive feedback from law enforcement stakeholders and follow-up case reviews indicate there is value in the notification process. The program brings attention to situations that when reviewed from a more global and trending perspective show potential for improving care and decreasing diversion. Collaboratively implementing the law enforcement and prescriber programs helps engage prescribers as well as provide a conduit for outside review if a recipient is consistently and purposely receiving duplicative services and medications. A thorough evaluation of this new initiative is planned under the University of Florida Harold Rogers Data Driven Multi-Disciplinary Approach to Reducing Prescription Drug Abuse Grant 2016-PM-BX-K005.
0
2
4
6
8
10
12
14
16
18
20
Q4 Q1 Q2 Q3 Q4 Q1 Q2 Q3 Q4 Q1 Q2 Q3 Q4 Q1 Q2 Q3 Q4 Q1 Q2
2011 2012 2013 2014 2015 2016
Mul
tiple
pro
vide
r ep
isod
es p
er 1
00,0
00
popu
latio
n
18-34 35-54 55 and older

24
Table 12. Proactive notification reports by type, RY2016.
Proactive Notification Reports RY2016
(No.) Prescriber 225
Law Enforcement 24
TOTAL 249
E. PERFORMANCE MEASURE: The number of medical examiner reports that indicate controlled prescription drug use as the primary or contributing cause of death.
The Drugs Identified in Deceased Persons by Florida Medical Examiners 2015 Annual Report24 illustrates occurrences of oxycodone increased by 10.5 percent and deaths caused by oxycodone increased by 20.2 percent between 2014 and 2015. This reverses a five-year trend whereby oxycodone caused deaths had decreased by 69.0 percent from 2010 to 2014.
Medical Examiners also reported a decline in occurrences and deaths associated with methadone, hydrocodone and tramadol in 2015. Figure 9 illustrates the mortality rate (deaths per 100,000 population) for selected drugs by year. It shows that from 2010 to 2015, the oxycodone-caused mortality rate declined from 8.0 to 2.8 per 100,000 population (a 65.3 percent decrease). Methadone-caused and hydrocodone-caused mortality rate declined over the same period by 61.1 percent and 30.3, respectively. Morphine-caused mortality rates have increased from 1.4 to 4.4 per 100,000 (+217.7 percent). Additionally, the number of heroin-caused deaths increased from 48 to 733 (0.3 to 3.6 per 100,000 population, +1,320.0 percent) during 2010 to 2015.
Figure 9. Mortality rate for select licit and illicit drugs from 2005 to 2015.
0.0
1.0
2.0
3.0
4.0
5.0
6.0
7.0
8.0
9.0
2005 2006 2007 2008 2009 2010 2011 2012 2013 2014 2015
Dea
ths
per
100,
000
popu
latio
n
Alprazolam Heroin Hydrocodone Methadone Morphine Oxycodone

25
Figure 10. Number of fentanyl-related law enforcement submissions and overdose deaths, and rate of fentanyl prescriptions, 2012-2015
In 2016, the University of Florida and the CDC prepared a brief report regarding the increase in the number of fentanyl-related deaths in Florida and Ohio.25 Fentanyl is an opioid that is reported to be 50-100 times more potent than morphine.26 Figure 10 illustrates the number of fentanyl-related law enforcement submissions and overdose deaths, and rate of fentanyl prescriptions and was published in the CDC report. The analysis helped 1) bring national attention to the increasing number of fentanyl-involved overdoses, 2) demonstrate the direct correlation between deaths and fentanyl-related law enforcement submissions, and 3) provide evidence, using the fact that fentanyl prescribing had not increased at the same rate, that the likely source of fentanyl was non-medical.
F. PERFORMANCE MEASURE: The number of Florida substance abuse treatment admissions by substance type.
The Treatment Episode Data Set (TEDS) is maintained by the Center for Behavioral Health Statistics and Quality, Substance Abuse and Mental Health Services Administration (SAMHSA). The TEDS system includes records for substance abuse treatment admissions annually. Data shown here are routinely collected by states to monitor their individual substance abuse treatment systems.27
Other opiates includes admissions for non-prescription use of methadone, codeine, morphine, oxycodone, hydromorphone, meperidine, opium, and other drugs with morphine-like effects. Treatment admissions for other opiates increased from 2,553 in 2005 to 26,974 in 2011. However, since 2011, treatment admissions for this group declined by 78.9 percent (5,700 in 2015). Since 2012, heroin admissions have increased from 2,003 to 3,883 in 2015, a 93.9 percent increase. Alcohol treatment admissions are shown for reference.
0
0.2
0.4
0.6
0.8
1
1.2
1.4
1.6
1.8
2
0
10
20
30
40
50
60
70
80
90
1 2 3 4 5 6 7 8 9 10 11 12 1 2 3 4 5 6 7 8 9 10 11 12 1 2 3 4 5 6
2013 2014 2015
Prescriptions per 1,000 population
Num
ber
Fentanyl-caused deaths Fentanyl-related law enforcement submissions
Fentanyl prescriptions per 1,000 population

26
Figure 11. Florida substance abuse treatment admissions, TEDS, 2005-2014.
G. PERFORMANCE MEASURE: The number of hospital discharges with poisoning as a principal diagnosis, by substance type.
Drug overdose hospitalization was identified using International Classification of Diseases, Ninth Revision, Clinical Modification (ICD-9-CM) codes.28 The number of discharges from Florida hospitals due to pharmaceutical opioids (ICD-9-CM codes: 965.00, 965.02, 965.09, E850.1, E850.2) and benzodiazepines (ICD-9-CM codes: 969.4, E853.2) poisoning reached their peak in Q3 2011 at 1,572 and 1,979 discharges, respectively. This was the same quarter as PDMP implementation. A rise in the number of discharges due to heroin poisoning is apparent in recent years. Since 2014, the number of quarterly discharges for heroin poisonings has increased threefold (ICD-9-CM codes: 965.01, E850.0).
Figure 12. Hospital discharges for drug poisoning in Florida, by substance, Florida Agency for Health Care Administration, 2005 to 2015.
0
500
1,000
1,500
2,000
2,500
3,000
3,500
4,000
4,500
0
5,000
10,000
15,000
20,000
25,000
30,000
2005 2006 2007 2008 2009 2010 2011 2012 2013 2014 2015
Heroin
Alc
ohol
/Oth
er O
piat
es
Other Opiates Alcohol Heroin
0
50
100
150
200
250
300
350
0
500
1000
1500
2000
2500
Q1
Q2
Q3
Q4
Q1
Q2
Q3
Q4
Q1
Q2
Q3
Q4
Q1
Q2
Q3
Q4
Q1
Q2
Q3
Q4
Q1
Q2
Q3
Q4
Q1
Q2
Q3
Q4
Q1
Q2
Q3
Q4
Q1
Q2
Q3
Q4
Q1
Q2
Q3
Q4
Q1
Q2
Q3
2005 2006 2007 2008 2009 2010 2011 2012 2013 2014 2015
Heroin
Pha
rmac
eutic
al
Opi
oids
/Ben
zodi
azep
ines
Pharmaceutical Opioids Benzodiazepines Heroin

27
Conclusion
The effectiveness of E-FORCSE as a tool to decrease prescription drug abuse and diversion is demonstrated when comparing the performance measures reported during July 1, 2014 through June 30, 2015 to July 1, 2015 through June 30, 2016.
There have been 37,048,030 prescriptions reported by 6,546 dispensers for 7,387,884 unique Florida residents, indicating each unique patient received an average of 5.01 prescriptions, an increase from 4.97 the previous reporting period. Although dispensers are required to report controlled substance dispensing information to E-FORCSE within 7 days of dispensing, 66 percent of pharmacy dispensers reported within 24 hours.
While its use is not mandatory, physicians and pharmacists have queried E-FORCSE more than 27.5 million times and through outreach and educational efforts, E-FORCSE registration increased 20.4 percent and utilization increased 41.84 percent. During the most recent year, 25.6 percent of the 63,839 in-state prescribers who issued one or more controlled substance prescriptions were registered to access the PDMS, suggesting it is becoming an integral part of everyday clinical practice. This demonstrates the value of the PDMP as a clinical decision making tool to reduce prescription drug abuse, misuse and diversion. Increased utilization of the PDMS resulted in a 38.9 percent reduction in average morphine milligram equivalents (MMEs) per patient since the PDMP became operational.
E-FORCSE has proven to be a critical tool in the fight to protect health and safety by reducing doctor shopping and controlled substance related deaths, while supporting sound clinical practice in the prescribing of controlled substances.

28
References
1 Florida Medical Examiner’s Commission. Drugs Identified in Deceased Persons, Annual Report 2015. Florida Department of Law Enforcement, Medical Examiner’s Commission, September 2016. 2 Jones, C.M., Heroin use and heroin use risk behaviors among nonmedical users of prescription opioid pain relievers- United States, 2002-2004 and 2008-2010. Drug Alcohol Depend. 2013 Sep 1; 132(1-2): 95-100. doi: 10.1016/j.drugalcdep.2013.01.007/ Epub 2013 Feb 12. 3 Id. 1. 4 Surrat, H.L. et al. Reductions in prescription opioid diversion following recent legislative interventions in Florida. Pharmacopidemiol. Drug Saf. 23, 314-320 (2014). 5 Delcher, C. et al. Abrupt decline in oxycodone-caused mortality after implementation of Florida’s Prescription Drug Monitoring Program. Drug Alcohol Depend. (2015) 6 Rutlow, L. et al. Effect of Florida’s Prescription Drug Monitoring Program and Pill Mill Laws on Opioid Prescribing and Use. JAMA Intern. Med. 175, 1642-1649 (2015). 7 Kennedy-Henricks, A. et al. Opioid overdose deaths and Florida’s crackdown on pill mills. Am. J. Public Health 106, 291-297 (2016). 8 Florida Dep’t of Health. 2013-2014 Prescription Drug Monitoring Program Annual Report, 2014. 9 Frieden, T.R., From Sounding the Alarm to Turning the Tide: Action to Combat the Opioid Epidemic, Operation Unite, National Rx Abuse and Heroin Summit, 2016. 10 Dart, R.C. et al. Trends in Opioid Analgesic Abuse and Mortality in the United States. N Engl. J. Med. 372, 241-248 (2015) 11 Rudd, R.A. et al. Increases in heroin overdose deaths- 28 States, 2010 to 2012. MMWR Morb. Mortal. Wkly. Rep. 63, 849-854 (2014). 12The PDMP Quarterly Dashboard is published online at http://www.floridahealth.gov/statistics-and-data/e-forcse/news-reports/index.html. 13 Dep’t of Health, Division of Medical Quality Assurance, Annual Report 2014-2015, p.10-12. 14 Id. 15 Florida Dep’t of Law Enforcement, Fusion Center, email correspondence, October 2015. 16 Id. 17 http://www.floridahealth.gov/statistics-and-data/e-forcse/meaningful-use.html 18 Division of Medical Qualtiy Assurance Annual Report and Long Range Plan Fiscal Year 2014-2015. Available at http://www.floridahealth.gov/licensing-and-regulation/reports-and-publications/_documents/annual-report-1415.pdf. 19 Dowell De, Haegerich TM, Chou R. CDC Guideline for Prescribing Opioids for Chronic Pain – United States, 2016. MMWR Recomm Rep 2016;65(No. RR-1):1-49. DOI:
29
http://dx.doi.org/10.15585/mmwr.rr6501e1 or or http://www.cdc.gov/media/modules/dpk/2016/dpk-pod/rr6501e1er-ebook.pdf
20 Id. 21 Id. 22Dunn, Kate M., Kathleen W. Saunders, Carolyn M. Rutter, Caleb J. Banta-Green, Joseph O. Merrill, Mark D. Sullivan, Constance M. Weisner, et al. “Opioid Prescriptions for Chronic Pain and Overdose: A Cohort Study.” Annals of Internal Medicine 152, no. 2 (January 19, 2010): 85–92. doi:10.7326/0003-4819-152-2-201001190-00006. 23 Forrester MB. Ingestions of hydrocodone, carisoprodol, and alprazolam in combination reported to Texas poison centers. J Addict Dis. 2011; 30(2):110-115. doi:10.1080/10550887.2011.554778. 24Id. 1 25 Peterson AB, Gladden RM, Delcher C, et al. Increases in Fentanyl-Related Overdose Deaths — Florida and Ohio, 2013–2015. MMWR Morb Mortal Wkly Rep 2016;65:844–849. DOI: http://dx.doi.org/10.15585/mmwr.mm6533a3. 26 Id. 27 Treatment Episodes Data Set. Substance Abuse and Mental Health Services Administration. http://wwwdasis.samhsa.gov/webt/information.htm. Accessed October 29, 2015. 28 Injury Surveillance Workgroup 7. Consensus recommendations for national and state poisoning surveillance. The Safe States Alliance. Atlanta, GA. 2012. April 2012. Available at http://c.ymcdn.com/sites/www.cste.org/resource/resmgr/injury/isw7.pdf