john f. sandberg, and sandra l. hofferth f. sandberg, and sandra l. hofferth changes in...
TRANSCRIPT

John F. Sandberg, and Sandra L. Hofferth
Changes in Children's Time with Parents, U.S. 1981-1997
PSC Research ReportReport No. 01-475
May 2001
P O P U L A T I O N S T U D I E S C E N T E RAT THE INSTITUTE FOR SOCIAL R ESEARCH
UNIVERSITY OF M ICHIGAN
PSC

PSC Publications Population Studies Center, University of Michiganhttp://www.psc.isr.umich.edu/pubs/ PO Box 1248, Ann Arbor, MI 48106-1248 USA
The Population Studies Center (PSC) at the University of Michigan is one of the oldestpopulation centers in the United States. Established in 1961 with a grant from the FordFoundation, the Center has a rich history as the main workplace for an interdisciplinarycommunity of scholars in the field of population studies. Today the Center is supported by aPopulation Research Center Core Grant from the National Institute of Child Health andHuman Development (NICHD) as well as by the University of Michigan, the National Instituteon Aging, the Hewlett Foundation, and the Mellon Foundation.
PSC Research Reports are prepublication working papers that report on currentdemographic research conducted by PSC associates and affiliates. These papers are written fortimely dissemination and are often later submitted for publication in scholarly journals. ThePSC Research Report Series was begun in 1981. Copyrights for all Reports are held by theauthors. Readers may quote from, copy, and distribute this work as long as the copyright holderand PSC are properly acknowledged and the original work is not altered.

Changes in Children’s Time with Parents, U.S. 1981-1997
John F. SandbergPopulation Studies Center
University of [email protected]
Sandra L. HofferthPopulation Studies Center
University of [email protected]
May 9, 2001
Funding for this research was provided by the NICHD Family and Child Well-Being ResearchNetwork and by a Training Grant from NICHD to the Population Studies Center. The authorswish to thank John Bound and Pam Smock for helpful comments. This is a revised version of apaper presented at the Annual Meeting of the International Association of Time Use Research,University of Essex, Colchester, England, October 6-8 1999.

2
Changes in Children’s Time with Parents, U.S. 1981-1997
Abstract
This paper examines changes in the time American children spent with their parentsbetween 1981 and 1997, and the contribution to these changes of shifting patterns of femalelabor force participation, family structure, and parental education. Changes are decomposed intothe parts attributable to changes in demographic characteristics and parts likely due to changes inbehavior. In general, children’s time with parents did not decrease over the period, and in twoparent families it increased substantially. Population level changes in demographiccharacteristics were found to have only small direct effects on time children spent with parents.

3
INTRODUCTION
In the United States today, our societal commitment to the healthy development of children isoften disparaged. One common element in many of these complaints is time. The time children spendwith parents is thought to be important for their cognitive and social-emotional development, and it isargued by some that increasing extra-familial market activity by mothers and decreasing levels ofcommitment to traditional family structures by fathers in the U.S. in recent years have hurt childrenbecause they have led to decreasing amounts of time spent with parents (Hewlett, 1991; Blankenhorn,1995).
There are two fundamental problems with this line of reasoning. First, relatively little is actuallyknown about children’s time with parents. While there is a substantial amount of research that hasexamined the time parents spend in paid work and in household work (Robinson & Godbey, 1997), therehas been no comprehensive U.S. information on parental investments from the perspective of theindividual child which includes both time directly receiving care and time shared with parents whileengaging in other activities (Council of Economic Advisers, 1999).
In addition, though recent research examines current investments in children (Hofferth,forthcoming), there is little comparative work across time. Arguments that changes in the percentage offemale-headed families in the population and in female labor force participation over time have adverselyaffected the time children spend with parents are based on the assumption that the relationship betweenthese factors and parents’ time allocation has remained constant over time. Without concrete supportingevidence however, this assumption is untenable.
In this paper, we address these issues by examining the relative contributions of shifts in familystructure and maternal employment, and non-structural, potentially behavioral, changes to children’sweekly time spent with mothers, fathers, and either parent in 1981 and 1997. Using a variety of methodsincluding simple means comparisons, structural decomposition, and regression estimation, we find thatthough structural effects of increasing single parenthood and maternal labor force participation exist,changes in non-structural components of time use were at least equally, and sometimes more important.As a result, American children spent no less time with parents in 1997 than they did in 1981, and, in twoparent families, time with parents has actually increased over the period.
STRUCTURAL VS. BEHAVIORAL CHANGE
Change in Family Structure and Maternal Labor Force Participation
One premise of the argument made by those who believe that the changing structure of Americanfamilies and the increase in female labor force participation have decreased the time children spend withparents is indisputable. In the past twenty years, the structure of American families has undergoneenormous change.
Today it is estimated that two-thirds of first marriages will end in divorce, more than twice asmany as two decades ago (Martin & Bumpass, 1989). In addition, almost one-quarter of white and morethan half of black children are currently born to unmarried mothers. The consequences of these changesare evident in cross-sectional family statistics. In 1980, 22 percent of children lived with one parent, whiletoday almost 27 percent do (U.S. Bureau of the Census, 1999). The cumulative experience of divorce andsingle parenthood is even higher than these statistics suggest. According to recent estimates, 60% ofchildren will spend at least part of their childhood with only one parent (Hernandez, 1993).
At the same time, the proportion of women in the paid labor force has increased dramatically inrecent decades. While single women have always worked at high levels, married mothers have not. Oneof the more important elements of this change is the increase in the proportion of married mothers withyoung children who are employed outside the home. In 1998, 64 percent of U.S. married mothers with apreschool child were in the work force, compared with 42 percent in 1981 (by authors: 1981 CurrentPopulation Survey) and only 30 percent in 1970 (U.S. Bureau of the Census, 1999).

4
Change in Parental Behavior
What the proponents of the structural argument that single parenthood and maternal employmenthave produced a loss of time with parents neglect, however, is potential change in time allocation withinfamilies (Bryant and Zick, 1996b; Bianchi 2000). Such changes may be more or less exogenous todemographic change, related to that change, or some combination of the two. Regardless of maternalwork and marital status, mothers and fathers might spend more time with children because of culturalchanges in childrearing values emphasizing the importance of child development (Alwin, 1996). Anotherpossibility that has received recent support is that parents in employed-mother and single parent familieshave changed their behavior to compensate for perceived deficits in children’s well being related to theirwork or family status (Bianchi 2000). On the other hand, it could be argued that, in recent decades,parents might have spent less time with their children because of shifting values emphasizingindividualism (Whitehead, 1991).
The foregoing discussion suggests that the possibility of behavioral change needs to be accountedfor explicitly in any serious analysis of the effects of structural change. To do so, we need to examinepatterns of time allocation within families over time in conjunction with patterns of compositional changein the population.
Children’s Time with Parents
While it may seem obvious that children in single-parent families will spend less time withparents (simply because of the lack of a parent) only two recent studies have documented this in detail.One found that young adolescents living with single mothers spent 20 percent fewer daily non-schoolhours with parents than those living with two parents and that a proportionally greater amount of timespent with mothers in these families did not make up for the lower amount of time spent with fathers(Asmussen and Larsen 1991). Similarly, children under age 13 living with single mothers were found tospend 12 to 14 fewer weekly hours with parents than children living with married parents (Hofferth,forthcoming). Unfortunately, there is no information about the time children spent with single andmarried parents in earlier periods. Therefore, we are unable to gauge the magnitude of such changesacross time, and, thus, the contribution of changing proportions of single parent families in the populationto children’s time with parents.
The association between female labor force participation and parental time in household work hasbeen widely studied; there is, however, less evidence about its effects on time with children. Researchfrom the early 1980s found that nonworking mothers spent twice the time of employed mothers inactivities with preschool children on workdays—a difference of 5 hours (Nock and Kingston 1988). Thedifference was smaller, about 2 hours per workday, for mothers with only school-age children. Researchin 1997 found a 7.5-hour per week difference between the time children under age 13 spent with marriedmothers in dual-earner and in male breadwinner, female homemaker families (Hofferth, forthcoming).Though such research tends to confirm the negative association between maternal work and children'stime with parents, upon further consideration, the relationship may not be so clear-cut.
First, while maternal work outside the home is associated with decreased time mothers spend intraditional childcare activities, one study found it was also associated with increased time mothers wereengaged with children in shared housework and leisure activities (Bryant and Zick, 1996a). Second, in theU.S. a substantial minority of dual-earner parents keep their use of non-parental care to a minimum byadjusting their work schedules so that a parent can care for their children when needed. Though none ofthe above studies found maternal employment associated with more time spent with fathers, this may bepartially due to parents’ overlapping schedules. About one-third of working parents in two-parent familieswith a preschool child work different schedules and can share care (Presser, 1989); father participationrises dramatically with the number of non-overlapping hours (Brayfield, 1995). Also, mothers often workhours such that, for school-age children at least, they can be home at the end of the school day. Finally,

5
the at-home time of stay-at-home mothers does not equal their total time with children, since children andtheir parent are not always interacting, even if both are at home. Recent research shows only a 3-hourdifference between children of employed and non-employed married mothers in the time mothers spentinteracting with them in 1997 (Hofferth, forthcoming).
In addition to the ambiguity concerning the cross-sectional effects of maternal work, there isalmost no comparative research available to evaluate whether and to what degree changes in children’stime with parents are due to changes in female labor force participation rates or to changes in parentalbehavior. Two exceptions looking at the problem from the perspective of parental time allocation aresuggestive, however. One study of parental time in unpaid household work in the United States indicatesthat mothers’ time spent in childcare or playing with children might have increased in the decade between1975 and 1985, had it not been offset by the increase in female labor force participation in the populationin the same period (Gershuny and Robinson, 1988). Another study that addressed the effects of increasinglabor force participation on parents’ time with children, using historical and contemporary data onmarried couples from the 1920’s to 1980’s, concluded that parental time spent in direct childcareactivities rose rather than declined over the period, in spite of increased maternal employment (Bryant andZick 1996b). Because the sample was restricted to married families, however, this latter study could notgauge the effects of increasing rates of single parenthood. Perhaps more importantly, both studies are oflimited value in addressing the present question because of their exclusive focus on direct care activitiesrather than total time with parents, the lack of time use data from recent years, and the fact that they donot address time with parents from the perspective of children.
Educational Attainment and Family Size
Though the principal goal of this paper is to analyze the effects of changes in rates of singleparenthood and women’s labor force participation on children’s time with parents, in doing so it isimportant to also take into account two other major changes in American families which may haveinfluenced children’s time with parents.
The first is the change in the educational attainment of mothers. While in 1950 only about 5% ofAmerican mothers with children under 12 years of age had completed four years of college, in 1980 over12% had, and by 1990, this figure had increased to slightly over 18%.1 Besides monetary advantages,education affects the values, knowledge, experience, and aspirations that parents bring to childrearing.Thus since education and labor force participation may be associated, changing levels of education mayoffset the simple independent effect of rising female labor force participation. Previous research hasshown that better-educated mothers invest more heavily in their children by spending more time withthem in educational activities (Leibowitz, 1974).
Secondly, the number of children born to the average woman has declined substantially in the lasthalf century. Each woman born after 1945 is expected to bear about two children by the time shecompletes childbearing (U.S. Bureau of the Census, 1984; U.S. Bureau of the Census, 1988). In contrast,the average woman born between 1930 and 1939 had about three children. Most studies have found thatthe time parents spend with any given child declines as the number of children in the family increases (fora summary, see Bryant and Zick, 1996b). On the other hand, having fewer children may mean thatmothers and fathers spend less time at home and, therefore, less time with any individual child.
In the following analyses, changes in the educational attainment of mothers are included instructural decompositions of children’s time with parents, both independently and in conjunction withchanges in family structure and maternal labor force participation. We also control for the potentialimpact of changing numbers of children in families over time in the final section of the paper, usingmultivariate analyses. 1 Estimates compiled by authors, using historical census data from the IPUMS extraction system. StevenRuggles and Matthew Sobek et. al. Integrated Public Use Microdata Series: Version 2.0 Minneapolis:Historical Census Projects, University of Minnesota, 1997 (http://www.ipums.umn.edu).

6
METHODS AND DATA
The measurement of children's time is an issue that a number of researchers have wrestled with.In this section we discuss measurement issues, then describe the two sources of national information onchildren's time used in this analysis.
Measurement of Children's Time with Parents
The most accurate way to assess what activities children engage in and how much time theyspend in each would be observation. However, such methods are costly, intrusive, and limited in theamount of any particular day that can be covered. Another accurate way to collect information is by timesampling, in which respondents write down the activity they are engaged in whenever a beeper sounds, orsome other sampling device is triggered. This methodology is also costly and intrusive. The mostcommon method in survey research is to ask parents directly how much time they spend in certainactivities, such as reading to their child. While simple and widely used, this so-called ‘stylized’ method isknown to be biased, and has been proven to be quite inaccurate in some cases (Juster & Stafford, 1985;Marini & Shelton, 1993). In contrast, substantial methodological work has established the validity andreliability of data collected in time-diary form (Juster & Stafford, 1985).
Data for this study on children's time with parents come from 24-hour time diaries collected intwo surveys of the American population—the 1997 Child Development Supplement to the Panel Study ofIncome Dynamics—and a small 1981 follow-up to the 1976-77 Study of Time Use in Social andEconomic Accounts—The Time Use Longitudinal Panel Study, 1975-1981.2 Both studies were conductedby the University of Michigan using a similar methodology. The time diaries for both 1981 and 1997asked about the child's flow of activities over a 24-hour period beginning at midnight of the designatedday. Respondents were asked to give detailed information concerning each activity engaged in, when itbegan and ended, with whom the child did it, and what activity came next.
Prior to 1997, the Time Use Longitudinal Panel Study, 1975-1981 contained the only nationallyrepresentative data on U.S. children's time use available (Timmer, Eccles & O'Brien, 1985). In eachfamily sampled, time diary data were collected for the head of household, for their spouse, if present, andup to 3 children aged 3-17 years old. Adults were interviewed up to 4 times, but for most children only 2time diaries, one for a school day and one for a non-school-day, were obtained. Many studies continue toutilize statistics generated by this study for lack of a recent alternative (Task Force on YouthDevelopment and Community Programs, 1992). Until 1997 no national time diary data were available todocument changes since 1981, though results of a California study have been reported (Bianchi &Robinson, 1997).
The Panel Study of Income Dynamics (PSID) is a longitudinal survey of a representative sampleof U.S. men, women, children, and the families in which they reside. The sample is self-replacing, sincechildren and other sample members become respondents in their own right when they leave the originalhousehold. In 1997, the PSID added a refresher sample of immigrants to the United States (since 1968) sothat the sample represents the U.S. population in 1997. When weights are used, the PSID has been foundto be representative of U.S. individuals and their families (Fitzgerald, Gottschalk & Moffitt, 1998a).
2 Time Use Longitudinal Panel Study, 1975-1981; data originally collected by F. Thomas Juster.
Martha S. Hill, Frank P. Stafford, and Jacquelyn Eccles Parson of the Survey Research Center, Institute forSocial Research. Additional data used in analyses come from the Current Population Survey, March 1981,originally collected by the U.S. Dept. of Commerce, Bureau of the Census. Data from both studies wasfurnished by the Inter-university Consortium for Political and Social Research. ICPSR studies #9054 and#8269, respectively. Neither the collectors of the original data nor the Consortium bear any responsibility forthe analyses or interpretations presented here.

7
In 1997, information was collected on up to two randomly selected 0-12-year-old children ofPSID respondents both from the primary caregiver and from the children themselves. This ChildDevelopment Supplement (CDS) completed interviews with 2,380 households and about 3,563 children.The response rate was 90% for those families regularly interviewed in the core PSID and 84% for thosecontacted the first time this year for the immigrant refresher to the sample. The combined response ratefor both groups was 88%. Of principle importance to this research, time diaries for one weekend day andone weekday were collected from about 2,900 children.
For comparative purposes, the analytic child samples used in this paper were restricted to childrenaged 3-12 years old for whom both weekend and weekday diary data are available, and who are sons ordaughters of the head or wife of the household from which they were sampled.
For the 1981 data we use a sample of 243 children meeting these criteria. Individual child recordswere weighted by the product of the 1981 sample attrition weight (which adjusts the sample for loss ofrespondents from the 1975-1976 study), a post- stratification factor (taking into account maternal workstatus and number of parents in the household) derived from comparison to the March 1981 CurrentPopulation Survey, and a sub-selection weight that adjusts for the probability that a child in a givenhousehold was sampled in addition to non-response among sampled children.
For the 1997 PSID-CDS, the sub-sample of 2,125 children aged 3-12 years old is weighted by theproduct of the core PSID family weight, a post-stratification factor (by race and education of householdhead) based on comparison to the 1997 Current Population Survey, and a sub-selection weight thatadjusts for the probability that a child in a given household was sampled and for non-response of sampledchildren.
In the PSID-CDS time diaries, children's activities can be classified according to whether a parentdid the activity with the child or was simply present. In 1981, this distinction between engaged time andtime accessible to, but not engaged with children was not made. In light of this limitation in the 1981 dataand because the amount of time children spend simply in the presence of a parent may have importantconsequences for their development, for the present comparative analysis we measure the total timechildren spent with parents either engaged or accessible to them. For both samples, measurement of timeparents (including non-custodial parents) are either engaged or accessible to children is aggregated fromthe individual daily child time diaries and imputed to the week by multiplying the weekday totals by 5and the weekend day totals by 2.3
Children experience parental time and attention differently, and individual experiences withparents may be important to their later development. Because of this important reality and because of thesampling scheme employed in the data collection, this study focuses on an individual child's time with themother, the father, or either parent (which encompasses time spent separately with mothers, with fathers,and time spent with both).
Measurement of the Demographic and Control Variables
The demographic variables of primary importance to the analysis of the effects of changes inpopulation structure on children’s time with parents are family type and maternal employment status. Wealso consider changes in parental education and the number of children in the family. Several family-levelvariables that we do not address substantively in the paper but which have been found to have potentiallyimportant effects on children’s time with parents include household income, weekly hours worked byfathers and mothers, the race and age of the parents, and age of the youngest child in the family (Bryantand Zick, 1996a; Hofferth, forthcoming; Nock and Kingston, 1988). These are included in themultivariate analyses as controls. Similarly, on the child level, important differences in children’s timewith parents have been found to be associated with the gender and age of the child (Bryant and Zick, 3 While having only two days and not an entire week is a disadvantage, analyses conducted by the authorsindicate that the weekly time imputation used is valid due to a general lack of significant differences in timechildren spent with parents across weekdays or weekend days in 1981 or 1997.

8
1996a; Harris and Morgan, 1991; Hofferth, forthcoming; Nock and Kingston 1988) and these are alsoincluded as controls.
Age of parents (in years), family income (in tens of thousands of dollars), number of children,and age of youngest child in the family are measured continuously. The other variables are categorical.Race is a binary indicator taking the value of one if the child is non-Hispanic Black, and 0 otherwise.Gender is also dichotomous, with 0 indicating male and 1 indicating female. Maternal employment iscategorized two ways, first, as a working/not working dichotomy, and, second, in the regression analysesas not working, working part time (less than 35 hours per week), and working full time (35 or more hoursa week).4 Not working is the reference category for both variables. Parents' education is codeddichotomously—0 represents less than 4 years of college, and 1 represents completion of at least 4 yearsof college or a 4-year degree. Finally, family type is also measured with an indicator variable representingtwo parent and single mother families, with the former being the reference category.
Table 1 presents sample characteristics across the key demographic dimensions underinvestigation here for the 1981 and 1997 samples and, for comparative purposes, the March 1981 CurrentPopulation Survey. Although point estimates for all of these variables in the 1981 sample do not exactlymatch those from the CPS of the same year, they are reasonably close. In our 1981 analytic sample, aslightly higher percentage of children have mothers with 4 years of college than in the CPS, and theaverage number of children in a given child's household is also slightly higher.
Analysis Plan
Our analysis first describes children's time with mothers, fathers, or either parent in 1981 and1997. The latter element, time with either parent, is seldom considered in analyses of children’s time, butis important if simply the presence of a parent, rather than one of a particular gender, is thought to besignificant, and if, as some research noted above indicates, mothers and fathers adjust their time allocationto maximize the time at least one parent spends with the children. Differences between children's timewith parents in two-parent and single-parent families, and between families in which mothers work andthose in which they do not are also shown. We also discuss differences in children’s time with parents bymaternal educational attainment.
Next, we conduct a series of simple shift-share analyses in which we standardize estimates ofchange in time children in the U.S. spent with parents between 1981 and 1997 by rates of singleparenthood, maternal labor force participation, and education. This allows us to decompose changes inchildren's time with parents into elements that can be accounted for by changes in these population levelvariables, and those which cannot, but which may be attributable to behavioral changes.
Finally, we regress children's time with parents in 1997 on the analytic and control variables. Weuse the estimates derived from these models to make counterfactual predictions about children's time withparents based on 1981 demographic data. These predictions are then compared to actual 1981 and 1997sample estimates, providing a method of discerning amounts of change due to demographic and otherfactors, adjusting for multiple aspects of compositional change simultaneously.
It should be noted that we address the potential influence of non-independence of observationswithin families by using in all bivariate tests as well as in the regression analysis design-adjusted varianceestimates as implemented in the complex survey data component Stata 6.0, specifying the child’s familyas the primary sampling unit. These variance adjustments, though minor, are appropriate for analyseswhere there is non-independence across observations (Skinner and Smith 1989; Binder 1983).
4 For 1981 work status and weekly hours worked were obtained at the time of the survey. For 1997, thoughwork status is taken at the time of the survey, because work hours were not collected in the PSID-CDS and arenot yet available for 1997 from the core PSID, average weekly hours worked in the previous year are used as aproxy in combination with current work status to construct the maternal part-time/full time measure.

9
RESULTS
Bivariate Relationships: Children’s Time with Parents in 1997 and 1981
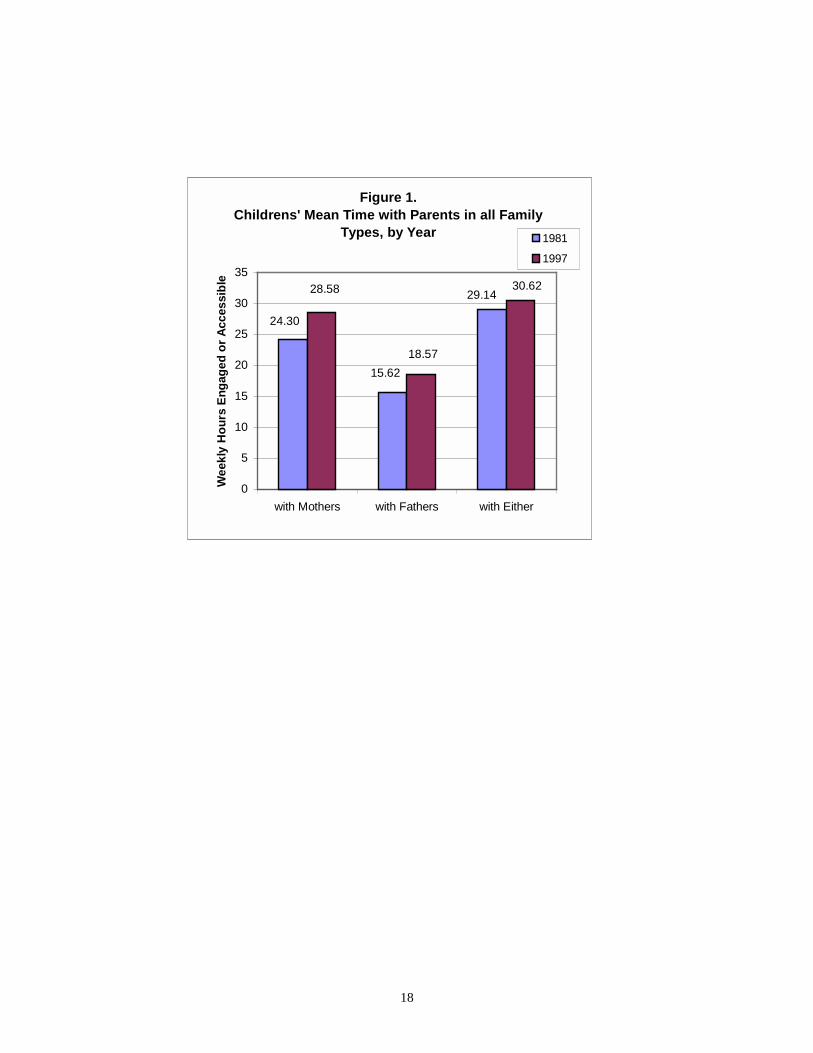
Figure 1 describes children’s mean weekly time with mothers, fathers, or either parent in 1981and 1997 across all family types.5 Children aged 3-12 spent about 4.3 more hours with mothers in 1997(about 28.6 hours) than they did in 1981 (about 24.3 hours; p=.000). There was also a marginallysignificant increase in time children spent with their fathers over the period (from about 15.6 hours perweek in 1981 to 18.6 hours per week in 1997, p=.084). In contrast, there was no significant difference intime spent with either parent (about 30 hours) in 1997 compared to 1981.
Family StructureThis apparent similarity may be real, or it may reflect a combination of offsetting structural and
non-structural effects on children’s time with parents. To investigate this possibility, Figure 2 re-estimateschildren’s mean time with parents, eliminating the potential effects of single parenthood by restricting theanalysis to two-parent families.
From this chart we see that the increase in children’s time with mothers over the period (about 5.8hours) is more pronounced in two-parent families (p=.000) than in all families.6 Children from two parentfamilies also spent significantly more time with their fathers each week (4.2 hours) in 1997 than in 1981(p=.003). This indicates that the similarity of time children spent with their fathers in all families between1981 and 1997 may be due at least in part to the negative effect of increasing single parenthood offsettingthe increased time with fathers in two-parent families. One of the more interesting results shown in thisgraph is that, although the time children spent with mothers or with fathers in two parent familiesincreased substantially, the increase in time spent with either parent was relatively small, and statisticallyinsignificant. This suggests that the amount of time children have both parents accessible to them at thesame time may have increased between 1981 and 1997.
Turning directly to the question of the effect of family structure on children’s time with mothers(analysis not shown), we find that in 1981, children in two-parent families spent more time with theirmothers (about 25 hours) than children in families with single mothers (about 21 hours). This differenceis marginally significant (p=.081), which is impressive given the small number of children in single-mother families (N=43) in our 1981 sample. This difference is more pronounced in 1997 (about 31 hoursper week with mothers in two parent families vs. 21 hours per week with single mothers), and highlysignificant (p=.000). These results, combined with those presented previously in figure 2 indicate thatthough time spent with mothers in two-parent families increased over the period, time with mothers insingle-parent families remained more or less constant. This is borne out by formal tests of the means;children in single-mother families did not spend significantly more or less time with their mothers in 1997than in 1981.
Maternal Labor Force ParticipationTo examine how children’s time with parents may have changed over the period in relation to
changes in mothers’ labor force participation, Figure 3 presents children’s mean time with mothers inboth periods, by whether the mother was working or not.
[Figure 3 about here]
5 Cases with extreme or implausible combinations of values for children’s time with parents wereremoved from all of the following analyses. A complete description of criteria used for removalis available from the corresponding author on request.6 And by implication, the difference over time in two parent families is greater than that in singleparent families. In fact, there is no significant difference between the two years in the amount oftime children in single parent families spent with mothers, fathers or either parent.
10
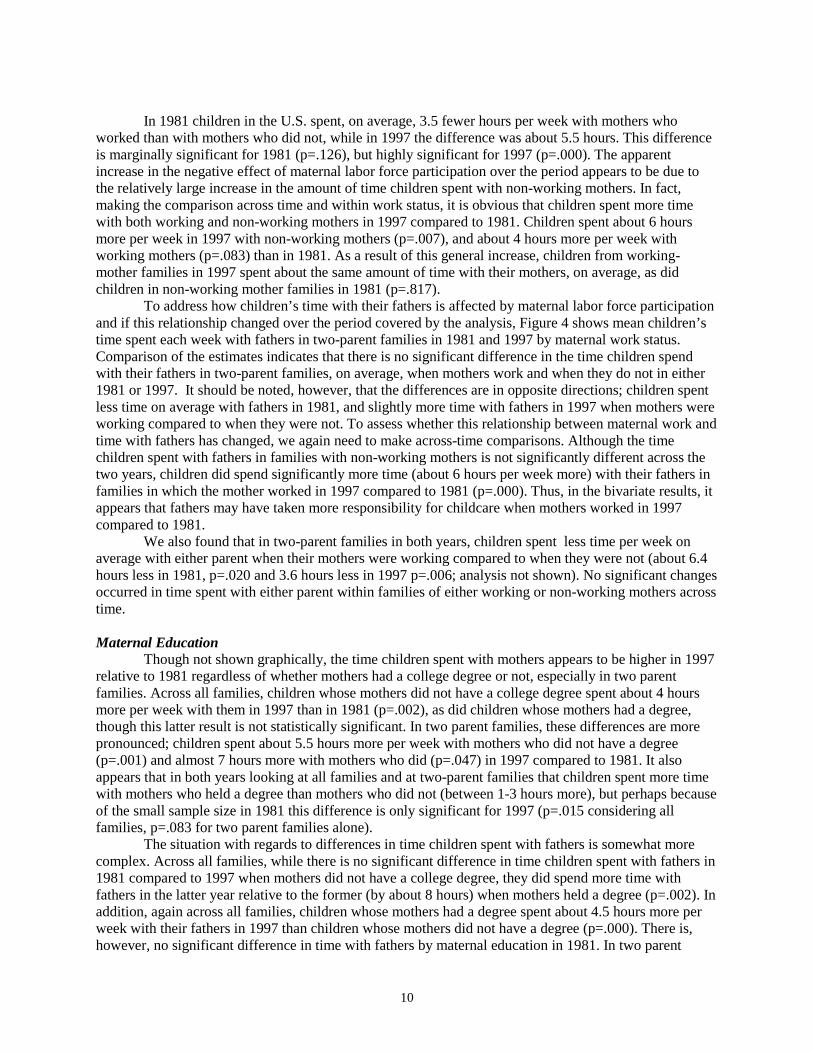
In 1981 children in the U.S. spent, on average, 3.5 fewer hours per week with mothers whoworked than with mothers who did not, while in 1997 the difference was about 5.5 hours. This differenceis marginally significant for 1981 (p=.126), but highly significant for 1997 (p=.000). The apparentincrease in the negative effect of maternal labor force participation over the period appears to be due tothe relatively large increase in the amount of time children spent with non-working mothers. In fact,making the comparison across time and within work status, it is obvious that children spent more timewith both working and non-working mothers in 1997 compared to 1981. Children spent about 6 hoursmore per week in 1997 with non-working mothers (p=.007), and about 4 hours more per week withworking mothers (p=.083) than in 1981. As a result of this general increase, children from working-mother families in 1997 spent about the same amount of time with their mothers, on average, as didchildren in non-working mother families in 1981 (p=.817).
To address how children’s time with their fathers is affected by maternal labor force participationand if this relationship changed over the period covered by the analysis, Figure 4 shows mean children’stime spent each week with fathers in two-parent families in 1981 and 1997 by maternal work status.Comparison of the estimates indicates that there is no significant difference in the time children spendwith their fathers in two-parent families, on average, when mothers work and when they do not in either1981 or 1997. It should be noted, however, that the differences are in opposite directions; children spentless time on average with fathers in 1981, and slightly more time with fathers in 1997 when mothers wereworking compared to when they were not. To assess whether this relationship between maternal work andtime with fathers has changed, we again need to make across-time comparisons. Although the timechildren spent with fathers in families with non-working mothers is not significantly different across thetwo years, children did spend significantly more time (about 6 hours per week more) with their fathers infamilies in which the mother worked in 1997 compared to 1981 (p=.000). Thus, in the bivariate results, itappears that fathers may have taken more responsibility for childcare when mothers worked in 1997compared to 1981.
We also found that in two-parent families in both years, children spent less time per week onaverage with either parent when their mothers were working compared to when they were not (about 6.4hours less in 1981, p=.020 and 3.6 hours less in 1997 p=.006; analysis not shown). No significant changesoccurred in time spent with either parent within families of either working or non-working mothers acrosstime.
Maternal EducationThough not shown graphically, the time children spent with mothers appears to be higher in 1997
relative to 1981 regardless of whether mothers had a college degree or not, especially in two parentfamilies. Across all families, children whose mothers did not have a college degree spent about 4 hoursmore per week with them in 1997 than in 1981 (p=.002), as did children whose mothers had a degree,though this latter result is not statistically significant. In two parent families, these differences are morepronounced; children spent about 5.5 hours more per week with mothers who did not have a degree(p=.001) and almost 7 hours more with mothers who did (p=.047) in 1997 compared to 1981. It alsoappears that in both years looking at all families and at two-parent families that children spent more timewith mothers who held a degree than mothers who did not (between 1-3 hours more), but perhaps becauseof the small sample size in 1981 this difference is only significant for 1997 (p=.015 considering allfamilies, p=.083 for two parent families alone).
The situation with regards to differences in time children spent with fathers is somewhat morecomplex. Across all families, while there is no significant difference in time children spent with fathers in1981 compared to 1997 when mothers did not have a college degree, they did spend more time withfathers in the latter year relative to the former (by about 8 hours) when mothers held a degree (p=.002). Inaddition, again across all families, children whose mothers had a degree spent about 4.5 hours more perweek with their fathers in 1997 than children whose mothers did not have a degree (p=.000). There is,however, no significant difference in time with fathers by maternal education in 1981. In two parent

11
families considered by themselves, the results with regards to time with fathers by maternal education aresimilar to those concerning time with mothers, with the exception that there is no significant difference bymaternal degree status in either 1997 or 1981.
The only significant difference by maternal degree status in the amount of time children spentwith either parent was in 1997, with children across all family types spending about 3 hours more(p=.012) and children in two-parent families about 2 hours more per week (p=.085) with either parentwhen their mothers held a degree.
Standardization of 1997 Estimates of Time Use to 1981 Demographic Rates
The next step in the analysis is to decompose the estimated change in children’s time with parentsbetween 1981 and 1997 by rates of maternal labor force participation (working/not working), familystructure (single parent/two parent), and maternal education (4 years of college/less than 4 years ofcollege). This common standardization procedure, also called ‘shift-share’ analysis (Gershuny &Robinson 1988; Williams 1991), decomposes the change in estimates over time into parts attributable tochanges in the structural composition of the population under analysis, those which are not (perhapsattributable to behavioral change), and the interaction of the two (a measure of the difference in theeffects of non-structural changes between the structural categories).
The decomposition equation used in this analysis is as follows:
( ) ( ) ( )( )212112112112 iii
iii
iiii
iii ttPPPPtttPtt −−+−+−=− ���
Where t is estimated mean time with parents, P is the estimated proportion of the population in categoryi, and the numeric subscripts indicate the year.7
The first term on the right side of the equation represents the contribution of non-structuralchange, the second, the difference in the estimates purely attributable to the structural changes, and thethird, the interaction term.
Structural vs. Non-Structural Effects: All Families Table 2 presents the change between the two years in the time children spent with parents across
all types of families decomposed into structural elements attributable to changes in family structure,maternal labor force participation, and maternal education, to non-structural elements, and to theinteraction between the two using both 1997 and 1981 as the base year. 8
Family Structure. As expected, the increase in the percentage of single parent families in thepopulation between the two years (columns 5 and 6) has a negative independent structural effect overallon the time children spent with their parents; in isolation, this change implies children would have spentbetween 0.12 and 0.3 fewer hours each week with mothers, about 1/2 an hour less with fathers, and about1/3 an hour less with either parent. That children’s time with mothers and fathers did not decrease over 7 Estimates of children’s time with parents in both years are taken from the time use surveys described earlier.Population proportions in each category for 1997 are taken from the PSID-CDS, the proportions for 1981 aretaken from the 1981 CPS due to the slight differences between this source and the 1981 sample.8 When the interaction term is large relative to another component the amount of change clearly attributable toeither structural and nonstructural elements may not be stable when the base year (t2 in equation 1) is switched,obscuring conclusions about the relative independent impact of each component of change. For this reason, thestandardizations are presented with both 1997 and 1981 as the base year. The reader should keep in mind thatthe signs for each component presented will, in most cases, be opposite for estimates using the two base years.For example, if children’s time with parents increased between 1981 and 1997 (as it did in most cases), thesign for total change will be positive using 1997 as the base year, and negative using 1981 as the base year.

12
the period, but actually increased, points to a more-than-compensating non-structural increase (about 4.5hours for time with mothers and about 3.7 hours for time with fathers). Though the compensating effectof non-structural increases in time children spent with either parent was not as large as for each parentseparately, it was large enough to fully offset the negative structural effect.
Maternal Labor Force Participation. The independent structural effect of increasing maternallabor force participation on children’s time with mothers is also negative and somewhat stronger than thatassociated with the change in the rate of single parenthood, though still slight. In isolation the change inthe proportion of children whose mothers were working would have resulted in children spendingbetween ½ and ¾ of an hour less with mothers in 1997 than in 1981 (columns 1 and 2). This effect ishowever offset by a large non-structural (or behavioral) effect. Contrary to expectations from the resultsof the previous section, the structural effect of increasing levels of maternal work on the time childrenspent with fathers was negative, though also small. Maternal work status has the strongest independentnegative structural effect on time children spent with either parent, but this was completely offset by apositive, potentially behavioral increase. 9
Maternal Education. The direct structural effects of increasing proportions of mothers with acollege degree in the population, though not the primary focus of this paper, are important to consider inthis context because of their potential behavioral correlates and relation to rates of maternal labor forceparticipation. The effect on time with mothers is, as expected, positive, but minor (columns 3-4). Thestructural effect of increasing levels of maternal education on time children spent with either parent is alsopositive, though again small. The direction of the structural effect on time with fathers here isindeterminate (the parameters for the structural element are negative in both base years). The interactionsfor time with fathers and either parent are relatively large in comparison to the main effects, but are mostpronounced for time children spent with fathers. This may reflect positive behavioral changes on the partof fathers due to changes in levels of maternal education, or equally likely, their own.
Looking at the combined effects of changes in maternal labor force participation and education(columns 9-10), it appears that the positive structural effects of increasing maternal education on timespent with mothers and either parent may have somewhat offset the negative effects of simultaneousincreases in the the proportion of mothers working outside the home.Structural vs. non-structural effects: two parent families
Though decomposing change due to structural and non-structural elements in the total populationis informative, interpretation of the effects may be clouded by considering all family types together. Next,we examine changes in children’s time with parents apart from changes in family structure by lookingseparately at two-parent families. Table 3 decomposes changes in children’s time with parents in thesefamilies into structural effects stemming from changing maternal labor force participation and education,non-structural effects, and the interaction between these two elements.
Maternal Labor Force Participation. For children in two-parent families, the expected structuraleffect of increasing female labor force participation (columns 1 and 2) is, as over all families, to reducethe average time children spend with their mothers or either parent. These effects, which are quite small(with implied decreases of about 2/3 of an hour per week), are offset by positive non-structural change,which is much larger than when looking at all families combined. This suggests, in comparison toprevious results across all families, that children in single parent families perhaps did not benefit to thesame extent as children in two-parent families from behaviorally influenced increases in time withmothers or either parent over the period. The implication is that single parenthood constrains the time 9 In light of the fact that the decompositions of maternal labor force and family structure may be biased by thehigher likelihood that a single mother will be in the labor force, a decomposition using the combineddistribution of these two variables is presented in columns 7-8. For time with mothers, fathers and with eitherparent the combined structural effects seem more or less additive.

13
children spend with mothers in ways not related to simply whether they are working or not, such asthrough scheduling constraints in time at work, which two-parent families may experience to a lesserdegree. The direction of the structural effect of increased maternal labor force participation on time spentwith fathers cannot be assigned because of the relatively large interaction effect.
Maternal Education. The effects of increasing proportions of mothers in two-parent families witha college degree between the two years, was again positive but slight, and the structural effect on changesin time children spent with fathers or either parent is indeterminate. As in suggested in the results for allfamilies, looking at the joint decomposition of changes in education and labor force participation(columns 5 and 6), increasing rates of female education appear to have somewhat offset the negativeeffect of increasing maternal labor force participation on children’s time with mothers.
Predictions Based on Regression Estimates
For the final analysis, we use estimates derived from OLS regressions of children’s time withmothers, fathers, and either parent in 1997 to make counterfactual predictions about what children’s timewith parents across all family types would have been like in 1997, had behavior been the same but thepopulation still had the same key demographic characteristics as in 1981. Using predicted children’s timeswith parents from these models, under the assumption of no demographic change between 1981 and 1997in comparison to actual estimates in both years is analogous to the simple standardization exercisepresented previously. The advantage is that now we can estimate the net structural effects of changes inall the demographic variables of interest (including changes in the number of children in the family),while controlling for relevant background variables. The results of these models are presented in Table 4.The means and standard deviations for the variables included in each of the models are presented inAppendix Table 1.
As expected, across all families, children’s time in 1997 with mothers, fathers, or either parent isstrongly reduced by living with a single parent. While the coefficients for both part-time and full-timematernal work are negative in the model for time children spend with their mothers, only the latter issignificant, and the effect is quite large. Under this model, children spend about 5 ¾ fewer hours eachweek with mothers working full time than with mothers who did not work at all, net of other factors. Thiseffect is similar for time children spend with either parent, though somewhat smaller in magnitude. Fortime children spend with fathers, though the coefficient for part-time maternal work is again negative, thecoefficient for full-time work is slightly positive; neither is statistically significant, however. Thecoefficients for maternal education and education of the household head in the models of children’s timewith mothers and fathers were positive, though again not significant. Education of the household head,however, does have a significant effect on time children spent with either parent, with children fromfamilies in which the head of the household had four years or more of college spending about 3.4 hoursper week on average with at least one of their parents than children in families in which the head of thehousehold did not. Each additional child in the family is estimated in all 3 models to slightly increase timeany given child (other things being equal) spends with their mother or either parent, but none of thecoefficients is significantly different from 0.
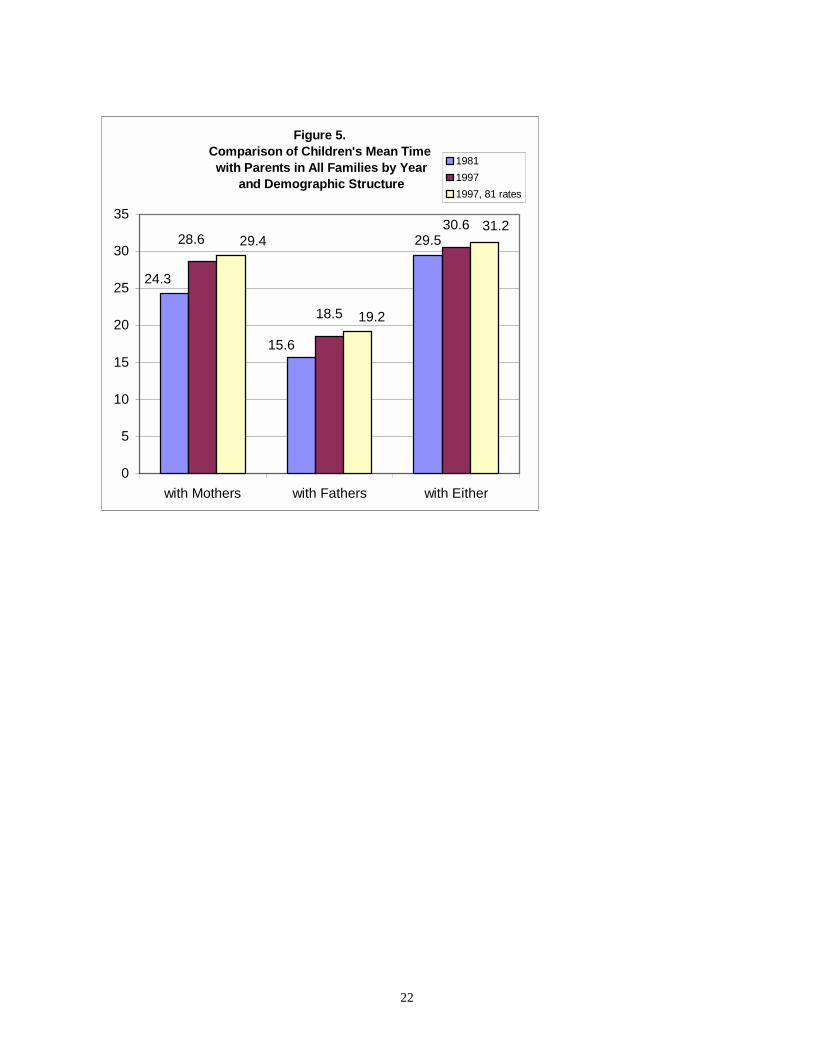
Counterfactual EstimatesFigure 5 presents children’s weekly time with mothers, fathers, and either parent across all family
types. The chart contains 3 estimates for each category of time use. The first and second bars in eachcategory are the sample estimates from the 1981 and 1997 data, respectively, which we have seen before.The third bar in each group is the predicted estimate for 1997, holding rates of single parenthood, femalelabor force participation, maternal education and the mean number of children in families constant at
14
1981 levels, as derived from the CPS child-based file. 10 The differences between the actual 1981estimates and the 1997 estimates adjusted for 1981 demographics represent non-structural, potentiallybehavioral, change. The differences between the actual and adjusted 1997 estimates provide a measure ofchange attributable to shifts in the demographic variables under consideration, under the assumption thatthe 1997 regression models would have held if these characteristics had not changed.11
The chart indicates that the combined changes in the demographic structure of the population asmodeled would have been associated with slight decreases of less than 1 hour in children’s weekly timewith both mothers, fathers, and either parent. For time with mothers, this decrease was, as in thestandardization analysis, offset by more than compensating non-structural, or behavioral change ofapproximately 5 hours, leading to the net increase of about 4.3 hours. All structural changes consideredtogether would imply only a slight decrease in the average amount of time children spent with theirfathers in the population as a whole, which is offset by a non-structural increase. The situation is the samewith regard to time with either parent, but the compensating effect of behavioral change is not as large asthat seen considering time with mothers or fathers separately. One could argue that this negligible effectof combined structural change across the dimensions under consideration may be the result of the positiveeffects of increasing maternal/head education offsetting the negative aspects of change associated withincreased single parenthood and maternal labor force participation. Though true, eliminating educationalchange from these models results in an almost trivial increase in the combined structural effect, of 0.1and 0.2 hours for the models of time with mothers and fathers, respectively, and 0.3 hours for time witheither parent.
In two-parent families (analysis not shown) the predominance of behavioral effects on children’stime use is more pronounced. Consistent with our decomposition results presented earlier, little of thechange in children’s time with mothers, and virtually none of the change in time with fathers or eitherparent in two parent families is attributable to the combined shifts in education, maternal employment, orfamily size.
SUMMARY AND CONCLUSIONS
This paper has attempted to separate the differences between 1981 and 1997 in the time childrenspent with parents due to changes in structural factors such as rates of single parenthood, maternalemployment, maternal education, and family size from those due to non-structural or behavioral changesamong families with similar characteristics.
American families have experienced dramatic changes over the past two decades. The increasesin percentages of families headed by single parents and families in which both parents work are welldocumented. We found that, overall, American children spent more time with their mothers and no lesstime with their fathers or either parent in 1997 than they did 16 years earlier, and that, contrary to popularbelief, structural changes in the population have not diminished the time children in the U.S. spend withtheir parents.
10 These estimates were also prepared using sample estimates from the 1981 Time Use Longitudinal PanelStudy data, and results were nearly identical. Since there are some biases in this small sample, however, theCPS estimates were used.11 Two questions need to be addressed here. First, it could be argued that some of the change presented here asnon-structural may in fact be due to changing characteristics of the population other than the four underanalysis here, and to a certain extent this is possible. In all cases in Figure 5, estimates of structural change dueto changes in the control variables are almost 0, and when they are not, their effects were to mute totalstructural change (analysis not shown). As such, the results presented are conservative estimates of non-structural change. Second, differences between the counterfactual 1997 estimates and the actual sampleestimates will necessarily also include the behavioral/structural interaction component seen in thestandardization analyses. Results from that section suggest that these effects are generally small.
15
Though the effects of changes in family structure as measured by rates of single parenthood andmaternal labor force participation were indeed negative, they were in all instances quite small. The effectsof structural changes in maternal education, which had a positive impact on children’s time with parents,were also found to be negligible.
Using several different methodologies, this research finds that, across all families consideredtogether, behavioral changes generally outweighed the effects of changing demographics. Without suchbehavioral change, it is possible that children would have spent less time with mothers, fathers or eitherparent in 1997 compared to 1981.
The overall picture presented by analyses including all family types is somewhat misleading,however. Though the most important structural factor affecting children’s time with parents in thepopulation as a whole between the two years was the increase in rates of female labor force participationrather than the increase in percentages of children living in single parent families, the most importantstatic factor affecting the time children spent with parents in both years was living in a family with asingle parent. While there have been positive and dramatic increases in children’s time with mothers,fathers, and both parents in two-parent families, these are not paralleled for children in single-parentfamilies. Whereas parents may be able to make up for time with children lost due to maternalemployment, they cannot compensate for the absence of a parent in the home. That said, we found thatchildren living in single-parent households in 1997 did not spend any less time with parents than suchchildren did in 1981, all else being equal.
Because of the strong effect of single parenthood on our estimates for the entire population, weexamined two parent families separately. The behavioral increases over the period for mothers, fathers,and either parent are, as noted above, highly pronounced in these families. The minor structural effects ofincreased female labor force participation were completely offset by large, non-structural (most likelybehavioral) increases in time children spend with their parents. Time with mothers in two-parent familiesgenerally increased over the period, regardless of whether mothers were working or not, but time withfathers only increased significantly in families in which mothers were working.
We believe these analyses have shown to be largely unfounded assertions that children spendless time with parents today than several decades ago because of changes in maternal labor marketbehavior and in patterns of family formation and dissolution. .

16
References
Alwin, Duane F. 1996. Parental Socialization in Historical Perspective. In The Parental Experience inMidlife. Carol D. Ryff and Marsha M. Seltzer (eds.). pp. 105-167. Chicago: University ofChicago Press.
Asmussen, Linda and Reed Larson. 1991. “The Quality of Family Time Among Young Adolescents inSingle-Parent and Married-Parent Families.” Journal of Marriage and the Family 53:1021-1030.
Bianchi, Suzanne. 2000. “Maternal Employment and Time with Children: Dramatic Change or SurprisingContinuity?” Demography 37:401-414.
Bianchi, Suzanne and John P. Robinson. 1997. “What Did You Do Today? Children's Use of Time,Family Composition, and the Acquisition of Social Capital.” Journal of Marriage and the Family59:332-44.
Binder, D. A. 1983. “On the variances of asymptotically normal estimators from complex surveys.”International Statistical Review 51: 270-292.
Blankenhorn, David. 1995. Fatherless America: Confronting our most Urgent Social Problem. NewYork: Basic Books.
Brayfield, April. 1995. “Juggling Jobs and Kids: The Impact of Work Schedules on Fathers' Caring forChildren.” Journal of Marriage and the Family 57:321-32.
Bryant, W. Keith and Cathleen D. Zick. 1996a. “An Examination of Parent-Child Shared Time.” Journalof Marriage and the Family 58:227-237.
________. 1996b. “Are We Investing Less in the Next Generation'?: Historical Trends in Time spent withChildren.” Journal of Family and Economic Issues. 17:365-392.
Casper, Lynne M. and Martin O’Connell. 1998. “Work, Income, the Economy, and Married Fathers asChild-Care Providers.” Demography 35:243-250.
Council of Economic Advisers. 1999. Families and the Labor Market, 1969-1999: Analyzing the “TimeCrunch.” Washington, DC: Council of Economic Advisers.
Fitzgerald, John, Peter Gottschalk, and Robert Moffitt. 1998a. “An Analysis of Sample Attrition in PanelData: The Michigan Panel Study of Income Dynamics.” Journal of Human Resources 33(2):251-99.
Gershuny, Jonathan and John P. Robinson. 1988. “Historical Changes in the Household Division ofLabor.” Demography 25(4):537-52.
Harris, Kathleen Mullan and S. Philip Morgan. 1991. “Fathers’ Involvement in Parenting Sons andDaughters.” Journal of Marriage and the Family 53:531-544.
Hernandez, Donald J. 1993. America's Children: Resources from Family, Government and the Economy.New York: Russell Sage.
Hewlett, Sylvia Ann. 1991. When the bough breaks: The cost of neglecting our children. New York:Basic Books.
Hofferth, Sandra L. Forthcoming. Women’s Employment and Care of Children in the United States. In T.Van der Lippe & L. Van Dijk (Eds.), Women's Employment in a Comparative Perspective. NewYork: Aldine de Gruyter.
________. 1999. Family Reading to Young Children: Social Desirability and Cultural Biases inReporting. Paper presented at. Workshop on Measurement of and Research on Time Use,Committee on National Statistics, Washington, DC: National Research Council, May 27-28.
Juster, F.Thomas and Frank P. Stafford. 1985. Time, Goods, and Well-Being. Ann Arbor, MI: Institute forSocial Research.
Leibowitz, Arleen. 1974. “Education and Home Production.” American Economic Review 64(2):243-50.Marini, Margaret M. and Beth Anne Shelton. 1993. “Measuring Household Work: Recent Experience in
the United States.” Social Science Research 22:361-82.Martin, Teresa Castro and Larry L. Bumpass. 1989. “Recent Trends in Marital Disruption.” Demography
26:37-51.

17
Nock Steven L. and Paul W. Kingston. 1988. “Time with children: the impact of couples work-timecommitments.” Social Forces 67(1):59-85
Presser, Harriet. 1989. “Can We Make Time for Children? the Economy, Work Schedules, and ChildCare?” Demography 26(4):523-43.
Robinson, John P. and Geoffrey Godbey. 1997. Time for Life: The Surprising Ways Americans Use TheirTime. University Park, PA: Pennsylvania State University.
Skinner, C.J. and T.M.F. Smith, eds. 1989. Analysis of Complex Surveys. New York: John Wiley andSons.
Task Force on Youth Development and Community Programs. 1992. A Matter of Time: Risk andOpportunity in the Non-school Hours. New York: Carnegie Corporation.
Timmer, Susan G., Jacquelyn Eccles, and Keith O'Brien. 1985. “How Children Use Time.” Pp. 353-82 inTime, Goods, and Well-Being, edited by F.T. Juster and F.P. Stafford. Ann Arbor, MI: Institutefor Social Research.
U.S. Bureau of the Census. 1984. “Childspacing Among Birth Cohorts of American Women: 1905-1959.” Current Population Reports Series P-20(385).
________. 1988. “Fertility of American Women: June 1987.” Current Population Reports P-20(427).________. 1998. “Family Composition Begins to Stabilize in the 1990s.” <www.census.gov/Press-
Release/cb98-88.html>.________. 1999. Statistical Abstract of the United States 1998. Washington, DC: U.S. Government
Printing Office.Whitehead, Barbara Defoe. 1991. “The Family in an Unfriendly Culture.” Family Affairs 3(1-2):1-6.Williams, Donald R. 1991. “Structural Change and the Aggregate Poverty Rate.” Demography 28
(2):323-332.
18
Figure 1.Childrens' Mean Time with Parents in all Family
Types, by Year
24.30
15.62
29.14
18.57
28.58 30.62
0
5
10
15
20
25
30
35
with Mothers with Fathers with Either
Wee
kly
Hou
rs E
ngag
ed o
r Acc
essi
ble
1981
1997

19
Figure 2.Children's Mean Time with Parents in
Two- Parent Families by Year
30.89
18.51
25.05
30.87
33.24
22.73
0
5
10
15
20
25
30
35
with Mothers with Fathers with Either
Wee
kly
Hou
rs E
ngag
ed o
r Acc
essi
bl
1981
1997

20
Figure 3.Children's Mean Time with Mothers by Mothers'
Work Status and Year, All Families
26.5422.52
26.06
32.05
0
5
10
15
20
25
30
35
Non-working WorkingMothers' Work Status
Wee
kly
Hour
s Ei
ther
Eng
aged
or
Acce
ssib
le19811997

21
Figure 4.Children's Mean time with Fathers in Two Parent
Families, by Mothers' Work Status and Year
19.97 17.01
22.40 22.94
0
5
10
15
20
25
30
35
Non-working WorkingMothers' work Status
Wee
kly
Hou
rs E
ither
Eng
aged
or
Acce
ssib
le
19811997
22
Figure 5. Comparison of Children's Mean Time with Parents in All Families by Year
and Demographic Structure
29.5
24.3
15.6
18.5
28.630.6
29.4
19.2
31.2
0
5
10
15
20
25
30
35
with Mothers with Fathers with Either
198119971997, 81 rates

23
Table 1. Sample Characteristics of U.S. Children’s Families AcrossKey Demographic Variables
‘81 CPS ‘81 Sample ‘97 CDSMaternal Labor Force Participation 50% 50% 63%Maternal college degree 13% 14% 23%Single mother families 18% 18% 22%Number of children in the household 2.7 3.1 2.5Source: compiled by authors. Data from Current Population Survey, March 1981, Time Use in Economicand Social Accounts, 1975-1976, and the 1997 Child Development Supplement to the Panel Study ofIncome Dynamics.

24
Table 2. Decomposition of Structural and Behavioral Elements of Changes in Estimates of Children’s Weekly Mean Time (in hours) withParents in All Families , 1981-1997
Maternal LaborForce Participation
Maternal education Family Structure Maternal Labor ForceParticipation andFamily Structure
Maternal LaborForce Participation
and MaternalEducation
(1) (2) (3) (4) (5) (6) (7) (8) (9) (10)Base Year Base Year Base Year Base Year Base Year
1997 1981 1997 1981 1997 1981 1997 1981 1997 1981with Mothers Behavioral 5.00 -4.74 4.02 -4.07 4.64 -4.46 5.31 -4.75 4.73 -4.40
Structural -0.46 0.71 0.27 -0.32 -0.12 0.30 -0.48 1.04 -0.12 0.45Interaction -0.25 -0.25 0.04 0.04 -0.18 -0.18 -0.56 -0.56 -0.33 -0.33Total* 4.29 -4.29 4.34 -4.34 4.34 -4.34 4.27 -4.27 4.28 -4.28
with Fathers Behavioral 3.09 -3.35 2.49 -3.18 3.72 -3.64 3.74 -3.96 2.62 -3.36Structural -0.39 0.13 -0.22 -0.46 -0.46 0.54 -0.97 0.75 -0.48 -0.26Interaction 0.25 0.25 0.68 0.68 -0.07 -0.07 0.23 0.23 0.74 0.74Total 2.96 -2.96 2.96 -2.96 3.18 -3.18 2.99 -2.99 2.88 -2.88
with Either Behavioral 2.04 -2.03 1.17 -1.44 1.95 -1.89 2.40 -2.23 1.75 -1.88Structural -0.55 0.55 0.06 -0.33 -0.28 0.34 -0.75 0.93 -0.41 0.27Interaction -0.01 -0.01 0.27 0.27 -0.06 -0.06 -0.18 -0.18 0.14 0.14Total 1.48 -1.48 1.50 -1.50 1.61 -1.61 1.47 -1.47 1.48 -1.48
Source: compiled by authors the Current Population Survey, March 1981: After-tax money income estimates, the Time Use Longitudinal Panel Study, 1975-1981and 1997 Child Development Supplement to the Panel Study of Income Dynamics.*Note that slight differences in totals are due to differences in estimates due to use of listwise deletion of item missing cases.

25
Table 3. Decomposition of Structural and Behavioral Elements of Changes in Estimates ofChildren’s Weekly Mean Time (in hours) with Parents in Two Parent Families, 1981-1997
Maternal Labor ForceParticipation
Maternal education Maternal labor forceparticipation and
education
(1) (2) (3) (4) (5) (6)Base Year Base Year Base Year
1997 1981 1997 1981 1997 1981With Mothers Behavioral 6.42 -6.49 5.53 -5.73 6.12 -6.29
Structural -0.66 0.59 0.11 -0.31 -0.51 0.34Interaction 0.07 0.07 0.19 0.19 0.17 0.17Total 5.83 -5.83 5.84 -5.84 5.78 -5.78
With Fathers Behavioral 4.15 -4.57 4.01 -4.40 3.99 -4.70Structural -0.35 -0.07 -0.18 -0.21 -0.50 -0.21Interaction 0.42 0.42 0.39 0.39 0.71 0.71Total 4.22 -4.22 4.22 -4.22 4.21 -4.21
With Either Behavioral 2.79 -3.13 2.08 -2.55 2.52 -3.20Structural -0.76 0.42 -0.18 -0.29 -0.86 0.18Interaction 0.34 0.34 0.47 0.47 0.68 0.68Total 2.37 -2.37 2.37 -2.37 2.34 -2.34
Source: compiled by authors the Current Population Survey, March 1981: After-tax money income estimates, theTime Use Longitudinal Panel Study, 1975-1981 and 1997 Child Development Supplement to the Panel Study ofIncome Dynamics.

26
Table 4. OLS Coefficients from the Regression of Children’s WeeklyHours with Parents Either Engaged or Accessible on SelectIndependent Variables: United States 1997Independent Variable With Mothers With Fathers With Either
Constant 38.935** 27.955** 41.592**Family type (0=two parent) -9.039** -18.012** -10.709**Mother part time work -1.864 -0.872 -1.203Mother full time work -5.760** 0.715 -3.743**Mother College Degree (0=no degree) 1.852Head College Degree (0=no degree) 1.703 3.443**Mother age -0.182Head age -0.145* -0.217*Child Age binary (0=under 6 years old) 4.500** 0.626 4.695**Child Sex (0=males) 0.626 -0.660 0.033Number of children in family 0.388 0.059 0.676Age of youngest child -0.400 -0.083 -0.433*Black -0.266 -2.126* -0.960Family income ($10,000) 0.052 0.058 -0.022*
Number of families 1486 1478 1478Number of children 2043 2033 2033F 14.30 43.81 16.24
(df) (11, 1475) (11, 1467) (11,1467)R2 .1535 .2845 .1684Source: compiled by authors. Data from the 1997 PSID-CDS. Note: *p <.05, **p <.01

27
Appendix table 1. Means from the Regression of Children’s Weekly Hours withParents Either Engaged or Accessible on Select Independent Variables,All Families: United States 1997
Mothers Fathers EitherMean Std. Dev.* Mean Std. Dev. Mean Std. Dev.
Dependent variable 28.571 16.086 18.527 14.949 30.499 16.317Family type (0=two parent) 0.220 0.414 0.221 0.415 0.221 0.415Mother part time work 0.220 0.414 0.221 0.415 0.221 0.415Mother full time work 0.410 0.492 0.410 0.492 0.410 0.492Mother College 0.228 0.420Head College (0=no college) 0.273 0.446 0.273 0.446Mother age 36.286 7.440Head age 37.933 7.796 37.933 7.796Child Age binary (0=under 6 years old) 0.294 0.456 0.294 0.456 0.294 0.456Child Sex (0=males) 0.489 0.500 0.488 0.500 0.488 0.500Number of children in family 2.477 1.155 2.478 1.157 2.478 1.157Age of youngest child 5.610 3.235 5.618 3.239 5.618 3.239Black 0.162 0.369 0.163 0.370 0.163 0.370Family income ($10,000) 5.109 4.501 5.126 4.511 5.126 4.511
Number of families (n) 1486 1478 1478Number of children (n) 2043 2033 2033Source: compiled by authors. Data from 1997 PSID-CDS. *Note: Standard deviations presented not adjusted forsampling of multiple children within a household.