john baldwin day - spectral line...
TRANSCRIPT
JOHN BALDWIN DAY - SPECTRAL LINE IMAGING
Melvyn Wright
May 20, 2011
1

IN MEMORY OF JOHN BALDWIN
John B was my PhD advisor. I was the first research student on the new Half Mile Telescope. My job
was commissioning both spectral line and polarization aperture synthesis. This was a great privilage
although I was too young to realize it at the time. The HMT comprised of two 30-foot antennas and
a novel, analog, time domain XF correlator – which is a fancy name for a 1 km coax cable tapped at
11m intervals to give a series of time delayed signals from the two antennas. The Fourier transform of
the sampled cross correlations gives the spectrum of the radio signal. Something dreamed up by John B.
Chris Fields designed and built this spectrometer for his PhD. I tested it using the Wurtzburg antennas
at Lordsbridge. It did not work very well. It could detect only the brightest radio sources like Cas A and
the Sun.
I wrote a spoof paper on setting astronomically significant limits from non-detections with an instrument
that could not detect known radio sources. John took it in his stride, but he was happier with more
positive results. John had a terrific sense of humor.
There were several well defended opinions why the spectrometer did not work as expected. These took
place between the benches in the electronics lab in the Old Cavendish. I wrote in my thesis: ” I am
indebted to Professor Ryle for a discussion about the spectrometer, which suggested that the fault was
with the low frequency ( 0-5MHz) part of the spectrometer, and to an argument between Dr D.M.A.
Wilson and Dr P. F. Scott which clarified my ideas on detectors.”
The spectrometer was only looking at the peak signal power and not integrating over the sampling interval.
The problem was solved with a circuit re-design and several happy afternoons with a soldering iron sitting
in the sun outside the lab at Lordsbridge re-building the 71 amplifiers attached to the delay cable.
2

The Half Mile Telescope made the first spectral line aperture synthesis images. The 1 arcmin resolution
in a 96 arcmin field of view and 39 km/s resolution of the spectrometer were well matched for observing
HI in nearby spiral galaxies.
Wikipedia: The Half Mile Telescope ...
”Used for Hydrogen Line studies of nearby galaxies and produced the first good radio maps of hydrogen
distribution (as a function of its velocity), for M33 and M31 (also produced nearly 20 PhDs and 50
published papers).”
I observed M33 in 1969, Darrel Emerson observed M31 in 1970. The HI observations of M33 took from
July to October, in order to accumulate aperture synthesis data at 60 spacings from 40 to 1200 feet. Each
day I traveled by scooter to Lordsbridge to set up the observations for the night with stop at the pub; 4
min earlier each day. Eventually I had to skip the visit to the pub en route.
John B, with John Shakeshaft, John Jennings, Peter Warner and Donald Wilson also pioneered polariza-
tion imaging with the Half Mile Telescope. It was a wonderfully creative group of people to work with.
These were the first polarization aperture synthesis data, so there were a few details to be worked out.
One of which was calibration of the relative gains of X and Y polarizations. This was a problem until
John said why don’t we just put a calibration dipole in each antenna at 45 degrees to the X and Y feeds
and measure the XY gains. So we did. It worked, and using a polarized source has become a standard
calibration for polarization imaging.
John B was a can-do person. His enthusiasm was contagious. Research with John was fun. He brought
out the best in his students.
I remember field days with all hands at Lordsbrdge carrying cables to reconfigure the Hewish array with
3

John B as cheer leader.
John B pursued both spectral line and polarization aperture synthesis imaging with the Half Mile Tele-
scope. After M33 and M31, polarization observations continued with IC443, imaged by Ian Hill.
Two more antennas were added in 1972, and several other galaxies were imaged in HI.
Winter, A. 1975, A study of the neutral hydrogen near the interacting galaxies NGC 4631 and NGC 4656
Cottrell, G. A. 1976 An aperture synthesis study of the irregular galaxy Holmberg II.
Cottrell, G. A. 1976 An aperture synthesis study of H I in the irregular II galaxy NGC 3077.
Cottrell, G. A. 1977. 21-cm observations of the interacting galaxies M81 and M82
Allsopp, N. J. 1978-1979 HI in the dwarf irregular galaxy Leo A, peculiar early-type galaxy NGC 3718,
NGC 1023 and IC 239, CVn I group. I - NGC 4136, 4144, 4190, IC 4182 and DDO 133.
There were also HI observations of M101 and of M51
Keith Newton repeated the M33 HI observations with twice the resolution.
Steve Unwin repeated the M31 HI observations with twice the resolution.
After the Half Mile Telescope, all aperture synthesis telescopes were spectral line instruments.
With the discovery of molecular line emission at millimeter wavelengths, spectral line observations became
an essential tool in understanding the structure and evolution of stars and galaxies, and gave us a measure
of the gas reservoirs in star-burst galaxies at high redshift.
Focusing on some telescopes I have helped to develop and use:
Jack Welch and Charles Townes discovery of interstellar H2O and NH3 at Hat Creek opened up molecular
4
line spectroscopy.
Richard Hills and Jack Welch built a 2-element interferometer at Hat Creek which showed that H2O
masers were closely associated with star formation. The Hat Creek interferometer expanded into the
10-antenna BIMA millimeter wavelength aperture synthesis array which mapped comets, star formation
regions, stellar envelopes, and galaxies in molecular tracers such as CO, 13CO, HCN, HCO+, CH3OH,
CH3CN........ Interstellar chemistry became an astronomical discipline and used as a diagnostic tool for
the evolution of star forming molecular clouds.
We build spectral line correlators capable of mapping dozens of spectral lines simultaneously in multiple
spectral windows spanning 10’s of GHz.
Thus we can trace John’s influence to the current telescope arrays at CARMA, SMA, IRAM, and the
future ALMA.
John’s legacy and work continues through his students and their students. John’s hands-on approach has
continued in the summer schools that I have organized and taught at Hat Creek and CARMA for the last
25 years. This school has trained students from all over the world. Many of these students are now the
interferometry experts at major universities and observatories.
John B was a mentor, a colleague and a friend. I’ll miss him. Thank you John, for the inspiration of
those early days.
5

Figure 1: M33 mapped in HI line emission with Half Mile Telescope. K. Newton, 19806
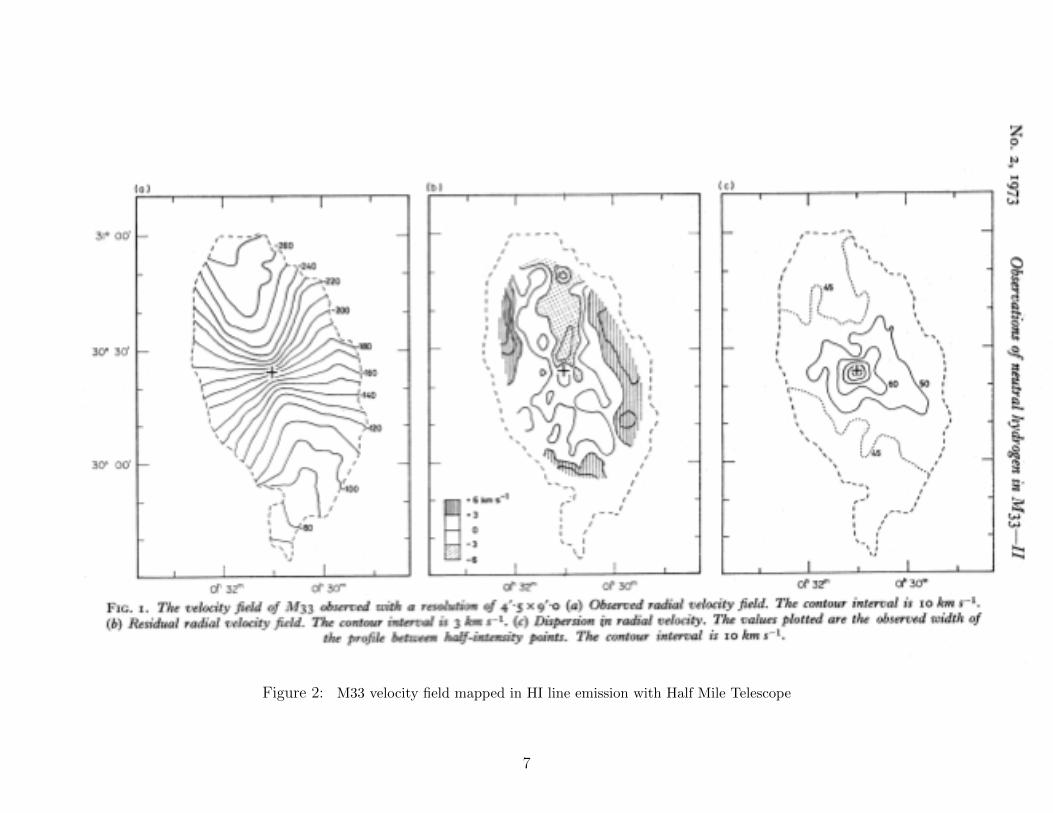
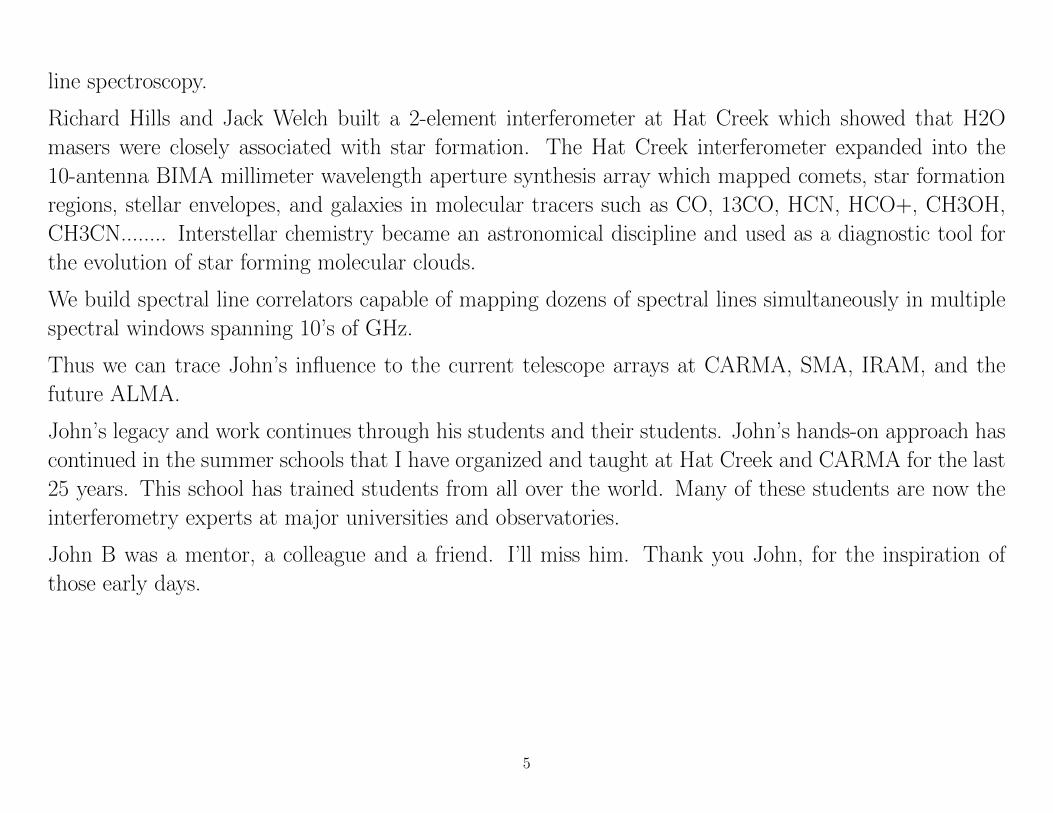
Figure 2: M33 velocity field mapped in HI line emission with Half Mile Telescope
7

Figure 3: M81 and M82 mapped in HI line emission with Half Mile Telescope. G. Cottrell, 19778

Figure 4: Allen Telescope Array 2000-2011. 42 antennas, with 4 simultaneous RF bands in the range 0.7 to 11 GHz. 4 100 MHz bandwidth,1000 channel correlators, 3 beamformers. Used for radio surveys, HI in spiral galaxies, radio transient surveys, SETI.
9

Figure 5: M31 HI distribution imaged with the Allen Telescope Array. 7-pointing mosaic with 8 hours per pointing. Garrett Keating, UCB.
10

Figure 6: The CARMA 23-element interferometer at Cedar Flat. Heterogeneous array with six 10 m, nine 6 m, and eight 3.5 m antennas providingprojected antenna spacings from 3.5 m to 2 km. Receivers at 1cm, 3mm, and 1.3 mm. 4 GHz bandwidth correlator providing 16 spectral windows. Usedfor imaging star formation regions, galaxies, planets, protoplanetary disks, molecular clouds, galaxy clusters. Recent 1.3 mm VLBI using telescopes inArizona, California and Hawaii with phased arrays at CARMA and SMA detected 30 microarcsec structure in the 4 million solar mass Black hole atthe Galactic center.
11
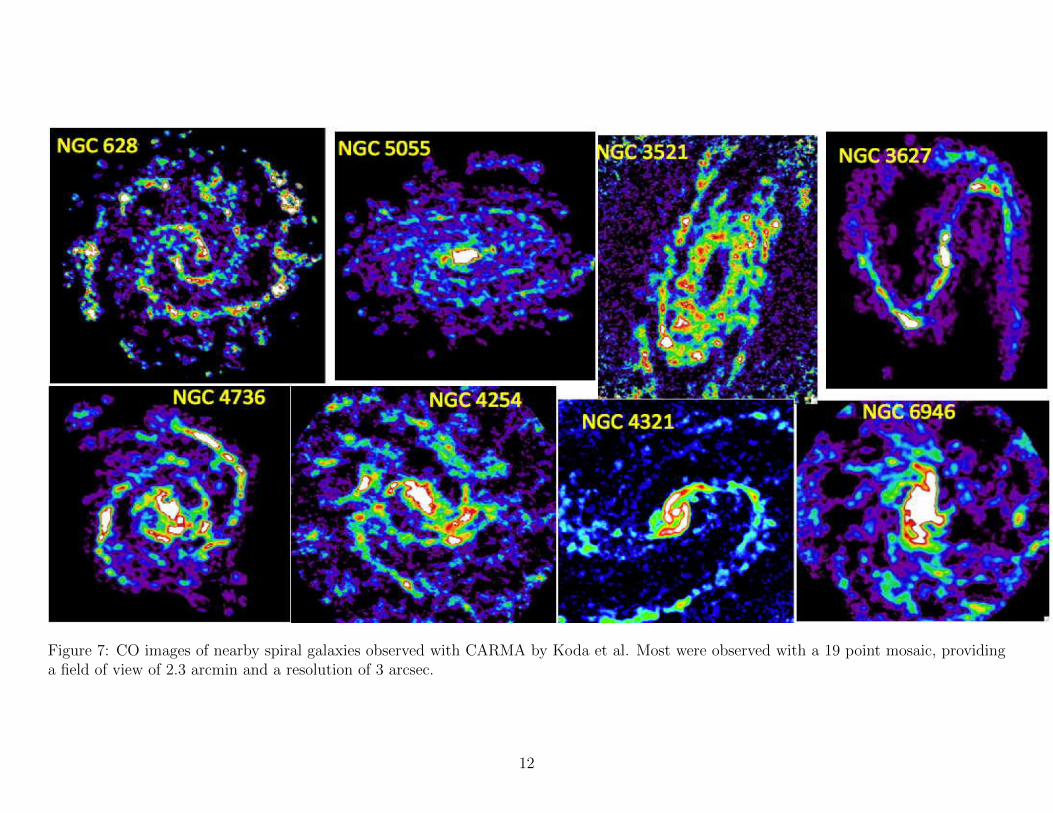
Figure 7: CO images of nearby spiral galaxies observed with CARMA by Koda et al. Most were observed with a 19 point mosaic, providinga field of view of 2.3 arcmin and a resolution of 3 arcsec.
12
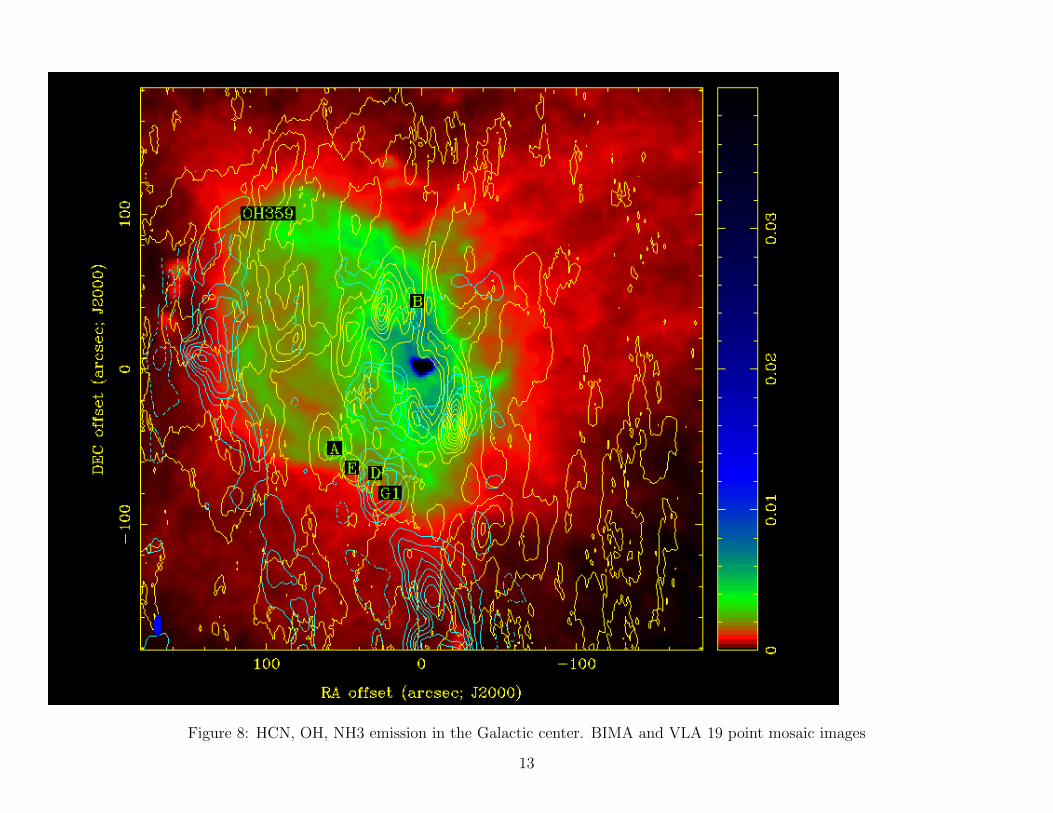
Figure 8: HCN, OH, NH3 emission in the Galactic center. BIMA and VLA 19 point mosaic images
13
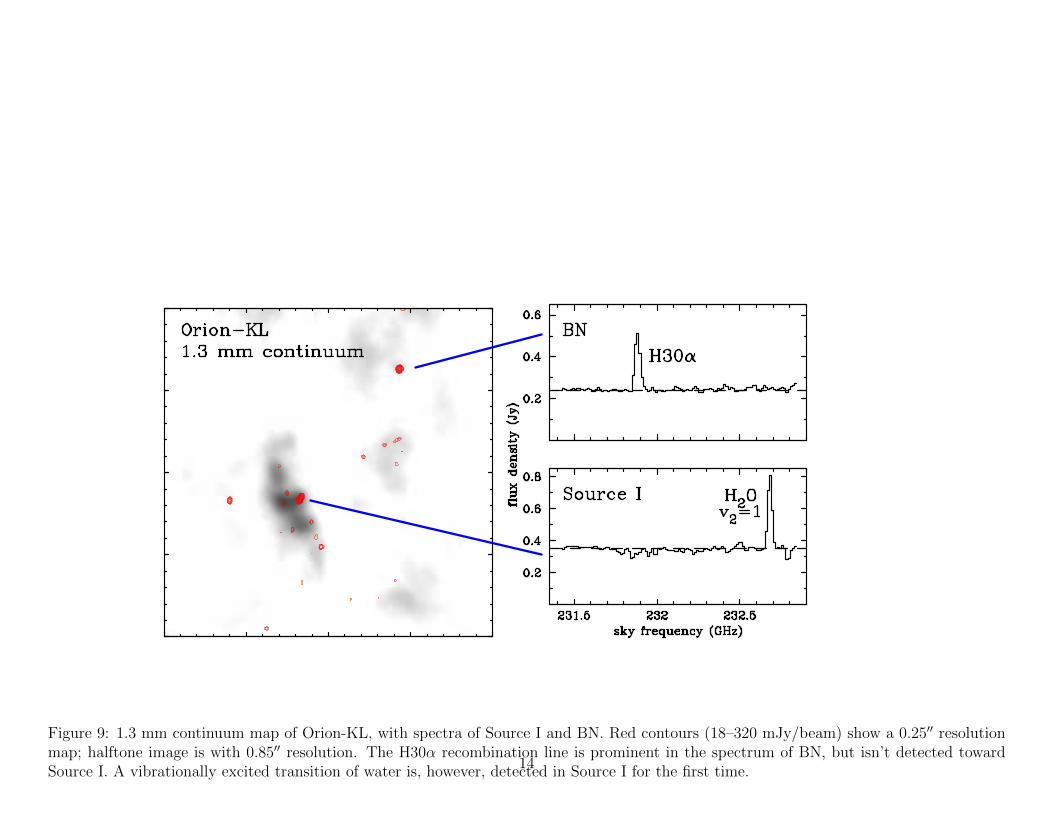
Figure 9: 1.3 mm continuum map of Orion-KL, with spectra of Source I and BN. Red contours (18–320 mJy/beam) show a 0.25′′ resolutionmap; halftone image is with 0.85′′ resolution. The H30α recombination line is prominent in the spectrum of BN, but isn’t detected towardSource I. A vibrationally excited transition of water is, however, detected in Source I for the first time.
14

Figure 10: Paired Antenna Calibration System using 3.5 m antennas at 30 GHz. The 3.5 m antennas are paired with 6.1 and 10.4 m antennasmaking science observations at millimeter wavelengths. The 3.5 m antennas simultaneously observe calibration sources in the 1 cm band.For calibration sources within a few degrees, the millimeter wavelength observations of the science target source, and the observations ofthe calibrator at 1cm, sample similar atmospheric phase fluctuations, allowing us to correct for the atmospheric phase fluctuations on longbaselines at millimeter wavelengths.
15