jobm sfqpsu - european commission · funding scheme cp/strep period covered june 1, 2008 to may 31,...
TRANSCRIPT

public report
HYDROSYS is a EC funded Seventh Framework programme STREP project (grant 224416, DG INFSO) on spatial analysis tools for on-site environmental monitoring and management.
Final report
The HYDROSYS final report, specifying objectives, science and technology results, and expected impact

HYDROSYS (224416) – D1.7 Final report, July 29, 2011 2
D1.7 Final report Grant agreement number 224416 Project acronym HYDROSYS Project title Advanced spatial analysis tools for on-site environmental monitoring and management Funding scheme CP/STREP Period covered June 1, 2008 to May 31, 2011 Project coordinator name, title and organization Technische Universität Graz Institute for Computer Graphics and Vision Dr. Ernst Kruijff phone: +43 316 873-5055 fax: +43 316 873-5050 mail: [email protected] Project website http://www.hydrosysonline.eu

HYDROSYS (224416) – D1.7 Final report, July 29, 2011 3
Results achieved Which significant results were achieved?
Goals and reasons What were the major goals of the project, what were the reasons to perform the project?
Users Who can benefit from the results of the project?
To support on-site environmental monitoring and management through provision of an innovative on-site monitoring system comprised of a sensor network and mobile clients, and analyze the various factors that contribute to potential impact, both from a usefulness and usability stance. The particular focus was on improved small-scale analysis through detailed spatio-temporal environmental data. In this context, the enhanced ability to (a) more easily capture spatial and temporal variability of environmental parameters, (b) manage and integrate real time sensor data with other heterogeneous data including simulations based on improved environmental models and (c) advance environmental understanding and decision making processes based on innovative mobile interactive visualization tools as to complement office-only work were the main goals. Such a system has not been available. With the improved knowledge gained, it is expected that in particular more complex and poorly understood environmental processes and associated problems might be better understood, discussed and mitigated in the future.
• An innovative on-site monitoring system prototype, consisting of a prototypical but usable data pipeline that handles sensor data acquisition, management of heterogeneous data and interactive visualization to truly support analysis and management of environmental processes through on-site activities
• Sensor innovations, including terrain model and thermal imaging improvements through blimp capturing, a newly developed mobile sensor – client unit, and multi-camera support for improved site understanding
• Advanced sensor networks with respect to simulation management, data cleaning, user access, and real-time data management
• Two mobile client platforms for accurate in-context interactive visualization of sensor and simulation data, supporting the user spectrum from laymen to expert users in the field through various spatial analysis tools
• A wide range of impact assessments to analyze usefulness and usability of system components based on user-centered design principles, including expert workshops, public demonstrations and formal validations
• Application of technology in real environmental monitoring applications • High quality scientific output in form of publications at key conferences, public
visibility, venues for further exploitation
• The system methods/technology may improve understanding and potential mitigation of environmental processes, and can promote socio-economic benefits. End-users reacted positively on on-site support methods, most seeing benefits for their daily work
• Improved setup and handling of dense sensor networks, easier handling of simulations. Expert feedback has confirmed usefulness.
• Advanced support for visualizing and exploring complex scientific data sets on mobile devices, which can positively affect a wider range of scientific data exploration. Accepted publications and expert feedback confirm innovation, usability and usefulness.
• Technical components such as the simulation work, localization system, multi-camera work or interactive visualization techniques, but also the environmental findings can certainly instigate further research
Impact What potential main impact can be expected from the results? How have end-users reacted?
The main group of end-users consists of people working in a geosciences context, including particularly hydrologists, environmental agencies and managers, or sensor companies. Furthermore, from a technical perspective, computers scientists and IT industry concerned with sensor network technology, and interactive visualization on mobile devices.
Executive summary

HYDROSYS (224416) – D1.7 Final report, July 29, 2011 4
Contents Executive summary ................................................................................................................... 3 1 Project context and objectives ........................................................................................... 5
1.1 Context of use ............................................................................................................. 5 1.2 Envisioned solution and expected benefits for end-users .......................................... 6 1.3 Objectives and methodology ....................................................................................... 7
2 Results ............................................................................................................................... 9 2.1 Major achievements .................................................................................................... 9 2.2 System overview ....................................................................................................... 10 2.3 Sensors and sensor network .................................................................................... 11 2.4 Handheld ................................................................................................................... 16 2.5 Cell phone ................................................................................................................. 24 2.6 Application ................................................................................................................. 30
3 Impact and dissemination ................................................................................................ 34 3.1 Methodology .............................................................................................................. 34 3.2 Usefulness ................................................................................................................ 34 3.3 Usability ..................................................................................................................... 40 3.4 Dissemination and exploitation ................................................................................. 41
Background information ........................................................................................................... 44

HYDROSYS (224416) – D1.7 Final report, July 29, 2011 5
1 Project context and objectives 1.1 Context of use Lately, the natural environment is under constant pressure. As example, in mountainous areas, warming, melting and disappearance of permafrost has accelerated in recent decades damaging engineered structures and raising public concerns. Such changes will have important implications in the design of infrastructures, change in the water balance, including associated social problems, and make environmental monitoring with a high resolution in space and time more and more important to make accurate observations and predictions. In the water management context some important changes and steps have been undertaken via EU directives (CEU 1991 and 2000) and other international agreements to mitigate and identify environmental degradation and changes, among others by increasing the sensing capacities in our environment. Currently, environmental monitoring and modeling is mostly done in office or by simple on-site observation using few expensive sensing stations with data loggers. Software solutions are either disconnected software systems or large desktop Geographical Information Systems (GIS). With this current approach, the monitoring of environmental processes is hindered. Additionally, the workflow from monitoring to planning in the environmental design process is long. Sensor data is still (timely) limited and scattered in the environment: even when a problem is detected by a sensor, it can often not be traced back directly, since detailed information on the area is missing. As a result, many processes are poorly understood and both their representation (including the physical process model) and their visualization are incomplete. Hence, in hydrology there have been only limited field campaigns with in-situ spatial observations. Three trends can be seen that affect on-site environmental monitoring: the usage of Wireless Sensor Networks (WSN), improving aspects of Geographic Information Systems and tools, and the deployment of mobile technology for exploring environmental data. Current trends are moving toward deploying a large number of wireless sensing stations in order to provide high spatial and temporal density measurement. Wireless Sensor Networks (WSN) has become a widespread tool for monitoring a wide range of environmental phenomena. Many research projects are investigating possible applications of sensor networks ranging from habitat monitoring to agriculture and to environmental monitoring. However, deploying a WSN in the field has always been reported as a difficult task and remains challenging. On the other hand, a Geographic Information System (GIS) is a system of hardware and software used for storage, retrieval, mapping, and analysis of geographic data. GIS is an important tool for managing and visualizing geo-spatial data. Current trends in Geographic Information sciences include the development of integrated and shared geospatial data infrastructures, which unite geographically and semantically disperse national geo databases, development of integrated environmental information systems that include geospatial data management and analysis capabilities, and integration of sensor networks and sensor data with other geospatial data. GIS, combined with remote sensing and GPS, is becoming a popular tool within environmental monitoring, with users seeing clear benefits (see next section) for deployment next to office-only tools. However, powerful on-site monitoring tools using mobile technology have not been available. There has not been a system available that combines the whole procedure of accessing and managing heterogeneous data, observing data in an integrated way, and noting and discussing findings. Mobile GIS systems become increasingly available, but are still very limited in scope, minimizing the potential of onsite monitoring: data access and visualization aspects are often limited and not necessarily optimized for mobile platforms.

HYDROSYS (224416) – D1.7 Final report, July 29, 2011 6
It appears that environmental monitoring is at current mainly done by researchers, administration and environmental companies using an on-site observer and a sensing station with a data logger. To perform their tasks, on site observers have outdoor equipment such as GPS, mobile phones, radio, video camera, binocular and compass. The usual procedure is to periodically go on-site, to observe the site, to take pictures, to measure, to download data when possible, to take notes and then, at the workplace, to integrate these information into the database or GIS system at a later stage. Heterogeneous data such as Digital Elevation Model (DEM), graphs, data interpolation, land covers and various maps are used within this process. However, this process has been far from ideal: it takes a long time since many tools and data are not integrated, and data may even be unavailable in required spatial or temporal resolution. Users thus depend on intermediate office-based steps, in particular to handle simulation-related tasks. Also, data cannot be directly matched and compared to the current state/conditions of the actual environment, limiting the understanding of especially more complex environmental processes.
1.2 Envisioned solution and expected benefits for end-users As we explained, with the current environmental monitoring and management approaches, many processes cannot be monitored. Sensor data is still limited and scattered in the environment: and problems can often not be traced back directly. Setting up a high-density network throughout our environment is often not a solution: it is far too expensive and damages the environment. In addition, short-term events require a quickly deployable monitoring infrastructure that can be used to analyze a specific area in a rapid way. To support taking countermeasures mitigating environmental degradation, HYDROSYS provides the innovative concept of event-driven campaigns with mobile devices. Such campaigns can be set up to outline and understand an environmental process, as a complementary tool to office-based analysis. Events such as storm, water pollution and environmental changes, might be triggered by an active process that already takes (or took) place, or the expectation that an event might take place. Hence, sites can also be observed to understand a process better in order to take more effective countermeasures when a problem situation occurs.
Research challenge: to develop and experiment with a novel on-site monitoring system comprised of a sensor network and mobile clients in real environmental applications to analyze potential impact for environmental process analysis and management. . In this context, the improved ability to (a) more easily capture spatial and temporal variability of environmental parameters, (b) manage and integrate real time data with other heterogeneous data including simulations based on improved environmental models and (c) advance environmental understanding and decision making processes based on innovative mobile interactive visualization tools as to complement office-only work are seen as the main challenges of HYDROSYS.
Though the infrastructure developed within the project was not expected to solve all problems at once, it should allow for new ways of analysis that were previously hardly possible: to take a close look at environmental processes where they truly happen, in the field, aided by modern sensing technologies. The connection of both the actual situation in the field and detailed sensing information is expected to yield results that might change the way end-users will observe and take decisions. Thus, it is expected that environmental problems and their impact can be defined more accurately, aiding the process of providing better solutions. By using the HYDROSYS system, we expect that decision making processes can be optimized, also when different end-users access information using HYDROSYS as a common platform. The system should allow users to analyze and control sensor data sources at a fine time and space scale, enabling planning or effective measures taking (solutions). Though HYDROSYS mainly focuses on hydrological processes, the scope is wider: the system is designed with being able to potentially cope with any kind of environmental process. End-users that are currently actively target and were involved include environmental specialists (engineers, biologists, geologists, and geographers), specialists in hazard management, municipalities, environmental authorities, watershed managers and citizens (higher-level information communication).

HYDROSYS (224416) – D1.7 Final report, July 29, 2011 7
The tasks that end-users perform encompass the analysis of environmental processes on site can be structured in several major high level tasks groups that integrate work being performed both in the office and in the field. The major task groups are monitoring and understanding environmental processes, and managing environmental matters. Both groups of tasks are supported by decision making and communication activities. Finally, due to the dependency on modern sensors, activities also encompass the setup and maintenance of sensors or sensor networks. HYDROSYS should improve support for these tasks. End-user interviews performed within the project underline specific potential benefits of the system:
• to improve the overall planning and performance of on-site monitoring actions through enhanced sensor data capturing and management,
• to enhance the capturing of up to date, higher-resolution spatio-temporal information for more accurate representation and analysis thereof,
• to utilize data in real time decision making, and as such, to make more accurate predictions based on real time data, including direct simulation result access,
• to combine sensor data with the actual environment and other heterogeneous data using advanced visualization techniques to improve spatial analysis of processes and thus have a better understanding of how natural areas change,
• to take measurements (manual probes) or make annotations directly in the field, instead of managing findings in the office
• to optimize workflows by using real time communication (images and data) at the site but also from the field to the workplace, improve data access to a wider public, hence, create a shared information space.
1.3 Objectives and methodology To address the development of the desired technical solution, the main objective of the project was to produce an innovative software system for interactive visualization of environmental data on mobile devices, deployable in on-site monitoring activities. The system should connect to a wireless network to receive near real time sensor data from sensors used on-site, and remote sources. To reach this objective, the consortium had to tackle following developments and related activities:
System infrastructure: to integrate a prototypical data pipeline to access and manage heterogeneous real-time data from a dense sensor network, to be successfully accessible on the mobile client while being in the field.
Sensors: to explore innovations in data capturing, by using a blimp-based system to generate high-resolution terrain models and thermal imaging, to allow ad-hoc sensing using a mobile sensor with direct feedback to a mobile device, and to experiment with camera systems to allow for multi-perspective analysis of a site to improve understanding.
Sensor networks: to handle real-time heterogeneous data from sensors within a wireless sensor network, to improve handling of simulations through closer integration, to improve the quality of data through tools to clean data, and to allow for user management to structure workflows and data access. In general, the process of setting up and managing dense sensor networks and associated simulations should be eased.
Mobile interactive visualization: to provide innovative platforms for multivariate data representation following conventions as well as innovations through 3D methods, to prepare and optimize the representations for mobile platforms (low-performance

HYDROSYS (224416) – D1.7 Final report, July 29, 2011 8
processor and small screen), to enhance context-based visualization through improved localization. Furthermore, innovative ways for exploring and analyzing complex environmental data sets should be found. End-users should be able to explore and analyze the data on the screen in an understandable way, and be able to communicate or note down findings. Two display platforms should be used, one for the wider public and specialists approach, using the cell phones, and a more functionally encompassing and complex approach for specialists only, using the handheld computers. Application: to deploy system or system components in relevant sites to observe particular environmental processes through dense sensor networks, to experiment with systems, and improve systems based on user-feedback in iterative sessions.
Validation: to analyze potential impact, and produce and publish high-quality research results, thus, creating positive feedback on potential applicability/usefulness (socio-economic impact) and usability (technical)
Within the project, the consortium has taken a highly user-centered approach to develop the system. User-centred design (UCD, ISO 13407:1999 standard) is a design philosophy that aims at improving the overall end-user experience for a “product” or service by actively and iteratively involving the identified user into the planning, design and development phases. UCD tries to optimize the designed system around how people can, want, or need to work, rather than forcing the users to change how they work to accommodate the system or function. UCD answers questions about users and their tasks and goals. The findings are validated through empirical grounding and used to make decisions about development and design. The goal of UCD is ultimately to produce “better results”. The concept of usability as one of the major gains of a well implemented UCD process is in itself gaining importance as a selling argument and most companies are incorporating UCD into their business strategies. Customers on the other hand have started to demand for usability as a product quality. In HYDROSYS two major gains of exercising UCD in the research process can be stated. First of all, UCD was expected to act as a mediator between different research-oriented activities and the common system development. It was also be expected to help in providing, as a result of the project, a useful more “market-oriented” system that satisfies needs of the project partners and defined user groups and above all, provides additional value in the activities they perform. Although in HYDROSYS, the developed system is not meant to be directed for markets (to be a true “product”), a user-centred outcome based on application of UCD in various aspects of the research, has led to more valuable results, with respect to usefulness and usability. To this extent, we focused from the start of the project on involving users in the various stages, analysing users in their actual work context, and involving them actively in the design of the system through so-called participatory design techniques. Up to 65 users were involved in the project on a regular basis, next to a powerful advisory board. The external users and specialists had widely varying backgrounds. Having a wide range of different skill sets is important for a user-centred design process. Practitioners of engineering, social and cognitive sciences along with designers and the users themselves are needed to fully comprehend the entire context surrounding the design of a new system. With the end-users, an empirical grounding was created by using mock-ups and prototypes early in the project on, to aid refinement of key concepts further on in the iterative design process. The impact assessment that has continued through the various stages of design and presentation of the intermediate and final stages of the research prototype system has confirmed its applicability, through positive feedback on usefulness and usability of the final results.

HYDROSYS (224416) – D1.7 Final report, July 29, 2011 9
2 Results 2.1 Major achievements HYDROSYS has produced highly advanced system components that have been integrated into research prototypes that have actively been used in the field as well as in the office. The overall outcome of the HYDROSYS project is a highly advanced research system prototype supporting on-site monitoring and management of environmental processes using mobile display devices. This system builds atop the notion of a shared information system fusing heterogeneous data sources that supports teams of stakeholders to monitor environmental processes on-site, complementing remote monitoring and management in the office. In relation, we can describe the following significant results.
• Prototypical system with high potential: We have developed a prototypical system
that has demonstrated how environmental monitoring and managing natural resources could be improved: As confirmed by end-users, the system approach could positively affect environmental monitoring, and users have expressed interest in using such systems in the future.
• Close involvement of end-users: end-users have been closely integrated through all stages, participating in design decisions, and providing valuable feedback. This has led to a better understanding of environmental monitoring needs and potential benefits which have, as we can confirm, be matched by our system.
• Integrated system infrastructure: though a fully automated pipeline between sensors and mobile clients was not focused on, it is prototypical but rather well working. In particular the Global Sensor Network (GSN) extensions are regularly used supported through its longer general availability, while other tools can be gradually introduced.
• Sensor innovation: we developed several novel data acquisition methods that have received positive feedback from geoscientists as well as technical specialists in the field. Both the blimp-based reconstruction and thermal imaging methods and the mobile sensor where seen by end-users and specialists as useful extensions to the project that could be well applicable in many situations in the future.
• Advances in sensor networks: GSN has been an innovative and stable platform for sensor deployments. In particular in the Swiss scenarios, the deployments build atop previous experiences with the system. It has been successfully extended to tailor special needs, as well as provide components that are very useful for other projects deploying GSN. Next to new and useful components like the access management and the data cleaning functionality, in particular the new simulation framework is a notable and highly innovative step forward. Most specialists have confirmed the usefulness and usability of these improvements to handle (ad-hoc) sensor networks, that will likely be further refined over time.
• Advanced mobile clients for interactive visualization: the cell phone and handheld clients represent the forefront of mobile interactive visualization and aid the spatial analysis of environmental processes through context-sensitive methods, supporting real-time decision making processes. The systems represent functionally extensive and well structured clients, with techniques optimized for mobile devices. Additionally, we offer improved localization for users, of which the spatial registration of information benefits. The systems have been tailored towards improving the analysis, understanding, and discussion of environmental processes, which has been positively confirmed by end-users. The clients are prototypical, hence, would need to be modified for professional usage to truly let their potential unfold.
• Systems applied in real-life scenarios: The overall system architecture provided actually works outside the lab. From the start of the project on, a large number of test deployments and monitoring exercises have been performed to test and demonstrate the systems in “real” situations.
• Important validations: The validations have been basis for multiple developments and publications – most validations have been extremely useful and discovered state of the art research results. Examples are the various visualization-centered tests, as well as the multi-view cognitive validations. Furthermore, we received positive impact feedback. Whereas some results are tailored towards usage by specialists, we received in general positive feedback on usefulness and usability, confirming that we reached our goal to improve on-site environmental monitoring and management.

HYDROSYS (224416) – D1.7 Final report, July 29, 2011 10
• Remarkable outreach: The outreach we generated in the project has been quite extensive and has found a lot of positive resonance. In general, we surpassed the initially set quantity and quality of outreach, varying from the number of high-quality publications and presentations, up to the number and size of well visited public and research events.
2.2 System overview HYDROSYS is a heterogeneous platform, combining various sensors, a sensor network for handling sensor data, and mobile clients in a unified prototype system. The system provides means for on-location analysis and discussion of environmental data, also supporting office work and collaboration. The main service is the sensor network framework GSN, a ubiquitous interface to a large deployment of sensors. Here, automated data is as well as measurements from manual sensors are stored and can be processed. To GSN, a simulation service is connected, which offers a uniform, format independent library to access numerical simulations from simple spatial interpolations to complex physical models. Finally, an on-site campaign service is deployed to support on-site activities in particular collaboration using the mobile clients. During campaigns, this service runs on a mobile computer at the site of study and provides access to shared information such as remote views and annotations. All these services contribute data to different layers that the application processes to generate a comprehensive visualization. All data needs to be transcoded and interpreted, which takes place both in offline and online stages.
Sensors (data acquisition). To study the environment, processes are captured by sensors that provide the required density, update rate and sensing characteristics to provide for a correct representation. Sensors may need to be installed ad-hoc, but generally they are placed at a site for longer periods. Data is handled in the sensor network by GSN wrappers, to fetch images, raster data, or for receiving sensor data from a station. Data is also handled that is generated by manual sensors or the blimp (updated terrain models, thermal data). Sensor networks (data storage and processing). Sensor data is stored and indexed by a global sensor network, allowing seamless gathering of data from stations. To ensure data validity, data is filtered using automatic or manual data quality mechanisms. Data may underlie privacy restrictions, hence, security mechanisms and user management is offered. Data can be simulated through the integrated simulation libraries that closely connect and ease sensor data and simulation management. To prepare the data for visualization at the mobile clients, it is handled through the query and pre-processing services of the smart client. Mobile clients (data visualization and analysis). After filtering and validation, the data is converted to visualizations for analysis, to be explored at either a handheld computer or cell phone. These visualizations are used to analyze and discuss the environmental processes. Visualizations provide an advantage to detect differences, connections or similarities in numerical data, and can be visualized in various (optimized) 1D, 2D and 3D formats. While exploring data, the data is brought into context to the environment, potentially aided by an advanced localization system. The systems also support collaboration via notes making, communication and the sharing of camera imagery, and can be linked to remote cooperators. Within the next sections, we will take a closer look at the sensors and sensor network, and the mobile clients.

HYDROSYS (224416) – D1.7 Final report, July 29, 2011 11
2.3 Sensors and sensor network As we explained in the previous section, the HYDROSYS platform is a heterogeneous system, combining devices varying from mobile devices to desktop, with specialized data acquisition methods and simulations, providing highly graphical mixed reality clients as the system highlight. Towards the overall objectives of the project, we developed a shared information system fusing different data sources. A sensor network system for sensor data acquisition and management is set up to enhance shared information retrieval at handheld devices. The sensor network is based on the Global Sensor Network (GSN) software developed at EPFL and extended in this project. Furthermore, several new sensor interfaces that make use of remotely controlled cameras will be developed, making use of robotics. The work is split into two main areas: i) building new sensing capabilities, ii) enhancing the sensor network with new functionality. Objectives The sensing functionality that needed to be supported is the following:
• Remotely controlled cameras using pan-tilt units • Remotely controlled blimp that produces visual and thermal overlays of the monitored
site • A manual sensor that can be connected to the cell phone platform (see section 2.5) • New Sensorscope station supporting multiple sensing frequencies • Video streams from both the thermal and the visual cameras are to be integrated and
overlaid in a single map at the user GUI Also, the sensor network needed to support the following functionality:
• Fusion of multiple real-time and historical sensor feeds • Support sensor mobility • Receive data from the aforementioned new sensors • Filter sensor data for its visualization in handheld devices and mobile phones • Support simulations of sensor data with physical (e.g. hydrological) models in a
transparent way for the users • Support authorized access of sensor data to enhance collaboration among a large
scientific community • Clean sensor data in an automated way and provide feedback to the user on its
quality Moreover, the GSN system needed to be enhanced in the following ways:
• Be more open to pull-/push-based sensor data feeds from arbitrary sensors (including the new ones developed in HYDROSYS)
• Be robust against noisy data or interleaving data connections (due to sensor mobility) • Make the sensor data available to clients through multiple network protocols (e.g. web
services/SOAP, UDP, HTTP, etc.) to facilitate remote data access from different platforms, since GSN needed to be communicate with external components, such as GeoTOP
• Properly index the sensor data stored in order to support temporal and spatial range, point and aggregate queries
• Make data processing fast and easy to implement to facilitate the work of environmental scientists
2.3.1 Overview of developed components The following figure presents an overview of the main components of the HYDROSYS platform. The system mainly aims at supporting on-site and at-the-office observation and analysis of environmental data by means of stationary and mobile sensors deployed at the site of interest. Each developed component progresses and contributes toward that goal. From left to right in the figure, environmental data is captured (“Sensors”), transmitted (“GSN”) for processing (“Simulation and warning”) and transcoding (“Smart Client”), and delivered to the user via the mixed reality clients (“Interaction and Graphics”). To integrate our components and to distribute sensor data, we needed suitable middleware. The Global Sensor Network, GSN, was foreseen as the best solution for connecting the various systems

HYDROSYS (224416) – D1.7 Final report, July 29, 2011 12
together. While needs arose, GSN itself was modified and improved to match the new requirements. GSN wrappers were built to parse and integrate proprietary data formats, and GSN nodes modified to deal with the new data types. In general, GSN delivers what was initially expected: the sensor data from semi-permanent sensor stations is transmitted via GSN for processing and compression. The data pipeline principally consists of the following stages and components: 1) Data acquisition, 2) Data storage and processing and 3) Data visualization and analysis. Raw data is seldom in a useful form, and further processing is needed. In the pipeline, data suited for simulation, transmission, visualization and analysis. In this chapter, we focus on the system components related to the data acquisition and the data storage and processing, highlighted in the figure below.
2.3.2 Results of components Global Sensor Networks Global Sensor Network (GSN) middleware was developed by EPFL during Swiss-Experiment project and is continuously extended since then. The Global Sensor Networks (GSN) platform aims at providing a flexible middleware to accomplish these goals. GSN assumes the simple model shown in the figure below.
GSN makes no assumptions on the internals of a sensor network other than that the sink node is connected to the base computer via a software wrapper conforming to the GSN API. On top of this physical access layer GSN provides so-called virtual sensors that abstract from implementation details of access to sensor data and define the data stream processing to be performed. Also, special components called wrappers, acquire data either pull- or push-based from sensor devices. The sensor network platform of HYDROSYS The GSN has been significantly enhanced to offer new functionality regarding access control, access rights management, simulation management, virtual sensor management, temporal-range querying of sensor data, spatial querying of sensor data and data pre-processing for visualization in mobile devices with limited visualization capabilities. The access control and access rights management functionality are related to authentication, authorization and confidentiality support and they are offered by the Access Control Framework, which is described in a separate section below. Also, the simulation management use case includes the capability to start/stop and access the intermediate results of a running simulation. The Sensor Data Retrieval functionality includes the functionality for fast sensor data retrieval by the physical simulation models. Also, it offers support for temporal/range/spatial querying of the sensor data. Finally, the virtual sensor management

HYDROSYS (224416) – D1.7 Final report, July 29, 2011 13
functionality allows dynamic query registration for push/pull-based data retrieval, as well as the specification of arbitrary sensor data processing by GSN virtual sensors. A number of newly developed GSN interfaces are utilized by other components (described in detail in the task descriptions of this report), specifically: Interfaces
• HTTP GSN Interface for Temporal - Range Queries • HTTP Interface for Spatial Queries • Interface for Managing Simulations • Web Service Interface for Data Retrieval
Wrappers Metadata Merging (SparqlWrapper), Image Support (ImageWrapper, GridWrapper), SensorScopeWrapper, UDPWrapper, CSVWrapper, RasterWrapper/RasterVS
Virtual Sensors (VS) UDPVirtualSensor, Scriptlet VS, ScheduledBridge VS, ClockedBridge VS, DataClean VS, GEOtop/Alpine3D VS
Remotely controlled cameras Two types of remotely controlled cameras are deployed, being the pan-tilt unit (PTU) and the blimp cameras. Remotely controlled cameras using a pan tilt unit can allow users to control dynamically the rotation of the cameras, to get an overview of the environment in the surroundings of the camera. For this purpose, a pan-tilt unit (PTU) driver has been integrated with Studierstube software. This driver is used by the host computer to communicate commands to the PTU, and allows accurate reorientation of the unit. The handheld devices also host PTUs and use the PTU driver to control their uEye cameras. They publish their video footage using a publish/subscribe approach. For remotely controlling the blimp and obtaining live data and position information, a communication module has been designed and implemented, providing a much higher range (than using only IEEE 802.11b/g) but only limited data bandwidth. It is based on a custom-made radio unit controlled by a programmable Arduino microcontroller board both on the blimp side and on the handheld side. Also, a wireless stand-alone, low-power camera for environmental monitoring has been developed to meet rather demanding challenges: potentially harsh environmental conditions, low data rate for communication (a maximum of 53.6 Kbits/s can be achieved with GPRS), and severe energy limitations (rechargeable battery coupled to a solar panel). The camera is solar-powered, autonomous and can be seamlessly integrated in wireless networks. Hereby, the HYDROSYS project worked together with the Sensorcam project.
Blimp sensor system A blimp system had to be developed to produce visual and thermal overlays of the monitored site of existing digital elevation models (DEMs) and help improving existing DEMs. We have selected a custom made blimp with a larger than usual envelope to allow operation at an altitude of up to 3000m above sea level (necessary for some regions of the La Fouly and Davos sites). A modified version of the original MZ8000, arrived in February 2011 (after a crash of the original MZ7000 at a field test in Davos in August 2010) and the adjustments to carry the on-board computer were finished in time for another test deployment in Davos in March 2011. The blimp payload consists of a complement of sensors (thermal camera, high resolution optical camera, GPS, IMU), some communications modules to the operating station and a PC-104 based control computer. This setup allows the blimp to perform video processing on board. The processing system can also compress and send the video to the operating station on the ground. The system is able to overlay the thermal data onto existing DEMs with accuracy depending on the accuracy of the blimp position estimate, the captured images and the DEM. Also, scalable and parallelizable methods for refining the DEM from the recorded images have been developed based on efficient combination of existing algorithms.

HYDROSYS (224416) – D1.7 Final report, July 29, 2011 14
Access Control Framework In GSN access control framework, we implemented discretionary access control for each virtual sensor. Discretionary access control (DAC) governs the ability of subjects to access objects, allows users to make policy decisions and/or to assign security attributes. A user can own a virtual sensor (i.e. have registered it into the system), and he can have read, write or read/write access to it. Read access concerns the sensor data aggregated by the virtual sensor. Write access concerns the XML description of the virtual sensor. The owner of a virtual sensor automatically has read/write access to it. The administrator can modify the access rights of the users. She/He can also can create group(s) of virtual sensors. A group is a set of (virtual sensor, access right) tuples. The administrator creates a group of virtual sensor and their access rights after consulting virtual sensors owners. Then, users can ask for access to a group and the access is authorized by the administrator. Also, when a new user signs up and requests certain access rights to some virtual sensors, these access right requests are granted by both the virtual sensor owners and the administrator. Data Quality Monitoring and Cleaning Data quality monitoring and cleaning methods have been implemented employing parametric (e.g. linear regression with a certain error bound and window) and probabilistic models (namely an innovative ARMA/GARCH combination) to estimate confidence to data. The experimental results showed that the latter approach is promising. The anomalies detected by the diagnostics are then visualized using plotted graphs (see figure beside). The graphs present raw values (green curves), corresponding model-inferred values (black curves), and anomaly indications (red bars). This allows users to easily find the anomalies, while comparing the original data with the model-processed data. Our GSN-integrated GUI also permits users to zoom in/out the graphs for effective anomaly identification. Simulation Pipeline Until now, running a model simulation based on field sensor data needs several steps, namely data sensing, aggregation, retrieval, cleaning, interpolation, formatting, model execution and model output visualization. This process was time-consuming (e.g. only the data preparation for a single simulation typically takes 3-4 days) and highly error-prone, as it involves many manual or semi-automated steps. In HYDROSYS, we have defined and implemented a data processing pipeline that makes simulation process completely automated, fast and transparent to the scientist that reduces the process time to minutes. We developed a “GEOtop VS” for GSN interaction with the specific environmental model and a “R VS” for GSN interaction with an R server (http://www.r-project.org/). Moreover, we enhanced GSN functionality with two new web services interfaces, one for fast, concurrent access to sensor data, and another for the remote control of the simulation process. Also, a web-based front-end simulation GUI is included in the GSN portal. The simulation process happens as follows: Initially, the scientist selects the sensors over a geographical region, their sensing period and sets the most important simulation parameters of the model (the rest of the parameters have their default values).Then, GEOtopVS starts the execution of the simulation at a remote server where the physical model resides.The environmental model employs MeteoIO library (http://slfsmm.indefero.net/p/meteoio/) to retrieve sensor data from GSN, filter and complete a certain segment of the sensor data of interest. When simulation is completed, GEOtop VS retrieves the simulation results, stores them

HYDROSYS (224416) – D1.7 Final report, July 29, 2011 15
and forwards them to R VS that interacts with a R server to execute a visualization R script for producing graphs of the simulation output. These graphs are then stored to GSN, and finally, the graphs of the simulation output appear in the web-based GUI of the scientist. A similar process happens for Alpine3D simulation by replacing GEOtopVS with Alpine3DVS. An innovative meteorological data fetching and preprocessing library (MeteoIO) has been designed, developed and released under an open source license and is now used by several other projects, both by the participating institutions and by other institutions. Several well known and respected physical models have experienced deep redesigns and partial rewrites that make them more robust, more flexible and potentially more attractive for integration in other projects.. Pre-processing support for mobile phones and handhelds (SmartClient) Handheld and mobile phone devices have limited communication, visualization and processing capabilities. Sensor data fetched by these mobile devices should be pre-filtered in order to be compressed, while it’s utility to be maintained high. This functionality is referred to as SmartClient. The SmartClient supports the streaming of sensor data from the Luode sensor data services and interacts with interactive Simulation Services using a WPS protocol. It also provides a transcoding pipeline, which receives data coming in abstract form from the sensor stations and translates it into a reduced form understandable by the mobile devices.
2.3.3 Summary The work on sensor network system and sensors has fully accomplished the project objectives in this subject. Specifically, the work on the remotely controlled cameras has laid the foundation for the multi-view system presented in detail in section 2.4.4. A lower-level control layer (driver) was implemented for controlling the pan-tilt unit, as well as various camera parameters. The developed methods in remotely controlled cameras have been very beneficial to continue the work on the multi-camera system. The multi-view system has been discussed as part of the expert interviews and general events, mainly from a user interface stance. In general, users were very positive about the usefulness and mechanisms for sharing images to create a common understanding between users, but also to create a better understanding in general. Furthermore, a prototype of a stable low-power wireless camera was completed and successfully tested. This camera setup is suitable for environmental monitoring in harsh weather/topology conditions. Also, a stable flight platform was developed with enough lifting capacity even at the altitudes required by the Alpine scenarios, lightweight design, a powerful on-board computer, and a suitable communications link to get live data and position information from the blimp to the ground. In March 2011, a presentation at a public celebration meeting of SLF has been performed, where the blimp has been displayed to the general public, followed up by a number of successful deployments. Also, thermal data were accurately overlaid onto existing digital elevation models (DEM) with their accuracy crucially depending on the accuracy of the thermal images, of the DEM and of the estimated blimp position at capture time. In addition, scalable optimization algorithms for the refinement of DEMs from the recorded images and for generating thermal overlays for them have successfully been developed and applied to data acquired with the blimp system. The blimp platform developed has been shown to be a very useful platform to gather aerial imagery over areas of interest. However, it is sensitive to weather conditions. Furthermore, the algorithms for height map estimation blimp has been shown to be a very effective platform to refine DEMs and scalable, as they are easily parallelized to multi-core machines. With regards to the sensor network, GSN now supports fetching, storing and publishing images and data grids captured from sensor cameras. Moreover, GSN has now support for processing archived or real-time sensor data from mobile devices, and make it accessible to the latter. It has multiple wrappers for pulling or pushing data to it from multiple different sensors and the sensor data stored at GSN is accessible through various general-purpose network protocols, such as SOAP, HTTP, UDP, etc. Furthermore, new interfaces for value-based, aggregate, range and temporal queries were developed, as well as dynamic query registration. We implemented support for spatial queries inside GSN. This is very important given the sensor mobility. Additionally, we enhanced GSN functionality with two new web services interfaces, one for fast, concurrent access to sensor data, and another for the remote control of the simulation process. A complete documentation and unification of the Web service interfaces provided by GSN was produced. The unified GSN web service data access interface and its documentation greatly facilitate further adoption of the platform. The Smartclient component for the handhelds that has been developed successfully completes the data handling between GSN and the handheld computer. Profile mechanisms

HYDROSYS (224416) – D1.7 Final report, July 29, 2011 16
included ease the configuration of applications and make them more “user friendly”. It is the product of various discussions with end-users, to ease the preparation time of generation / starting an application. Whereas for now, the tools have been mostly used in production settings, it will ease future users considerably configuring their applications. The SmartClient directly links to the transcoding component that interprets the data from the sensor network, as well as simulation data. Also, the SmartClient system component for the mobile phones supports the streaming of sensor data from the Luode sensors to mobile phones. The SmartClient is enhanced with functionality to allow mobile phones interact with the Simulation Services using a WPS protocol. The SmartClient functionality allows the interaction of mobile users with devices of limited capabilities to seamlessly interact with the HYDROSYS platform. To support collaborative sessions, an access control framework for GSN has been implemented. It provides authentication, authorization and confidentiality to the GSN users. Authentication is provided by user/password credentials, while confidentiality is provided by SSL/TLS protocols. GSN access control framework employs the MVC reference model, but it is an innovative and customized collection of software components that control the access on every web services interface or HTTP interface of GSN. The fine-grained discretionary access control of sensor data developed enables the introduction of sensor of diverse ownership into the platform and the exploitation of the sensor data by the designated users without violating privacy constraints. To ease simulation management, we also defined and implemented an innovative data processing pipeline for running simulations with physical models with real-time or archived sensor data. Our simulation tool pipelines several ordinary virtual sensors (VSs) with special-purpose ones namely “GeotopVS” VS (resp. “Alpine3D” VS) for GSN interaction with GeoTOP (resp. Alpine3D) and an “R VS” for GSN interaction with an R server (http://www.r-project.org/). Also, a web-based front-end simulation GUI is included in the GSN portal. An innovative meteorological data preprocessing library (MeteoIO) allows multiple physical models (e.g. Alpine3D, GEOtop) to fetch sensor data from different sources (including GSN) as well as data pre-processing (e.g. interpolation, data cleaning, etc.). Physical models (i.e. Alpine3D, GeoTOP) have been through deep redesign to improve their stability and accessibility. The simulation pipeline reduces the length of the sensor data preparation towards a simulation from days to minutes, while the approach is less error-prone. The approach is generic-enough to be employed for arbitrary physical models. Finally, we employed parametric (e.g. ARMA, LR) and probabilistic (ARMA/GARCH) models to approximate data streams and provide data cleaning as well as data quality estimation in real-time. The effectiveness of the approach has been experimentally verified towards identifying anomalies, as well as low root mean square error and processing time. Non-parametric models have been experimentally verified to be effective for cleaning and estimating the quality of the sensor data from several real sensor deployments.
2.4 Handheld
2.4.1 Introduction The ultimate goal of our mobile, handheld interface for environmental monitoring is to visualize sensor measurements and simulation results in the context of their occurrence. The main advantage of on-site monitoring is the fact that the data is connected directly to the actual site, not some potentially outdated model of it. This in-context visualization and interaction supports the scientist across all tasks, from displaying sensor position for deployment or current readings for maintenance, integrating representations for multivariate data and complex simulations. All this must happen in a collaborative framework whereby users can interact, communicate and discuss findings and potential solutions. The challenge is to exploit this fact, relating synthetic data to the real world and attempting to convey as much information as possible without losing the real world context. The addition of information that is spatially located relative to the user’s viewpoint as per mobile device can help to improve their understanding of it. The method of choice, augmented reality (AR), strives to render computer generated artifacts “correctly registered” (appropriate position relative to the point of view of the user) over a video-image based representation of the real world (see Figure below). Using in-context visualization, and in particular augmented reality for geosciences / environmental science has hardly been explored yet. It has provided us with an approach to innovate the field of monitoring in a useful and highly innovative way.

HYDROSYS (224416) – D1.7 Final report, July 29, 2011 17
Augmented Reality Concept: overlaying virtual data in the real view of the world. This
approach is used for the handheld client to support in-context visualization. Objectives The main objectives for the handheld client can thus be defined as follows:
• To create a software system for accessing, processing and displaying heterogeneous environmental data from sensor and simulation sources on a mobile device in real-time,
• To create and optimize multivariate visualizations of environmental data for small screen displays, combining conventional representation approaches (numeric, plots) with innovative and accurate 3D in-context visualizations, to provide for accurate localization for in-context visualization
• To support the various monitoring and management tasks, thus to explore, combine, communicate, annotate and analyze environmental representations through a user interface optimized for mobile devices and collaboration support,
• To validate the usefulness and usability of various aspects, both technically and usage oriented, and produce high-quality publications.
2.4.2 System overview The handheld system is comprised of a number of hardware and software components, which are represented in the diagram below. In terms of hardware, the system consists of a display unit that offers the front-end to the interactive visualization of the environmental data. The display unit (hardware) had to be small and robust, to be taken into the field under harsh conditions. To support the augmented reality approach, connected to the unit there are several sensors, including a camera, and other sensors that define the viewing direction of the user (localization and orientation). In addition, several base components are provided that, next to localization, support the system, including improved network support for data communication with the sensor network at remote areas, and components that support collaboration. These included the development of a customized WiFi bridge system that can be set up in remote areas. It is self-sustained, affordable, and can relay high-bandwidth network connections over several kilometers .
Diagram of main components of the handheld augmented reality system Our system runs a software framework that handles the various visualization and interaction aspects, but also includes data handling an external process that deals with preparing the data for the handheld. On the one hand, data visualization techniques take care of
Data visualization Techniques to show the environmental data in various formats
User interface Methods to interact with environmental data
System platform The mobile system software and hardware to support visualization and data exploration, including external supporting technologies
Collaboration Support the understanding and discussion of observations
Data exploration Techniques to support the exploration of environment data sets, simulation support
Support External support components, including collaboration and network support
Localization Bringing data into context through localization of the user

HYDROSYS (224416) – D1.7 Final report, July 29, 2011 18
interpreting and showing the multivariate sensor data from the sensor network. The sensor data is handled within a 3D context: since the data is related directly to the environment, the system is inherently a 3D visualization system.
Display unit, example interface showing data overlay and multi-view system.
The user interface allows the access and guided exploration of the various data sources and representations, varying from basic numerical data, to specialized simulation results. This data is accessible in real-time, except when it needs to be processed on forehand (such as some simulation results). Furthermore, there is a range of collaboration features included, that aid and understanding and discussing the observed sites between multiple users (group work). This includes voice communication and annotation possibilities, but also an advanced multi-camera system for observing the site under observation from different perspectives.
2.4.3 Data visualization The data visualization is responsible for preparing and representing the multivariate sensor and simulation data obtained from the sensor network system (GSN). The representation should be well understandable and, where possible, follow general conventions The representation should also be brought correctly into the context of the real world. To do so, the data is packaged and optimized for the handheld platform, which is a low performance system. After preparation, support is provided for “traditional” visualization formats for environmental data (numeric, plots), as well as 3D representations for novel data analysis of environmental data and expanding the current trend in geosciences toward using 3D. To allow efficient interpretation of visualized data, it is optimized for visibility affected by the small display and potential complex data sets, and tuned for performance on the small device to run fluently (“real-time”, to allow affective analysis). Furthermore, we experimented with various techniques to “filter” data, modifying the appearance of a representation to, for example, direct attention to a specific part of content. Software framework: Mobile devices are characterized by their thinness, their lack of resources. Even devices equipped with 3D hardware are able to render and keep in memory only small data sets, while real world data easily exceeds their capabilities. Thus, to deal with the data obtained from the sensor network using the SmartClient (see the sensor network section), the handheld system requires several preparatory steps that are eased by the usage of profiles. User profiles are stored in XML and can be handled by an external user interface developed specifically for HYDROSYS. The profiles include parameters for, among others, display management, camera configuration, data access management, or visualization aspects. Data will be pre-processed in formats apt for the mobile platform, after which it is ported on the handheld platform and visualized with our OpenGL-based interactive visualization system that leverages a plug-in manager to deal with sensor input. We created implementations of specific renderers to handle geometry (e.g., elevation models), and the user interface (e.g., tiles, text). The speed ups in our implementation (using vertex buffer objects) immediately allowed reaching interactive frame rates even on the slow mobile device when running the full fledged application. The application is organized following the model-view-control design pattern and mostly data-driven. Data visualization: The main visualization component of the handheld client encompasses an augmented reality approach, where data is related directly to the real environment through video overlay. For this matter, the information should be spatially registered to an underlying

HYDROSYS (224416) – D1.7 Final report, July 29, 2011 19
model (a digital terrain model, which can also be made visible upon request) and correctly matched to the environment representation. However, geoscientists do not only require spatially and visually registered overlays of primarily 3D data, but also more traditional, conventional 1D (numeric) and 2D (plots or graphs) formats. Within the visualization work, methods have been found to unify the analysis of multi-variate visualizations controlled by the user interface.
Different Visualization Techniques in the AR view: tabular, plot, labels and overlays First, based on the selected sensor data type, labels show the numerical value of a specific observation (temperature, humidity) across all sensor stations. The location on the AR view of the label relates to the location the data originates. This provides the user with indication of the discreet spatial distribution of a specific sensor type over the site. Additionally, users can access a complete overview of the sensor data produced by a station, in a tabular form. The table itself is not directly related to the environment since it occupies a large portion of the screen. However, indirectly, it is linked to a selected sensor and accessed by by tapping the label/station. The overview gives the end-user a good representation of all the data generated at the particular spot, which can be compared or related. Next, we offer spatial overlays using simulation data as a main source; it provides a spatial color distribution maps that show data produced out of a physical model. The source of these simulations is mainly the simulation pipeline which has been described previously. Data which is received is interpreted and pre-processed using the transcoding tools and then correctly registered and mapped to the underlying terrain model. Here limitations exist in the size of the model and textures the computer can handle. In a similar way as exploring simulation data, and geo-referenced map data can be related to the terrain model. Hence, if map-like data such as satellite or aerial photography raster maps or land use are available, they can also be shown as overlay. Finally, we also offer support for data browsing through (pre-generated) plot-based representation. Whereas initially we produced plots on the fly, the appearance/readability was not appropriate. The current implementation depends on pre-generated plots in GSN that we retrieve in real-time or package with the scenario datasets. Here, we can make use of GSN R (available on the GSN Server with Rserve library) or Matlab wrappers. Within R, the data is processed in whichever method desired and provided back to the GSN server as a plot in JPEG format. As both R and Matlab are extremely capable tools, many advanced plots can be provided. Multi-variate visualization is then available by combining the visualization of overlays simultaneously with labels – hence, users can nicely compare the sensor data values with the color distribution of a simulation output. However, overlays also suffer from several issues, including depth perception and visual clutter. We tackled these by modulating and optimizing representations (overlays), as we will talk about here after. Lastly, we created a separate visualization front-end for the Andermatt application (see section 2.6.2). This application visualizes in particular inclination changes sensed by a wall mounted sensor. This simple application implemented in TCL/TK that displays a graph, generated on the device, of the sampled inclination values. These values include samples from all three axis: heading, banking and jaw. Additionally, the user may select a particular sample with the touch screen and have data displayed on the bottom of the device. Visualization modulation and optimization: While pursuing various efforts of creating environmental data visualizations, experimental research was started that focused on the modulation and optimization of representations, hence, to adapt the visual appearance with various goals in mind. Our research was meant to improve the augmented reality visualization, in particular with complex data sets considering limitations in screen size and quality. The techniques developed can aid in better understanding a data set on a small

HYDROSYS (224416) – D1.7 Final report, July 29, 2011 20
screen. To address identified perceptual issues, we followed two approaches, which can be defined as “unnoticeable” and “visible” modifications. The unnoticeable direction experiments with so-called focus+context techniques aim to draw attention to a specific part of the scene (for example, a sensor producing out-of threshold data, or the aid in navigation through complex scene). The focus+context techniques developed and validated in the project mainly dealt with so-called saliency modulation. Salient objects are objects that likely call your attention in a scene. To analyze a scene the techniques perform a conspicuity analysis, which outputs the salient objects in a scene, classify objects on a priori knowledge and modulate their representation (objects can be made more or less salient). For example, we know where a sensor station is in a scene, as such, we could regard this as an “object” and perform modifications. We performed several experiments in sub-urban environments as well as artificial scenes using the technique and could show that we can direct the user’s attention to a specific part of the scene without the user actively noticing it. Furthermore, we could also demonstrate that such a technique could be worthwhile for aiding a user while exploring an (unknown) environment. As a final step, we ported a multi-pass rendering component from a workstation platform to our mobile client software to handle the saliency modulation. Unfortunately, the techniques proved to be limit the performance of the device considerably. Notwithstanding, the work has provided an important foundation for several new “perceptually optimized” visualization techniques at the mobile platform: The “visible” direction focused on modifications to visual representations to improve visibility of complex representations, solving perceptual problems such as incorrect depth cues or spatial data occlusion. To find out to which level we could perceptually optimize the representations on the mobile client, we first performed an extensive study on perceptual issues of augmented reality, with a particular focus on mobile devices. After evaluation, we primarily worked on several issues till the end of the project, including the usage of isophotes and transparencies to improve visibility, and making modifications to the structural appearance of overlays. Isophotes, that resemble contour lines of a terrain model, form an unobtrusive way to color-code different forms of environmental data while still seeing the content below, being the video image, or any other activated layer of information. They also provide depth indications, improving depth perception problems with unmodified overlays. Isophotes, which are pre-processed during the simulation post-processing stage, work well with underlying transparent layers. Transparent layers make use of the multi-pass rendering functionality. Multi-pass rendering allows the rendering of disparate parts to textures or render buffers which are blended together in a final compositing step. Then we can separate parts of the application that are independent from one another in the graphics pipeline into layers (e.g. DTM, labels, UI). Each of these layers is rendered to a different texture and combined in real time using different blending techniques and off-screen rendering (FBO). Generally, end-users have reacted positively to our multivariate visualization approach, appreciating the quality of the different visualization types (even with their limitations) and finding the advanced visualization approach using 3D / Augmented Reality useful for improving environment analysis.
System components contributing to different layers.
2.4.4 Interaction The interactive visualization system offers both software and hardware interface components to support the applications at hand. The application promotes a logical workflow supporting the various monitoring and management tasks, the potentially shared understanding of observations and findings, and forms the basis for discussion and solution finding. Hereby, it proved useful to have limited access over simplified simulation functionality, to perform quasi ad-hoc analysis. Ultimately, the hardware also needs to be ergonomic: users need to take a specialized setup consisting of the display with several sensors that are used for capturing the environment and user localization. Such a setup, deployed with high-quality sensors, has not

HYDROSYS (224416) – D1.7 Final report, July 29, 2011 21
been available. Within the project we developed that several generations of these setups, which have successfully been used in trials and demonstrations. We also performed a mock-up test on perceptual factors that formed the basis for the visible appearance of the various generations of user interfaces, optimizing its visibility and readability. Data exploration To ease the data exploration, the application is centered on Shneiderman’s “Visual Information Seeking Mantra”. The application provides several overviews, which can be zoomed to create a specific focus. Subsequently, users can deploy various filters to select
data, and request more details where needed. Whereas these principles have been used widely in information visualization, our application introduces several novelties, which are foremost connected to the implemented view management principles. Users can explore the data that is ordered logically in multiple layers, similar to GIS applications but which is classified by information type rather than data type.. As one can see on the right, the layer menu holds different categories: RS (remote sensing, such as aerial or ground photography or blimp generated data), sim (simulation data), topo (topographic data), sensor (sensor data), 1d sim (one dimensional simulation data, as discussed here after), and notes (annotations). Following Shneiderman’s principle, users can browse data layers by deploying spatial, temporal or type-based filters. For filtering the sensors layer, and to avoid that users start to browse stations that are not in view (which would cause considerable confusion), we only browse stations that are in view. Once data is selected, its appearance can be adjusted as part of the view optimization tools that aid in improving the perception of data in the AR view. Furthermore, when more cross-referenced data is available, further
details can be requested. The data exploration is “guided” through automatically adjusting the user interface (menus, options) based on the selected data context.
Guided exploration of data, integration with modification of visualization
A special form of data exploration is the usage of the on-site simulation functionality. For doing this we coupled our mobile client with the MeteoIO middleware library developed as part of the GSN work. The library allows us to generate at run-time different spatial overlays resulted from spatial interpolation of 2D simulations (Alpine3D). Additionally the library can also support access to point simulation (SNOWPACK). An end-user can access these functionalities by defining a specific type step and different variables that will be used as an input to the library allowing us retrieve and graphically output the results in our AR Renderer. Collaboration The collaboration toolset offers a range of functions that can be used in relation to the explored data set. It includes collaboration methods, data processing, as well as a multi-view system. The collaboration methods encompass several ways of noting down ideas, by using semantic text-based annotations, and audio annotations. The semantic annotations are ordered logically according to the application at hand - examples include sensor failures, or specific observatory findings. The marking tools are a set of simple drawing tools which can be used to draw upon screen shots that can be taken by the user. An example of a marking task is taking a picture of a snow profile, and marking the various layers that can be observed. Furthermore, users are able to set up a voice communication channel using the Skype protocol, which is useful for dispersed teams on a site, as well as to communicate with remote parties. The view management is based on a multi-view layer built underneath the application. The view toolset focuses at creating a shared understanding and spatial awareness between participants of an (interdisciplinary) team. By default, the user is offered the first person perspective generated through the user’s own handheld camera. The first person perspective often is a direct way of filtering and zooming into a part of the data set: frequently, users only

HYDROSYS (224416) – D1.7 Final report, July 29, 2011 22
view a part of the complete data set as a direct effect of their position and viewing direction within the physical environment.
Different views in the multi-view system. Left: first-person view with remote cameras.
Right: browsing other perspectives/camera’s in 3D world view. Through the view menu, an additional map or 3D top-view overview of the environment can be activated. Users can also share viewpoints or access remote cameras that are not directly connected to a user. Examples are cameras that could be mounted at sensor stations, or below the blimp that can be deployed within our system. As a result, users can take different views and thus foci on the complete data set. Where appropriate, users are able to freeze the video image to take a closer look, or enable/disable the video. We performed various validations with the multi-camera techniques, and in general got very positive feedback from (end-) users: the system is found to be useful and usable to understand the site at hand better, and can be well used too to communicate or observe from a remote location.
2.4.5 Localization Within the project, people on the field are equipped with handhelds and mobile stations and have to be tracked in real time, in order to allow for correct augmentation of the video. The tracking is performed using a hybrid tracking system which fuses data from an IMU (inertial/magnetic unit), a GPS receiver, a Ubisense UWB localization system and a computer vision horizon tracking system. Sensor combines measurements using noise models to give the advantages of all of the systems: global localization via GPS, accurate local measurements from the IMU and accurate, high frequency global localization near to the UWB system and very high angular accuracy from the horizon tracking system. This UWB system has been realized by mounting sensors on a terrain vehicle rack at a certain height so that a line of sight condition all around the vehicle is possible. This solution has the advantage of being movable and easy as the sensors are mounted on the vehicle on a fixed configuration. The complete solution has been achieved successfully by creating a system that can be mounted either on a car or on self-sustained mobile tripods. It has been validated through several field measurements in Davos (Vehicle setup and tripods) and Cambridge (tripods).
To combine the measurements from the various sensors in a meaningful manner, the individual contributions have to be weighted according to the uncertainty of the respective sensors. To this end, UCAM has characterized the measurement noise of the individual sensors that are used in the hybrid tracking system. These error modes for each sensor must be known before their measurements can be combined in the hybrid tracking system. In experiments we have characterized the data from the IMU and GPS sensors, and used simulations to characterize the USB sensor (note that the horizon tracking system does not function in real-time).Finally, the individual measurements are fused to provide an accurate pose estimation. To achieve drift-free orientation tracking we have fused the measurements of angular velocity from the gyroscopes, the magnetic field direction from the magnetometer, and the direction of gravity from the accelerometers. To provide a reliable estimate of the user position, UWB and GPS measurements are used according to availability. We developed two different approaches to perform the data fusion, one based on the Extended Kalman Filter, the other on a general Bayes Filter. Our handheld client can easily integrate and take benefit of the new hardware and software tracking technology developed. Leveraging our plug-ins architecture, the handheld system can be easily configured to support these different tracking configurations: GPS + Inertial Tracking (raw data with in-built filtering), UWB + Inertial Tracking, UCAM Fusion Tracker. We conducted a certain number of tests in Davos and Cambridge with these different
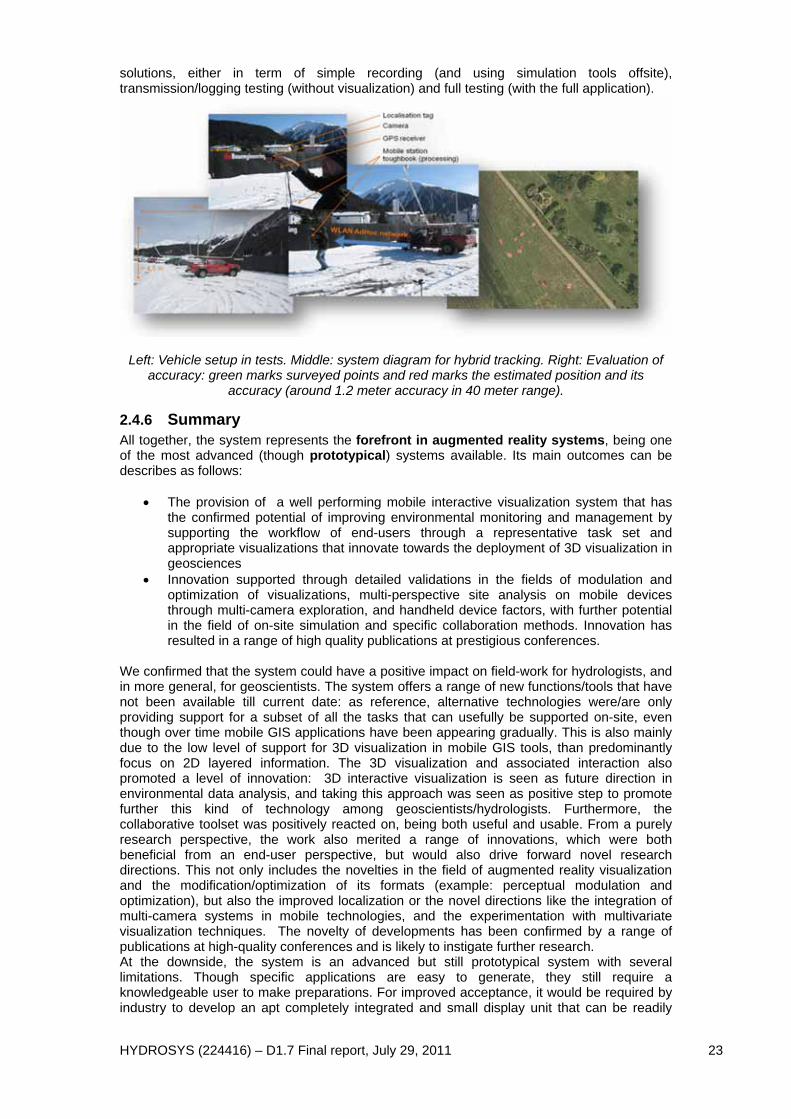
HYDROSYS (224416) – D1.7 Final report, July 29, 2011 23
solutions, either in term of simple recording (and using simulation tools offsite), transmission/logging testing (without visualization) and full testing (with the full application).
Left: Vehicle setup in tests. Middle: system diagram for hybrid tracking. Right: Evaluation of accuracy: green marks surveyed points and red marks the estimated position and its
accuracy (around 1.2 meter accuracy in 40 meter range).
2.4.6 Summary All together, the system represents the forefront in augmented reality systems, being one of the most advanced (though prototypical) systems available. Its main outcomes can be describes as follows:
• The provision of a well performing mobile interactive visualization system that has the confirmed potential of improving environmental monitoring and management by supporting the workflow of end-users through a representative task set and appropriate visualizations that innovate towards the deployment of 3D visualization in geosciences
• Innovation supported through detailed validations in the fields of modulation and optimization of visualizations, multi-perspective site analysis on mobile devices through multi-camera exploration, and handheld device factors, with further potential in the field of on-site simulation and specific collaboration methods. Innovation has resulted in a range of high quality publications at prestigious conferences.
We confirmed that the system could have a positive impact on field-work for hydrologists, and in more general, for geoscientists. The system offers a range of new functions/tools that have not been available till current date: as reference, alternative technologies were/are only providing support for a subset of all the tasks that can usefully be supported on-site, even though over time mobile GIS applications have been appearing gradually. This is also mainly due to the low level of support for 3D visualization in mobile GIS tools, than predominantly focus on 2D layered information. The 3D visualization and associated interaction also promoted a level of innovation: 3D interactive visualization is seen as future direction in environmental data analysis, and taking this approach was seen as positive step to promote further this kind of technology among geoscientists/hydrologists. Furthermore, the collaborative toolset was positively reacted on, being both useful and usable. From a purely research perspective, the work also merited a range of innovations, which were both beneficial from an end-user perspective, but would also drive forward novel research directions. This not only includes the novelties in the field of augmented reality visualization and the modification/optimization of its formats (example: perceptual modulation and optimization), but also the improved localization or the novel directions like the integration of multi-camera systems in mobile technologies, and the experimentation with multivariate visualization techniques. The novelty of developments has been confirmed by a range of publications at high-quality conferences and is likely to instigate further research. At the downside, the system is an advanced but still prototypical system with several limitations. Though specific applications are easy to generate, they still require a knowledgeable user to make preparations. For improved acceptance, it would be required by industry to develop an apt completely integrated and small display unit that can be readily

HYDROSYS (224416) – D1.7 Final report, July 29, 2011 24
taken into the field, since the current version is very portable but still too large. Also, over the years, several other improvements should be achieved (performance of graphics, experimental localization components), or the experimental exploration of the on-site simulation functionality to understand its full effects, which seems to have great potential.
2.5 Cell phone
2.5.1 Introduction Geomedia applications are new application types emerging to the mobile market. They engage the user with high levels of visualization, challenging the usual GIS approach. However, due to the limited resources of mobile devices, their emergence has been quite slow. 3D hardware enabled mobile phones have existed about 5 years, but most spatial 3D applications are still limited in their functionalities and visualization. For example, Google Earth Mobile only renders the land masses, and visualizes them with traditional terrain rendering methods, applying aerial photos. Content is geo-referenced, but only via coordinates, not semantic associations. Dynamic real time events are poorly supported. The HYDROSYS cell phone platform goes beyond state-of-the-art by delivering recognizable 3D outdoor environments to end users via cell phones, visualizing hydrological data in intuitive manner within the environment based on near real time wireless sensor feeds. The system facilitates collaboration between field and office. In general, the 3D view acts as active, bidirectional gateway to location based information, in our case supporting interactive placement of sensor stations and annotations. The cell phone platform advances the current state-of-the-art in mobile GIS and mobile visualization and paves way for more intuitive location based systems, engaging users with a mobile virtual environment. Objectives The cell phone platform requirements arose from the goal of providing an advanced observation and analysis platform for environmental data and processes on the field, from which both professionals and casual users could benefit. The UCD phase of HYDROSYS was designed to provide details on reaching this goal in the most useful manner. Technically, the system was required to be lightweight enough to run on currently available cell phones, providing a high degree of interactivity instead of pre-rendered animations or images. The networking system needed to be flexible enough to enable efficient transmissions of both large data sets (3D environments) and frequent small updates (sensor feeds). Users needed to be able to interpret the representation accurately and unambiguously, and to interact with the content. They need to be able to observe hydrological phenomena in their current spatial and temporal context and register their observations onto the system. The system was required to be easy enough for the casual user and still useful for the professional. Several scenarios were developed earlier in the project, to bridge the end user’s point of view with technical developments. The final cell phone platform is biased toward the case of environmental activist. The visualization allows passive spatial browsing, where the virtual environment itself reflects the current, measured state of the real environment, emphasizing and drawing attention toward hydrological phenomena. With a glimpse, the casual user perceives the current state – there is no hassle through menus or making special queries, but all data transfer, network optimizations and finally visualizations happen automatically. Should the visualization provide interesting cues, the user can deepen her observations, for example by verifying numerical values of the measurable or by observing the temporal characteristics thereof with graphs. Hereby, the system enables easy observation and monitoring, increasing one’s awareness of the state of the environment with a very low threshold. A number of general functional and technical criteria of success can be drawn from the requirements. In our Nordic scenario, the end user is required to pre-install the HYDROSYS cell phone client, but is not assumed to pre-install 3D environments, annotations or sensor data. These should be delivered as need arises, on the fly, as automatically as possible. In general, the system should be transparent to the user in the sense of which data is being utilized. The user does not need to know what is downloaded and when, nor does he need to make queries or establish streams (except for the case of administrators). The fundamental requirement for the visualization is to depict the environment in a manner where the user can perform self-orientation and other navigation related tasks – the user must be able to match the virtual and real environments. Unless this succeeds, hydrological representations have no spatial context. The visualization should be sufficiently smooth for interactive use.
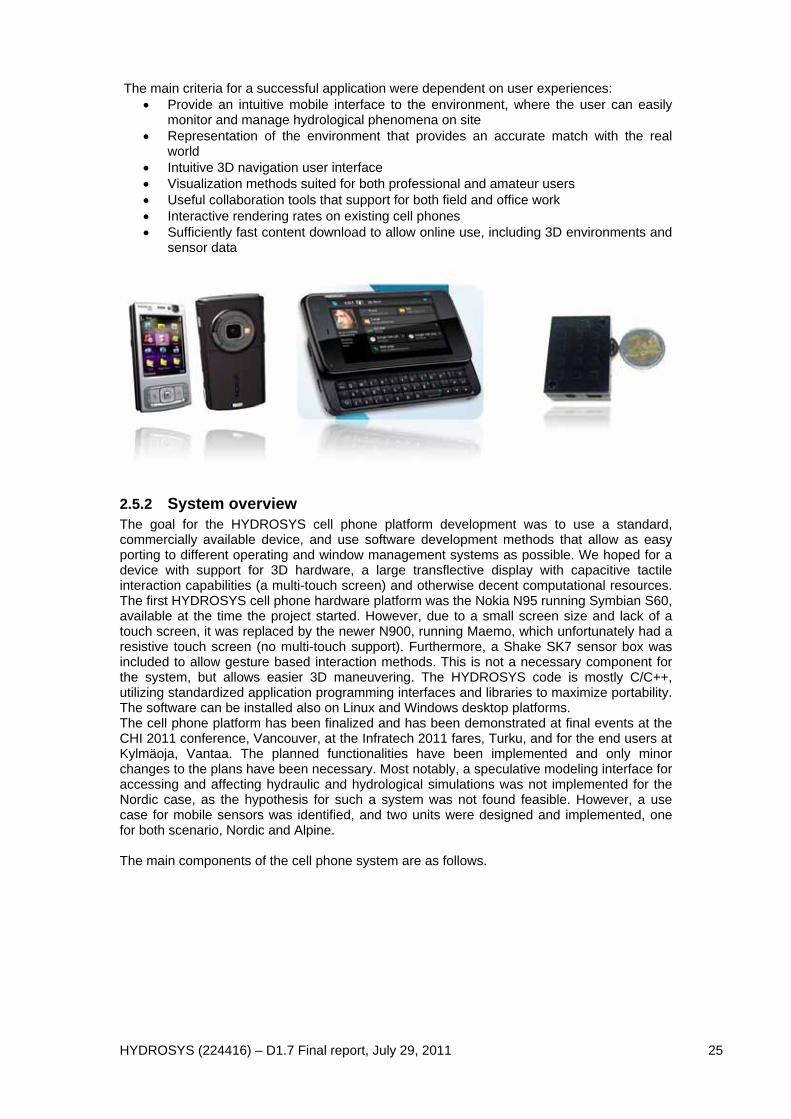
HYDROSYS (224416) – D1.7 Final report, July 29, 2011 25
The main criteria for a successful application were dependent on user experiences:
• Provide an intuitive mobile interface to the environment, where the user can easily monitor and manage hydrological phenomena on site
• Representation of the environment that provides an accurate match with the real world
• Intuitive 3D navigation user interface • Visualization methods suited for both professional and amateur users • Useful collaboration tools that support for both field and office work • Interactive rendering rates on existing cell phones • Sufficiently fast content download to allow online use, including 3D environments and
sensor data
2.5.2 System overview The goal for the HYDROSYS cell phone platform development was to use a standard, commercially available device, and use software development methods that allow as easy porting to different operating and window management systems as possible. We hoped for a device with support for 3D hardware, a large transflective display with capacitive tactile interaction capabilities (a multi-touch screen) and otherwise decent computational resources. The first HYDROSYS cell phone hardware platform was the Nokia N95 running Symbian S60, available at the time the project started. However, due to a small screen size and lack of a touch screen, it was replaced by the newer N900, running Maemo, which unfortunately had a resistive touch screen (no multi-touch support). Furthermore, a Shake SK7 sensor box was included to allow gesture based interaction methods. This is not a necessary component for the system, but allows easier 3D maneuvering. The HYDROSYS code is mostly C/C++, utilizing standardized application programming interfaces and libraries to maximize portability. The software can be installed also on Linux and Windows desktop platforms. The cell phone platform has been finalized and has been demonstrated at final events at the CHI 2011 conference, Vancouver, at the Infratech 2011 fares, Turku, and for the end users at Kylmäoja, Vantaa. The planned functionalities have been implemented and only minor changes to the plans have been necessary. Most notably, a speculative modeling interface for accessing and affecting hydraulic and hydrological simulations was not implemented for the Nordic case, as the hypothesis for such a system was not found feasible. However, a use case for mobile sensors was identified, and two units were designed and implemented, one for both scenario, Nordic and Alpine. The main components of the cell phone system are as follows.

HYDROSYS (224416) – D1.7 Final report, July 29, 2011 26
2.5.3 Visualization The cell phone platform provides 3D virtual environments as interactive environments for mobile users. Traditionally, 2D and 3D location based systems use quite simple data structures to represent data. Usually such data is geo-referenced. This means the data consists of essentially points, represented with an icon or billboard. However, when users perceive an environment, they do not consider absolute coordinates. People use semantic entities in their communication, such as „the pond“, „the path“, „the house“ etc. The cell phone 3D world supports such entities: the 3D scene is tessellated according to natural entities, dividing the scene to, as in the figure below, Water, Grass and Path elements, maintaining their hierarchy and topology. Each element (or chain of elements) can be associated with further data, such as sensor feeds or annotations. This division differentiates from GIS layers in that the actual geometry of the scene matches with the semantic entities. For the end user, these technologies allow her to address the environment based on natural features: she receives information related to a pond from the pond, not via an artificial point-based label; and, when she annotates the pond, she does not merely create a point with coordinates, she adds information to the pond itself. And when she queries more information from the pond, again she addresses the pond (or the entire water-ecosystem), not a point with a radius or a rectangle drawn around it.
The main potential for visualization arising from semantic segmentation is the ability to alter the way the elements are rendered. As the 3D visualization client receives sensor data, it modulates the environment. In the real world, solid content causes murkiness and discoloration of water. In our implementation, we vary the water visualization from a dull, dark matte to a highly reflective surface based on the measured solid content. The changes in the visualization take place in real time, as data arrives. For water temperature visualization, we use traditional coloring from blue to red. The first implementation of the cell phone platform performed rendering with OpenGL ES 1.0. A number of rendering features was implemented, including lightmaps to emphasize topography and translucency that is applied in tree rendering. More advanced methods, for example reflections, were implemented with OpenGL for desktops, and at the end of the last period, the entire client rendering engine was ported to OpenGL ES 2.0, with full shader support. Currently, a bug in our primary hardware platform, Nokia N900, prevents us from launching this final version on the phone (it runs in an ES 2.0 development environment). The version with simpler sensor-based modulations is fully functional.

HYDROSYS (224416) – D1.7 Final report, July 29, 2011 27
The cell phone visualization task was challenging. A mobile phone lacks memory and rendering resources, and battery power is limited. Our approach was to push as much computations to off-line processes as possible, relying mainly on look-up tables at run time. A natural way to select the renderable content is to use visibility. If a piece of a scene is not visible to the user, it need not be loaded to memory nor rendered. An offline visibility determination process to exhaustively go through the entire environment was implemented, to calculate all visible surfaces from every view cell in the 3D navigation space. Design constraints included analysis of visibility differences between neighboring cells, suitable view cell size selection and compression of the visibility lists. The pre-process also takes care of 3D content parsing and packaging onto efficient binary files. The complementary component for the off-line process is the run-time rendering engine, which
relies on the pre-determined visibility lists in loading and rendering 3D content. The run-time component manages all content through a cache system, minimizing the use of file I/O and keeping the memory consumption under a predetermined level. As usual with cached systems, the efficiency of the cache dictates the efficiency of the entire system. Our cache was engineered to yield maximal efficiency, based on performance benchmarks on both file I/O and CPU capabilities. The visibility based pre-process runs on Linux platforms, utilizing 3D hardware. The HYDROSYS clients run on Linux, Windows, Symbian and Maemo platforms, utilizing 3D hardware if available. In the beginning of the project, it was decided to build a 3D model of a case area manually, to have a test case for visualization, rendering and off-line optimization process development. During the last period, a method for automatically creating 3D models from pre-categorized LIDAR scan data was developed. Our case area data set did not include RGB imagery, but we were able to color code the geometry based on the categorization. The pipeline from LIDAR data to 3D models is now automated. The system utilizes the CGAL library, which was heavily extended (including writing completely new data types) to manage point clouds.
2.5.4 Networking and sensor data The HYDROSYS networking solutions focuses on the Smart Client. The Smart Client holds 3D content for the virtual environments, annotation databases, discussions and transcodes sensor data streams received from the GSN. A binary XML protocol was designed and implemented to transmit all content between the Smart Client and the cell phone clients. Most content delivery in the cell phone platform is implicit, where anything that is potentially visible to the user is automatically transmitted. The 3D scene content is after pre-processing essentially static. The mobile client sends its current view cell ID to the Smart Client, which transmits visibility data, followed by any required geometry and textures. Annotations and sensor data are dynamic in manner. In our earlier projects, we have encountered very dense sensor streams, for example robot data, which was impossible to deal with the traditional approach. An advanced system for managing dynamic entities was designed and implemented to the HYDROSYS cell phone platform, maximizing scalability.

HYDROSYS (224416) – D1.7 Final report, July 29, 2011 28
Typical spatial applications perform radius or rectangular area based queries at certain intervals. The HYDROSYS cell phone platform only sends its view cell ID, and implicitly subscribes to all visible updates. In general, the Smart Client can forward any dynamic events or data, up to moving entities such as GPS tracked users, to the mobile clients. In the Nordic scenario, the sensor data is gathered usually in semi-permanent sensor stations during campaigns. A sensor station is placed to a physical location, and associated with the scene. At network level, the station data is accessed via the station name. When a scene element with an associated sensor data feed becomes visible, the data will be transmitted to the client, which can then visualize it automatically without user intervention or queries. The data is stored at Smart Client for historical searches and graphs. Sensor stations are placed relatively seldom to the environment, and pose no computational challenge to a server. Annotations, however, can be instantiated at any time, and pose a bit more challenge. The HYDROSYS cell phone platform manages them with ease. Although not in original plan, the UCD studies resulted in a need for mobile sensors. Two mobile sensors were designed and implemented, including low level electronics, controls and Bluetooth communications. The sensors act together with a cell phone, which is used for initial calibration of raw data, transmitting measurements to the Smart Client, and associating the measurements to the 3D environment via the usual 3D view. The mobile sensors utilize the dynamic capabilities of the Smart Client to the fullest.
2.5.5 Interaction and collaboration A typical issue with advanced and new user interfaces is the slow learning curve. If a system is difficult to use, it may easily hinder all other benefits. If 3D navigation is too difficult, the users will not be able to focus in their main tasks, data exploration, monitoring of environmental phenomena, etc. Our earlier experience of 3D navigation with cell phones demonstrated the innate difficulties in 3D maneuvering with minimal controls, such as hardware buttons. For HYDROSYS, a new 3D navigation interface was designed, supporting touch screen navigation and sensor-based navigation. An external device, the SHAKE SK7, was selected to provide orientation information via the gyroscope and magnetometers. Several navigation metaphors were designed and implemented, and improved. Latest feedback came from the final events, and was incorporated to a fused navigation system, where buttons, the touch screen and the sensor-based maneuvering are integrated. The final system allows the user to use gestures to move in the 3D environment; for example, by rotating herself, the user rotates the view accordingly, maintaining a proper view orientation. Tilting the device raises or lowers the viewpoint. The view is by default tied to the GPS position, but for exocentric navigation, the user can detach the view and wander beyond his physical viewpoint, returning back with a single click. In addition to 3D navigation, users need to be able to use the more traditional interfaces fluently. The related tasks include data exploration, reading and creating annotations, and using the annotation and messaging system for collaboration. While our networking subsystem takes care of message and data transmissions, separate interface components were needed for these tasks. In general, everything in a scene can be accessed via context-sensitive pop-ups. They allow direct access to main functionalities such as sensor data plots, collaborative features such as annotations and discussions, routing (for environments with routable data available), bookmarks and some administrator features such as sensor placement, etc. The data plots provide traditional graphs, where the user can observe temporal

HYDROSYS (224416) – D1.7 Final report, July 29, 2011 29
characteristics, such as sudden peaks and trends, and compare the observed behavior to other variables. In general, we allow simultaneous monitoring of two sensor data flows, which the user can choose from sub-dialogs. Our dialogs also allow access to named individual sensor stations to allow location-independent observation of hydrological data; in this case, it is the burden of the administrator to apply and publish intuitive naming conventions. Our annotation system provides a casual or interactive gateway to the environment. One can take a photo and attach it to the scene, and forget about it, or one can undertake online discussions on the topic. Again, the networking component takes care of transmitting messages and photos transparently; and our semantic segmentation provides association to the scene elements directly. The annotations become
accessible via billboard icons or the elements (ponds, river segments etc) themselves. The main application user interface is implemented with in-house widgets, including menus, pop-ups, the graphs, scrollbars, sliders, buttons etc. This allows us portability over any devices that support OpenGL ES, but with the drawback that our interface is not based on the device/OS’s own widgeting system nor does it adhere to the device/OS’s own UI guidelines.
2.5.6 Summary User evaluations were performed heuristically by experts and qualitatively in the field and with end users.
• Users were able to successfully recognize the environment and perform accurate self-orientation based on the 3D view on location (matching the real and virtual environments was successful)
• Environmental monitoring with direct sensor data visualization together with the possibility for more thorough analysis with the graphs was found useful
• Sensor data visualization and content presentation is sufficiently intuitive for the public
• Usability of 3D maneuvering has increased significantly along with the touch screen and sensor based navigation
• Traditional graphs are still considered essential and useful by professionals • As some functionalities and menus are still a bit complex and intended for
developers, the HYDROSYS client as a whole is not yet at a “product” level. Especially the in-house widget system is not aligned with any particular device’s internal UI style (this was a design decision at the time when the main platform was Symbian; we chose to be platform independent in the UI).
Technically, the developed components match their requirements.
• The HYDROSYS cell phone client runs fully textured 3D virtual environments in 10MB of memory at interactive rates in the cell phone platform. Detail is preserved due to the memory management.
• The GSN connection is functional and sensor data feeds are transcoded with over 90% efficiency at Smart Client, and delivered to clients in scalable manner.
• 3D environments are transmitted to the client progressively, allowing navigation to take place almost immediately after launching the client.
In general, the HYDROSYS cell phone client matches the initial requirements and passes the criteria tests. The main drawback is currently a bug in N900’s graphics initialization library egl that prevents us from launching the most recent and shader supported version of the client. On desktop machines, the client runs successfully.
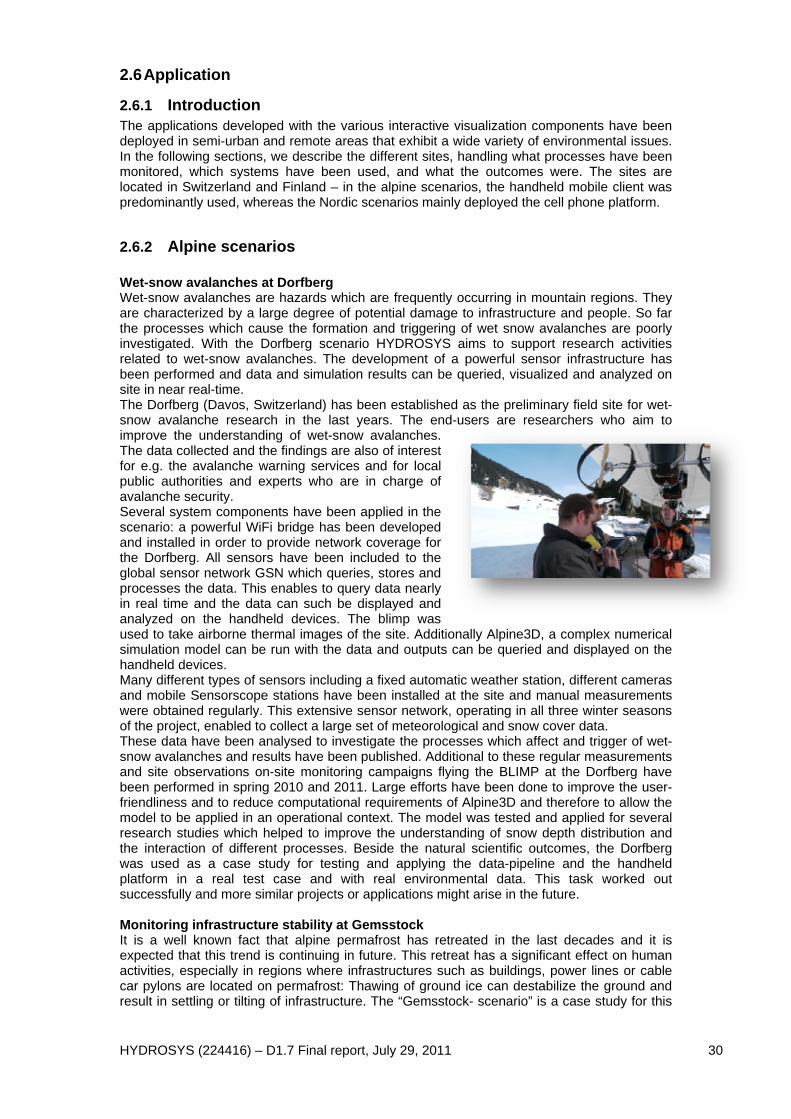
HYDROSYS (224416) – D1.7 Final report, July 29, 2011 30
2.6 Application
2.6.1 Introduction The applications developed with the various interactive visualization components have been deployed in semi-urban and remote areas that exhibit a wide variety of environmental issues. In the following sections, we describe the different sites, handling what processes have been monitored, which systems have been used, and what the outcomes were. The sites are located in Switzerland and Finland – in the alpine scenarios, the handheld mobile client was predominantly used, whereas the Nordic scenarios mainly deployed the cell phone platform.
2.6.2 Alpine scenarios Wet-snow avalanches at Dorfberg Wet-snow avalanches are hazards which are frequently occurring in mountain regions. They are characterized by a large degree of potential damage to infrastructure and people. So far the processes which cause the formation and triggering of wet snow avalanches are poorly investigated. With the Dorfberg scenario HYDROSYS aims to support research activities related to wet-snow avalanches. The development of a powerful sensor infrastructure has been performed and data and simulation results can be queried, visualized and analyzed on site in near real-time. The Dorfberg (Davos, Switzerland) has been established as the preliminary field site for wet-snow avalanche research in the last years. The end-users are researchers who aim to improve the understanding of wet-snow avalanches. The data collected and the findings are also of interest for e.g. the avalanche warning services and for local public authorities and experts who are in charge of avalanche security. Several system components have been applied in the scenario: a powerful WiFi bridge has been developed and installed in order to provide network coverage for the Dorfberg. All sensors have been included to the global sensor network GSN which queries, stores and processes the data. This enables to query data nearly in real time and the data can such be displayed and analyzed on the handheld devices. The blimp was used to take airborne thermal images of the site. Additionally Alpine3D, a complex numerical simulation model can be run with the data and outputs can be queried and displayed on the handheld devices. Many different types of sensors including a fixed automatic weather station, different cameras and mobile Sensorscope stations have been installed at the site and manual measurements were obtained regularly. This extensive sensor network, operating in all three winter seasons of the project, enabled to collect a large set of meteorological and snow cover data. These data have been analysed to investigate the processes which affect and trigger of wet-snow avalanches and results have been published. Additional to these regular measurements and site observations on-site monitoring campaigns flying the BLIMP at the Dorfberg have been performed in spring 2010 and 2011. Large efforts have been done to improve the user-friendliness and to reduce computational requirements of Alpine3D and therefore to allow the model to be applied in an operational context. The model was tested and applied for several research studies which helped to improve the understanding of snow depth distribution and the interaction of different processes. Beside the natural scientific outcomes, the Dorfberg was used as a case study for testing and applying the data-pipeline and the handheld platform in a real test case and with real environmental data. This task worked out successfully and more similar projects or applications might arise in the future. Monitoring infrastructure stability at Gemsstock It is a well known fact that alpine permafrost has retreated in the last decades and it is expected that this trend is continuing in future. This retreat has a significant effect on human activities, especially in regions where infrastructures such as buildings, power lines or cable car pylons are located on permafrost: Thawing of ground ice can destabilize the ground and result in settling or tilting of infrastructure. The “Gemsstock- scenario” is a case study for this

HYDROSYS (224416) – D1.7 Final report, July 29, 2011 31
impact of thawing permafrost in alpine areas and aimed to develop and test a monitoring system for such infrastructure.
The study site is the Andermatt (Switzerland) skiing resort. Parts of the cable car infrastructure are built on frozen ground and need to be monitored regularly. The site has been used for permafrost research for several years and is therefore equipped with several sensors like a permanent weather station or a borehole with several sensors. Involved end-users are the cable car company technical staff, the safety instructor and the permafrost researchers. The monitoring system consists of an orientation sensor which is directly linked to the handheld device on which the inclination measurements are
directly displayed. Several field campaigns were conducted in order to install markers and to test the performance of the system together with the end-users. This enabled to improve the user interface and to identify shortcomings in the sensor accuracy. Nevertheless the concept of in context visualization appears to be beneficial for the task. A further advantage is that the new setup enables to directly measure all 3 angels with one measurement. Additional repeated terrestrial laser scanning campaigns were performed and the data have been analyzed and published. Stream flow generation in La Fouly La Fouly refers to an alpine catchment on the southern Swiss border with Italy. Vegetation includes patches of trees, especially covering the very steep east-facing slopes where grazing is limited, though the predominant vegetation is grass approximately 50 cm high on average (though this can change noticeably within as little as one week, depending on precipitation). Much of the catchment has side slopes between 30 and 50 degrees from horizontal, making collection of observations a challenge. In La Fouly, the campaign was focused on understanding the sources of stream flow generation in an alpine catchment. In addition to the sensor network for field monitoring, with real-time data feedback, two different hydrologic modelling approaches were taken in order to better understand the physical processes observed in the field. In particular, it was discovered that a relatively simple lumped model was able to accurately capture daily and monthly variations in stream flow according to changes in snowmelt and precipitation. End-users are hydrologists and environmental scientists who can employ simple lumped models with confidence using the knowledge gained from this study. The 2009 and 2010 field campaigns carried out at La Fouly took place from June to October. The steep terrain required the use of wireless sensor networks, thus avoiding extra trips to remote stations for data collection. Sensorscope distributed wireless sensor networks were deployed throughout the catchment for measurement of surface meteorological and hydrological variables including incoming solar radiation, winds, air, land-surface, and soil temperatures, soil moisture and humidity. In October 2009 all 12 stations were removed and transferred to the EFLUM laboratory, taking care of keeping together sensors belonging to the same station to be able to reproduce the same sensor configuration for the following year's campaign. During 2010 two stations were left at the field site during the winter months; the harsh winter conditions made their operation a challenge, but some data was successfully collected. During fall 2010, several monitoring sessions with handheld devices, and network tests were performed, next to a deployment of the blimp. Work in La Fouly is on-going in 2011, this year with a dual emphasis on stream flow generation and fluxes of heat and moisture into the atmospheric boundary layer. It was found that snowmelt dominated stream flow while precipitation often had little effect, even when soil was near saturation, due to evaporation. Additionally, it was revealed that a relatively simple lumped model was able to accurately capture daily and monthly variations in stream flow according to changes in snowmelt and precipitation, while a more complicated distributed model was unable to more accurately predict these phenomena. This disparity derives from the fact that although more detailed physics is described by the distributed model, equally detailed initial and boundary conditions are virtually unavailable (detailed subsurface geology and water content, for example). The distributed wireless sensor network provided valuable information regarding the heterogeneity of meteorological and hydrological

HYDROSYS (224416) – D1.7 Final report, July 29, 2011 32
variables within the catchment, which is perhaps best used directly to validate a simple lumped model or create an analytical model of hydrological processes within the catchment. Furthermore, the improved simulation components inside the sensor network have eased the handling of simulations within this scenario.
2.6.3 Nordic Scenarios The major goal of the Nordic scenario in HYDROSYS was to conduct a detailed investigation into the nature of semi-urban watersheds hydrology. This investigation aimed to improve the understanding of environmental hydrology in the Nordic instance and to support the development of the HYDROSYS system for on-site modeling. This was achieved by following a sequel of steps starting with standard and sensor based data acquisition, processing, modeling and visualization of the results. Construction activities at Nummela/Ridalinpuro Ridalinpuro's watershed is partially overlapping the Nummela village, a satellite city with 50 km commute north-west of Helsinki. The watershed is partly urbanized, a typical sub-urban neighborhood affected by construction activities. The soils are in acidic, poorly permeable and prone to erosion due to sulphates deposited after the last ice age. The main aim in Nummela site was the environmentally sensitive hydraulic engineering focused on the design of ecological restoration and water quality management of a typical suburban area. Throughout the project lifetime a number of system components were developed for pursuing the established aim. The on-site monitoring campaigns were performed using commercial Luode water sensor stations equipped with a submersible optical YSI-600 water quality sensor and a pressure gauge. The sensor stations were connected to the GSN using custom written wrappers. A 1D hydraulic model was developed for the purpose simulating the water flow in the Ridalinpuro stream. A mobile smart client was developed for the data visualization part of the system. A 1D hydraulic model capable of computing water level and discharge at the hydraulic cross-section of a maximum three branched channel system was developed. The model was designed in a manner to be used as a system component. This involved computational and input output/optimization/integration optimization. The model uses the data from the campaigns as well as processed baseline data to simulate the channel flow. The baseline data was derived from LiDAR sources in a semi-automatic manner and served as support of the spatial domain of the modeling. The work in Nummela site commenced with identification of end-user groups which played a major role throughout duration of the project as they were involved in the establishment of the requirements for the system, the design of user interfaces and not at last the usage of the system. The end-users interacted with the system through a series of indoor and outdoor events as well as specialized workshops. During the monitoring campaigns sensors were deployed on-site and water quality parameters were collected to be used for analysis as well as development, calibration and validation of the hydraulic model. The main result here was the successful modeling of the channel flow in extremely small streams and spatial localization of the dominant hydrological processes in the catchment. In Nummela HYDROSYS facilitated the integration of highly heterogeneous data sources necessary for hydraulic modeling. Additionally, unlike in most of present day investigations, the focus was on peri-urban small streams and the efforts highlighted the dominance of channel geometry in the structure of the flow regime as well as the need for adjustment of friction coefficients in comparison to standard literature. Loading sources in the Kylmäoja catchment The Kylmäoja catchment is located in the South of Finland and its surface area is 22 km2 of which 75 % is within the Vantaa town and 25% is within Tuusula town. The catchment is very urbanized and current plans include more urbanization (e.g., the construction of a large logistic centre in Tuusula in the upper part of the catchment). The catchment features clayey soils that follow closely the valleys, with a topography dominated by moraines structured as shallow layers on short rocky hills. The aim of the work in Kylmäoja was the identification of loading sources in a suburban/urban stream for hydrological management purposes. The on-site monitoring campaigns were performed using commercial Luode water sensor stations equipped with a submersible optical YSI-600 water quality sensor and a pressure gauge. The sensor stations were connected to the GSN using custom written wrappers. A 1D hydraulic model was developed for the purpose simulating the

HYDROSYS (224416) – D1.7 Final report, July 29, 2011 33
water flow in the channel. Additionally, the model was published as a web processing service. Next to the cell phone 3D client, the handheld client deploying augmented reality visualization was used for the visualization of the sensor readings as well as the output of the simulation model. The very same hydraulic model was employed in the Kylmäoja site with the mention that a large amount of effort was directed to baseline data processing. The topography of the Kylmäoja catchment is much more complex in comparison to Ridalinpuro. This complexity is the result of extremely high urbanization. The effects of this large variance in elevation proved to be problematic in accurate terrain/objects segmentation, spatial interpolation of the terrain model, delineation of stream channel geometry as well as calibration and execution of the hydraulic model. Both sites of the Nordic scenario share their end-users. This is because of the spatial proximity of the sites as well as similarity of the goals. Therefore, an advisory
board of end-users was created serving as the end-user steering committee for both sites. Similarly to Nummela, the end-users interacted with the system through a series of events (indoor and outdoor meetings as well as specialized workshops). The intensive data monitoring campaigns proved to be of central importance in understanding the spatial distribution of quantitative and qualitative water parameters of the stream. Kylmäoja is prone to loading both from natural and human sources. The flow regime in the catchment is influenced by the high impervious coefficients which sharpen the hydrological response. A conclusion reached is that for small streams with complex catchment topography, the hydraulic engineering is much more sensitive to the channel geometry because the low water levels can easily cause dry-bed situations
and this poses serious computational challenges in spite of the theoretical reduced needs of large scale hydraulic modelling. Furthermore, a very important deed was to publish the hydraulic model online as a geospatial processing service. This favoured the interaction between the end-users and the data processing respectively modelling components.
2.6.4 Summary The sites proved to be a good basis for testing and demonstrating the developed systems to a wider public, in particular to our included end-user group. As such, the sites have been used to assess the usefulness (are the systems good for on-site monitoring and management?) and usability (can users really make use of the systems?), by prototypically using them in real monitoring sessions. Deployment at these sites has been challenging: they often pose harsh weather conditions, no power provision and the non- or only partial availability of network connections. Nonetheless, the systems have been successfully deployed, and the site observations have led to new or improved insights in environmental processes.

HYDROSYS (224416) – D1.7 Final report, July 29, 2011 34
3 Impact and dissemination Impact is an important aspect of the project’s success, assessing both the usefulness and usability of its outcomes. The impact assessment has been in close connection to the general user-centred design approach (section 1.3), which strongly included end-users throughout the various phases of the project. Within this section, we will take a closer look at both socio-economic and environmental impact (usefulness), but also the ease of operating the system, its usability. In the last section, we focus on how we disseminated the project, to address impact and secure potential exploitation.
3.1 Methodology Within the project, we have performed a range of actions to assess and analyze the potential impact of the research project outcomes, matching the various objectives we introduced in section 1. We performed of a large number of actions including direct user feedback through participatory design and deployment in applications, workshops and events, citizen involvement, advisory board involvement, and focused technical validations. The various stages of the research system prototypes have been discussed and demonstrated in regular end-users meetings, but also the various expert workshops and interviews. These demonstrations and discussions have often led to improvements in developments. These discussions did not only take place in workshop-like settings, but also within the applications. In particular the new data acquisition methods and the mobile clients have been used in regularly monitoring exercises that took place from the start of the project on. Monitoring exercises have been a great way of “guided usage” of in particular the mobile clients by end-users, who are generally not used to make use these, and the blimp. As such, the monitoring exercises were a great method to simulate real usage, to asses both their technical usability, but also their usefulness in potential future usage. Various components have been used at an almost regular basis in the daily routines, as part of the application scenarios. GSN has been almost continuously in use in the scenarios, in particular building atop previous experiences with the system at the Swiss institutes. From the first research prototype on, we have also frequently used system components in the field for testing purposes, to evaluate it’s working in preferably real conditions. Examples are the usage of the mobile client to check visualization of sensor data on-site or the data connection, verifying the various tracking components, or making recordings of the sites for usage in the office. Finally, a number of validations have been performed. All these actions have been taken to quantify and qualify usability and usefulness. To assess in particular the usefulness of the research prototype systems, we have made use of the IATOOLS structured impact assessment approach (proposed by the ERC joint research center), to assess potential future consequences of using the various tools offered. IATOOLS offers a range of question, which have been filtered to match the specific needs, and extended with project relevant issues. The main questions encompass:
Social: Does the public get better informed and may it obtain easier access to information, would services improve, and are there any social protection affects or educational influences?
Economic: does the research advance competitiveness position of European firms, and if yes, in which sectors, do the outcomes stimulate further research and developments, is the introduction of new technology to be expected, are there budgetary consequences?
Environmental: Can the outcomes improve water quality and reduce environmental risks, how do the tools impact the various stages in on-site environmental monitoring?
Within the following sections, we will assess the usefulness and usability in more detail.
3.2 Usefulness With respect to usefulness, we can state the following main outcomes of the impact assessment, which will be detailed in the next sections.
• The offered tools can raise public awareness and information access and offer educational value. In general services could improve.
• Experts confirmed potential economic impact, and positive effects on competitive position of companies. This may affect in particular SMEs and administration working

HYDROSYS (224416) – D1.7 Final report, July 29, 2011 35
within the field of environmental monitoring. Budgetary consequences are expected, but benefits were expected to cover for increased initial / operational costs
• The project outcomes was expected to facilitate introduction and dissemination of new technologies and products, and could well promote further academic and industrial research
• Experts confirmed the usefulness of the offered system methods/technology as complementary tool to normal office procedures to improve environmental monitoring and management. However, improvements would need to be made for professional usage, since they are still research prototypes.
• The system was confirmed to be useful for sensor setup and maintenance, as well as to ease data handling in general. The new sensors offered were positively reflected.
• Most experts reacted positively on the capacities of the mobile clients to improve monitoring and understanding of environmental processes and would potentially use them in the future after small modifications. Shared understanding capacities (for example the multi-perspective analysis of sites) were reflected very positively.
• Management as per annotation and collaboration support, and enforcement of plans were seen positively on, though users would not like to use the systems in mission-critical situations.
• The visualization and interaction approaches were positively reflected, confirming the quality of the data exploration methods, and the usefulness and quality of the multi-variate visualization.
3.2.1 Social and societal impact The HYDROSYS system has the potential to better inform the public about a particular environmental issue, improving public access to information. In general we see the following two main directions. To (a) raise public awareness: in particular the “front-ends” of the project (the mobile clients) can be used to raise the awareness on natural resources by sharing information on consumer systems. Secondly, (b) to offer educational value: requiring a basic understanding of the application, the mobile clients can be used to visually experience the consequences of environmental degradation, by showing data representing environmental processes directly in context to the real environment. Based on the security level of information (which is mostly public), in particular the cell phone could be well used as widely available platform, which extends the well established web-interfaces made available through the cooperation with SwissEx. The consortium is currently following this track to see possibilities. Furthermore, as confirmed by experts, the tools could be well applicable for “explaining”. For example, since HYDROSYS technologies are aimed at making environmental data easier to collect, view, and analyze, these technologies could potentially be used in an educational setting to help the public gain a first-hand understanding of environmental conditions and processes. Hence, education is a potential field of application for the future. To secure potential social impact, in particular the cell phone has been proven useful. It (a) represents an open platform that is widely available and is (b) quite straightforward (understandable) in its functional approach. The cell phones are front-end applications run on top of GSN to provide access to top-level environmental information. These applications are freely available and usable without much instruction. In contrast, the handheld application supports a slightly more complex interaction and visualization approach, targeted towards specialists. The potential for public access and involvement has taken place through the involvement of citizens in various stages of the project. These ways address different goals and can be seen as complementary actions, even though the underlying premise is the same: promote awareness of the project outcomes, and potentially interest in its usage. Citizen involvement has aided in improving potential social impact. This has been achieved via public dissemination, via the web-site or newspaper articles, but also through public events. Here, the public has been informed in “simplified ways” on what actions have been performed in the project, what results have been achieved and how these results could be useful. Several educational sessions took place, in particular open days and other public demonstrations at universities, to show and promote the potential usefulness of using the research systems for explaining environmental concepts in a school-like setting. Finally, in particular in the Nordic scenarios, citizens have been included in monitoring exercises at the sites. Lastly, experts agreed that the tools could have a positive impact on the quality and access to services: they confirmed that the tools are a useful addition (complementary tool) to their current work process, thus, it can be expected that services related to environmental monitoring / decision-making can be improved in quality.

HYDROSYS (224416) – D1.7 Final report, July 29, 2011 36
3.2.2 Economic impact Expert users confirmed the potential positive economic impact HYDROSYS system can have, and foresee marketing potential for both private companies and public sector. The competitive position of SMEs using the technology is expected to be strengthened, even though some interviewed companies thought the product doesn’t increase competitiveness, since their target groups don’t necessary need any extra services. This should, however, not be generalized – there is an increasing transition noticeable (mobile GIS) that supports the notion of on-site monitoring, among others supported through government organizations. Such transition will automatically result in the appearance of additional services. In general, the tools could certainly promote competitiveness of EU companies against EU rivals – currently, there is no commercial product available that has the same technical baseline as our system prototypes. Nonetheless, depending on the kind of service, investments would be required to make the prototypes market proof. Due to the modularity/variety of services that could be offered, exact numbers cannot be provided here. HYDROSYS may affect various sectors. HYDROSYS technology is highly connected to environmental monitoring, natural resources management and outdoor activities. In that context, HYDROSYS system will have a specific impact on SMEs or administration working within these topics. On a long term perspective the knowledge gained in HYDROSYS might result in improvements in natural disaster risk assessment. However, improvements would need to be made to the prototypes to perform in more “mission critical situations” – the current system is not directly intended for this purpose. Tools like direct sensor feedback or decision making support might improve the effectiveness of field work and therefore help to save time and resources. In direct relation, the developed technology may have consequences for SMEs. HYDROSYS technology provides an innovative way of doing environmental monitoring and managing natural resources by using new portable technology. Consequently SMEs using this technology will have potentially more mandates. On the other side, the obstacles of implementing this technology are the relatively high costs of the wireless sensing devices (which is expected to change in future in sense of affordability) and the specific training that users will need to use the full system. In relation to its deployment, most of the components are not subject to copyright or other IPR: the majority of software being developed is Open source, which is likely to lower to barrier for interested parties to try out components. Still, to make use of the offered tools, budgetary consequences should be expected. The tools possibly require both hardware (e. g. sensing stations, camera) and services to be set up. Furthermore, going out in the field takes time, and thus money. However, HYDROSYS may save time and money avoiding back and forth travel from office to on-site. Experts agreed, though, that the knowledge and positive effects (including economic) gained by using the technology would be far more significant than the actual expenses. In a long run, HYDROSYS may change the way how administration (generally in charge of these tasks) is managing these environmental resources. It has been difficult to assess the actual budgetary frame, since this often depends on the goal of the end-user and the available infrastructure. The budgetary frame may include hardware, but in particular the support personnel may produce additional costs. This, however, is no necessary restriction. Various discussions performed with decision makers of the Federal Office of the Environment (Switzerland) confirmed that governmental authorities very much see a bright future for mobile tools such as developed in the project, and would certainly invest in such technology in the long run. The project results are expected to facilitate the introduction and dissemination of new technologies and products. The main goal of HYDROSYS system has been the implementation of new technology and put together several tools in order to demonstrate how environmental monitoring and managing natural resources could be improved. In that context and as the development of such a system underline so many technical and scientific challenges such as accuracy and portability of the mobile device, HYDROSYS really stimulates research and development and obviously promotes new technology. In a wider context the research affects computer science / information technology in general, including mobile technologies, visualization, groupware, or robotics, but also sensor networks. We believe that principally all significant outcomes of the project may instigate further research, which has largely been confirmed by external specialists. HYDROSYS technology will also certainly promote academic and industrial research. The offered mobile tools, both the handheld and the cell phone, present the forefront in mobile applications/interactive visualization. As is currently promoted through system and application papers, HYDROSYS is getting much attention on these new systems; hence, new research in

HYDROSYS (224416) – D1.7 Final report, July 29, 2011 37
a variety of related techniques is expected. On the other hand, for example environmental scientists are very interested in wireless sensor networks because this innovative tool has the potential to vastly facilitate and improve the understanding of complex environmental processes such the triggering factors of natural hazards (e.g. wet snow avalanches). HYDROSYS real-time field visualization tools and techniques are complimentary to wireless sensor networks, and so should be developed and utilized in parallel. As a result, HYDROSYS is expected to stimulate research at least in the following areas.
3.2.3 Environmental impact As a baseline, the project outcome was found be useful as complementary tool to normal office procedures to improve environmental monitoring and understanding, confirming our main goal of the project. Because of its complementary nature, users have varying opinions on where the tools can be best used. The usefulness of the tools within the applications/scenarios of the project was seen positively. Users often prefer a specific toolset tailored to their needs, limiting the overall toolset to a specific scope. The premise that the tools could ease decision-making was supported, especially in short term (“urgent”) assessments, installation of sensors, and in cooperative setups. Urgent assessments should, in this case, rather be seen as short-term, quick assessment of a situation, not necessarily aiming at a mission-critical situation. Since the tools support decision-making processes in an extended way, it can be expected that solutions found could improve water quality and decrease likelihood and effects of natural disasters. Given that there are many factors influencing quality and quantity of surface and groundwater, as well as natural disasters in general, quantitative assessment is difficult. Nonetheless, as was reported in the hydrological findings sections of the application chapter, various findings have been reported that clearly contribute to the quality of water, and the mitigation of potential problems. To assess in more detail the environmental impact, we will now take a deeper look at the results of HYDROSYS in direct context of monitoring and management of processes, by handling the various “stages” in a workflow. Sensor setup and maintenance, data pipeline: In general, users reacted very positively on sensor setup maintenance aids, and the directions followed for implementation. The direct feedback on the content and usefulness of a (manually) placed sensor is found to be useful, since it can improve the quality of measurement as well as ease the set up of sensor networks. An example is the direct feedback during usage of a manual sensor, which can save time and avoid returning to site to take samples again (are the measurements appropriate? Do I need more?). To test sensors, whether sensors are working properly can be seen through showing meta data was found to be beneficial by all parties. End-users may require services though: currently, end-users do not necessarily make use of automated networks of sensors. Furthermore, many are not used to configure, use and maintain databases and the required mobile devices. Nevertheless, the applications (scenarios) proved that the data pipeline is working well for a research system prototype. Experts also expressed interest in the usage of the mobile sensor, as has been provided by Aalto. In relation, the system would also be beneficial for combination with specialized sensors: for example, the usage of the SLF SnowMicropen system would certainly benefit from obtaining direct feedback in the field, while taking samples with the device. With regards to the blimp, most users saw clear benefits of using the blimp for terrain model refinement and thermal data capturing, but could not assess if the institute could afford it. With respect to the data pipeline, it was expressed it would be very beneficial if the demo could be easily modified, meaning, the self-setup of an application by “loading a terrain model and sensor data”. Principally, this is possible and not very complex (some tools are provided, like the profile manager and data preparation tool), but we did not test the process with end-users. Most users did see relative advantage of the tools to improve the data pipeline, but the comparison is difficult here: most users make use of GSN and the web interface to access sensor data in the office, which, from an office perspective, is quite similar to what our application provides. Monitoring and understanding environmental processes: The general stance of most experts was positive towards using presented tools in on-site monitoring. Systems are seen as advantageous, even though they may consume time for getting used to, and to actually use (deploy) them. Experts clearly expressed that on-site monitoring using the offered toolset

HYDROSYS (224416) – D1.7 Final report, July 29, 2011 38
is very useful, and extends office-only workflows. The user background had an effect on user feedback in some of the expert interviews – on-site visitors reacted very positively, while office-based workers did react average to using such tools. In general, the positive users would take such a kind of application in the field, however (in case of the handheld), changes would need to be made. Users expressed they would only take the system in the field if it would be smaller, even though technically, the choice of such a platform would pose a number of constraints on the application. These constraints are not always understood to full extent by the end-users. Nevertheless, to leave the prototypical stage, smaller devices with good sensors would be needed, which is a factor which cannot be covered within the current project. In addition, there was interested in using the software still in a more modular way, selecting only those components that are useful for the specific task at hand. With respect to understanding environmental processes, we obtained positive feedback, which is also further explained in the “visualization” part of the usability section: the visualization approach is found to be very apt for doing analysis of environmental processes in the field. The notion of a shared understanding system was also reflected very positively on by the interviewed experts, reflecting the multi-camera system on the handheld. This is particularly interesting since most experts know their sites very well. Interest was also expressed in coupling to the “local observation” of micro-sites a regional or national model, to explore sensor data while generally being on the road. Currently, such a system would be difficult to assess due to the processing power of the mobile computers to process larger models, but this can certainly be foreseen in the future. Most users reported that the handheld-based tools could be very useful for specialists from research institutes, but not so much suited to communicate information to the general public: here, the cell phone demo seems more suitable, since it is less focused on advanced users. Users were unable to unanimously answer if they would pay for services, since they are not generally used to deal with such issues (see budgetary considerations previously). In general, the various monitoring exercises proved that the offered toolset is advantageous for improving environmental research on-site, which may ultimately lead to improved understanding of complex processes. Management of environmental processes: The experts were positive about the systems to have potential to improve decision-making processes, though it was often hard to qualify its actual effects: decision processes vary widely between the different user groups and applications. Most users reported in particular positively on using the system for communication and annotations. For example, the marking tools were seen beneficial to make small “notes” on screen shots, for later usage. The tools even seemed in order for reporting plans: the annotations are not suited for more complex documents, but ratings were on the positive side. Using the systems in mission-critical situations was not seen positively, but our system has never been intended for this purpose. Mixed team decision-making also did not receive good ratings for the handheld, which is because the tools are rather specialized. Previously, the tools were found to be advantageous to enforce plans, in particular to see the effects of new (physical) changes made to the environment, for example as part of new infrastructure. Also, low-level decision-making was seen positively on – experts expressed the usefulness of using the system for non-critical discussions, like between an on-site user fixing a station, and remote electrician. Both short-term and long-term decision making may benefit: those situations that require a quick validation of a situation before a particular action is undertaken can be improved, as well as those situations in which multiple users with different perspectives need to discuss a situation in a short-term manner. These methods only support the decision-making, and are not aimed to be part of official warning / evacuation schemes. Complex team-work scenarios, outside simple sharing of observations, were also not reflected positively on. These kinds of scenarios, however, are generally difficult with any mobile technology currently available. In general the toolset is thought to provide extra information that may lead to financial benefits because of optimized decision-making supported workflows. This is found to be especially useful in monitoring rapid changes, e.g. evaluating effects of instantaneous emissions or environmental accidents and deciding and allocating needed actions. Here, of course there is a direct dependency with deploying highly dense and fast sensor networks. Augmented Reality in particular was thought to be useful e.g. in field investigation, when it enables making decisions already in the field. This is targeted more towards the enforcement of decisions taken. E.g. decision could be made about road construction or observe how accumulation of sediment to one part of the stream affects to other parts.

HYDROSYS (224416) – D1.7 Final report, July 29, 2011 39
Relationship between understanding and mitigation: In general we received positive feedback on improving the understanding of environmental processes using the offered toolset. Understanding is the process of defining a problem space and context, representation, interpretation, verification of understanding, and documentation. The interpretation of environmental processes is improved by providing the spatio-temporal context: users can observe a “complete model” of the environment and its processes, verify observations directly in the environment, have shorter feedback loops with other users, and work at different scales. End-users confirmed the useful role of our technology in this process, which positively affects mitigation of problems. The understanding and mitigation processes are highly entangled processes: understanding is the premise on which mitigations need to be based. Within the HYDROSYS project, both processes are a collaborative process, encompassing various end-users that may have different backgrounds. Hereby, it is important to note that HYDROSYS only provides tools to aid in understanding of the environmental processes, and not any automated decision-support tools: the decisions are ultimately taken by the end-users, not the system. As a result, the role of HYDROSYS can rather be seen in aiding the creation of understanding of processes (events) in direct relation to its spatial and temporal context (in-situ), supporting and hopefully improving the decision-making processes that are based on a common understanding between the various partners involved. Short and long term impact: On-site environmental monitoring and HYDROSYS technology can be very useful because it provides communication and exchange methods (e. g. images, data, graphs) from an on-site observer to decision makers who are generally at workplace and vice versa. The visualization capabilities of this system such as overlapping heterogeneous data creates new on-site analysis possibilities. In other words, with HYDROSYS technology, end users will have a better view of the global situation before, during and after an event with the image transmission and overlapping functionalities. End-users may also optimize their workflow, doing onsite and online analysis and avoiding back and forth travel from office to onsite. Finally, they will have a more complete and better visualization of the field/environment when they are in office or headquarter. Nonetheless, the system still is in a prototypical though stable state, it is not a product. Limitations in the system, which are mostly of maintenance nature, but also on for example the level for data interpretation support, limit its immediate usage. Modifications, though, should be doable quite easily. The HYDROSYS system is a new technology that promotes innovative tools and that could have a competitive impact on universities or firms. Of course implementing this technology within national, regional or local administration that is in charge of managing natural resources will take some time and require careful adjustment to the specific needs. Moreover, such an implementation will have a cost because staff needs to be educated. Nevertheless HYDROSYS has potential to change the way how environmental monitoring is done. Workflow is one of the key issues in the usage of the various system components by end-users. Whereas some tools, like the sensor network system, are close to a current workflow, other tools, such as the blimp or the mobile clients, are further away from the current workflow and may need more drastic “rethinking” as well as new ways of support. The long-term impact assessment has focused on high end users at national and cantonal / regional levels. Among others, meetings were held with the Federal Office of the Environment (Switzerland) since they are responsible for national flood forecasting and once with the Cantonal Ministry of the Environment. The office reacted very positively on both the application background and technology usage, and strongly suggested to continue. The same office also confirmed, as mentioned earlier, the generally positive impact of mobile technologies in environmental monitoring. To further secure impact after the projects end, there are several actions that could be undertaken. First of all, it would be beneficial to perform further pilot projects, either experimental or commercial, to assess the final research prototypes, in particular through (a) longer term assessments or (b) to particularly look into benefits of certain modules of the total system. Based on pilot projects, as a next step it would be beneficial to set up commercial services. Whereas it is possible to port some of the modules into a commercial context, some aspects certainly still need to be improved, For example, a smaller but high-quality platform would be needed for the handheld platform, which would require industrial involvement. Considerations are taken by the consortium to follow up these actions. From a research perspective, the consortium continues to promote scientific results by publishing the final system outcomes. Further publications (conference and journal) are
HYDROSYS (224416) – D1.7 Final report, July 29, 2011 40
expected to appear soon, and will be referenced on the HYDROSYS website. Furthermore, efforts are undertaken to extend promising components into new research projects, though further details cannot be given here. 3.3 Usability The technical usability of in particular the mobile clients has been assessed in various technical validations (which also included performance tests of for example localization or sensor network components), and focused interviews and questionnaires with end-users and experts in various related fields. In this section, we foremost report on the general technical usability instead of detailed performance tests, illuminating how well in particular the technical aspects of the interactive visualization work. Visualization: During the analysis of the various visualization aspects we noticed a clear transition of the field towards understanding the benefits of 3D visualization, as well its actual usage. Initially, participants had different opinions about needs and benefits of (3D) visualization. On the one hand data gathering and processing were seen as the most important components of HYDROSYS-system and visualization as just a “nice” add-on. On the other hand other experts saw visualization as fundamental part of the system. Also, at the start of the project, we had varying reflections on 2D/3D visualizations, were in general, 3D was thought to be useful, but not in all cases: users stated that in many situations the position of sensors and overlay of numeric data on top of a map would be enough (relating to traditional map-based overlays used in GIS systems). This affected our development to a great extent, taking a comparative visualization approach that makes use of various 1D, 2D and 3D formats to support the different users/tasks at hand. It also partly, contradicted with positive feedback we obtained on simulation results access in the field, particularly for sensor placement support / manual sampling. Users did find 3D visualization useful for those situations in which spatial data sets are the basis for analysis (including “hidden” information), or for those users that have difficulties reading maps. As such, it may certainly help multi-disciplinary teams of users were different users with different levels of experience cooperate. However, 3D visualization may also make interpretation overly complex. Experts might prefer using 2D, but a non expert understands 3D-visualizations more easily - When working in unfamiliar environment 3D-visualization is more useful than 2D-visualization. The ability to visualize and compare different sources of information was found to be advantageous for decision-making. The usage of video overlays (AR) was found to be useful in the field, though not for all visualization purposes, but also merits possible usefulness in the office. Towards the end of the project, the reflection of 3D visualization, as well as the general multivariate visualization approach, improved notably: Without exception, users found the 1D, 2D and 3D data formats very useful to use for environmental analysis, and were very positive towards accessing and comparing these different representations. Most users saw 3D visualization as a key future direction for geoscientific visualization. Also, the usage of overlay (AR) was also rated well by most users, with few users still skeptical: information could be well mapped to the environment, confirming the in-context visualization approach. The representations were generally of appropriate quality for assessment, even though observing the representations and reading text in outdoor situations received low marks for the handheld: in bright conditions, the screen quality is still unacceptable. One particular aspect rated very positively in related to visualization/analysis was the usage of the multi-camera system to assess a site from different viewpoints. Here, users saw large potential, both for on-site analysis as well as post-analysis in the office. The end-users position towards 3D visualization in general was confirmed by users of the cell phone platform too. The quality of visualization was found to be apt, though text is on the small side, and information could be well enough matched to the environment. User interfaces: Users tend to have a longer learning curve with new user interfaces in general. There is a preference for “single button” interfaces and metaphors that are known from other handheld devices such as phones. To this respect, functionally, users do not always need all the functionality that we offer: often, users were interested in a particular set of functionality. In practice, the final user interfaces for the mobile clients, and their underlying metaphors worked out well: learning curves were quite short to make use of mobile devices, with the exception of non-specialist usage with the handheld system. The handheld device is aimed at specialists and non-experts clearly had problems operating the device. Also, some icons could not always be understood during an initial validation, which was solved by
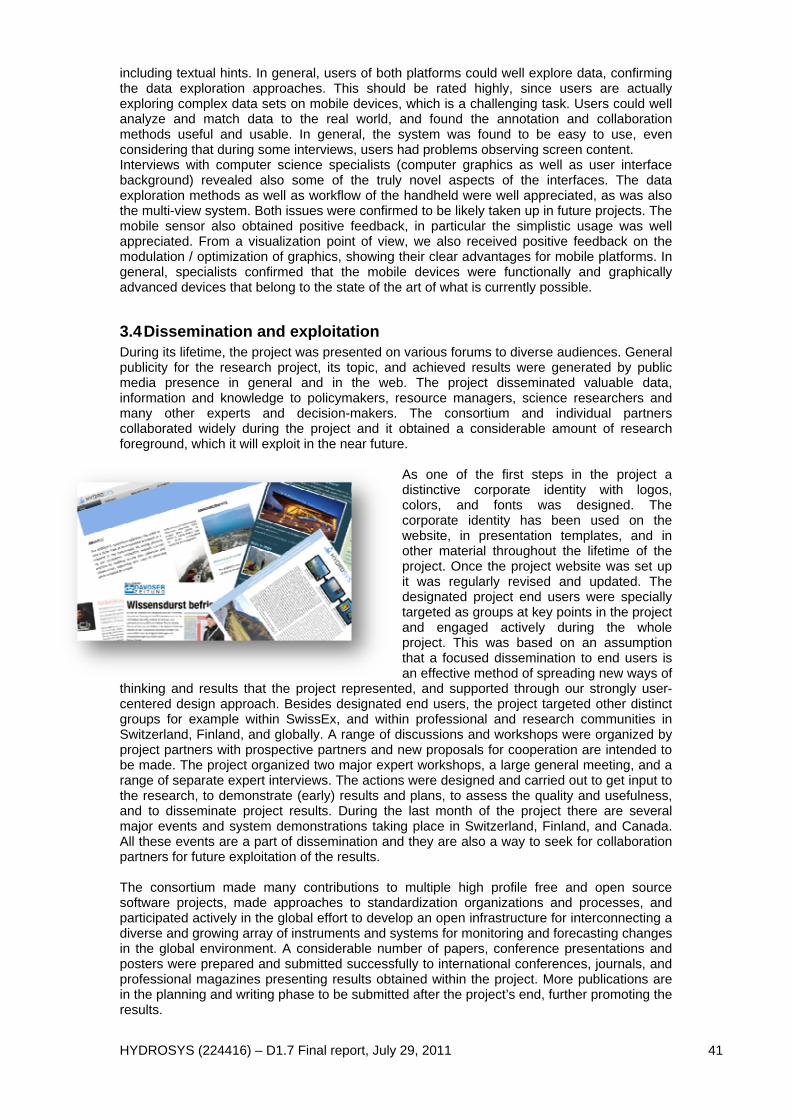
HYDROSYS (224416) – D1.7 Final report, July 29, 2011 41
including textual hints. In general, users of both platforms could well explore data, confirming the data exploration approaches. This should be rated highly, since users are actually exploring complex data sets on mobile devices, which is a challenging task. Users could well analyze and match data to the real world, and found the annotation and collaboration methods useful and usable. In general, the system was found to be easy to use, even considering that during some interviews, users had problems observing screen content. Interviews with computer science specialists (computer graphics as well as user interface background) revealed also some of the truly novel aspects of the interfaces. The data exploration methods as well as workflow of the handheld were well appreciated, as was also the multi-view system. Both issues were confirmed to be likely taken up in future projects. The mobile sensor also obtained positive feedback, in particular the simplistic usage was well appreciated. From a visualization point of view, we also received positive feedback on the modulation / optimization of graphics, showing their clear advantages for mobile platforms. In general, specialists confirmed that the mobile devices were functionally and graphically advanced devices that belong to the state of the art of what is currently possible.
3.4 Dissemination and exploitation During its lifetime, the project was presented on various forums to diverse audiences. General publicity for the research project, its topic, and achieved results were generated by public media presence in general and in the web. The project disseminated valuable data, information and knowledge to policymakers, resource managers, science researchers and many other experts and decision-makers. The consortium and individual partners collaborated widely during the project and it obtained a considerable amount of research foreground, which it will exploit in the near future.
As one of the first steps in the project a distinctive corporate identity with logos, colors, and fonts was designed. The corporate identity has been used on the website, in presentation templates, and in other material throughout the lifetime of the project. Once the project website was set up it was regularly revised and updated. The designated project end users were specially targeted as groups at key points in the project and engaged actively during the whole project. This was based on an assumption that a focused dissemination to end users is an effective method of spreading new ways of
thinking and results that the project represented, and supported through our strongly user-centered design approach. Besides designated end users, the project targeted other distinct groups for example within SwissEx, and within professional and research communities in Switzerland, Finland, and globally. A range of discussions and workshops were organized by project partners with prospective partners and new proposals for cooperation are intended to be made. The project organized two major expert workshops, a large general meeting, and a range of separate expert interviews. The actions were designed and carried out to get input to the research, to demonstrate (early) results and plans, to assess the quality and usefulness, and to disseminate project results. During the last month of the project there are several major events and system demonstrations taking place in Switzerland, Finland, and Canada. All these events are a part of dissemination and they are also a way to seek for collaboration partners for future exploitation of the results. The consortium made many contributions to multiple high profile free and open source software projects, made approaches to standardization organizations and processes, and participated actively in the global effort to develop an open infrastructure for interconnecting a diverse and growing array of instruments and systems for monitoring and forecasting changes in the global environment. A considerable number of papers, conference presentations and posters were prepared and submitted successfully to international conferences, journals, and professional magazines presenting results obtained within the project. More publications are in the planning and writing phase to be submitted after the project’s end, further promoting the results.
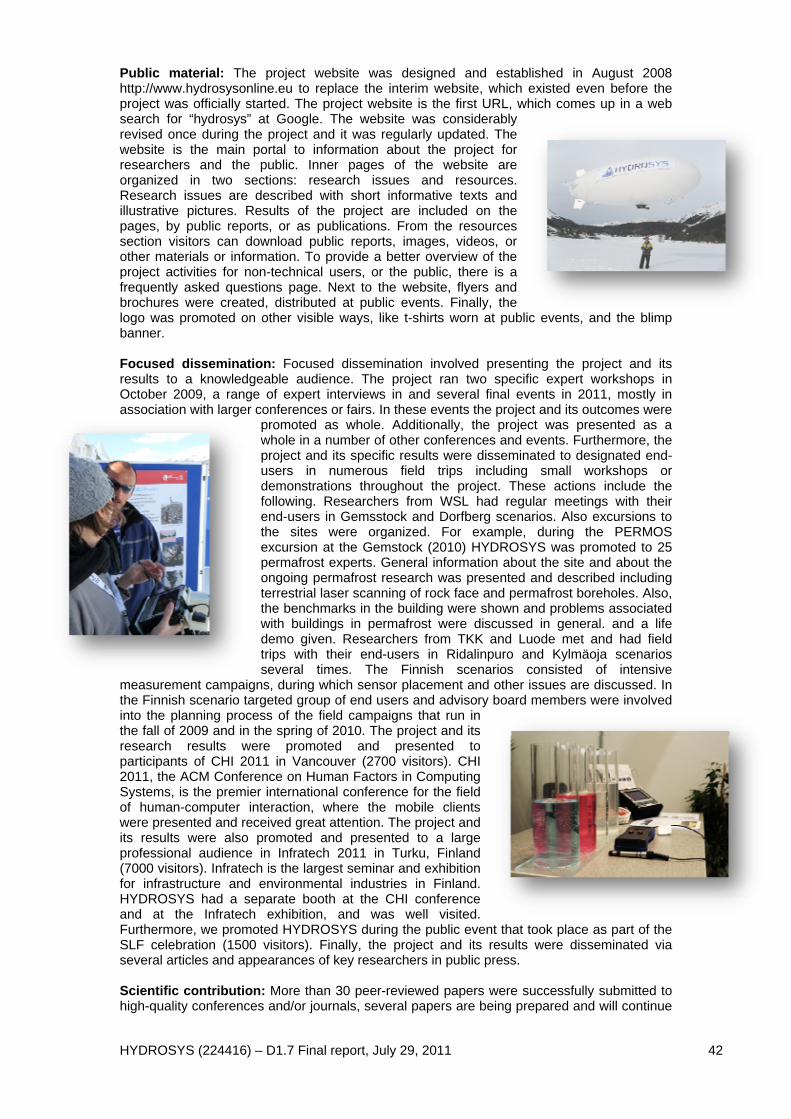
HYDROSYS (224416) – D1.7 Final report, July 29, 2011 42
Public material: The project website was designed and established in August 2008 http://www.hydrosysonline.eu to replace the interim website, which existed even before the project was officially started. The project website is the first URL, which comes up in a web search for “hydrosys” at Google. The website was considerably revised once during the project and it was regularly updated. The website is the main portal to information about the project for researchers and the public. Inner pages of the website are organized in two sections: research issues and resources. Research issues are described with short informative texts and illustrative pictures. Results of the project are included on the pages, by public reports, or as publications. From the resources section visitors can download public reports, images, videos, or other materials or information. To provide a better overview of the project activities for non-technical users, or the public, there is a frequently asked questions page. Next to the website, flyers and brochures were created, distributed at public events. Finally, the logo was promoted on other visible ways, like t-shirts worn at public events, and the blimp banner. Focused dissemination: Focused dissemination involved presenting the project and its results to a knowledgeable audience. The project ran two specific expert workshops in October 2009, a range of expert interviews in and several final events in 2011, mostly in association with larger conferences or fairs. In these events the project and its outcomes were
promoted as whole. Additionally, the project was presented as a whole in a number of other conferences and events. Furthermore, the project and its specific results were disseminated to designated end-users in numerous field trips including small workshops or demonstrations throughout the project. These actions include the following. Researchers from WSL had regular meetings with their end-users in Gemsstock and Dorfberg scenarios. Also excursions to the sites were organized. For example, during the PERMOS excursion at the Gemstock (2010) HYDROSYS was promoted to 25 permafrost experts. General information about the site and about the ongoing permafrost research was presented and described including terrestrial laser scanning of rock face and permafrost boreholes. Also, the benchmarks in the building were shown and problems associated with buildings in permafrost were discussed in general. and a life demo given. Researchers from TKK and Luode met and had field trips with their end-users in Ridalinpuro and Kylmäoja scenarios several times. The Finnish scenarios consisted of intensive
measurement campaigns, during which sensor placement and other issues are discussed. In the Finnish scenario targeted group of end users and advisory board members were involved into the planning process of the field campaigns that run in the fall of 2009 and in the spring of 2010. The project and its research results were promoted and presented to participants of CHI 2011 in Vancouver (2700 visitors). CHI 2011, the ACM Conference on Human Factors in Computing Systems, is the premier international conference for the field of human-computer interaction, where the mobile clients were presented and received great attention. The project and its results were also promoted and presented to a large professional audience in Infratech 2011 in Turku, Finland (7000 visitors). Infratech is the largest seminar and exhibition for infrastructure and environmental industries in Finland. HYDROSYS had a separate booth at the CHI conference and at the Infratech exhibition, and was well visited. Furthermore, we promoted HYDROSYS during the public event that took place as part of the SLF celebration (1500 visitors). Finally, the project and its results were disseminated via several articles and appearances of key researchers in public press. Scientific contribution: More than 30 peer-reviewed papers were successfully submitted to high-quality conferences and/or journals, several papers are being prepared and will continue

HYDROSYS (224416) – D1.7 Final report, July 29, 2011 43
the dissemination after the project’s end. Furthermore, the project researchers prepared presentations and posters for a large number of scientific conferences. Two doctoral dissertations were successfully defended by project researchers during the project, several more dissertations are expected to appear based on project work. The project released and contributed to several high-profile open-source software projects. HYDROSYS cooperated closely with the SwissEx initiative, by actively exchanging research results. HYDROSYS made use of the GSN base infrastructure, extending GSN with some specific components for on-site monitoring. Several other scientific collaboration activities were carried out including collaboration aiming towards standardization. Exploitation of the foreground: HYDROSYS has produced notable outcomes, most of which are either knowledge or things built using knowledge: software or combined software—hardware prototypes. The main outcome is the research system prototype that has been developed alongside actual measurement campaigns. The knowledge and components developed are related to the main theme of the project, which is “geospatial analysis tools for on-site environmental monitoring and management”, a subtheme of the programme theme “collaborative systems for environmental management”. Knowledge, i.e., research products, in physical form is either documentation or manuscripts describing the prototypes and their design, their use, results and experience obtained with their use, or methods and experience that have been developed and gained within the project. The consortium has exploited the project outcomes in:
• environmental field work: making, transmitting, processing, and displaying the data,
• collection of environmental data sets: generating multifaceted detailed data sets,
• increasing in-house knowledge and capacity: consortium members have increased both in depth and in breadth knowledge,
• scientific papers and conference presentations: around 30 papers at peer-reviewed conferences, next to a range of scientific presentations. Results have been presented at geophysical, environmental, and various computer science related conferences,
• collaborative work with designated end-users, and carried out in joint workshops, field trips and problem solving,
• education: open days, public demonstrations and events, doctoral level education and field trips.
The final outcomes are intended to be exploited in addition to above mentioned in
• continuing internal research and development: some key research assets, for example software libraries, will be further improved,
• broader collaboration: the project outcomes provide cornerstones for new collaboration,
• development of new sellable services and products: services are meant to be created to support further deployment,
• further development of expertise in the area: some open questions remain, but the issues have been structured in the project and are foreseen to be carried out further in future research projects.
The consortium intends to explicitly seek and in some cases propose new initiatives and platforms that would exploit and develop further the existing research system prototype.

HYDROSYS (224416) – D1.7 Final report, July 29, 2011 44
Background information Partners
Technische Universität Graz Institute for Computer Graphics and Vision Inffeldgasse 16, 8010 Graz, Austria Contact: Ernst Kruijff
Ecole Polytechnique fédérale de Lausanne EFLUM Laboratory of Environmental Fluid Mechanics and Hydrology EPFL-ENAC, Station 2, Bâtiment GR, 1015 Lausanne, Switzerland Contact: Marc Parlange LSIR Distributed Information Systems Laboratory EPFL-IC-IIF-LSIR, Bâtiment BC, Station 14, 1015 Lausanne, Switzerland Contact: Karl Aberer
Swiss Federal Institute for Forest, Snow and Landscape Research Snow and permafrost research unit Flüelastrasse 11, 7260 Davos Dorf, Switzerland Contact: Michael Lehning
Helsinki University of Technology (Aalto University) Ubiquitous Interaction Main Building, Otakaari 1, 02150 Espoo, Finland Contact: Antti Nurminen Geoinformation and positioning technology Niemenkatu 73, 15140 Lahti, Finland Contact: Ari Jolma
University of Cambridge Machine Intelligence Laboratory Trumpington Street, Cambridge, CB2 1PZ, England Contact: Edward Rosten
Luode Consulting Oy Olarinluoma 15 B, 02200 Espoo, Finland Contact: Mikko Kiirikki
Ubisense Franz-Rennefeld-Weg 2-6, 40472 Düsseldorf, Germany Contact: Jaouhar Jemai
Website www.hydrosysonline.eu