job satisfaction of public and private sectors of manufacturing … · 2018-12-10 · i job...
TRANSCRIPT

i
Job Satisfaction of Public and Private Sectors of Manufacturing
Industry in Lahore, Pakistan
By
STELLA MARIAM SARDAR C0255RBRB0813
Supervisors:
Prof. Jokull Johannesson
Dr. Lynne Nikolychuk
A Thesis Submitted in Fulfilment of the Requirements for the Degree of Doctor
of Philosophy of Cardiff Metropolitan University
December 2017
ii
Declaration
I declare that this work has not previously been accepted in substance for any degree and is
not being concurrently submitted for any degree.
I further declare that this thesis is the result of my own independent work and investigation,
except where otherwise stated. A bibliography is appended.
Finally, I hereby give consent for my thesis, if accepted, to be available for photocopying and
for inter-library loan, and for the title and abstract to be made available to outside
organizations.
Signed: ……………………………………… (candidate)
Date: ………………………………………...
iii
ACKNOWLEDGEMENTS
Firstly, I would like to thank the Almighty God for His guidance and strength in the
completion of this study. I want to thank my father Sardar Masih and my mother Surriya
Sardar, my guardian Rina Sardar, my sisters, my friends and my extended family, which
provided me with love, inspiration and support towards the completion of this task.
I am deeply grateful to my director of studies Professor Jokull Johannesson and my
supervisor Dr. Lynne Nikolychuk for their great support and guidance, brilliant suggestions
and constructive comments and for their words of wisdom and encouragement which have
been invaluable throughout my research. Without their guidance and persistent help to the
researcher, this thesis would not have been possible. I would like to thank the managers and
employees of the government and privately owned organisations who selflessly shared their
time and efforts with me. I would like to express my profound thanks and deepest
appreciation to those who have generously shared their precious times and extended their
valuable assistance to me during the preparation and completion of this study.
iv
List of Abbreviations
JS Job Satisfaction S Salaries C Co-workers V Supervision Jsec Job Security WC Working Conditions TS Task significance WE Working Environment P Promotion WI Work Itself A Achievement REC Recognition Res Responsibility CFA Confirmatory Factor Analysis CV Convergent validity DV Dependent Variable IV Independent Variable DM Dummy Variable DV Discriminant validity HRM Human Resource Management EFA Exploratory Factor Analysis PLS Partial least square SE Standard Error Sig. Significant SPSS Statistical Package for Social Sciences α Cronbach’s alpha UK United Kingdom USA United States of America KMO Kaiser-Meyer-Olkin
v
Abstract
This study is conducted to investigate the statistical relationship between motivational factors
(extrinsic/intrinsic) and job satisfaction of public and private-sector employees in the
manufacturing industry of Lahore-Pakistan. Memon and Tahir (2012) stated that the
manufacturing industry in Pakistan, which is one of the leading industries of the world, has
shown decline in productivity in recent years. Various studies have shown that productivity
improvement could be achieved when employees are satisfied with their jobs as it has direct
influence on the performance of organisations (Aziri, 2011).
This thesis represents an original contribution of job satisfaction in the manufacturing
industry of Lahore, Pakistan. In the last decade, Lahore has moved internationally to capture
the global market. As a result, it is essential that it should concentrate on the employees of
manufacturing industries in the region (Raza et al. 2015). However, due to increase in
competition, some companies have failed to maintain their positions in the market. Hence,
studies to date have provided some indication about how job satisfaction could be enhanced
to the benefit of employees in these industries. However, although this subject area is a
popular area in management studies, conclusions are frequently either inconclusive or
conflicting.
Using multiple regression analysis, research findings indicate that job security, supervision,
working conditions, task significance, work environment, promotion, work itself,
achievement, recognition and responsibility hold a statistically significant relationship with
job satisfaction except for salaries and co-workers. The results obtained from the T-Test
indicated that a statistical significant difference exists between the public and private-sector
employees in the manufacturing industry of Lahore-Pakistan.
The findings of this research, therefore, indicate that public sector employees are more
satisfied with their jobs as compared to private sector employees. This study has implications
for the public and private-sector entities and has opened a gateway for future researchers to
explore further the variables which could enhance employee’s job satisfaction in the private
sector of the manufacturing industry in Lahore-Pakistan.
vi
Table of Contents Declaration.....................................................................................................................................ii Aknowledgement...........................................................................................................................iii List of Abbreviations.......................................................................................................................iv Abstract ....................................................................................................................................... v Chapter One: Introduction ........................................................................................................... 1 1.1 ResearchBackground ........................................................................................................................ 1 1.2 Research Problem and its Significance ............................................................................................. 4 1.3 Geographical Background and History of the Proposed Study ......................................................... 6 1.4 Motive of Study ................................................................................................................................. 8 1.5 Aim of the Research ......................................................................................................................... 9 1.6 Objectives of the Research................................................................................................................9 1.7 Research Questions ......................................................................................................................... 9 1.8 Connection between Research Aim, Research Objectives and Research Questions ..................... 10 1.9 Development Need in Public and Private Sectors of Pakistan ........................................................ 12 1.10 Research Structure ........................................................................................................................ 13 1.11 Summary and Conclusion ............................................................................................................. 13 Chapter Two: Literature Review....................................................................................................15 2.1 Introduction .................................................................................................................................... 15 2.2 The Concept of Job Satisfaction ...................................................................................................... 15 2.2.1 Definitions of Job Satisfaction ................................................................................................ 16 2.2.2 Different Approaches of Job Satisfaction ............................................................................... 18 2.2.2. (I) Classical Management Approach.............................................................................19 2.2.2 (Ia) Merits and Demerits of the Classical Management Approach.............................. 22 2.2.2. (II) Neoclassical Approach............................................................................................23 2.2.2. (IIa) Merits and Demerits of the Neoclassical Approach..............................................24 2.2.3 Job Satisfaction and Welfare..................................................................................................25 2.2.4 Importance of Job Satisfaction ............................................................................................... 26 2.2.5 Measurement of Job Satisfaction ........................................................................................... 28 2.2.6 Consequences of Job Satisfaction .......................................................................................... 30 2.3 Job satisfaction Theories ................................................................................................................. 31 2.3.1 Maslow’s Hierarchical of Needs Theory ................................................................................. 32 2.3.2 Alderfer’s ERG Theory ............................................................................................................ 33 2.3.3 Herzberg’s Two Factor Theory of Job Satisfaction ................................................................. 34 2.3.4 Comparison of Content Theories............................................................................................36 2.4 Hackman and Oldham Job Characteristics Model...........................................................................36 2.5 Determinants of Job Satisfaction .................................................................................................... 38 2.6 Rationale for the Selection of Mixed Theories................................................................................43 2.7 Public versus Private Sectors .......................................................................................................... 44 2.8 Manufacturing Industry and Job Satisfaction ................................................................................. 46 2.9 Research Gap .................................................................................................................................. 49 2.10 Conclusion ..................................................................................................................................... 51 Chapter Three: Conceptual Framework and Research Hypotheses ............................................... 53 3.1 Introduction .................................................................................................................................... 53 3.2 Research Framework ...................................................................................................................... 53 3.3 Salaries ............................................................................................................................................ 55 3.4 Co-workers ...................................................................................................................................... 57 3.5 Job Security ..................................................................................................................................... 58 3.6 Supervision ...................................................................................................................................... 59
vii
3.7 Working Conditions......................................................................................................................... 60 3.8 Task Significance and Work Environment ...................................................................................... 61 3.9 Intrinsic Factors and Job Satisfaction .............................................................................................. 62 3.10 Comparison of Job Satisfaction in Public and Private Sectors...................................................... 64 Chapter Four: Research Methodology ......................................................................................... 65 4.1 Introduction .................................................................................................................................... 65 4.2 Research Paradigms ........................................................................................................................ 65 4.2.1 Ontology ................................................................................................................................. 67 4.2.2 Epistemology .......................................................................................................................... 68 4.3 Research Philosophies .................................................................................................................... 70 4.3.1 Positivism ................................................................................................................................ 70 4.3.2 Realism ................................................................................................................................... 70 4.3.3 Interpretivism ......................................................................................................................... 70 4.3.4 Pragmatism ............................................................................................................................. 71 4.3.5 Justification of Selected Research Philosophy ....................................................................... 71 4.4 Research Approaches ...................................................................................................................... 72 4.4.1 Deductive Approach ............................................................................................................... 72 4.4.2 Abduction Approach ............................................................................................................... 73 4.4.3 Inductive Approach ................................................................................................................ 74 4.4.4 Justification of Selected Research Approach .......................................................................... 75 4.5 Research Design .............................................................................................................................. 77 4.5.1 Descriptive Design .................................................................................................................. 78 4.5.2 Justification of Selected Research Design .............................................................................. 78 4.6 Components of Research Design .................................................................................................... 79 4.6.1 Research Strategy (Survey) ..................................................................................................... 79 4.6.2 Research Choice ..................................................................................................................... 80 4.6.3 Time Horizon .......................................................................................................................... 80 4.7 Population ...................................................................................................................................... 81 4.8 Sampling .......................................................................................................................................... 82 4.8.1 Gender and Age.....................................................................................................................83 4.8.2 Experience.............................................................................................................................87 4.8.3 Education...............................................................................................................................89 4.8.4 Sector.....................................................................................................................................90 4.8.5 Position..................................................................................................................................91 4.9 Sampling Frame .............................................................................................................................. 92 4.10 Rationalefor Adopting Probability Method .................................................................................. 92 4.11 Research Instruments ................................................................................................................... 93 4.12 Measurement Scale ...................................................................................................................... 94 4.12.1 Demographic Variables ........................................................................................................ 94 4.12.2 Independent Variables ......................................................................................................... 95 4.12.3 Dependent Variable .............................................................................................................. 95 4.12.4 Dummy Variable ................................................................................................................... 95 4.13 Pilot Study ..................................................................................................................................... 97 4.14 Data collection Techniques and Analysis Procedures ................................................................... 98 4.14.1 Primary Data Sources .......................................................................................................... 98 4.14.2 Tertiary Data Sources .......................................................................................................... 99 4.14.3 Administering the Questionnaire ........................................................................................ 99 4.14.4 Response Rate ................................................................................................................... 100 4.15 Confirmatory Factor Analysis ...................................................................................................... 100 4.16 Multiple Regression Analysis ...................................................................................................... 101
viii
4.16.1 Sample Size ........................................................................................................................ 101 4.16.2 Multicollinearity................................................................................................................. 102 4.16.3 Outliers .............................................................................................................................. 102 4.17 Independent Sample T-Test (Group Difference Test) ................................................................. 102 4.18 Ethical Considerations ................................................................................................................. 103 4.19 Summary ..................................................................................................................................... 105 Chapter Five: Findings, Analysis and Hypothesis Testing ............................................................ 106 5.1 Introduction .................................................................................................................................. 106 5.2 Reliability Analysis ......................................................................................................................... 106 5.2.1 Job Satisfaction ..................................................................................................................... 107 5.2.2 The Independent Variables .................................................................................................. 108 5.3 Descriptive Analysis ...................................................................................................................... 109 5.4 Data Screening .............................................................................................................................. 161 5.4.1 Missing Data ........................................................................................................................ 162 5.4.2 Linearity ............................................................................................................................... 163 5.4.3 Multicollinearity................................................................................................................... 165 5.5 Confirmatory Factor Analysis ........................................................................................................ 168 5.5.1 Convergent and Discriminant Validity.................................................................................168 5.5.2 Test of Normality................................................................................................................ 168 5.6 Hypothesis Testing: Ordinary Least Square Regression Results....................................................170 5.6.1 Multiple Regression Analysis ............................................................................................... 170 5.6.2 T-Test ................................................................................................................................... 180 5.6.3 Model Adequacy..................................................................................................................181 5.7 Results without Dummy Variable ................................................................................................. 183 5.8 Overview of the Main Findings.....................................................................................................183 Chapter Six: Discussion of the Main Findings ............................................................................ 186 6.1 Introduction .................................................................................................................................. 186 6.2 Data Entry and Sample .................................................................................................................. 186 6.3 The Relationship between Job Satisfaction and Extrinsic and Intrinsic Factors ........................... 187 6.4 Conclusion ..................................................................................................................................... 196 Chapter Seven – Conclusions, Implications, Contribution and Recommendations ...................... 198 7.1 Introduction .................................................................................................................................. 198 7.2 Thesis Overview ............................................................................................................................ 199 7.3 Realisation of Objectives...............................................................................................................202 7.4 Theoretical Implications ................................................................................................................ 203 7.5 Practical Implications .................................................................................................................... 204 7.6 Study Limitations .......................................................................................................................... 206 7.7 Recommendations ........................................................................................................................ 207 7.8Knowledge Contribution ................................................................................................................ 209 7.9 Need for Future Research.............................................................................................................211 References..................................................................................................................................212 Appendix A ............................................................................................................................. 239 Appendix B .............................................................................................................................. 242 Appendix C .............................................................................................................................. 243 Appendix D .............................................................................................................................. 244
ix
List of Figures
Figure 1.1: Location of Lahore-Pakistan (Source: SleepingAway, 2005) ................................................. 7
Figure 1.2: Attainment of Research Aim via Research Objectives and Research Questions ................ 11
Figure 1.3: The Solution of Research Problem......................................................................................12
Figure 2.1: Types of Classical Management Approach (Source: Author’s Own Diagram Based on Celik,
2011) ..................................................................................................................................................... 19
Figure 2.2: Diversification of Job Satisfaction while Retiring (Source: Author’s Own Diagram Based on
Helman et al. 2008).............................................................................................................................. 27
Figure 2.3: Content Theories and Models of Job Satisfaction (Source: Author’s Own Diagram Based
on Kaur, 2012) ....................................................................................................................................... 31
Figure 2.4: Variables of Hertzberg's Two Factor Theory (Source: Author’s Own Diagram Based on
Hertzberg’s Two Factor Theory, 1966) .. .............................................................................................. 35
Figure 3.1: The Conceptual Framework of Research ............................................................................ 55
Figure 4.1: Research Paradigm Structure (Source: Author’s Own Diagram Based on Saunders et al.
(2007) .................................................................................................................................................... 69
Figure 4.2: The Operationalization Concept (Source: Adoption from framework) .............................. 76
Figure 4.3: Gender Distribution of all Participants ............................................................................... 84
Figure 4.4: Age Distribution of all Participants ..................................................................................... 85
Figure 4.5: Age of Female Participants ................................................................................................. 86
Figure 4.6: Age of Male Participants ..................................................................................................... 87
Figure 4.7: Experience of all Participants .............................................................................................. 88
Figure 4.8: Education level of all Participants ....................................................................................... 89
Figure 4.9: Distribution of Respondents Based on Sectors ................................................................... 90
Figure 4.10: Position of Participants ..................................................................................................... 91
Figure 5.1: The Final Model ................................................................................................................ 182
Figure 6.1: Revised Model...................................................................................................................195
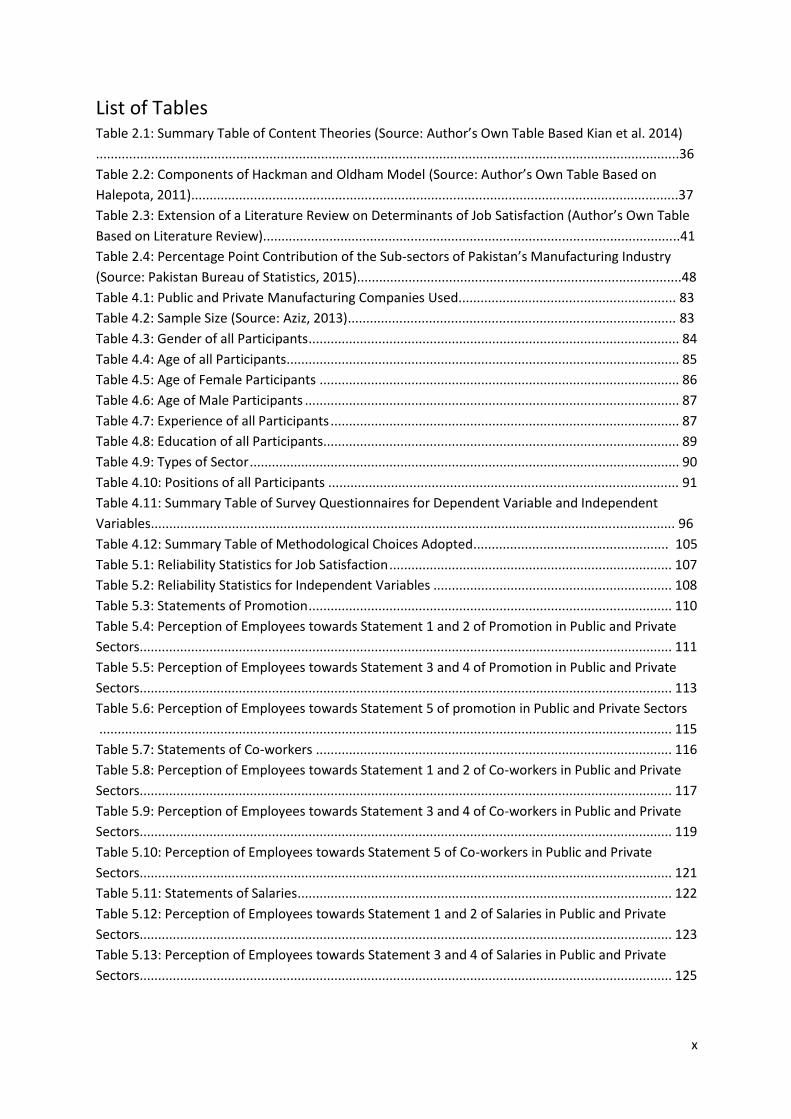
x
List of Tables Table 2.1: Summary Table of Content Theories (Source: Author’s Own Table Based Kian et al. 2014)
..............................................................................................................................................................36
Table 2.2: Components of Hackman and Oldham Model (Source: Author’s Own Table Based on
Halepota, 2011)....................................................................................................................................37
Table 2.3: Extension of a Literature Review on Determinants of Job Satisfaction (Author’s Own Table
Based on Literature Review).................................................................................................................41
Table 2.4: Percentage Point Contribution of the Sub-sectors of Pakistan’s Manufacturing Industry
(Source: Pakistan Bureau of Statistics, 2015)........................................................................................48
Table 4.1: Public and Private Manufacturing Companies Used........................................................... 83
Table 4.2: Sample Size (Source: Aziz, 2013)......................................................................................... 83
Table 4.3: Gender of all Participants ..................................................................................................... 84
Table 4.4: Age of all Participants........................................................................................................... 85
Table 4.5: Age of Female Participants .................................................................................................. 86
Table 4.6: Age of Male Participants ...................................................................................................... 87
Table 4.7: Experience of all Participants ............................................................................................... 87
Table 4.8: Education of all Participants................................................................................................. 89
Table 4.9: Types of Sector ..................................................................................................................... 90
Table 4.10: Positions of all Participants ............................................................................................... 91
Table 4.11: Summary Table of Survey Questionnaires for Dependent Variable and Independent
Variables.............................................................................................................................................. 96
Table 4.12: Summary Table of Methodological Choices Adopted..................................................... 105
Table 5.1: Reliability Statistics for Job Satisfaction ............................................................................. 107
Table 5.2: Reliability Statistics for Independent Variables ................................................................. 108
Table 5.3: Statements of Promotion ................................................................................................... 110
Table 5.4: Perception of Employees towards Statement 1 and 2 of Promotion in Public and Private
Sectors ................................................................................................................................................. 111
Table 5.5: Perception of Employees towards Statement 3 and 4 of Promotion in Public and Private
Sectors ................................................................................................................................................. 113
Table 5.6: Perception of Employees towards Statement 5 of promotion in Public and Private Sectors
............................................................................................................................................................ 115
Table 5.7: Statements of Co-workers ................................................................................................. 116
Table 5.8: Perception of Employees towards Statement 1 and 2 of Co-workers in Public and Private
Sectors ................................................................................................................................................. 117
Table 5.9: Perception of Employees towards Statement 3 and 4 of Co-workers in Public and Private
Sectors ................................................................................................................................................. 119
Table 5.10: Perception of Employees towards Statement 5 of Co-workers in Public and Private
Sectors ................................................................................................................................................. 121
Table 5.11: Statements of Salaries ...................................................................................................... 122
Table 5.12: Perception of Employees towards Statement 1 and 2 of Salaries in Public and Private
Sectors ................................................................................................................................................. 123
Table 5.13: Perception of Employees towards Statement 3 and 4 of Salaries in Public and Private
Sectors ................................................................................................................................................. 125
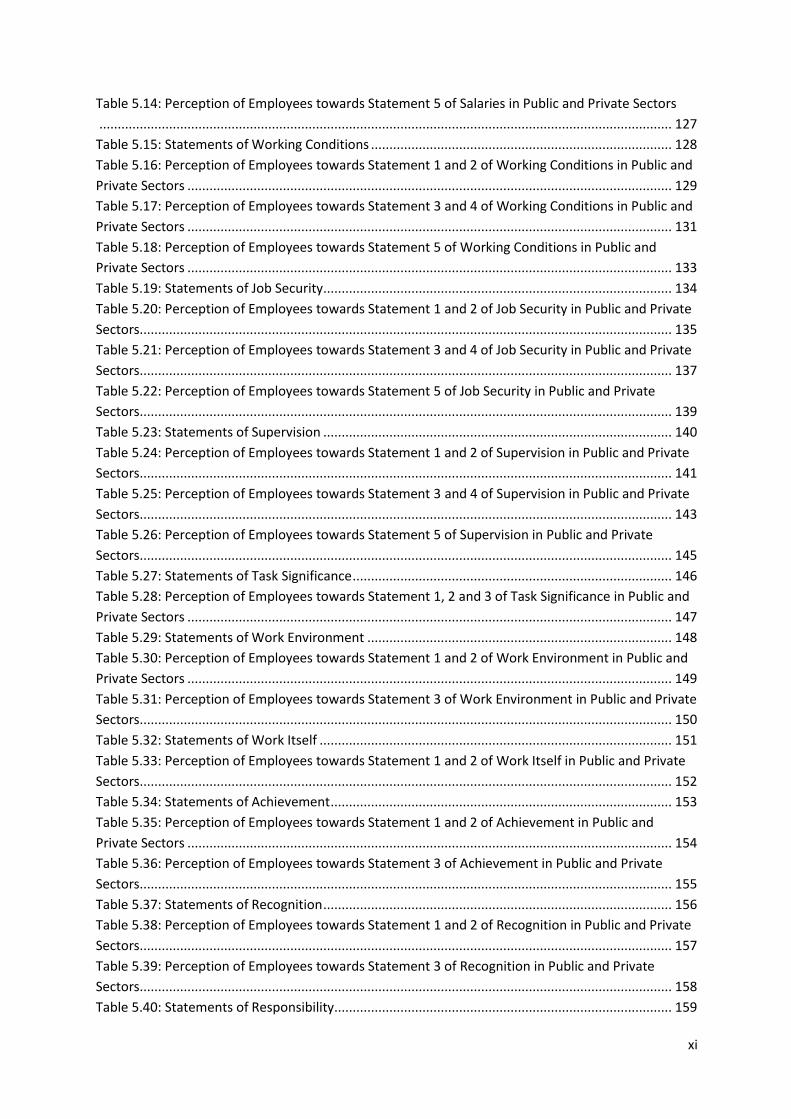
xi
Table 5.14: Perception of Employees towards Statement 5 of Salaries in Public and Private Sectors
............................................................................................................................................................ 127
Table 5.15: Statements of Working Conditions .................................................................................. 128
Table 5.16: Perception of Employees towards Statement 1 and 2 of Working Conditions in Public and
Private Sectors .................................................................................................................................... 129
Table 5.17: Perception of Employees towards Statement 3 and 4 of Working Conditions in Public and
Private Sectors .................................................................................................................................... 131
Table 5.18: Perception of Employees towards Statement 5 of Working Conditions in Public and
Private Sectors .................................................................................................................................... 133
Table 5.19: Statements of Job Security ............................................................................................... 134
Table 5.20: Perception of Employees towards Statement 1 and 2 of Job Security in Public and Private
Sectors ................................................................................................................................................. 135
Table 5.21: Perception of Employees towards Statement 3 and 4 of Job Security in Public and Private
Sectors ................................................................................................................................................. 137
Table 5.22: Perception of Employees towards Statement 5 of Job Security in Public and Private
Sectors ................................................................................................................................................. 139
Table 5.23: Statements of Supervision ............................................................................................... 140
Table 5.24: Perception of Employees towards Statement 1 and 2 of Supervision in Public and Private
Sectors ................................................................................................................................................. 141
Table 5.25: Perception of Employees towards Statement 3 and 4 of Supervision in Public and Private
Sectors ................................................................................................................................................. 143
Table 5.26: Perception of Employees towards Statement 5 of Supervision in Public and Private
Sectors ................................................................................................................................................. 145
Table 5.27: Statements of Task Significance ....................................................................................... 146
Table 5.28: Perception of Employees towards Statement 1, 2 and 3 of Task Significance in Public and
Private Sectors .................................................................................................................................... 147
Table 5.29: Statements of Work Environment ................................................................................... 148
Table 5.30: Perception of Employees towards Statement 1 and 2 of Work Environment in Public and
Private Sectors .................................................................................................................................... 149
Table 5.31: Perception of Employees towards Statement 3 of Work Environment in Public and Private
Sectors ................................................................................................................................................. 150
Table 5.32: Statements of Work Itself ................................................................................................ 151
Table 5.33: Perception of Employees towards Statement 1 and 2 of Work Itself in Public and Private
Sectors ................................................................................................................................................. 152
Table 5.34: Statements of Achievement ............................................................................................. 153
Table 5.35: Perception of Employees towards Statement 1 and 2 of Achievement in Public and
Private Sectors .................................................................................................................................... 154
Table 5.36: Perception of Employees towards Statement 3 of Achievement in Public and Private
Sectors ................................................................................................................................................. 155
Table 5.37: Statements of Recognition ............................................................................................... 156
Table 5.38: Perception of Employees towards Statement 1 and 2 of Recognition in Public and Private
Sectors ................................................................................................................................................. 157
Table 5.39: Perception of Employees towards Statement 3 of Recognition in Public and Private
Sectors ................................................................................................................................................. 158
Table 5.40: Statements of Responsibility ............................................................................................ 159
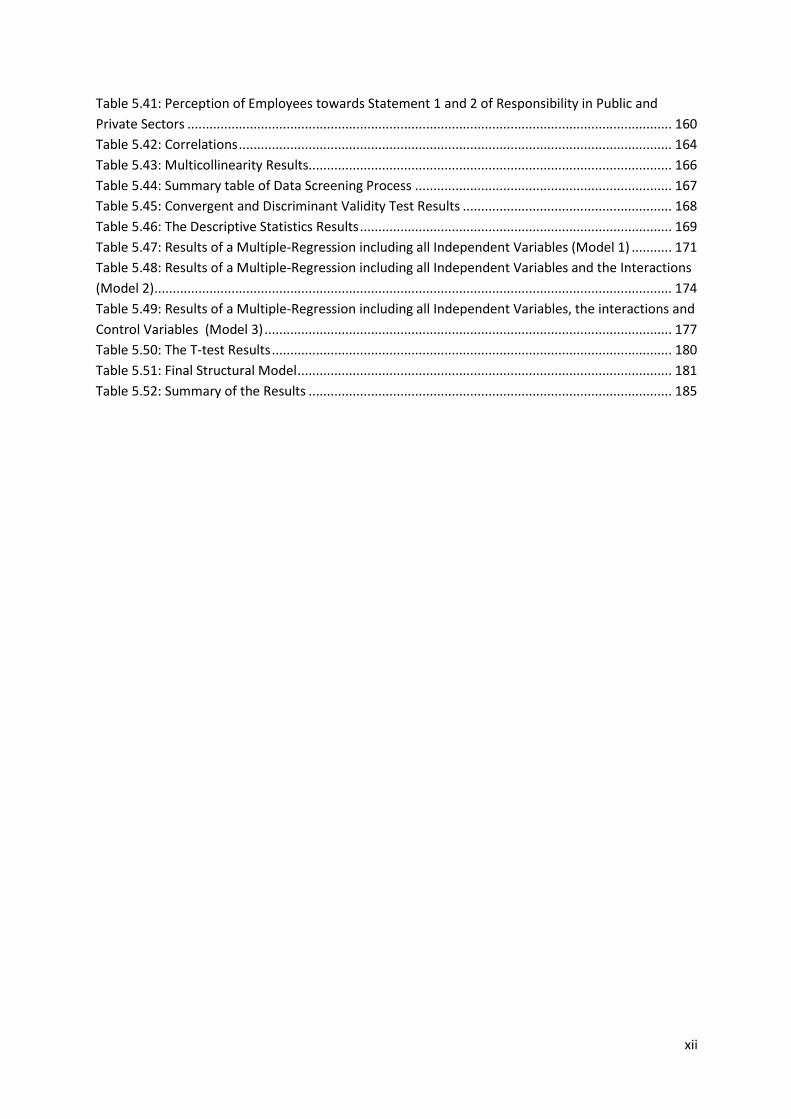
xii
Table 5.41: Perception of Employees towards Statement 1 and 2 of Responsibility in Public and
Private Sectors .................................................................................................................................... 160
Table 5.42: Correlations ...................................................................................................................... 164
Table 5.43: Multicollinearity Results................................................................................................... 166
Table 5.44: Summary table of Data Screening Process ...................................................................... 167
Table 5.45: Convergent and Discriminant Validity Test Results ......................................................... 168
Table 5.46: The Descriptive Statistics Results ..................................................................................... 169
Table 5.47: Results of a Multiple-Regression including all Independent Variables (Model 1) ........... 171
Table 5.48: Results of a Multiple-Regression including all Independent Variables and the Interactions
(Model 2) ............................................................................................................................................. 174
Table 5.49: Results of a Multiple-Regression including all Independent Variables, the interactions and
Control Variables (Model 3) ............................................................................................................... 177
Table 5.50: The T-test Results ............................................................................................................. 180
Table 5.51: Final Structural Model ...................................................................................................... 181
Table 5.52: Summary of the Results ................................................................................................... 185
1
Chapter One: Introduction
1.1 Research Background
Employee job satisfaction is one of the main concerned topics of today. Organisations
performing at international levels are required to focus on their workers. For this reason most
firms use Human Resource (HR) policies such as ethics, fascinating work, and development
of competencies in their day-to-day operations. More so, managers use these as crucial points
of employee job satisfaction to provide good working conditions as stated by Raza et al.
(2015). Similarly, Tett and Meyer (1993) also stated that job satisfaction is one of the most
researched topics in the management area, as researchers want to explore the factors that are
responsible for boosting job satisfaction levels of employees. With the help of analyses of
attitude and behaviour of employees towards work, researchers can comprehend the
connection between employees and their performances within the organisation. An increase
in competition due to innovative technologies around the world has led the management of
different businesses to keep their employees satisfied to avoid future losses. Various studies
have shown that different factors are associated with employee job satisfaction (Yang &
Wang, 2013). This also shows that different factors have direct influences on an employee’s
job satisfaction.
The manufacturing industry in Lahore-Pakistan is the main target-subject of this study. In
Pakistan, most of the studies are conducted in universities, medical institutions, information
technology houses and banks, thereby neglecting the large industries of the country (Rukh et
al. 2015). Memon and Tahir (2012) stated that the manufacturing industry of Pakistan has
faced losses in profitability in recent years. Taking into consideration the current position of
this industry, the researcher selected different companies within the manufacturing industry to
investigate the relation between motivational factors and job satisfaction. Furthermore, public
and private sectors are targeted in this study because both sectors play important roles in
revenue generation for the country’s economy. To investigate the perception of employees
towards job satisfaction, it is useful to compare both these sectors as this would give a useful
insight of the researched topic (Hyder & Batool, 2013).
Various studies have been conducted to find out the job satisfaction level of employees
working in different organisations as they are considered as the key contributors towards
2
revenue generation in the organisation or the country’s economy. The main reason behind this
is due to their performances, which have direct impacts on the successes of the organisation.
Researchers, therefore, have undertaken various studies to explore the factors which impact
job satisfaction. Yang and Wang (2013) stated that job satisfaction has attracted the attention
of many practitioners and scholars for decades in the human resource management field.
Similarly, Malik et al. (2010) mentioned that there are various studies that show that job
satisfaction and organisational commitment are the most researched and widely-studied topics
in the management and psychology literature. Numerous studies have also worked on the
same issues; for example, the research conducted by Park et al. (2005) and Allen & Meyer
(1990). The main reason behind this knowledge is that when employees are satisfied, they
fully commit themselves towards work. The commitments of employees towards their jobs
are measured with the help of their performances and accomplishments of the organisation’s
goals as explained by Azeem (2010).
Also, Rainey (2009) as cited by Yang and Wang (2013, p.567) stated that job satisfaction is
“one of the most intensively studied variables in organisational research”. This means that
due to the rapid increase in the competition around world management, practitioners want to
adopt better strategies by which they can satisfy their staff in order to gain competitive
advantage.
Different researchers have defined job satisfaction in different ways. Yang and Wang (2013)
said that job satisfaction has a connection with some desirable organisational outcomes
including high productivity, low absenteeism, and low turnover rates. Job satisfaction is a
conflicting topic studied by various researchers producing different outcomes on the
performances of an organisation and its relationship with the chosen variables. One study
conducted by Haorei (2012), linked the consequences of job satisfaction to three variables,
including: a) increased productivity; b) lower turnover rates; c) lower absenteeism. Haorei’s
work concluded that job satisfaction of the workforce differs with respect to the occupation
category and revealed that 55 per cent of managers, 52 per cent of supervisors and 53.3 per
cent of other workers agreed that job satisfaction resulted in high productivity for a company.
Haorei (2012) further stated that the maximum percentage of managers and 48.3 proportions
of non-managers supported the approach that job satisfaction could also result in a lower rate
of turnover whereas more than half, i.e. 52.3 per cent of supervisors, showed partiality in this

3
regard. In regards to low absenteeism, Haorei (2012) concluded that the ratio of the managers
was 40:40 in support of the above consequence of job satisfaction which remained
unanswered by 62.5 per cent of supervisors and 48.3 per cent of labourers (Haorei, 2012).
According to Durst and DeSantis (1997) the topic of job satisfaction is a serious concern.
This is because their study findings revealed that public-sector employees needed a
considerable amount of attention as compared to private-sector employees; and for this reason
identification of the factors was required to increase job satisfaction among public-sector
workers. Previous studies (Khalid et al. 2012; Ayub, 2010) have revealed that job satisfaction
levels differ among public and private-sector employees. For this reason Durst and DeSantis
(1997) utilised the National Surveys of the Youth that consisted of a large sample size (i.e.
12,686 women and men) to evaluate the job satisfaction along with the personal
characteristics and work experiences of public and private-sector employees. With the
analysis of the existing data, they concluded that the job satisfaction of the employee differed
in the public and private-sectors. And that the private-sector employees were comparatively
more satisfied with their work compared to the public-sector employees.
This concept works in the opposite direction in Pakistan as the research conducted by Latif et
al. (2011) revealed that public-sector employees were more satisfied with different
components of job satisfaction, mainly: pay; promotion; job security; nature of work;
education; family and work life balance. In addition to this, Batool (2010), as cited by Hyder
and Batool (2013), suggested that there are factors that need clarification, such as the
differences in job satisfaction among employees in the public and private-sectors. A
comparative study conducted by Kumari and Pandey (2011) stated that the employees of the
private sector need to be visible and accountable for and every action they take (Kumari &
Pandey, 2011). Hence, an argument in this topic gives an opportunity for researchers to find
out innovation about the reasons for a weak bond between the practitioners of management
and employees’ job satisfaction in the public sector as well as the private sector.
From the literature, it has been accessed that most of the research work is carried out in the
Western countries. In developing countries like Pakistan, less work has been conducted which
has motivated the author to carry out the research project in Pakistan. Job satisfaction is
important because it is responsible for generating the revenue of an organisation and the
country. The uniqueness of the culture from that of the Western context and the environment
4
in which they work would possess different determinants of job satisfaction. The current
study, therefore, will analyse the relationship between job satisfaction and organisational
attributes and will evaluate the job satisfaction levels in both the public and private sectors of
Pakistan, mainly in the city of Lahore.
1.2 Research Problem and its Significance
According to USC Libraries (2014), the problem statement of the research can be defined as
that area of research, which needs the attention of the researchers, so that it could be
improved. This is a problem that concerns and requires considerable measures to be removed.
Failure to do this could pose a problematic question which could be found in existing
literature, in practice or in theory that requires an innovative and planned analysis. Keeping in
mind the above explanation of the problem statement, the researcher has identified the
problem in the literature concerning the factors, which can increase the job satisfaction of
employees. Further investigation and research are needed in developing countries, especially
in Pakistan, and as most of the research has been conducted in Western countries mainly the
United Kingdom and the United States of America in the view of Koustelios (2001) as cited
by Khalid et al. (2012).
This study has been motivated by the research conducted by Khalid et al. (2012) which was
done in the public and privately-owned education sectors of Pakistan where different public
and private universities from the Punjab were taken to find out the job satisfaction levels in
organisations by academicians. In other words, this study is limited to the education sector
only and does not consider other important factors of job satisfaction.
According to Rukh et al. (2015) very limited research is conducted in Pakistan on the factors
that affect job satisfaction and that much of the research is carried out in medical institutions,
banks and universities and that none of the large organisations have been researched so far.
Therefore, this research will consider different public and private manufacturing companies in
Lahore, which will be selected based on their ownerships.
The manufacturing industry of Pakistan has suffered a lot in recent years and has shown a
slow growth (Memon & Tahir, 2012). Hence, this study will be useful to overcome this issue
5
by investigating the factors that could enhance the job satisfaction of employees in the
manufacturing industry as their satisfaction with the work is directly linked to positive
outcomes (Yang & Wang, 2013). On the other hand, when the employees are unhappy with
their jobs it leads to various inappropriate outcomes such high staff turnovers, absenteeism
and engenders a big loss to the organisation. To overcome this issue, managers want to find
out the strategies, which could be used to combat the problem and increase job satisfaction
levels among employees. There are various factors suggested by researchers in the literature
(see chapter two), which could increase the job satisfaction level of the employees.
Aycan et al. (2000) stated that limited research has been conducted in the Human Resource
Management field, which includes different areas like developmental programme for the
employees along with their training agendas, the rewarding system and the recognition of the
workforce that requires a lot of attention for further improvements. Michaels et al. (2001)
stated in “The War for Talent” book that the managers are responsible for the organisational
outcomes and it is very essential to build the managers in such a way so that they should be
accountable for their revenues (Abbasi et al. 2011). The workforce plays a vital role in the
productivity of different organisations. Hence, for the effective and the productive work of an
organisation - it is essential that the practitioners of HR (especially the managers) should be
satisfied with their jobs because it is observed that human resource management plays a vital
role in delivering the service (Ali & Wajidi, 2013).
In this research, the researcher will take into consideration public and private-sector
manufacturing companies based in Lahore-Pakistan because workers serving in public-sector
organisations are considered to be attractive as they have to provide services to the
community (Ashraf et al. 2013) and are, therefore, responsible for giving the satisfactory
performance (Mohammad & Kolachi, 2013) while in the private sector employees have to be
visible and accountable for the actions they take (Kumari and Pandey, 2011). The above
literature depicts that limited research has been conducted in the context of Pakistan, which
gives an opportunity for the researcher to explore the factors that act as a source of employee
job satisfaction, especially in manufacturing industry which has a low productivity rate as
stated by Memon and Tahir (2012). It is important to research in area Lahore as it is main hub
which connects transport to other regions of Pakistan. For example the Allama Iqbal Airport
is situated Lahore and most of the flights fly from this airport both at national and
international level. Previous researches have been conducted in different industries mainly: an
6
education sector, banking sector and medical institutions of Lahore and limited research is
carried out in the manufacturing industry of Pakistan (Rukh et al. 2015). According to
Pakistan Bureau of Statistics (2015) the highest population was recorded for the Punjab
province and since Lahore is situated in this region therefore its findings will be useful for the
entire population. Moreover, most of the big industries are situated in Lahore. This shows that
Lahore is the highest contributor towards the economy of Pakistan. The socio-economic
factors in Lahore are different from the ones in other provinces of Pakistan as a result of
which the findings of previous studies cannot be applied to this region.
Hence, this study will tend to fill in the gap in the literature by investigating the influences of
organisational factors on public and private sector employees, which could benefit the
management to adopt strategies that could increase the job satisfaction of their employees to
have fruitful and beneficial outcomes in Lahore-Pakistan. .
1.3 Geographical Background and History of the Proposed Study
The selected country of this research is located in the southern part of Asia where it shares
two main borders; one with China and the other with India. According to One World Nations
Online (2016) the total region of Pakistan covers approximately 796,095 square kilometres
which is larger than the size of the UK. The entire population of Pakistan is 188 million in
2014. The tribes in Pakistan are segmented into four different provinces: the Punjab; Sindh;
Balochistan; Khyber Pakhtunkhwa, according to the Pakistan Economic Survey (2014-2015).
The national language of Pakistan is Urdu; however, there are other languages as well
(Sindhi, Balochi, Punjabi and Pashto) which are quite commonly spoken in the different
regions of the country. Based on the figures presented by US Library (2010) it is revealed that
the majority of people in Pakistan are Muslims with more than 90% of the total population
and the remaining percentage is covered by other religions and includes Christians, Hindus,
Sikhs, and Bengalis.
In Pakistan most of the revenues are generated by large industries of both the public and
private sectors. However, due to the recent decline in the productivity rate of manufacturing
industry of Pakistan, managers are putting together efforts to know the strategies that could
help them retain their companies’ positions in the international market (Memon & Tahir,
2012). Employees are considered as the assets for any organisation and their job satisfaction

7
levels have a direct link with the performance of the firm. Hence, it would be useful to
investigate the factors which could enhance the job satisfaction of public and private sectors
of manufacturing industries in Pakistan as it is one of the main leading sources of employee
motivation and needs much attention (Memon & Tahir, 2012; Rukh et al. 2015). To
investigate the influence of predictors of job satisfaction on employees, this study considered
the city Lahore as it is the centre of Pakistan, and is directly linked to major regions of
Pakistan and contributes more towards income generation. Unfortunately, this status has
declined in recent years. It would, therefore, be appropriate to conduct research in Lahore as
the performances of big firms have a direct impact on the economy of a country.
Figure 1.1: Location of Lahore-Pakistan
Source: Based on SleepingAway (2005)
1.4 Motive of Study
Job satisfaction is one of the most researched topics with “more than 5,000” publications as
cited by Hussain (2012, p.1916). This shows that in the present era, job satisfaction topic has
achieved much of the attention of the researchers which is due to contradictory findings
(Yang & Wang, 2013). Similarly, Kinzl et al. (2005) stated that job satisfaction is one of the
most influential variables, and it has great implications for organisations and working fields.
Human Resource managers believe that employee satisfaction is always associated with
positive outcomes, which means that when employees are happy, they perform well in an
organisation and actively participate in achieving the organisation’s goals and objectives.
However, this idea is not always supported as some researchers have revealed that there is no
8
straight relationship between employee satisfaction and their performances as mentioned by
Sousa-Poza and Sousa-Poza (2000).The main differences in the findings is due to nature of
sectors (Kumari & Pandey, 2011).
There are many factors with the help of which management can identify the satisfaction levels
of their employees. Various types of theories have been proposed by different researchers to
analyse the job satisfaction level of workers. One of the most common theories of job
satisfaction is Maslow’s theory which states that individuals needs and wants develop from
time to time which he termed as hierarchy of needs. In contrast, Hertzberg’s two-factor theory
divided factors into two categories: hygiene factors and motivating factors. Similarly, other
researchers came with different concepts and models (see chapter two) for further discussion.
However, this study is motivated by Khalid et al. (2012) in which they argued that job
satisfaction is the main function of promotion, salary, co-workers, job security and
supervision. Khalidet al.’s (2012) study was limited to the education sector. This research
project will consider these factors along with the addition of important intrinsic factors and
extrinsic factors (see chapter three). One of the most important factors that contribute to job
satisfaction is employee working conditions as suggested by Jain and Kaur (2014), a study
which was conducted in India. To analyse the important factors of job satisfaction Jain and
Kaur (2014) collected data from the managers and non-managers of the company called
Dominos. Results revealed that there are six factors (working conditions, refreshment and
recreation, fun at workplace, duties and responsibilities, health and safety and grievance
handling procedure), which actually foster the job satisfaction of the employees surveyed.
Among them working conditions is the most influential factor to predict satisfaction levels of
the employees.
To conclude, the main motive of the proposed research work is to explore the relationship
between job satisfaction and extrinsic as well as intrinsic factors. It also aims to identify
differences between the public and private sectors with regards to the above-mentioned
factors in the manufacturing industry of Pakistan as most of the studies are conducted in other
institutions such as medical institutions, the banking sector and in education (Rukh et al.
2015). More so, Memon and Tahir (2012) stated that the manufacturing industry needs much
attention as it is one of the leading industries of Pakistan but its productivity has declined in
recent years. Hence, employees are the main contributors towards the performance of an
organisation it is therefore, vital to investigate the job satisfaction levels of employees.
9
1.5 Aim of the Research
The aim of this research is to examine the relationship between job satisfaction and salaries,
co-workers, job security, supervision, working conditions, task significance, work
environment, promotion, work itself, achievement, recognition and responsibility. The
research also analyses the differences in the job satisfaction levels among public and private-
sector employees of the manufacturing industry in Lahore, Pakistan.
1.6 Objectives of the Research
In view of the aforementioned discussions on the background of the research, the objectives
of the study, therefore, are:
Objective 1: To critically evaluate the secondary research on job satisfaction within the
manufacturing industry of Pakistan.
Objective 2: To identify the relationship between job satisfaction and extrinsic as well
intrinsic factors in the manufacturing industry of Lahore-Pakistan.
Objective 3: To find out the difference between the public and private-sector employees of
the manufacturing industry of Lahore-Pakistan.
Objective 4: To analyse the existing framework of job satisfaction and develop a model used
in improving job satisfaction in the manufacturing industry of Lahore-Pakistan.
1.7 Research Questions
The central research question of this study arises from the fact that there are factors that need
clarification, such as the differences in job satisfaction among employees in the public and
private-sectors (Batool, 2010). The specific questions that this study will consider are:
1. What is the relationship between job satisfaction and salaries?
2. What is the relationship between job satisfaction and co-workers?
3. What is the relationship between job satisfaction and job security?
4. What is the relationship between job satisfaction and supervision?
10
5. What is the relationship between job satisfaction and working conditions?
6. What is the relationship of task significance and work environment with job satisfaction?
7. What is the relationship between job satisfaction and promotion, work itself, achievement,
recognition and responsibility?
8. Does a significant difference exist between the public and private-sector employees of the
manufacturing industry of Lahore-Pakistan with respect to job satisfaction and extrinsic
factors (salaries, co-workers, job security, supervision, working conditions, task significance,
work environment) as well as intrinsic factors (promotion, work itself, achievement,
recognition, responsibility) ?
1.8 Connection between Research Aim, Research Objectives and Research
Questions
The following figure shows the research aim, which has been linked together for its
attainment in this study. The main agenda of this connection is to investigate the relationship
between job satisfaction and extrinsic as well as intrinsic factors among public and private-
sector employees of manufacturing industry of Pakistan. The figure shown below illustrates
the linkage of research aim with research objectives and research questions.
11
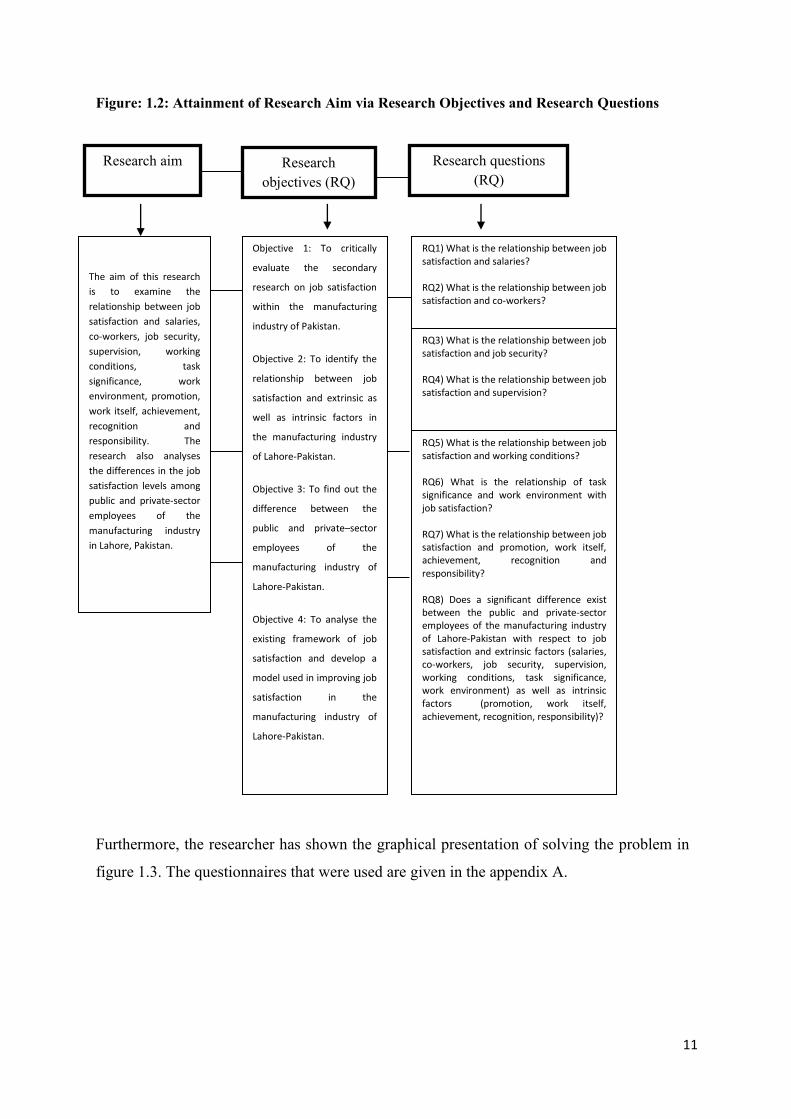
Figure: 1.2: Attainment of Research Aim via Research Objectives and Research Questions
B
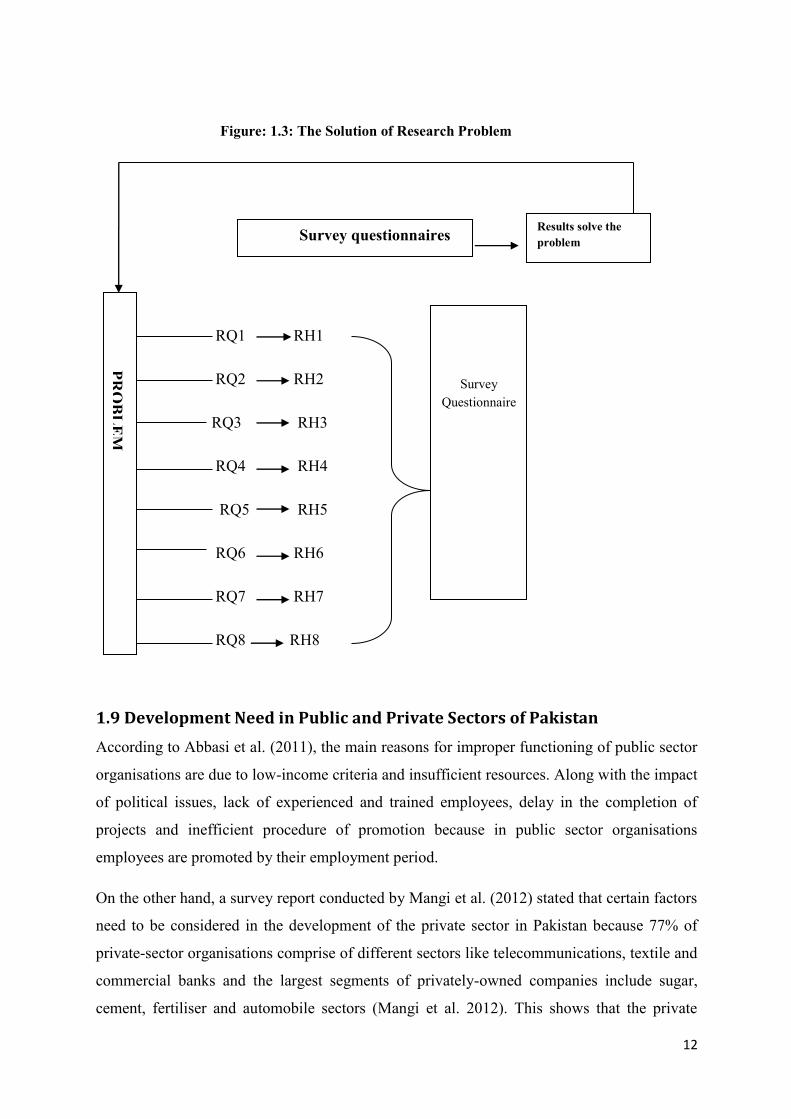
Furthermore, the researcher has shown the graphical presentation of solving the problem in
figure 1.3. The questionnaires that were used are given in the appendix A.
Research objectives (RQ)
Research aim
Research questions (RQ)
The aim of this research
is to examine the
relationship between job
satisfaction and salaries,
co-workers, job security,
supervision, working
conditions, task
significance, work
environment, promotion,
work itself, achievement,
recognition and
responsibility. The
research also analyses
the differences in the job
satisfaction levels among
public and private-sector
employees of the
manufacturing industry
in Lahore, Pakistan.
RQ1) What is the relationship between job satisfaction and salaries?
RQ2) What is the relationship between job satisfaction and co-workers?
Objective 1: To critically
evaluate the secondary
research on job satisfaction
within the manufacturing
industry of Pakistan.
Objective 2: To identify the
relationship between job
satisfaction and extrinsic as
well as intrinsic factors in
the manufacturing industry
of Lahore-Pakistan.
Objective 3: To find out the
difference between the
public and private–sector
employees of the
manufacturing industry of
Lahore-Pakistan.
Objective 4: To analyse the
existing framework of job
satisfaction and develop a
model used in improving job
satisfaction in the
manufacturing industry of
Lahore-Pakistan.
RQ3) What is the relationship between job satisfaction and job security?
RQ4) What is the relationship between job satisfaction and supervision?
RQ5) What is the relationship between job satisfaction and working conditions?
RQ6) What is the relationship of task significance and work environment with job satisfaction?
RQ7) What is the relationship between job satisfaction and promotion, work itself, achievement, recognition and responsibility?
RQ8) Does a significant difference exist between the public and private-sector employees of the manufacturing industry of Lahore-Pakistan with respect to job satisfaction and extrinsic factors (salaries, co-workers, job security, supervision, working conditions, task significance, work environment) as well as intrinsic factors (promotion, work itself, achievement, recognition, responsibility)?
12
Figure: 1.3: The Solution of Research Problem
RQ1 RH1
RQ2 RH2
RQ3 RH3
RQ4 RH4
RQ5 RH5
RQ6 RH6
RQ7 RH7
RQ8 RH8
1.9 Development Need in Public and Private Sectors of Pakistan
According to Abbasi et al. (2011), the main reasons for improper functioning of public sector
organisations are due to low-income criteria and insufficient resources. Along with the impact
of political issues, lack of experienced and trained employees, delay in the completion of
projects and inefficient procedure of promotion because in public sector organisations
employees are promoted by their employment period.
On the other hand, a survey report conducted by Mangi et al. (2012) stated that certain factors
need to be considered in the development of the private sector in Pakistan because 77% of
private-sector organisations comprise of different sectors like telecommunications, textile and
commercial banks and the largest segments of privately-owned companies include sugar,
cement, fertiliser and automobile sectors (Mangi et al. 2012). This shows that the private
PRO
BL
EM
Survey questionnaires Results solve the problem
Survey Questionnaire
13
sector in Pakistan needs to have considerable notice for the development and better
functioning as it would lead to prosperous outcomes. Based on the above reviews it has been
that both the public and private sectors hold important positions in different aspects. As a
result, this research will attempt to recommend strategies to both public and private sector
managers with the help which they could enhance the satisfaction levels of their employees so
that they could perform well and help the organisation to achieve the goals of the company.
1.10 Research Structure
This research thesis comprises of seven chapters together with the first chapter. Chapter two
discusses different theories and concepts of job satisfaction in the light of literature. Chapter
three represents the conceptual framework containing dependent and independent factors,
which will be presented in the form of a regression equation that will be used for the data
analysis. Chapter four represents the methodology in which the researcher will discuss in
detail the methods and tools that were used to collect data and the techniques that were
applied to analyse the data whereas, chapter five represents the findings in the form of graphs,
charts and tables. Chapter six discusses the results of the main findings in the light of
literature and Chapter seven reviews the findings followed by implications of the study,
recommendations, limitations and the contribution to the knowledge.
1.11 Summary and Conclusion
Organisations are persistently facing new challenges to maintain their market positions.
Several recent studies have shown that productivity improvement could be achieved when
employees are satisfied towards their jobs. These research outcomes motivate some managers
to search for strategies that encourage employees to be dedicated to their work especially in
the manufacturing industry of Pakistan which has faced losses in recent years as mentioned
by Memon and Tahir (2012). Job satisfaction is a positive outcome of employee satisfaction.
Different factors are responsible for increasing the job satisfaction of employees. This has a
direct influence on the performance of an organisation as happy workers tend to achieve goals
on time (Aziri, 2011).
In a comparative study conducted by Latif et al. (2011) on the college teachers of district
Faisalabad, he revealed that job satisfaction is a function of certain factors like job security,
14
salary, nature of work, supervision and promotional opportunities which help in measuring
the overall job satisfaction levels of the workers. This study is based on Latif et al. (2011) to
examine the correlation between certain facets of job satisfaction in the public and private
sectors of Pakistan along with addition of intrinsic factors and other important determinants
of job satisfaction.
Moreover, it has been reported that public-sector organisations in Pakistan are bureaucratic
and hierarchical in nature where managers hold important positions and are responsible for
the outcome of their organizations’ performances. This makes their work more fascinating
and challenging. Most of the studies reported that workers of the public sector organisations
should be satisfied with their jobs as this would lead to the enhancement of the success of an
organisation with numerous outcomes (Mafini & Pooe, 2013).
To conclude, in chapter one, the researcher has discussed the overview of the research along
with research aim, objectives and research questions. It has further discussed different
concepts by defining it and the importance of employees in the various sectors of Pakistani
manufacturing industries. Also, this study has mentioned the contribution of the research
towards the development of the job satisfaction theory. The second chapter of this study will
take into account the literature review based on the determinants of job satisfaction in the
different sectors of Pakistan and the correlation between them.
15
Chapter Two: Literature Review
2.1 Introduction
This research study analyses the relationship between job satisfaction and the independent
factors that are held responsible in analysing specific needs of employees within the
organisation. The study continues to examine the differences between the two sectors (public
and private) regarding job satisfaction and determinants of job satisfaction in the
manufacturing industry of Pakistan.
In this chapter, previous studies are critically evaluated to find the gap in the literature that
can lead to the contribution of new knowledge to the existing body of knowledge and to
develop the conceptual framework. Various researches done in past on job satisfaction are
examined against both sectors and some fundamental determinants are reviewed to justify the
satisfaction levels of employees. Different countries have different ways of making their
employees satisfied. This research explains the truth and the reality based on particular
hypotheses on how satisfied most employees are with their jobs in Lahore-Pakistan and what
are the determinants which increase their levels of satisfaction. Moreover, both private and
public sectors are dealt with separately and are examined against each other to come up with
the results with justifications.
2.2 The Concept of Job Satisfaction
Job satisfaction has become one of the most concerned topics in Human Resource
Management. Hussain (2012) stated that employees are the assets of an organisation without
which the business cannot achieve its goals. Hussain’s (2012) findings revealed that there are
five key factors (job security, supervision, relationship with co-workers, pay and promotional
opportunities) which increase job satisfaction among public and private sector employees of
the banking industry of Punjab, Pakistan. Various scientists have concluded findings which
vary from each other as a result of which the total number of articles and dissertations written
on the job satisfaction is around 3,350 according to Locke (1976) as mentioned by Hussain
(2012). This shows that the majority of the studies have shown different outcomes of job
satisfaction and its relationship with the various facets of the subject matter, as some studies
revealed similar results whereas others presented different ones. The concept used by Hussain
16
(2012) is very similar to the concept used in this study. That is job satisfaction depends on
upon five key factors as explained above. However, the main limitation of Hussain’s (2012)
study was that only public and private banking sector employees were considered in a
different region of Pakistan. According to Ahmad et al. (2010), job satisfaction is not only
considered in the manufacturing industries but also in the service sectors as well. Hence, it
can be said that job satisfaction occupies an equal rank of all sectors in order to have
successful outcomes.
Rast and Tourani (2012) explained that the concept of job satisfaction was developed by
Elton Mayo at the Western Electric Company in Chicago. The leading prospect of Rast and
Tourani’s (2012) study was that job satisfaction has a direct influence on the perceptions of
employees towards their jobs after analysing data from the private sector employees of the
airline industry of Iran. For this aspect they considered five main factors (supervision, present
pay, nature of work, co-worker and opportunities for promotion) in investigating the level of
job satisfaction of employees. This shows that the organisations should focus on the needs
and wants of their employees and should react accordingly to create a positive image in the
eyes of the employees as this leads to the loyalty phenomenon of employees towards their
respective firms, and a healthy environment could be created in the workplace. This concept
is used in this study as employees of both public and private sectors of the manufacturing
industries in Pakistan were given survey questionnaires to give their perceptions towards job
satisfaction.
Various researchers defined job satisfaction in different ways. Some of the most commonly
phrases used to define job satisfaction are discussed in section (2.2.1) in which researcher
critically evaluates the thoughts of authors in regards to job satisfaction.
2.2.1 Definitions of Job Satisfaction
Morrell et al. (2008) stated that, jobs have become important contributing factors towards the
sustainability of families and survival of life. The effectiveness of the job depends on how
much satisfaction employees get from their work. Studies have shown that the research
conducted on behaviour aspects of employees in different organisations has led to various
approaches to defining job satisfaction (Mafini and Pooe, 2013). This statement was
supported by Yang and Wang (2013), in which they stated that the study of job satisfaction
17
had become an interesting topic to be ever studied by the researchers investigating on the
behaviour of the individual towards work.
Robbins and Sanghi (2006) describe job satisfaction as a phenomenon in which individuals
perceive and regard their jobs. This means that job satisfaction is a collection of thoughts
which could be positive, negative or neutral depending on the nature of an individual, and
how that individual evaluates his or her job and holds an opinion. In support of this argument,
Yang and Wang (2013), define the term of job satisfaction into two main types: the positive
and negative approach and the neutral approach.
In the opinion of Locke (1970), the positive and negative aspects of a job are engenders cause
and an effect reaction; and that is what an individual attains from his or her job and how they
value their jobs. This view was supported by Kreitner and Kinichi (2007) in which they
described job satisfaction as an occurrence of an imbalance situation of what an individual
perceives from his or her job, and the happening of facts like the implementation of
employment ethics and balanced management of justice will ultimately lead to an employee
satisfaction. Also, Sousa-Poza and Sousa-Poza (2000) came up with a new thought that
employee satisfaction would result if there is a balance between input sources and output
sources. The input sources include hardships such as effort and time required to get the job
and the output resources consisting of salary, limited profit, external environment of the job
and other fundamental prospects of the work. This study believes that job satisfaction will
result in optimum levels for employees if there is an equal balance between both the input and
the output factors.
Islam and Siengthai (2009), define job satisfaction as an optimistic condition of the
employees that results due to an appreciation of one’s experiences regarding the work or the
presentation of the job. This shows that job satisfaction is the feeling of indulgence which the
employees perceive from their work (Asegid et al. 2014). Keeping in mind several
approaches of defining job satisfaction, according to Locke (1969) as cited by Yang and
Wang (2013), the most common approach that could be used to simplify the term of job
satisfaction is that it could be considered as a positive state of an employee which arises when
they are admired and treated well in the workplace. Mathis and Jackson (2004) also, in their
study described job satisfaction by the analysis of the perception of the employees towards
work. This shows that most of the authors consider job satisfaction as an intangible source,

18
Contrary to this assertion, Gordan (2011) argued that job satisfaction is regarded as an
outcome of how one perceives his or her work. This shows neutralism in the statement of the
job satisfaction terminology meaning job satisfaction is not only the positive response of the
workers, but it depends on what one gets from his job. Based on the arguments it has been
observed that job satisfaction has a connection with the perception of the workers in which
they work. However, in this thesis the researcher considers Robbins and Sanghi’s (2006)
approach job satisfaction in Pakistan as a developing country where the level of job
satisfaction are measured by how employees evaluate dimensions of job satisfaction which is
discussed later in this chapter. Moreover, when job satisfaction is measured, it will be judged
by its interaction with certain factors in both sectors of the manufacturing industry in Lahore,
Pakistan.
From the above literature regarding job satisfaction, it is concluded that job satisfaction is a
subjective assessment of different facets of the subject matter in regards to some domestic
thresholds erected by numerous factors such as pay scales, promotions and career
opportunities, relationships with co-workers, working conditions, supervision, individual
satisfaction and so on. Most studies have focused more on the factors which help to
investigate job satisfaction of the employees. This study, therefore, uses the same concept to
measure job satisfaction among public and private sector employees of different
manufacturing companies.
In the next section, the researcher discusses different approaches of job satisfaction. These are
mainly the classical management approach and the neoclassic approach (see section 2.2.2) for
further explanation.
2.2.2 Different Approaches to Job Satisfaction
To gain competitive advantage, firms are in a continuous struggle to create a positive image
of their brands. Numerous factors are associated in gaining the competitive advantage. These
include cheap products with features showing high quality and more likely that fulfil the
requirements of the customers as compared to other products. This has a direct impact on
customers as they feel satisfied. Continuous analyses of the performance of employees and
better deliverance of services result in the establishment of businesses. Productive results can
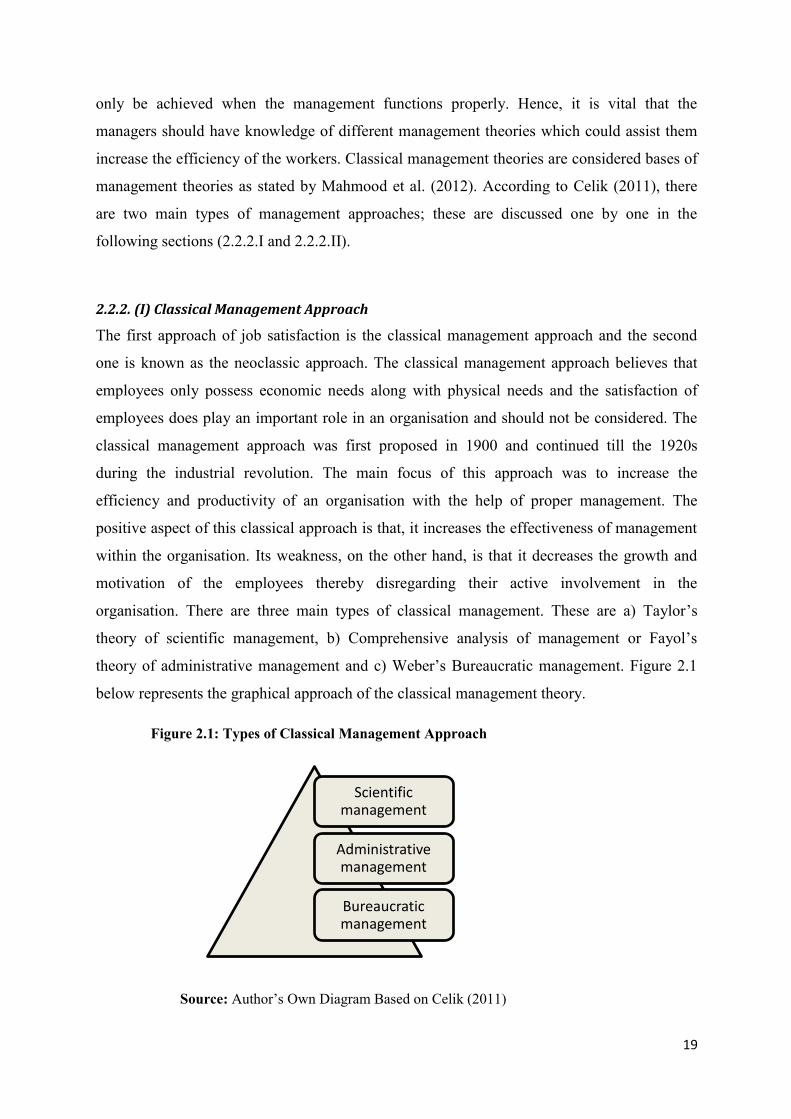
19
only be achieved when the management functions properly. Hence, it is vital that the
managers should have knowledge of different management theories which could assist them
increase the efficiency of the workers. Classical management theories are considered bases of
management theories as stated by Mahmood et al. (2012). According to Celik (2011), there
are two main types of management approaches; these are discussed one by one in the
following sections (2.2.2.I and 2.2.2.II).
2.2.2. (I) Classical Management Approach
The first approach of job satisfaction is the classical management approach and the second
one is known as the neoclassic approach. The classical management approach believes that
employees only possess economic needs along with physical needs and the satisfaction of
employees does play an important role in an organisation and should not be considered. The
classical management approach was first proposed in 1900 and continued till the 1920s
during the industrial revolution. The main focus of this approach was to increase the
efficiency and productivity of an organisation with the help of proper management. The
positive aspect of this classical approach is that, it increases the effectiveness of management
within the organisation. Its weakness, on the other hand, is that it decreases the growth and
motivation of the employees thereby disregarding their active involvement in the
organisation. There are three main types of classical management. These are a) Taylor’s
theory of scientific management, b) Comprehensive analysis of management or Fayol’s
theory of administrative management and c) Weber’s Bureaucratic management. Figure 2.1
below represents the graphical approach of the classical management theory.
Figure 2.1: Types of Classical Management Approach
Source: Author’s Own Diagram Based on Celik (2011)
Scientific management
Administrative management
Bureaucratic management

20
Taylor’s theory of scientific management deals with the finding of the best method with the
help of which they can structure the situation to have fruitful results that are to yield high
levels of production from the workforce. Taylor (1911) is considered as the father of
scientific management theory and was a mechanical engineer who worked in the steel
industry and observed that workers do not work in an efficient way. His primary focus,
therefore, was to enhance the productivity of the workers using scientific methods. Taylor did
the experiment (known as time studies) to examine the optimum procedure to increase the
performance of the employees. A stopwatch was used to calculate the efficiency of the
workers. He was able to increase the output of shovellers from sixteen to fifty-nine
tonnes/daily and condensed the figure of yard workers from five hundred to one hundred and
forty (Mahmood et al. 2012).
The scientific management covers mainly the lower managers as a result of which it is
commonly known as lower level management analysis. The scientific management approach
is defined as the procedure of discovering “one best way” for doing the job (Certo & Certo,
2006, p.2) as cited by Sarker and Khan (2013). Sarker and Khan (2013) wrote a book on
“Scientific Management Theory” in which they mentioned four basic features as given below:
1. The first rule is that the work should be based on scientific method, and new ways of
performing tasks should be developed accordingly.
2. New scientific approach should be adopted to train employees, and each employee should
be allotted an individual task for better results.
3. Cooperation with the workers allows the management to ensure that the scientific criteria
are fulfilled.
4. The work should be divided between the managers and the employees equally so that the
managers should implement the scientific principles and in return, the workers should
perform their tasks in an effective way.
Taylor’s (1911) study was very effective during the era of the industrial revolution and is still
adopted by the practitioners around the world as the workers are rewarded for their
performances within the organisation. On the other hand, there are some critics that did not
consider the social need of workers and required more work from the workers with less
compensation. Moreover, the outcomes of production rates are discussed with the workers
and these revealed different findings when applied to the industrial area as productivity of
work varies from one individual to another individual. However, his work was later
21
developed by dividing the tasks into further sub-segments and to execute that task in a more
scientific way (Mahmood et al. 2012).
The second type of scientific management is known as administrative management which
deals with the designing of the job leading to the examination of the management style. In
other words, this type of management is directly linked to the performances of the managers.
Its main function is to concentrate on the efficiency of an organisation. Another name for this
technique is the comprehensive analysis of management. The pioneer of this approach is
Fayol (1949) who wrote the book named the “General and Industrial Management” (Sarker &
Khan, 2013, p.3). Fayol (1949) was a mining engineer and management theorist. His main
contribution towards the administrative management is due to principles he highlighted for
the better performance of the managers. The main functions of his theory are planning,
organising, commanding, and coordinating the management process and finally the
implementation of the process. The positive aspect of Fayol’s (1949) theory of management
is that it is widely used in big businesses and is most commonly practised in the military. The
management functions presented by him are still adopted in the modern era. On the other
hand, the negative aspect of his theory is that his two principles of management theory mainly
unity of direction and unity to command were excluded from the matrix management as cited
by Mahmood et al. (2012).
The last type of classical management approach is the bureaucratic management. The pioneer
of this approach is Max Weber (1947). He was a German sociologist. He felt the development
of the management theory and suggested that the organisation should adopt a modern system
of management which could be achieved with the help of pre-planned activities. He divided
bureaucratic management into hierarchical ranks which assures that the management can
function in a better way. This means that when managers are allotted tasks, individually they
can work effectively and efficiently. The main strength of this approach is that it can be used
in different sectors both by publically owned businesses and privately owned companies.
Hence, it can be said that every sector follows the hierarchy of management which makes
them successful and competitive (Mahmood et al. 2012).
22
2.2.2. (I a) Merits and Demerits of the Classical Management Approach
The classical management approach has both positive and negative aspects of this approach.
The main positive aspect of the classical management approach is that it is considered as a
significant contributor towards the enhancement of management theories. It has three key
elements as stated by Griffin (2006) where the scientific management approach deals with the
employees working in an organisation and the methods by which their efficiency to do work
can be enhanced.
This theory was later overcome by an administrative approach which concentrates more on
the performance of an organisation rather than just the employees. Another type of classical
management approach is the bureaucratic management approach which mainly focuses on
erasing the inconsistency of the managers. This shows that its key function is to highlight the
post of managers instead of individuals.
To conclude from the above literature, it is found that the classical management approach is
the representative of all the rules and regulations associated with management. It has created
the difference between the performance of the management and the operational activities.
Moreover, it recognised the usage of scientific technique in solving the issues related to
management and has created the awareness for the requirement to have a mutual
understanding between the workforce and the employers.
Contrary to this, the classical management theory also possesses various drawbacks as well.
The main drawback of this approach is that it does not consider the needs and wants of
humans and is totally based on the designed structure of the organisation. This shows that the
classical approach disregards the requirements of human beings at the workplace by
identifying the designed organisational structure which goes against the nature of the
employees within the organisation. This creates stress among the workers for they are unable
to participate in the organisation’s decision-making process and are derived from freedom of
communication. The practice also relies on the money given to employees as a part of work
which, if paid less, could lead to depression and unbalanced family lives among the
employees of the organisation. Other weaknesses associated with this theory are that it is “too
formal” (Sarker & Khan, 2013, p.3) and is more likely to be more suitable for uncomplicated
and stable businesses as compared to complex entities which can be seen in today’s era.
Lastly, it is based on the basic principles and does not cover some complex situations in
reality.
23
2.2.2. (II) Neoclassic Approach
After the criticisms by various researchers on the classical management approach of job
satisfaction, the later management theory that came into being is the neoclassical management
approach. It is depicted from the above literature that the classical management approach did
not consider the needs of workers. It was later criticised for this presumption and was
overcome by another approach known as the neoclassic approach which was the foundation
of employees as they were given free will to share their ideas in the decision-making process,
were allowed to communicate with the managers and assist them where ever required. These
components of neoclassic approach were considered to be more efficient for the success of an
organisation in the form of productivity. The main constituents of this approach are that
liberty to participate and the intrinsic worth-value of work are both assured.
The interaction between the managerial and non-managerial workers provide them with the
sense of job security as the workers were given a chance to respect the rights of employees
thereby, giving them authority and providing them with promotional and career advancement
which the employees deserve. The neoclassical management was established by Mayo (1949)
as mentioned by Sarker and Khan (2013) who came with the idea that much of the attention is
required towards the human perspective. There are three main types of neoclassical
management approach. The first type is known as the Hawthorne Experiment. The second
one is called the Human Relation Movement; and the third one is named as Organisational
Behaviour. The Hawthorne Experimental study conducted various experiments in the United
States of America on the electric company between 1927 and 1932 and concluded that
humans hold crucial positions within organisations Other experiment conducted on a similar
group revealed that there is a direct relationship between the working environment and
productivity, which means that when management provides healthy conditions to their
employees, they would be motivated to do more productive work. This approach is further
extended by other researchers to a new approach commonly known as Human Relation
Movement. The main purpose of the Human Relation Movement method was to analyse the
perception of employees towards their job satisfaction by taking into consideration various
dimensions which include personal characteristics, interpersonal characteristics and others.
This movement was supported by various scholars, mainly Abraham Maslow and Frederick
Hertzberg as suggested by Singh (1983). The third and last type of neoclassical management
approach is the organisational behaviour. This category is mainly concerned with the analysis
of the attitude and behaviour of employees along with their performances whether it is at
24
individual or collective levels. Since this approach is mainly concerned with the attitude and
behavioural study of employees in an organisation, it is known as the organisational
behaviour approach. See section 2.2.2. (IIa) for more on the literature on positive and
negative aspects of the neoclassical management approach
2.2.2. (IIa) Merits and Demerits of the Neoclassical Management Approach Various researchers criticise the neoclassical management approach to employees in job
satisfaction. In light of this aspect, the researcher first discusses the strengths of this theory
followed by its weakness. The positive side of this approach is that it realises and fights for
the needs and welfare of the workforce within the organisation. This virtually opens the gate
of success for future researchers to interpret job satisfaction based on the perception of the
worker, where one can evaluate the satisfaction with the job and the life itself as it has a direct
impact on the social behaviour of workers. Furthermore, it identifies the factors that are
directly related to the human attitude. This idea led to the perception that the neoclassic
management approach is useful as it considers the workers as important sources for the
success of an organisation. Moreover, it has led to the establishment of a type of unique
management approach within the organisation.
However, besides, the positive aspects of the neoclassical management approach, there are
some limitations as well. The chief drawback of this theory is that it does share the ideas of a
classical management theory as the perception of human thinking deviates from time to time.
Further, it is not scientifically validated and possesses a biased connotation towards some
employees within the organisation. Also, it is hard to apply in the current situation as it very
much depends on the attitude and behaviour of both managers and employees.
From the above literature, it is it could be argued that both the classical management theory
and neoclassical approach have played vital roles in the development of different
management practices and theories in regards to the employees of the organisation. With the
help of these approaches, businesses can take advantage and gain competitive advantage.
The Classical management theory holds an equally important positive position in the
management discipline as it was the first theory used to introduce management approaches
whereas the neoclassical management approach is regarded as the basis of all management
25
approaches,. This shows that every management theory has its identity and the application of
these theories depends on the nature of the organisation. Based on the current situation of the
manufacturing industry of Pakistan, it is observed that the country’s manufacturing industry
has declined by 11% of its contribution to the Gross Domestic Product as suggested by
Memon and Tahir (2012). The outcome of any organisation is known by the performance of
its employees; happy employees are expected to perform creditably well. This shows that the
manufacturing industry should focus more on neoclassical approach as this approach would
assist the managers to realise the needs of the employees, and it will enhance the satisfaction
levels of the employees which are directly associated with their best performances. This will
ultimately lead to the success and productivity of the organisation.
2.2.3 Job Satisfaction and Welfare
A recent study conducted by Gamboa et al. (2011) based on job satisfaction in the developing
country of Columbia stated that job satisfaction is one of the elements of individual
contentment. It is linked with a variety of positive outcomes including a) self-perception of
labour stability, b) the positive externality of workmates, c) an index of personal success, d)
an emotional state resulting from the appraisal of one’s job and e) an attitude towards one’s
job.
The term welfare has various concepts such as individual satisfaction which comes when a
person is self-satisfied with personal life. Secondly, the appraisal sentiments which ultimately
lead to positivity and thirdly the satisfaction from the influential sphere which comes from
various factors like family, leisure, social network and the work itself (Gamboa et al. 2011).
In an analytical study conducted on workers within an organisation, welfare in a developing
country where the case of India was taken into consideration concluded that nearly twenty
two per cent of the workers were satisfied with the process of welfare within the organisation.
Thirty-nine per cent of the workers fall into the category of average scale and least per cent of
the employees, i.e., sixteen per cent showed dissatisfaction (Sabarirajan et al. 2010).
Gamboa et al.’s (2011) findings revealed that job satisfaction and welfare measure have a
proportional relationship with each other. The employees of Textile Mills in India were found
to be happy with the welfare measures granted by their management. One study by Linley et
al. (2009) conducted in the United Kingdom also supports this idea by defining well-being as

26
an assemblage of happiness and satisfaction which shows that happiness can be analysed by
examining the perception of employees towards the job.
Since welfare is associated with the combination of happiness and job satisfaction, it is very
important to understand the significance of job satisfaction. This is discussed in (section
2.2.4) and the theories are required to put forward this suggestion suggests the theoretical part
where the theories help the illustration in detail (See section 2.3).
2.2.4 Importance of Job Satisfaction
There are many aspects in which we consider the employees to be satisfied with their jobs.
These include their mental health, working attributes, and relationships with other colleagues
and most importantly, the element of liking and helping increase production in the job. Scheid
(2010) stated that when workers are happy with their personal lives, they are also satisfied
with their work. This Scheid (2010) referred to as a dispositional theory. A significant amount
of research also supports this idea (Scheid, 2010, p. 1). The above statement depicts the idea
of the positive attitude of the life cycle to the positivity of job satisfaction. This also indicates
that workers who are satisfied with their jobs are more humble, happier and more enthusiastic
towards their lives. So, the question arises that, are the people satisfied with their occupations
the ones to be happier in life? A recent retirement survey carried out by Helman et al. (2008)
suggested that people retiring have attributes of satisfaction to their jobs, and the ratio is quite
diverse (See Figure 2.2 below).

27
Figure 2.2: Diversification of Job Satisfaction while Retiring
Source: Author’s Own Diagram Based on Helman et al. (2008)
The above chart depicts that out of hundred people surveyed, only 11 % of employees are
highly satisfied when they retire and a combined percentage of 43% also shows the satisfied
and somehow satisfied. Around 40 % of the people who are not satisfied may have problems
such as less career and promotional opportunities that could stop the future development of an
employee, less salaries scale, non-mutual relationships with the colleagues, insecure jobs,
lack of supervision and poor working conditions within the organisation.
This research highlights and uses the determinants mentioned above (extrinsic as well as
intrinsic factors) to analyse their influence on job satisfaction levels. The survey questionnaire
is administered using mathematical equation and statistics software to interpret the results
(See chapter 5). Moreover, the elements which are healthy in making an employee satisfied
with the job are the main reasons and cause him or her to be happier in the lifetime of his
employment period.
In the view of Sousa-Poza and Sousa-Poza (2000) job satisfaction is the outcome of the
stability between the internal and external factors. For example when employees receive the
expected rewards based on their hard work then job satisfaction increases. This theory has
clearly mentioned the exact elements of job satisfaction which not only make the employee
Highly Satisfied11%
Satisfied21%
Somewhat Satsfied
22%
Dissatisfied25%
Highly Dissatisfied
21%
Job Satisfaction at the time of making decision to retire

28
satisfied, but also guarantees the desired life of employees. It is worth, therefore,
understanding the influence of job satisfaction.
Various studies have concluded that job satisfaction assists in maintaining the workforce as it
is linked to reducing high turnover rates as the employees retain themselves in their jobs for
long periods. In other words, they become loyal and dedicated towards their jobs. On the
other hand, however, it would be injudicious to perceive that job satisfaction-turnover levels
have direct proportional connections, since job satisfaction is presumed to play a vital role in
reducing the percentage of employees quitting the job despite their chances of developing
their careers. Lack of job satisfaction would lead to high level of intention to leave a job even
if there are opportunities to build up the career and have more chances of promotion.
There are numerous outcomes of job satisfaction such as the reduction of levels of employee
job absenteeism; for example. This view was supported by Ellickson and Logsdon (2001) by
stating that job satisfaction is significant as it results in various aspects like a low level of
turnover rates in the organisations, less percentage of absenteeism and so on. What this
suggests is that, there is an inverse relation between job satisfaction and absenteeism rate.
Moreover, it has been suggested that job satisfaction could also be the cause of better
performances by organisations. However, this has not always been the case as the literature
shows that the relationship between job satisfaction and performance levels within the
organisation to be spurious (Halepoda, 2011). In the next section, the researcher takes into
consideration different theories of job satisfaction and discusses the pros and a con of each
theory based on the literature and provides the rationale for the selection of an appropriate
theory as applied in this study.
2.2.5 Measurement of Job Satisfaction
Different authors perceive that job satisfaction is a vast topic which is measured with the help
of various determinants which comprise the job satisfaction itself. For example Yang and
Wang (2013) suggested that job satisfaction is composed of certain determinants such as
personal characteristics, job characteristics and organisational characteristics which are
further composed of factors. Most of the researchers analyse job satisfaction in different
industries based on an intrinsic and extrinsic phenomenon. The intrinsic factors include:
promotions and pay, and extrinsic factors consist of supervision, co-workers and the nature of
29
work (Judge & Klinger, 2008). After analysing the determinants with the help of which one
can interpret job satisfaction best, the next issue raised by most of the researchers is that of
how to measure the job satisfaction itself.
It is observed from the literature that most of the authors rely on measuring job satisfaction
with the help of scales; these include the Minnesota Satisfaction Questionnaire (Weiss et al.
1967) and the Job Descriptive Index (Smith et al. 1969). The Minnesota Satisfaction
Questionnaire possess long and short forms which consists of certain facets which the
researcher uses to examine job satisfaction. The application of long and short forms depends
on upon the nature of each study. Job Descriptive Index, on the other hand, analyses job
satisfaction with the help of certain facets (promotion, pay, supervision, co-workers and the
nature of work) which could be used to measure the job satisfaction. Various researchers have
validated both measures. However, the usage of specific questionnaires depends on the study
of the research. The scale is the most appropriate method of measurement of job satisfaction
as suggested by Brayfield and Rothe’s (1951). On the other hand, there are some critics
regarding the facets employed in measuring job satisfaction. For example, the Job Descriptive
Index is based on certain facets and does not measure job satisfaction on its own; that is to
examine the job satisfaction level the researchers have to calculate all the related facets. In
this way, it could be defined as the combination of all facets. Results have revealed that facets
measuring job satisfaction have no correlation with the “global measures” as cited by Judge
and Klinger (2008, p.397). On the other hand, however, researchers argue that job satisfaction
can be measured without considering the facets that measure job satisfaction having the
reliability of .67 (Wanous et al. 1997). However, the reliability value is less than the
assemblage of three facets measuring job satisfaction having the reliability of .85.
To sum up, it is more appropriate to use scale having certain facets with the help of which one
can analyse job satisfaction. However, there are certain demerits of using the facet technique
as some of the items require a lot of time from the respondents to fill in the forms as a result
of which they would commit negligence and will provide either wrong information or will
refuse to fill in the form. Hence, some researchers have come up with the questionnaires
which better analyse job satisfaction levels of the employees by analysing the Cronbach’s
alpha value which tells the reliability of the items used for the study.
30
2.2.6 Consequences of Job Satisfaction
In the previous section (2.2.4) the researcher discussed the importance of job satisfaction.
Now the researcher will throw more light on the effects and consequences of job satisfaction
regarding organisational perspectives. There are various positive effects of job satisfaction.
The first positive impact of job satisfaction is the productivity of the employee. This means
when employees are satisfied with their jobs, they will produce more work. The second
consequence of job satisfaction is how well the employees are loyal to their work, and this is
usually analysed when employees have low rates of absenteeism. This view was supported by
Pandey and Khare (2012) when they conducted a study to investigate the influence of job
satisfaction and organisational commitment on employee loyalty. With the help of their study,
they were able to analyse the relationship between job satisfaction and employee loyalty.
Similarly, Jawahar (2006) discussed that when employees are admired for their work, the
relationship between job satisfaction and employees loyalty is more likely to increase. Hence,
to increase the loyalty phenomenon, it is crucial that employees should be given good
remarks and should be appreciated for their work as this leads to low staff turnovers. The
literature, however, on the other hand, indicates that job satisfaction is not positively linked to
the productivity of the workforce as stated by Aziri (2011). This means even when employees
are satisfied with their jobs, they are less likely to be influenced and do not always produce
100% effort in their works.
Different factors play major roles in the job satisfaction levels of employees and act as
moderators. One of the most common and influential indicator of job satisfaction is when
employees are promoted and given rewards. This shows when employees are rewarded for
their work, they are more likely to observe the equality term in their organisations which
gives them mental satisfaction as well. For further discussion see section (2.5).
In the light of the literature, the key influence of job satisfaction concerning organisational
commitment is employee loyalty which most of the Human Resource managers identify.
What this means is that, with its absence organisations suffer a lot. This can be measured with
the help of questionnaires as well. There are three main types of employee’s loyalty, namely:
normative loyalty, continuity loyalty and effective loyalty. Another important factor that is
considered to be the influence of job satisfaction is low staff turnover. When employees are
absent from their jobs, it concerns the managers, and they try to find out means with which
they can get help to reduce the absenteeism phenomenon and this can only be achieved when
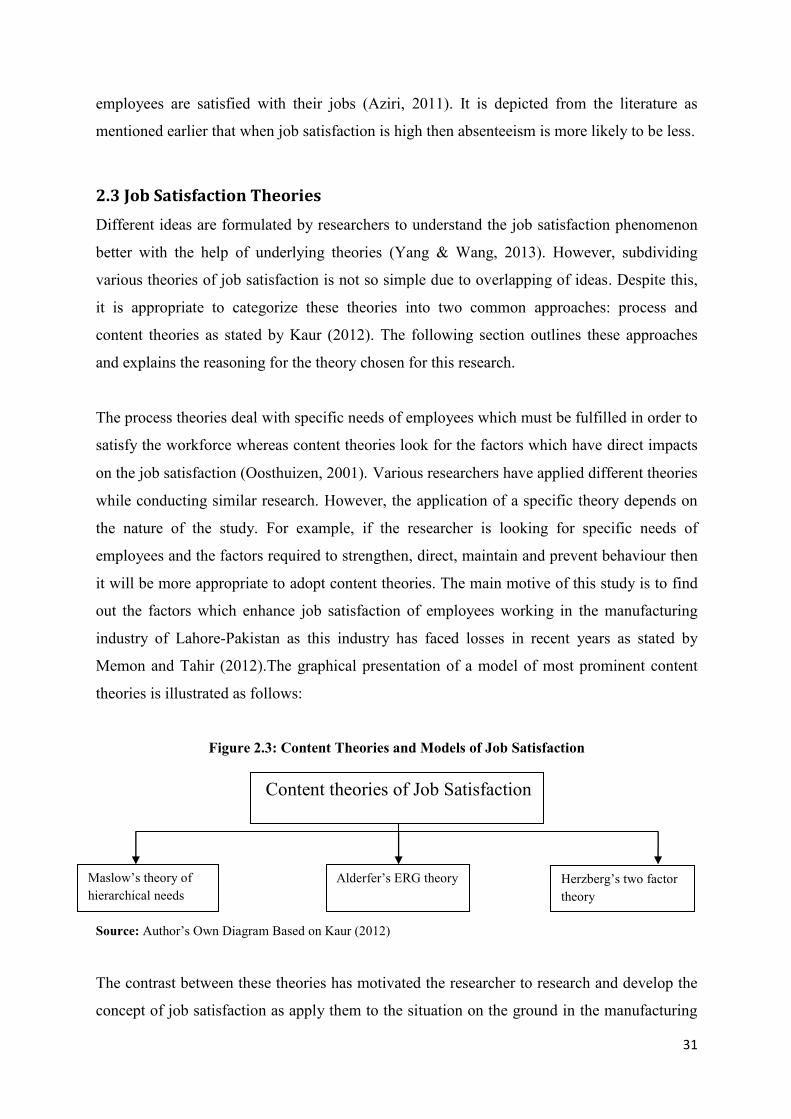
31
employees are satisfied with their jobs (Aziri, 2011). It is depicted from the literature as
mentioned earlier that when job satisfaction is high then absenteeism is more likely to be less.
2.3 Job Satisfaction Theories
Different ideas are formulated by researchers to understand the job satisfaction phenomenon
better with the help of underlying theories (Yang & Wang, 2013). However, subdividing
various theories of job satisfaction is not so simple due to overlapping of ideas. Despite this,
it is appropriate to categorize these theories into two common approaches: process and
content theories as stated by Kaur (2012). The following section outlines these approaches
and explains the reasoning for the theory chosen for this research.
The process theories deal with specific needs of employees which must be fulfilled in order to
satisfy the workforce whereas content theories look for the factors which have direct impacts
on the job satisfaction (Oosthuizen, 2001). Various researchers have applied different theories
while conducting similar research. However, the application of a specific theory depends on
the nature of the study. For example, if the researcher is looking for specific needs of
employees and the factors required to strengthen, direct, maintain and prevent behaviour then
it will be more appropriate to adopt content theories. The main motive of this study is to find
out the factors which enhance job satisfaction of employees working in the manufacturing
industry of Lahore-Pakistan as this industry has faced losses in recent years as stated by
Memon and Tahir (2012).The graphical presentation of a model of most prominent content
theories is illustrated as follows:
Figure 2.3: Content Theories and Models of Job Satisfaction
Source: Author’s Own Diagram Based on Kaur (2012)
The contrast between these theories has motivated the researcher to research and develop the
concept of job satisfaction as apply them to the situation on the ground in the manufacturing
Content theories of Job Satisfaction
Maslow’s theory of hierarchical needs
Alderfer’s ERG theory Herzberg’s two factor theory
32
industries of Pakistan. New knowledge gained will be added to existing knowledge in this
field of study. Each of these theories will be discussed one by one in the following ways:
2.3.1 Maslow’s Hierarchy of Needs Theory
Maslow’s (1943) theory is considered to be an early theory of job satisfaction. This theory
suggests that humans require developments in their needs with the passage of time which he
named as the hierarchy of needs. According to his theory he suggested that humans require
developments in their needs with the passage of time which he named as the hierarchy of
needs. Maslow’s theory argued that if the fundamental level of needs of people is fulfilled,
then this could motivate them to go further for the next level of needs which could be self-
actualization and achievement (Luthans, 1998). Maslow’s theory assisted Human Resource
practitioners to know about the attitude and behaviour of their employees towards work in an
organisation using the motivation technique. This eventually became the first theory to
provide the concept of individual needs, as posited by Abraham Maslow.
The main motive of Abraham Maslow was to analyse the perception of the people in a
working place when an organisation does not meet the needs of the individual’s then it affects
their performance. The psychology of Maslow’s theory was based on the hierarchical needs of
the workers (Carr, 2005). According to him, there are five main categories of human needs
that have been arranged by hierarchy meaning that the core needs of individuals must be
accomplished first in order to proceed to the next step. Hence, his theory works in a process
form where the basic needs of a person are fulfilled first before the initiation of the other
needs in a hierarchical order. However, from the motivational aspect, it proposes that
differences in the needs of an individual could be the best source to increase the productivity
(Steyn, 2002). But on the other hand, he argues that when all the needs of people are met then,
motivation does not influence them as a result of which performance of an organisation is
affected. Maslow insisted on the importance of hierarchical needs of people. The five main
needs which should be kept in mind by the management to motivate their employees as
indicated by Maslow (1943) are physiological factors, safety factors, social factors, esteem
factors and self-actualization.
The Maslow theory is one of the pioneer theories of management which is considered to be
useful in assisting managers and is very simple to understand and present as stated by Benson
(2003). On the other end, certain economists and socialists have ideas that go against

33
Maslow’s theory. Koutsoyians (1991), argues that man has unlimited needs and wants. If we
relate this to the Maslow theory in which he suggests that needs are at the stage development
of individuals, goes controversial with Koutsoyians. According to Koutsoyians (1991)
consider that there are infinite “wants” not “needs”. This shows that an individual does not
require a need if there is no need of it in actual. Criticising the Maslow theory Buchanan and
Huczynski (2004) considers that it is not appropriate to apply this theory as it possesses the
ideas that are unclear and does not examine the behaviour of an individual. Carr (2005) stated
that this theory is not empirically supported as Maslow did not provide any empirical
evidence to support his findings. Moreover, this theory is cultured based which means that it
depends on the norms and values of individuals. Based on the limitations, Maslow’s theory
was extended and modified by Alderfer in 1969.
2.3.2 Alderfer’s ERG Theory
Another theory that was introduced in the management field based on the needs of individuals
was formulated by Alderfer (1969). According to his theory there are three major needs
(existence, relatedness and growth) that held responsible in fulfilling the desired needs of
employees (Spector, 2000).He contradicts the idea of Maslow and stated that the needs do not
depend on levels. Oosthuizen (2001) stated that existence needs include basic needs (shelter,
water, food, working environment and pay), relatedness corresponded to Malow’s social
needs (co-workers relationships, friends and family) and lastly is the growth needs which
refers to Maslow’s self-actualisation in which individuals desire to grow and be more
productive. Although Maslow theory and Alderfer’s ERG theory resemble with each other
with respect to hierarchy level of needs but still their work has significant differences. For
example Maslow’s theory focus on specification of five levels in which individuals move
from low level to high level with respect to needs while Alderfer’s (existence, relatedness and
growth) theory have categorise these five needs into three basic needs(Greenberg and Baron,
2003).Above all, the Alderfer’s ERG theory is considered as an extended version of
Maslow’s work and it assist the managers to comprehend the attitude of their employees and
to know that they have certain needs which can be fulfilled at the same time. This shows that
the ERG theory does not have to follow any order and states that need can be fulfilled again
irrespective of order. Further, this theory is considered as one of the approach which accounts
intrinsic factors which become a reason for the management to take actions. Such knowledge
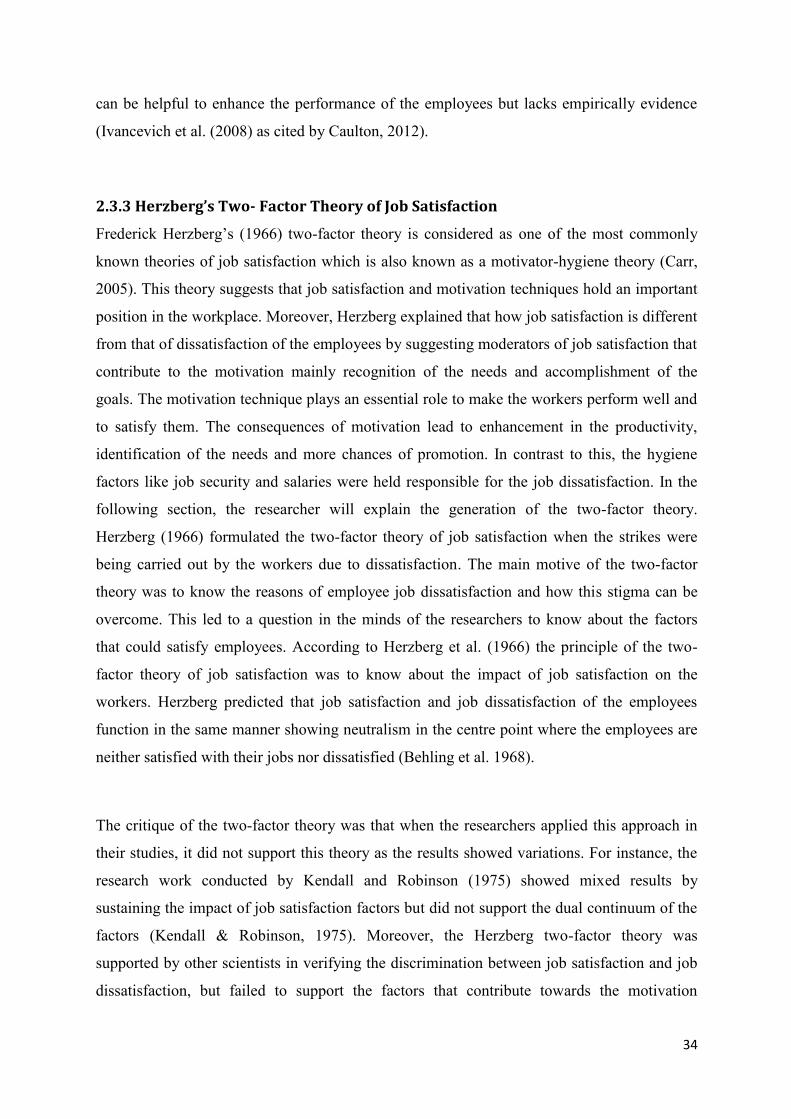
34
can be helpful to enhance the performance of the employees but lacks empirically evidence
(Ivancevich et al. (2008) as cited by Caulton, 2012).
2.3.3 Herzberg’s Two- Factor Theory of Job Satisfaction
Frederick Herzberg’s (1966) two-factor theory is considered as one of the most commonly
known theories of job satisfaction which is also known as a motivator-hygiene theory (Carr,
2005). This theory suggests that job satisfaction and motivation techniques hold an important
position in the workplace. Moreover, Herzberg explained that how job satisfaction is different
from that of dissatisfaction of the employees by suggesting moderators of job satisfaction that
contribute to the motivation mainly recognition of the needs and accomplishment of the
goals. The motivation technique plays an essential role to make the workers perform well and
to satisfy them. The consequences of motivation lead to enhancement in the productivity,
identification of the needs and more chances of promotion. In contrast to this, the hygiene
factors like job security and salaries were held responsible for the job dissatisfaction. In the
following section, the researcher will explain the generation of the two-factor theory.
Herzberg (1966) formulated the two-factor theory of job satisfaction when the strikes were
being carried out by the workers due to dissatisfaction. The main motive of the two-factor
theory was to know the reasons of employee job dissatisfaction and how this stigma can be
overcome. This led to a question in the minds of the researchers to know about the factors
that could satisfy employees. According to Herzberg et al. (1966) the principle of the two-
factor theory of job satisfaction was to know about the impact of job satisfaction on the
workers. Herzberg predicted that job satisfaction and job dissatisfaction of the employees
function in the same manner showing neutralism in the centre point where the employees are
neither satisfied with their jobs nor dissatisfied (Behling et al. 1968).
The critique of the two-factor theory was that when the researchers applied this approach in
their studies, it did not support this theory as the results showed variations. For instance, the
research work conducted by Kendall and Robinson (1975) showed mixed results by
sustaining the impact of job satisfaction factors but did not support the dual continuum of the
factors (Kendall & Robinson, 1975). Moreover, the Herzberg two-factor theory was
supported by other scientists in verifying the discrimination between job satisfaction and job
dissatisfaction, but failed to support the factors that contribute towards the motivation
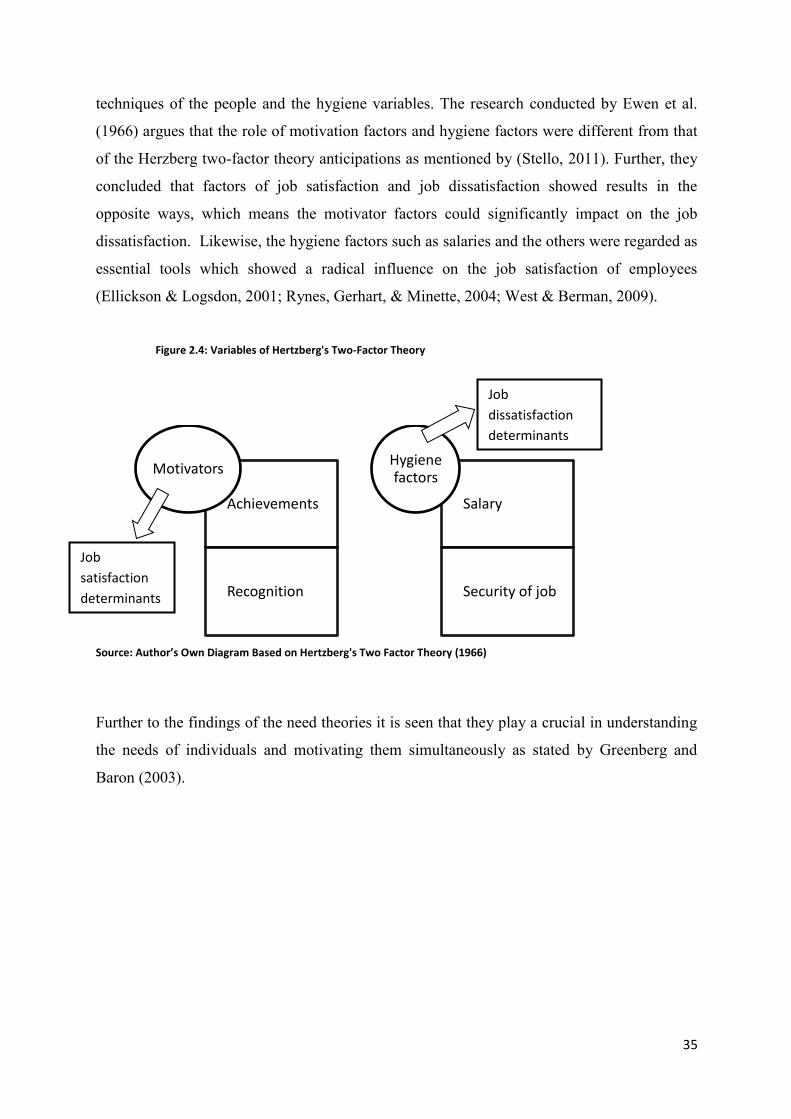
35
techniques of the people and the hygiene variables. The research conducted by Ewen et al.
(1966) argues that the role of motivation factors and hygiene factors were different from that
of the Herzberg two-factor theory anticipations as mentioned by (Stello, 2011). Further, they
concluded that factors of job satisfaction and job dissatisfaction showed results in the
opposite ways, which means the motivator factors could significantly impact on the job
dissatisfaction. Likewise, the hygiene factors such as salaries and the others were regarded as
essential tools which showed a radical influence on the job satisfaction of employees
(Ellickson & Logsdon, 2001; Rynes, Gerhart, & Minette, 2004; West & Berman, 2009).
Figure 2.4: Variables of Hertzberg's Two-Factor Theory
Source: Author’s Own Diagram Based on Hertzberg's Two Factor Theory (1966)
Further to the findings of the need theories it is seen that they play a crucial in understanding
the needs of individuals and motivating them simultaneously as stated by Greenberg and
Baron (2003).
Achievements
Recognition
Motivators
Salary
Security of job
Hygiene factors
Job
satisfaction
determinants
Job
dissatisfaction
determinants
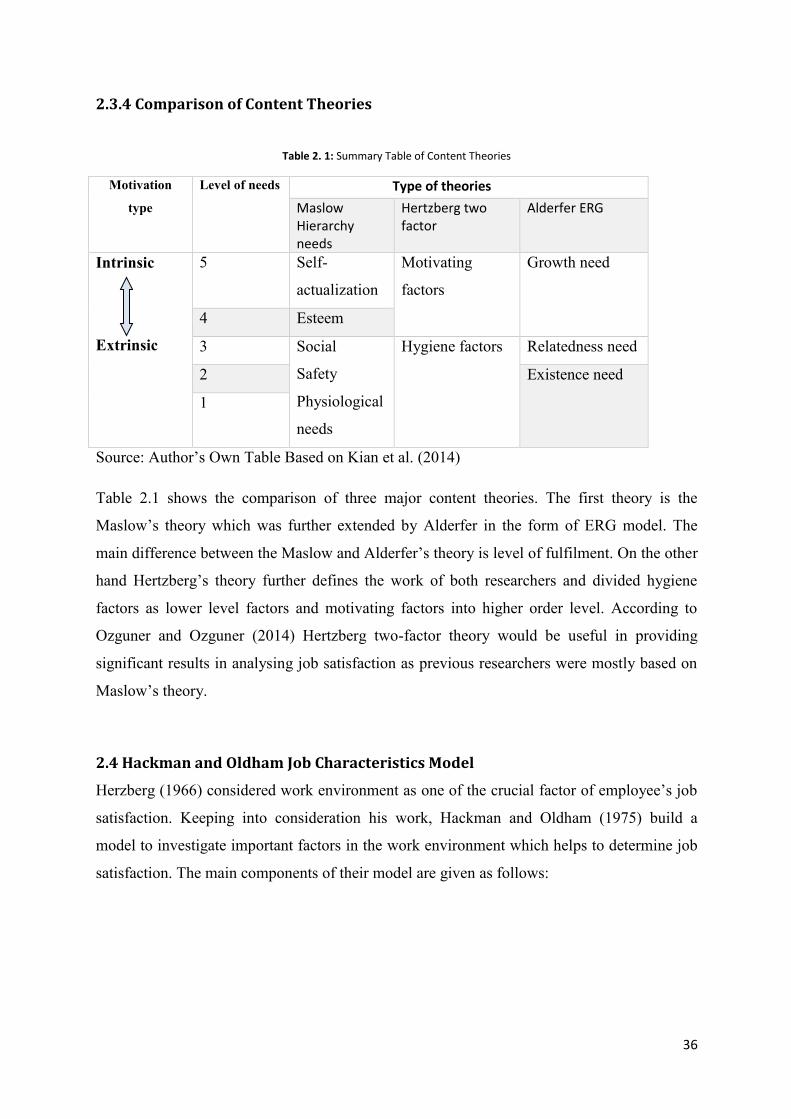
36
2.3.4 Comparison of Content Theories
Table 2. 1: Summary Table of Content Theories
Motivation
type
Level of needs Type of theories
Maslow Hierarchy needs
Hertzberg two factor
Alderfer ERG
Intrinsic
Extrinsic
5 Self-
actualization
Motivating
factors
Growth need
4 Esteem
3 Social
Safety
Physiological
needs
Hygiene factors Relatedness need
2 Existence need
1
Source: Author’s Own Table Based on Kian et al. (2014)
Table 2.1 shows the comparison of three major content theories. The first theory is the
Maslow’s theory which was further extended by Alderfer in the form of ERG model. The
main difference between the Maslow and Alderfer’s theory is level of fulfilment. On the other
hand Hertzberg’s theory further defines the work of both researchers and divided hygiene
factors as lower level factors and motivating factors into higher order level. According to
Ozguner and Ozguner (2014) Hertzberg two-factor theory would be useful in providing
significant results in analysing job satisfaction as previous researchers were mostly based on
Maslow’s theory.
2.4 Hackman and Oldham Job Characteristics Model
Herzberg (1966) considered work environment as one of the crucial factor of employee’s job
satisfaction. Keeping into consideration his work, Hackman and Oldham (1975) build a
model to investigate important factors in the work environment which helps to determine job
satisfaction. The main components of their model are given as follows:
37
Table 2. 2: Components of Hackman and Oldham Model
Autonomy The degree of independence, discretion and liberty granted by the occupation in analysing various factors such as the work environment, breaks in work and distribution of different tasks.
Identity of task The amount of work identified by an employee in accomplishing the targeted job.
Variety of skill The degree of opportunities provided by the job to the workers in utilising different levels of aptitudes and abilities.
Feedback of task The evaluation of work provided by the job to the employees in regards to their performance and achievement of the objectives and organisational goals.
Importance of task The impact level of the job performance executed by the employees either on their colleagues working in the same organisation or different one.
Source: Author’s Own Table Based on Halepota (2011)
According to Rousseau (1977), most of the studies were in favour of this model. The job
characteristics model strengthened the work done by Arthur and Paul (1965). They examined
the connection between the attitude and behaviour of employees towards their work and the
main aim of that work. The job characteristic theory argues that the work which is derived
from objectives to be accomplished in a particular span of time and the same schedule of
work leads to a) an increase in job dissatisfaction of employees, b) more chances of quitting a
job and c) high rates of absenteeism. This ultimately results in difficulty in handling the
employees working on even a simple task. The specific features of the Hackman and
Oldham’s job characteristic model are that the employees should possess the awareness and
understanding of their work, the deliverance of the work should be performed in an efficient
manner so that they should be obliged towards their responsibility for the fulfilment of the
assigned task.
Likewise, the main limitation associated with the Hackman and Oldham job characteristic
model in the view of Brass (1981) is that it did not consider the organisational/interpersonal
variables which may have an influence on the job satisfaction. This shows that organisational
environmental factors should be considered for they have a significant relationship with job
satisfaction. Nevertheless, this theory is also useful to apply in Lahore-Pakistan as it helps to
identify the factors which are responsible to energise employee’s job satisfaction within the
manufacturing industries of Pakistan.
38
2.5 Determinants of Job Satisfaction
It is crucial to know the constituents of job satisfaction. For this reason, different theories
were reviewed earlier which provided various perceptions and concepts of the researchers
about job satisfaction. The expectancy theory of job satisfaction formulated by Porter and
Lawler (1968) developed the concept of other motivational theories by providing a broad
model consisting of factors which play fundamental roles in representing various
determinants of job satisfaction. The primary focus of illustrating different theories as
discussed above in section (2.3) is that they have strong connections with employee job
satisfaction within the organisation. In this way, it acts as the foundation for conducting the
respective research by providing the basis for the interpretation of the attitude and behaviour
of the employees towards the job satisfaction phenomenon. As discussed before that the
origin of all theories of job satisfaction was formulated and developed mainly in developed
western context, particularly the United States of America and that their work was mostly
industrial based. It can, therefore, be visualised that all these theories of job satisfaction do
not provide further encouragement to other cultures mainly in an Asian environment. For this
purpose, the particular study has been taken into consideration to evaluate and assess the
effectiveness, generalizability and validity of the theories of job satisfaction in the light of the
Pakistani manufacturing industry sector of Lahore.
For the profound knowledge of job satisfaction, this study examines some essential factors
that contribute towards employee satisfaction. To conduct this study, the researcher focuses
on different manufacturing companies from the public and private sectors. Nevertheless, a
profound review of literature based on employee job satisfaction is quite related because it
has provided a strong base to assess, and interpret various variables of job satisfaction. This
study, therefore, presents the facets that were analysed to understand the job satisfaction
levels in leading public and private manufacturing companies of Lahore-Pakistan.
Job satisfaction is considered as the fundamental source of employees’ working lifestyles.
Various researches have been conducted on the satisfaction of employees that belong to
different professions in different organisations. The main purpose of their studies is to create
alertness about problems related to workers and the determinants which have strong impacts
on job satisfaction of employees within the organisation. Thus, with a proper understanding

39
of key factors of job satisfaction, the management can assist to enhance the performance of
the workforce which will ultimately lead to increased productivity.
Various factors contribute towards job satisfaction. Ayub (2010) with the help of survey
technique investigated the impact of pay, promotion, supervision, fringe benefit, contingent
rewards, operating condition, co-workers, nature of work and communication. His findings
revealed that private university teachers are more satisfied with their job as compared to
public university teachers.
To analyse the impact of task significance, job clarity, working conditions, esprite de corps,
job training, procedural justice, neuroticism, self esteem, locus of control and self efficiency
Halepota (2011) carried study on 310 public medical institution employees from 20 districts
of Pakistan. Survey questionnaire was adopted to find the perception of employees towards
job satisfaction. Results showed that all factors are significantly linked to job satisfaction
except for three factors (task significance, job security and locus of control) showed no affect
on job satisfaction.
Rast and Tourani (2012) assessed the influence of independent factors (nature of work,
present pay, opportunities for promotion, supervision and relationship with co-workers) on
the job satisfaction. Employees working in Iranian airline industry were distributed survey
form to examine the job satisfaction. Rast and Tourani’s findings revealed that all factors
significantly predict job satisfaction. However, gender did not show any relationship with the
job satisfaction.
Yang and Wang (2013) conducted study on civil servants of Beijing in China to determine
their satisfaction level. For this purpose sample size of 800 employees was used. Various sub-
factors of job characteristics, organisational-environmental factors and personal
characteristics were used to examine the job satisfaction level. Their findings revealed that
factors which have significant influence on job satisfaction include task variety, salary, work
environment safety, relations with co-workers and gender. Similarly, different authors state
that job satisfaction is a function of different facets (Lehman, 2014; Ali & Wajidi, 2013).
Okpara (2002) suggested that the main factors of employee job satisfaction include salary,
good co-workers relationships, supervision, the work, promotion and career opportunities
40
present in the organisation. Latif et al. (2011) argued that there were six basic components
such as educational qualification, pay, promotion, nature of work, work-life balance and
security in job satisfaction.
To find the difference between the public and private sector university teachers of Khyber
Pakhtunkhwa in Pakistan Aziz (2013) adopted Minnesota Satisfaction Questionnaire. A
sample size of 420 was conducted using T-Test. Results showed no difference among public
and private university teachers. Taking into consideration major contributors of job
satisfaction Ravichandran et al. (2015) conducted study on 150 employees working in
manufacturing industry of Puducherry in India. Analysis of variance was used to find the
impact of working condition, promotion and work environment. All three factors were found
to be statistically associated with the job satisfaction. Whereas, findings of Rukh et al. (2015)
revealed that demographic, financial and non-financial factors play a significant role in
predicting job satisfaction among public manufacturing employees of Pakistan.
Mihajlov and Mihajlov (2016) analysed the impact of intrinsic and extrinsic factors on job
satisfaction and how turnover intention is influenced by job satisfaction phenomenon. A
sample size of 234 employees working in public and private enterprises were send survey
questionnaire. Two difference techniques were used to assess the collected data. Results
revealed that public sector employees are highly satisfied as compared to private sector
employees. Moreover, their findings contradicted the idea of Herzberg’s two-factor theory by
stating that extrinsic factors lead to satisfaction. This shows that factors which are sources of
satisfaction and dissatisfaction is affected by various factors mainly country, nature of study
and sample size. To further confirm Herzberg’s two-factor theory Rahman et al. (2017)
conducted study in three big cities of Pakistan (Lahore, Islamabad and Karachi).The
population consisted of both family Takāful and life insurance agents. Results showed that
Herzberg’s two-factor theory successfully predicts the job satisfaction of employees. To
check the influence of moderator (Shari’ah perception) multiple regression analysis was used.
Findings revealed Shari’ah perception acts as a significant moderator for family Takāful sale
agents as compared to and life insurance agents.
Table 2.3 given below shows the summary of different determinants of job satisfaction
constructed from literature review to find the gap in knowledge.
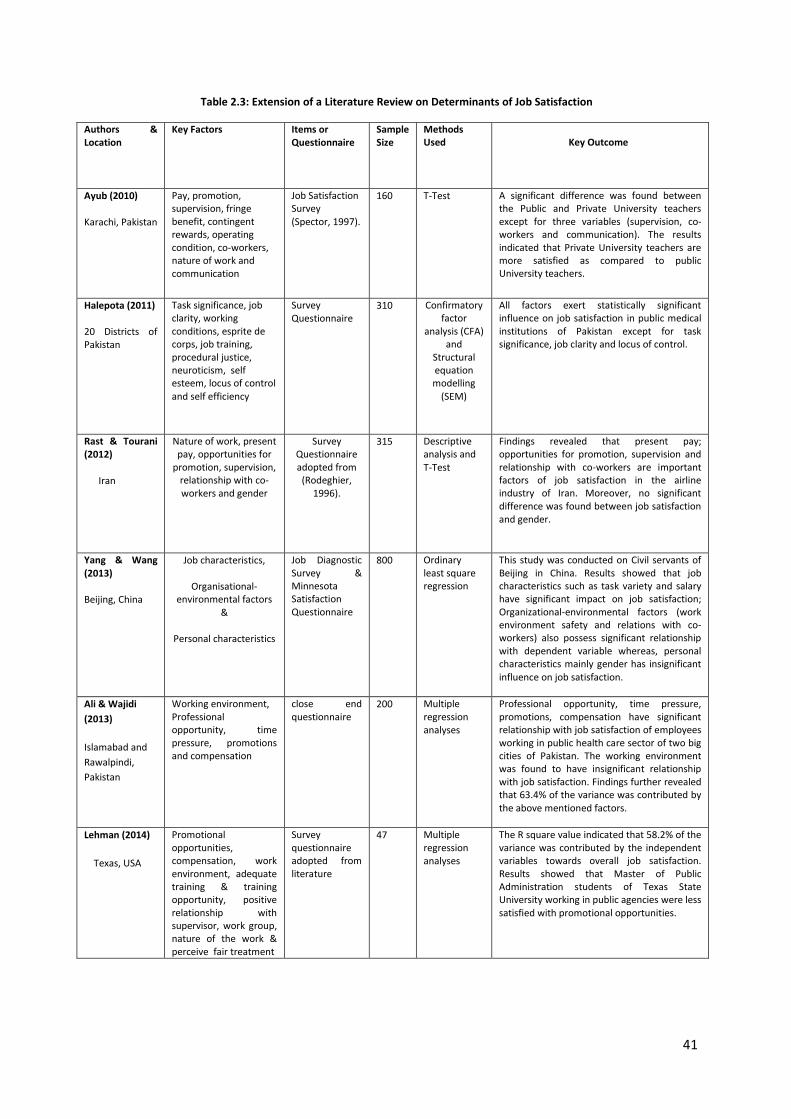
41
Table 2.3: Extension of a Literature Review on Determinants of Job Satisfaction
Authors & Location
Key Factors Items or Questionnaire
Sample Size
Methods Used
Key Outcome
Ayub (2010)
Karachi, Pakistan
Pay, promotion, supervision, fringe benefit, contingent rewards, operating condition, co-workers, nature of work and communication
Job Satisfaction Survey (Spector, 1997).
160 T-Test
A significant difference was found between the Public and Private University teachers except for three variables (supervision, co-workers and communication). The results indicated that Private University teachers are more satisfied as compared to public University teachers.
Halepota (2011)
20 Districts of Pakistan
Task significance, job clarity, working conditions, esprite de corps, job training, procedural justice, neuroticism, self esteem, locus of control and self efficiency
Survey Questionnaire
310 Confirmatory factor
analysis (CFA) and
Structural equation modelling
(SEM)
All factors exert statistically significant influence on job satisfaction in public medical institutions of Pakistan except for task significance, job clarity and locus of control.
Rast & Tourani (2012)
Iran
Nature of work, present pay, opportunities for
promotion, supervision, relationship with co-workers and gender
Survey Questionnaire adopted from
(Rodeghier, 1996).
315
Descriptive analysis and T-Test
Findings revealed that present pay; opportunities for promotion, supervision and relationship with co-workers are important factors of job satisfaction in the airline industry of Iran. Moreover, no significant difference was found between job satisfaction and gender.
Yang & Wang (2013)
Beijing, China
Job characteristics,
Organisational-environmental factors
&
Personal characteristics
Job Diagnostic Survey & Minnesota Satisfaction Questionnaire
800
Ordinary least square regression
This study was conducted on Civil servants of Beijing in China. Results showed that job characteristics such as task variety and salary have significant impact on job satisfaction; Organizational-environmental factors (work environment safety and relations with co-workers) also possess significant relationship with dependent variable whereas, personal characteristics mainly gender has insignificant influence on job satisfaction.
Ali & Wajidi
(2013)
Islamabad and
Rawalpindi,
Pakistan
Working environment, Professional opportunity, time pressure, promotions and compensation
close end questionnaire
200
Multiple regression analyses
Professional opportunity, time pressure, promotions, compensation have significant relationship with job satisfaction of employees working in public health care sector of two big cities of Pakistan. The working environment was found to have insignificant relationship with job satisfaction. Findings further revealed that 63.4% of the variance was contributed by the above mentioned factors.
Lehman (2014)
Texas, USA
Promotional opportunities, compensation, work environment, adequate training & training opportunity, positive relationship with supervisor, work group, nature of the work & perceive fair treatment
Survey questionnaire adopted from literature
47 Multiple regression analyses
The R square value indicated that 58.2% of the variance was contributed by the independent variables towards overall job satisfaction. Results showed that Master of Public Administration students of Texas State University working in public agencies were less satisfied with promotional opportunities.

42
Authors & Location
Key Factors
Items or Questionnaire
Sample
Size
Methods Used
Key Outcome
Okpara (2002)
Chartered Institute of Bankers of Nigeria
Pay, gender, supervision, promotion, co-workers, work and demographic factors
Job Descriptive Index (Smith et al. 1969, 1985)
340 T-Test and multiple regression analysis
Results showed that a significant difference occurs between male and female bank manager’s salary with respect to demographic factors having R square values as .52 for gender, .48 for education and .51 for experience. Findings also indicated that female respondents were less satisfied with their pay as compared to males. However, female employees were more satisfied with their work, co-workers and supervision.
Latif et al. (2011)
Faisalabad, Pakistan
Nature of Work, promotional opportunities, educational qualifications, job security, family & work life balance and pay
Survey Questionnaire
160 Descriptive analysis and correlations
Public College teachers of district Faisalabad in Pakistan were more satisfied with all components of job satisfaction as compared to Private College teachers.
Aziz (2013)
Khyber Pakhtunkhwa,
Pakistan
20 Dimensions of job satisfaction
Minnesota Survey Questionnaire long form
420 T-Test No significant difference was found between the public and private sector university teachers in Khyber Pakhtunkhwa in Pakistan.
Ravichandran et al. (2015)
Puducherry, India
Working condition, promotion and work environment
Well-structured Questionnaire
150 Exploratory factor analysis, frequency distribution and analysis of variance (ANOVA)
Employees working in manufacturing industry of Puduchery in India showed satisfaction towards job. Findings indicated that all three factors played a significant role in job satisfaction. However, promotion was recorded as the most influential factor of job satisfaction.
Rukh et al. (2015)
Pakistan
Demographic, financial and non-financial factors
Self-administered Questionnaire
250 non-parametric Spearman correlation and Kruskal-Wallis tests
Results showed that demographic, financial and non-financial factors were significantly associated with the job satisfaction among large public engineering goods manufacturing organisations of Pakistan.
Mihajlov & Mihajlov (2016)
Serbia
Intrinsic and extrinsic along with turnover intension of employees
Previous survey questionnaire
234
T-Test and Hierarchical regression analysis
Results revealed that employees working in public enterprise are more satisfied and showed low turnover rate as compared to private employees. Findings indicated that extrinsic factors lead to satisfaction. Their results contradict Herzberg’s theory which states that extrinsic factors are resource of dissatisfaction.
Rahman et al. (2017)
Lahore, Islamabad and Karachi, Pakistan
Motivators, Hygiene factors and Shari’ah perception (moderating variable)
Survey Questionnaire
318 Descriptive analysis , multiple regression and hierarchical regression analysis
Findings indicated that Herzberg’s two-factor theory plays a significant role in motivating both family Takāful and life insurance agents. However, the moderating effect of Shari’ah perception has a significant influence on family Takāful sales agents as compared to life insurance agents.
Source: Author’s Own Table Based on Literature Review
43
From Table 2.3 above, it is observed that most of the researchers agreed to the issues
regarding facets that measure the job satisfaction. Among them, the most important factors
are pay, attitude of supervisors, job security and co-workers. However, the main limitation
associated with their work is that the sample size used by the researchers varies concerning
the research project and other factors. This shows that the sample size has a direct influence
on the results of the study. Along with that it is seen from the above mentioned literature that
most of the researchers have applied Herzberg two-factor to find the job satisfaction level of
employees.
One study by D’Addio, Eriksson and Frijters (2003) has concluded that job satisfaction is
directly related to various mental factors. Evidence (reliability test) has revealed that job
satisfaction is a combination of various factors which help to analyse the job satisfaction
levels of employees within the organisation. Taking this into consideration, the researcher
considers the important factors that enhance the job satisfaction of employees as Kumari and
Pandey (2011) stated that the relationship of job satisfaction is not necessarily straightforward
and can be influenced by a number of other work-related constructs. To gain more insight
into this view, the main factors which influence job satisfaction levels among employees are
discussed in detail (see Chapter 3).
2.6 Rationale for the Selection of Mixed Theories
This study is based on combination of Hertzberg’s two-factor theory and Hackman and
Oldham theory as the crucial motive of study is to investigate the specific factors which have
a positive impact on the employee job satisfaction. As discussed in section 2.5 various
researchers have applied Herzberg two-factor theory to determine the perception of
employees towards job satisfaction. However, few studies have considered the combination
of theories as a result of which this study will use a combination of theories to evaluate the
perception of employees working in public and private manufacturing companies of Lahore-
Pakistan.
According to Alshitri (2013), the absence of extrinsic factors among employees in the
organisation results in job dissatisfaction. As a result, it is important to identify the perception
of employees towards hygienic factors which include: salaries, co-workers, job security,
supervision, working conditions, task significance and work environment. On the other hand,
44
the elements which constitute intrinsic factors are recognition, achievement, responsibility,
promotion and the work itself. The presence of intrinsic factors also plays an important role in
enhancing the job satisfaction of employees (Danish & Usman, 2010). Both extrinsic and
intrinsic factors contribute towards job satisfaction of employees. This shows that it is equally
essential to consider both types of factors.
Since the current performance of the manufacturing industry is in decline in Pakistan, it
would be useful to analyse the influences of both intrinsic and extrinsic factors, since intrinsic
factors reduce job dissatisfaction and extrinsic factors enhance job satisfaction. Therefore, by
evaluating the perception of employees towards these factors would help to know the attitude
and behaviour of the employees towards certain predictors of job satisfaction and if any of
these are not statistically associated with job satisfaction, then recommendations could be
made to human resource practitioners of the manufacturing industry of Pakistan.
It is observed from the literature that previous studies have been conducted in the developed
Western countries, and few have been conducted in the developing countries. Moreover, these
studies were limited to specific industries only. By taking into consideration, the
organisational features one can identify the job satisfaction of employees as it has direct
impact on the success of an organisation. Hence, it was appropriate to use combination of
theories.
2.7 Public versus Private Sectors
The public sector is comprised of organisations which are run by government whereas the
private sector composed of entities privately run by private owners. Mohammed & Kolachi
(2013) explained that the public sector is the main hub for the prosperity of any economy and
nation. In such situation, it should be the primary intention of the public sector practitioners to
manage the things in an appropriate way, and this could be achievable when the managers of
an organisation are themselves satisfied. This could be seen in the form of performance of an
organisation. Most of the studies based on the behaviour of people have reported that job
satisfaction of the workers is very important for the enhancement of the productivity of an
organisation. Since job satisfaction has beneficial outcomes, almost every organisation
focuses on the development of the HR because the performance of the public sector

45
organisations is considered to be poor by corruption and poverty rate, financial calamity,
instability in the government policies (Memon, 2007).
Recent researches prevail that the job satisfaction of employees varies across different sectors
of the economy (Durst & DeSantis 1997; Jung et al. 2007). This shows that there are certain
factors associated with job satisfaction which influence employees differently in both public
and private sectors. According to Kumari and Pandey (2011 the topic of public sector versus
private sector is more like a debate which does not have any end and the reason behind this is
that both these sectors provide scopes in different ways. With the help of literature, the
researcher now discusses the findings of various researchers about the differences in the
public and private sectors. For example Ashraf et al. (2013) stated that the public sector of
Pakistan is more attractive and provide services to the community. This means that the
employees working in government companies work under the public eye and have to serve
the public. A study conducted by Nasir (2001) on the earnings of public and private sector
workers revealed that public sector employees earn more compared to the private sector
workers in Pakistan. As a result, there are much higher satisfaction levels of job satisfaction
for the public sector employees of Pakistan than the private sector. Similarly, results of Tai
and Chuang (2014) also concluded that public sector employees show higher job satisfaction
levels at work as compared to private sector employees.
Different researcher’s results showed that the pay level of employees is an important factor in
both the public and private sectors (Ayub, 2010). A study conducted by Kumari and Pandey
(2011) revealed that during the recession period, the government sector expanded the pay
scheme and added 110,000 jobs while the private sector reduced the jobs by 6.9 million; but
still the satisfaction phenomenon is considered in both sectors.
The main issue occurs when it comes to comparison of job satisfaction in both the public and
private sectors. Various studies have depicted different results, and so it is hard to conclude
which sector has a higher level of job satisfaction. Moreover, there are researches which show
that the public sector employees have low levels of job satisfaction, while others even
revealed that there is no difference in the job satisfaction levels among the public and private
sector employees as suggested by Hussain (2012). Other researchers have stated that the
satisfaction levels depend on the factors which help the employees to show positive attitudes
46
towards their jobs which varies from sector to sector (Yang & Wang, 2013; Rast & Tourani,
2012).
For example Hussain, (2012) explained the satisfaction in publicly owned banks and stated
that the employees in the public sector feel more job secured than the private sector which
leads to increased job satisfaction among the public sector. The same view has been explained
by Khalid and Irshad (2010). The uncertainty in the results is mainly due to the application of
the intrinsic and extrinsic factors in an organisation as cited by Błoński and Jefmański (2013).
This shows that the variance in the job satisfaction levels is more likely influenced by internal
and external factors. The research conducted by Rainey and Bozeman (2000) revealed that
public sector employees are affected by internal factors as compared to external factors
whereas the opposite is observed in the private sector. The main reason of these influential
factors is due to the bureaucratic nature of operations in the sector.
2.8 Manufacturing Industry and Job Satisfaction
The manufacturing industry has played a paramount role in the 21st century and is considered
to be an important source of income for any country. The primary target-location of this
project is the city of Lahore situated in Pakistan. This city is selected due to the ease of
access, sub cultural mix, larger population size which are all comparatively higher than
Islamabad which is the capital of Pakistan and its representativeness. Lahore is the capital of
the Punjab province and is well known around the world. The unique features of Lahore
include its leading role in different industries (banking, education, steel, commerce, iron and
agricultural products). The hub of transportation is in Lahore, which links it to other main
cities of Pakistan (Kron, 2016).
Further, it is revealed that most of the studies have been conducted in the Western context as
stated by Yang and Wang (2013). As a developing country with unstable economic
industrialisation, different sectors of Pakistan have faced considerable losses in recent years
suffering from economic loss. Lack of resources and non-satisfactory performances of the
workforce are the two leading provocateurs of such losses. Hence, the existing literature
review analyses the factors which can decrease the job dissatisfaction.
47
Taking into consideration the study related example of Pakistan, it is observed that it is one of
the major contributors towards the economic growth of a country (Shah, 2011). According to
Pakistan Survey Report (2014-2015) the manufacturing industry of Pakistan is said to
comprise of 65.4% share in the total industrial sector. And it comprises of three sub sectors
i.e. large scale manufacturing (LSM), small scale manufacturing (SSM) and slaughtering
where LSM shares are 80%, SSM shares 13% and slaughtering shares 7%.
Due to globalisation and international competitiveness, the manufacturing industry declined
last year in the growth of all sub sectors. Large scale manufacturing declined from 3.99 to
2.38; small scale manufacturing declined from 8.29 to 8.24 and slaughtering declined from
3.40 to 3.32. According to Memon and Tahir (2012) the investment in public and private
sectors are held responsible for enhancing the productivity in the country of Pakistan. The
previous report of (2009-2010) showed that the growth rate of the manufacturing industry had
declined from 22 per cent to 16.2 per cent. This shows that every year the performance of the
manufacturing industry is declining.
According to Raza et al. (2015) it is suggested that organisations performing at international
levels need to focus on their employees. This shows that when employees are satisfied with
their jobs, they perform well which in return has a direct impact on the performance of an
organisation and its growth rate. The research conducted by Rukh et al. (2015) mentioned that
few of the studies have been carried out in large industries as most of the research areas are
based on education, banks and medical institutions. From the above statistics it is observed
that much of the attention is required in the manufacturing industry of Pakistan so that it can
retain its performance and gain the competitive advantage. This research, therefore, analyses
the factors which can boost the job satisfaction levels of employees so that they can perform
well as it proportional to the revenue generation of the country. According to Commonwealth
Network (2016) the manufacturing industry of Pakistan has been severely affected since
2008. The main issues associated with the performance of the manufacturing industry are due
to less demand of the products as the international market is suffering from economic crisis.
Moreover, the investment in the manufacturing industry has decreased by 11% in 2011
(Memon and Tahir, 2012) as compared to the United Kingdom whose growth has risen to
15% in 2014 (Rhodes, 2015). The manufacturing industry is composed of various sub sectors
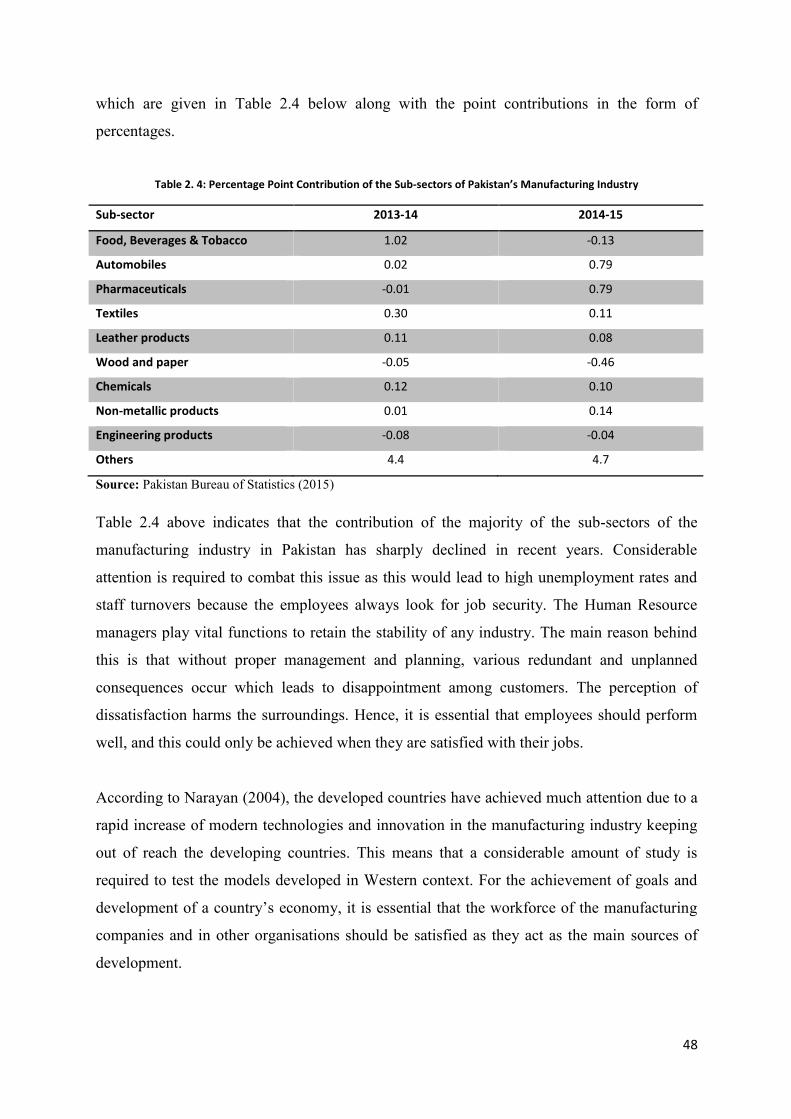
48
which are given in Table 2.4 below along with the point contributions in the form of
percentages.
Table 2. 4: Percentage Point Contribution of the Sub-sectors of Pakistan’s Manufacturing Industry
Sub-sector 2013-14 2014-15
Food, Beverages & Tobacco 1.02 -0.13
Automobiles 0.02 0.79
Pharmaceuticals -0.01 0.79
Textiles 0.30 0.11
Leather products 0.11 0.08
Wood and paper -0.05 -0.46
Chemicals 0.12 0.10
Non-metallic products 0.01 0.14
Engineering products -0.08 -0.04
Others 4.4 4.7
Source: Pakistan Bureau of Statistics (2015)
Table 2.4 above indicates that the contribution of the majority of the sub-sectors of the
manufacturing industry in Pakistan has sharply declined in recent years. Considerable
attention is required to combat this issue as this would lead to high unemployment rates and
staff turnovers because the employees always look for job security. The Human Resource
managers play vital functions to retain the stability of any industry. The main reason behind
this is that without proper management and planning, various redundant and unplanned
consequences occur which leads to disappointment among customers. The perception of
dissatisfaction harms the surroundings. Hence, it is essential that employees should perform
well, and this could only be achieved when they are satisfied with their jobs.
According to Narayan (2004), the developed countries have achieved much attention due to a
rapid increase of modern technologies and innovation in the manufacturing industry keeping
out of reach the developing countries. This means that a considerable amount of study is
required to test the models developed in Western context. For the achievement of goals and
development of a country’s economy, it is essential that the workforce of the manufacturing
companies and in other organisations should be satisfied as they act as the main sources of
development.
49
The productivity of the manufacturing industry does not only depend on the accomplishment
of the objectives but also on inputs and outputs. Gajic et al. (2014) reviewed employee job
satisfaction as an essential tool for the progress of an organisation and human resource
management. The majority of the industrial sectors evaluate the satisfaction levels of their
employees with the help of the survey technique as dissatisfaction leads to high rates of
absenteeism from the workplace which could be either high staff turnover, sickness or other
factors.
The study of Ravichandran et al. (2015) was conducted on the manufacturing industry of
India in which they declared there are three major factors (working conditions, promotion and
work environment) that has a direct impact on the job satisfaction of employees. Among
them, promotion was recorded to influence more than the other two factors. For this purpose,
they used simple random sampling techniques and survey questionnaire forms to analyse the
perception of manufacturing industry employees.
From the above literature, it has been seen that Pakistan is so much dependent on the
manufacturing industry due to its high shares as compared to other industries. However, due
to less resources and negligence of the management system, this industry always faces losses.
The main cause is that the industry suffers from high staff turnovers. To overcome this issue
the management should function properly i.e. it should satisfy their employees to yield better
output and many researchers have verified that there are various factors which the human
resource practitioners should consider to enhance the performance of their employees and to
retain their positions in the business. In this thesis, the researcher takes into consideration the
comparison between the public and private manufacturing companies and to evaluate the
impact of intrinsic and extrinsic factors on job satisfaction of employees within the
organisation.
2.9 Research Gap
Previous studies revealed that in both the sectors of public or private enterprises, the job
satisfaction phenomenon is quite common, and there are various factors which induce
employees to show positive attitudes and behaviour patterns towards their jobs. However, the
topic of job satisfaction in both the public and private sectors is more likely to be subject to
50
debate as suggested by Kumari and Pandey (2011). This is due to the variances in the findings
of different authors which contradict with each other and have argued that there was a need
for further investigation of factors which could enhance the job satisfaction levels in the
organisation (Yang & Wang, 2013; Ayub, 2010; Bright, 2008).
With the help of literature review on determinants of job satisfaction (see section 2.5), the
researcher is able to find out the gap in knowledge in the subject area and is motivated to
explore further the factors which play major roles in the job satisfaction of employees within
the organisation like the manufacturing industries of Lahore-Pakistan and to find out the
differences in the job satisfaction levels among the public and private sector employees in the
country.
Considering the gap in the literature, this thesis investigates the influence of intrinsic and
extrinsic factors on job satisfaction levels in different sectors of manufacturing companies in
Lahore-Pakistan. Furthermore, this study checks if there exists a significant difference among
public and private sector employees with respect motivational factors and job satisfaction.
This project will be unique in nature as previous studies were carried out in the developed
Western World context, and have been done in particular industries (banks, universities,
information technology and medical institutions) ignoring the representative phenomenon of
the manufacturing industries of Pakistan as posited in the literature (Rukh et al., 2015).
The large organisations like the manufacturing industry of Pakistan which shares most of its
shares declined since 2008 due to high competition in the international markets as a result of
which the industry is facing high staff turnovers. Memon and Tahir (2012) stated that the
manufacturing industry faced various issues like poor quality of products, low growth of
investments along with output and exports. This shows much of the attention is required to
sustain the effective running of this industry and this can only be achieved when the
employees are satisfied with their jobs, because happy employees help to achieve the
organisational goals on time. Keeping into consideration the current position of the
manufacturing industry of Pakistan, it is revealed that its employees are not satisfied as a
result of which they do not perform well. This has a direct impact on the output of these
industries. Previous studies have prevailed that numerous factors are associated to enhance
the satisfaction level of employees.
51
Hence, with the help of the random technique method, the researcher identifies and selects
various public and private manufacturing companies in Pakistan and analyses their various
and respective job satisfaction levels. In addition to this, very little evidence has been
provided in the context of Pakistan’s public and privates manufacturing sectors in Lahore,
which is the heart of Pakistan and no key research is conducted in this way. Considering all of
the above-mentioned shreds of evidences, this research investigates and provides more
authentic findings which will constitute an addition of new knowledge to this subject area of
studies and provide a gateway for future studies.
2.10 Conclusion
Literature depicts that public versus private sector comparison is a debate topic (Kumari &
Pandey, 2011). Various studies depicts that numerous factors have been studied which helps
in enhancing the job satisfaction level. However, the results of these studies often contradict
to each other (Yang & Wang, 2013).
In this study, the researcher compares and contrasts the influence of intrinsic and extrinsic
factors of job satisfaction among public and private sector employees of manufacturing
companies. For this purpose, the researcher selects random manufacturing companies for
further discussion (see chapter 4). Moreover, the above-mentioned literature reveals that job
satisfaction is the most researched topic in the area of management in which “about 3,350 and
articles and dissertations had been written” as cited by Hussain (2012, p. 1916). Furthermore,
the researcher has identified the importance of job satisfaction within the organisation. In the
light of the literature, different approaches and theories are considered. From the two major
approaches of job satisfaction (classical management approach and neoclassic approach), it is
revealed that neoclassic approach of job satisfaction is the most useful one, for it considers
the needs of the workers as cited by Celik (2011). Different theories of job satisfaction are
critically evaluated and among them, content theories were selected as it is based on the
investigations of job satisfaction factors.
This study is motivated by the study conducted by Khalid et al. (2012) among public and
private sector universities. However, their study was based on the education sector only. In
any organisation, extrinsic factors play an important role as they have a direct impact on the
52
job satisfaction levels of employees and could lead to job dissatisfaction if absent as stated by
Alshitri (2013). Similarly, intrinsic factors are held responsible to motivate the employees
thereby, increasing their job satisfaction levels.
It is vitally important, therefore, for the researcher to check the job satisfaction levels of
employees within the organisation by evaluating the perception of employees towards certain
factors of job satisfaction. It is observed that numerous studies have suggested either the
positive or negative relationships of job satisfaction with certain determinants as mentioned in
(section 2.5). However, the main theme of this research is to find out the job satisfaction
levels of public and private sector employees of manufacturing companies.
From the findings of the job satisfaction theories and the empirical evidence, it is revealed
that tremendous suggestions are recommended as to how much and when the satisfaction
arises by using the different factors of job satisfaction as discussed earlier in section 2.3. It is
revealed from the above-mentioned literature that various techniques have been implemented
to analyse the perception of employees towards their jobs and the most appropriate technique
adopted by the researchers is the questionnaire. Different public and private companies were
selected for this purpose based on the ownership of the companies; the researcher was able to
explore the relationship between job satisfaction and certain independent factors.
53
Chapter Three: Conceptual Framework and Research Hypotheses
3.1 Introduction
This research aims to analyse the predictors of job attitudes of workers in order to develop the
job satisfaction levels of the employees in the manufacturing industrial sector of Pakistan. For
the development of conceptual framework, the researcher has taken into consideration
different theories on job satisfaction and evidences from previous empirical research as
mentioned in the review of the literature in chapter two of this thesis. In addition, this chapter
also aims at developing the hypotheses guiding the thesis by evaluating various theories on
job satisfaction and come up with a conclusion. This conclusion is based on these theories
which play major roles in predicting job satisfaction within the organisation. Also, the
researcher will present a job satisfaction model using a theoretical framework which critically
analyses the major indicators of job satisfaction in the public and private sectors of the
manufacturing industry in Lahore-Pakistan.
3.2 Research Framework
Job satisfaction is regarded as a tool of an employee satisfaction (Saeed & Farooqi, 2013).
This shows that the overall perception one holds about his or her work examines the level of
job satisfaction as mentioned by (Halepota, 2011).
In the view of Oshagbemi (2003), organisations mainly focus on the job satisfaction of their
employees as employee satisfaction is directly related to the productivity of an organisation
(Böckerman & Ilmakunnas, 2012). Moreover, by keeping the record of inputs (working
hours, task effort and education) and outputs (salary, promotion and career opportunities, co-
workers relation, work environment and task significance) helps to measure employee job
satisfaction. The balance between these leads to higher levels of job satisfaction (Sousa-Poza
& Sousa-Poza, 2000).
Job satisfaction plays a major role in the organisational commitment, which means that when
workers are satisfied with their jobs they will be more satisfied with their lifestyles, and then
they will be more committed to their work patterns with the seriousness that it deserves. This
will engender fewer chances of employees leaving the job.

54
As mentioned by Tella et al. (2007, p.5) “Lack of job satisfaction is a predictor of quitting a
job”. This shows that decrease in employee job satisfaction will force workers to shift from
the private sector to the public sector. There are various reasons for quitting a job and moving
to another workplace. In the developing countries, this process is very common. The main
reason is that when management does not meet the expectations or needs and wants of the
workers, they will always look for better facilities. Different theories of job satisfaction as
mentioned in chapter two help management of public and private organisations to consider
various factors which can lead to employee satisfaction. The most common theory of job
satisfaction is Maslow’s theory of hierarchical needs. Although, the negative point of this
theory is that it represents unclear concepts and do not examine the individual’s attitude to
work, it is also more culturally based (Buchanan & Huczynski, 2004).
On the other hand, the Hackman and Oldham theory of job satisfaction also has a critique that
it does not consider organisational factors Brass (1981). Similarly, other approaches also
show controversies by different researchers. This research is based on content theories to
evaluate the job satisfaction of the public and private sectors of the manufacturing industry in
Pakistan.
Extrinsic factors (salaries, co-workers, job security, supervision, task significance and work
environment) all have a direct influences on the job satisfaction levels of the employees,
which means that when hygiene factors are unpleasant or missing in the organisation, then
this would lead to job dissatisfaction (Adenike, 2011). On the other hand, intrinsic factors
(promotion, achievement, work itself, recognition and responsibility) also play important
roles in job satisfaction. Thus, this research analyses the relationship between both intrinsic
and extrinsic factors and job satisfaction. Further, it examines the influence of the working
conditions as well for the development of organisational factors at the workplace in
developing countries. The central perspective of evaluating the relationship between the
intrinsic and extrinsic factors and job satisfaction was conducted on the public and private
manufacturing companies of Lahore-Pakistan. Figure 3.1 given below represents the
relationship between intrinsic and extrinsic factors and job satisfaction where the public and
private sectors are controlled variables of this study.
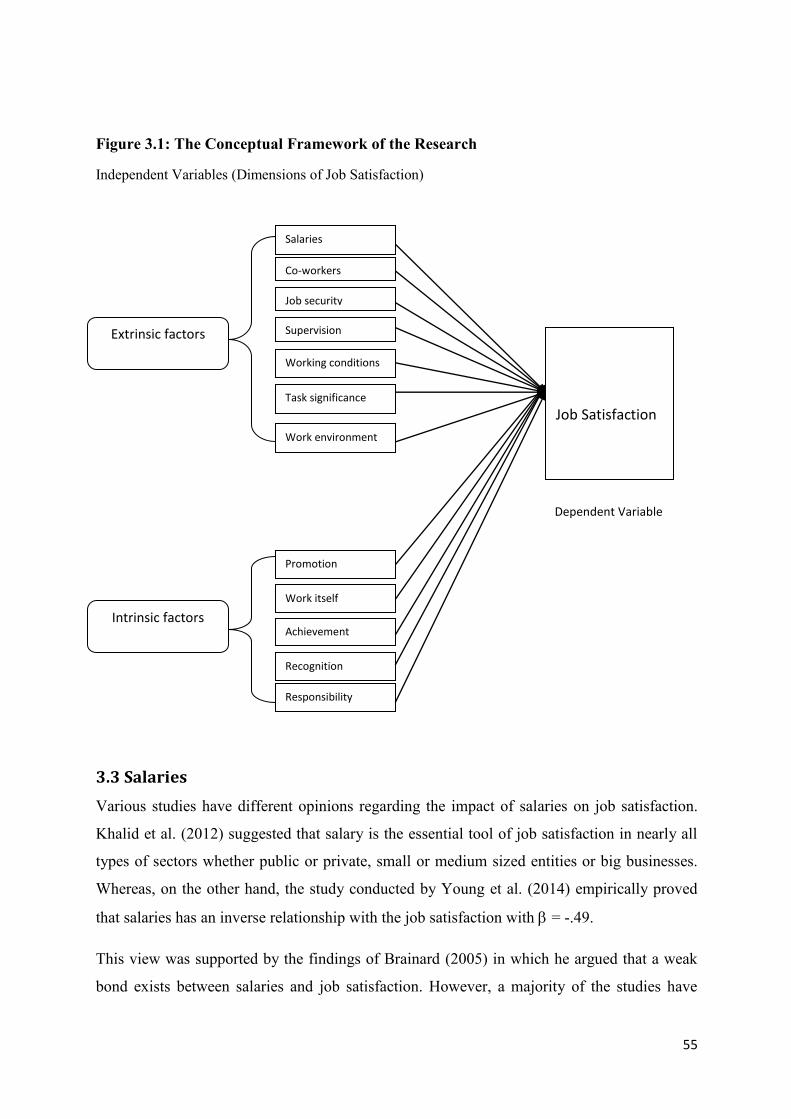
55
Figure 3.1: The Conceptual Framework of the Research
Independent Variables (Dimensions of Job Satisfaction)
Dependent Variable
3.3 Salaries
Various studies have different opinions regarding the impact of salaries on job satisfaction.
Khalid et al. (2012) suggested that salary is the essential tool of job satisfaction in nearly all
types of sectors whether public or private, small or medium sized entities or big businesses.
Whereas, on the other hand, the study conducted by Young et al. (2014) empirically proved
that salaries has an inverse relationship with the job satisfaction with = -.49.
This view was supported by the findings of Brainard (2005) in which he argued that a weak
bond exists between salaries and job satisfaction. However, a majority of the studies have
Promotion
Salaries
Co-workers
Job security
Supervision
Working conditions
Extrinsic factors
Intrinsic factors
Task significance
Work environment
Work itself
Achievement
Recognition
Responsibility
Job Satisfaction
56
proved that a positive relationship exists between salaries and job satisfaction among
employees in the work places as mentioned by and Tourani (2012). Moreover, Grace and
Khalsa (2003) stated that salary is considered to be an important indicator of job satisfaction.
This shows that when there is an increase in salary, the level job satisfaction also arises.
Therefore, the researcher will use this factor to check the overall job satisfaction level in the
public and private sectors of the manufacturing industry in Pakistan.
Theories mentioned above have been progressed much into the world of job satisfaction.
Macdonald and McIntyre (1997) suggested that job satisfaction is more likely to be
influenced by employees’ salaries and financial benefits. This demonstrates that job
satisfaction has a significant impact in both theoretical and practical realities of the
employment world. Where there is less job satisfaction companies tend to experience very
high staff turnovers and this leads to low productivity within the organisation. Usually, the
marketing companies have high turnovers and their employees become less satisfied if they
do not get the desired wages and commissions. Organisations should, therefore, pay
competitive salaries so that employees work harder and be rewarded with high salaries
because of their good performances.
Banjoko (2006) stated that competitive salaries have a direct link with an employee job
satisfaction. This shows that organisations which do not offer competitive salaries to their
employees face high staff turnovers and absenteeism. A report of by the United Kingdom
Retail Store ASDA (2007) reveals that salaries influence job satisfaction of employees.
According to this report ASDA (2007), 60.33 per cent of the employees who work for ASDA
are highly satisfied with their salaries, 25.62 per cent are satisfied, 6.61 62 per cent are neither
satisfied nor dissatisfied with the amount of pay, and the least percentage recorded for
dissatisfaction was 5.79 62 per cent. Only 1.65 62 per cent are recorded for a highly
dissatisfied employees with their salaries. Employees with high salaries showed higher
satisfaction levels and employees with less salaries showed less job satisfaction rates.
The concept of job satisfaction was explored by ASDA in 2007 when there were increases in
the salaries of their employees. The company induced the feedback rotation policy so that
they could find out job attitudes of their employees. The above-mentioned literature,
therefore, depicts that employee job satisfaction levels go higher when salaries increase.
Hence, the proposed hypothesis (Hypothesis 1) is as follows:
57
H1: “Employees with higher salaries have greater job satisfaction levels within an
organisation”.
3.4 Co-workers
Different researchers conducted various researches on job satisfaction and found out that
various factors are associated with job satisfaction which could reduce the high staff turnover
rates and help and encourage high productivity of an organisation. Among organisational
features, one of the most visible examples that promote job satisfaction is the relationship
between the co-workers within the organisation. It is essential for the workers to cooperate
with each other at the workplace as a friendly relationship with the colleagues assists to create
an encouraging atmosphere which results in an increase in job satisfaction (Durst & DeSantis,
1996; Ting, 1997; Volkwein & Zhou, 2003). This also shows that when workers cooperate
with one another, the outcome is usually a healthy environment where employees possess
better attitudes towards the job. In Pakistan, for example, co-workers tend to work close to
each other to make the job more satisfying for them. This may go the other way round as
well. Moreover, when employees work as a team, there are more chances of enhancement in
work performances due to job satisfaction as stated by Abugre (2012); that good interactions
between managers and workers result in positive outcomes. This shows that co-workers’
relationships, which increases job satisfaction at the workplace, is important as it has a direct
impact on the organisation’s output and performances.
On the other hand, Harmer and Findlay (2005) argued that only 6.7 per cent of the variances
in job satisfaction are due to co-workers cooperation and effective supervision, and the
significance level was recorded to be greater than 0.05. This shows that co-workers
cooperation and effective supervision do not possess a significant relationship with the job
satisfaction. However, a majority of the studies contradict with these findings as a study
conducted by Eder and Eisenberg (2008) revealed that co-workers are more likely to leave the
job if they found that their relationships are violated. It is crucial, therefore, for the
management to understand the ways by which they could make their staff to be loyal to them
and to find out ways by which they could stop their workers from quitting their jobs. Hence,
the proposed hypothesis (Hypothesis 2) is as follows:
58
H2: “Employees having good relationships with their co-workers possess greater job
satisfaction levels within an organisation”.
3.5 Job Security
Organisational commitment among workers in the organisation can be achieved through job
security. This means that employees with secure and permanent jobs should be more satisfied
than temporary or contractual job holders in light of the relationship between job security and
job satisfaction in different sectors that is the public and private sectors. The study of Khalid
and Irshad (2010) revealed the differences between the perceptions of different sector workers
and suggested that public sector workers are more satisfied with job security as compared to
their counterparts in the private sector organisations. So does that mean job satisfaction can
only be achieved in the public sector? The answer is not that as simple as it looks like as the
job security has widened its arms towards the satisfaction of workers in the organisation.
Iverson (1996) claimed that job security has an influential impact on organisational
commitment within the organisation. This means that with a change in job security, the
organisational commitment would also change. Similar results have been showed by Morris
et al. (1993) where he goes out in favour of the view mentioned above along with the positive
relationship of job security with job satisfaction.
From the literature, it is clearly shown that job satisfaction increases with the increase in job
security. Now the point is if that, must employees working with permanent contracts always
be highly satisfied? However, when it comes to the public and private sectors, the results are
observed differently. For example, a study conducted by Hassan et al. (2011) revealed that
job security is one of the major dimensions of job satisfaction in the private sector. Hence,
this study examines the influences of job security on job satisfaction in both the public and
private manufacturing companies of Lahore in Pakistan. Furthermore, job security is
accounted to have a direct relationship with job satisfaction which means, if the job is secured
then satisfaction can be seen by the employees, and more amount of sound output can be
achieved if they are psychologically settled. Similar is the case where security and guarantee
are paramount for salaries and promotions. This ultimately suggests that any employee either
in the public or private sector, if given the confirmation of job security could help him in his
own satisfaction of his current employment. If the employees are satisfied, then the employer
could also make the most use of them because ‘Protect and make the most out of the training
59
budget–focus resources on key areas such as improving line management capability and
customer service’ (ACAS, 2010, p.4). From the above literature, it is revealed that revenues
can be generated in both sectors by giving the jobs on a permanent basis. Taking into
consideration the impact of job security on job satisfaction the proposed hypothesis
(Hypothesis 3) is proposed as follows:
H3: “Employees with high job security at the workplace enjoy higher job satisfaction levels
within an organisation”.
3.6 Supervision
Adebayo and Ogansina (2011) stated that a significant relationship exists between
supervisory behaviour and job satisfaction. This shows that supervision is directly
proportional to employee job satisfaction. Similarly, Adebayo and Ogansina (2011)
mentioned in their study that, supervision is not only based on human relations, but it also
deals with different skills and how the workers coordinate with each other on various work
tasks and the involvement of technical knowledge.
In the view of Eseka (2009) states that the supervisor’s primary duty is to adopt the
supervisory techniques as this would lead to the success of an organisation. It has been
revealed from the previous literature that supervision behaviour acts as a catalyst for the
productivity and the success of an organisation. This supervisory action also helps to
recognise the leadership skills of a supervisor which helps the firm to evaluate the skills of a
supervisor (Osibanjo et al. 2015). Focusing on the role of supervisors, Chen et al. (2002)
mentioned that some scientists consider the supervisors’ characters as same as managers. This
shows that supervisory behaviour plays a significant role in the organisational success of the
organisation. Moreover, it has been seen in the literature that the performances of the workers
are directly linked to the ways they are supervised (Mohammad & Akhter, 2010; Adebayo &
Ogansina, 2011).
Alshitri (2013) stated that there some characteristic features of supervisors that play
significant roles in the job satisfaction levels of their workers. Alshitri (2013) further stated
that the supervisors should have friendly relationships with the workforce and appreciate the
work of their employees. Thirdly, supervisors should give equal opportunities to their staff to
60
participate in the decision-making processes and should show interest by listening to their
opinion as this has a direct influence on the increase in employee job satisfaction levels
within the organisation (Alshitri, 2013).
McCroskey (2006) argued that job satisfaction does not only depend on the employees’
performances; but it also depends on the employees’ attitudes towards their supervisors
meaning that there should be a balance between employees and supervisors’ understanding;
because if they do not respect the opinions of each other, then this would lead to failure of the
organisation as both of them would be dissatisfied. It is essential, therefore, that the
workforce should be job satisfied as their perceptions are directly linked to the productivity of
the organisation.
The literature discussed above shows that the relationship between supervisors is positively
associated with an employee job satisfaction. This means that job satisfaction is dependent
upon the supervisor’s attitude towards employees and they should have better understanding
between each other as they are responsible for the success of an organisation. The proposed
hypothesis, therefore (Hypothesis 4) is as follows:
H4: “Employees with higher supervision within an organisation enjoy greater job satisfaction
levels with their work”.
3.7 Working Conditions
The concept of working conditions is crucial in any organisation. This is due to the fact that
working conditions are regarded as one of the essential tools of increasing job satisfaction of
their employees (Jain & Kaur, 2014). The working conditions of employees could be either
comfortable or hazardous for the workers. It is essential, therefore, for organisations to
provide best conditions to their employees as it is directly proportional to the satisfaction
levels of employees.
A study conducted by Bakotić and Babić (2013) stated that, their working conditions were
influenced by various factors namely: external factors, subjective factors and organisational
factors, where external factors mainly dealt with temperature, radiation, smoke, dust, gases,
humidity and other injurious variables. On the other hand, the subjective factors dealt with
61
demographic features (age, gender, education and representativeness). And the variables
related to the organisation include working hours, salaries and so on. This shows that working
conditions are constituents of the numerous factors which the management should take into
consideration.
Raziq and Maulabakhsh (2015) explained that organisations are now-a- days facing financial
pressures because of competition in the business as a result of which every single company
works hard to gain competitive advantage. It is crucial, therefore, for the business leaders to
satisfy their employees by giving them better working conditions as this would enhance the
businesses and low staff turnovers could be achieved within the organisation. Previous studies
revealed that supervision is positively related to job satisfaction (Gawel, 1997; Javed et al.
2014). Organisations should focus on the enhancement of the working conditions to increase
the performances of the workforce as this result in high productivity levels of the organisation
(Atambo et al. 2012). Taking this statement into consideration, it can be seen that the working
environment has an influential impact on the overall job satisfaction levels of employees. The
managers should understand the needs and wants of their employees as every employee has a
different satisfaction level based on working conditions they are being provided. In that case,
all three working environmental factors as mentioned above should be considered. For
example, organisations where multi-cultured people are employed possess different features
of job satisfaction levels depending on the environment in which they work.
However, the most characteristic feature of working conditions within the organisation
depends on how well the environment around them is provided; that is whether it is healthy or
poor. This view was supported by Markey et al. (2012) in which they focussed on the quality
of the workplace and explained that it is identified by less pressure of work, promotional
opportunities and appreciation by the managers on a good performance that is achieving goals
on time. Moreover, results of empirical studies have also revealed that working conditions are
one of the main indicators of job satisfaction (Siu, 2002). The results of most studies as
mentioned in the above literature indicated that working conditions are positively related to
job satisfaction. Hence, the formulated hypothesis (Hypothesis 5) is given below:
H5: “Employees provided with higher standards of working conditions have greater job
satisfaction levels within an organisation”.
62
3.8 Task Significance and Work Environment
In the present era, different organisations face pressure from foreign businesses due to rapid
increases in competition globally. To maintain effective running of organisations,
management needs to make sure that employees are satisfied with their jobs. Morgeson and
Humphrey (2006) stated that by cultivating the idea of task significance, employees can
perform their tasks better at work. This shows that task significance has a direct influence on
the perception of the employees as they show more concern with the outcome of their work
which could benefit both the organisation as well as society. Research conducted by
Halepota’s (2011) findings revealed that task significance does not have a direct influence on
employee’s job satisfaction mainly in health care institutions.
In the view of Grant (2008), little research has been conducted on the relationship between
task significance and job performance. Hence, by analysing the relationship between task
significance and job satisfaction, the human resource management can analyse the
performances of the employees as satisfied employees perform well as suggested by Sousa-
Poza and Sousa-Poza (2000). Previous studies have shown positive impacts of task
significance on job satisfaction.
Another important predictor of job satisfaction is work environment. Raziq and Maulabakhsh
(2015) state that Human Resource practitioners need to introduce healthy work environment
as this is helps to maximize the job satisfaction levels of employees. Taking into
consideration the needs and wants of the customer, managers need to focus on the satisfaction
levels of their employees because satisfied employees help to achieve the goals of the
organisation on time. Similarly, Jain and Kaur (2014) mentioned that when workers are happy
with their working environments they perform well leading to the growth and development of
their respective firms.
The proposed hypothesis (Hypothesis 6), therefore, is as follows:
H6: “Employees provided with significant tasks and good work environment have greater job
satisfaction levels within an organisation”.
63
3.9 Intrinsic Factors and Job Satisfaction
Based on Hertzberg’s two factor theory, there are certain factors which act internally to an
organisation mainly promotion, achievement, recognition, work itself and responsibility.
Ayub (2010) stated that promotion and career opportunities increase the job satisfaction
levels of employees within the organisation. This means that most of the employees perceive
promotion as a motivator and is often regarded as one of the most influential and powerful
tools for job satisfaction (Hackman & Oldham, 1975). Shaikh et al. (2012) concluded that job
satisfaction and promotion have strong correlations between them. This shows that when
employees are granted with promotional opportunities, they will ultimately be satisfied with
their work whereas an absence of this would lead to dissatisfaction. This view was supported
by various authors (Durst & DeSantis, 1996; Park & Kim, 2009; Sell & Cleal, 2011) in which
they stated that a positive relationship exists between promotional opportunities and job
satisfaction. Moreover, promotion gives an opportunity to the worker to be responsible and to
enhance the status in the society (Robbins, 1998; Heery & Noon, 2001).
On the other hand, Malik et al’s. (2012) findings contradict with the above mentioned
theories. They argued that promotion had less impact on the job satisfaction levels of
employees in comparison to pay, and failed to show significant relationships between
promotion and job satisfaction. This shows that promotion does effect the job satisfaction of
employees more than the increased pay scale. However, most of the studies as mentioned in
the above literature have revealed that significant positive relationships occur between
promotion and job satisfaction, irrespective of the most influential indicator. Other important
intrinsic factors such as recognition, work itself and achievement also positively impact on
job satisfaction levels within the organisation (Benrazavi and Silong, 2013).
This study was further supported by Hoque et al. (2016) in which they stated that a major
motivator of job satisfaction is recognition. Another key motivator of job satisfaction is the
sense of responsibility. According to Aliakbari and Kafshgar (2013) job satisfaction and
responsibility possess a significant relationship. Hence, it can be said that intrinsic factors
mainly promotion; work itself, recognition, achievement and responsibility have positive
impacts on job satisfaction levels within the organisation. The proposed hypothesis, therefore,
(Hypothesis 7) is as follows:

64
H7: “Employees with higher intrinsic rewards (promotion, work itself, achievement,
recognition and responsibility) have greater job satisfaction levels within an organisation”.
3.10 Comparison of Job Satisfaction in Public and Private Sectors
Some past research suggests that job satisfaction directly depends on upon the health of the
working environment (Rossberg et al. 2004). Bhutto et al. (2012) conducted a study to
compare the employee perceptions of the organisational climate and job satisfaction at public,
private, and foreign banks operating in Pakistan. The relationship between these measures
was also analysed. Fourteen sub-factors of organisational culture were studied for
investigating the relationship between the two variables under study. Twelve branches of
banks in Karachi were included in this study. To collect the data, 90 executives were
surveyed in 4 branches each for the public sector (National Bank of Pakistan {NBP}), private
(Muslim Commercial Bank {MCB}), and foreign bank (Standard Chartered Bank {SCB}).
The data was collected through structured questionnaires, consisting of 42 questions. Multiple
regression analysis is used in reaching the findings of the study. Results of the survey show
that the employee perceptions of the organisational climate and job satisfaction are more
positive for the foreign bank as compared to the private and public banks of Karachi. The
employee perceptions for both the organisational climate and job satisfaction were found to
be least favourable for the public banks. Furthermore, three sub-factors of organisational
climate were found to positively impact the job satisfaction levels of employees at the banks
including organisational structure, identity and human relations; the two factors, equity and
empowerment were negatively related. A study conducted by Hussain (2012) in the public
and private banking sectors revealed that there does not exist a significant relationship
between the public and private bank employees. Previous studies have shown that a
significant difference exists between the public and private sectors (Bas et al. 2002; Khalid &
Irshad, 2010; Ayub, 2010; Khalid et al. 2012). Hence, it is demonstrated that job satisfaction
levels differ both in the public and private sectors of organisations in Pakistan. The following
hypothesis (Hypothesis 8), therefore, is proposed:
H8: “A significant difference exists between the public and private-sector employees with
respect to job satisfaction and extrinsic as well as intrinsic factors within an organisation”.
65
Chapter Four: Research Methodology
4.1 Introduction
This chapter discusses in detail the methodology adopted for this study. Firstly, it analyses the
relationship between job satisfaction and salaries, co-workers, job security, supervision,
working conditions, task significance, work environment, promotion, work itself,
achievement, recognition and responsibility in the public and private sectors of manufacturing
companies in Lahore-Pakistan. The research design for the thesis was encouraged by the
same research from Khalid et al. (2012). However, the nature of this study is dissimilar to the
previous work as a combination of manufacturing companies was taken into consideration
which makes it unique from other studies. Moreover, this type of research has not been
conducted in Lahore before. Hence, it will be useful to carry out research on multiple public
and private manufacturing companies to inspect the relationship between the dependent
variable (job satisfaction) and independent variables (salaries, co-workers, job security,
supervision, working conditions, task significance, work environment, promotion, work itself,
achievement, recognition and responsibility).
Additionally, this chapter is composed of different sections. The first section, considers the
significance of paradigms and the reason for the adoption of this research philosophy.
Secondly, the section provides the justification for the selected approach for the research. In
the other sections of this chapter, the study discusses the research strategy, research design,
sampling technique, the application of various instruments and the measurement scale. Before
conduction of final analysis, a pilot test was used. Further, this chapter will report on the
successful attempt of data collection along with ethical issues and the technique for
conducting the data and its analyses. And lastly, it will discuss the adoption of appropriate
methods used for the analysis of survey questionnaires.
4.2 Research Paradigms
Creswell (2009) suggested that there is a significant influence of research philosophy and
research paradigm on the research design and hence should be considered while
implementing the research methodology. The social scientists quite often use the paradigm
terminology in their subject besides the fact that it contains a lot of meanings (Saunders et al.
2009). Keeping in view the importance of paradigm, McGregor and Murnane (2010) reveal
66
paradigm as a vital tool in research because it provides the guidance for the researchers to
shape their works. This argument was supported by the authors Weaver and Olson (2006) in
which they revealed that “paradigms are a set of certain beliefs that are practised that help to
achieve an investigations procedure within the boundary” (Weaver and Olson 2006, p. 460).
Holden and Lynch (2004) also suggested that research paradigms are the philosophical
stances which help the researchers can carry out their studies. In the view of Johnson and
Christensen (2010), these philosophies possess some characteristic features mainly: values,
assumptions, practices and certain concepts and are hence different for each paradigm
(ontology and epistemology). It is vital, therefore, to consider the research paradigm as every
researcher has a different view and knowledge of the world. This results in a difference in the
findings and opinions of the researchers during the investigations procedure showing
variances in the nature of paradigms even if the same paradigm is applied for the same study
as suggested by Hatch and Cunliffe (2006).
This is useful as it gives researchers an equal opportunity to share their perceptions on
research paradigms as it will lead to the reduction in research biases as the researcher will be
able to represent and discuss it in detail (Flowers, 2009). As previously discussed in chapter
two of this thesis, it is observed that despite a lot of supporting literature on the job
satisfaction in different industries, various authors still argue that there is still the need to find
out the factors that play important roles in the satisfaction of employees.
Summarising the purpose of this study, one will find out that most of the study is conducted
on job satisfaction in the education and banking fields in Lahore-Pakistan. Less emphasis is
put on the performance of the manufacturing industry which has declined in Gross Domestic
Product in recent years and a lot of research is required to help the management of this sector.
Hence, this study opens the gate providing the evidence of job satisfaction of employees
taking into consideration various public and private sector manufacturing companies which
make the nature of the current study different from other studies.
However, keeping in mind the constraints of time it has not been possible to consider all the
determinants of job satisfaction. Nevertheless, it has been possible to study the impact of
certain hygiene and motivation factors on job satisfaction. This study, therefore, enhances the
understanding of the factors which could boost the job satisfaction of employees in different
(public and private) sectors of the manufacturing companies in Lahore, Pakistan. Hence,
67
studying the influential factors of job satisfaction will assist the management to evaluate the
job satisfaction factors in both the public and private sectors and will help fill in the
knowledge gap. Also, it will help the managers to identify the perception of the employees
towards the hygiene and motivation factors as it has focused on the ownership of the sectors.
Furthermore, future researchers could benefit from their respective studies and could
implement this study in big organisations.
In view of the above-mentioned literature, the researcher now applies an appropriate
paradigm based on the assumptions of each element of paradigm as previously discussed.
There are two main types of research paradigms; i.e. Ontology and Epistemology which will
be discussed as follows:
4.2.1 Ontology
Yin (2009) stated that an ontological paradigm deals with the study of the existing nature.
Similarly, other researchers defined ontology as “the branch of philosophy dealing with the
nature of reality and the truth” (Johnson & Christensen, 2010, p.32). This means that
researchers should consider the “way the world operates” and to what extent he or she should
embrace or hold them (Saunders et al. 2007, p. 108).
Kuhn (1970) stated in the book entitled “The Scientific Revolution” that there are two main
types of paradigms i.e. the ontological and epistemological paradigm that suggests the
researchers to visualise the universe and to understand the perception of the scientists about it.
Moreover, the ontological paradigm is composed of two main segments which are:
objectivism and subjectivism where the objectivism aspect of ontology positions itself in such
a way that it does not show its connection with the social actors and hence possess an
independent nature (Saunders et al. 2009). Contrary to this, subjective ontology concentrates
on the understanding of the insight of actors towards the phenomenon that is socially attached
with it (Yin, 2009).
In this study, the researcher has applied an objective ontology as objectivism deals with the
present situation and is not influenced by social actors as mentioned by Saunders et al.
(2007). This shows that objectivism acts independently and is not affected by certain
components like beliefs, views, feelings and perception of social actors. There are a certain
68
set of rules and regulations which the workers have to follow in the workplace. The first and
foremost rule is that of the human resource management (HRM) by which they have to
provide the details of a job that is being advertised for the recruitment. The job description is
given to the individuals so that they are prepared well ahead for the respective post and to
carry out their task under the rules of their organisation from the first day of their jobs. Also,
workers become much familiar with the work required from them with the passage of time.
The details of the work that are not provided to the workers at the initial stages include
strategy followed by the respective organisation, the anticipation of the producers, suppliers
and the consumers; in other words, the stakeholders and the recognition of the brand about its
rivals. For productive work, the employees should meet up with the expectations of
shareholders to attain competitive advantage and to apply that strategy which could result in
the success of an organisation. This shows that the procedure of businesses possess unique
and objective nature and are hence free. For example, they are not affected by the employee
and are right compared to ones who are with the firm and are already practicing the rules
along with the reviews that are considered important to describe the performance of an
employee. To evaluate the performance of an employee, the organisation in which the
employee works, uses benchmarking keeping in view their goals and objectives which were
examined during the review process. Focussing on the consequences of the negative reviews
Caspi et al. (1998) stated that during the review phase if the firm evaluates the performance of
an employee as negative then they are subject to face work stress, and tries to avoid losing the
job and the benefits associated with the better performance reward. To refrain from the
jobless phase, workers should know the uses of availing the opportunity in a firm and the
outcome of their performance. Therefore, it is vital that the management should take every
step to avoid stuff turn over during the assessment process of the performance of their
employees. As a result of which this study will presume that the matter under consideration
will be free from actors.
4.2.2 Epistemology
Epistemology is that type of paradigm which focuses on the procedure that can be carried out
to make the knowledge acceptable (Burrell & Morgan, 1982; Saunders et al. 2007).
Moreover, it examines the individual engagement or involvement along with analysing the
connection between the researcher and the matter during the research project as cited by
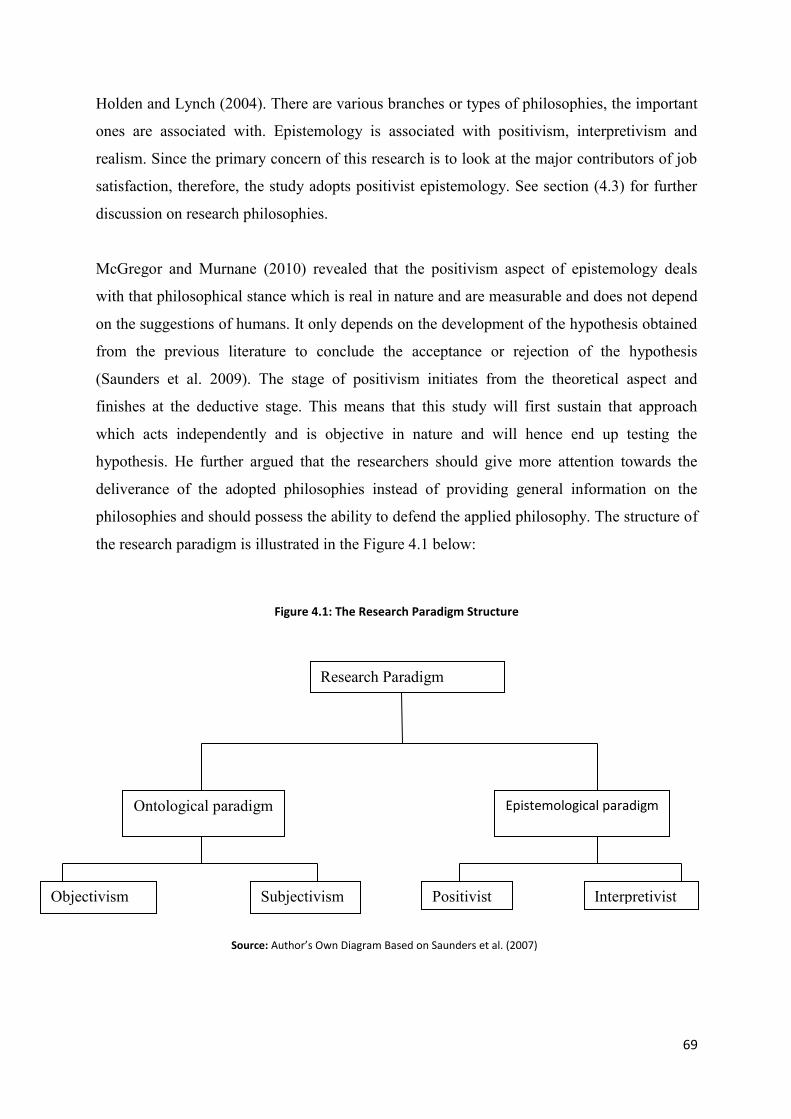
69
Holden and Lynch (2004). There are various branches or types of philosophies, the important
ones are associated with. Epistemology is associated with positivism, interpretivism and
realism. Since the primary concern of this research is to look at the major contributors of job
satisfaction, therefore, the study adopts positivist epistemology. See section (4.3) for further
discussion on research philosophies.
McGregor and Murnane (2010) revealed that the positivism aspect of epistemology deals
with that philosophical stance which is real in nature and are measurable and does not depend
on the suggestions of humans. It only depends on the development of the hypothesis obtained
from the previous literature to conclude the acceptance or rejection of the hypothesis
(Saunders et al. 2009). The stage of positivism initiates from the theoretical aspect and
finishes at the deductive stage. This means that this study will first sustain that approach
which acts independently and is objective in nature and will hence end up testing the
hypothesis. He further argued that the researchers should give more attention towards the
deliverance of the adopted philosophies instead of providing general information on the
philosophies and should possess the ability to defend the applied philosophy. The structure of
the research paradigm is illustrated in the Figure 4.1 below:
Figure 4.1: The Research Paradigm Structure
Source: Author’s Own Diagram Based on Saunders et al. (2007)
Research Paradigm
Ontological paradigm Epistemological paradigm
Objectivism Subjectivism Positivist Interpretivist
70
4.3 Research Philosophies
The research philosophy that has been derived with the help of the paradigms as mentioned
above will then lead to design the strategy for the research. The primary focus of the research
philosophy is to organise certain beliefs, perceptions, the context and the assumptions.
According to Neuman (2003), research philosophy plays a vital role in the conduction of the
research and developing the framework of a study (Saunders et al. 2009). Based on the
previous discussion on ontology and epistemology, four essential research philosophies that
are linked with them are discussed one by one. Saunders et al. (2009) suggested that there are
four main constituents of research philosophy which include Positivism, Realism,
Interpretivism and Pragmatism.
4.3.1 Positivism
The first type of research philosophy is positivism under which the researcher formulates the
hypothesis to test the objectives of the research (Saunders et al. 2012). The technique used for
collecting the data in the positivism philosophy is usually quantitative in nature and is highly
structured.
4.3.2 Realism
Another type of research philosophy is realism which focuses on enquiring the social factors
scientifically and in real life (Saunders et al. 2007). This strengthens the idea of the
philosophers that objects are not controlled by the humans and are naturally independent. The
fundamental aspect of realism is totally based on the senses meaning that what we see in real
life is the fact of reality. Realism is the subdivision of epistemology which shows similarity to
each other concerning the assumption that scientific approach is related to the development of
knowledge (Bryman, 2006). The researcher will not adopt this philosophy as it does not show
a parallel connection with the research objectives.
4.3.3 Interpretivism
The third segment of research philosophy is the interpretivism which aims to understand the
differences between humans as social actors (Saunders et al. 2009). This means that the
researchers should concentrate more on the humans study rather than the resources that are
made by the humans.
71
The interpretivism philosophy is a function of human perceptions about the world in which
they live and give their contribution with salient features to this world (Saunders et al. 2007).
Crucially it is interpreted that with the interpretivism philosophy, “the researcher has to focus
on the empathetic stance” (Saunders et al. 2009, p.116). This seems challenging as the
researchers have to consider their views in a particular context. The procedure for assembling
the data via this philosophy is appropriate for smaller samples. The researcher utilises an in-
depth interview technique which is highly qualitative in nature.
4.3.4 Pragmatism
The fourth element of the research philosophy is the pragmatism which asserts that the
researchers view and interpret the affairs of the world in multiple ways in order to conduct
their research work. Saunders et al. (2009) explained that pragmatism reveals the importance
of research questions which are considered as the main constituent of the research strategy.
The pragmatists in favour of this philosophy argue that if the research question does not give
a vivid image of the adoption of the interpretivism or positivism philosophy, then this gives
the confirmation of the pragmatism view (Saunders et al. 2012). In this philosophy, mixed a
method approach is used i.e. both qualitative and quantitative data. This view goes contrary to
the view of Kelemen and Rumens (2008) asserting that the methods used in the pragmatism
context vary in accordance to answering the research question.
4.3.5 Justification of Selected Research Philosophy
It has been concluded from the research as mentioned above philosophies after critical
evaluation of them and taking into the account the research objectives and questions that have
been devised to assist the respective study that, the adoption of positivism seems suitable for
the conduction of this study. The main motive for considering this philosophy is to make use
of an existing theory to assert the assumptions for the evaluation of job satisfaction among
public and private sectors employees. Moreover, the rationale behind the adoption of the
positivism philosophy is that it leads to further development of the theory. This shows that it
would help in contribution to the body of knowledge with more analytical thoughts and will
ultimately fill in the gap in the literature by opening the way for further research (Saunders et
al. 2009). Hence, this study will test the generalizability of theories in the country of Pakistan
that were practised in different industries by various authors. The nature of this study will be

72
unique as it has considered different manufacturing companies of public and private sectors
of the province the Punjab-Lahore in Pakistan.
4.4 Research Approaches
To explain the nature of the study Saunders et al. (2009) stated that there are two key
approaches to defining the research mainly: the deductive approach by which the researcher
formulates the hypothesis and design the research strategy to assess the hypothesis. Secondly,
is the inductive approach in which the researcher assembles the information for the
conduction of the data analysis and formulate the theory based on the conclusion. However,
in this project the researcher will adopt the deductive approach; the rationale for the selection
of deductive approach can be seen in section 4.4.4.
4.4.1 Deductive Approach
The central aspect of the deductive approach is based on what humans perceive about the
scientific research. According to Saunders et al. (2012) deduction leads the way to the
development of a theory subjected to a rigorous test. It is most dominantly used in natural
sciences, where laws present the basis for explanation, allowing the anticipation of
phenomena and predict their occurrences and therefore allowing them to be controlled (Collis
& Hussey, 2003).
This approach is termed as the one which moves from whole to part (Creswell, 2009). A
general event is used to make deductions about a specific event. Arguments based on laws
and rules are examples of deductive research (Soiferman, 2010). For example, if all the dogs
bite and “A” is a dog hence he must bite (Trochim, 2006). Soiferman (2010, p.3) further
defines deduction as that kind of approach that “begins with the general and ends with the
specific”. In this approach, the aim of the researcher is to test concepts and patterns
theoretically known with the aid of newly observed data. It reaches the hypothesis first
relying on the existing theories and then tests it using the new observations such as surveys
from the employees or customers. Similarly, Beiske (2007) describes that the deductive
approach as used to explore whether a proven theory or concept would apply to a given
scenario or not. Thus, the deductive researcher works following the top to down approach to
73
test the hypothesis, findings of which result in either adding to or contradicting the existing
researchers’ knowledge (Bhattacherjee 2012).
The steps involve in the deductive research approach includes deduction of hypothesis from
theory, formulating the hypothesis, deciding the appropriate variables and proposing the
relationship between them, deciding an appropriate methodology for testing the theory,
making observations, examining the observations and finally accepting or rejecting the
hypothesis.
4.4.2 Abduction Approach
The term abduction refers to a flourishing concept of researching for theories, and social
researchers have taken great interest in this approach. The abduction approach of logical
reasoning was coined by Charles Sanders Peirce, who defined the term as “abduction”, and
used it to denote the only truly knowledge-extending means of inference (Reichertz, 2009).
Peirce struggled for more than 50 years to discover the logic of the derivation of new ideas.
He considered abduction to be the first stage of inquiries, and that it was a necessary part of
one’s perception and memory. Abduction is a distinctive type of approach to of reasoning,
namely inference or argument. It is not to be confused with traditional approaches of
induction and deduction (Fann, 2012).
Today the term "abduction" is widely used in qualitative social research. In reference to
Peirce’s work, many educationists, linguists, psychologists, sociologists, psychoanalysts,
theatre-scientists, theologians, criminologists, and researchers in the artificial intelligence
have made use of the abduction approach, as it reaches to the sphere of deep insight and
discovers new knowledge. Abduction assists in social research to formulate new discoveries
in a logically and methodologically ordered way (Charniak & McDermott, 1985). Unlike the
inductive approach, the only abduction is capable of bringing new ideas to life application, by
creating hypotheses and conjectures from the interpretations of perceptions and ideas
(Reichertz, 2014).
According to Peirce’s logics, efforts of the abduction approach seek a new order, specifically,
the discovery of an order which complements certain facts; or, more precisely, which solves
the practical problems that arise from such situations (Moore & Richard, 1964). Abduction is
the process of epistemic change which begins when surprise takes the human actor, and the

74
starting point for any abduction is empirical data. Thus, it ends when the surprise is replaced
by the understanding of and the ability to make predictions (Aliseda, 2007).
Charmaz (2006) stated that abductive approach starts with the data which ultimately ends in
the formation of a theory. Following Harman, abduction can also be characterised as an
inference to the best explanation (Harman, 1965). In the modern world, abduction “is a rule-
governed way of knowledge” (Reichertz, 2007, p.216).
4.4.3 Inductive Approach
Induction reasoning starts from the basic observation and ends up the formation of a theory
(Charmaz, 2006). For a long time, induction was considered to be the central form of
interference of discovering new ideas. Induction is one of the types of logical reasoning,
which could either be quantitative or qualitative.
Quantitative induction makes inferences of a whole from the quantitative properties of a
sample; it is not a valid approach but is only a probable form of reasoning. In contrast,
Qualitative induction supplements the observed features of a sample and is considered as the
base of all scientific procedures (Reichertz, 2007). Thus we can conclude that the existence
of certain qualitative features in sample implies the presence of other features. For example, I
can hear a clatter that in many ways sounds like the clatter of hooves. Conclusion: clatter of
hooves are a feature of horses, thus horses may be around (Reichertz, 2014).
In the historical times, the inductive approach was rejected by researchers. Many researchers
relied on empirical evidence, based on the traditional logic of intuitive discovery. However,
the inductive approach is questionable, since it does not convey the truth, but only forms its
reasoning by a more or less probable situation. In “The Problems of Philosophy”, Russell
believes that the theory of induction is flawed because one can never prove the existence of
things from the hypothesis that the world consists of. The principle of induction applies only
to the verification of a single instance, based on past instances. Therefore, it cannot be
generalised over all cases, and the evidence for the truth only lies if the inductive principle is
assumed (Russell, 2001).
Based on the above reasoning, Induction observes individual parts of the unique diversity of
the world and attempts to determine its rules and laws to order its infinite manifestations. The
75
inductive approach hopes that the rules ascertained in one limited situation also apply in other
contexts. Moreover, the inductive approach follows the procedure of subsumption (i.e.
deductive reasoning in which a conclusion is derived from two premises). Subsumption
proceeds from an already known context of features that follow a familiar rule and look for
the general background in the data in order to obtain knowledge about an individual case.
Unlike the abduction approach, the inductive approach does not create or discover new
knowledge as suggested by Reichertz (2014).
4.4.4 Justification of Selected Research Approach
In this study, the researcher has chosen the deductive approach. The key feature of deduction
is to explain the relationships between the variables (Saunders et al. 2009). The research
questions in this research are based on the analysis of the relationship between the job
satisfaction (dependent variable) and the independent variables (promotion, salary, co-
workers, job security, supervision and working conditions) and to check if a significant
difference exists between the public and private sector employees of Pakistan. This study
will, therefore, adopt the deductive approach. The research questions associated with this
study could be seen as follows:
1. What is the relationship between job satisfaction and salaries?
2. What is the relationship between job satisfaction and co-workers?
3. What is the relationship between job satisfaction and job security?
4. What is the relationship between job satisfaction and supervision?
5. What is the relationship between job satisfaction and working conditions?
6. What is the relationship of task significance and work environment with job satisfaction?
7. What is the relationship between job satisfaction and promotion, work itself, achievement,
recognition and responsibility?
8. Does a significant difference exist between the public and private sector employees of the
manufacturing industry of Lahore-Pakistan with respect to job satisfaction and extrinsic
factors (salaries, co-workers, job security, supervision, working conditions, task significance,
work environment) as well as intrinsic factors (promotion, work itself, achievement,
recognition, responsibility)?

76
Here, the deductive approach seems more suitable in answering the above questions.
McGregor and Murnane (2010) suggested that the most common words which are used in the
deductive research such as: to determine, test, measure, variables and identify whereas the
inductive research employs words like to understand, discover, explore, aspects and uncover.
This research generates its tentative hypothesis with the help of research objectives to
determine the relationship of job satisfaction with the independent variables. The formulated
hypothesis is then utilised to help in measuring the factors. The research uses an ordinary
least square regression method and a t-test to verify the hypotheses guiding the study. And the
tools applied in this study could be seen as shown in figure given below:
Figure 4.2: The Operationalization Concept
Source: Adoption from framework
Research aim Generated hypothesis Operationalised variables to test
the hypothesis via
To examine the relationship between job satisfaction and salaries, co-workers, job security, supervision, working conditions, task significance, work environment, promotion, work itself, achievement, recognition and responsibility. The research also analyses the differences in the job satisfaction levels among public and private-sector employees of the manufacturing industry in Lahore, Pakistan.
H1: Employees with higher salaries have greater job satisfaction levels within an organisation.
H2: Employees having good relationships with their co-workers possess greater job satisfaction levels within an organisation.
H3: Employees with high job security at the workplace enjoy higher job satisfaction levels within an organisation.
H4: Employees with higher supervision within an organisation enjoy greater job satisfaction levels with their work.
H5: Employees provided with higher standards of working conditions have greater job satisfaction levels within an organisation.
H6: Employees provided with significant tasks and good work environment have greater job satisfaction levels within an organisation.
H7: Employees with higher intrinsic rewards (promotion, work itself, achievement, recognition and responsibility) have greater job satisfaction levels within an organisation.
H8: A significant difference exists between the public and private-sector employees with respect to job satisfaction and extrinsic as well as intrinsic factors within an organisation.
Planned
actions
Quantitative
skills
Postal
77
Figure 4.2 above shows that the hypotheses applied in the deductive approach could be
progressed via operationalization which helps the researcher to measure the variables being
tested, and tested statistically. The main aim of using this statistical method is to understand
the phenomena and to modify theory in accordance with the research findings.
4.5 Research Design
Research design is regarded as the “blueprint for conducting a study with maximum control
over factors that may interfere with the validity of the findings” (Burns & Grove, 2003, p.
195).
There are three main types of research designs which are descriptive, exploratory and
explanatory. The research design is formulated by considering the aims and objectives of the
research along with the research questions and the title of the research (Creswell, 2014).
According to Saunders et al. (2009) the way in which the research question is being asked
would lead to either exploratory, descriptive or explanatory answers. Before the formulation
of the research question, it is essential that the researcher considers the purpose of the
research which is quite often associated with either of the above-mentioned designs.
Moreover, given Saunders et al. (2007) stated that the validity and reliability of the research
findings depend on the type of research design that is used in the research.

78
4.5.1 Descriptive Design
The aim of this research design is to provide an accurate picture of observations, ideologies
and occurrences. In such form of studies, scholars have no control over the variables (factors)
or current predicament. Descriptive research may be characterised as merely an attempt to
determine, describe or identify what is (Ethridge, 2004). A comprehensive set of data on the
profile of customers or clients could be a very self-explanatory example of this research
design. Through this data, we can decode the likes and dislikes of the customers and act
accordingly. For example, product management team will be able to make better decisions on
new product development. Similarly, sales and advertising teams will take into account the
research and make relatable ads for better customer satisfaction. Descriptive research vaguely
fits into both qualitative and quantitative approaches to study. Often, within the same case-
study, descriptive research could apply the key elements of both approaches. It may comprise
of quantitative information as well that can be organised in numerical forms, such as scores or
figures, or it can describe categories of information such as gender or blood group.
Descriptive research is composed of data that describes events and then organises, tabulates,
depicts, and describes the data collection (Glass & Hopkins, 1984). Such research patterns
often use pictorial methods such as graphs and charts to aid the observer in understanding the
data variation. With the help of descriptive designs, raw data can be trimmed down and can
be converted into a manageable form. Questions in this type of studies usually start with
‘What’.
4.5.2 Justification of Selected Research Design
In light of the research question asserted in this study, the researcher adopts the descriptive
design to answer the research questions guiding the study. The key element of this research
design is that it is an effective method for researching specific problems or questions and as a
foundation for more numerical studies (Bryman & Bell, 2003). Hence, the researcher
considers this design to be appropriate to find out the relationship between job satisfaction
and independent variables in the public and private sectors of the manufacturing companies in
Lahore-Pakistan and how their job satisfaction levels could be increased at an optimum level.
The rationale for selecting this design by this study is based on the view revealed by Saunders
et al. (2009) in which they stated that descriptive design works better in a situation where the
researcher wants to know the correlation between two variables.
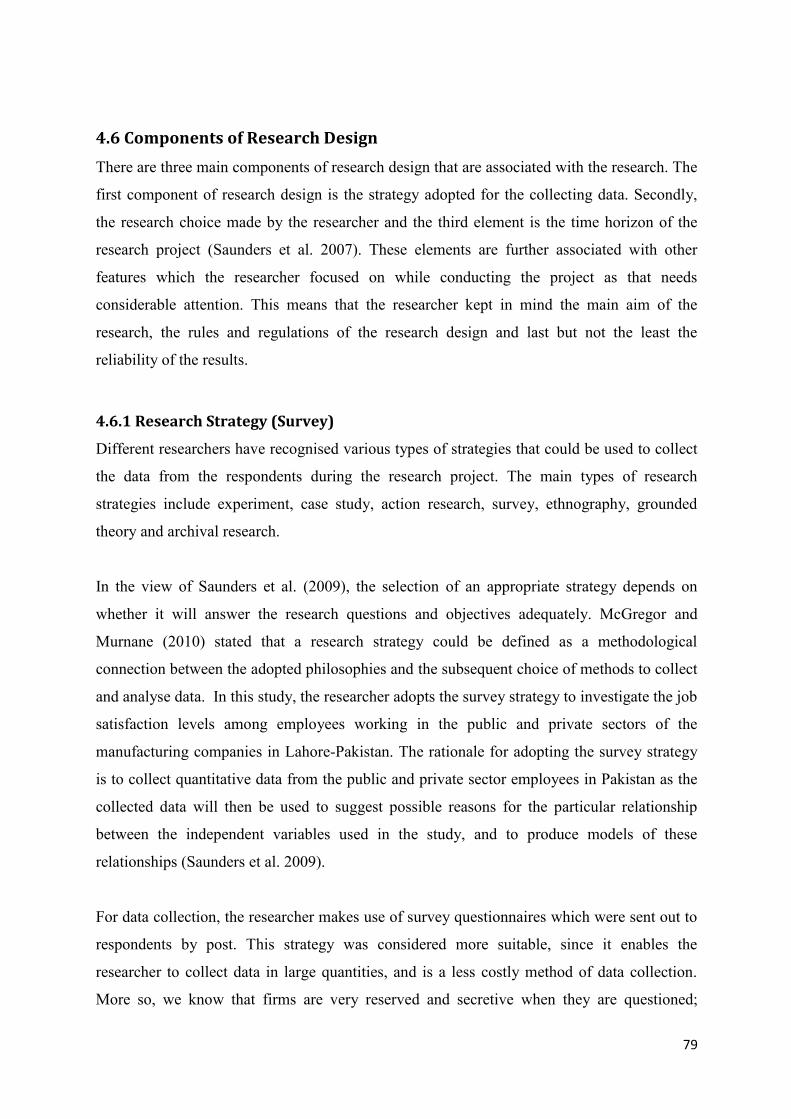
79
4.6 Components of Research Design
There are three main components of research design that are associated with the research. The
first component of research design is the strategy adopted for the collecting data. Secondly,
the research choice made by the researcher and the third element is the time horizon of the
research project (Saunders et al. 2007). These elements are further associated with other
features which the researcher focused on while conducting the project as that needs
considerable attention. This means that the researcher kept in mind the main aim of the
research, the rules and regulations of the research design and last but not the least the
reliability of the results.
4.6.1 Research Strategy (Survey)
Different researchers have recognised various types of strategies that could be used to collect
the data from the respondents during the research project. The main types of research
strategies include experiment, case study, action research, survey, ethnography, grounded
theory and archival research.
In the view of Saunders et al. (2009), the selection of an appropriate strategy depends on
whether it will answer the research questions and objectives adequately. McGregor and
Murnane (2010) stated that a research strategy could be defined as a methodological
connection between the adopted philosophies and the subsequent choice of methods to collect
and analyse data. In this study, the researcher adopts the survey strategy to investigate the job
satisfaction levels among employees working in the public and private sectors of the
manufacturing companies in Lahore-Pakistan. The rationale for adopting the survey strategy
is to collect quantitative data from the public and private sector employees in Pakistan as the
collected data will then be used to suggest possible reasons for the particular relationship
between the independent variables used in the study, and to produce models of these
relationships (Saunders et al. 2009).
For data collection, the researcher makes use of survey questionnaires which were sent out to
respondents by post. This strategy was considered more suitable, since it enables the
researcher to collect data in large quantities, and is a less costly method of data collection.
More so, we know that firms are very reserved and secretive when they are questioned;

80
manufacturing companies are frequently not transparent with respect to their adopted
strategies. As the process of sharing how their financial goods work will not legally make it
tough for its competitors to imitate but will make its clients suffer from this privacy of
knowing the goods they purchase. In regards to this and focusing on customer’s perception of
depicting the firm as immoral, the adoption of interviews was eliminated as there was a
concern of the data validity collected from the prospective interview of the managers who
would like to secure the industry.
The main risk associated with this strategy is that it has a lot of chances of biased data as the
respondents would give positive feedback about their firms. Despite the assurance of
anonymity to the mangers of public and private sectors, the decision of not conducting
interviews was put down mainly because of the alarm of whistle-blower in this industry as the
information travels quickly which could affect the position of the whole sector.
4.6.2 Research Choice
The main purpose of research choice is to identify the application of an appropriate research
method when using either qualitative or quantitative research as suggested by Saunders et al.
(2007). There are three main approaches namely: mono method, multi-method and mixed
method. The researcher has adopted mono method approach for this study. The rationale for
selecting this approach is based on the paradigm (positivism) as discussed previously. This
choice is, therefore, limited to apply mono method or mixed method. In a mixed method, the
researcher makes use of both qualitative and quantitative techniques to collect the data for
further analysis (Saunders et al. 2007). Based on this discussion the nature of this study
should be mixed method approach; however, the researcher applies the mono method
approach due to time limitation and implements the mono method in this thesis in a detailed
way which could be seen in the summary table of survey questionnaires.
4.6.3 Time Horizon
Like other components of the research design, time horizon also holds an equally important
position in the research. More often the application of an appropriate time horizon depends on
upon the nature of the research work i.e. the researcher has to keep in mind the time limitation
allowed to conduct the research with the given period. Taking into consideration the
81
perspective as mentioned above, the researcher is allotted two types of time horizons
depending on the nature of the study namely: Cross-sectional study and longitudinal study. In
a cross-sectional study, the researcher is given a particular time to finish the research project
whereas in the longitudinal study the researcher does not have to depend on the period of the
study (Saunders et al. 2009). In the light of the time span available to this research, the
researcher opted to choose the cross-sectional study. The main drawback of this study,
however, is that the attitude of the participants may differ from time to time whether
conducted at a particular time or over a lengthy period. However, the strength of using cross-
sectional study is that it gives an opportunity to the researcher to evaluate the attitude of the
participants from different backgrounds, and conclude differences in the opinions of the
respondents as suggested by Remenyi et al. (1998). As a result, this study uses the method to
examine the relationships between the dependent and independent variables used in the
hypotheses testing in the study.
4.7 Population
Creswell (2014) suggested that sampling is the procedure with the help of which participants
are selected from the population to conduct data for the analysis process. It was essential,
therefore, to choose the sample from the target population. Hence, it can be said that it is a
process for representing the population as a whole providing useful sources of information
composed of diminutive parts (Sekaran & Bougie, 2010). The total population of this study is
400 as per guidelines provided by selected companies’ managers.
The sample must possess the adequate size to warrant statistical analysis. Sampling is
frequently performed because it is almost impractical to test every single individual within the
population. It has also been performed to save time, effort, and money while conducting the
research. Performing population sampling should be conducted in a proper and accurate
manner since; any error can lead to misleading and inaccurate data (Levy& Lemeshow,
2013). Results obtained from the population sampling can be generalised in order to represent
the whole of the population from where the aforementioned sample was retrieved.
82
4.8 Sampling
Sampling is regarded as the procedure of selecting the units, i.e. organisations, people, from a
population of interest. Therefore, by studying the sample, one can generalise the results back
towards the population from which it had been selected (Dong et al. 2014). Some of the key
terms regarding the sampling include sampling frame and population. The benefits of
sampling involve the smaller quantities of subjects that, in turn, cut the investment in money
and time. Sampling can be more precise in contrast with studying the overall population, the
reason being; it facilitates researchers a great control upon the subjects (Levy& Lemeshow,
2013). On the other hand, large studies can conceal interesting correlations amongst the
noises. Also, statistical populations are more feasible with that of the smaller sets of data and
are also easy to evade human errors while inputting and analysing the data.
The sample for this study constitutes of respondents (male and female) employees working in
the public and private sector companies in Lahore, Pakistan where both public and private
sector employees represent the entire population. However, it was difficult to gather
information from the whole population; consequently, the sampling technique is adopted for
this study. The sampling process is conducted in different phases. The initial step is the
representativeness of the population which means the sample that is being taken for the
respective study should signify the entire population. To fulfil this requirement stratified
simple random sampling technique is applied to select the sample for this study.
For the next phase, researcher selected public and private sector companies with the help of
random number generator (random.org, 2016). There are altogether 101 well known public
and private sector manufacturing companies in Lahore which were verified from the
organisation’s websites and published directories out of which a total of 10 companies (five
public and five private) were selected randomly to represent the sample for this study. Table
4.1 below shows the list of the public and private manufacturing companies used in Lahore-
Pakistan.

83
Table 4. 1: Public and Private Manufacturing Companies Used
No. Public manufacturing companies Private manufacturing companies
1 Fauji Fertilizer Zahoor Cotton Mills Ltd
2 Millat Tractors Arooj Garments Accessories Ltd
3 Bata Pakistan Ansari Sugar Mills Ltd
4 Crescent Steel Ittehad Chemicals
5 Colgate-Palmolive Ghani Automobiles Company Ltd
Next is the final stage of the sampling technique that is the selection of sample size; for this
purpose, the researcher uses the sample size calculator (Creative Research Systems, 2016)
and the sample size table provided by Krejcie and Morgan (1970). According to their sample
size table, 196 sample sizes are required to represent the population of 400, having a
confidence level of 95% with the confidence interval of five per cent. Hence, the sample size
(10%) was applied following the Rule of Thumb of John Curry as cited by Aziz (2013, p.60)
as is given in Table 4.2 below:
Table 4. 2: Sample Size (Rule of Thumb)
10-100 100%
101-1000 10%
1001-5000 5%
5001-10000 3%
10000+ 1%
Source: Aziz (2013)
The demographic features of respondents include gender, age, education, experiences in
particular fields, sectors in which they work and positions in the respective companies.
4.8.1. Gender and Age
Table 5.1 below shows that most of the participants are male (82.35%). This shows that the
majority of the participants are males with highest response rate of 140, whereas, the females
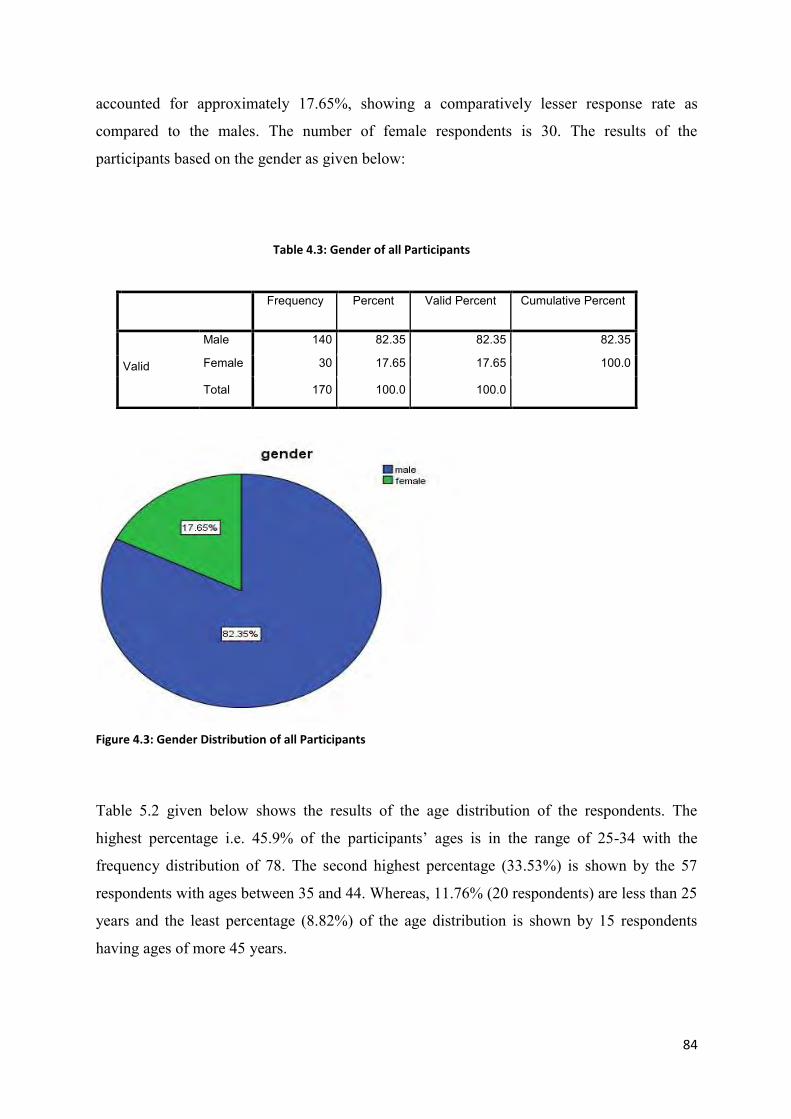
84
accounted for approximately 17.65%, showing a comparatively lesser response rate as
compared to the males. The number of female respondents is 30. The results of the
participants based on the gender as given below:
Figure 4.3: Gender Distribution of all Participants
Table 5.2 given below shows the results of the age distribution of the respondents. The
highest percentage i.e. 45.9% of the participants’ ages is in the range of 25-34 with the
frequency distribution of 78. The second highest percentage (33.53%) is shown by the 57
respondents with ages between 35 and 44. Whereas, 11.76% (20 respondents) are less than 25
years and the least percentage (8.82%) of the age distribution is shown by 15 respondents
having ages of more 45 years.
Table 4.3: Gender of all Participants
Frequency Percent Valid Percent Cumulative Percent
Valid
Male 140 82.35 82.35 82.35
Female 30 17.65 17.65 100.0
Total 170 100.0 100.0
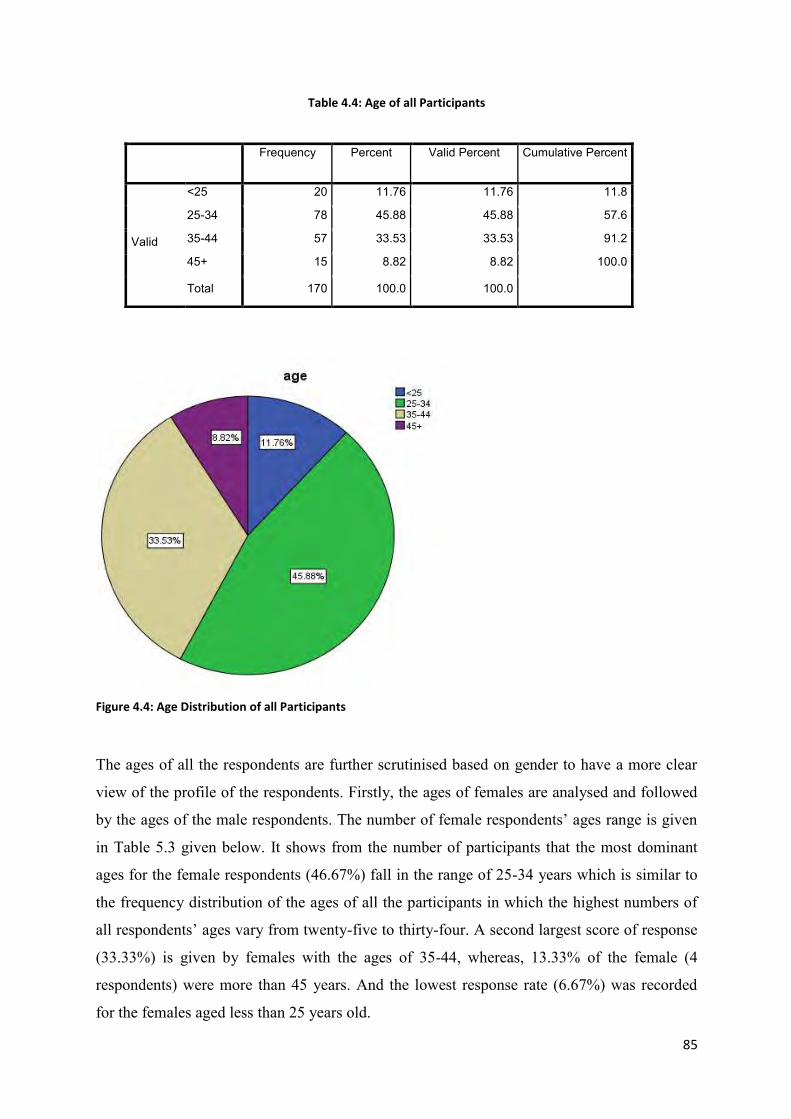
85
Table 4.4: Age of all Participants
Figure 4.4: Age Distribution of all Participants
The ages of all the respondents are further scrutinised based on gender to have a more clear
view of the profile of the respondents. Firstly, the ages of females are analysed and followed
by the ages of the male respondents. The number of female respondents’ ages range is given
in Table 5.3 given below. It shows from the number of participants that the most dominant
ages for the female respondents (46.67%) fall in the range of 25-34 years which is similar to
the frequency distribution of the ages of all the participants in which the highest numbers of
all respondents’ ages vary from twenty-five to thirty-four. A second largest score of response
(33.33%) is given by females with the ages of 35-44, whereas, 13.33% of the female (4
respondents) were more than 45 years. And the lowest response rate (6.67%) was recorded
for the females aged less than 25 years old.
Frequency Percent Valid Percent Cumulative Percent
Valid
<25 20 11.76 11.76 11.8
25-34 78 45.88 45.88 57.6
35-44 57 33.53 33.53 91.2
45+ 15 8.82 8.82 100.0
Total 170 100.0 100.0
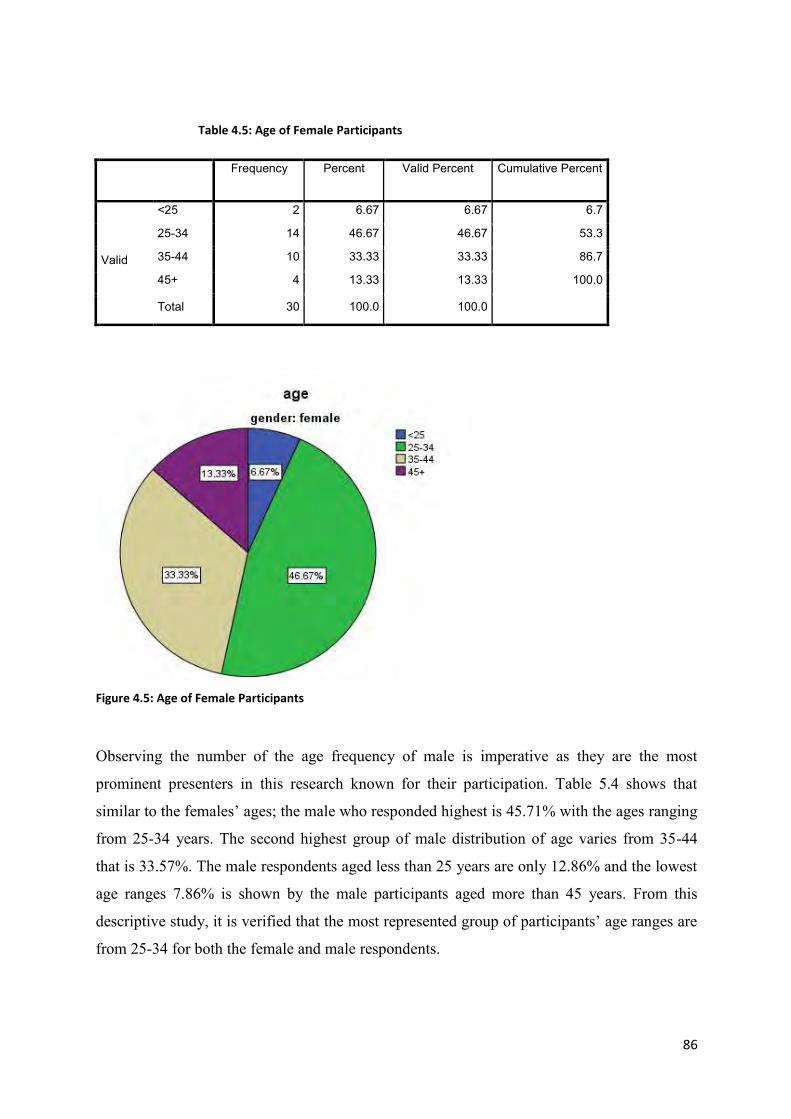
86
Table 4.5: Age of Female Participants
Frequency Percent Valid Percent Cumulative Percent
Valid
<25 2 6.67 6.67 6.7
25-34 14 46.67 46.67 53.3
35-44 10 33.33 33.33 86.7
45+ 4 13.33 13.33 100.0
Total 30 100.0 100.0
Figure 4.5: Age of Female Participants
Observing the number of the age frequency of male is imperative as they are the most
prominent presenters in this research known for their participation. Table 5.4 shows that
similar to the females’ ages; the male who responded highest is 45.71% with the ages ranging
from 25-34 years. The second highest group of male distribution of age varies from 35-44
that is 33.57%. The male respondents aged less than 25 years are only 12.86% and the lowest
age ranges 7.86% is shown by the male participants aged more than 45 years. From this
descriptive study, it is verified that the most represented group of participants’ age ranges are
from 25-34 for both the female and male respondents.
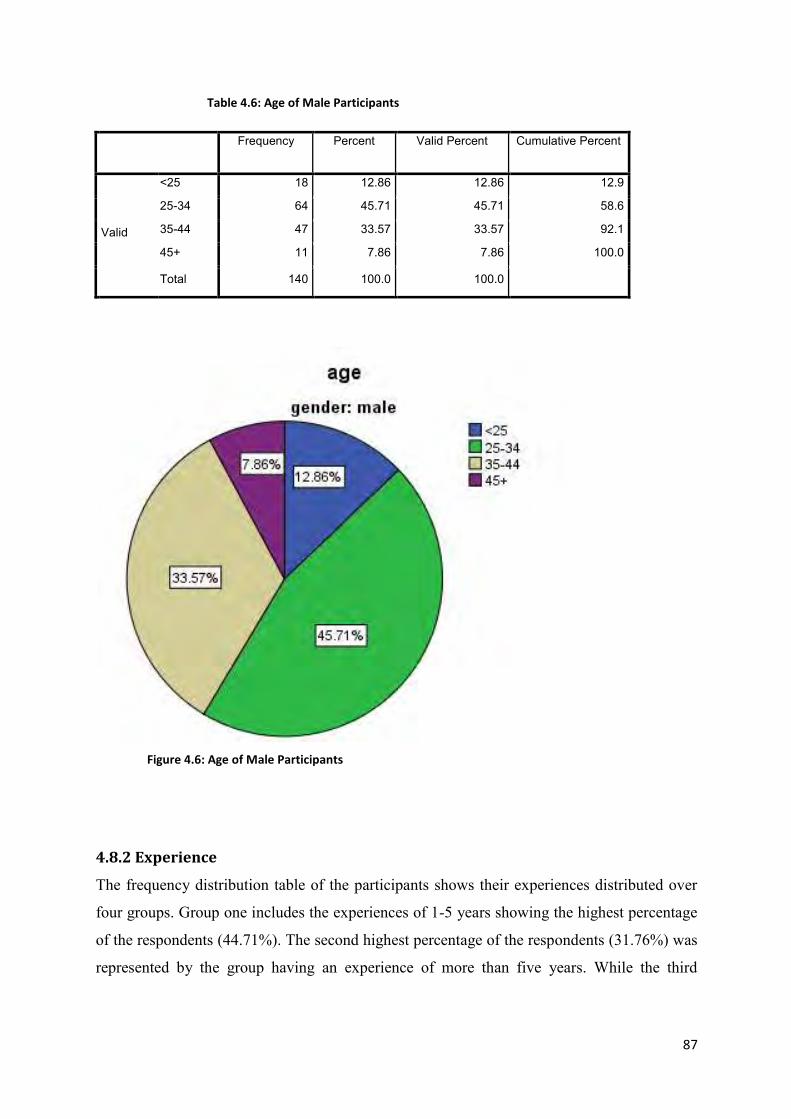
87
Table 4.6: Age of Male Participants
Frequency Percent Valid Percent Cumulative Percent
Valid
<25 18 12.86 12.86 12.9
25-34 64 45.71 45.71 58.6
35-44 47 33.57 33.57 92.1
45+ 11 7.86 7.86 100.0
Total 140 100.0 100.0
Figure 4.6: Age of Male Participants
4.8.2 Experience
The frequency distribution table of the participants shows their experiences distributed over
four groups. Group one includes the experiences of 1-5 years showing the highest percentage
of the respondents (44.71%). The second highest percentage of the respondents (31.76%) was
represented by the group having an experience of more than five years. While the third
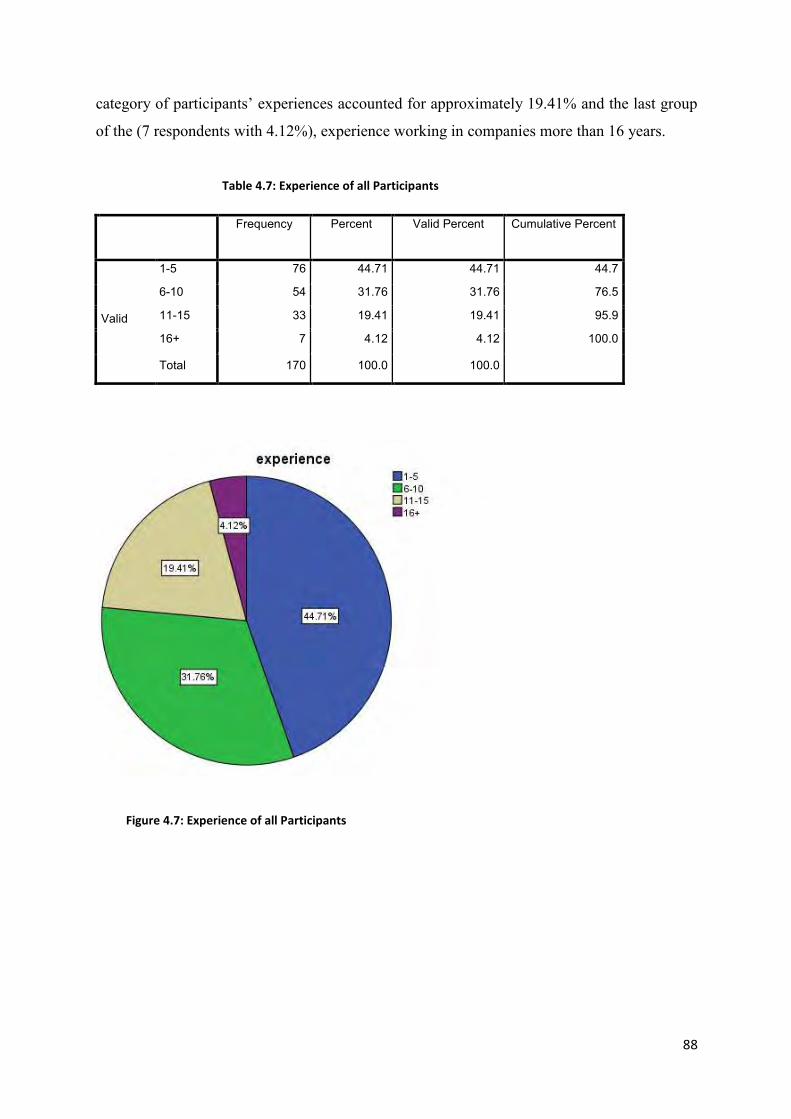
88
category of participants’ experiences accounted for approximately 19.41% and the last group
of the (7 respondents with 4.12%), experience working in companies more than 16 years.
Table 4.7: Experience of all Participants
Frequency Percent Valid Percent Cumulative Percent
Valid
1-5 76 44.71 44.71 44.7
6-10 54 31.76 31.76 76.5
11-15 33 19.41 19.41 95.9
16+ 7 4.12 4.12 100.0
Total 170 100.0 100.0
Figure 4.7: Experience of all Participants
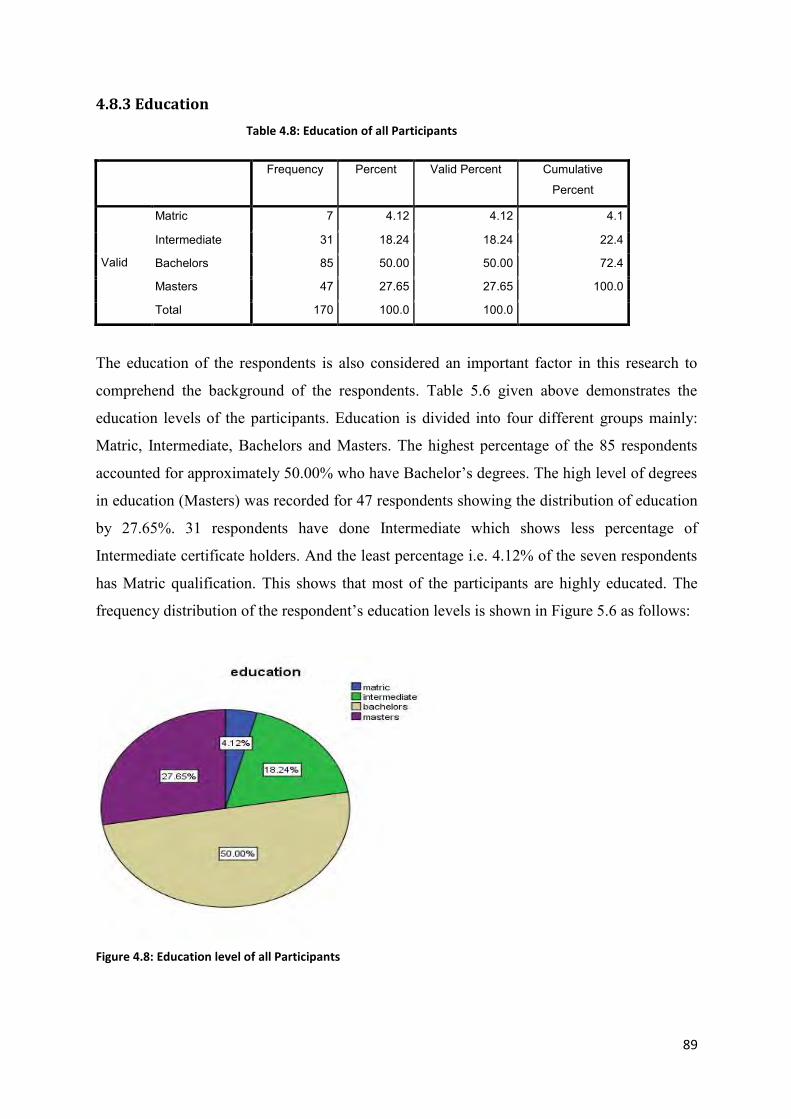
89
4.8.3 Education
Table 4.8: Education of all Participants
Frequency Percent Valid Percent Cumulative
Percent
Valid
Matric 7 4.12 4.12 4.1
Intermediate 31 18.24 18.24 22.4
Bachelors 85 50.00 50.00 72.4
Masters 47 27.65 27.65 100.0
Total 170 100.0 100.0
The education of the respondents is also considered an important factor in this research to
comprehend the background of the respondents. Table 5.6 given above demonstrates the
education levels of the participants. Education is divided into four different groups mainly:
Matric, Intermediate, Bachelors and Masters. The highest percentage of the 85 respondents
accounted for approximately 50.00% who have Bachelor’s degrees. The high level of degrees
in education (Masters) was recorded for 47 respondents showing the distribution of education
by 27.65%. 31 respondents have done Intermediate which shows less percentage of
Intermediate certificate holders. And the least percentage i.e. 4.12% of the seven respondents
has Matric qualification. This shows that most of the participants are highly educated. The
frequency distribution of the respondent’s education levels is shown in Figure 5.6 as follows:
Figure 4.8: Education level of all Participants

90
4.8.4 Sector
In this research, sector is considerably important in the analysis of the job satisfaction levels
in different sectors. However, in this section, the researcher considers the number of
observations for both the public and private sector entities. Table 5.7 below shows the results
of the respondents working in the public and private sectors. The contribution of the
participants by the public sector employee’s accounts for approximately 50.6% which is
similar to the number of participants working in private sector companies i.e. 50.6%. The
distribution of the respondents based on the type of sector is shown graphically in Figure 5.7
below.
Table 4.9: Types of Sector
Frequency Percent Valid Percent Cumulative
Percent
Valid
public 85 50.6 50.6 50.0
private 85 50.6 50.6 100.0
Total 170 100.0 100.0
Figure 4.9: Distribution of Respondents Based on Sectors

91
4.8.5 Position
The positions of the participants are also the chief concerning factor in this study. Two
different groups are generated which includes managers and non-managers. Table 5.8 shows
the number of response rate. The highest response rate 143 out of 170 respondents accounted
for the non-managers working in different sectors with approximately 83.82%, and 27
respondents are managers showing the less percentage of response rates i.e. 16.18%.
Table 4.10: Positions of Participants
Frequency Percent Valid Percent Cumulative
Percent
Valid
manager 27 16.18 16.18 15.9
non-manager 143 83.82 83.82 100.0
Total 170 100.0 100.0
Figure 4.10: Position of Participants
92
4.9 Sampling Frame
A sampling frame is the set of information that is being deployed to identify the sample
population designed for statistical treatment (Thompson, 2004). This is the subset of a well-
defined target population, from which, one can realistically choose the sample for the
research. A sampling frame comprises a numerical identifier for every individual. In addition
to it, it includes other identifying information regarding the characteristics of the individuals,
to assist in analysis and also allow the division into advance frames so as to perform more in-
depth analysis (Dong et al. 2014). Consequently, a sample is usually a practical listing of the
population, or could also be termed as the definition of areas or elements that can be deployed
for sampling practices.
In this study, the researcher selected the sample with the method outlined by Miller et al.
(2008). To have a suitable sample, the researcher used the databases to generate the list of 101
public and private manufacturing companies located in Lahore due to ease of access. The
reason for selecting this method is the non-availability of some of the private limited
companies’ names on websites, but can be found in directories. For this reason, the researcher
selected public and private sector companies through a cross-referencing system by using
secondary sources (company’s websites and published directories) to ensure accuracy (See
Appendix D).
4.10 Rationale for Adopting Probability Method
A sampling design is comprised of two elements; sampling method and estimator. The
sampling methods are referred to the rules and processes through which, some of the items
regarding the population are included in the sample (Rea& Parker, 2014). There are two
types of sampling techniques: probability and non-probability sampling. In a probability
sampling, each item of the population has a known, non-zero probability of being included in
the sample (Henry, 1990). In contrast to this, in non-probability sampling, the sample is
chosen on the basis of a subjective judgement of the researcher (Uprichard, 2013). It is used
when the researcher is faced with a limited population size (Gingery, 2009).
Some common sampling methods include; simple random sampling, cluster sampling, and
stratified sampling. On the other hand, the estimation process involves the calculation of the
sample statistics that is known as an estimator. A variety of sampling methods may deploy
93
different estimators. For instance, the formula for the standard error can differ from one
sampling method to that of the next. For this research, the stratified simple random sampling
technique is used. In this approach, a sample, which is representative of the population, is
chosen (Smith et al. 2013). Chosen entirely by chance, every unit of the population has an
equal probability of being included in the sample (Levy &Lemeshow, 2013). This technique
is selected to have unbiased results about the job satisfaction levels of employees surveyed
and the impact of studied variables on the same without bias. Selecting the stratified simple
random sampling also assisted in generalising the results for all the employees who are
working in the public and private manufacturing companies in Lahore-Pakistan.
4.11 Research Instruments
In this study, the instrument that is used to gather the proposed data from the public and
private sector employees of the manufacturing companies is the survey questionnaire.
Various studies have adopted the survey tool to examine the perception of employees towards
job satisfaction levels. Waqas et al. (2014) analysed job satisfaction by measuring its
determinants and its influence on the job loyalty. Naveed et al. (2011) examined the job
attitudes of employees by measuring promotion with the help of the survey questionnaire
technique. In the same way, Kumari and Pandey (2011) used a survey to evaluate the public
and private sector employees. From the above literature, it is depicted that most of the
researchers have relied on using survey questionnaires to measure job satisfaction. Most of
the researchers rely on this technique as it is considered one of the most appropriate methods
to analyse the attitudes and behaviour patterns of employees towards job satisfaction
(Halepota, 2011). Moreover, this technique has a connection with the deduction approach and
could be used to describe data in the quantitative form (Saunders et al. 2007).
The main purpose of this thesis is to find the relationship between the dependent variable (job
satisfaction) and independent variables (salary, co-workers, job security, supervision, working
conditions, task significance, work environment, promotion, work itself, achievement,
recognition and responsibility). As a result of which survey questionnaire was regarded as the
most appropriate method of collecting the data (Sekaran, 2005). Focusing on its importance
Verschuren and Doorewaard (1999) stated that the key element of a survey is to examine and
evaluate the thinking of the respective participants. See section 4.9.2 for a more specific
discussion.
94
4.12 Measurement Scale
Both the dependent and independent variables “are taken up by the positivist research
paradigm” (Halepota, 2011, p.103) to determine the behaviour and sentiment of workforce
regarding the perception of a job. In this study both hygiene and motivation factors are used
to analyse the job satisfaction levels of the public and private sector employees in the
manufacturing industries of Pakistan. Also, age, gender, work experience, education, type of
sector and employees holding different positions are used to represent the background of the
respondents. The measurement scale that is used to measure employee job satisfaction levels
and independent variables is adopted from the literature used by previous researchers. A pilot
testing was used to check their validity and reliability of the respective scale.
The main purpose for using pilot study is to examine the time used to fill the survey
questionnaire and to make sure the survey strategy is free from poor wording or ambiguity
before the final survey can be distributed for the data collection. After the conduction of the
pilot study, the survey questionnaire forms were sent to the public and private sector
employees of manufacturing companies operating in Lahore-Pakistan. The survey
questionnaire comprised of two parts including a demographic profile of the participants
represented as part (I) and part (II) consisting of survey questionnaires measuring the
dependent variable (job satisfaction) and the independent variables (salaries, co-workers, job
security, supervision, working conditions, task significance, work environment, promotion,
work itself, achievement, recognition and responsibility). Sections 4.12.1, 4.12.2 and 4.12.3
further explain the demographic variables representing the background of the participants,
independent variables, dependent variable and dummy variables taken into consideration for
this study.
4.12.1 Demographic Variables
To ascertain the background of the respondents used in the survey, the researcher used
demographic features namely: age and gender, work experience, education, type of sector to
which the participants belong and their positions in their respective companies, whether
managerial or non-managerial. In this section, the participants are provided with the
guidelines that are to tick the appropriate answers that describe their demographic
characteristics.
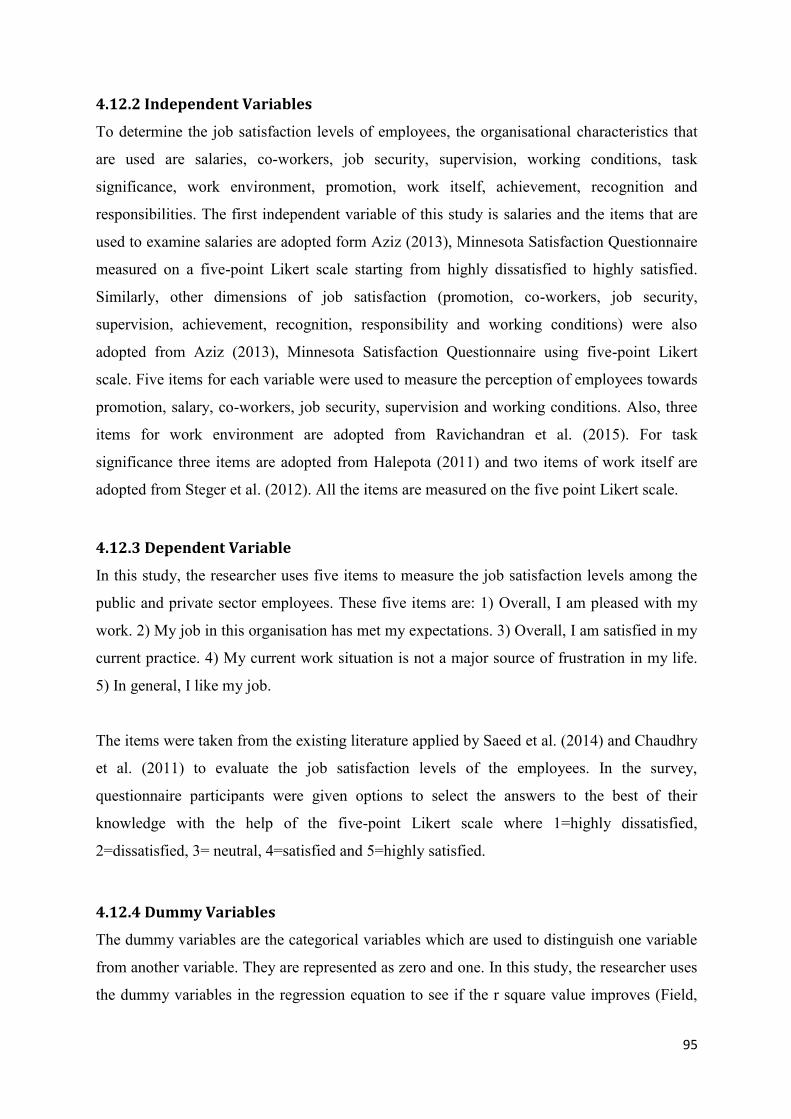
95
4.12.2 Independent Variables
To determine the job satisfaction levels of employees, the organisational characteristics that
are used are salaries, co-workers, job security, supervision, working conditions, task
significance, work environment, promotion, work itself, achievement, recognition and
responsibilities. The first independent variable of this study is salaries and the items that are
used to examine salaries are adopted form Aziz (2013), Minnesota Satisfaction Questionnaire
measured on a five-point Likert scale starting from highly dissatisfied to highly satisfied.
Similarly, other dimensions of job satisfaction (promotion, co-workers, job security,
supervision, achievement, recognition, responsibility and working conditions) were also
adopted from Aziz (2013), Minnesota Satisfaction Questionnaire using five-point Likert
scale. Five items for each variable were used to measure the perception of employees towards
promotion, salary, co-workers, job security, supervision and working conditions. Also, three
items for work environment are adopted from Ravichandran et al. (2015). For task
significance three items are adopted from Halepota (2011) and two items of work itself are
adopted from Steger et al. (2012). All the items are measured on the five point Likert scale.
4.12.3 Dependent Variable
In this study, the researcher uses five items to measure the job satisfaction levels among the
public and private sector employees. These five items are: 1) Overall, I am pleased with my
work. 2) My job in this organisation has met my expectations. 3) Overall, I am satisfied in my
current practice. 4) My current work situation is not a major source of frustration in my life.
5) In general, I like my job.
The items were taken from the existing literature applied by Saeed et al. (2014) and Chaudhry
et al. (2011) to evaluate the job satisfaction levels of the employees. In the survey,
questionnaire participants were given options to select the answers to the best of their
knowledge with the help of the five-point Likert scale where 1=highly dissatisfied,
2=dissatisfied, 3= neutral, 4=satisfied and 5=highly satisfied.
4.12.4 Dummy Variables
The dummy variables are the categorical variables which are used to distinguish one variable
from another variable. They are represented as zero and one. In this study, the researcher uses
the dummy variables in the regression equation to see if the r square value improves (Field,
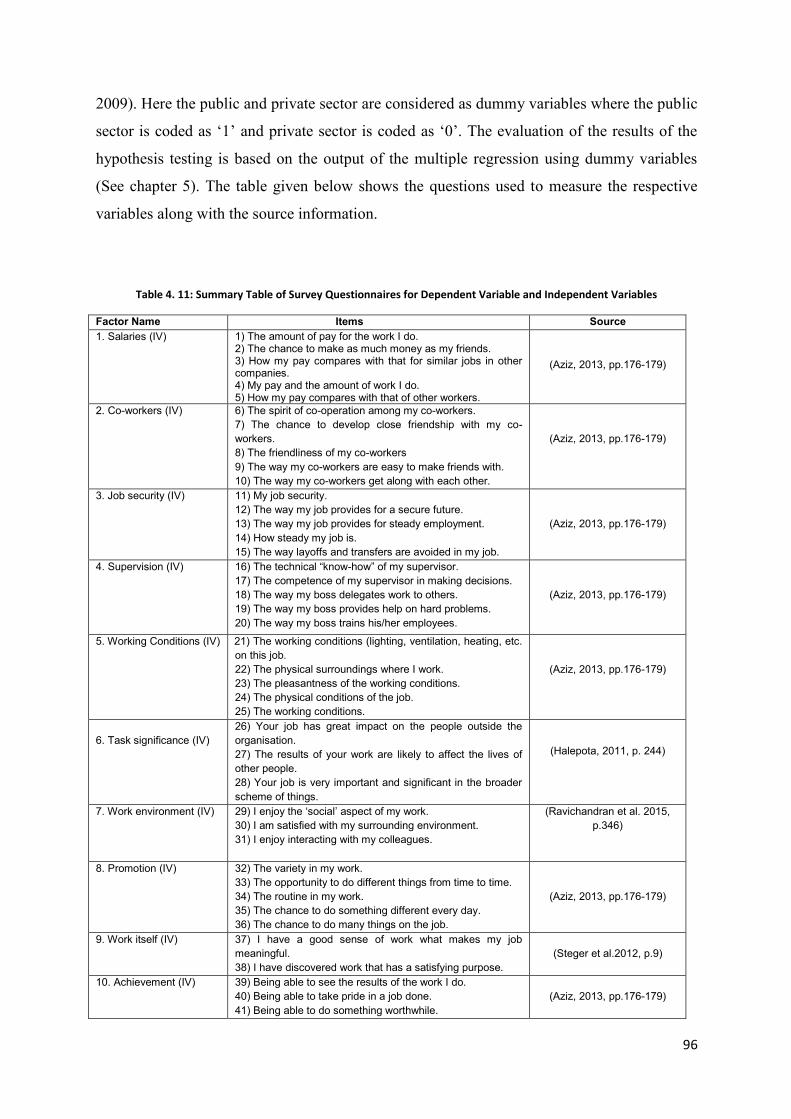
96
2009). Here the public and private sector are considered as dummy variables where the public
sector is coded as ‘1’ and private sector is coded as ‘0’. The evaluation of the results of the
hypothesis testing is based on the output of the multiple regression using dummy variables
(See chapter 5). The table given below shows the questions used to measure the respective
variables along with the source information.
Table 4. 11: Summary Table of Survey Questionnaires for Dependent Variable and Independent Variables
Factor Name Items Source 1. Salaries (IV) 1) The amount of pay for the work I do.
2) The chance to make as much money as my friends. 3) How my pay compares with that for similar jobs in other companies. 4) My pay and the amount of work I do. 5) How my pay compares with that of other workers.
(Aziz, 2013, pp.176-179)
2. Co-workers (IV) 6) The spirit of co-operation among my co-workers. 7) The chance to develop close friendship with my co-workers. 8) The friendliness of my co-workers 9) The way my co-workers are easy to make friends with. 10) The way my co-workers get along with each other.
(Aziz, 2013, pp.176-179)
3. Job security (IV) 11) My job security. 12) The way my job provides for a secure future. 13) The way my job provides for steady employment. 14) How steady my job is. 15) The way layoffs and transfers are avoided in my job.
(Aziz, 2013, pp.176-179)
4. Supervision (IV) 16) The technical “know-how” of my supervisor. 17) The competence of my supervisor in making decisions. 18) The way my boss delegates work to others. 19) The way my boss provides help on hard problems. 20) The way my boss trains his/her employees.
(Aziz, 2013, pp.176-179)
5. Working Conditions (IV)
21) The working conditions (lighting, ventilation, heating, etc. on this job. 22) The physical surroundings where I work. 23) The pleasantness of the working conditions. 24) The physical conditions of the job. 25) The working conditions.
(Aziz, 2013, pp.176-179)
6. Task significance (IV)
26) Your job has great impact on the people outside the organisation. 27) The results of your work are likely to affect the lives of other people. 28) Your job is very important and significant in the broader scheme of things.
(Halepota, 2011, p. 244)
7. Work environment (IV)
29) I enjoy the ‘social’ aspect of my work. 30) I am satisfied with my surrounding environment. 31) I enjoy interacting with my colleagues.
(Ravichandran et al. 2015, p.346)
8. Promotion (IV) 32) The variety in my work. 33) The opportunity to do different things from time to time. 34) The routine in my work. 35) The chance to do something different every day. 36) The chance to do many things on the job.
(Aziz, 2013, pp.176-179)
9. Work itself (IV) 37) I have a good sense of work what makes my job meaningful. 38) I have discovered work that has a satisfying purpose.
(Steger et al.2012, p.9)
10. Achievement (IV) 39) Being able to see the results of the work I do. 40) Being able to take pride in a job done. 41) Being able to do something worthwhile.
(Aziz, 2013, pp.176-179)
97
11. Recognition (IV) 42) The way I am noticed when I do a good job. 43) The way I get full credit from the work I do. 44) The recognition I get for the work I do.
(Aziz, 2013, pp.176-179)
12. Responsibility (IV)
45) The chance to be responsible for planning my work. 46) The chance to make decisions on my work.
(Aziz, 2013, pp.176-179)
Job satisfaction (DV)
47) Overall, I am pleased with my work. 48) My job in this organisation has met my expectations. 49) Overall, I am satisfied in my current practice. 50) My current work situation is not a major source of frustration in my life. 51) In general, I like my job.
(Saeed et al. 2014, p.249) (Saeed et al. 2014, p.249) (Saeed et al. 2014, p.249) (Saeed et al. 2014, p. 249)
(Chaudhry et al. 2011, p.11)
Where, IV= independent variable DV=dependent variable
4.13 Pilot Study
A pilot study is a pre-testing study which is conducted on a small number of people especially
the experts to give suggestions on the questionnaire that will be used to collect the final data.
However, the number of people required for the pilot testing is directly influenced by various
factors such as the main objective of the project, the research questions and the dimension of
study (Saunders et al. 2007). On the other hand, Fink (2003) suggested that at least ten
participants are adequate to represent the population of the pilot study.
During this process experts suggest researchers to refine the questions which they think
would be appropriate to use in gathering information from the respective participants as
explained by Saunders et al. (2007). This is so in order not to encounter any problems related
to the time required to fill in the questionnaires and the length of the questions, unclear words
or sentences, inappropriate timings and to check if the correct phrases have been used to
measure the actual factors (Adenigi, 2011). In the light of the key perspective of the pilot
study, Bell (2005) suggested that pilot tests are used to investigate the validity and the
reliability of the data collected for the full-scale study.
The pilot test for this study was conducted in November 2015 following some
recommendations from the questionnaire feedback, from the experts of the same field. This
process was followed by the delivery of questions to 25 participants which were chosen from
LinkedIn based on required profile of the experts. It was important to conduct a pilot test for
this study as the questionnaires were taken from the existing literature which meant that they
were not modified. Also, these questions were used in different industries and had not
98
considered the combination of the public and private sector limited companies. Moreover,
some of these studies were region-specific. Based on the suggestions from the experts some
items were removed from the questionnaire. Hence, this gave an opportunity to check the
validity and reliability of the questions. The experts also recommended asking questions from
the participants in the official language (Urdu) rather than international as most of the
employees find difficulty in understanding the English Language. Hence, this was very useful
to get quite a high response rate. Moreover, based on the feedback from the questionnaires,
some of the items were removed from the questionnaire due to time limit and were observed
as inappropriate. Taking into consideration the above facts raised during the pilot study, the
researcher amended the questions accordingly.
4.14 Data Collection Techniques and Analysis Procedures
According to Saunders et al. (2009), there are three main types of data collection and analysis
process; these are mainly qualitative, quantitative and mixed method that could be used to
define the purpose of the research. To verify the hypothesis multiple regression analysis and
independent samples, a t-test is used. Moreover, to evaluate the influence of the independent
variables, the researcher makes use of the five-point Likert scale in which the employees rate
their responses about certain organisational features.
The characteristic feature of quantitative data collection technique includes the structured
questionnaire analysed in the form of graphs and statistics. Whereas the data collection
technique in qualitative research is predominantly based on interviews and the procedure
adopted for the analysis of data is presented in a non-numerical term (Saunders, Lewis &
Thornhill, 2009). However, in this study researcher uses the quantitative approach and the
data in this research is collected using following sources:
4.14.1 Primary Data Sources
This study collects the primary data from the employees working in public and private sector
manufacturing companies in Lahore-Pakistan. The survey questionnaire adapted from the
literature is used and administered via post and by personal appearance. A representative
sample (n=10) that is five from each sector is composed of randomly selected managerial and
non-managerial employees in the same department; i.e. human resource department of the
99
group of 10 manufacturing companies. Five public and five private companies were selected
randomly with the help Random.org (2016).
4.14.2 Tertiary Data Sources
Saunders et al. (2009) stated that the key element of tertiary data includes indexes,
dictionaries, bibliographies and online databases. With the help of tertiary data, the researcher
located primary or secondary data to introduce a topic (Saunders et al. 2007).
4.14.3 Administering the Questionnaire
After the conduction of the pilot test and final amendments are done, and the sample size is
chosen, the next step is to conduct the questionnaires in different forms. There are numerous
ways to administer the questions namely: the internet and intra-mediated questionnaires,
postal questionnaires, telephone questionnaires, delivery and collection of the questionnaire
(Saunders et al. 2007).
In this study, the researcher selects postal questionnaires to collect data in the time frame of
six months that is between January 2015 and June 2015. The questionnaires were posted to
five public and five private sector manufacturing companies. The key features that are
considered according to Saunders et al. (2007) are that it should contain the covering letter
and the presentation of the questionnaire should be good enough to get high response rates.
There are six main stages of a postal questionnaire. The first stage of postal questionnaires is
that the questions along with cover letter should be printed. Secondly, the recipients should be
contacted in advance either by telephone, email or by post and should be informed about
filling in the survey questionnaire. Thirdly, both the questionnaire and the covering letter
should be posted along with the self-addressed return envelope. The main purpose of this is to
get more responses as public holidays may affect this process. During the fourth stage, the
respondents were followed-up immediately after the first week of postal questionnaires. This
was done to thank the participants who responded to the questionnaires and to motivate others
to fill in the survey forms. If they still have not responded to the survey forms, then they
should follow-up again after three weeks with the process identical to first one. The stage
should be avoided as it would be difficult to analyse the actual participants.
100
To make use of the third follow-up, the response should be less than the expected one. To
make this stage fruitful the researcher should track the record of the post or email them or
telephone them to explain to them on how their replies could be beneficial for the research
and other prospects. Furthermore, DeVaus (2001) as cited by Saunders et al. (2007) suggested
that it would be useful to allot a distinctive number that could be helpful to keep the record of
the participants and to follow-up the non-respondents. On the other hand, Dillman (2007)
contradicted this idea and mentioned that it would have less influence on the response rate.
Keeping in view all the stages the researcher is able to get the high response rate; this is
discussed further in section 4.11.4.
4.14.4 Response Rate
To collect data from the employees of both the public and private sectors of the
manufacturing companies, a total of 196 survey questionnaires were posted to the
respondents, out of which the total number of 170 responded. This means that the response
rate at 86% was good enough to represent the population while the remaining 14% of the
respondents did not respond and hence were not further considered for the data analysis
phase.
4.15 Confirmatory Factor Analysis
The confirmatory factor analysis is adopted in this study as this technique helps to test the
designed hypothesis relationships between the dependent and independent variables.
According to Suhr (2006) this technique should be used when the research is based on an
existing theory or previous study. The confirmatory factor analysis (CFA) is directly
influenced by number of factors such as the sample size i.e. 15-20 participants per variable,
the hypothesized relationships being tested, outliers, multivariate normality, missing data,
measurement instruments, interpretation of model fit indices as suggested by Schumacker and
Lomax (1996). Various steps are involved to achieve successful CFA.
Firstly, the researcher should review the literature of an applied theory. Secondly, the
specification and determination of the model along with the collection and conduction of
preliminary analysis is done. Lastly, is the assessing the model-fit via results (Suhr, 2006).
Another type of factor analysis is the exploratory factor analysis which is used when the CFA
101
fails to prove the model fitness. However, in this study the researcher opts to use CFA which
can be seen in chapter five.
4.16 Multiple Regression Analysis
This study adopts a multiple regression analysis to test if salary, co-workers, job security,
supervision, working conditions, task significance, work environment, promotion, work itself,
achievement, recognition and responsibility possess significant positive relationships with the
job satisfaction. Tabachnick and Fidell (2001) stated that multiple regression analysis is not
only a single procedure but a set of procedures used to investigate the relationships between
the dependent and independent variables, or a set of predictors. There are two main types of
regression analysis namely: standard regression equation and multiple regression analysis.
The standard regression equation is used to compute the value of a dependent variable using a
single independent variable whereas in multiple regression analysis the value of a dependent
variable is examined based on some independent variables. Since this research has a set of
different independent variables, the researcher adopts the multiple regression technique for
the hypothesis testing. Multiple regression analysis is also known as ordinary least squares
(OLS).
The equation used to predict the model fitness is run automatically with the application of
software calculations; it is of the key point to comprehend the formula of multiple regression
equation which is written as Y= β0 +β1 X1 +β2 X2+....βnXn+ є. Where Y represents the
dependent variable, β0 is the intercept value of the regression equation; β is the coefficient
value, X represents the value of independent variable and є is the error term of the regression
equation (Andersen, 2008). However, it is important to consider the assumptions of multiple
regression analysis as it is “one of the fussier of the statistical techniques” (Pallant, 2005,
p.142). The details of these assumptions are given as follows:
4.16.1 Sample Size
Different researchers have given various opinions based on the sample size to be used in
multiple regression analysis. The most used formula for calculating the number for cases for
independent variables can be calculated by the formula (N>50+8m). In this case, m represents
the value of independent factors (Tabachnick and Fidell, 2001, p.117). This means that 146

102
observations are required when the number of independent variables is twelve. Hence, this
research is confident that its sample size is good enough to represent the results.
On the other hand, Stevens (1996, p.72) argued that approximately fifteen participants are
good enough to represent the results of a regression equation. Whereas, Pallant (2007) stated
that more samples are required depending on the nature of the dependent variable whether it
is skewed or not, and likewise forty observations are required for the stepwise regression
analysis. This shows that it is not appropriate to use multiple regression analysis when the
sample size is small.
4.16.2 Multicollinearity
Multicollinearity is often considered as the problematic term which occurs when independent
variables represent high correlation approximately by .09. Therefore, it is important to clean
the data using data screening process which will be explained in chapter five of this thesis.
The main reason to avoid the multicollinearity issue is that it creates problem to interpret the
results of the regression model (Field, 2009).
4.16.3 Outliers
The outliers are of high concern as they have a direct impact on the multiple regression
analysis results. Pallant (2005) stated that the outliers should be checked for both the
dependent variable and independent variables. However, there are different opinions of the
authors regarding its removal from the data. Various scientists stated that by removing the
outliers the regression results would be appropriate and acceptable (Tabachnick and Fidell,
2001). While, some researchers argue that the outliers should be retained for they change the
meaning of the data for they could contain some important information (Acuña & Rodriguez,
2004). This will be further discussed in chapter five of this thesis.
4.17 Independent Sample T-Test (Group Difference Test)
The difference between the groups helps to find out if the responses of the groups differ
significantly or not. The nature of the group difference depends on upon the group number
within the population. The first type to check the difference between the groups is known as
Analysis of Variance (ANOVA) which is applied when there are more than two groups
103
within the population. The second type of difference group test is used when there are only
two groups. There are two types of tests namely: z-test and t-test that can be used to find out
the differences between the two groups.
Based on the utilisation of the correct test McCluskey and Lalkhen (2007) stated that t-test
could be used when there is not enough data; in other words when there is only a small
sample size. The standard deviation of the population is unknown whereas; z-test is used
when the standard deviation is known.
In this thesis, researcher adopted the t-test to find out the difference between the public and
the private sector employees of manufacturing companies in Pakistan. However, according to
Pallant (2005) following assumptions of independent t-test should be considered:
1. The dependent variable should be measured on a continuous scale.
2. The independent variable should consist of two separate groups.
3. Independence of observation.
4. There should be no significant outliers.
5. The data should normally be distributed.
6. There should be the homogeneity of variance.
Based on these assumptions, this study has adopted a t-test to see the difference between the
two groups.
4.18 Ethical Considerations
Before the conduction of data, it is essential for the researcher to review the principles of
ethics. Halepota (2011) explained the importance of ethics by stating that ethical
considerations work in the chain form which starts from the title of the research till the
evaluation of the results which means that the ethics process ensures that the participants
should have the full knowledge of the data usage and the aim of the study. In few types of
researches, scientists use the data available to them which could sometimes go against the
rules of ethics and give rise to ethical issues. Most of the scholars mainly focus on the use of
ethics in the research and consider ethics as the way of focussing “on the disciplines that
study standards of conduct such as philosophy, theology, law, psychology, or sociology”
104
(Resnik, 2015). This suggests that ethics are the norms that need to be considered before
conducting the research.
Different factors are associated with ethics which may vary according to Cohen et al. (2007)
regarding the ages of the respondents on which the research is being conducted and the nature
of the subject. To abide by the rules and regulations of ethics, the researcher considers all the
principles of ethics in this study. In accordance with this, the researcher took permission from
the managers of the public and private sector companies well in advance to carry out the
survey with the employees. The questionnaire was distributed to the employees via a personal
appearance, and some survey forms were given to the employees through the post. Before
conducting the survey, each participant was given freedom to participate in the survey
according to their will and was allowed to quit from this study if they desired to do so. During
the process of data collection, the participants were handed with a consent form in which their
rights were assured along with the main purpose of the study. The following rights were
explained to the respondents in the consent form.
1. Confidentiality
The participants were provided with information along with survey form in which it was
guaranteed that the information they will provide will be protected and will be confidential.
For this prospect, Cardiff Metropolitan University ethics guidelines were followed which
were viewed and signed by the research degree committee and supervisors to make sure the
rights of the participants are protected. Moreover, the researcher explained in the consent
form elements like the title of the research, the aim of the study, the school name and the
respondents were assured that the information they will provide would be used for the
academic purposes only. Along with that it also provided the information that will be
published and which information will not be shared with another party.
2. Participant’s Protection
Another important factor of ethics includes the protection of the respondents. In this study,
the researcher informed the participants that they will not be harmed or deceived and if they
think they are being harmed, or any have any query they could contact the Research Degree
Committee (RDC) or the researcher. For this purpose, the participants were provided with the
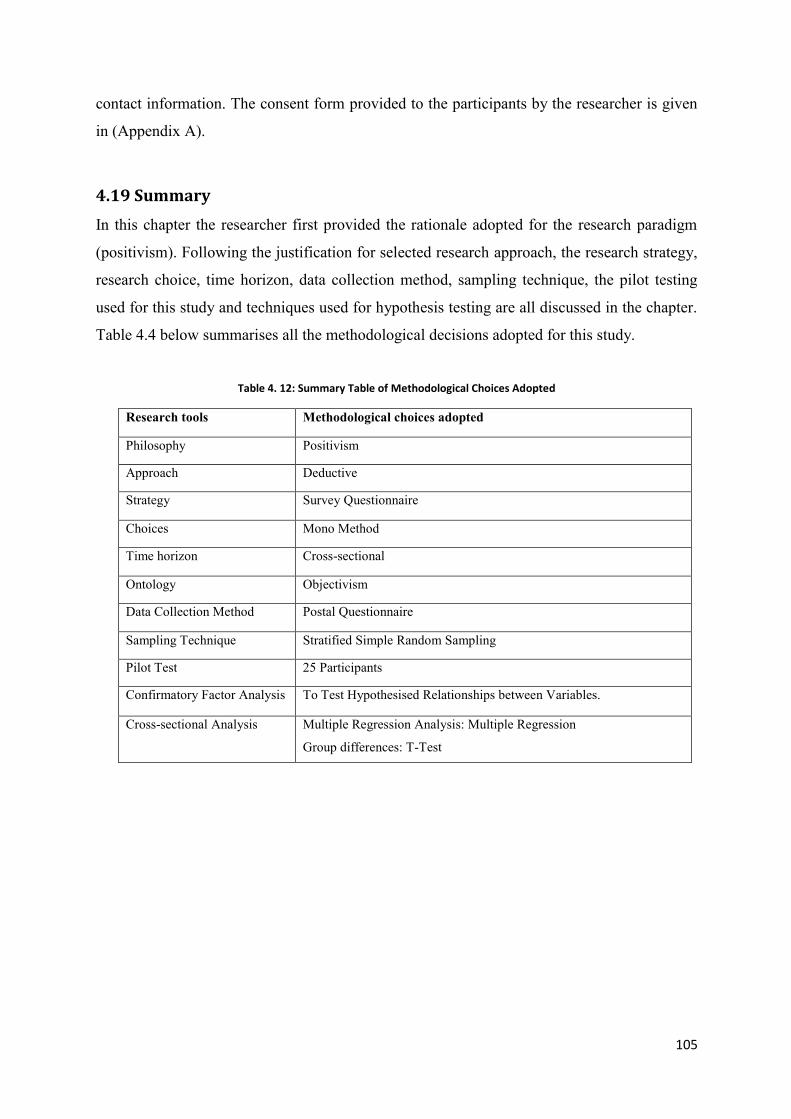
105
contact information. The consent form provided to the participants by the researcher is given
in (Appendix A).
4.19 Summary
In this chapter the researcher first provided the rationale adopted for the research paradigm
(positivism). Following the justification for selected research approach, the research strategy,
research choice, time horizon, data collection method, sampling technique, the pilot testing
used for this study and techniques used for hypothesis testing are all discussed in the chapter.
Table 4.4 below summarises all the methodological decisions adopted for this study.
Table 4. 12: Summary Table of Methodological Choices Adopted
Research tools Methodological choices adopted
Philosophy Positivism
Approach Deductive
Strategy Survey Questionnaire
Choices Mono Method
Time horizon Cross-sectional
Ontology Objectivism
Data Collection Method Postal Questionnaire
Sampling Technique Stratified Simple Random Sampling
Pilot Test 25 Participants
Confirmatory Factor Analysis To Test Hypothesised Relationships between Variables.
Cross-sectional Analysis Multiple Regression Analysis: Multiple Regression
Group differences: T-Test
106
Chapter Five: Findings, Analysis and Hypothesis Testing
5.1. Introduction
This chapter presents the findings, results, analysis and discusses different statistical
techniques that are used to find the correlation between the dependent variable i.e. job
satisfaction and the independent factors which include salary, co-workers, job security,
supervision, working conditions, task significance, work environment, promotion, work itself,
achievement, recognition and responsibility. For the accomplishment of the research
objectives, the researcher first identifies and then discusses the results based on the
relationship between job satisfaction and the independent factors.
The researcher adopts the quantitative technique for this study which is achievable with the
help of survey tools. The application of this instrument was utilised in gathering the data from
managerial and non-managerial employees of the public and private sector manufacturing
companies of Pakistan. In short, the researcher focuses on the utilisation of the techniques
which helps in examining the results of the data analysis. For this purpose, the researcher uses
the Statistical Package for Social Science (SPSS) version 20. In this chapter, the researcher
presents the results obtained using various statistical approaches like the perception of
respondent’s towards job satisfaction, preliminary analysis and inferential statistics followed
by reliability analysis, Pearson correlation, multiple regression analysis and T-Test. Before
the analysis of the data, it is vital to carry out data screening steps followed by missing data,
linearity, normality and multicollinearity. In addition, a confirmatory factor analysis was also
performed to test the hypothesised relationship between job satisfaction and the independent
variables. This is discussed in the coming section of the chapter.
5.2 Reliability Analysis
Before the conduction of the reliability test, it is paramount to know the use of multi-item
scales. Churchill (1979) stated that the analysis of the multi-item scale is very beneficial in
providing knowledge about the reliability and the internal consistency of the measurement
scale. Similarly, Snijders and Bosker (1999) stated that the multi-item scale is superior to a
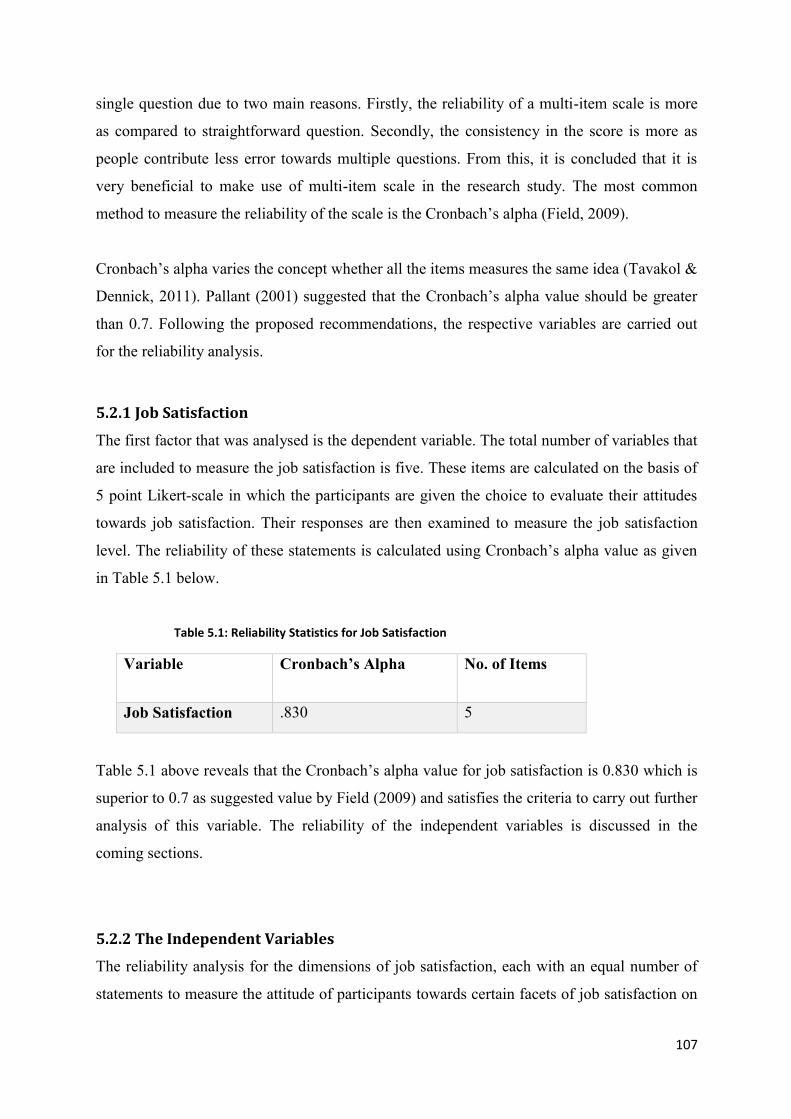
107
single question due to two main reasons. Firstly, the reliability of a multi-item scale is more
as compared to straightforward question. Secondly, the consistency in the score is more as
people contribute less error towards multiple questions. From this, it is concluded that it is
very beneficial to make use of multi-item scale in the research study. The most common
method to measure the reliability of the scale is the Cronbach’s alpha (Field, 2009).
Cronbach’s alpha varies the concept whether all the items measures the same idea (Tavakol &
Dennick, 2011). Pallant (2001) suggested that the Cronbach’s alpha value should be greater
than 0.7. Following the proposed recommendations, the respective variables are carried out
for the reliability analysis.
5.2.1 Job Satisfaction
The first factor that was analysed is the dependent variable. The total number of variables that
are included to measure the job satisfaction is five. These items are calculated on the basis of
5 point Likert-scale in which the participants are given the choice to evaluate their attitudes
towards job satisfaction. Their responses are then examined to measure the job satisfaction
level. The reliability of these statements is calculated using Cronbach’s alpha value as given
in Table 5.1 below.
Table 5.1: Reliability Statistics for Job Satisfaction
Variable Cronbach’s Alpha No. of Items
Job Satisfaction .830 5
Table 5.1 above reveals that the Cronbach’s alpha value for job satisfaction is 0.830 which is
superior to 0.7 as suggested value by Field (2009) and satisfies the criteria to carry out further
analysis of this variable. The reliability of the independent variables is discussed in the
coming sections.
5.2.2 The Independent Variables
The reliability analysis for the dimensions of job satisfaction, each with an equal number of
statements to measure the attitude of participants towards certain facets of job satisfaction on
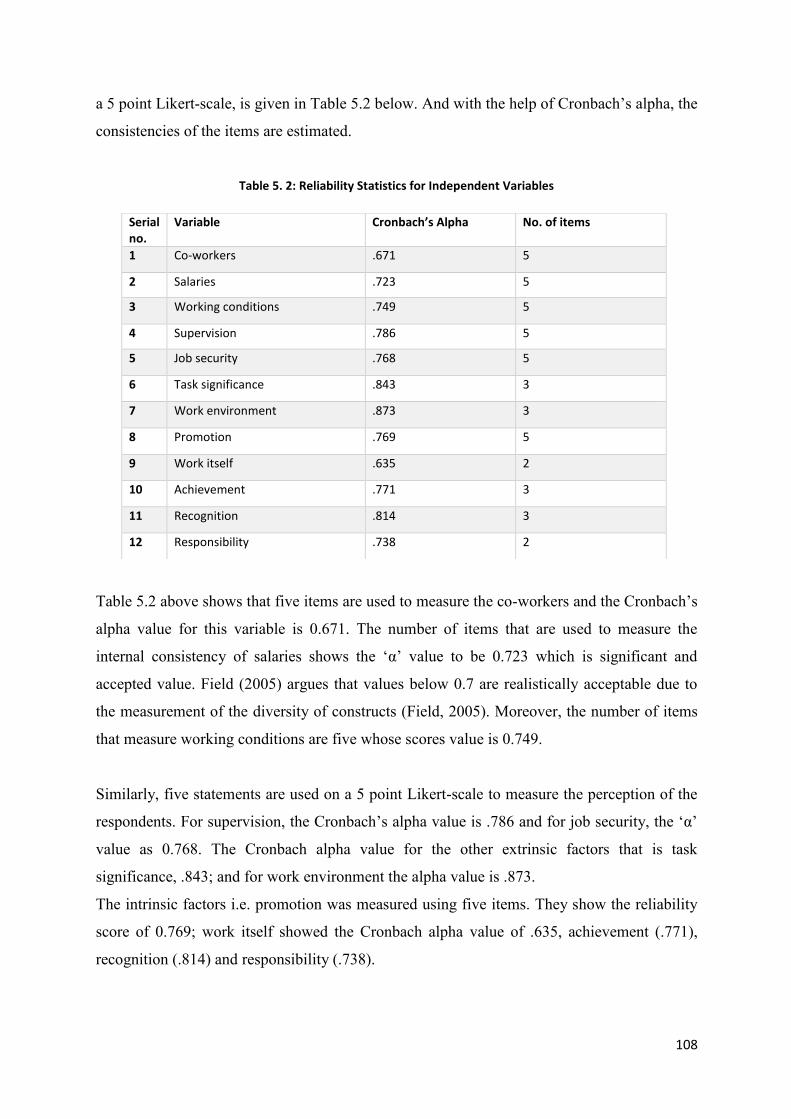
108
a 5 point Likert-scale, is given in Table 5.2 below. And with the help of Cronbach’s alpha, the
consistencies of the items are estimated.
Table 5. 2: Reliability Statistics for Independent Variables
Table 5.2 above shows that five items are used to measure the co-workers and the Cronbach’s
alpha value for this variable is 0.671. The number of items that are used to measure the
internal consistency of salaries shows the ‘α’ value to be 0.723 which is significant and
accepted value. Field (2005) argues that values below 0.7 are realistically acceptable due to
the measurement of the diversity of constructs (Field, 2005). Moreover, the number of items
that measure working conditions are five whose scores value is 0.749.
Similarly, five statements are used on a 5 point Likert-scale to measure the perception of the
respondents. For supervision, the Cronbach’s alpha value is .786 and for job security, the ‘α’
value as 0.768. The Cronbach alpha value for the other extrinsic factors that is task
significance, .843; and for work environment the alpha value is .873.
The intrinsic factors i.e. promotion was measured using five items. They show the reliability
score of 0.769; work itself showed the Cronbach alpha value of .635, achievement (.771),
recognition (.814) and responsibility (.738).
Serial no.
Variable Cronbach’s Alpha No. of items
1 Co-workers .671 5
2 Salaries .723 5
3 Working conditions .749 5
4 Supervision .786 5
5 Job security .768 5
6 Task significance .843 3
7 Work environment .873 3
8 Promotion .769 5
9 Work itself .635 2
10 Achievement .771 3
11 Recognition .814 3
12 Responsibility .738 2
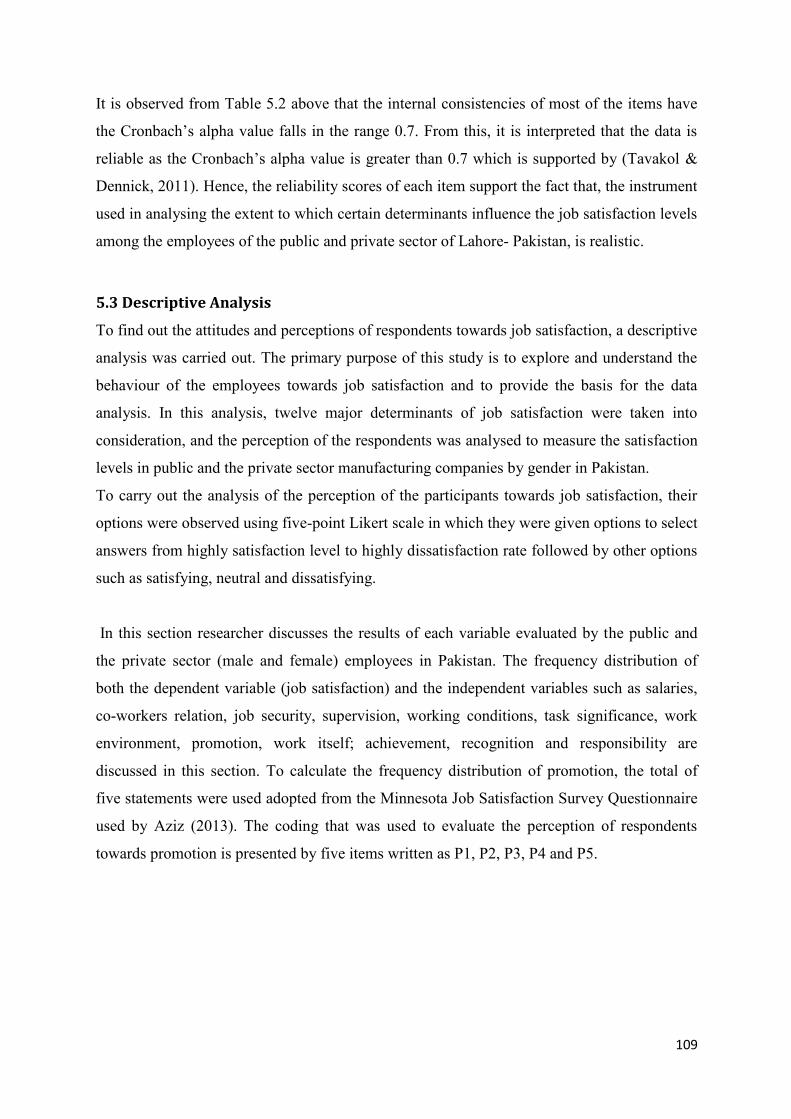
109
It is observed from Table 5.2 above that the internal consistencies of most of the items have
the Cronbach’s alpha value falls in the range 0.7. From this, it is interpreted that the data is
reliable as the Cronbach’s alpha value is greater than 0.7 which is supported by (Tavakol &
Dennick, 2011). Hence, the reliability scores of each item support the fact that, the instrument
used in analysing the extent to which certain determinants influence the job satisfaction levels
among the employees of the public and private sector of Lahore- Pakistan, is realistic.
5.3 Descriptive Analysis
To find out the attitudes and perceptions of respondents towards job satisfaction, a descriptive
analysis was carried out. The primary purpose of this study is to explore and understand the
behaviour of the employees towards job satisfaction and to provide the basis for the data
analysis. In this analysis, twelve major determinants of job satisfaction were taken into
consideration, and the perception of the respondents was analysed to measure the satisfaction
levels in public and the private sector manufacturing companies by gender in Pakistan.
To carry out the analysis of the perception of the participants towards job satisfaction, their
options were observed using five-point Likert scale in which they were given options to select
answers from highly satisfaction level to highly dissatisfaction rate followed by other options
such as satisfying, neutral and dissatisfying.
In this section researcher discusses the results of each variable evaluated by the public and
the private sector (male and female) employees in Pakistan. The frequency distribution of
both the dependent variable (job satisfaction) and the independent variables such as salaries,
co-workers relation, job security, supervision, working conditions, task significance, work
environment, promotion, work itself; achievement, recognition and responsibility are
discussed in this section. To calculate the frequency distribution of promotion, the total of
five statements were used adopted from the Minnesota Job Satisfaction Survey Questionnaire
used by Aziz (2013). The coding that was used to evaluate the perception of respondents
towards promotion is presented by five items written as P1, P2, P3, P4 and P5.
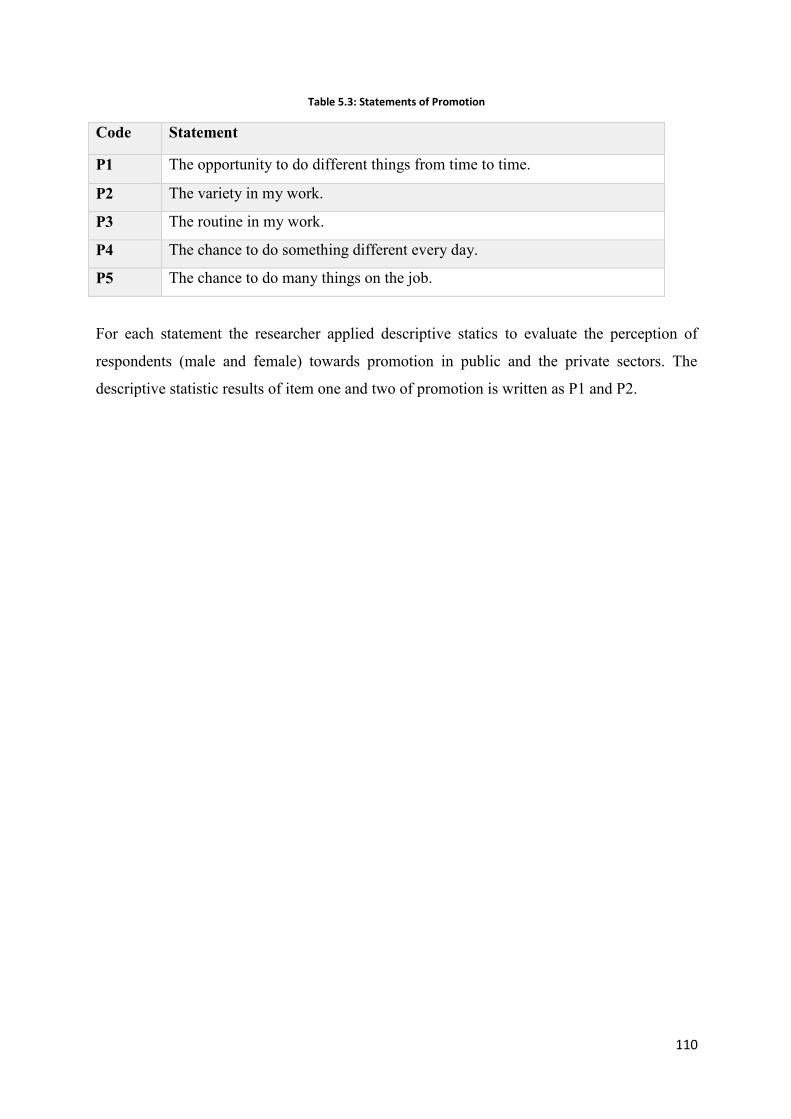
110
Table 5.3: Statements of Promotion
Code Statement
P1 The opportunity to do different things from time to time.
P2 The variety in my work.
P3 The routine in my work.
P4 The chance to do something different every day.
P5 The chance to do many things on the job.
For each statement the researcher applied descriptive statics to evaluate the perception of
respondents (male and female) towards promotion in public and the private sectors. The
descriptive statistic results of item one and two of promotion is written as P1 and P2.

111
Table 5.4: Perception of Employees towards Statement 1 and 2 of Promotion in Public and Private Sectors
P2: The variety in my work.
gender Sector Frequency Percent Valid Percent Cumulative Percent
male
Public Valid
Dissatisfied 1 1.5 1.5 1.5 Neutral 8 11.9 11.9 13.4 Satisfied 17 25.4 25.4 38.8 Highly satisfied 41 61.2 61.2 100.0 Total 67 100.0 100.0
Private Valid
Highly dissatisfied 2 2.7 2.7 2.7 Dissatisfied 2 2.7 2.7 5.5 Neutral 11 15.1 15.1 20.5 Satisfied 50 68.5 68.5 89.0 Highly satisfied 8 11.0 11.0 100.0 Total 73 100.0 100.0
female
Public Valid
Neutral 2 11.8 11.8 11.8 Satisfied 3 17.6 17.6 29.4 Highly satisfied 12 70.6 70.6 100.0 Total 17 100.0 100.0
Private Valid
Neutral 2 15.4 15.4 15.4 Satisfied 9 69.2 69.2 84.6 Highly satisfied 2 15.4 15.4 100.0 Total 13 100.0 100.0
P1: The opportunity to do different things from time to time. gender sector Frequency Percent Valid Percent Cumulative
Percent
male
public Valid
Dissatisfied 1 1.5 1.5 1.5 Neutral 14 20.9 20.9 22.4 Satisfied 20 29.9 29.9 52.2 Highly satisfied 32 47.8 47.8 100.0 Total 67 100.0 100.0
private Valid
Highly dissatisfied 2 2.7 2.7 2.7 Neutral 2 2.7 2.7 5.5 Satisfied 49 67.1 67.1 72.6 Highly satisfied 20 27.4 27.4 100.0 Total 73 100.0 100.0
female
public Valid
Neutral 4 23.5 23.5 23.5 Satisfied 4 23.5 23.5 47.1 Highly satisfied 9 52.9 52.9 100.0 Total 17 100.0 100.0
private Valid
Neutral 2 15.4 15.4 15.4 Satisfied 8 61.5 61.5 76.9 Highly satisfied 3 23.1 23.1 100.0 Total 13 100.0 100.0
112
From the above mentioned results of P1 it is demonstrated that male respondents in the public
sector were highly satisfied with the item one which is promotion as compared to the private
sector. And the level of high dissatisfaction was 2.7% whereas, in the public sector, male
employees did not show dissatisfaction levels highly. This indicates that male participants were
more satisfied with this statement of promotion than the private sector male respondents.
Similarly, female participants in the public sector showed 52.9 percentage of high satisfaction
rate as compared to female respondents. However, in both sectors, female respondents did not
show a negative attitude towards the particular statement of promotion. Hence, it is recorded
that the public sector employees were highly satisfied with the statement “The opportunity to
do different things from time to time” (Aziz, 2013, p.176) as compared to the private sector
employees whereas, male participants were highly satisfied as compared to female participants.
The evaluation of the responses towards the second item of promotion (P2) revealed depicted
that male respondents in the public sector were highly satisfied with 61.2%, and the private
sector male participants showed only 11.0% of attitude towards high satisfaction level of the
second statement of promotion i.e. “The variety in my work” (Aziz, 2013, p.176). On the other
hand, the percentage of male respondents in the private sector was 2.7% as compared to the
public sector. The frequency of female participants for the item (P2) was also recorded to be
highly satisfied (70.6%) as compared to female participants in the private sector with only
15.4%. Hence, it is clear from the above descriptive statistics table that male and female
participants were highly satisfied with the second item of promotion than the male and female
employees of the private sector. The evaluation for item three and four of promotion are given
as follows:

113
Table 5.5: Perception of Employees towards Statement 3 and 4 of Promotion in Public and Private Sectors
P4: The chance to do something different every day.
P3: The routine in my work. gender sector Frequency Percent Valid Percent Cumulative
Percent
male
public Valid
Dissatisfied 1 1.5 1.5 1.5 Neutral 9 13.4 13.4 14.9 Satisfied 18 26.9 26.9 41.8 Highly satisfied 39 58.2 58.2 100.0 Total 67 100.0 100.0
private Valid
Highly dissatisfied 1 1.4 1.4 1.4 Dissatisfied 1 1.4 1.4 2.7 Neutral 11 15.1 15.1 17.8 Satisfied 47 64.4 64.4 82.2 Highly satisfied 13 17.8 17.8 100.0 Total 73 100.0 100.0
female
public Valid
Neutral 5 29.4 29.4 29.4 Satisfied 3 17.6 17.6 47.1 Highly satisfied 9 52.9 52.9 100.0 Total 17 100.0 100.0
private Valid
Neutral 3 23.1 23.1 23.1 Satisfied 6 46.2 46.2 69.2 Highly satisfied 4 30.8 30.8 100.0 Total 13 100.0 100.0
gender sector Frequency Percent Valid Percent Cumulative Percent
male
public Valid
Dissatisfied 1 1.5 1.5 1.5 Neutral 10 14.9 14.9 16.4 Satisfied 16 23.9 23.9 40.3 Highly satisfied 40 59.7 59.7 100.0 Total 67 100.0 100.0
private Valid
Highly dissatisfied 1 1.4 1.4 1.4 Dissatisfied 6 8.2 8.2 9.6 Neutral 25 34.2 34.2 43.8 Satisfied 37 50.7 50.7 94.5 Highly satisfied 4 5.5 5.5 100.0 Total 73 100.0 100.0
female
public Valid
Neutral 4 23.5 23.5 23.5 Satisfied 4 23.5 23.5 47.1 Highly satisfied 9 52.9 52.9 100.0 Total 17 100.0 100.0
private Valid
Dissatisfied 1 7.7 7.7 7.7 Neutral 5 38.5 38.5 46.2 Satisfied 4 30.8 30.8 76.9 Highly satisfied 3 23.1 23.1 100.0 Total 13 100.0 100.0

114
Table 5.5 illustrates that male employees in the public sector were more satisfied with the
third item of promotion showing a 58.2% satisfaction level as compared to the private sector
with the frequency of 13 responses with the value of 17.8%. In terms of female participants
the degree of high satisfaction was also recorded high for the public sector employees with
the value of 52.9% as compared to female respondents in the private sector with the value of
30.8%. This shows both male and female participants in the public sector were highly
satisfied with the statement “The routine in my work” (Aziz, 2013, p. 176).
The above mentioned results of P4 results show the evaluation of the responses towards the
fourth item of promotion. It is depicted that 59.7% of the male respondents were highly
satisfied with the statement of P4 i.e. “The chance to do something different everyday” (Aziz,
2013, p. 176). Whereas, 50.7% of the private sector male participants were highly satisfied
with the respective item of promotion. Similarly, for the female participants of the public
sector the percentage of highly satisfaction level for P4 is 52.9% as compared to female
participants in the private sector with the value of 23.1%. On the other hand 7.7%
dissatisfaction rate was recorded for the private sector female employees and 0% was
recorded for the public sector female employees. From this is depicted that both male and
female employees of the public sector were highly satisfied the given statement of promotion
as compared to male and female respondents of the private sector. In the next table researcher
presents the results of the fifth statement of promotion and the findings are given as follows:
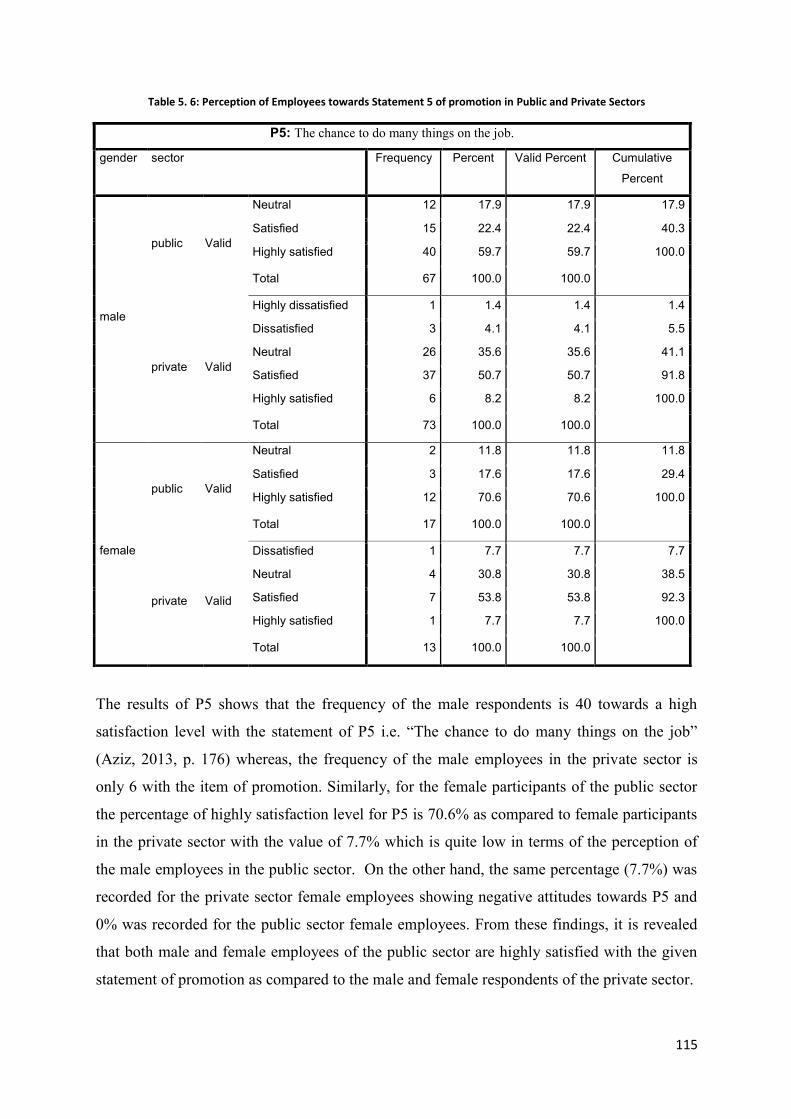
115
Table 5. 6: Perception of Employees towards Statement 5 of promotion in Public and Private Sectors
P5: The chance to do many things on the job.
gender sector Frequency Percent Valid Percent Cumulative
Percent
male
public Valid
Neutral 12 17.9 17.9 17.9
Satisfied 15 22.4 22.4 40.3
Highly satisfied 40 59.7 59.7 100.0
Total 67 100.0 100.0
private Valid
Highly dissatisfied 1 1.4 1.4 1.4
Dissatisfied 3 4.1 4.1 5.5
Neutral 26 35.6 35.6 41.1
Satisfied 37 50.7 50.7 91.8
Highly satisfied 6 8.2 8.2 100.0
Total 73 100.0 100.0
female
public Valid
Neutral 2 11.8 11.8 11.8
Satisfied 3 17.6 17.6 29.4
Highly satisfied 12 70.6 70.6 100.0
Total 17 100.0 100.0
private Valid
Dissatisfied 1 7.7 7.7 7.7
Neutral 4 30.8 30.8 38.5
Satisfied 7 53.8 53.8 92.3
Highly satisfied 1 7.7 7.7 100.0
Total 13 100.0 100.0
The results of P5 shows that the frequency of the male respondents is 40 towards a high
satisfaction level with the statement of P5 i.e. “The chance to do many things on the job”
(Aziz, 2013, p. 176) whereas, the frequency of the male employees in the private sector is
only 6 with the item of promotion. Similarly, for the female participants of the public sector
the percentage of highly satisfaction level for P5 is 70.6% as compared to female participants
in the private sector with the value of 7.7% which is quite low in terms of the perception of
the male employees in the public sector. On the other hand, the same percentage (7.7%) was
recorded for the private sector female employees showing negative attitudes towards P5 and
0% was recorded for the public sector female employees. From these findings, it is revealed
that both male and female employees of the public sector are highly satisfied with the given
statement of promotion as compared to the male and female respondents of the private sector.
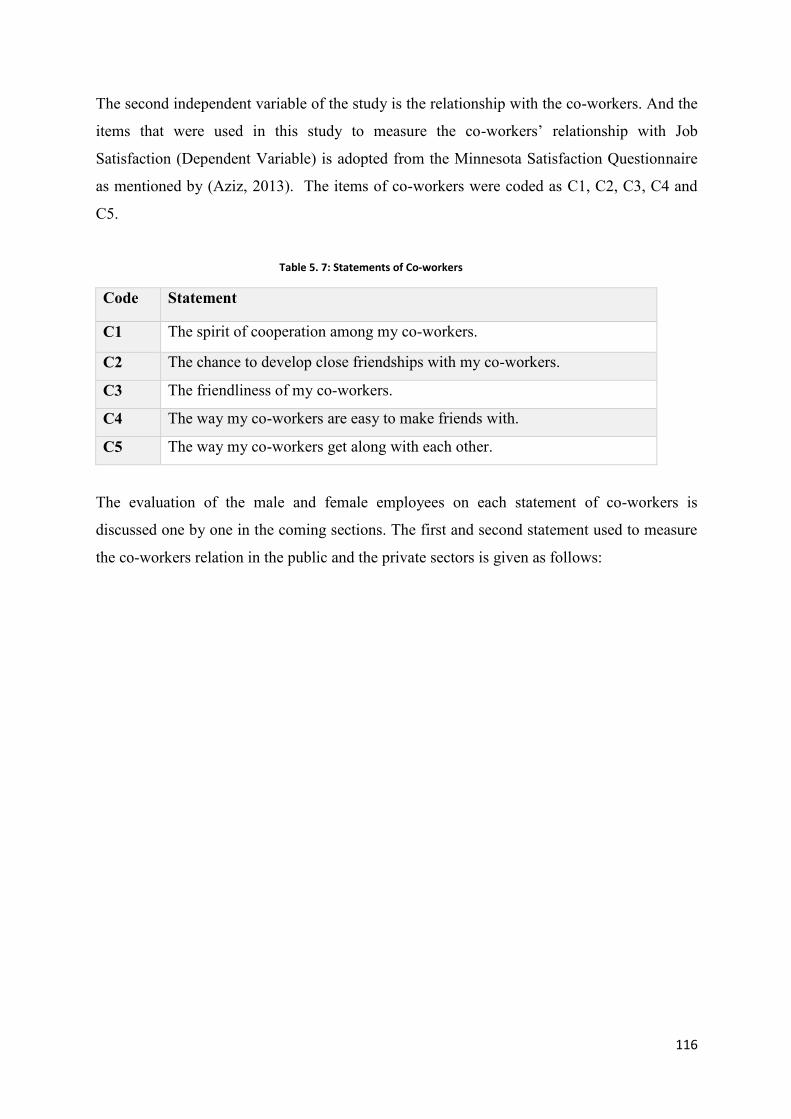
116
The second independent variable of the study is the relationship with the co-workers. And the
items that were used in this study to measure the co-workers’ relationship with Job
Satisfaction (Dependent Variable) is adopted from the Minnesota Satisfaction Questionnaire
as mentioned by (Aziz, 2013). The items of co-workers were coded as C1, C2, C3, C4 and
C5.
Table 5. 7: Statements of Co-workers
Code Statement
C1 The spirit of cooperation among my co-workers.
C2 The chance to develop close friendships with my co-workers.
C3 The friendliness of my co-workers.
C4 The way my co-workers are easy to make friends with.
C5 The way my co-workers get along with each other.
The evaluation of the male and female employees on each statement of co-workers is
discussed one by one in the coming sections. The first and second statement used to measure
the co-workers relation in the public and the private sectors is given as follows:
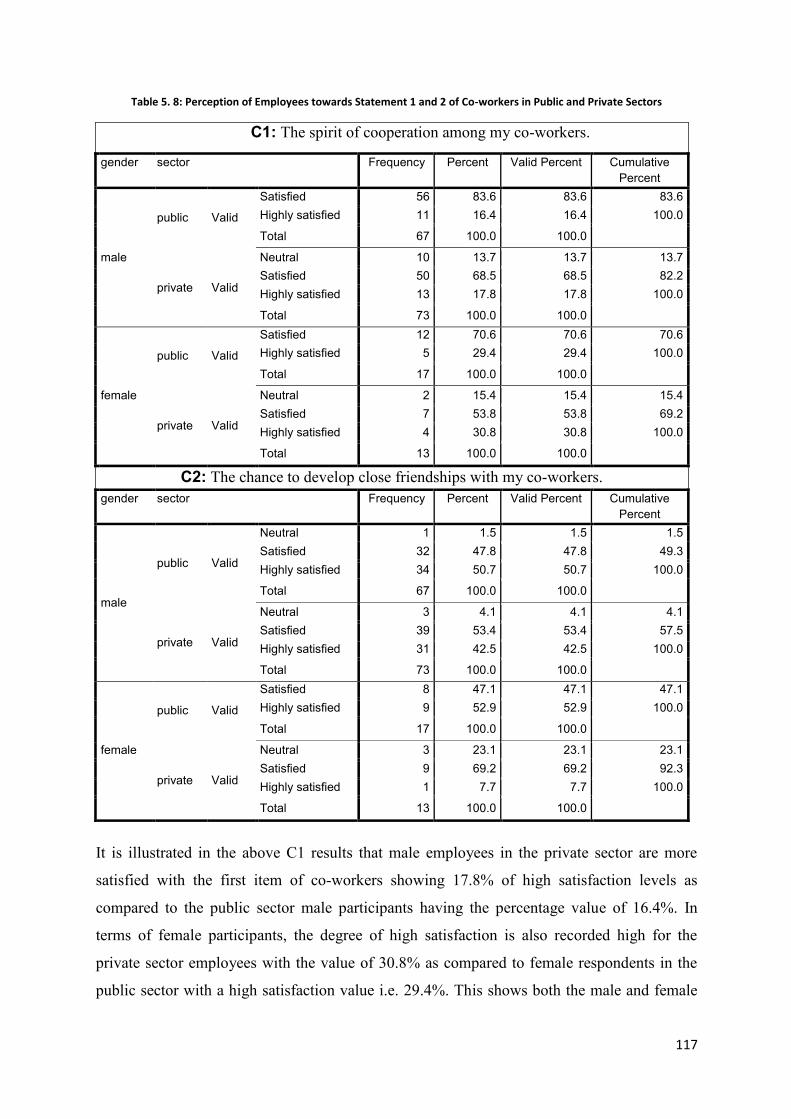
117
Table 5. 8: Perception of Employees towards Statement 1 and 2 of Co-workers in Public and Private Sectors
C1: The spirit of cooperation among my co-workers.
gender sector Frequency Percent Valid Percent Cumulative Percent
male
public Valid
Satisfied 56 83.6 83.6 83.6 Highly satisfied 11 16.4 16.4 100.0
Total 67 100.0 100.0
private Valid
Neutral 10 13.7 13.7 13.7 Satisfied 50 68.5 68.5 82.2 Highly satisfied 13 17.8 17.8 100.0
Total 73 100.0 100.0
female
public Valid
Satisfied 12 70.6 70.6 70.6 Highly satisfied 5 29.4 29.4 100.0
Total 17 100.0 100.0
private Valid
Neutral 2 15.4 15.4 15.4 Satisfied 7 53.8 53.8 69.2 Highly satisfied 4 30.8 30.8 100.0
Total 13 100.0 100.0 C2: The chance to develop close friendships with my co-workers.
gender sector Frequency Percent Valid Percent Cumulative Percent
male
public Valid
Neutral 1 1.5 1.5 1.5 Satisfied 32 47.8 47.8 49.3 Highly satisfied 34 50.7 50.7 100.0
Total 67 100.0 100.0
private Valid
Neutral 3 4.1 4.1 4.1 Satisfied 39 53.4 53.4 57.5 Highly satisfied 31 42.5 42.5 100.0
Total 73 100.0 100.0
female
public Valid
Satisfied 8 47.1 47.1 47.1 Highly satisfied 9 52.9 52.9 100.0
Total 17 100.0 100.0
private Valid
Neutral 3 23.1 23.1 23.1 Satisfied 9 69.2 69.2 92.3 Highly satisfied 1 7.7 7.7 100.0
Total 13 100.0 100.0 It is illustrated in the above C1 results that male employees in the private sector are more
satisfied with the first item of co-workers showing 17.8% of high satisfaction levels as
compared to the public sector male participants having the percentage value of 16.4%. In
terms of female participants, the degree of high satisfaction is also recorded high for the
private sector employees with the value of 30.8% as compared to female respondents in the
public sector with a high satisfaction value i.e. 29.4%. This shows both the male and female
118
participants in the private sector are highly satisfied with the statement “The spirit of
cooperation among my co-workers” (Aziz, 2013, p. 176).
Whereas, the results of C2 mentioned above demonstrated that male participants were highly
satisfied (50.7%) with second statement of co-workers as compared to male respondents of
the private sector. Whereas, 47.8% were satisfied in the public sector, 53.4% were satisfied in
the private sector. Furthermore, only 1.5% of the male respondents in the public sector and
4.1% male participants in the private sector were neither satisfied nor dissatisfied. Hence,
from the findings of the frequency distribution of the male participants in the public and the
private sectors reveal that the public sector male employees are highly satisfied with
statement 2 which states that “The chance to develop close friendships with co-workers”
(Aziz, 2013).
Female participants in the public sector were 52.9% highly satisfied as compared to the
female participants in the private sector showing only 7.7% of high satisfaction rates.
However, female employees in the private sector showed high satisfaction rates (69.2%) as
compared to female employees in the public sector. The statistics of the third and fourth
statement of co-workers relationship with job satisfaction among male and female employees
in the public and the private sectors is given as follows:
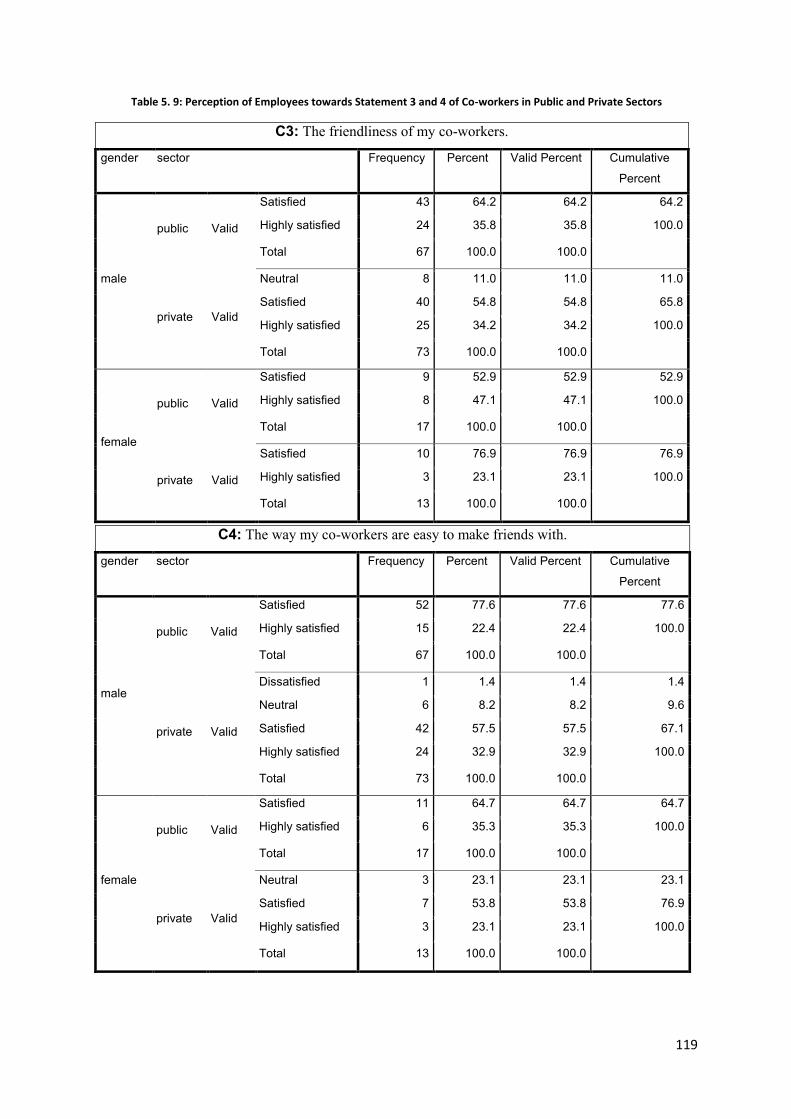
119
Table 5. 9: Perception of Employees towards Statement 3 and 4 of Co-workers in Public and Private Sectors
C3: The friendliness of my co-workers.
gender sector Frequency Percent Valid Percent Cumulative
Percent
male
public Valid
Satisfied 43 64.2 64.2 64.2
Highly satisfied 24 35.8 35.8 100.0
Total 67 100.0 100.0
private Valid
Neutral 8 11.0 11.0 11.0
Satisfied 40 54.8 54.8 65.8
Highly satisfied 25 34.2 34.2 100.0
Total 73 100.0 100.0
female
public Valid
Satisfied 9 52.9 52.9 52.9
Highly satisfied 8 47.1 47.1 100.0
Total 17 100.0 100.0
private Valid
Satisfied 10 76.9 76.9 76.9
Highly satisfied 3 23.1 23.1 100.0
Total 13 100.0 100.0
C4: The way my co-workers are easy to make friends with.
gender sector Frequency Percent Valid Percent Cumulative
Percent
male
public Valid
Satisfied 52 77.6 77.6 77.6
Highly satisfied 15 22.4 22.4 100.0
Total 67 100.0 100.0
private Valid
Dissatisfied 1 1.4 1.4 1.4
Neutral 6 8.2 8.2 9.6
Satisfied 42 57.5 57.5 67.1
Highly satisfied 24 32.9 32.9 100.0
Total 73 100.0 100.0
female
public Valid
Satisfied 11 64.7 64.7 64.7
Highly satisfied 6 35.3 35.3 100.0
Total 17 100.0 100.0
private Valid
Neutral 3 23.1 23.1 23.1
Satisfied 7 53.8 53.8 76.9
Highly satisfied 3 23.1 23.1 100.0
Total 13 100.0 100.0
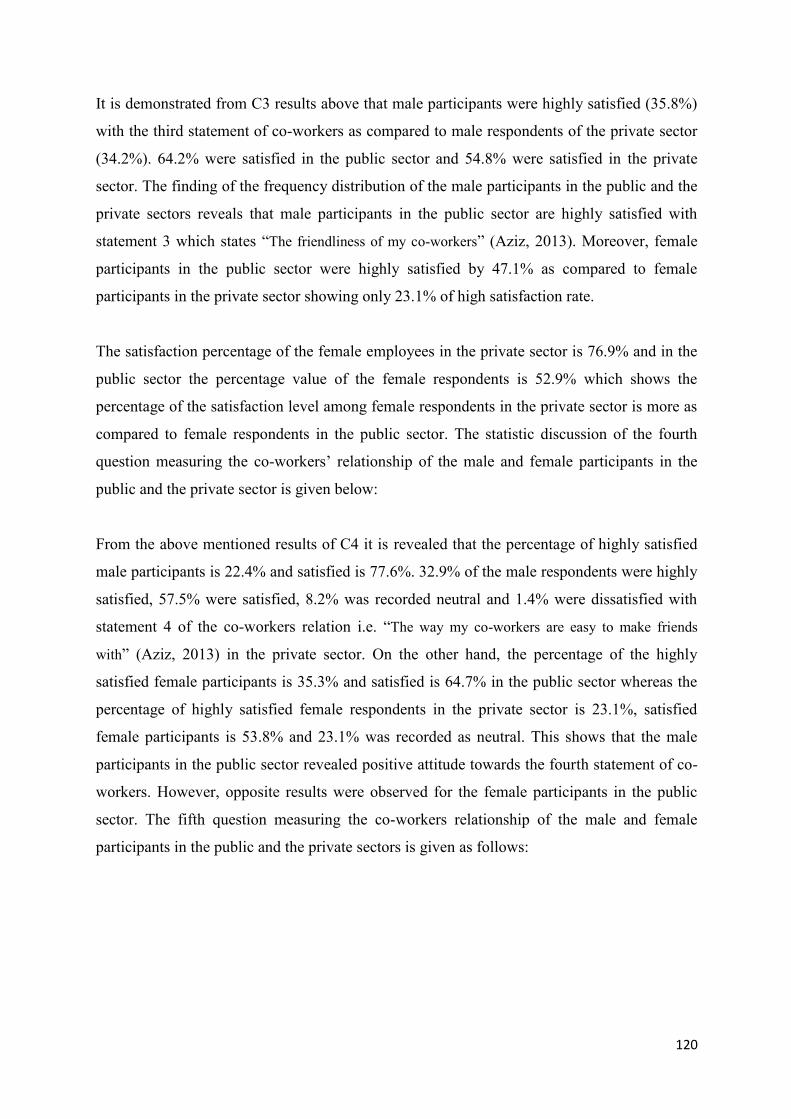
120
It is demonstrated from C3 results above that male participants were highly satisfied (35.8%)
with the third statement of co-workers as compared to male respondents of the private sector
(34.2%). 64.2% were satisfied in the public sector and 54.8% were satisfied in the private
sector. The finding of the frequency distribution of the male participants in the public and the
private sectors reveals that male participants in the public sector are highly satisfied with
statement 3 which states “The friendliness of my co-workers” (Aziz, 2013). Moreover, female
participants in the public sector were highly satisfied by 47.1% as compared to female
participants in the private sector showing only 23.1% of high satisfaction rate.
The satisfaction percentage of the female employees in the private sector is 76.9% and in the
public sector the percentage value of the female respondents is 52.9% which shows the
percentage of the satisfaction level among female respondents in the private sector is more as
compared to female respondents in the public sector. The statistic discussion of the fourth
question measuring the co-workers’ relationship of the male and female participants in the
public and the private sector is given below:
From the above mentioned results of C4 it is revealed that the percentage of highly satisfied
male participants is 22.4% and satisfied is 77.6%. 32.9% of the male respondents were highly
satisfied, 57.5% were satisfied, 8.2% was recorded neutral and 1.4% were dissatisfied with
statement 4 of the co-workers relation i.e. “The way my co-workers are easy to make friends
with” (Aziz, 2013) in the private sector. On the other hand, the percentage of the highly
satisfied female participants is 35.3% and satisfied is 64.7% in the public sector whereas the
percentage of highly satisfied female respondents in the private sector is 23.1%, satisfied
female participants is 53.8% and 23.1% was recorded as neutral. This shows that the male
participants in the public sector revealed positive attitude towards the fourth statement of co-
workers. However, opposite results were observed for the female participants in the public
sector. The fifth question measuring the co-workers relationship of the male and female
participants in the public and the private sectors is given as follows:
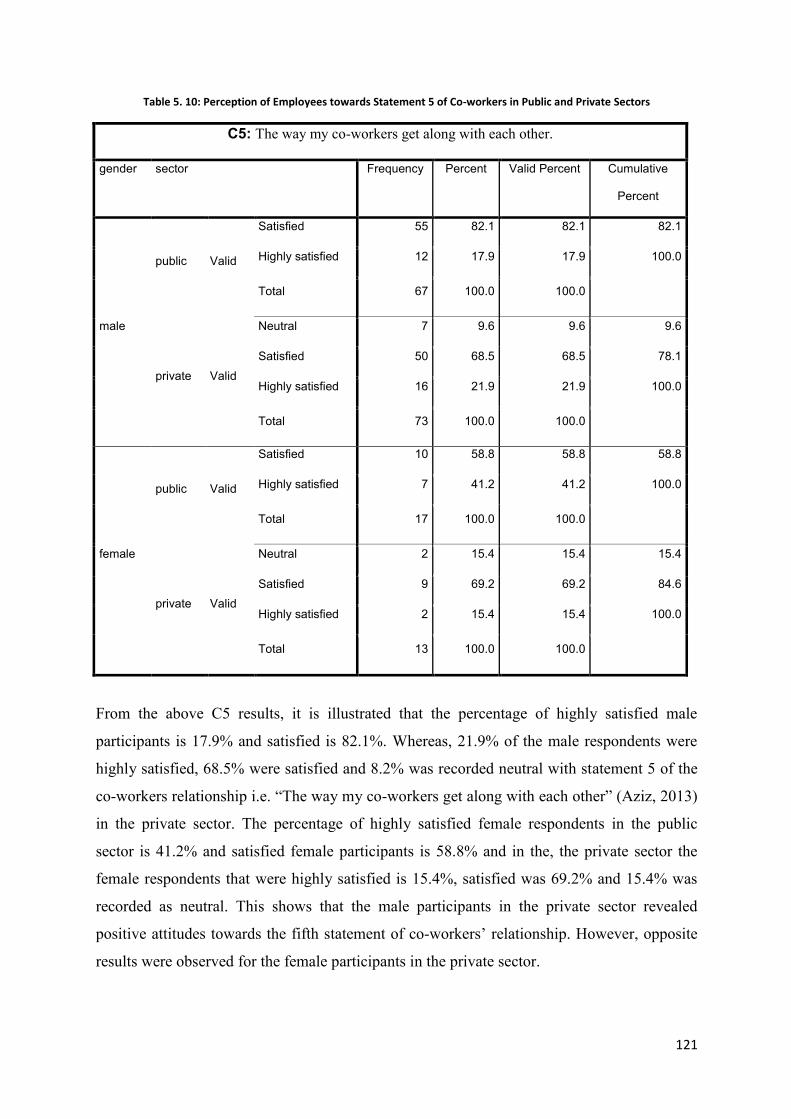
121
Table 5. 10: Perception of Employees towards Statement 5 of Co-workers in Public and Private Sectors
C5: The way my co-workers get along with each other.
gender sector Frequency Percent Valid Percent Cumulative
Percent
male
public Valid
Satisfied 55 82.1 82.1 82.1
Highly satisfied 12 17.9 17.9 100.0
Total 67 100.0 100.0
private Valid
Neutral 7 9.6 9.6 9.6
Satisfied 50 68.5 68.5 78.1
Highly satisfied 16 21.9 21.9 100.0
Total 73 100.0 100.0
female
public Valid
Satisfied 10 58.8 58.8 58.8
Highly satisfied 7 41.2 41.2 100.0
Total 17 100.0 100.0
private Valid
Neutral 2 15.4 15.4 15.4
Satisfied 9 69.2 69.2 84.6
Highly satisfied 2 15.4 15.4 100.0
Total 13 100.0 100.0
From the above C5 results, it is illustrated that the percentage of highly satisfied male
participants is 17.9% and satisfied is 82.1%. Whereas, 21.9% of the male respondents were
highly satisfied, 68.5% were satisfied and 8.2% was recorded neutral with statement 5 of the
co-workers relationship i.e. “The way my co-workers get along with each other” (Aziz, 2013)
in the private sector. The percentage of highly satisfied female respondents in the public
sector is 41.2% and satisfied female participants is 58.8% and in the, the private sector the
female respondents that were highly satisfied is 15.4%, satisfied was 69.2% and 15.4% was
recorded as neutral. This shows that the male participants in the private sector revealed
positive attitudes towards the fifth statement of co-workers’ relationship. However, opposite
results were observed for the female participants in the private sector.
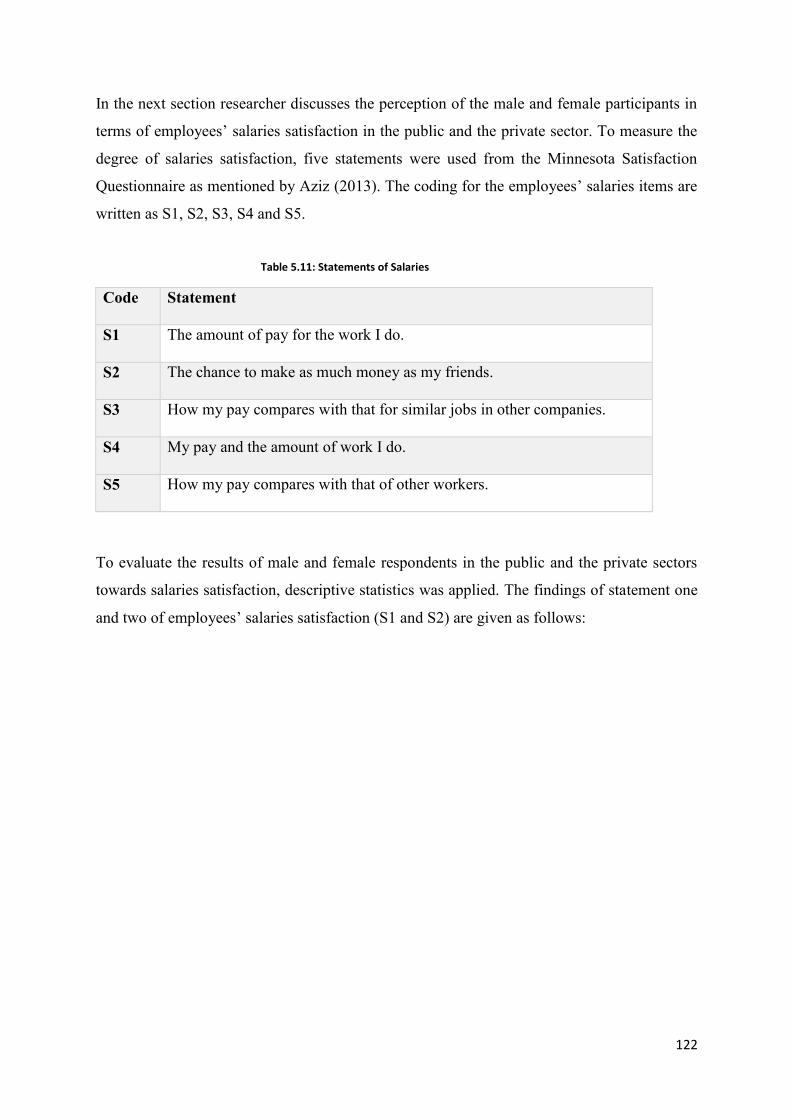
122
In the next section researcher discusses the perception of the male and female participants in
terms of employees’ salaries satisfaction in the public and the private sector. To measure the
degree of salaries satisfaction, five statements were used from the Minnesota Satisfaction
Questionnaire as mentioned by Aziz (2013). The coding for the employees’ salaries items are
written as S1, S2, S3, S4 and S5.
Table 5.11: Statements of Salaries
Code Statement
S1 The amount of pay for the work I do.
S2 The chance to make as much money as my friends.
S3 How my pay compares with that for similar jobs in other companies.
S4 My pay and the amount of work I do.
S5 How my pay compares with that of other workers.
To evaluate the results of male and female respondents in the public and the private sectors
towards salaries satisfaction, descriptive statistics was applied. The findings of statement one
and two of employees’ salaries satisfaction (S1 and S2) are given as follows:
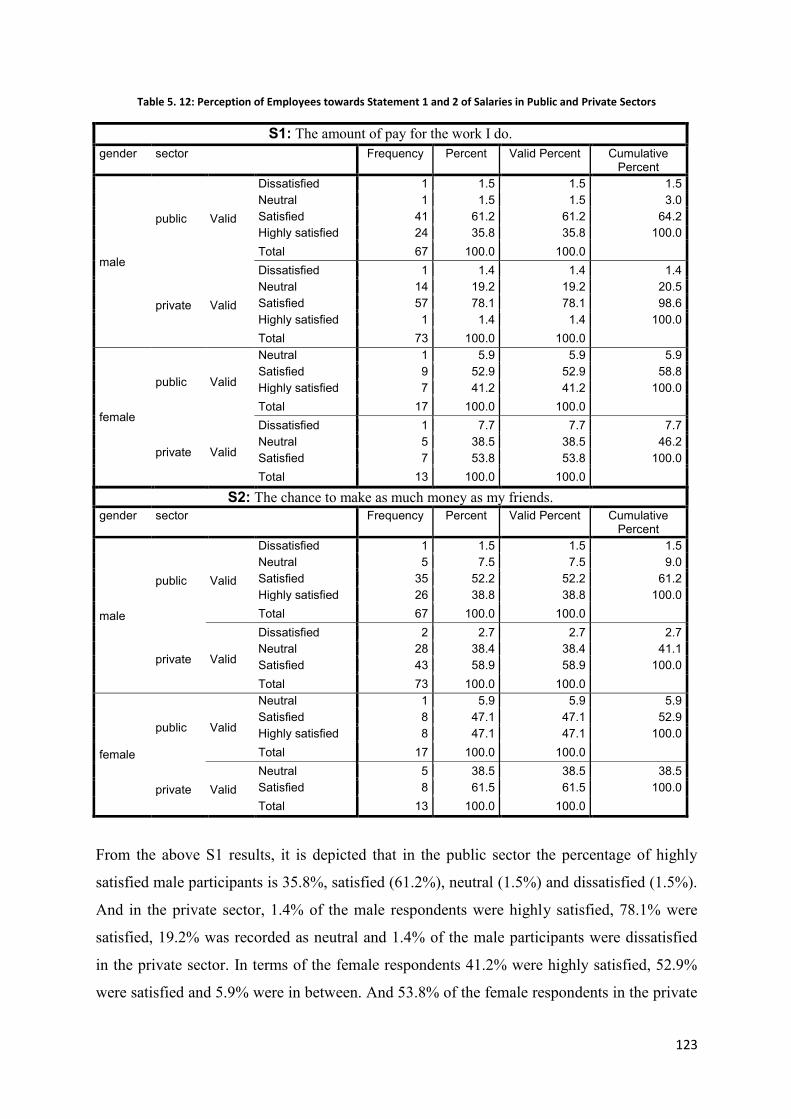
123
Table 5. 12: Perception of Employees towards Statement 1 and 2 of Salaries in Public and Private Sectors
S1: The amount of pay for the work I do. gender sector Frequency Percent Valid Percent Cumulative
Percent
male
public Valid
Dissatisfied 1 1.5 1.5 1.5 Neutral 1 1.5 1.5 3.0 Satisfied 41 61.2 61.2 64.2 Highly satisfied 24 35.8 35.8 100.0 Total 67 100.0 100.0
private Valid
Dissatisfied 1 1.4 1.4 1.4 Neutral 14 19.2 19.2 20.5 Satisfied 57 78.1 78.1 98.6 Highly satisfied 1 1.4 1.4 100.0 Total 73 100.0 100.0
female
public Valid
Neutral 1 5.9 5.9 5.9 Satisfied 9 52.9 52.9 58.8 Highly satisfied 7 41.2 41.2 100.0 Total 17 100.0 100.0
private Valid
Dissatisfied 1 7.7 7.7 7.7 Neutral 5 38.5 38.5 46.2 Satisfied 7 53.8 53.8 100.0 Total 13 100.0 100.0
S2: The chance to make as much money as my friends. gender sector Frequency Percent Valid Percent Cumulative
Percent
male
public Valid
Dissatisfied 1 1.5 1.5 1.5 Neutral 5 7.5 7.5 9.0 Satisfied 35 52.2 52.2 61.2 Highly satisfied 26 38.8 38.8 100.0 Total 67 100.0 100.0
private Valid
Dissatisfied 2 2.7 2.7 2.7 Neutral 28 38.4 38.4 41.1 Satisfied 43 58.9 58.9 100.0 Total 73 100.0 100.0
female
public Valid
Neutral 1 5.9 5.9 5.9 Satisfied 8 47.1 47.1 52.9 Highly satisfied 8 47.1 47.1 100.0 Total 17 100.0 100.0
private Valid Neutral 5 38.5 38.5 38.5 Satisfied 8 61.5 61.5 100.0 Total 13 100.0 100.0
From the above S1 results, it is depicted that in the public sector the percentage of highly
satisfied male participants is 35.8%, satisfied (61.2%), neutral (1.5%) and dissatisfied (1.5%).
And in the private sector, 1.4% of the male respondents were highly satisfied, 78.1% were
satisfied, 19.2% was recorded as neutral and 1.4% of the male participants were dissatisfied
in the private sector. In terms of the female respondents 41.2% were highly satisfied, 52.9%
were satisfied and 5.9% were in between. And 53.8% of the female respondents in the private
124
sector were satisfied whereas, 38.5% were neither satisfied nor dissatisfied with the first
question of the salaries and approximately 7.7% were dissatisfied. This shows that male
respondents were more satisfied with the statement 1 of salaries as compared to male
respondents in the private sector. Similarly in the public sector, the percentage of the female
respondents was more than the private sector respondents. The frequency distribution of the
male and female respondents’ attitudes towards the second statement of salaries (S2) as
shown above revealed that 38.8 percent of the male participants were highly satisfied with
statement 2 of employees’ salaries satisfaction i.e. “The chance to make as much money as
my friends” (Aziz, 2013). The percentage of the male respondents in the private sector
towards the highly satisfied option is zero whereas 58.9% were satisfied, 38.4% answered
neutral and 2.7% were dissatisfied. This reveals that the attitude of the male respondents
towards the second question of salaries in the public sector was more satisfying as compared
to the male respondents in the private sector.
The perception of the female respondents was also recorded high in the public sector having
47.1% of high satisfaction rate, the same percentage (47.1%) was also observed for the
satisfaction levels and 5.9% evaluated the respective statement as neutral. 61.5% of the
female respondents were satisfied and 38.5% evaluated as neutral. From this it is depicted
that both male and female participants in the public sector were happy about their salaries as
compared to the male and female participants in the private sector. The third and fourth
statement used to measure the employees’ salaries satisfaction was also taken from the
Minnesota Satisfaction Questionnaire adopted by Aziz (2013).The evaluation of the
perception of the male and female participants towards the third and fourth statement used to
measure the employees’ salaries satisfaction on the 5 point Likert-scale are given as follows:
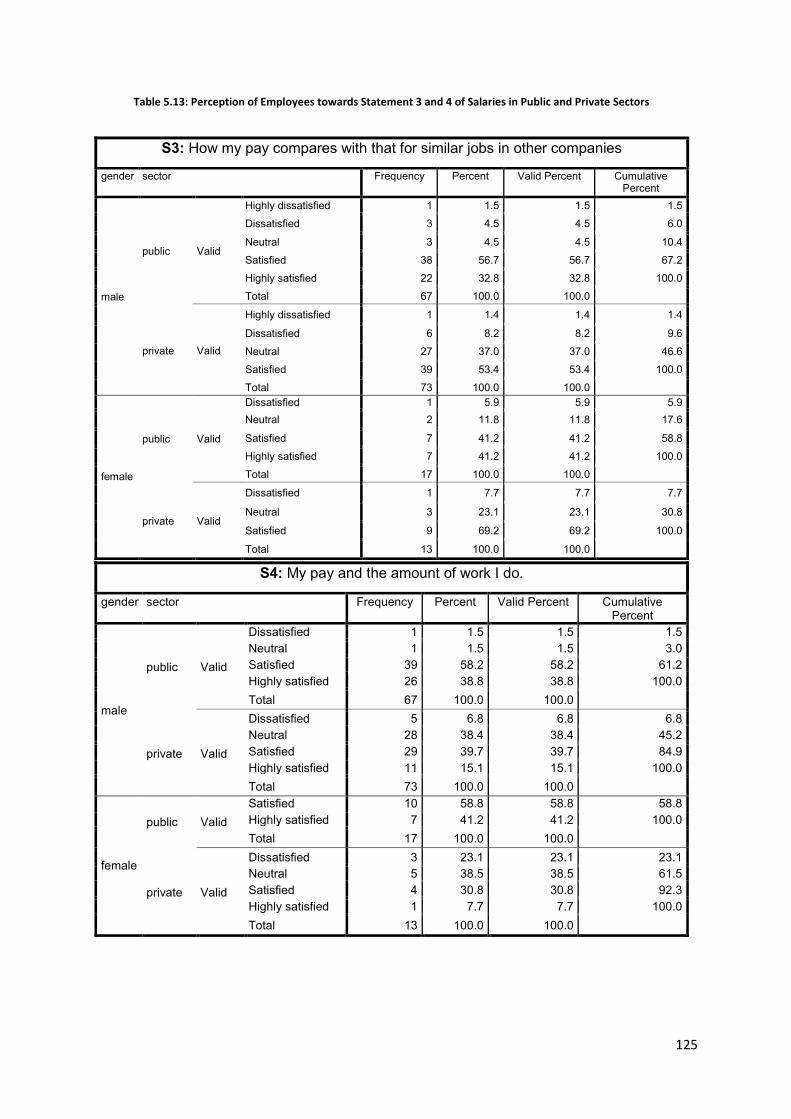
125
Table 5.13: Perception of Employees towards Statement 3 and 4 of Salaries in Public and Private Sectors
S3: How my pay compares with that for similar jobs in other companies
gender sector Frequency Percent Valid Percent Cumulative Percent
male
public Valid
Highly dissatisfied 1 1.5 1.5 1.5 Dissatisfied 3 4.5 4.5 6.0
Neutral 3 4.5 4.5 10.4 Satisfied 38 56.7 56.7 67.2 Highly satisfied 22 32.8 32.8 100.0 Total 67 100.0 100.0
private Valid
Highly dissatisfied 1 1.4 1.4 1.4
Dissatisfied 6 8.2 8.2 9.6 Neutral 27 37.0 37.0 46.6 Satisfied 39 53.4 53.4 100.0 Total 73 100.0 100.0
female
public Valid
Dissatisfied 1 5.9 5.9 5.9 Neutral 2 11.8 11.8 17.6
Satisfied 7 41.2 41.2 58.8 Highly satisfied 7 41.2 41.2 100.0 Total 17 100.0 100.0
private Valid
Dissatisfied 1 7.7 7.7 7.7
Neutral 3 23.1 23.1 30.8
Satisfied 9 69.2 69.2 100.0
Total 13 100.0 100.0
S4: My pay and the amount of work I do.
gender sector Frequency Percent Valid Percent Cumulative Percent
male
public Valid
Dissatisfied 1 1.5 1.5 1.5 Neutral 1 1.5 1.5 3.0 Satisfied 39 58.2 58.2 61.2 Highly satisfied 26 38.8 38.8 100.0 Total 67 100.0 100.0
private Valid
Dissatisfied 5 6.8 6.8 6.8 Neutral 28 38.4 38.4 45.2 Satisfied 29 39.7 39.7 84.9 Highly satisfied 11 15.1 15.1 100.0 Total 73 100.0 100.0
female
public Valid Satisfied 10 58.8 58.8 58.8 Highly satisfied 7 41.2 41.2 100.0 Total 17 100.0 100.0
private Valid
Dissatisfied 3 23.1 23.1 23.1 Neutral 5 38.5 38.5 61.5 Satisfied 4 30.8 30.8 92.3 Highly satisfied 1 7.7 7.7 100.0 Total 13 100.0 100.0
126
From the above results of S3, it is depicted that 32.8% of the male respondents in the public
sector were highly satisfied, 56.7% were satisfied, 4.5% evaluated the respective statement as
neutral, 4.5% were dissatisfied and 1.5% were highly dissatisfied. 53.4% of the male
respondents in the private sector were satisfied, 37.0% evaluated statement 3 of employees’
salaries satisfaction i.e. “How my pay compares with that for similar jobs in other companies”
(Aziz, 2013). 8.2% were dissatisfied and 1.4% as highly dissatisfied. In case of the opposite
gender, 41.2% of the female respondents were highly satisfied, 41.2% were satisfied, 11.8%
evaluated as neutral and 5.9% were dissatisfied with the third question measuring salaries
satisfaction. 69.2% of the female respondents were satisfied, 23.1% evaluated as neutral and
7.7% were dissatisfied. It is revealed form the above mentioned findings that both the male
and female respondents in the public sector were highly satisfied as compared to the male and
female respondents in the private sector.
And the results of S4 revealed that 38.8% of the male respondents in the public sector were
highly satisfied, 58.2% were satisfied, 1.5% evaluated the respective statement as neutral and
4.5% were dissatisfied. Whereas, 15.1% of the male respondents in the private sector were
highly satisfied, 39.7% were satisfied, 38.4% evaluated the statement 4 of i.e. “My pay and
the amount of work I do” (Aziz, 2013) and 6.8% were dissatisfied. The attitude of the female
respondents in the public sector is as follows: 41.2% were highly satisfied and 58.8% were
satisfied with the third question measuring salaries satisfaction. On the other hand, 41.2% of
the female respondents were highly satisfied and 58.8% were satisfied in the public sector. In
the private sector, 7.7% of the female respondents were highly satisfied, 30.8% were
satisfied, 38.5% evaluated as neutral and 23.1% were dissatisfied. From these findings it is
revealed that both male and female respondents in the public sector were highly satisfied as
compared to the male and female respondents in the private sector. The perception of the
male and female participants towards the fifth question of employees’ salaries satisfaction is
given as follows:
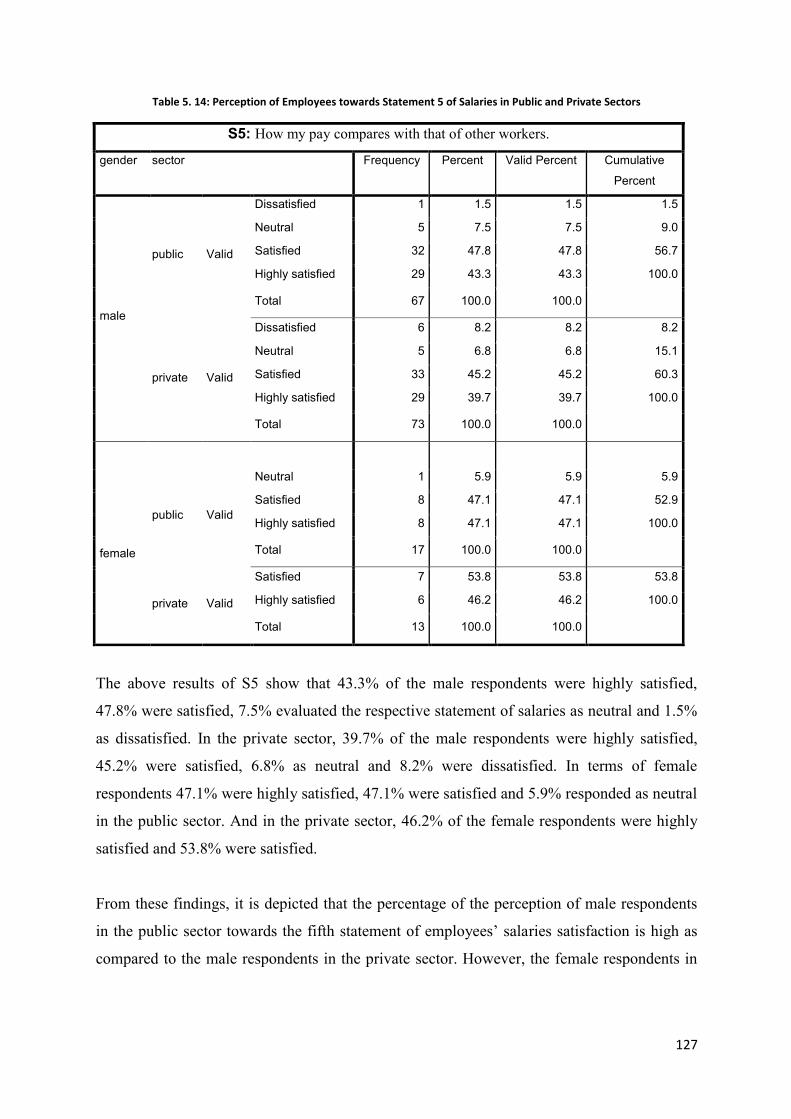
127
Table 5. 14: Perception of Employees towards Statement 5 of Salaries in Public and Private Sectors
S5: How my pay compares with that of other workers.
gender sector Frequency Percent Valid Percent Cumulative
Percent
male
public Valid
Dissatisfied 1 1.5 1.5 1.5
Neutral 5 7.5 7.5 9.0
Satisfied 32 47.8 47.8 56.7
Highly satisfied 29 43.3 43.3 100.0
Total 67 100.0 100.0
private Valid
Dissatisfied 6 8.2 8.2 8.2
Neutral 5 6.8 6.8 15.1
Satisfied 33 45.2 45.2 60.3
Highly satisfied 29 39.7 39.7 100.0
Total 73 100.0 100.0
female
public Valid
Neutral 1 5.9 5.9 5.9
Satisfied 8 47.1 47.1 52.9
Highly satisfied 8 47.1 47.1 100.0
Total 17 100.0 100.0
private Valid
Satisfied 7 53.8 53.8 53.8
Highly satisfied 6 46.2 46.2 100.0
Total 13 100.0 100.0
The above results of S5 show that 43.3% of the male respondents were highly satisfied,
47.8% were satisfied, 7.5% evaluated the respective statement of salaries as neutral and 1.5%
as dissatisfied. In the private sector, 39.7% of the male respondents were highly satisfied,
45.2% were satisfied, 6.8% as neutral and 8.2% were dissatisfied. In terms of female
respondents 47.1% were highly satisfied, 47.1% were satisfied and 5.9% responded as neutral
in the public sector. And in the private sector, 46.2% of the female respondents were highly
satisfied and 53.8% were satisfied.
From these findings, it is depicted that the percentage of the perception of male respondents
in the public sector towards the fifth statement of employees’ salaries satisfaction is high as
compared to the male respondents in the private sector. However, the female respondents in
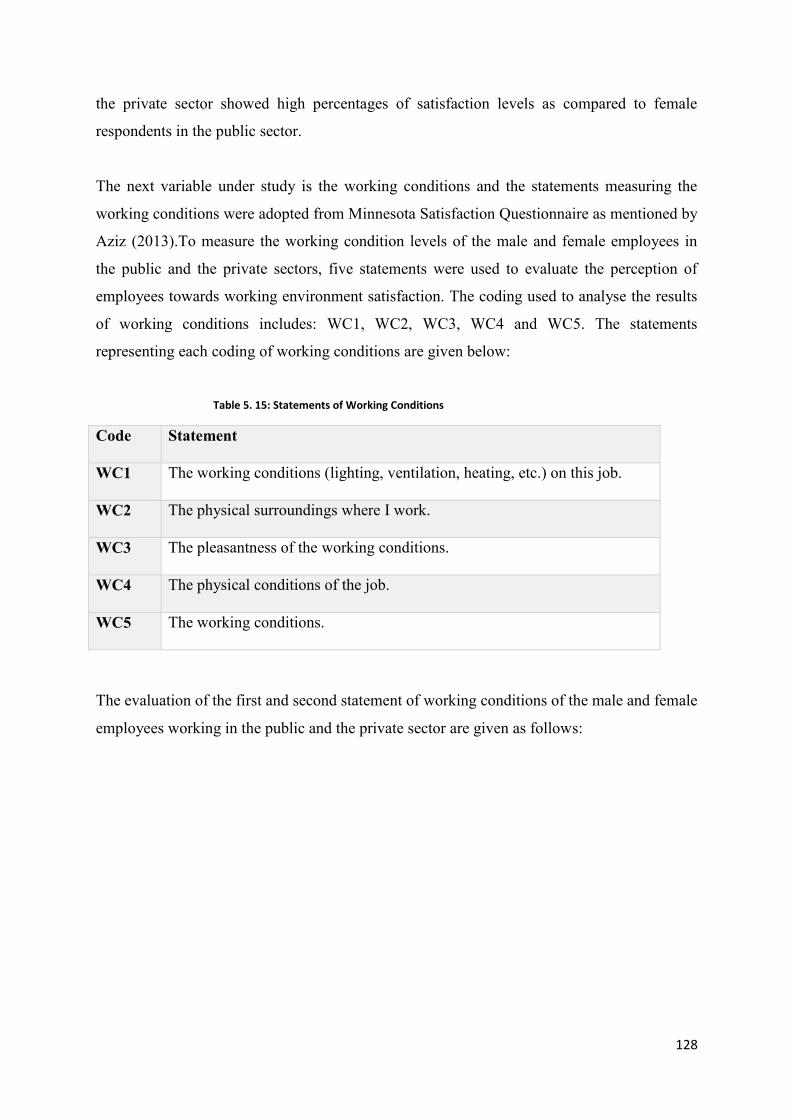
128
the private sector showed high percentages of satisfaction levels as compared to female
respondents in the public sector.
The next variable under study is the working conditions and the statements measuring the
working conditions were adopted from Minnesota Satisfaction Questionnaire as mentioned by
Aziz (2013).To measure the working condition levels of the male and female employees in
the public and the private sectors, five statements were used to evaluate the perception of
employees towards working environment satisfaction. The coding used to analyse the results
of working conditions includes: WC1, WC2, WC3, WC4 and WC5. The statements
representing each coding of working conditions are given below:
Table 5. 15: Statements of Working Conditions
Code Statement
WC1 The working conditions (lighting, ventilation, heating, etc.) on this job.
WC2 The physical surroundings where I work.
WC3 The pleasantness of the working conditions.
WC4 The physical conditions of the job.
WC5 The working conditions.
The evaluation of the first and second statement of working conditions of the male and female
employees working in the public and the private sector are given as follows:

129
Table 5. 16: Perception of Employees towards Statement 1 and 2 of Working Conditions in Public and Private Sectors
WC 1: The working conditions (lighting, ventilation, heating, etc.) on this job. gender sector Frequency Percent Valid Percent Cumulative
Percent
male
public Valid
Neutral 1 1.5 1.5 1.5 Satisfied 51 76.1 76.1 77.6 Highly satisfied 15 22.4 22.4 100.0
Total 67 100.0 100.0
private Valid
Highly dissatisfied 2 2.7 2.7 2.7 Dissatisfied 5 6.8 6.8 9.6 Neutral 8 11.0 11.0 20.5 Satisfied 42 57.5 57.5 78.1 Highly satisfied 16 21.9 21.9 100.0
Total 73 100.0 100.0
female
public Valid
Satisfied 15 88.2 88.2 88.2 Highly satisfied 2 11.8 11.8 100.0
Total 17 100.0 100.0
private Valid
Dissatisfied 1 7.7 7.7 7.7 Neutral 3 23.1 23.1 30.8 Satisfied 7 53.8 53.8 84.6 Highly satisfied 2 15.4 15.4 100.0
Total 13 100.0 100.0 WC 2: The physical surroundings where I work.
gender sector Frequency Percent Valid Percent Cumulative Percent
male
public Valid
Neutral 3 4.5 4.5 4.5 Satisfied 31 46.3 46.3 50.7 Highly satisfied 33 49.3 49.3 100.0
Total 67 100.0 100.0
private Valid
Dissatisfied 4 5.5 5.5 5.5 Neutral 25 34.2 34.2 39.7 Satisfied 33 45.2 45.2 84.9 Highly satisfied 11 15.1 15.1 100.0
Total 73 100.0 100.0
female
public Valid
Satisfied 10 58.8 58.8 58.8 Highly satisfied 7 41.2 41.2 100.0
Total 17 100.0 100.0
private Valid
Dissatisfied 1 7.7 7.7 7.7 Neutral 7 53.8 53.8 61.5 Satisfied 2 15.4 15.4 76.9 Highly satisfied 3 23.1 23.1 100.0
Total 13 100.0 100.0 From the above results of WC1, it is shown that the percentage of highly satisfied male
participants is 22.4%, satisfied is 76.1% and neutral (1.5%) in the public sector. 21.9% of the
male respondents in the private sector were highly satisfied, 57.5% were satisfied, 11.0% was
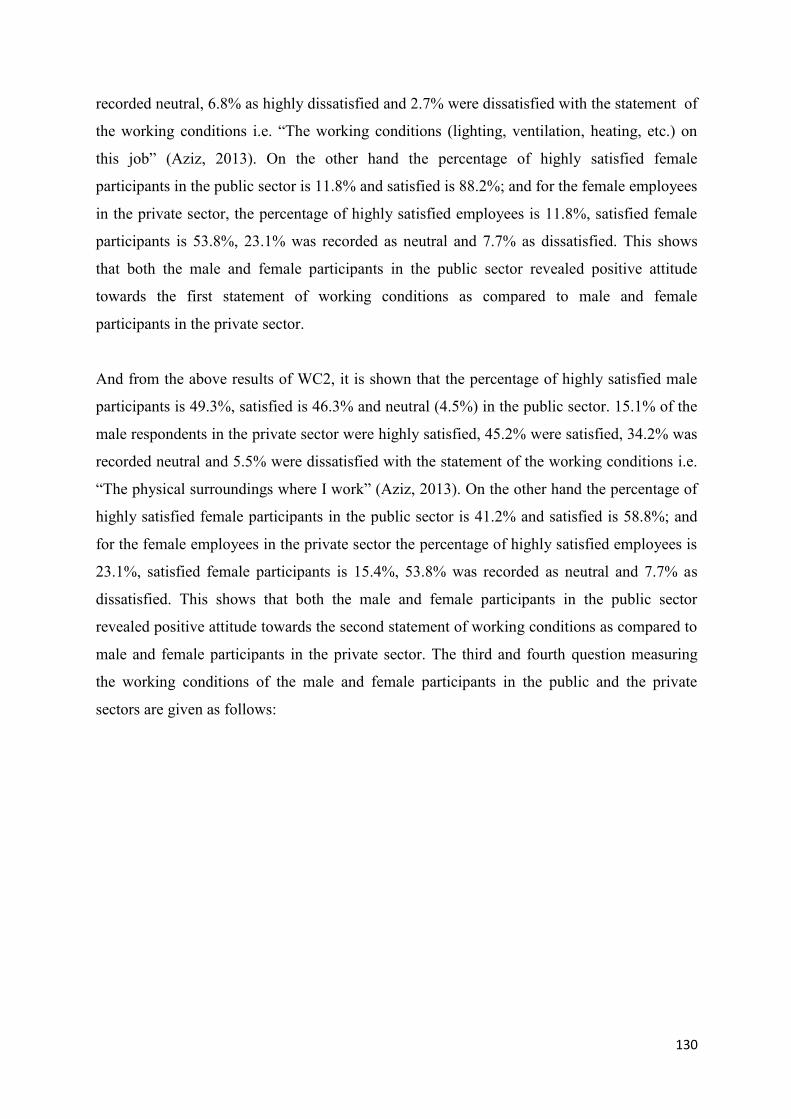
130
recorded neutral, 6.8% as highly dissatisfied and 2.7% were dissatisfied with the statement of
the working conditions i.e. “The working conditions (lighting, ventilation, heating, etc.) on
this job” (Aziz, 2013). On the other hand the percentage of highly satisfied female
participants in the public sector is 11.8% and satisfied is 88.2%; and for the female employees
in the private sector, the percentage of highly satisfied employees is 11.8%, satisfied female
participants is 53.8%, 23.1% was recorded as neutral and 7.7% as dissatisfied. This shows
that both the male and female participants in the public sector revealed positive attitude
towards the first statement of working conditions as compared to male and female
participants in the private sector.
And from the above results of WC2, it is shown that the percentage of highly satisfied male
participants is 49.3%, satisfied is 46.3% and neutral (4.5%) in the public sector. 15.1% of the
male respondents in the private sector were highly satisfied, 45.2% were satisfied, 34.2% was
recorded neutral and 5.5% were dissatisfied with the statement of the working conditions i.e.
“The physical surroundings where I work” (Aziz, 2013). On the other hand the percentage of
highly satisfied female participants in the public sector is 41.2% and satisfied is 58.8%; and
for the female employees in the private sector the percentage of highly satisfied employees is
23.1%, satisfied female participants is 15.4%, 53.8% was recorded as neutral and 7.7% as
dissatisfied. This shows that both the male and female participants in the public sector
revealed positive attitude towards the second statement of working conditions as compared to
male and female participants in the private sector. The third and fourth question measuring
the working conditions of the male and female participants in the public and the private
sectors are given as follows:
131
Table 5. 17: Perception of Employees towards Statement 3 and 4 of Working Conditions in Public and Private Sectors
WC3: The pleasantness of the working conditions gender sector Frequency Percent Valid Percent Cumulative
Percent
male
public Valid
Satisfied 52 77.6 77.6 77.6 Highly satisfied 15 22.4 22.4 100.0
Total 67 100.0 100.0
private Valid
Highly dissatisfied 1 1.4 1.4 1.4 Dissatisfied 2 2.7 2.7 4.1 Neutral 17 23.3 23.3 27.4 Satisfied 40 54.8 54.8 82.2 Highly satisfied 13 17.8 17.8 100.0
Total 73 100.0 100.0
female
public Valid
Satisfied 14 82.4 82.4 82.4 Highly satisfied 3 17.6 17.6 100.0
Total 17 100.0 100.0
private Valid
Dissatisfied 1 7.7 7.7 7.7 Neutral 3 23.1 23.1 30.8 Satisfied 6 46.2 46.2 76.9 Highly satisfied 3 23.1 23.1 100.0
Total 13 100.0 100.0 WC4: The physical conditions of the job
gender sector Frequency Percent Valid Percent Cumulative Percent
male
public Valid
Satisfied 49 73.1 73.1 73.1 Highly satisfied 18 26.9 26.9 100.0
Total 67 100.0 100.0
private Valid
Dissatisfied 2 2.7 2.7 2.7 Neutral 28 38.4 38.4 41.1 Satisfied 36 49.3 49.3 90.4 Highly satisfied 7 9.6 9.6 100.0
Total 73 100.0 100.0
female
public Valid
Satisfied 15 88.2 88.2 88.2 Highly satisfied 2 11.8 11.8 100.0
Total 17 100.0 100.0
private Valid
Dissatisfied 1 7.7 7.7 7.7 Neutral 5 38.5 38.5 46.2 Satisfied 6 46.2 46.2 92.3 Highly satisfied 1 7.7 7.7 100.0
Total 13 100.0 100.0
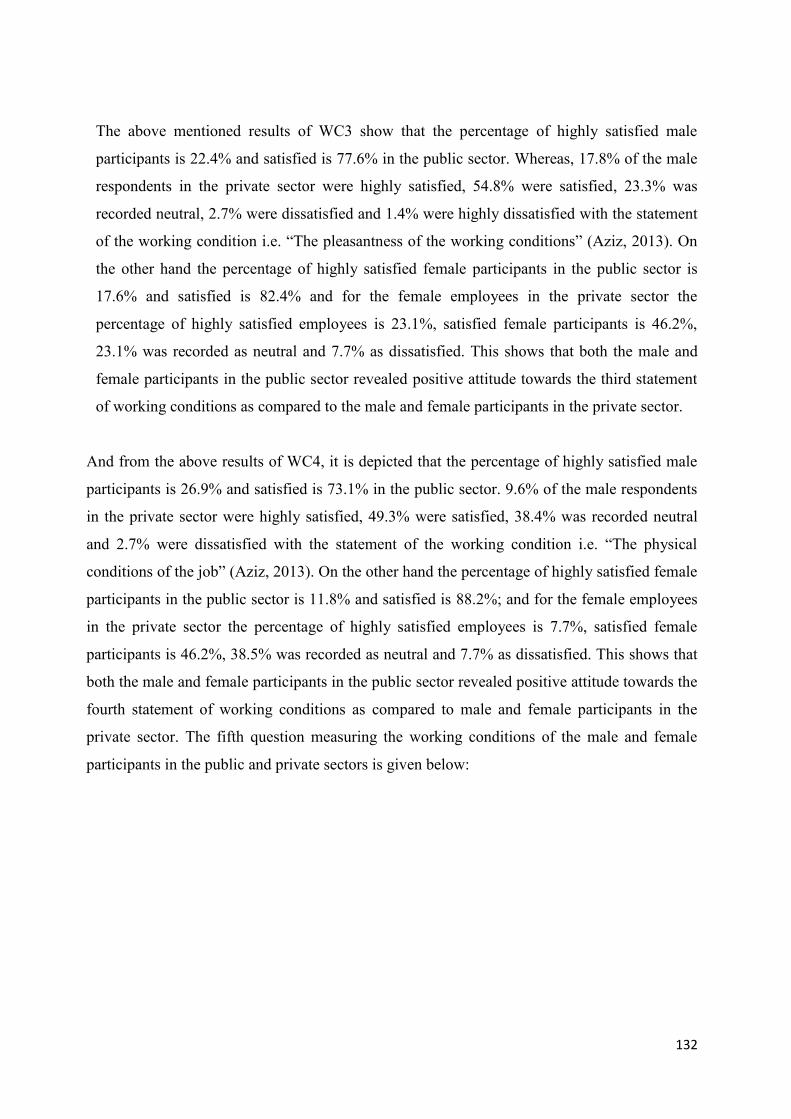
132
The above mentioned results of WC3 show that the percentage of highly satisfied male
participants is 22.4% and satisfied is 77.6% in the public sector. Whereas, 17.8% of the male
respondents in the private sector were highly satisfied, 54.8% were satisfied, 23.3% was
recorded neutral, 2.7% were dissatisfied and 1.4% were highly dissatisfied with the statement
of the working condition i.e. “The pleasantness of the working conditions” (Aziz, 2013). On
the other hand the percentage of highly satisfied female participants in the public sector is
17.6% and satisfied is 82.4% and for the female employees in the private sector the
percentage of highly satisfied employees is 23.1%, satisfied female participants is 46.2%,
23.1% was recorded as neutral and 7.7% as dissatisfied. This shows that both the male and
female participants in the public sector revealed positive attitude towards the third statement
of working conditions as compared to the male and female participants in the private sector.
And from the above results of WC4, it is depicted that the percentage of highly satisfied male
participants is 26.9% and satisfied is 73.1% in the public sector. 9.6% of the male respondents
in the private sector were highly satisfied, 49.3% were satisfied, 38.4% was recorded neutral
and 2.7% were dissatisfied with the statement of the working condition i.e. “The physical
conditions of the job” (Aziz, 2013). On the other hand the percentage of highly satisfied female
participants in the public sector is 11.8% and satisfied is 88.2%; and for the female employees
in the private sector the percentage of highly satisfied employees is 7.7%, satisfied female
participants is 46.2%, 38.5% was recorded as neutral and 7.7% as dissatisfied. This shows that
both the male and female participants in the public sector revealed positive attitude towards the
fourth statement of working conditions as compared to male and female participants in the
private sector. The fifth question measuring the working conditions of the male and female
participants in the public and private sectors is given below:
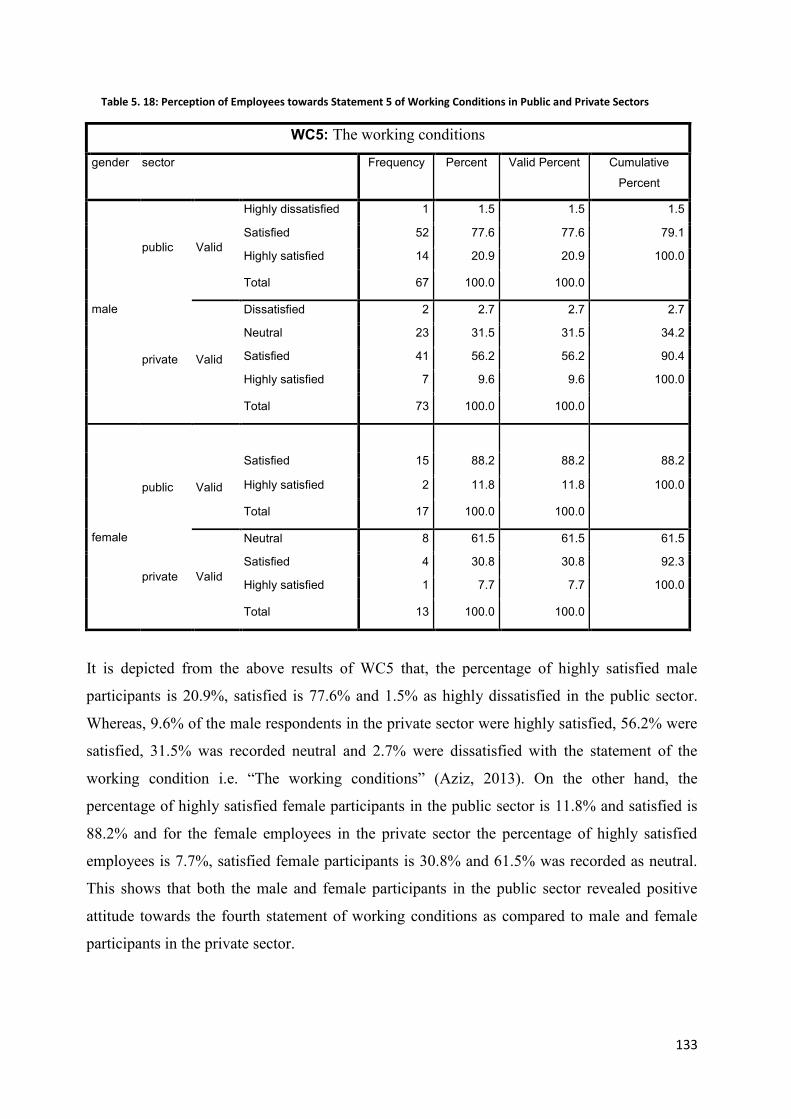
133
Table 5. 18: Perception of Employees towards Statement 5 of Working Conditions in Public and Private Sectors
WC5: The working conditions
gender sector Frequency Percent Valid Percent Cumulative
Percent
male
public Valid
Highly dissatisfied 1 1.5 1.5 1.5
Satisfied 52 77.6 77.6 79.1
Highly satisfied 14 20.9 20.9 100.0
Total 67 100.0 100.0
private Valid
Dissatisfied 2 2.7 2.7 2.7
Neutral 23 31.5 31.5 34.2
Satisfied 41 56.2 56.2 90.4
Highly satisfied 7 9.6 9.6 100.0
Total 73 100.0 100.0
female
public Valid
Satisfied 15 88.2 88.2 88.2
Highly satisfied 2 11.8 11.8 100.0
Total 17 100.0 100.0
private Valid
Neutral 8 61.5 61.5 61.5
Satisfied 4 30.8 30.8 92.3
Highly satisfied 1 7.7 7.7 100.0
Total 13 100.0 100.0
It is depicted from the above results of WC5 that, the percentage of highly satisfied male
participants is 20.9%, satisfied is 77.6% and 1.5% as highly dissatisfied in the public sector.
Whereas, 9.6% of the male respondents in the private sector were highly satisfied, 56.2% were
satisfied, 31.5% was recorded neutral and 2.7% were dissatisfied with the statement of the
working condition i.e. “The working conditions” (Aziz, 2013). On the other hand, the
percentage of highly satisfied female participants in the public sector is 11.8% and satisfied is
88.2% and for the female employees in the private sector the percentage of highly satisfied
employees is 7.7%, satisfied female participants is 30.8% and 61.5% was recorded as neutral.
This shows that both the male and female participants in the public sector revealed positive
attitude towards the fourth statement of working conditions as compared to male and female
participants in the private sector.
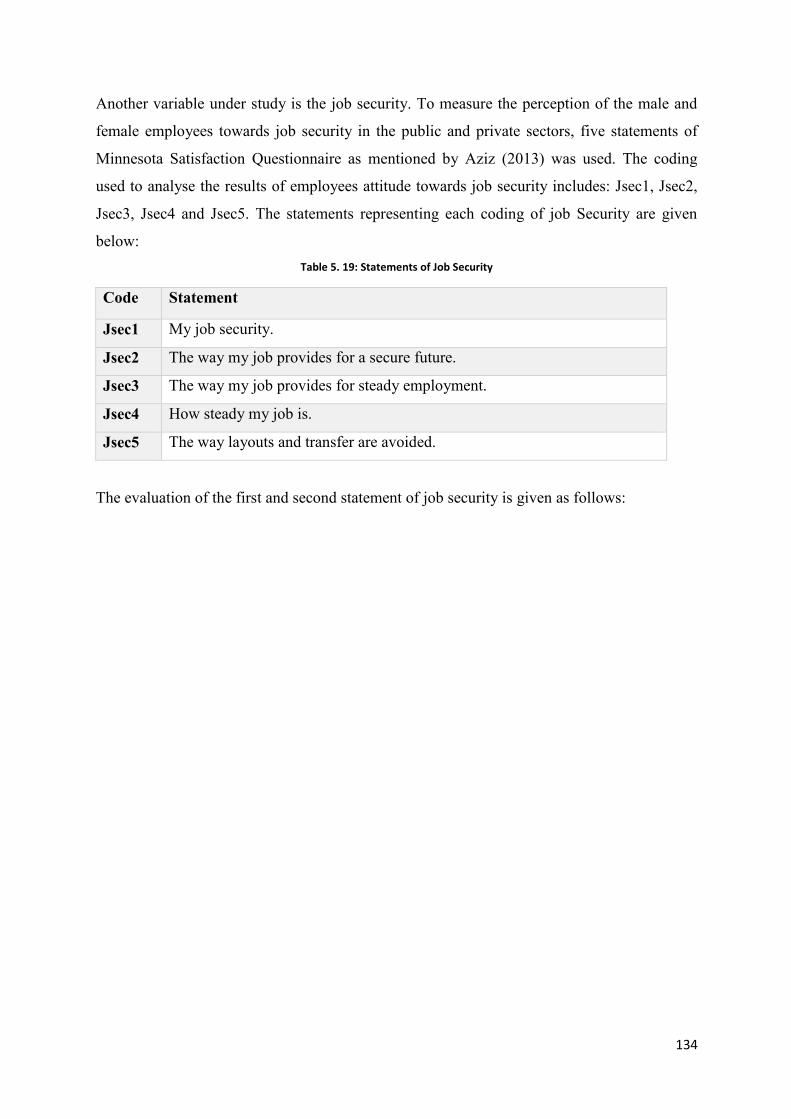
134
Another variable under study is the job security. To measure the perception of the male and
female employees towards job security in the public and private sectors, five statements of
Minnesota Satisfaction Questionnaire as mentioned by Aziz (2013) was used. The coding
used to analyse the results of employees attitude towards job security includes: Jsec1, Jsec2,
Jsec3, Jsec4 and Jsec5. The statements representing each coding of job Security are given
below: Table 5. 19: Statements of Job Security
Code Statement
Jsec1 My job security.
Jsec2 The way my job provides for a secure future.
Jsec3 The way my job provides for steady employment.
Jsec4 How steady my job is.
Jsec5 The way layouts and transfer are avoided.
The evaluation of the first and second statement of job security is given as follows:
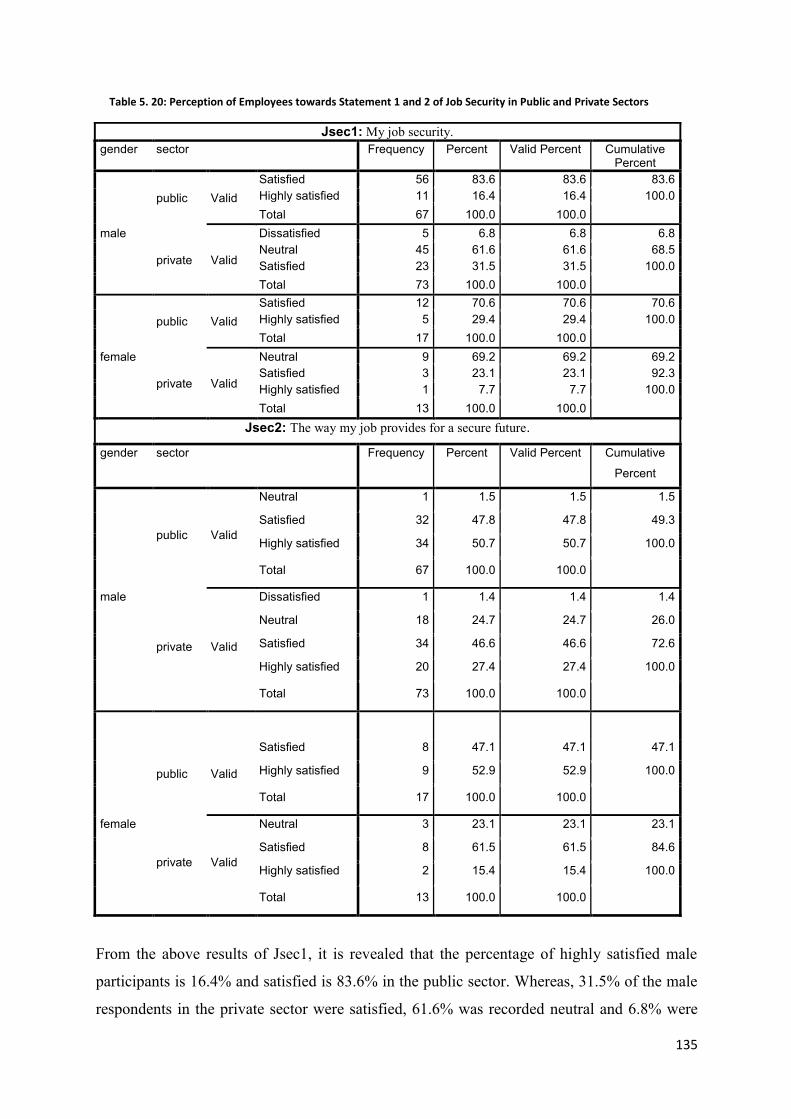
135
Table 5. 20: Perception of Employees towards Statement 1 and 2 of Job Security in Public and Private Sectors
Jsec1: My job security. gender sector Frequency Percent Valid Percent Cumulative
Percent
male
public Valid Satisfied 56 83.6 83.6 83.6 Highly satisfied 11 16.4 16.4 100.0 Total 67 100.0 100.0
private Valid
Dissatisfied 5 6.8 6.8 6.8 Neutral 45 61.6 61.6 68.5 Satisfied 23 31.5 31.5 100.0 Total 73 100.0 100.0
female
public Valid Satisfied 12 70.6 70.6 70.6 Highly satisfied 5 29.4 29.4 100.0 Total 17 100.0 100.0
private Valid
Neutral 9 69.2 69.2 69.2 Satisfied 3 23.1 23.1 92.3 Highly satisfied 1 7.7 7.7 100.0 Total 13 100.0 100.0
Jsec2: The way my job provides for a secure future.
gender sector Frequency Percent Valid Percent Cumulative
Percent
male
public Valid
Neutral 1 1.5 1.5 1.5
Satisfied 32 47.8 47.8 49.3
Highly satisfied 34 50.7 50.7 100.0
Total 67 100.0 100.0
private Valid
Dissatisfied 1 1.4 1.4 1.4
Neutral 18 24.7 24.7 26.0
Satisfied 34 46.6 46.6 72.6
Highly satisfied 20 27.4 27.4 100.0
Total 73 100.0 100.0
female
public Valid
Satisfied 8 47.1 47.1 47.1
Highly satisfied 9 52.9 52.9 100.0
Total 17 100.0 100.0
private Valid
Neutral 3 23.1 23.1 23.1
Satisfied 8 61.5 61.5 84.6
Highly satisfied 2 15.4 15.4 100.0
Total 13 100.0 100.0
From the above results of Jsec1, it is revealed that the percentage of highly satisfied male
participants is 16.4% and satisfied is 83.6% in the public sector. Whereas, 31.5% of the male
respondents in the private sector were satisfied, 61.6% was recorded neutral and 6.8% were
136
dissatisfied with the statement of job security i.e. “My job security” (Aziz, 2013). On the other
hand the percentage of highly satisfied female participants in the public sector was 29.4% and
satisfied is 70.6% and for the female employees in the private sector the percentage of highly
satisfied employees is 7.7%, satisfied female participants is 23.1% and 69.2% was recorded
as neutral. This shows that both the male and female participants in the public sector revealed
positive attitude towards the first statement of working conditions as compared to male and
female participants in the private sector.
The results of Jsec2 indicate that the percentage of highly satisfied male participants is
50.7%, satisfied is 47.8% and 1.5% as neutral in the public sector. Whereas, 27.4% of the
male respondents in the private sector were highly satisfied, 46.6% were satisfied, 24.7% was
recorded neutral and 1.4% as dissatisfied with the second statement of job security. On the
other hand the percentage of highly satisfied female participants in the public sector was
52.9%; and satisfied is 47.1% and for the female respondents in the private sector the
percentage of highly satisfied employees is 15.4%, satisfied female participants is 61.5% and
23.1% was recorded as neutral. This shows that both the male and female participants in the
public sector show a high percentage of satisfaction levels towards the second statement of
working conditions as compared to the male and female participants in the private sector.
The third and fourth question measuring the job security of the male and female participants
in public and private sector is given as follows:
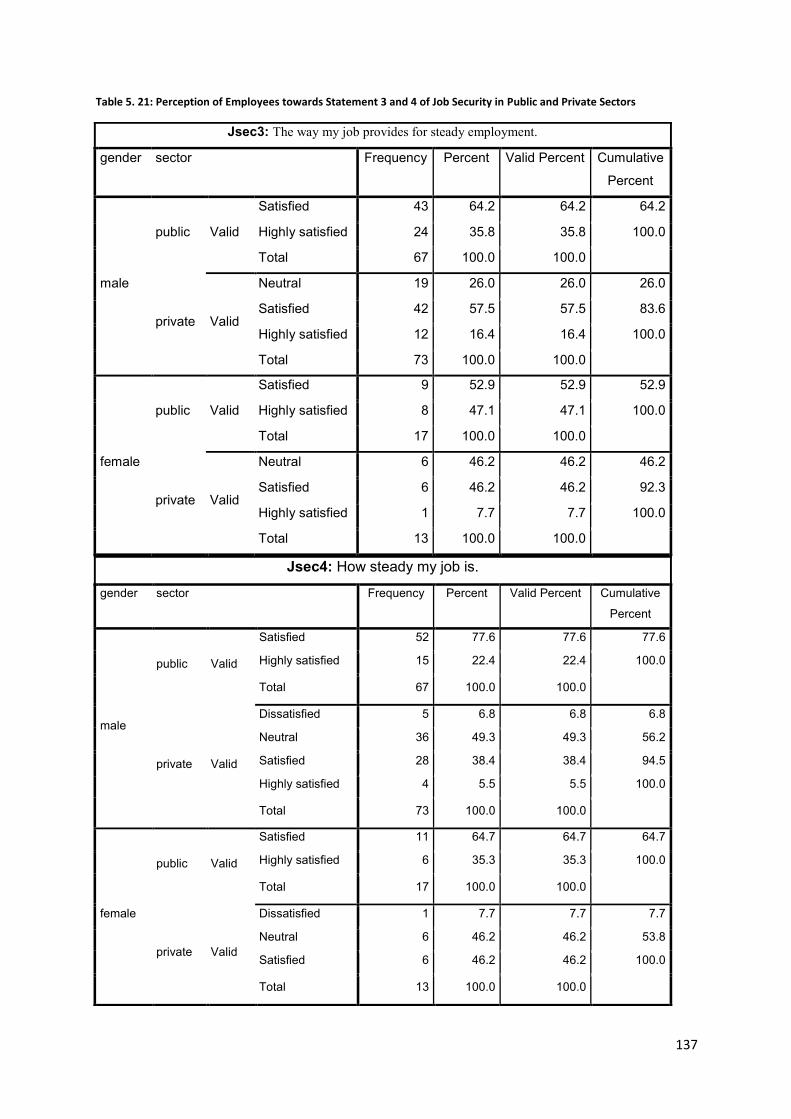
137
Table 5. 21: Perception of Employees towards Statement 3 and 4 of Job Security in Public and Private Sectors
Jsec3: The way my job provides for steady employment.
gender sector Frequency Percent Valid Percent Cumulative
Percent
male
public Valid
Satisfied 43 64.2 64.2 64.2
Highly satisfied 24 35.8 35.8 100.0
Total 67 100.0 100.0
private Valid
Neutral 19 26.0 26.0 26.0
Satisfied 42 57.5 57.5 83.6
Highly satisfied 12 16.4 16.4 100.0
Total 73 100.0 100.0
female
public Valid
Satisfied 9 52.9 52.9 52.9
Highly satisfied 8 47.1 47.1 100.0
Total 17 100.0 100.0
private Valid
Neutral 6 46.2 46.2 46.2
Satisfied 6 46.2 46.2 92.3
Highly satisfied 1 7.7 7.7 100.0
Total 13 100.0 100.0
Jsec4: How steady my job is.
gender sector Frequency Percent Valid Percent Cumulative
Percent
male
public Valid
Satisfied 52 77.6 77.6 77.6
Highly satisfied 15 22.4 22.4 100.0
Total 67 100.0 100.0
private Valid
Dissatisfied 5 6.8 6.8 6.8
Neutral 36 49.3 49.3 56.2
Satisfied 28 38.4 38.4 94.5
Highly satisfied 4 5.5 5.5 100.0
Total 73 100.0 100.0
female
public Valid
Satisfied 11 64.7 64.7 64.7
Highly satisfied 6 35.3 35.3 100.0
Total 17 100.0 100.0
private Valid
Dissatisfied 1 7.7 7.7 7.7
Neutral 6 46.2 46.2 53.8
Satisfied 6 46.2 46.2 100.0
Total 13 100.0 100.0
138
From the above results of Jsec3, it is revealed that the percentage of highly satisfied male
participants is 35.8% and satisfied is 64.2% in the public sector. Whereas, 16.4% of the male
respondents in the private sector were highly satisfied, 57.5% were satisfied and 26.0% was
recorded neutral with the statement of job security i.e. “The way my job provides for steady
employment” (Aziz, 2013). On the other hand the percentage of highly satisfied female
participants in the public sector is 47.1% and satisfied is 52.9% and for the female
respondents in the private sector the percentage of highly satisfied employees is 7.7%,
satisfied female participants is 46.2% and 46.2% was recorded as neutral. This shows that
both the male and female participants in the public sector show a high percentage of
satisfaction levels towards the third statement of job security as compared to male and female
participants in the private sector.
The above mentioned results of Jsec 4 revealed that the percentage of highly satisfied male
participants is 22.4% and satisfied is 77.6% in the public sector. Whereas, 5.5% of the male
respondents in the private sector were highly satisfied, 38.4% were satisfied and 49.3% was
recorded neutral with the statement of job security i.e. “How steady my job is” (Aziz, 2013).
On the other hand the percentage of highly satisfied female participants in the public sector is
35.3% and satisfied is 64.7%. For the female respondents in the private sector, the percentage
of satisfied employees is 46.2%, 46.2% was recorded as neutral and 7.7% were dissatisfied.
This shows that both the male and female participants in the public sector show a high
percentage of satisfaction levels towards the fourth statement of job security as compared to
the male and female participants in the private sector.
The fifth question measuring the job security of the male and female participants in public
and the private sector is given as follows:

139
Table 5. 22: Perception of Employees towards Statement 5 of Job Security in Public and Private Sectors
Jsec5: The way layouts and transfers are avoided in my job. gender sector Frequency Percent Valid Percent Cumulative
Percent
male
public Valid
Satisfied 55 82.1 82.1 82.1
Highly satisfied 12 17.9 17.9 100.0
Total 67 100.0 100.0
private Valid
Dissatisfied 3 4.1 4.1 4.1
Neutral 28 38.4 38.4 42.5
Satisfied 37 50.7 50.7 93.2
Highly satisfied 5 6.8 6.8 100.0
Total 73 100.0 100.0
female
public Valid
Satisfied 10 58.8 58.8 58.8
Highly satisfied 7 41.2 41.2 100.0
Total 17 100.0 100.0
private Valid
Neutral 6 46.2 46.2 46.2
Satisfied 7 53.8 53.8 100.0
Total 13 100.0 100.0
Form the above results of Jsec 5, it is revealed that 12 participants (17.9%) of the male
respondents were highly satisfied and 82.1% satisfied in the public sector. Whereas, 6.8% of
the male respondents in the private sector were highly satisfied, 50.7% were satisfied, 38.4%
was recorded neutral and 4.1% as dissatisfied with the statement of job security i.e. “The way
layouts and transfers are avoided in my job” (Aziz, 2013). On the other hand the percentage
of highly satisfied female participants in the public sector is 41.2% and satisfied 58.8% and
for the female respondents in the private sector the percentage of satisfied employees is
53.8% and 46.2% was recorded as neutral. This shows that both the male and female
participants in the public sector show a high percentage of satisfaction levels towards the fifth
statement of job security as compared to the male and female participants in the private
sector.
In order to measure the perception of the male and female employees towards supervision in
the public and private sector five statements of Minnesota Satisfaction Questionnaire as
mentioned by Aziz (2013) was used. The coding used to analyse the results of employees’
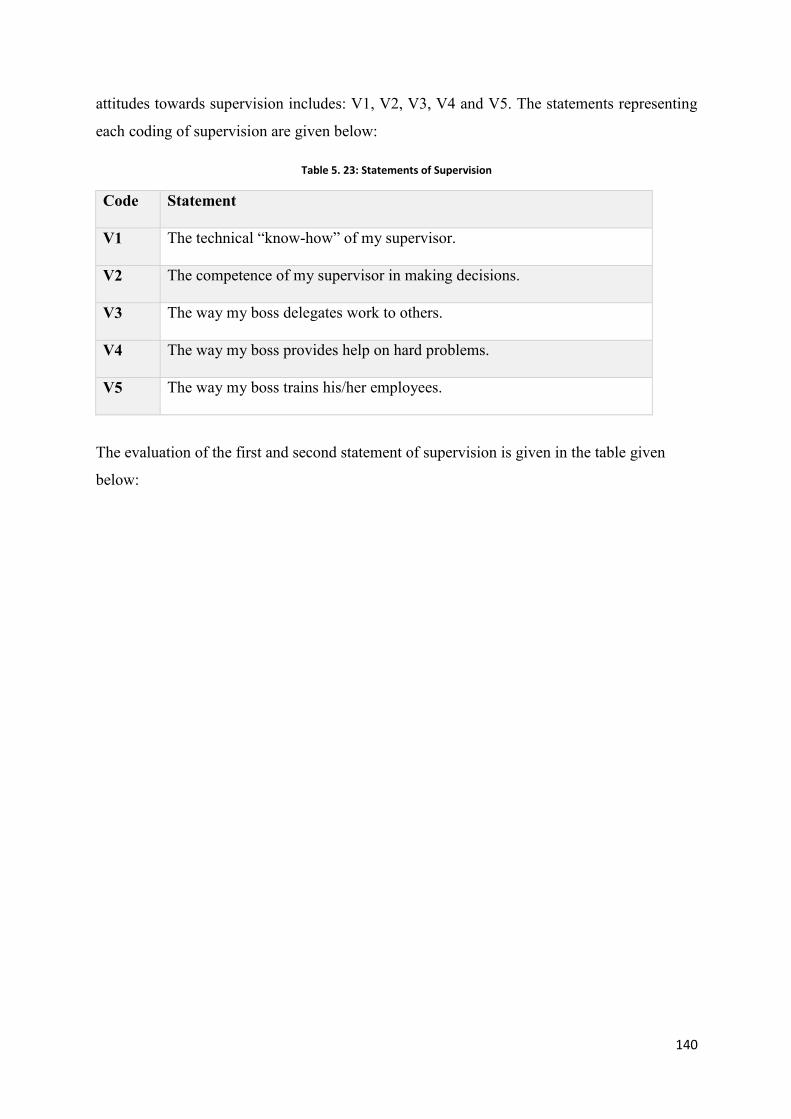
140
attitudes towards supervision includes: V1, V2, V3, V4 and V5. The statements representing
each coding of supervision are given below:
Table 5. 23: Statements of Supervision
Code Statement
V1 The technical “know-how” of my supervisor.
V2 The competence of my supervisor in making decisions.
V3 The way my boss delegates work to others.
V4 The way my boss provides help on hard problems.
V5 The way my boss trains his/her employees.
The evaluation of the first and second statement of supervision is given in the table given
below:
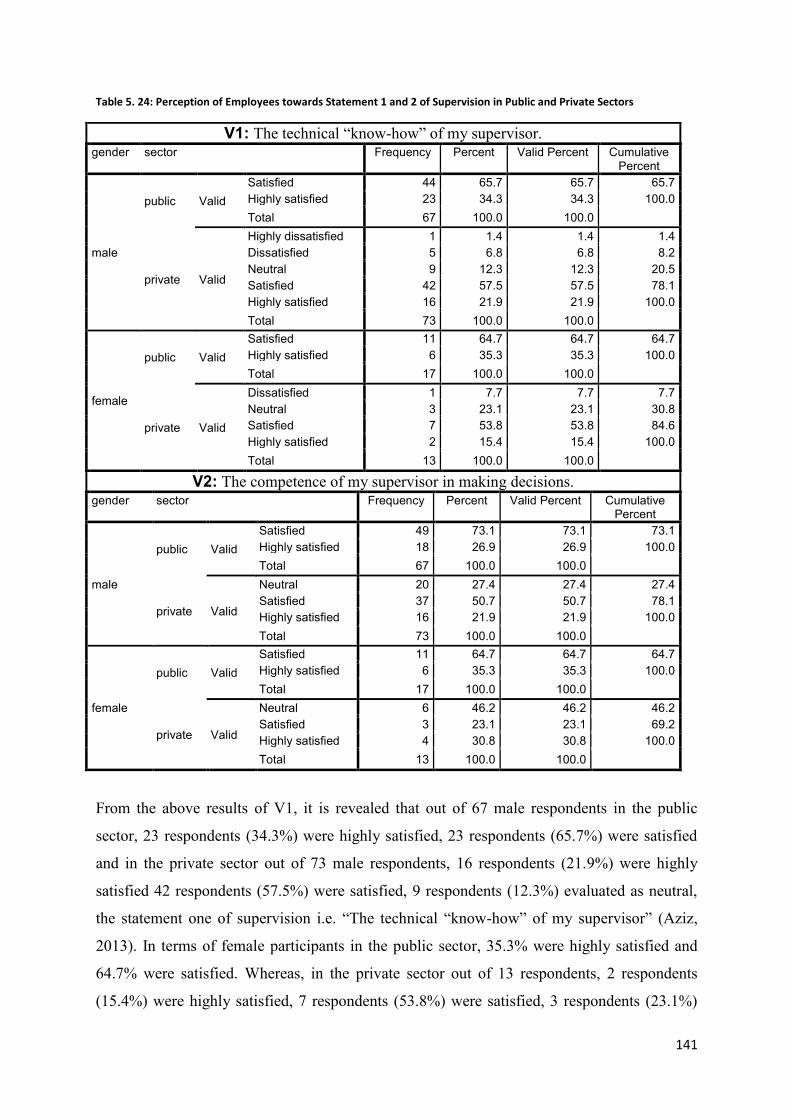
141
Table 5. 24: Perception of Employees towards Statement 1 and 2 of Supervision in Public and Private Sectors
V1: The technical “know-how” of my supervisor. gender sector Frequency Percent Valid Percent Cumulative
Percent
male
public Valid Satisfied 44 65.7 65.7 65.7 Highly satisfied 23 34.3 34.3 100.0 Total 67 100.0 100.0
private Valid
Highly dissatisfied 1 1.4 1.4 1.4 Dissatisfied 5 6.8 6.8 8.2 Neutral 9 12.3 12.3 20.5 Satisfied 42 57.5 57.5 78.1 Highly satisfied 16 21.9 21.9 100.0 Total 73 100.0 100.0
female
public Valid Satisfied 11 64.7 64.7 64.7 Highly satisfied 6 35.3 35.3 100.0 Total 17 100.0 100.0
private Valid
Dissatisfied 1 7.7 7.7 7.7 Neutral 3 23.1 23.1 30.8 Satisfied 7 53.8 53.8 84.6 Highly satisfied 2 15.4 15.4 100.0 Total 13 100.0 100.0
V2: The competence of my supervisor in making decisions. gender sector Frequency Percent Valid Percent Cumulative
Percent
male
public Valid Satisfied 49 73.1 73.1 73.1 Highly satisfied 18 26.9 26.9 100.0 Total 67 100.0 100.0
private Valid
Neutral 20 27.4 27.4 27.4 Satisfied 37 50.7 50.7 78.1 Highly satisfied 16 21.9 21.9 100.0 Total 73 100.0 100.0
female
public Valid Satisfied 11 64.7 64.7 64.7 Highly satisfied 6 35.3 35.3 100.0 Total 17 100.0 100.0
private Valid
Neutral 6 46.2 46.2 46.2 Satisfied 3 23.1 23.1 69.2 Highly satisfied 4 30.8 30.8 100.0 Total 13 100.0 100.0
From the above results of V1, it is revealed that out of 67 male respondents in the public
sector, 23 respondents (34.3%) were highly satisfied, 23 respondents (65.7%) were satisfied
and in the private sector out of 73 male respondents, 16 respondents (21.9%) were highly
satisfied 42 respondents (57.5%) were satisfied, 9 respondents (12.3%) evaluated as neutral,
the statement one of supervision i.e. “The technical “know-how” of my supervisor” (Aziz,
2013). In terms of female participants in the public sector, 35.3% were highly satisfied and
64.7% were satisfied. Whereas, in the private sector out of 13 respondents, 2 respondents
(15.4%) were highly satisfied, 7 respondents (53.8%) were satisfied, 3 respondents (23.1%)

142
responded as neutral and only one respondent (7.7%) were dissatisfied with the respective
statement of supervision. This shows that both the male and female participants in the public
sector agreed with the first question measuring supervision as compared to the male and
female participants of the private sector.
The V2 results given above reveals that out of 67 male respondents in the public sector, 18
respondents (26.9%) were highly satisfied, 49 respondents (73.1%) were satisfied and in the
private sector out of 73 male respondents, 16 respondents (21.9%) were highly satisfied 37
respondents (50.7%) were satisfied, 20 respondents (27.4%) evaluated as neutral on the
statement two of supervision i.e. “The competence of my supervisor in making decisions”
(Aziz, 2013).
In terms of female participants in the public sector, 35.3% were highly satisfied and 64.7%
were satisfied. Whereas, in the private sector, out of 13 respondents, 4 respondents (30.8%)
were highly satisfied, 3 respondents (23.1%) were satisfied and 6 respondents (46.2%)
responded as neutral with the respective statement of supervision. This shows that both the
male and female participants in the public sector agreed with the second question measuring
supervision as compared to the male and female participants of the private sector.
In the next table the researcher discusses the third and fourth statement of supervision with
respect to the perception of the male and female participants in the public and private sectors
and the statistics are given in Table 5.25.
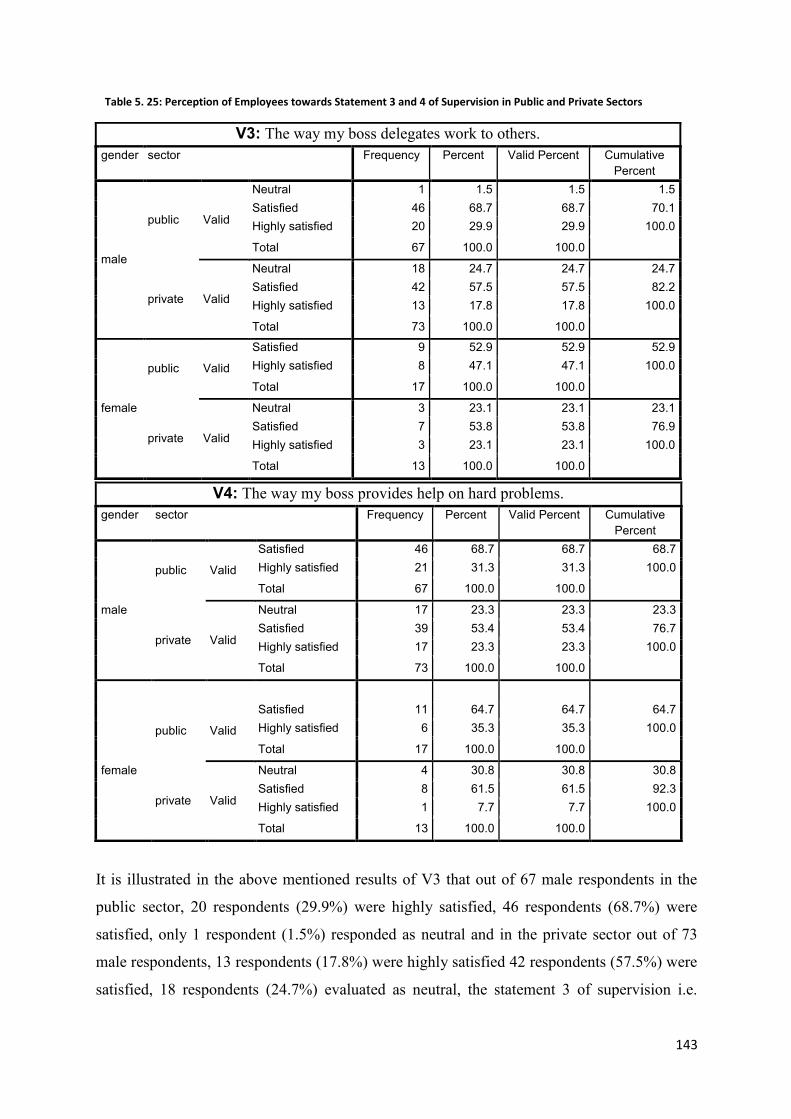
143
Table 5. 25: Perception of Employees towards Statement 3 and 4 of Supervision in Public and Private Sectors
V3: The way my boss delegates work to others. gender sector Frequency Percent Valid Percent Cumulative
Percent
male
public Valid
Neutral 1 1.5 1.5 1.5 Satisfied 46 68.7 68.7 70.1 Highly satisfied 20 29.9 29.9 100.0
Total 67 100.0 100.0
private Valid
Neutral 18 24.7 24.7 24.7 Satisfied 42 57.5 57.5 82.2 Highly satisfied 13 17.8 17.8 100.0
Total 73 100.0 100.0
female
public Valid
Satisfied 9 52.9 52.9 52.9 Highly satisfied 8 47.1 47.1 100.0
Total 17 100.0 100.0
private Valid
Neutral 3 23.1 23.1 23.1 Satisfied 7 53.8 53.8 76.9 Highly satisfied 3 23.1 23.1 100.0
Total 13 100.0 100.0
It is illustrated in the above mentioned results of V3 that out of 67 male respondents in the
public sector, 20 respondents (29.9%) were highly satisfied, 46 respondents (68.7%) were
satisfied, only 1 respondent (1.5%) responded as neutral and in the private sector out of 73
male respondents, 13 respondents (17.8%) were highly satisfied 42 respondents (57.5%) were
satisfied, 18 respondents (24.7%) evaluated as neutral, the statement 3 of supervision i.e.
V4: The way my boss provides help on hard problems. gender sector Frequency Percent Valid Percent Cumulative
Percent
male
public Valid
Satisfied 46 68.7 68.7 68.7 Highly satisfied 21 31.3 31.3 100.0
Total 67 100.0 100.0
private Valid
Neutral 17 23.3 23.3 23.3 Satisfied 39 53.4 53.4 76.7 Highly satisfied 17 23.3 23.3 100.0
Total 73 100.0 100.0
female
public Valid
Satisfied 11 64.7 64.7 64.7 Highly satisfied 6 35.3 35.3 100.0
Total 17 100.0 100.0
private Valid
Neutral 4 30.8 30.8 30.8 Satisfied 8 61.5 61.5 92.3 Highly satisfied 1 7.7 7.7 100.0
Total 13 100.0 100.0

144
“The way my boss delegates work to others” (Aziz, 2013). In terms of female participants in
the public sector, 47.1% were highly satisfied and 52.9% were satisfied. Whereas, in the
private sector out of 13 respondents, 3 respondents (23.1%) were highly satisfied, 7
respondents (53.8%) were satisfied and 3 respondents (23.1%) responded as neutral with the
respective statement of supervision. This shows that both the male and female participants in
the public sector possess high percentage of supervision than male and female participants of
the private sector.
And the results of V4 reveals that out of 67 male respondents in the public sector, 21
respondents (31.3%) were highly satisfied, 46 respondents (68.7%) were satisfied and in the
private sector out of 73 male respondents, 17 respondents (23.3%) were highly satisfied 39
respondents (53.4%) were satisfied and 17 respondents (23.3%) evaluated as neutral, the
statement 4 of supervision. In terms of female participants in the public sector, 35.3% were
highly satisfied and 64.7% were satisfied. Whereas, in the private sector out of 13
respondents, 1 respondent (7.7%) was highly satisfied, 8 respondents (61.5%) were satisfied
and 4 respondents (30.8%) responded as neutral with the respective statement of supervision.
This shows that both the male and female participants in the public sector agreed with the
fourth question measuring supervision as compared to the male and female participants of the
private sector.
In the next Table 5.34 the researcher will discuss about the fifth statement of supervision with
respect to the perception of male and female participants in public and private sector and the
statistics are given in Table 5.26.
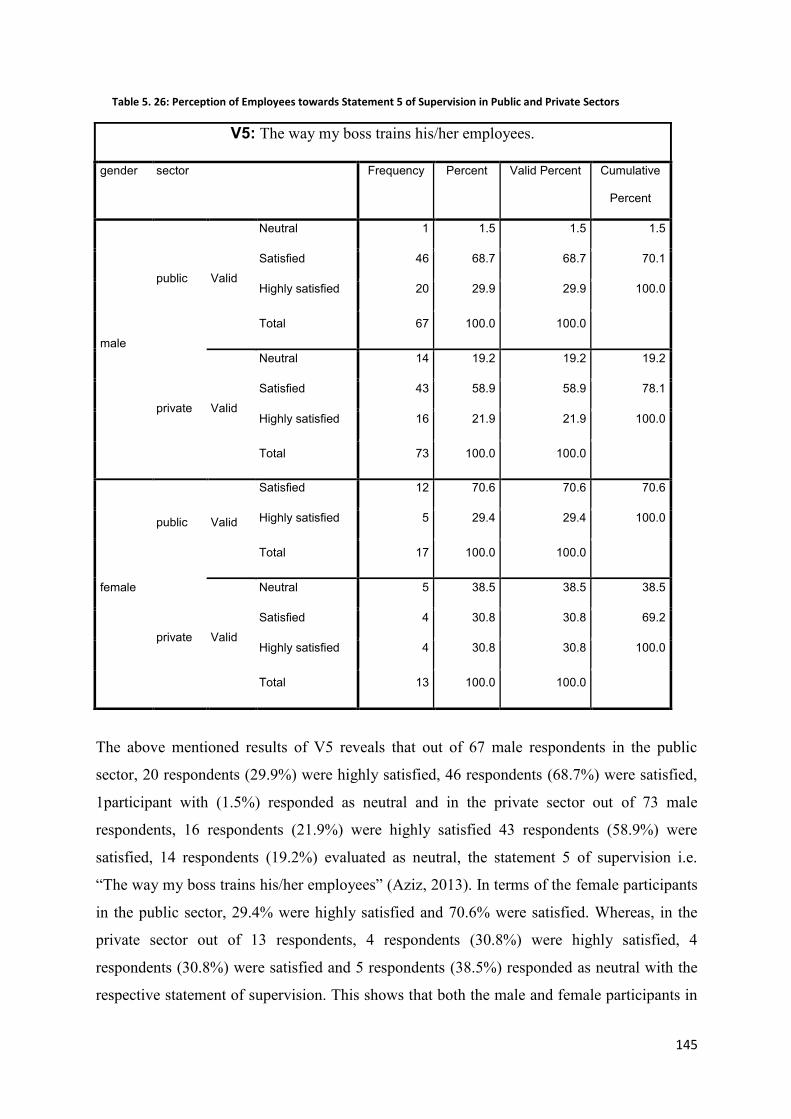
145
Table 5. 26: Perception of Employees towards Statement 5 of Supervision in Public and Private Sectors
V5: The way my boss trains his/her employees.
gender sector Frequency Percent Valid Percent Cumulative
Percent
male
public Valid
Neutral 1 1.5 1.5 1.5
Satisfied 46 68.7 68.7 70.1
Highly satisfied 20 29.9 29.9 100.0
Total 67 100.0 100.0
private Valid
Neutral 14 19.2 19.2 19.2
Satisfied 43 58.9 58.9 78.1
Highly satisfied 16 21.9 21.9 100.0
Total 73 100.0 100.0
female
public Valid
Satisfied 12 70.6 70.6 70.6
Highly satisfied 5 29.4 29.4 100.0
Total 17 100.0 100.0
private Valid
Neutral 5 38.5 38.5 38.5
Satisfied 4 30.8 30.8 69.2
Highly satisfied 4 30.8 30.8 100.0
Total 13 100.0 100.0
The above mentioned results of V5 reveals that out of 67 male respondents in the public
sector, 20 respondents (29.9%) were highly satisfied, 46 respondents (68.7%) were satisfied,
1participant with (1.5%) responded as neutral and in the private sector out of 73 male
respondents, 16 respondents (21.9%) were highly satisfied 43 respondents (58.9%) were
satisfied, 14 respondents (19.2%) evaluated as neutral, the statement 5 of supervision i.e.
“The way my boss trains his/her employees” (Aziz, 2013). In terms of the female participants
in the public sector, 29.4% were highly satisfied and 70.6% were satisfied. Whereas, in the
private sector out of 13 respondents, 4 respondents (30.8%) were highly satisfied, 4
respondents (30.8%) were satisfied and 5 respondents (38.5%) responded as neutral with the
respective statement of supervision. This shows that both the male and female participants in
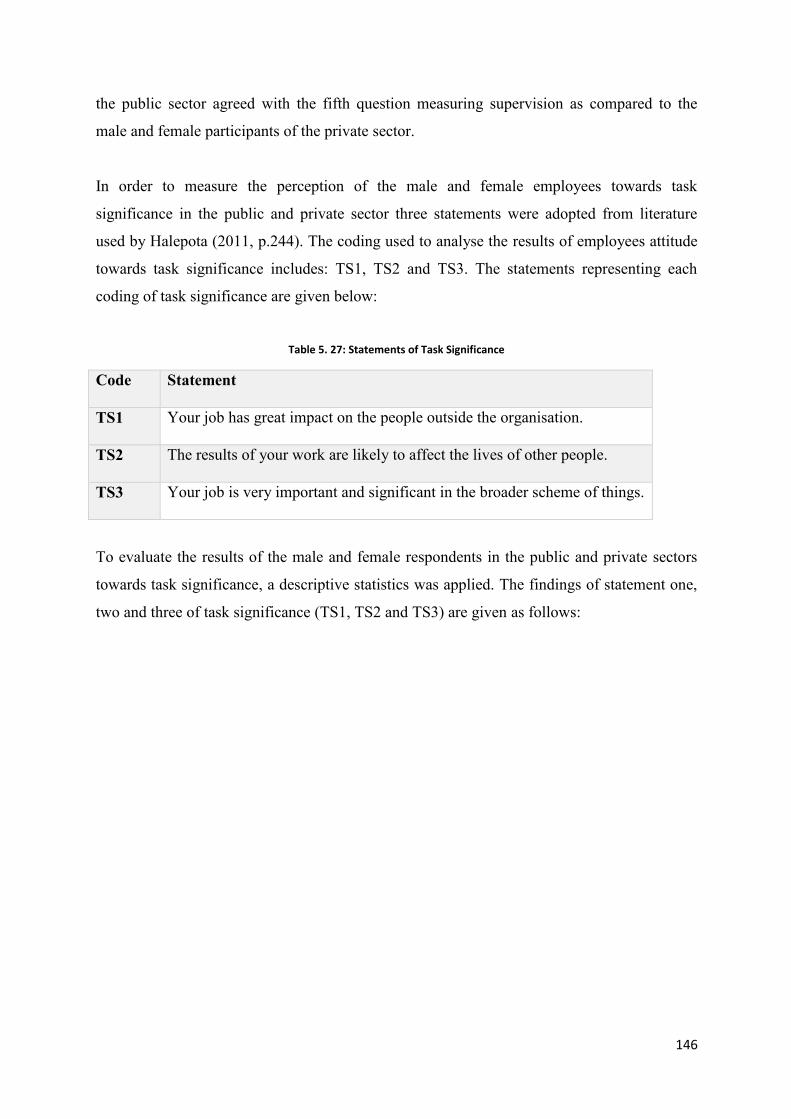
146
the public sector agreed with the fifth question measuring supervision as compared to the
male and female participants of the private sector.
In order to measure the perception of the male and female employees towards task
significance in the public and private sector three statements were adopted from literature
used by Halepota (2011, p.244). The coding used to analyse the results of employees attitude
towards task significance includes: TS1, TS2 and TS3. The statements representing each
coding of task significance are given below:
Table 5. 27: Statements of Task Significance
Code Statement
TS1 Your job has great impact on the people outside the organisation.
TS2 The results of your work are likely to affect the lives of other people.
TS3 Your job is very important and significant in the broader scheme of things.
To evaluate the results of the male and female respondents in the public and private sectors
towards task significance, a descriptive statistics was applied. The findings of statement one,
two and three of task significance (TS1, TS2 and TS3) are given as follows:
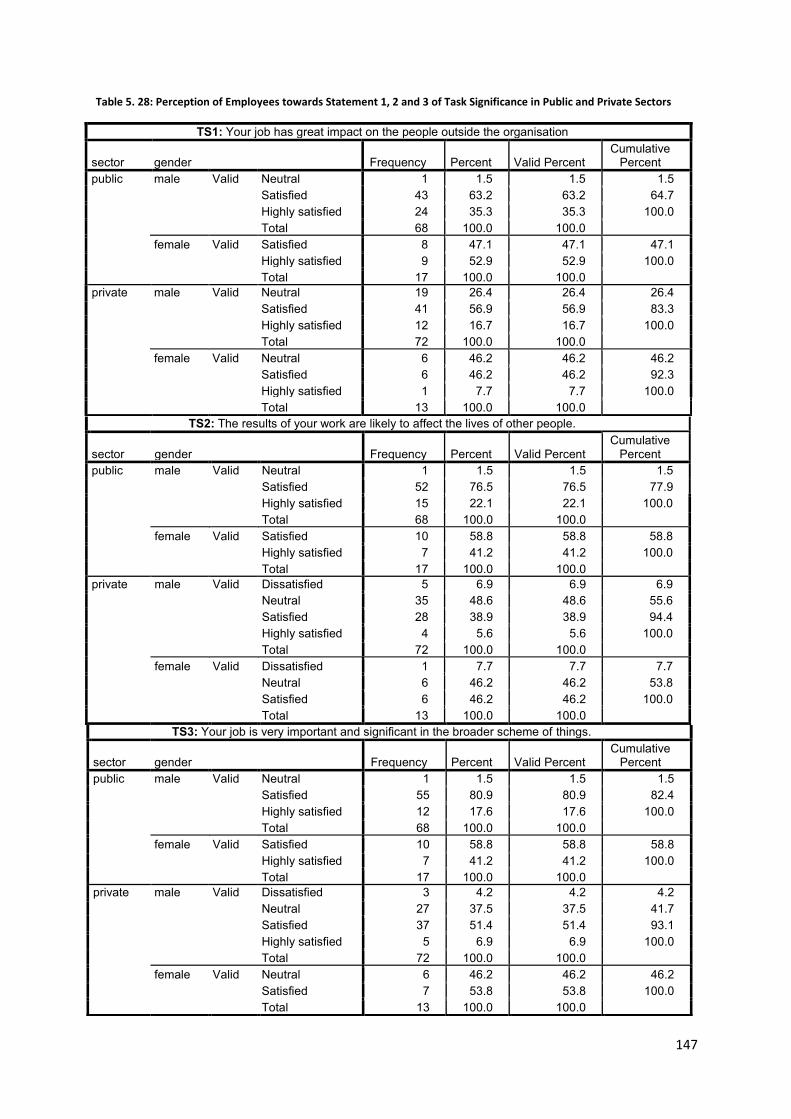
147
Table 5. 28: Perception of Employees towards Statement 1, 2 and 3 of Task Significance in Public and Private Sectors
TS2: The results of your work are likely to affect the lives of other people.
sector gender Frequency Percent Valid Percent Cumulative
Percent public male Valid Neutral 1 1.5 1.5 1.5
Satisfied 52 76.5 76.5 77.9 Highly satisfied 15 22.1 22.1 100.0 Total 68 100.0 100.0
female Valid Satisfied 10 58.8 58.8 58.8 Highly satisfied 7 41.2 41.2 100.0 Total 17 100.0 100.0
private male Valid Dissatisfied 5 6.9 6.9 6.9 Neutral 35 48.6 48.6 55.6 Satisfied 28 38.9 38.9 94.4 Highly satisfied 4 5.6 5.6 100.0 Total 72 100.0 100.0
female Valid Dissatisfied 1 7.7 7.7 7.7 Neutral 6 46.2 46.2 53.8 Satisfied 6 46.2 46.2 100.0 Total 13 100.0 100.0
TS1: Your job has great impact on the people outside the organisation
sector gender Frequency Percent Valid Percent Cumulative
Percent public male Valid Neutral 1 1.5 1.5 1.5
Satisfied 43 63.2 63.2 64.7 Highly satisfied 24 35.3 35.3 100.0 Total 68 100.0 100.0
female Valid Satisfied 8 47.1 47.1 47.1 Highly satisfied 9 52.9 52.9 100.0 Total 17 100.0 100.0
private male Valid Neutral 19 26.4 26.4 26.4 Satisfied 41 56.9 56.9 83.3 Highly satisfied 12 16.7 16.7 100.0 Total 72 100.0 100.0
female Valid Neutral 6 46.2 46.2 46.2 Satisfied 6 46.2 46.2 92.3 Highly satisfied 1 7.7 7.7 100.0 Total 13 100.0 100.0
TS3: Your job is very important and significant in the broader scheme of things.
sector gender Frequency Percent Valid Percent Cumulative
Percent public male Valid Neutral 1 1.5 1.5 1.5
Satisfied 55 80.9 80.9 82.4 Highly satisfied 12 17.6 17.6 100.0 Total 68 100.0 100.0
female Valid Satisfied 10 58.8 58.8 58.8 Highly satisfied 7 41.2 41.2 100.0 Total 17 100.0 100.0
private male Valid Dissatisfied 3 4.2 4.2 4.2 Neutral 27 37.5 37.5 41.7 Satisfied 37 51.4 51.4 93.1 Highly satisfied 5 6.9 6.9 100.0 Total 72 100.0 100.0
female Valid Neutral 6 46.2 46.2 46.2 Satisfied 7 53.8 53.8 100.0 Total 13 100.0 100.0
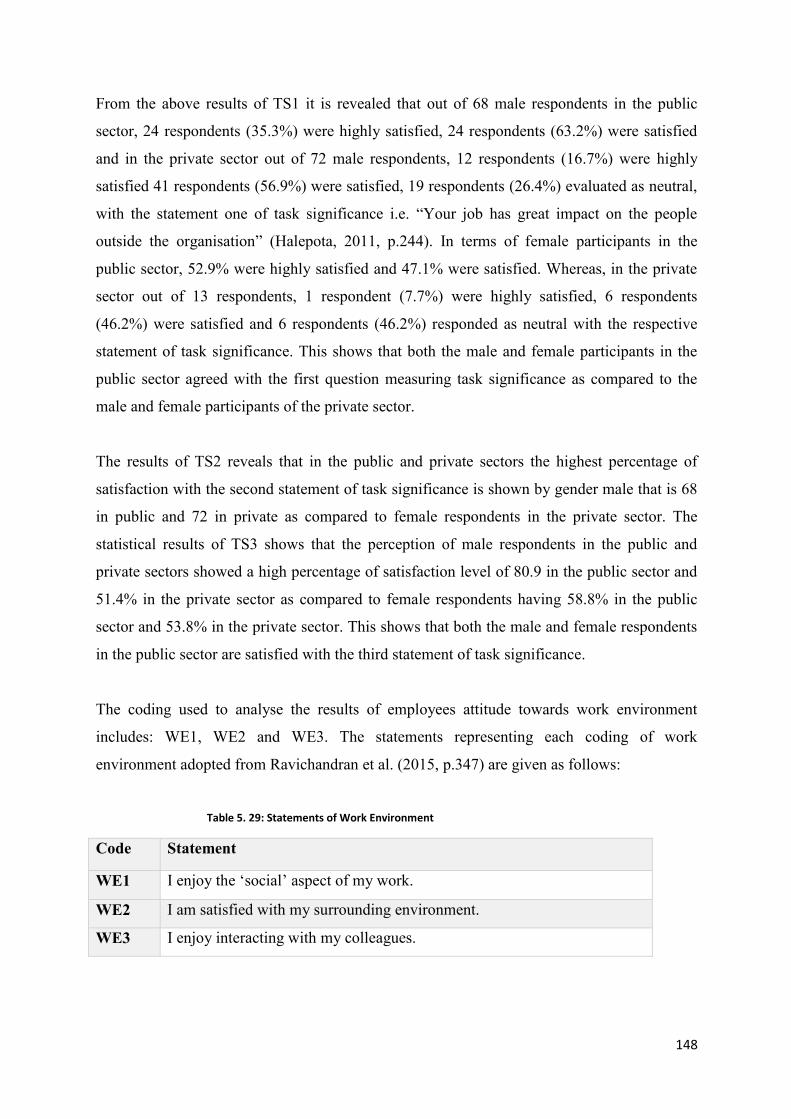
148
From the above results of TS1 it is revealed that out of 68 male respondents in the public
sector, 24 respondents (35.3%) were highly satisfied, 24 respondents (63.2%) were satisfied
and in the private sector out of 72 male respondents, 12 respondents (16.7%) were highly
satisfied 41 respondents (56.9%) were satisfied, 19 respondents (26.4%) evaluated as neutral,
with the statement one of task significance i.e. “Your job has great impact on the people
outside the organisation” (Halepota, 2011, p.244). In terms of female participants in the
public sector, 52.9% were highly satisfied and 47.1% were satisfied. Whereas, in the private
sector out of 13 respondents, 1 respondent (7.7%) were highly satisfied, 6 respondents
(46.2%) were satisfied and 6 respondents (46.2%) responded as neutral with the respective
statement of task significance. This shows that both the male and female participants in the
public sector agreed with the first question measuring task significance as compared to the
male and female participants of the private sector.
The results of TS2 reveals that in the public and private sectors the highest percentage of
satisfaction with the second statement of task significance is shown by gender male that is 68
in public and 72 in private as compared to female respondents in the private sector. The
statistical results of TS3 shows that the perception of male respondents in the public and
private sectors showed a high percentage of satisfaction level of 80.9 in the public sector and
51.4% in the private sector as compared to female respondents having 58.8% in the public
sector and 53.8% in the private sector. This shows that both the male and female respondents
in the public sector are satisfied with the third statement of task significance.
The coding used to analyse the results of employees attitude towards work environment
includes: WE1, WE2 and WE3. The statements representing each coding of work
environment adopted from Ravichandran et al. (2015, p.347) are given as follows:
Table 5. 29: Statements of Work Environment
Code Statement
WE1 I enjoy the ‘social’ aspect of my work.
WE2 I am satisfied with my surrounding environment.
WE3 I enjoy interacting with my colleagues.
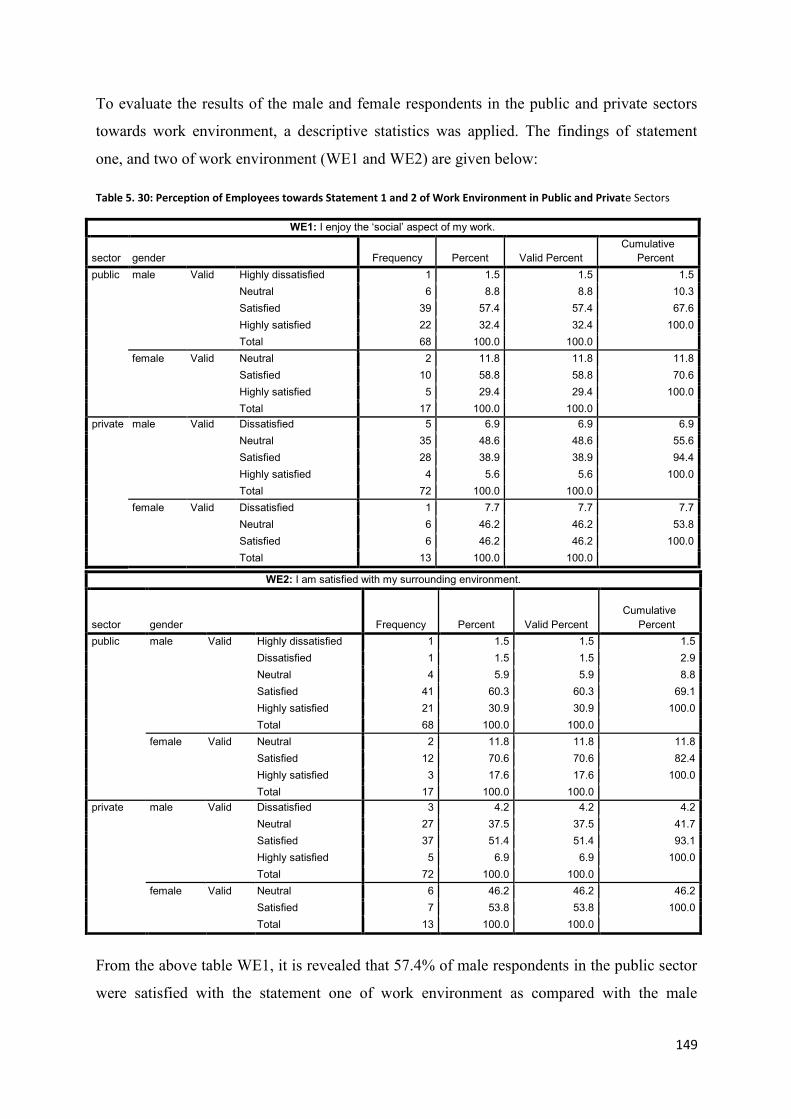
149
To evaluate the results of the male and female respondents in the public and private sectors
towards work environment, a descriptive statistics was applied. The findings of statement
one, and two of work environment (WE1 and WE2) are given below:
Table 5. 30: Perception of Employees towards Statement 1 and 2 of Work Environment in Public and Private Sectors
WE1: I enjoy the ‘social’ aspect of my work.
sector gender Frequency Percent Valid Percent Cumulative
Percent public male Valid Highly dissatisfied 1 1.5 1.5 1.5
Neutral 6 8.8 8.8 10.3 Satisfied 39 57.4 57.4 67.6 Highly satisfied 22 32.4 32.4 100.0 Total 68 100.0 100.0
female Valid Neutral 2 11.8 11.8 11.8 Satisfied 10 58.8 58.8 70.6 Highly satisfied 5 29.4 29.4 100.0 Total 17 100.0 100.0
private male Valid Dissatisfied 5 6.9 6.9 6.9 Neutral 35 48.6 48.6 55.6 Satisfied 28 38.9 38.9 94.4 Highly satisfied 4 5.6 5.6 100.0 Total 72 100.0 100.0
female Valid Dissatisfied 1 7.7 7.7 7.7 Neutral 6 46.2 46.2 53.8 Satisfied 6 46.2 46.2 100.0 Total 13 100.0 100.0
From the above table WE1, it is revealed that 57.4% of male respondents in the public sector
were satisfied with the statement one of work environment as compared with the male
WE2: I am satisfied with my surrounding environment.
sector gender
Frequency
Percent
Valid Percent
Cumulative
Percent public male Valid Highly dissatisfied 1 1.5 1.5 1.5
Dissatisfied 1 1.5 1.5 2.9 Neutral 4 5.9 5.9 8.8 Satisfied 41 60.3 60.3 69.1 Highly satisfied 21 30.9 30.9 100.0 Total 68 100.0 100.0
female Valid Neutral 2 11.8 11.8 11.8 Satisfied 12 70.6 70.6 82.4 Highly satisfied 3 17.6 17.6 100.0 Total 17 100.0 100.0
private male Valid Dissatisfied 3 4.2 4.2 4.2 Neutral 27 37.5 37.5 41.7 Satisfied 37 51.4 51.4 93.1 Highly satisfied 5 6.9 6.9 100.0 Total 72 100.0 100.0
female Valid Neutral 6 46.2 46.2 46.2 Satisfied 7 53.8 53.8 100.0 Total 13 100.0 100.0
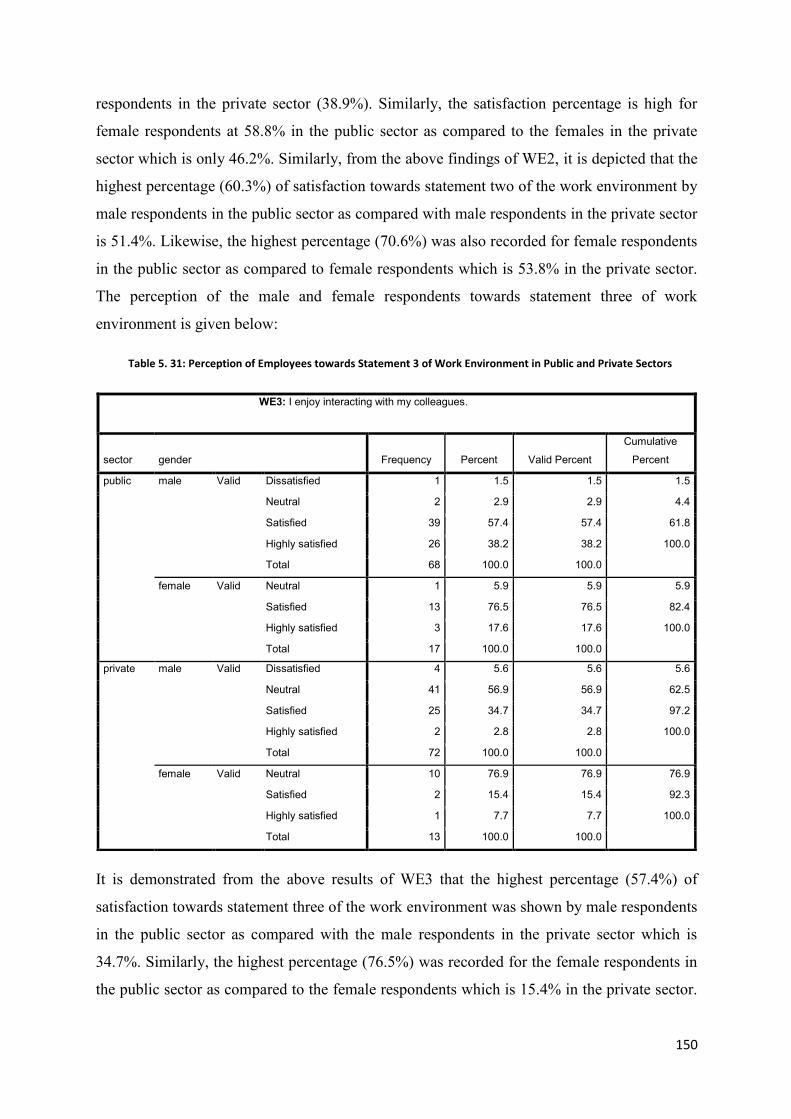
150
respondents in the private sector (38.9%). Similarly, the satisfaction percentage is high for
female respondents at 58.8% in the public sector as compared to the females in the private
sector which is only 46.2%. Similarly, from the above findings of WE2, it is depicted that the
highest percentage (60.3%) of satisfaction towards statement two of the work environment by
male respondents in the public sector as compared with male respondents in the private sector
is 51.4%. Likewise, the highest percentage (70.6%) was also recorded for female respondents
in the public sector as compared to female respondents which is 53.8% in the private sector.
The perception of the male and female respondents towards statement three of work
environment is given below: Table 5. 31: Perception of Employees towards Statement 3 of Work Environment in Public and Private Sectors
It is demonstrated from the above results of WE3 that the highest percentage (57.4%) of
satisfaction towards statement three of the work environment was shown by male respondents
in the public sector as compared with the male respondents in the private sector which is
34.7%. Similarly, the highest percentage (76.5%) was recorded for the female respondents in
the public sector as compared to the female respondents which is 15.4% in the private sector.
WE3: I enjoy interacting with my colleagues.
sector gender Frequency Percent Valid Percent
Cumulative
Percent
public male Valid Dissatisfied 1 1.5 1.5 1.5
Neutral 2 2.9 2.9 4.4
Satisfied 39 57.4 57.4 61.8
Highly satisfied 26 38.2 38.2 100.0
Total 68 100.0 100.0
female Valid Neutral 1 5.9 5.9 5.9
Satisfied 13 76.5 76.5 82.4
Highly satisfied 3 17.6 17.6 100.0
Total 17 100.0 100.0
private male Valid Dissatisfied 4 5.6 5.6 5.6
Neutral 41 56.9 56.9 62.5
Satisfied 25 34.7 34.7 97.2
Highly satisfied 2 2.8 2.8 100.0
Total 72 100.0 100.0
female Valid Neutral 10 76.9 76.9 76.9
Satisfied 2 15.4 15.4 92.3
Highly satisfied 1 7.7 7.7 100.0
Total 13 100.0 100.0
151
This shows that both the male and female respondents in the public sector have high job
satisfaction levels towards work environment as compared to the male and female
respondents in the private sector.
The coding used to analyse the results of employees’ attitudes towards work itself are: WI1
and WI2.The statements representing each coding of work itself are adopted from Steger et al.
(2012, p.11) and are presented as follows:
Table 5. 32: Statements of Work Itself
Code Statement
WI1 I have a good sense of what makes my job meaningful.
WI2 I have discovered work that has a satisfying purpose.
To evaluate the results of the male and female respondents in the public and private sectors
towards work itself, a descriptive statistics was applied. The findings of statement one and
two of work itself (WI1 and WI2) are given as follows:

152
Table 5. 33: Perception of Employees towards Statement 1 and 2 of Work Itself in Public and Private Sectors
From the above results of WI1, it is revealed that the highest percentage (63.2%) of
satisfaction towards statement one of the work itself was shown by male respondents in the
public sector as compared with male respondents in the private sector is 56.9%. Similarly, the
highest percentage (47.1%) was recorded for female respondents in the public sector as
compared to female respondents which is 46.2% in the private sector. And the findings of
WI1: I have a good sense of what makes my job meaningful.
sector gender Frequency Percent Valid Percent Cumulative
Percent public male Valid Neutral 1 1.5 1.5 1.5
Satisfied 43 63.2 63.2 64.7 Highly satisfied 24 35.3 35.3 100.0 Total 68 100.0 100.0
female Valid Satisfied 8 47.1 47.1 47.1 Highly satisfied 9 52.9 52.9 100.0 Total 17 100.0 100.0
private male Valid Neutral 19 26.4 26.4 26.4 Satisfied 41 56.9 56.9 83.3 Highly satisfied 12 16.7 16.7 100.0 Total 72 100.0 100.0
female Valid
Neutral 6 46.2 46.2 46.2 Satisfied 6 46.2 46.2 92.3 Highly satisfied 1 7.7 7.7 100.0 Total 13 100.0 100.0
WI2: I have discovered work that has a satisfying purpose.
sector gender Frequency Percent Valid Percent Cumulative
Percent public male Valid Dissatisfied 1 1.5 1.5 1.5
Neutral 6 8.8 8.8 10.3 Satisfied 25 36.8 36.8 47.1 Highly satisfied 36 52.9 52.9 100.0 Total 68 100.0 100.0
female Valid Neutral 2 11.8 11.8 11.8 Satisfied 9 52.9 52.9 64.7 Highly satisfied 6 35.3 35.3 100.0 Total 17 100.0 100.0
private male Valid Dissatisfied 1 1.4 1.4 1.4 Neutral 34 47.2 47.2 48.6 Satisfied 36 50.0 50.0 98.6 Highly satisfied 1 1.4 1.4 100.0 Total 72 100.0 100.0
female Valid Neutral 5 38.5 38.5 38.5 Satisfied 6 46.2 46.2 84.6 Highly satisfied 2 15.4 15.4 100.0 Total 13 100.0 100.0
153
WI2 revealed that the highest percentage (50.0%) of satisfaction towards statement two of the
work itself shown by the male respondents in the private sector as compared with male
respondents in the private sector is 36.8%. However, the highest percentage (52.9%) was
recorded for female respondents in the public sector as compared to the female respondents
which is 46.2% in the private sector.
The coding used to analyse the results of employees’ attitude towards achievement are: A1,
A2 and A3.The statements representing each coding of achievement are adopted from Aziz
(2013, pp. 176-179) and are presented as follows:
Table 5. 34: Statements of Achievement
Code Statement
A1 Being able to see the results of the work I do.
A2 Being able to take pride in a job done.
A3 Being able to do something worthwhile.
To evaluate the results of the male and female respondents in public and private towards
achievement descriptive statistics was applied. The findings of statement one and two of
achievement (A1 and A2) are given as follows:
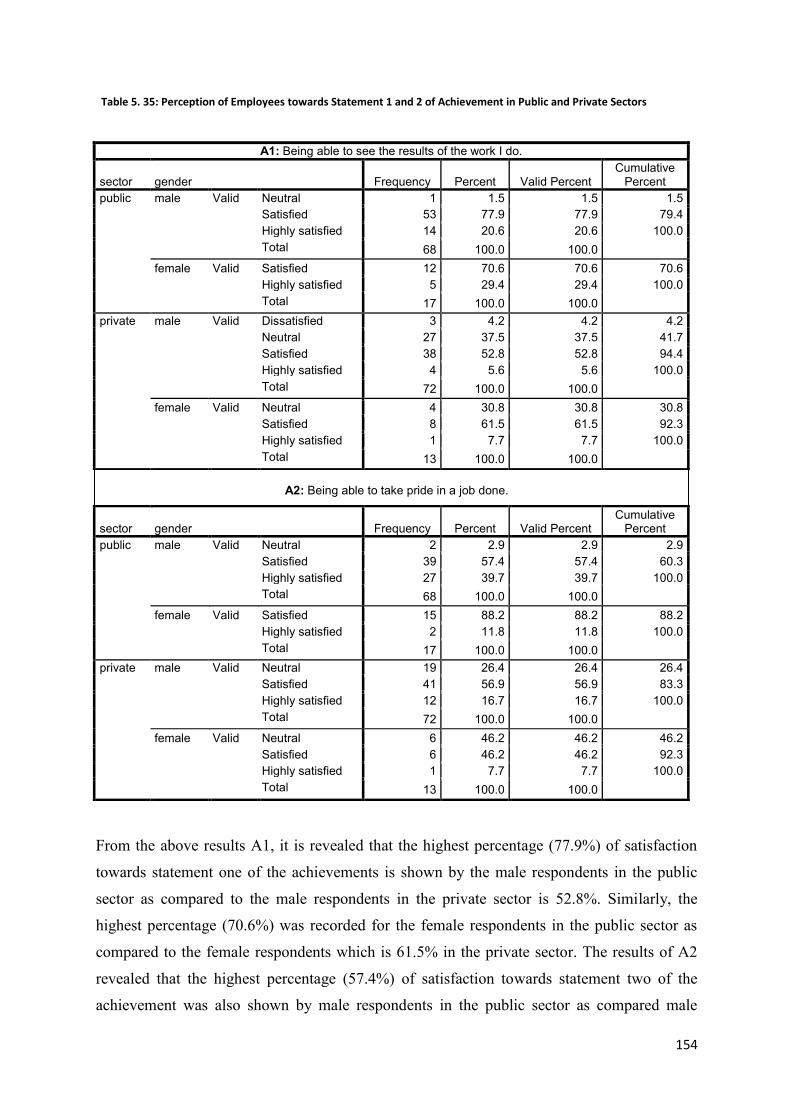
154
Table 5. 35: Perception of Employees towards Statement 1 and 2 of Achievement in Public and Private Sectors
A2: Being able to take pride in a job done.
From the above results A1, it is revealed that the highest percentage (77.9%) of satisfaction
towards statement one of the achievements is shown by the male respondents in the public
sector as compared to the male respondents in the private sector is 52.8%. Similarly, the
highest percentage (70.6%) was recorded for the female respondents in the public sector as
compared to the female respondents which is 61.5% in the private sector. The results of A2
revealed that the highest percentage (57.4%) of satisfaction towards statement two of the
achievement was also shown by male respondents in the public sector as compared male
A1: Being able to see the results of the work I do.
sector gender Frequency Percent Valid Percent Cumulative
Percent public male Valid Neutral 1 1.5 1.5 1.5
Satisfied 53 77.9 77.9 79.4 Highly satisfied 14 20.6 20.6 100.0 Total 68 100.0 100.0
female Valid Satisfied 12 70.6 70.6 70.6 Highly satisfied 5 29.4 29.4 100.0 Total 17 100.0 100.0
private male Valid Dissatisfied 3 4.2 4.2 4.2 Neutral 27 37.5 37.5 41.7 Satisfied 38 52.8 52.8 94.4 Highly satisfied 4 5.6 5.6 100.0 Total 72 100.0 100.0
female Valid Neutral 4 30.8 30.8 30.8 Satisfied 8 61.5 61.5 92.3 Highly satisfied 1 7.7 7.7 100.0 Total 13 100.0 100.0
sector gender Frequency Percent Valid Percent Cumulative
Percent public male Valid Neutral 2 2.9 2.9 2.9
Satisfied 39 57.4 57.4 60.3 Highly satisfied 27 39.7 39.7 100.0 Total 68 100.0 100.0
female Valid Satisfied 15 88.2 88.2 88.2 Highly satisfied 2 11.8 11.8 100.0 Total 17 100.0 100.0
private male Valid Neutral 19 26.4 26.4 26.4 Satisfied 41 56.9 56.9 83.3 Highly satisfied 12 16.7 16.7 100.0 Total 72 100.0 100.0
female Valid Neutral 6 46.2 46.2 46.2 Satisfied 6 46.2 46.2 92.3 Highly satisfied 1 7.7 7.7 100.0 Total 13 100.0 100.0

155
respondents in the private sector which is 56.9%. Similarly, the highest percentage of (88.2%)
was recorded for female respondents in the public sector as compared to the female
respondents which is 46.2% in the private sector. The perception of the employees towards
statement 3 of achievement is given as follows:
Table 5.36: Perception of Employees towards Statement 3 of Achievement in Public and Private Sectors
From the above results A3, it is revealed that the highest percentage (57.4%) of satisfaction
towards statement three of the achievement was shown by male respondents in the public
A3: Being able to do something worthwhile.
sector gender Frequency Percent Valid Percent
Cumulative
Percent
public male Valid Highly dissatisfied 1 1.5 1.5 1.5
Neutral 6 8.8 8.8 10.3
Satisfied 39 57.4 57.4 67.6
Highly satisfied 22 32.4 32.4 100.0
Total 68 100.0 100.0
female Valid Neutral 2 11.8 11.8 11.8
Satisfied 10 58.8 58.8 70.6
Highly satisfied 5 29.4 29.4 100.0
Total 17 100.0 100.0
private male Valid Dissatisfied 5 6.9 6.9 6.9
Neutral 35 48.6 48.6 55.6
Satisfied 28 38.9 38.9 94.4
Highly satisfied 4 5.6 5.6 100.0
Total 72 100.0 100.0
female Valid Dissatisfied 1 7.7 7.7 7.7
Neutral 6 46.2 46.2 53.8
Satisfied 6 46.2 46.2 100.0
Total 13 100.0 100.0

156
sector as compared male respondents in the private sector which is 38.9%. Similarly, the
highest percentage (58.8%) was recorded for female respondents in the public sector as
compared to female respondents which is 46.2% in the private sector. This shows that both
the male and female respondents are satisfied with the achievement factor in the public sector
as compared to the male and female respondents of the private sector.
The coding used to analyse the results of employees’ attitudes towards recognition includes:
R1, R2 and R3.The statements representing each coding of recognition are adopted from Aziz
(2013, pp. 176-179) and are presented as follows:
Table 5. 37: Statements of Recognition
Code Statement
REC1 The way I am noticed when I do a good job.
REC2 The way I get full credit for the work I do.
REC3 The recognition I get for the work I do.
To evaluate the results of the male and female respondents in the public and private sectors
towards achievement, a descriptive statistics was applied. The findings of statement one and
two of recognition (REC1) are given as follows:
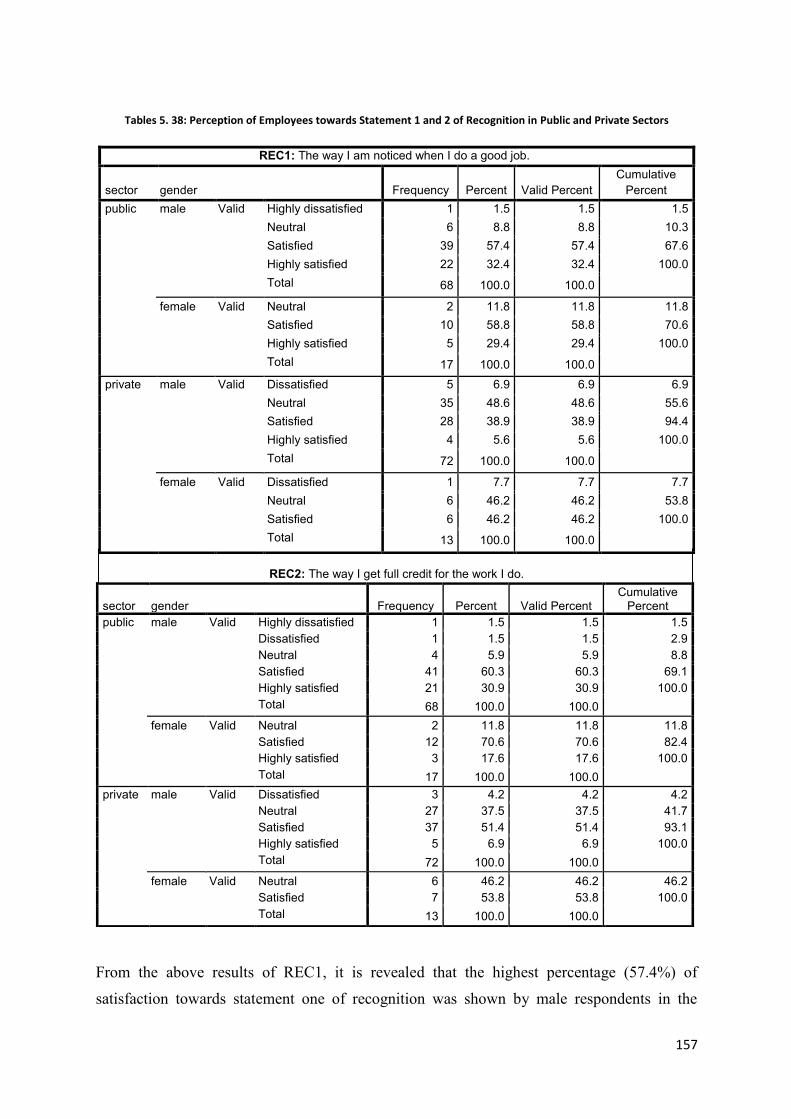
157
Tables 5. 38: Perception of Employees towards Statement 1 and 2 of Recognition in Public and Private Sectors
REC2: The way I get full credit for the work I do.
From the above results of REC1, it is revealed that the highest percentage (57.4%) of
satisfaction towards statement one of recognition was shown by male respondents in the
REC1: The way I am noticed when I do a good job.
sector gender Frequency Percent Valid Percent Cumulative
Percent public male Valid Highly dissatisfied 1 1.5 1.5 1.5
Neutral 6 8.8 8.8 10.3 Satisfied 39 57.4 57.4 67.6 Highly satisfied 22 32.4 32.4 100.0 Total 68 100.0 100.0
female Valid Neutral 2 11.8 11.8 11.8 Satisfied 10 58.8 58.8 70.6 Highly satisfied 5 29.4 29.4 100.0 Total 17 100.0 100.0
private male Valid Dissatisfied 5 6.9 6.9 6.9 Neutral 35 48.6 48.6 55.6 Satisfied 28 38.9 38.9 94.4 Highly satisfied 4 5.6 5.6 100.0 Total 72 100.0 100.0
female Valid Dissatisfied 1 7.7 7.7 7.7 Neutral 6 46.2 46.2 53.8 Satisfied 6 46.2 46.2 100.0 Total 13 100.0 100.0
sector gender Frequency Percent Valid Percent Cumulative
Percent public male Valid Highly dissatisfied 1 1.5 1.5 1.5
Dissatisfied 1 1.5 1.5 2.9 Neutral 4 5.9 5.9 8.8 Satisfied 41 60.3 60.3 69.1 Highly satisfied 21 30.9 30.9 100.0 Total 68 100.0 100.0
female Valid Neutral 2 11.8 11.8 11.8 Satisfied 12 70.6 70.6 82.4 Highly satisfied 3 17.6 17.6 100.0 Total 17 100.0 100.0
private male Valid Dissatisfied 3 4.2 4.2 4.2 Neutral 27 37.5 37.5 41.7 Satisfied 37 51.4 51.4 93.1 Highly satisfied 5 6.9 6.9 100.0 Total 72 100.0 100.0
female Valid Neutral 6 46.2 46.2 46.2 Satisfied 7 53.8 53.8 100.0 Total 13 100.0 100.0
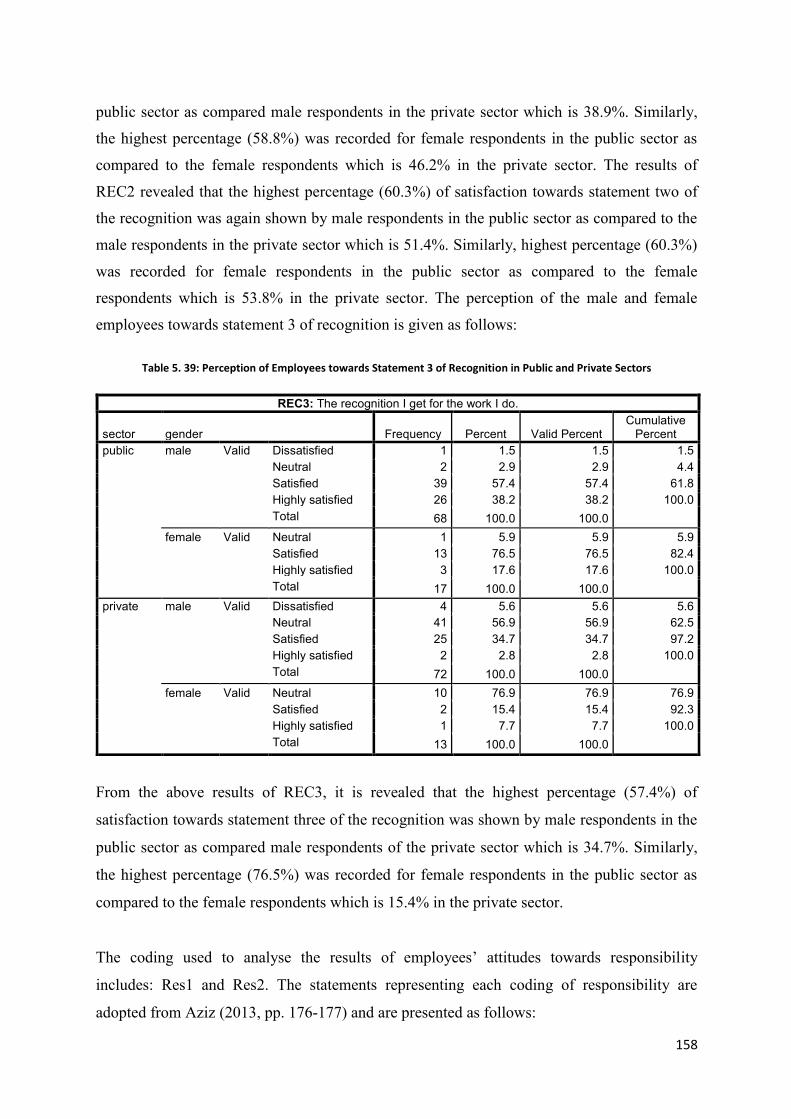
158
public sector as compared male respondents in the private sector which is 38.9%. Similarly,
the highest percentage (58.8%) was recorded for female respondents in the public sector as
compared to the female respondents which is 46.2% in the private sector. The results of
REC2 revealed that the highest percentage (60.3%) of satisfaction towards statement two of
the recognition was again shown by male respondents in the public sector as compared to the
male respondents in the private sector which is 51.4%. Similarly, highest percentage (60.3%)
was recorded for female respondents in the public sector as compared to the female
respondents which is 53.8% in the private sector. The perception of the male and female
employees towards statement 3 of recognition is given as follows:
Table 5. 39: Perception of Employees towards Statement 3 of Recognition in Public and Private Sectors
From the above results of REC3, it is revealed that the highest percentage (57.4%) of
satisfaction towards statement three of the recognition was shown by male respondents in the
public sector as compared male respondents of the private sector which is 34.7%. Similarly,
the highest percentage (76.5%) was recorded for female respondents in the public sector as
compared to the female respondents which is 15.4% in the private sector.
The coding used to analyse the results of employees’ attitudes towards responsibility
includes: Res1 and Res2. The statements representing each coding of responsibility are
adopted from Aziz (2013, pp. 176-177) and are presented as follows:
REC3: The recognition I get for the work I do.
sector gender Frequency Percent Valid Percent Cumulative
Percent public male Valid Dissatisfied 1 1.5 1.5 1.5
Neutral 2 2.9 2.9 4.4 Satisfied 39 57.4 57.4 61.8 Highly satisfied 26 38.2 38.2 100.0 Total 68 100.0 100.0
female Valid Neutral 1 5.9 5.9 5.9 Satisfied 13 76.5 76.5 82.4 Highly satisfied 3 17.6 17.6 100.0 Total 17 100.0 100.0
private male Valid Dissatisfied 4 5.6 5.6 5.6 Neutral 41 56.9 56.9 62.5 Satisfied 25 34.7 34.7 97.2 Highly satisfied 2 2.8 2.8 100.0 Total 72 100.0 100.0
female Valid Neutral 10 76.9 76.9 76.9 Satisfied 2 15.4 15.4 92.3 Highly satisfied 1 7.7 7.7 100.0 Total 13 100.0 100.0
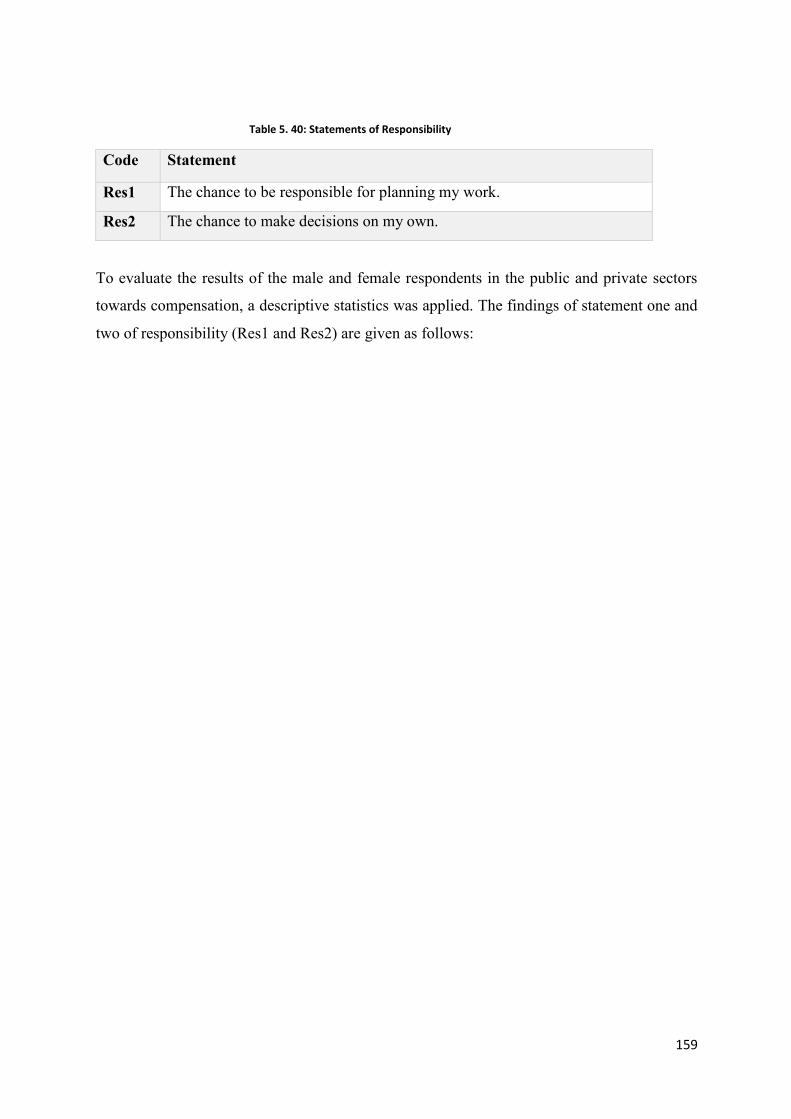
159
Table 5. 40: Statements of Responsibility
Code Statement
Res1 The chance to be responsible for planning my work.
Res2 The chance to make decisions on my own.
To evaluate the results of the male and female respondents in the public and private sectors
towards compensation, a descriptive statistics was applied. The findings of statement one and
two of responsibility (Res1 and Res2) are given as follows:
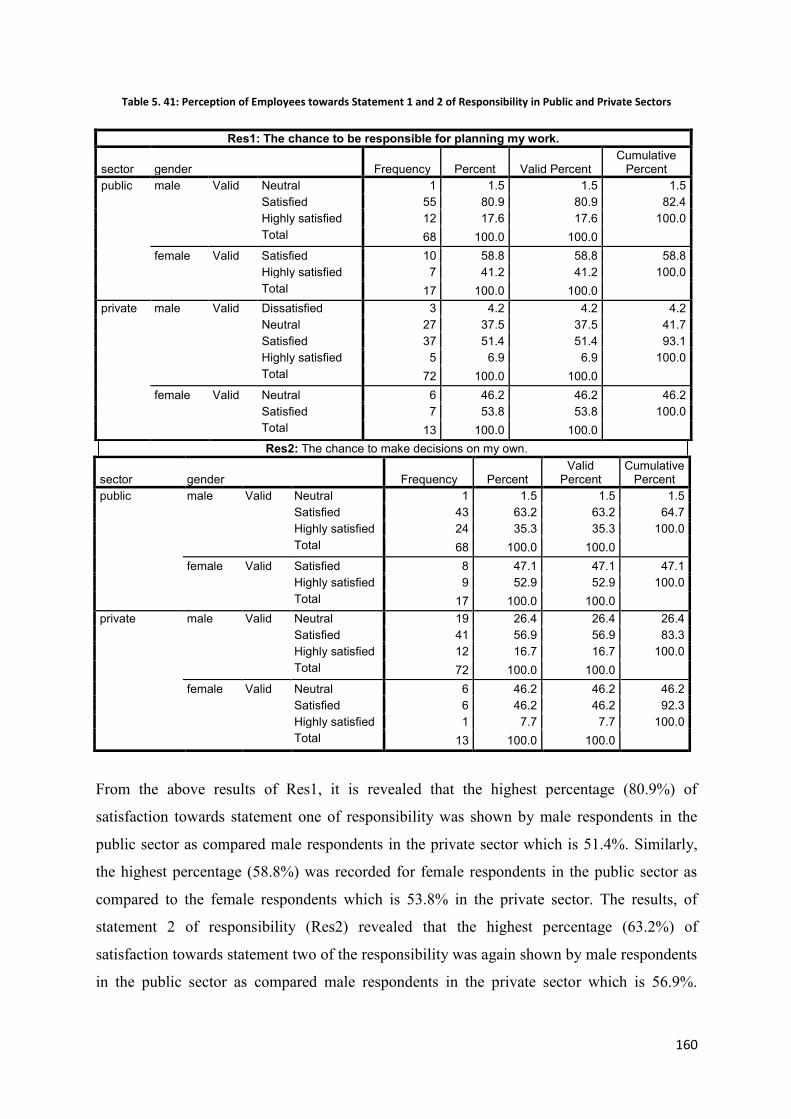
160
Table 5. 41: Perception of Employees towards Statement 1 and 2 of Responsibility in Public and Private Sectors
Res2: The chance to make decisions on my own.
From the above results of Res1, it is revealed that the highest percentage (80.9%) of
satisfaction towards statement one of responsibility was shown by male respondents in the
public sector as compared male respondents in the private sector which is 51.4%. Similarly,
the highest percentage (58.8%) was recorded for female respondents in the public sector as
compared to the female respondents which is 53.8% in the private sector. The results, of
statement 2 of responsibility (Res2) revealed that the highest percentage (63.2%) of
satisfaction towards statement two of the responsibility was again shown by male respondents
in the public sector as compared male respondents in the private sector which is 56.9%.
Res1: The chance to be responsible for planning my work.
sector gender Frequency Percent Valid Percent Cumulative
Percent public male Valid Neutral 1 1.5 1.5 1.5
Satisfied 55 80.9 80.9 82.4 Highly satisfied 12 17.6 17.6 100.0 Total 68 100.0 100.0
female Valid Satisfied 10 58.8 58.8 58.8 Highly satisfied 7 41.2 41.2 100.0 Total 17 100.0 100.0
private male Valid Dissatisfied 3 4.2 4.2 4.2 Neutral 27 37.5 37.5 41.7 Satisfied 37 51.4 51.4 93.1 Highly satisfied 5 6.9 6.9 100.0 Total 72 100.0 100.0
female Valid Neutral 6 46.2 46.2 46.2 Satisfied 7 53.8 53.8 100.0 Total 13 100.0 100.0
sector gender Frequency Percent Valid
Percent Cumulative
Percent public male Valid Neutral 1 1.5 1.5 1.5
Satisfied 43 63.2 63.2 64.7 Highly satisfied 24 35.3 35.3 100.0 Total 68 100.0 100.0
female Valid Satisfied 8 47.1 47.1 47.1 Highly satisfied 9 52.9 52.9 100.0 Total 17 100.0 100.0
private male Valid Neutral 19 26.4 26.4 26.4 Satisfied 41 56.9 56.9 83.3 Highly satisfied 12 16.7 16.7 100.0 Total 72 100.0 100.0
female Valid Neutral 6 46.2 46.2 46.2 Satisfied 6 46.2 46.2 92.3 Highly satisfied 1 7.7 7.7 100.0 Total 13 100.0 100.0

161
Similarly, the highest percentage (52.9%) was recorded for female respondents in the public
sector as compared to the female respondents which is 46.2% in the private sector.
5.4 Data Screening
The term data screening is considered as the first and foremost procedure of ensuring that
data is free from errors. Most of the researchers use this process in their studies to examine
the precision of the data used. With the help of data screening, one can identify the errors in
different variables and their score values.
In the view of Hair et al. (2006) the rationale for using data the screening process is to make
sure any hidden values are detected and to expose the accurate data to make it clean and
purified. Furthermore, based on the importance of the data screening, Tabachnick and Fidell
(2013), suggests that the process of data screening works in a certain order by which it has
some steps which need to be followed before conducting an analysis. Tabachnick and Fidell
(2013) demonstrated that this data screening order affects the decisions taken before and not
after the analysis. This shows that if the data possesses some outliers and is not normally
distributed, then the researcher decides to eliminate that problematic value or tries to
transform that score.
However, if the process of transformation is applied at the initial stage then it will result in
the minimum occurrence of outliers, and when the outliers are removed or transformed first,
then there is the probability of small amounts of factors showing non-normal distribution.
With the help of transformation techniques, the outlier’s quantity could be decreased showing
normal distribution of the data, linear relationship between dependent and independent
variables and homoscedastic results. Data that undergoes screening is quite reliable and
accurate to be used for further tests. In this study, the researcher accesses certain issues which
include outliers, missing data and normality. These problems may have effects on the
correlation between the dependent and independent variables.
Tabachnick and Fidell (2013) stated that before conducting the main analysis of the research
project, it is crucial to consider the issues as mentioned earlier associated with the data. This
process of data screening helps this research to interpret the relationship between different
factors.
162
5.4.1 Missing Data
“Missing data are ubiquitous in psychological research” (Allison, 2001, p.72). This means
that missing data are quite visible in data analysis which arises when the participants decline
to provide information or fail to respond to the items and the evaluation of the statements due
to various factors such as providing personal details and filling in time-consuming survey
questionnaires (Hair et al. 2006). Schlomer (2010) suggested that the right way to deal with
an issue of missing data is to adopt various steps missing this matter before further analysis.
The two main aspects associated with missing data are the amount of data missing in the
research project, and the pattern of the missing data which are considered to be the most
concerning problem. Different methods are introduced by various researchers to overcome the
problem of missing data; either by deleting the cases or the variables of the participants who
failed to provide information or by using mean or median scores instead. The degree to which
the problem of missing data could be overcome also depends on the percentage of the missing
data. For example, if the proportion of the missing data is approximately five per cent or less
than that 5%, then it is not considered to create any problem in the study; and hence could be
dealt with using one of the above-mentioned techniques. The application of these methods
will produce same results (Tabachnick & Fidell, 2007).
In this research, project researcher has overcome the problem of missing data with the
application of the median replacement technique, as it is considered to be a more appropriate
method than the mean replacement technique to overcome the issue of missing data. It helps
to produce the missing scores of the variables which showed that the data had missed values
less than five per cent. The median value replaces these values without causing any problem
to the main data. The Likert-type data is much suitable to use for median replacement method
rather than mean scores (Lynch, 2003). (See Appendix B)

163
5.4.2 Linearity
The concept of linearity is used to indicate the relationship between variables; if the result
reveals a straight line, then this means the correlation is linear (Tabachnick & Fidell, 2007).
This also means that before carrying out further analysis such as factor analysis, a simple
multiple regression, structural equation modelling and logistic regression, it is considered an
important technique to test the correlation between different variables (Hair et al. 2006). For
statistical measures, linearity is measured with the help of a scatter plot or Pearson’s
correlation (Field, 2009).
To determine the connection between the independent variables and the dependent variable,
the researcher uses the Pearson’s correlation technique in this research. The results are given
in Table 5.42 as shown below.
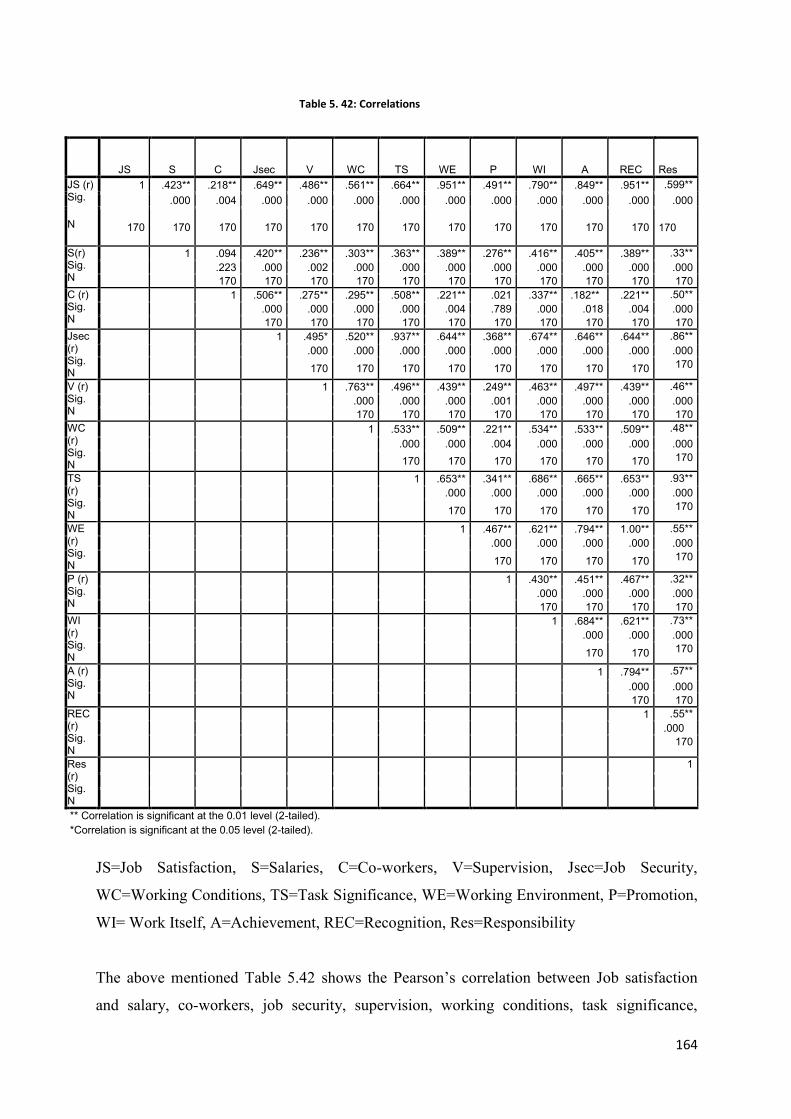
164
JS=Job Satisfaction, S=Salaries, C=Co-workers, V=Supervision, Jsec=Job Security,
WC=Working Conditions, TS=Task Significance, WE=Working Environment, P=Promotion,
WI= Work Itself, A=Achievement, REC=Recognition, Res=Responsibility
The above mentioned Table 5.42 shows the Pearson’s correlation between Job satisfaction
and salary, co-workers, job security, supervision, working conditions, task significance,
Table 5. 42: Correlations
JS S C Jsec V WC TS WE P WI A REC
Res JS (r) Sig.
N
1 .423** .218** .649** .486** .561** .664** .951** .491** .790** .849** .951** .599** .000 .004 .000 .000 .000 .000 .000 .000 .000 .000 .000 .000
170 170 170 170 170 170 170 170 170 170 170 170 170
S(r) Sig. N
1 .094 .420** .236** .303** .363** .389** .276** .416** .405** .389** .33** .223 .000 .002 .000 .000 .000 .000 .000 .000 .000 .000
170 170 170 170 170 170 170 170 170 170 170 C (r) Sig. N
1 .506** .275** .295** .508** .221** .021 .337** .182** .221** .50** .000 .000 .000 .000 .004 .789 .000 .018 .004 .000 170 170 170 170 170 170 170 170 170 170
Jsec (r) Sig. N
1 .495* .520** .937** .644** .368** .674** .646** .644** .86** .000 .000 .000 .000 .000 .000 .000 .000 .000 170 170 170 170 170 170 170 170 170
V (r) Sig. N
1 .763** .496** .439** .249** .463** .497** .439** .46** .000 .000 .000 .001 .000 .000 .000 .000 N 170 170 170 170 170 170 170 170
WC (r) Sig. N
1 .533** .509** .221** .534** .533** .509** .48** .000 .000 .004 .000 .000 .000 .000 N 170 170 170 170 170 170 170
TS (r) Sig. N
1 .653** .341** .686** .665** .653** .93** .000 .000 .000 .000 .000 .000 N 170 170 170 170 170 170
WE (r) Sig. N
1 .467** .621** .794** 1.00** .55** .000 .000 .000 .000 .000 N 170 170 170 170 170
P (r) Sig. N
1 .430** .451** .467** .32** .000 .000 .000 .000 N 170 170 170 170
WI (r) Sig. N
1 .684** .621** .73** .000 .000 .000 N 170 170 170
A (r) Sig. N
1 .794** .57** .000 .000 N 170 170
REC (r) Sig. N
1 .55** .000 N 170
Res (r) Sig. N
1 N
** Correlation is significant at the 0.01 level (2-tailed). *Correlation is significant at the 0.05 level (2-tailed).
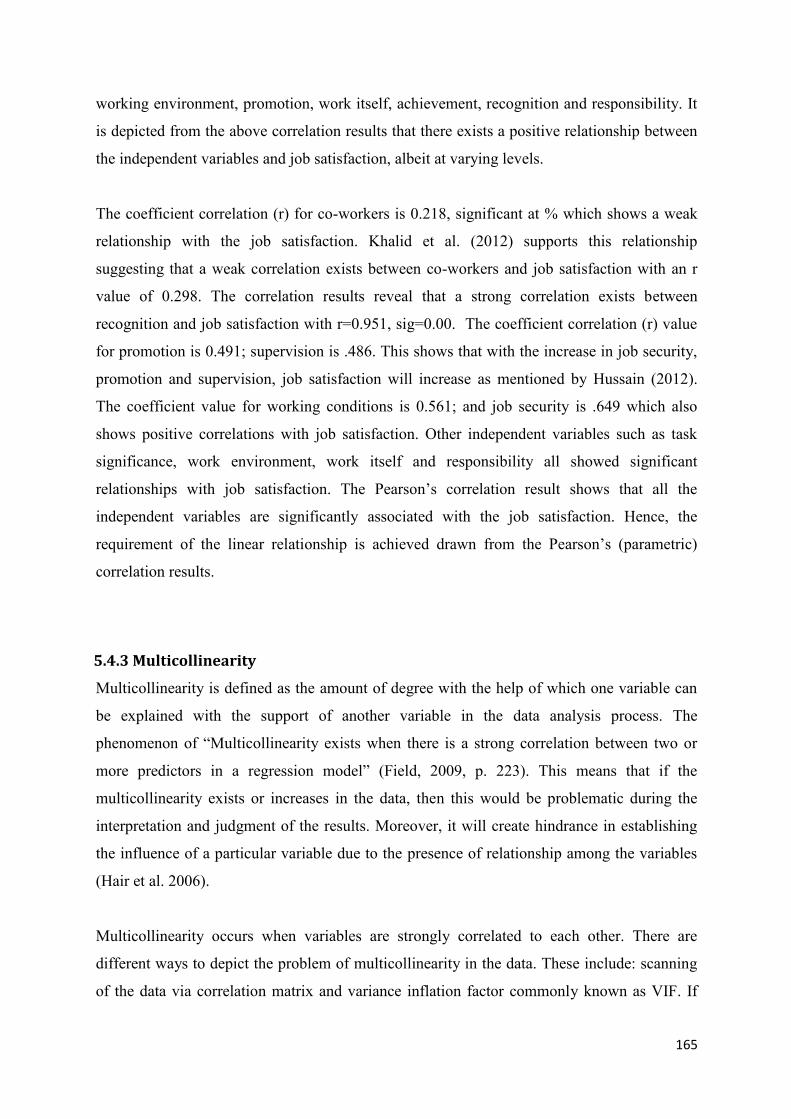
165
working environment, promotion, work itself, achievement, recognition and responsibility. It
is depicted from the above correlation results that there exists a positive relationship between
the independent variables and job satisfaction, albeit at varying levels.
The coefficient correlation (r) for co-workers is 0.218, significant at % which shows a weak
relationship with the job satisfaction. Khalid et al. (2012) supports this relationship
suggesting that a weak correlation exists between co-workers and job satisfaction with an r
value of 0.298. The correlation results reveal that a strong correlation exists between
recognition and job satisfaction with r=0.951, sig=0.00. The coefficient correlation (r) value
for promotion is 0.491; supervision is .486. This shows that with the increase in job security,
promotion and supervision, job satisfaction will increase as mentioned by Hussain (2012).
The coefficient value for working conditions is 0.561; and job security is .649 which also
shows positive correlations with job satisfaction. Other independent variables such as task
significance, work environment, work itself and responsibility all showed significant
relationships with job satisfaction. The Pearson’s correlation result shows that all the
independent variables are significantly associated with the job satisfaction. Hence, the
requirement of the linear relationship is achieved drawn from the Pearson’s (parametric)
correlation results.
5.4.3 Multicollinearity
Multicollinearity is defined as the amount of degree with the help of which one variable can
be explained with the support of another variable in the data analysis process. The
phenomenon of “Multicollinearity exists when there is a strong correlation between two or
more predictors in a regression model” (Field, 2009, p. 223). This means that if the
multicollinearity exists or increases in the data, then this would be problematic during the
interpretation and judgment of the results. Moreover, it will create hindrance in establishing
the influence of a particular variable due to the presence of relationship among the variables
(Hair et al. 2006).
Multicollinearity occurs when variables are strongly correlated to each other. There are
different ways to depict the problem of multicollinearity in the data. These include: scanning
of the data via correlation matrix and variance inflation factor commonly known as VIF. If
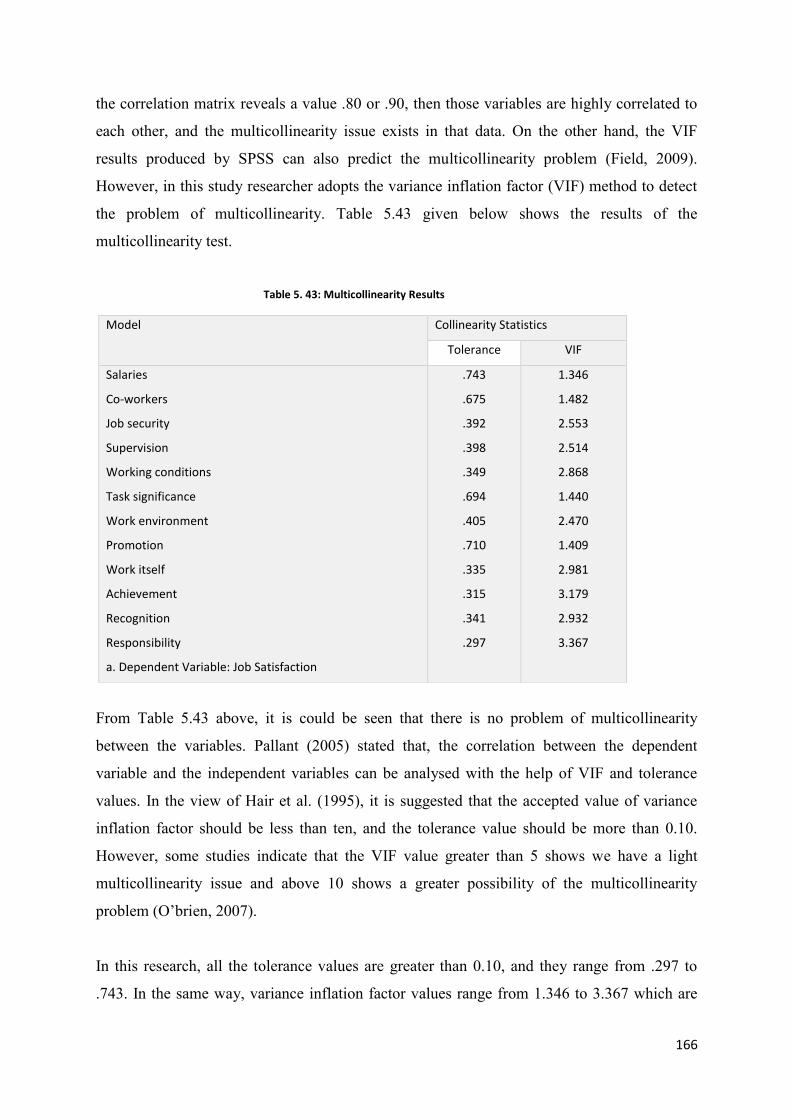
166
the correlation matrix reveals a value .80 or .90, then those variables are highly correlated to
each other, and the multicollinearity issue exists in that data. On the other hand, the VIF
results produced by SPSS can also predict the multicollinearity problem (Field, 2009).
However, in this study researcher adopts the variance inflation factor (VIF) method to detect
the problem of multicollinearity. Table 5.43 given below shows the results of the
multicollinearity test.
Table 5. 43: Multicollinearity Results
From Table 5.43 above, it is could be seen that there is no problem of multicollinearity
between the variables. Pallant (2005) stated that, the correlation between the dependent
variable and the independent variables can be analysed with the help of VIF and tolerance
values. In the view of Hair et al. (1995), it is suggested that the accepted value of variance
inflation factor should be less than ten, and the tolerance value should be more than 0.10.
However, some studies indicate that the VIF value greater than 5 shows we have a light
multicollinearity issue and above 10 shows a greater possibility of the multicollinearity
problem (O’brien, 2007).
In this research, all the tolerance values are greater than 0.10, and they range from .297 to
.743. In the same way, variance inflation factor values range from 1.346 to 3.367 which are
Model Collinearity Statistics
Tolerance VIF
Salaries
Co-workers
Job security
Supervision
Working conditions
Task significance
Work environment
Promotion
Work itself
Achievement
Recognition
Responsibility
a. Dependent Variable: Job Satisfaction
.743
.675
.392
.398
.349
.694
.405
.710
.335
.315
.341
.297
1.346
1.482
2.553
2.514
2.868
1.440
2.470
1.409
2.981
3.179
2.932
3.367
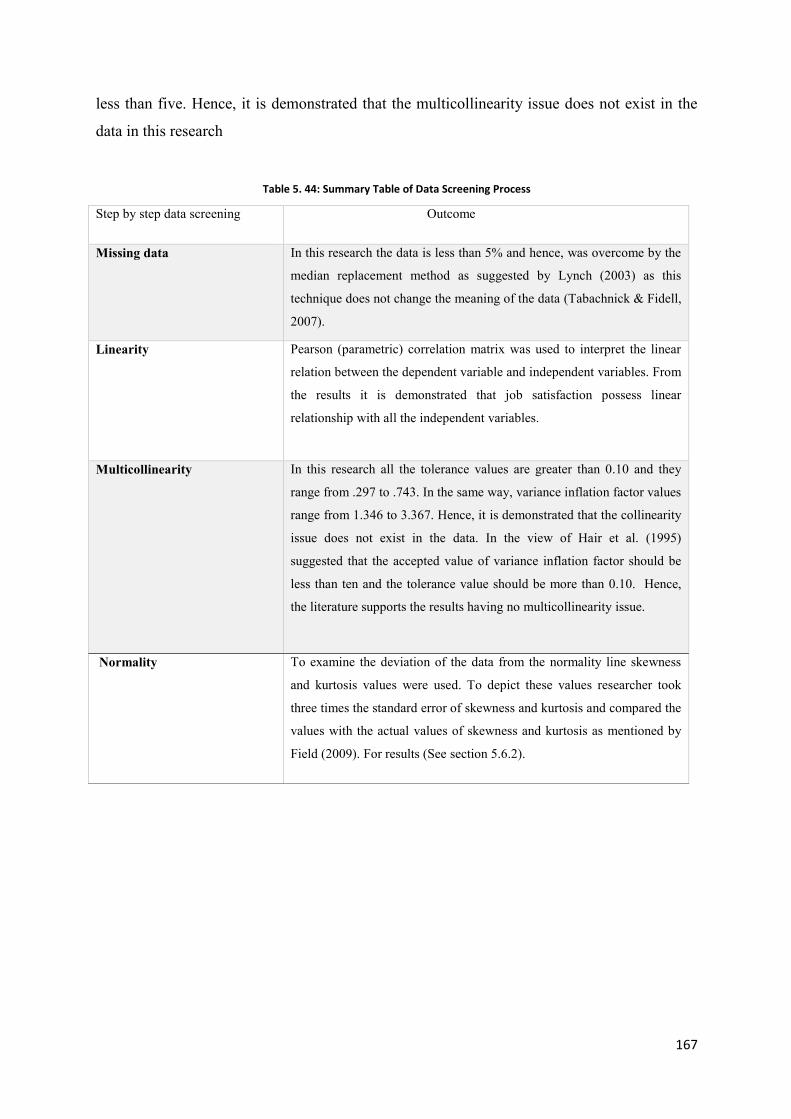
167
less than five. Hence, it is demonstrated that the multicollinearity issue does not exist in the
data in this research
Table 5. 44: Summary Table of Data Screening Process
Step by step data screening Outcome
Missing data In this research the data is less than 5% and hence, was overcome by the
median replacement method as suggested by Lynch (2003) as this
technique does not change the meaning of the data (Tabachnick & Fidell,
2007).
Linearity Pearson (parametric) correlation matrix was used to interpret the linear
relation between the dependent variable and independent variables. From
the results it is demonstrated that job satisfaction possess linear
relationship with all the independent variables.
Multicollinearity
In this research all the tolerance values are greater than 0.10 and they
range from .297 to .743. In the same way, variance inflation factor values
range from 1.346 to 3.367. Hence, it is demonstrated that the collinearity
issue does not exist in the data. In the view of Hair et al. (1995)
suggested that the accepted value of variance inflation factor should be
less than ten and the tolerance value should be more than 0.10. Hence,
the literature supports the results having no multicollinearity issue.
Normality
To examine the deviation of the data from the normality line skewness
and kurtosis values were used. To depict these values researcher took
three times the standard error of skewness and kurtosis and compared the
values with the actual values of skewness and kurtosis as mentioned by
Field (2009). For results (See section 5.6.2).
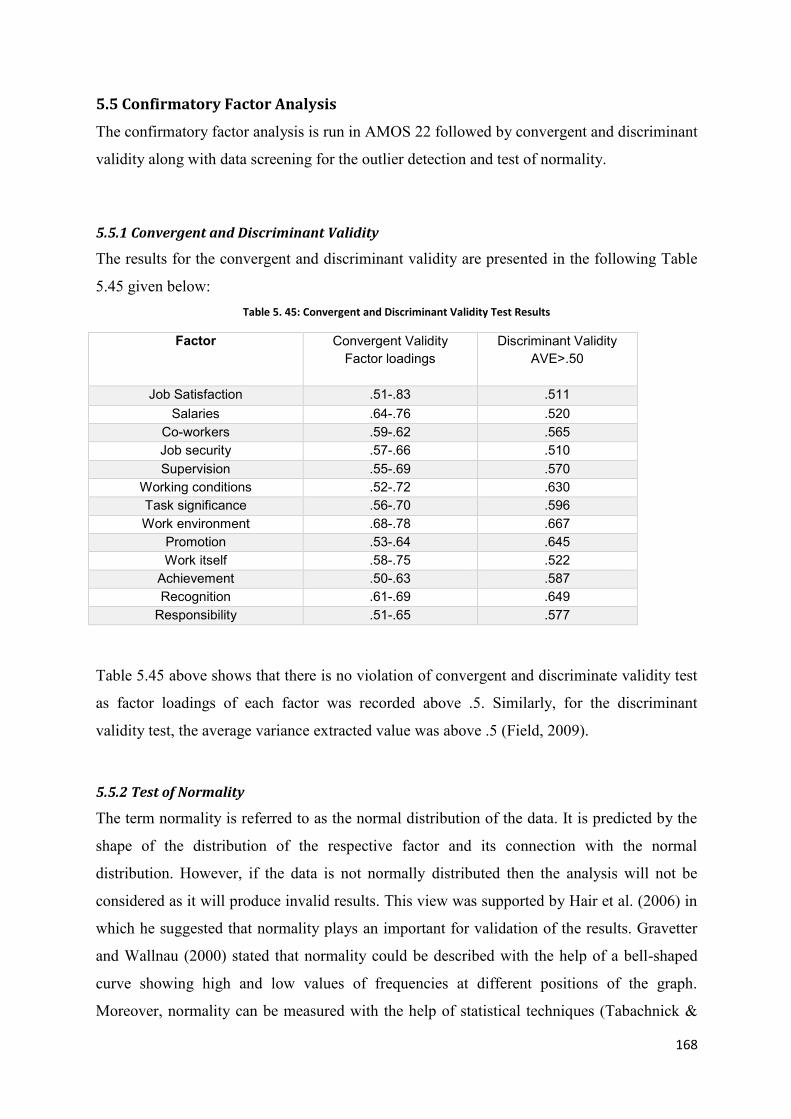
168
5.5 Confirmatory Factor Analysis
The confirmatory factor analysis is run in AMOS 22 followed by convergent and discriminant
validity along with data screening for the outlier detection and test of normality.
5.5.1 Convergent and Discriminant Validity
The results for the convergent and discriminant validity are presented in the following Table
5.45 given below: Table 5. 45: Convergent and Discriminant Validity Test Results
Factor Convergent Validity Factor loadings
Discriminant Validity AVE>.50
Job Satisfaction .51-.83 .511 Salaries .64-.76 .520
Co-workers .59-.62 .565 Job security .57-.66 .510 Supervision .55-.69 .570
Working conditions .52-.72 .630 Task significance .56-.70 .596 Work environment .68-.78 .667
Promotion .53-.64 .645 Work itself .58-.75 .522
Achievement .50-.63 .587 Recognition .61-.69 .649
Responsibility .51-.65 .577
Table 5.45 above shows that there is no violation of convergent and discriminate validity test
as factor loadings of each factor was recorded above .5. Similarly, for the discriminant
validity test, the average variance extracted value was above .5 (Field, 2009).
5.5.2 Test of Normality
The term normality is referred to as the normal distribution of the data. It is predicted by the
shape of the distribution of the respective factor and its connection with the normal
distribution. However, if the data is not normally distributed then the analysis will not be
considered as it will produce invalid results. This view was supported by Hair et al. (2006) in
which he suggested that normality plays an important for validation of the results. Gravetter
and Wallnau (2000) stated that normality could be described with the help of a bell-shaped
curve showing high and low values of frequencies at different positions of the graph.
Moreover, normality can be measured with the help of statistical techniques (Tabachnick &
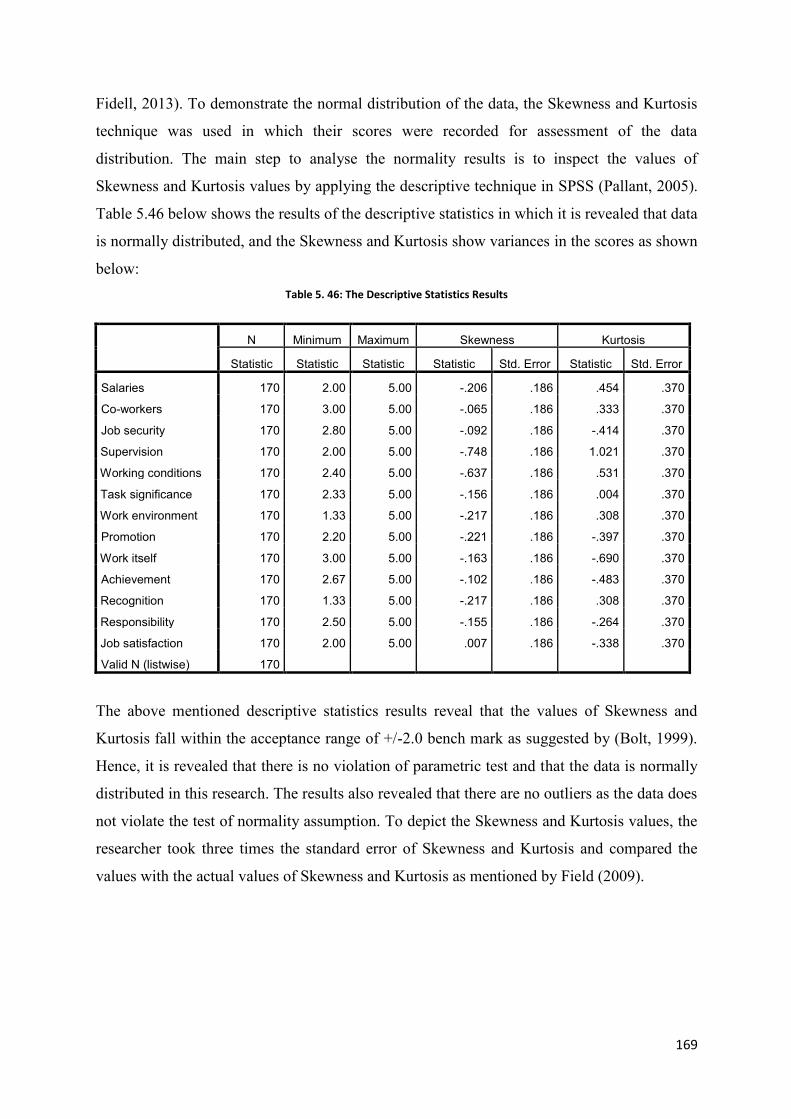
169
Fidell, 2013). To demonstrate the normal distribution of the data, the Skewness and Kurtosis
technique was used in which their scores were recorded for assessment of the data
distribution. The main step to analyse the normality results is to inspect the values of
Skewness and Kurtosis values by applying the descriptive technique in SPSS (Pallant, 2005).
Table 5.46 below shows the results of the descriptive statistics in which it is revealed that data
is normally distributed, and the Skewness and Kurtosis show variances in the scores as shown
below: Table 5. 46: The Descriptive Statistics Results
N Minimum Maximum Skewness Kurtosis
Statistic Statistic Statistic Statistic Std. Error Statistic Std. Error
Salaries 170 2.00 5.00 -.206 .186 .454 .370
Co-workers 170 3.00 5.00 -.065 .186 .333 .370
Job security 170 2.80 5.00 -.092 .186 -.414 .370
Supervision 170 2.00 5.00 -.748 .186 1.021 .370
Working conditions 170 2.40 5.00 -.637 .186 .531 .370
Task significance 170 2.33 5.00 -.156 .186 .004 .370
Work environment 170 1.33 5.00 -.217 .186 .308 .370
Promotion 170 2.20 5.00 -.221 .186 -.397 .370
Work itself 170 3.00 5.00 -.163 .186 -.690 .370
Achievement 170 2.67 5.00 -.102 .186 -.483 .370
Recognition 170 1.33 5.00 -.217 .186 .308 .370
Responsibility 170 2.50 5.00 -.155 .186 -.264 .370
Job satisfaction 170 2.00 5.00 .007 .186 -.338 .370
Valid N (listwise) 170
The above mentioned descriptive statistics results reveal that the values of Skewness and
Kurtosis fall within the acceptance range of +/-2.0 bench mark as suggested by (Bolt, 1999).
Hence, it is revealed that there is no violation of parametric test and that the data is normally
distributed in this research. The results also revealed that there are no outliers as the data does
not violate the test of normality assumption. To depict the Skewness and Kurtosis values, the
researcher took three times the standard error of Skewness and Kurtosis and compared the
values with the actual values of Skewness and Kurtosis as mentioned by Field (2009).
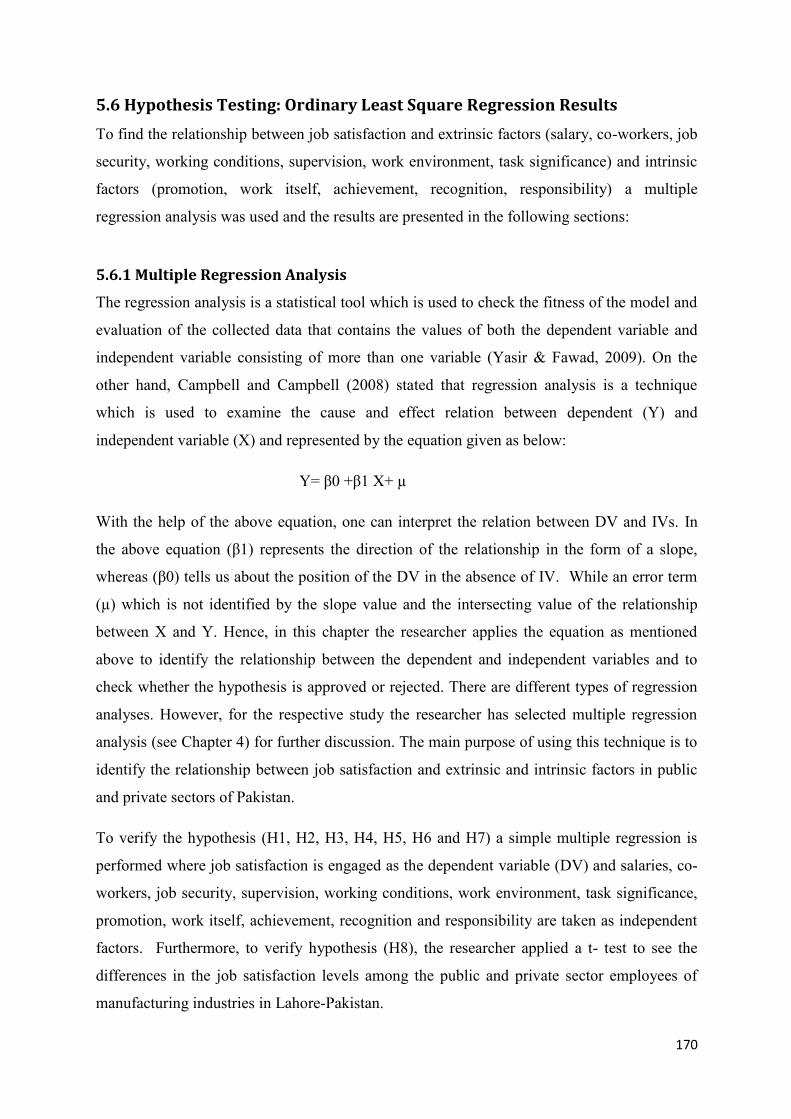
170
5.6 Hypothesis Testing: Ordinary Least Square Regression Results
To find the relationship between job satisfaction and extrinsic factors (salary, co-workers, job
security, working conditions, supervision, work environment, task significance) and intrinsic
factors (promotion, work itself, achievement, recognition, responsibility) a multiple
regression analysis was used and the results are presented in the following sections:
5.6.1 Multiple Regression Analysis
The regression analysis is a statistical tool which is used to check the fitness of the model and
evaluation of the collected data that contains the values of both the dependent variable and
independent variable consisting of more than one variable (Yasir & Fawad, 2009). On the
other hand, Campbell and Campbell (2008) stated that regression analysis is a technique
which is used to examine the cause and effect relation between dependent (Y) and
independent variable (X) and represented by the equation given as below:
Y= β0 +β1 X+ µ
With the help of the above equation, one can interpret the relation between DV and IVs. In
the above equation (β1) represents the direction of the relationship in the form of a slope,
whereas (β0) tells us about the position of the DV in the absence of IV. While an error term
(µ) which is not identified by the slope value and the intersecting value of the relationship
between X and Y. Hence, in this chapter the researcher applies the equation as mentioned
above to identify the relationship between the dependent and independent variables and to
check whether the hypothesis is approved or rejected. There are different types of regression
analyses. However, for the respective study the researcher has selected multiple regression
analysis (see Chapter 4) for further discussion. The main purpose of using this technique is to
identify the relationship between job satisfaction and extrinsic and intrinsic factors in public
and private sectors of Pakistan.
To verify the hypothesis (H1, H2, H3, H4, H5, H6 and H7) a simple multiple regression is
performed where job satisfaction is engaged as the dependent variable (DV) and salaries, co-
workers, job security, supervision, working conditions, work environment, task significance,
promotion, work itself, achievement, recognition and responsibility are taken as independent
factors. Furthermore, to verify hypothesis (H8), the researcher applied a t- test to see the
differences in the job satisfaction levels among the public and private sector employees of
manufacturing industries in Lahore-Pakistan.
171
The output of the regression analysis demonstrated the coefficients from latent factors to job
satisfaction. The R-square value helps to identify the model fitness where the private sector
and public sectors are used as dummy variables. Table 5.47 below shows the results of the
testing of hypothesis.
Table 5. 47: Results of a Multiple-Regression including all Independent Variables (Model 1)
Coefficients
Model
Coefficient (B) t Sig.
1 (Constant) 2.833 6.915 .000
Average_Salaries .166 1.773 .081
Average_Co-workers .293 1.897 .062
Average_Job_security .761 11.069 .000*
Average_Supervision .515 7.211 .000*
Average_Working_conditions .644 8.794 .000*
Average_Task_significance .702 .428 .000*
Average_Work_environment .847 .177 .000*
Average_Promotion .241 .466 .000*
Average_Work_itself .625 .790 .000*
Average_Achievement .721 1.01 .000*
Average_Recognition .904 .847 .000*
Average_Responsibility .359 .623 .000*
a. Dependent Variable: Average_Job _Satisfaction b. * sig. at 1%
Model Summary
Model R R Square Adjusted R Square F Std. Error of the
Estimate
Sig.
1 .831 .691 .671 34.664 1.77092 .000
a. Predictors: (Constant), Average_Salaries, Average_ Co-workers, Average_Job_security,
Average_Supervision, Average_Working_conditions, Average_Task_significance,
Average_Work_environment, Average_Promotion, Average_Work_itself, Average_Achievement,
Average_Recognition, Average_Responsibility
b. Dependent Variable: Average_Job_Satisfaction

172
The model summary table demonstrates that the value of R-square is 69.1% which shows that
69.1% variation in the dependent variable (Job Satisfaction) is due to salaries, co-workers, job
security, supervision, working conditions, task significance, work environment, promotion,
work itself, achievement, recognition and responsibility and remaining 30.9% is due to other
factors. F-test indicates that the observed R-squared is reliable, and is not a spurious result of
oddities in the data set. F-value (34.664) is significant at 1%. Hence, we can say that model
under study is a good fit.
Regression Equation
JS = β0 +β1 S +β2 C +β3 Jsec +β4 V+ β5 WC+ β6TS+ β7WE+ β8P+ β9WI+ β10A+ β11REC+ β12 Res+ µ
Whereas, JS= job satisfaction, S =Salaries, C= Co-worker, Jsec=Job security, V=Supervision,
WC=Working conditions, TS=Task significance, WE=Working environment, P=Promotion,
WI=Work itself, A=Achievement, REC=Recognition, Res=Responsibility
Estimated regression Equation:
JS=2.833+.166S+.293C+.761Jsec+.515V+.644WC+.702TS+.847WE+.241P+.625WI+.721A+.90
4REC+.359Res+ µ
The Constant (β0) is 2.833 which mean that if all factors are held constant the job satisfaction
(JS) will equal to 2.833. Beta value of salaries is .166, which means that with the change in
salaries (S) by one degree, JS will change in the same direction by .166 degrees. B value of C
is .293, which means with the change (increase/decrease) in C by one degree will bring
change (increase/decrease) in JS by .293 degrees in the same direction. The B value of job
security (Jsec) is .761, which means with the one degree change in job security, JS will
change in the same direction by .761degrees. The B value of supervision (V) is .515, which
means with the increase or decrease of one degree in the value of V, the JS will increase or
decrease by .515 degrees. The B value of working conditions (WC=.644), task significance
(TS=.702), working environment (WE=.847), promotion (P=.241), work itself (WI=.625),
achievement (A=.721), recognition (REC=.904) and responsibility (Res=.359).
All the independent variables have a positive relationship with dependent variable (JS), which
means that with the increase in independent variable, the dependent variable will also increase
and vice versa. The results of t-value shows that salaries (t=1.773, sig=.081) and co-workers
(t=1.897, sig=.062) has an insignificant relationship with job satisfaction. Whereas, job
security (t=11.089 , sig=.000), supervision (t=7.211, sig=.000), working conditions (t=8.794,
sig=.000), task significance (t=.428, sig=.000), work environment (t=.177, sig=.000),
173
promotion (t=.488, sig=.000), work itself (t=.790, sig=.000), achievement (t=1.01, sig=.000),
recognition (t=.847, sig=.000), and responsibility (t=.623, sig=.000), have a significant
relationship with JS at 1% significance level.
The model summary table demonstrates that salaries contributes 16.6% and co-workers
contributes 29.3% towards job satisfaction with the significance value of .081 for salaries and
.062 for co-workers which is more than .05 as suggested by Field (2009) that the value should
not be greater than .05 to show significance level. This means that the relationship between
job satisfaction and salaries and co-workers is weak. However, it is considered as a positive
correlation. In the next section, research has presented the results of relationship between
dependent and independent variables along with interactions.
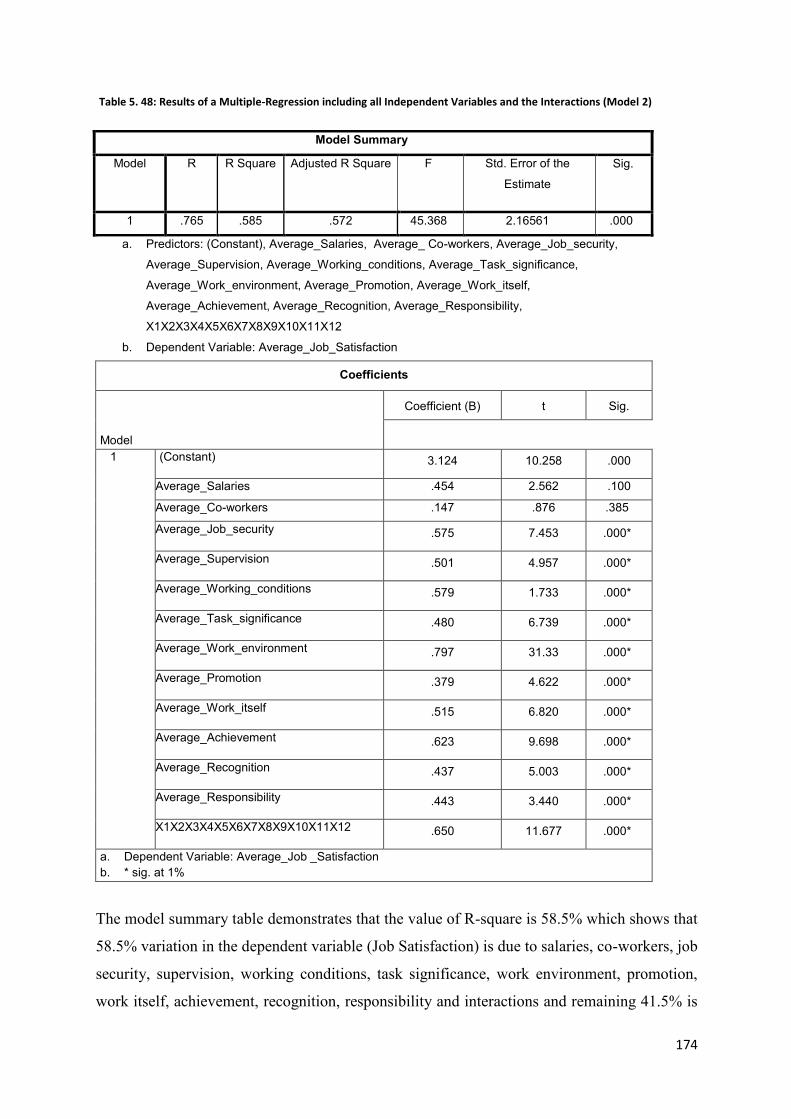
174
Table 5. 48: Results of a Multiple-Regression including all Independent Variables and the Interactions (Model 2)
Coefficients
Model
Coefficient (B) t Sig.
1 (Constant) 3.124 10.258 .000
Average_Salaries .454 2.562 .100
Average_Co-workers .147 .876 .385
Average_Job_security .575 7.453 .000*
Average_Supervision .501 4.957 .000*
Average_Working_conditions .579 1.733 .000*
Average_Task_significance .480 6.739 .000*
Average_Work_environment .797 31.33 .000*
Average_Promotion .379 4.622 .000*
Average_Work_itself .515 6.820 .000*
Average_Achievement .623 9.698 .000*
Average_Recognition .437 5.003 .000*
Average_Responsibility .443 3.440 .000*
X1X2X3X4X5X6X7X8X9X10X11X12 .650 11.677 .000*
a. Dependent Variable: Average_Job _Satisfaction b. * sig. at 1%
The model summary table demonstrates that the value of R-square is 58.5% which shows that
58.5% variation in the dependent variable (Job Satisfaction) is due to salaries, co-workers, job
security, supervision, working conditions, task significance, work environment, promotion,
work itself, achievement, recognition, responsibility and interactions and remaining 41.5% is
Model Summary
Model R R Square Adjusted R Square F Std. Error of the
Estimate
Sig.
1 .765 .585 .572 45.368 2.16561 .000
a. Predictors: (Constant), Average_Salaries, Average_ Co-workers, Average_Job_security,
Average_Supervision, Average_Working_conditions, Average_Task_significance,
Average_Work_environment, Average_Promotion, Average_Work_itself,
Average_Achievement, Average_Recognition, Average_Responsibility,
X1X2X3X4X5X6X7X8X9X10X11X12
b. Dependent Variable: Average_Job_Satisfaction
175
due to other factors. F-test indicates that the observed R-squared is reliable, and is not a
spurious result of oddities in the data set. F-value (45.368) is significant at 1%. Hence, we can
say that model under study is a good fit.
Regression Equation
JS = β0 +β1 S +β2 C +β3 Jsec +β4 V+ β5 WC+ β6TS+ β7WE+ β8P+ β9WI+ β10A+ β11REC+ β12 Res+
(β X1. X2. X3 .X4 .X5. X6. X7.X8.X9.X10.X11.X12) + µ
Whereas, JS= job satisfaction, S =Salaries, C= Co-worker, Jsec=Job security, V=Supervision,
WC=Working conditions, TS=Task significance, WE=Working environment, P=Promotion,
WI=Work itself, A=Achievement, REC=Recognition, Res=Responsibility
Estimated regression Equation:
JS=3.124+.454S+.147C+.575Jsec+.501V+.579WC+.480TS+.797WE+.379P+.515WI+.623A+.43
7REC+.443Res+ (.650 X1. X2. X3 .X4 .X5. X6. X7.X8.X9.X10.X11.X12) + µ
The Constant (β0) is 3.124 which mean that if all factors are held constant the job satisfaction
(JS) will equal to 3.124. Beta value of salaries is .454, which means that with the change in
salaries (S) by one degree, JS will change in the same direction by .454 degrees. B value of C
is .147, which means with the change (increase/decrease) in C by one degree will bring
change (increase/decrease) in JS by .147 degrees in the same direction. The B value of job
security (Jsec) is .575, which means with the one degree change in job security, JS will
change in the same direction by .575 degrees. The B value of supervision (V) is .501, which
means with the increase or decrease of one degree in the value of V, the JS will increase or
decrease by .501 degrees. The B value of working conditions (WC=.579), task significance
(TS=.480), working environment (WE=.797), promotion (P=.379), work itself (WI=.515),
achievement (A=.623), recognition (REC=.437), responsibility (Res=.443) and the beta value
of interactions is equal to .650.
All the independent variables have a positive relationship with dependent variable (JS), which
means that with the increase in independent variable, the dependent variable will also increase
and vice versa. The results of t-value shows that salaries (t=2.562, sig=.100) and co-workers
(t=876, sig=.385) has an insignificant relationship with job satisfaction. Whereas, job security
(t=7.453, sig=.000), supervision (t=4.957, sig=.000), working conditions (t=1.733, sig=.000),
task significance (t=6.739, sig=.000), work environment (t=31.33, sig=.000), promotion
176
(t=4.622, sig=.000), work itself (t=6.820, sig=.000), achievement (t=9.698, sig=.000),
recognition (t=5.003, sig=.000), responsibility (t=3.440, sig=.000) and interaction terms
(t=11.677, sig=.000) have a significant relationship with JS at 1% significance level.
The model summary table demonstrates that salaries contributes 45.4% and co-workers
contributes 14.7% towards job satisfaction with the significance value of .100 for salaries and
.385 for co-workers which is more than .05 as suggested by Field (2005) that the value should
not be greater than .05 to show significance level. This means that the relationship between
job satisfaction and salaries and co-workers is weak. However, it is considered as a positive
correlation. In the next table, researcher has presented the results of relationship between
dependent and independent variables along with interactions and control variables.
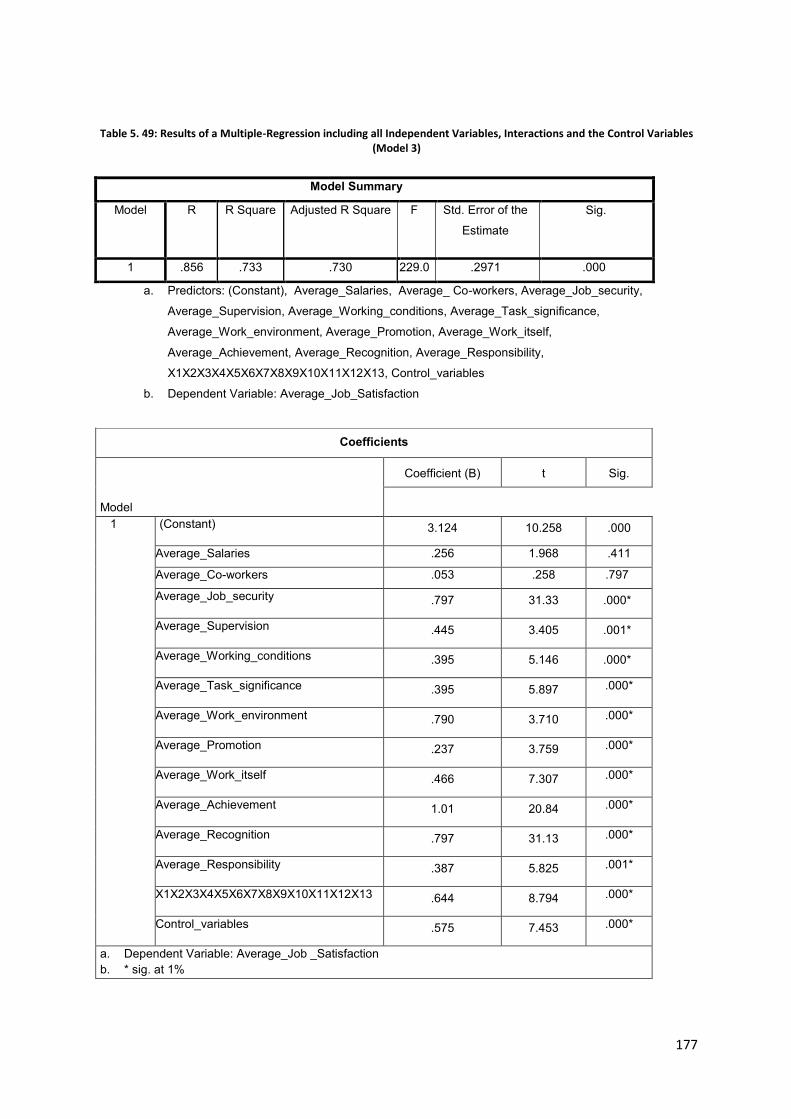
177
Table 5. 49: Results of a Multiple-Regression including all Independent Variables, Interactions and the Control Variables (Model 3)
Coefficients
Model
Coefficient (B) t Sig.
1 (Constant) 3.124 10.258 .000
Average_Salaries .256 1.968 .411
Average_Co-workers .053 .258 .797
Average_Job_security .797 31.33 .000*
Average_Supervision .445 3.405 .001*
Average_Working_conditions .395 5.146 .000*
Average_Task_significance .395 5.897 .000*
Average_Work_environment .790 3.710 .000*
Average_Promotion .237 3.759 .000*
Average_Work_itself .466 7.307 .000*
Average_Achievement 1.01 20.84 .000*
Average_Recognition .797 31.13 .000*
Average_Responsibility .387 5.825 .001*
X1X2X3X4X5X6X7X8X9X10X11X12X13 .644 8.794 .000*
Control_variables .575 7.453 .000*
a. Dependent Variable: Average_Job _Satisfaction b. * sig. at 1%
Model Summary
Model R R Square Adjusted R Square F Std. Error of the
Estimate
Sig.
1 .856 .733 .730 229.0 .2971 .000
a. Predictors: (Constant), Average_Salaries, Average_ Co-workers, Average_Job_security,
Average_Supervision, Average_Working_conditions, Average_Task_significance,
Average_Work_environment, Average_Promotion, Average_Work_itself,
Average_Achievement, Average_Recognition, Average_Responsibility,
X1X2X3X4X5X6X7X8X9X10X11X12X13, Control_variables
b. Dependent Variable: Average_Job_Satisfaction
178
Table 5.49 above depicts that 73.3% of the variance in the job satisfaction is due to salaries,
co-workers, job security, supervision, working conditions, task significance, work
environment, promotion, work itself, achievement, recognition, responsibility, interactions
and control variables while remaining 26.7% is due to other factors. F-test indicates that the
observed R-squared is reliable, and is not a spurious result of oddities in the data set. F-value
(229.0) is significant at 1%. Hence, we can say that model under study is a good fit.
Regression Equation
JS = β0 +β1 S +β2 C +β3 Jsec +β4 V+ β5 WC+ β6TS+ β7WE+ β8P+ β9WI+ β10A+ β11REC+ β12 Res+
β13CV+ (β X1. X2. X3 .X4 .X5. X6. X7.X8.X9.X10.X11.X12.X13) + µ
Whereas, JS= job satisfaction, S =Salaries, C= Co-worker, Jsec=Job security, V=Supervision,
WC=Working conditions, TS=Task significance, WE=Working environment, P=Promotion,
WI=Work itself, A=Achievement, REC=Recognition, Res=Responsibility, CV=Control variables
Estimated regression Equation:
JS=3.124+.256S+.053C+.797Jsec+.445V+.395WC+.395TS+.790WE+.237P+.466WI+1.01A+.79
7REC+.387Res+ .575CV (.644 X1. X2. X3 .X4 .X5. X6. X7.X8.X9.X10.X11.X12.X13) + µ
The Constant (β0) is 3.124 which mean that if all factors are held constant the job satisfaction
(JS) will equal to 3.124. Beta value of salaries is .256, which means that with the change in
salaries (S) by one degree, JS will change in the same direction by .256 degrees. B value of C
is .053, which means with the change (increase/decrease) in C by one degree will bring
change (increase/decrease) in JS by .053 degrees in the same direction. The B value of job
security (Jsec) is .797, which means with the one degree change in job security, JS will
change in the same direction by .797 degrees. The B value of supervision (V) is .445, which
means with the increase or decrease of one degree in the value of V, the JS will increase or
decrease by .445 degrees. The B value of working conditions (WC=.395), task significance
(TS=.395), working environment (WE=.790), promotion (P=.237), work itself (WI=.466),
achievement (A=1.01), recognition (REC=.797), responsibility (Res=.387), control variables
(CV=.575) and the beta value of interactions is equal to .644.
All the independent variables have a positive relationship with dependent variable (JS), which
means that with the increase in independent variable, the dependent variable will also increase
and vice versa. The results of t-value shows that salaries (t=1.968, sig=.411) and co-workers
179
(t=.258, sig=.797) has an insignificant relationship with job satisfaction. Whereas, job
security (t=31.33, sig=.000), supervision (t=3.405, sig=.001), working conditions (t=5.146,
sig=.000), task significance (t=5.897, sig=.000), work environment (t=3.710, sig=.000),
promotion (t=3.759, sig=.000), work itself (t=7.307, sig=.000), achievement (t=20.84,
sig=.000), recognition (t=31.13, sig=.000), responsibility (t=5.825, sig=.000), control
variables (t=7.453, sig=.000) and interaction terms (t=.644, sig=.000) have a significant
relationship with JS at 1% significance level.
The model summary table demonstrates that salaries contribute 25.6% and co-workers
contribute 5.3% towards job satisfaction with the significance value of .411 for salaries and
.797 for co-workers which is more than .05. This means that the relationship between job
satisfaction and salaries and co-workers is weak. However, it is considered as a positive
correlation.

180
5.6.2 T-Test
To find out the comparison between the two groups i.e. public and private sector employees
with respect to different aspects of job satisfaction, a T-Test was run and the results are as in
Table 5.50 below:
Table 5. 50: The T-test Results
Variable t-test df Average Mean Values Sig. (2-tailed)
Public
Sector
Private
Sector
Salaries 2.390 168 4.30 4.17 .000*
Co-workers 8.919 168 4.32 3.70 .000*
Job security 12.502 168 4.30 3.62 .000*
Supervision 7.505 168 4.30 3.74 .000*
Working conditions 7.862 168 4.24 3.74 .000*
Task significance 9.818 168 4.28 3.62 .000*
Work environment 9.430 168 4.20 3.45 .000*
Promotion 7.125 168 4.39 3.82 .000*
Work itself 9.431 168 4.33 3.70 .000*
Achievement 10.603 168 4.24 3.63 .000*
Recognition 9.430 168 4.20 3.45 .000*
Responsibility 7.800 168 4.29 3.73 .000*
Job satisfaction 10.280 168 4.25 3.55 .000*
* Significant at 1%
From these results, it is revealed that the opinions of the public and private sector employees
differ from each other at a significant level (p<.01) with various aspects of job satisfaction.
Hence, it is revealed that public sector employees are high performers as compared to private
sector employees. In the next section, the researcher presents the main findings of the data
analysis.

181
5.6.3 Model Adequacy
Table 5.51 below shows the results of the final model.
Table 5. 51: Final Structural Model
The table given demonstrate the results of the final structural model.
Model Fit Indices Table
Indices Critical values Model value
χ2(df) Acceptable between values of 1 and
3
1.01
RMSEA <0.05 is regarded as a close fit 0.01
PCLOSE >0.05 acceptable 0.95
GFI (Goodness of Fit Index) TLF (Tucker-Lewis Index)
Close to 1 good fit
>.95 good fit
0.91
.971
The results revealed that the model was a good fit as the value of the model fit was accepted
at .91 which is close to 1.

182
Figure 5.1: The Final Model
The final model in Figure 5.1 above shows and confirms that the all Independent Variables
(salaries, co-workers, job security, supervision, working conditions, work environment, task
significance, promotion, work itself, achievement, recognition and responsibility) used in the
research are positively correlated with the Dependent Variable (Job Satisfaction).
183
5.7 Results without Dummy Variable
Control variables were used as dummy variables. The main purpose of using dummy variable
was to record the differences between the sectors where public sector was coded as 1 and
private sector was coded as 0 (see chapter 4 for further discussion). A difference was
observed in results with and without using dummy variables. However, this study has
considered the results obtained when using the dummy variable as the R-square value which
shows the contribution of the factors towards the dependent variable was increased after
examining the results obtained using the dummy variable.
5.8 Overview of the Main Findings
The regression analysis was run to identify the relationship between the job satisfaction and
salaries, co-workers, job security, supervision, working conditions, task significance, work
environment, promotion, work itself, achievement, recognition and responsibility. This test
was applied with and without the dummy variable to see if the r square value increases. This
shows that dummy variable impacted on increasing the r square value. However, when the
hypotheses were tested without dummy variable, the variance or the r square value decreased
(See Model 1 and Model 2). Hence, the researcher was confident to consider these values
performed with the dummy variable.
From the results, it is depicted that a positive relationship occurs between job satisfaction and
salaries having beta value (β=.256) having insignificant relationship with job satisfaction as
p-value is greater than .05. Hence, H1, which states that “Employees with higher salaries
have greater job satisfaction levels within an organisation”, is partially accepted.
The relationship between job satisfaction and co-workers is recorded as positive as its beta
value (β=.053), and the significant value was greater than .05 i.e. (p> .05) showing 5.3% of
the variance in job satisfaction. This shows that the relationship between job satisfaction and
co-workers is positive, but weak. Hence, H2, which states that “Employees having good
relationships with their co-workers possess greater job satisfaction levels within an
organisation”, is partially accepted.
184
However, relationship between job security and job satisfaction is recorded significant having
beta value (β=.797, p<.05). Hence, H3, which states that “Employees with high job security at
the workplace enjoy higher job satisfaction levels within an organisation”, is supported.
The relationship between supervision and job satisfaction is also recorded positive with beta
value (β=.445, p<.05) which means the variance shown by this variable is 44.5%. Therefore,
H4, which states that “Employees with higher supervision within an organisation enjoy
greater job satisfaction levels with their work”, is supported.
The relationship between job satisfaction and working conditions is also positive with beta
value (β=.395, p<.05). This shows that supervision has a significant impact on job satisfaction
with 39.5% of the variance. Hence, H5 which states that “Employees provided with higher
standards of working conditions have greater job satisfaction levels within an organisation” is
accepted.
The beta values of other variables include task significance (β=.395, p<.05), work
environment (β=.790, p<.05), promotion (β=237, p<.05), work itself (β=.466, p<.05),
achievement (β =1.01, p<.05), recognition (β=.797, p<.05) and responsibility (β=.387, p<.05).
From the results it is revealed that job satisfaction possess positive relationships with task
significance, work environment and intrinsic factors. Hence, H6 and H7 are supported. In
addition to this the model was a good fit as indicated by confirmatory factor analyses results.
To check the difference between the public and private sector, a parametric test (T-Test) is
used. Results reveal that all the dimensions of job satisfaction differ significantly based on
their mean values. Public sector employees are much satisfied with all indicators of job
satisfaction as compared to private sector employees. This shows that public sector
employees are better performers than the private sector as their employees showed less
satisfaction rates. Hence it is revealed from the results that H8 is accepted.
The discussion of the entire hypotheses testing is discussed in chapter six. The summary of
the entire results is given as below:

185
Table 5. 52: Summary of the Results
Hypothesis Results Β value Significance
H1: “Employees with higher salaries have greater job satisfaction levels
within an organisation”.
Partially
Accepted
.256
.411
H2: “Employees having good relationships with their co-workers
possess greater job satisfaction within an organisation”.
Partially
Accepted
.053
.797
H3: “Employees with high job security at the workplace enjoy higher job
satisfaction levels within an organisation”.
Accepted
.797
.000*
H4: “Employees with higher supervision within an organisation enjoy
greater job satisfaction levels with their work”.
Accepted
.445
.001*
H5: “Employees provided with higher standards of working conditions
have greater job satisfaction levels within an organisation”.
Accepted
.395
.000*
H6: “Employees provided with significant tasks and good work
environment have greater job satisfaction levels within an
organisation”.
Accepted
.395
.790
.000*
.000*
H7: “Employees with higher intrinsic rewards (promotion, work itself,
achievement, recognition and responsibility) have greater job
satisfaction levels within an organisation”.
Accepted
.237
.466
1.01
.797
.387
.000*
.000*
.000*
.000*
.001*
H8: “A significant difference exists between the public and private-
sector employees with respect to job satisfaction and extrinsic as well
as intrinsic factors within an organisation”.
Accepted as all variables were statistically significant at 1% as (p<.01).
186
Chapter Six: Discussion of the Main Findings
6.1: Introduction
In this chapter the researcher has discuss the results based on the research objectives. The
principal purpose of research is to measure the influences of salaries, co-workers, job
security, supervision, working conditions, task significance, work environment, promotion,
work itself, achievement, recognition and responsibility on job satisfaction. For this purpose,
data is collected from the public and private owned manufacturing companies of Lahore-
Pakistan. In the next section, the researcher discusses the results obtained from the
preliminary analysis and the results achieved from hypotheses testing analysis in chapter 5.
6.2: Data Entry and Sample
To check the adequacy of the data, it is crucial that the study undergoes the preliminary
process to analyse the background of the respondents. The foremost procedure to carry out
the data screening process is to first check the missing values in the data in order to overcome
the related errors. In the views of Hair et al. (2006), they suggested that it is very important to
examine data and to purify it if there are any errors present in the data-file before further
analysis is carried out.
This study came across few issues during the data screening process. Firstly, the data file had
some missing values less than 5% which was overcome by replacing with the median values
as suggested by Lynch (2003). The missing values exist when the respondents fail to provide
the answer to the question or during data entry in the computer. When the values are less than
5%, it does not change the meaning of the data (Tabachnick & Fidell, 2007). Furthermore, the
test of normality, linearity and multicollinearity were also included in the data screening
process to interpret the relationship between the dependent variable i.e. job satisfaction and
the independent variables such as salaries, co-workers, job security, supervision, working
conditions, task significance, work environment, promotion, work itself, achievement,
recognition and responsibility. Since no issue was raised during the data screening process the
data was run for the hypotheses testing and the results are discussed in the following section.
187
6.3: The Relationship between Job Satisfaction and Extrinsic and Intrinsic factors
This research is based on the perception of public and private sector employees towards job
satisfaction. In view of this, the researcher has evaluates various aspects of job satisfaction in
the manufacturing industry of Lahore-Pakistan. The leading public and private sector
manufacturing companies have been taken into consideration as the co-existence of both
public and private sectors are given, much attention (Kaur, 2012). This shows that, the
presence of the public and private sectors is very strong in any country.
The literature depicts that the manufacturing industry needs considerable attention as most of
the research is conducted in universities, information technology, banks and medical
institutions in Pakistan as stated by Rukh et al. (2015). In recent years manufacturing industry
has faced decline in Gross Domestic Product (GDP) by 11 present (Memon and Tahir, 2012).
As a result of which it needs improvement to be competitive in the market. For this reason it
is noteworthy that management should motivate their employees to function in an effective
way as their performances are directly associated with the outcomes of an organisations (See
Chapter Two). This research attempts to find out the factors which can motivate employees,
and to find out the relationship between intrinsic and extrinsic factors and job satisfaction.
From the findings, it is revealed that a positive and significant relationship exists between job
satisfaction and independent variables (job security, supervision, working conditions, task
significance, work environment, promotion, work itself, achievement, recognition and
responsibility). On the other hand the relationship between two independent variables
(salaries and co-workers) and job satisfaction recorded as positive and insignificant. This
shows that these variables have a weak impact on the employees’ job satisfaction.
A beta coefficient value of salaries (β=.256, p>.05) indicates that salaries is a weak predictor
of job satisfaction. The beta value here shows that with the change (increase or decrease) in
salaries by one degree will bring change (increase or decrease) in job satisfaction by .116
degrees in the same direction. However, this relationship was not statistically significant as it
is greater than .05. Hence, hypothesis H1 (Employees with higher salaries have greater job
satisfaction levels within an organisation) was partially supported. From the findings it is
revealed that salaries have a little impact on the employee’s job satisfaction level. Similarly, a

188
co-workers also showed a weak correlation with the job satisfaction with the beta value
(β=.053, p>.05). This shows that with the change in co-workers by one degree will bring
change in job satisfaction by .053 degrees in the same direction. Hence, it is concluded that
hypothesis (H2) is partially supported.
A beta coefficient value for job security (β=.797, p<.05), supervision (β=.445, p<.05),
working conditions (β=.395, p<.05), task significance (β=.395, p<.05), work environment
(β=.790, p<.05), promotion (β=.237, p<.05), work itself (β=.466, p<.05), achievement
(β=1.01, p<.05), recognition (β=.797, p<.05) and responsibility (β=.387, p<.05). These results
indicated that all the above mentioned variables possess a positive and statistically significant
relationship with the job satisfaction. Hence, the entire hypothesis (H3, H4, H5, H6 and H7)
were empirically supported. The result of hypothesis (H8) which states that “A significant
difference exists between the public and private-sector employees with respect to job
satisfaction and extrinsic as well as intrinsic factors within an organisation” was also
statistically supported as significance value was less than .05.
The key contributions of this study are as follows:
Unique causal and conceptual model that simultaneously analyse the independent variables
to decide employees’ job satisfaction levels.
Supplied information in the area of job satisfaction from developing nations prospects i.e.
Lahore-Pakistan.
One of the few studies connected with creating countries’ public and private experts.
Recognition of the need for job satisfaction as an important foundation of value managing
both sectors.
Emphasis on the need for better salaries packages and enhancement in co-workers
relationships for improved job satisfaction.
Acknowledgment of the estimation of job attributes like supervision, promotion, job
security and working conditions in deciding job satisfaction.
The research findings of this study have partially supported the study conducted by Alshitri
(2013) in Saudi Arabia which stated that pay, promotion, supervision, co-workers and nature
of work have direct influences on the overall job satisfaction. The difference in the findings is
due to different needs and wants of the workforce and country differences as workers in
189
Pakistan focus more on different opportunities of promotion, better salary, job security and
working conditions in which they work, and also if it is safe and secure to carry out the work.
The results of an insignificant relationship between job satisfaction and co-workers were
partially supported by an empirical study conducted by Harmer and Findlay (2005) in which
he argued that only 6.7% of the variance in the job satisfaction was due to co-workers and
supervision, and the significance level which recorded greater than .05. This shows that co-
workers and supervision do not possess significant relationships with job satisfaction but
results of this study contradict their findings. The main difference in the findings is due to the
differences in the perceptions of employees which vary according to needs and wants of the
employees and more often cultural context and nature of the study.
Lee and Ok (2011) explored the effect of workplace friendship on employee job satisfaction
in the hospitality industry and concluded that healthy workplace relationships have a variety
of positive influences on both employee and employer satisfaction. Other factors which
impact the job satisfactions include pay and promotion as found out in the study by Malik et
al. (2012, p.6). Their study was conducted on employees working in higher education
institutes of Pakistan. The results of their study showed that salary, especially in developing
economies, has a significant influence on the job satisfaction. Similarly, promotion also plays
a major role in improving job satisfaction, but the impact of promotion is weaker than salary.
Reisel et al. (2010, p.74) conducted another study and found out the impact of job security on
job satisfaction. They conducted study on 320 United States managers and discovered that job
insecurity is one of the most stressful burdens which employees can shoulder. It was
concluded, therefore, that job insecurity directly leads to job dissatisfaction.
Working conditions have also been found out to be a major determinant of job satisfaction.
Bakotic and Babic (2013) conducted a study to analyse the impact of working conditions in a
Croatian shipbuilding company. The findings of this study indicate that workers who work
under difficult working conditions tend to be dissatisfied with their jobs. Supervision is also
another factor which impacts job satisfaction. One study surveyed 350 police personnel in
Nigeria by Adebayo and Ogunsina (2011, p.13), revealed that the supervisory behaviour
which can be of autocratic or democratic nature could directly influence the satisfaction
employees derive from their jobs.
190
The findings of confirmatory factor analysis revealed that the model is a good fit as the
fitness value is greater than 1. A strong and positive relationship accounts for promotion, job
security, and supervision and working conditions with the job satisfaction. These results
support the research conducted by Parvin and Kabir (2011) that promotion and job
satisfaction are directly proportional to each other which means that with the increase in a
level of promotion, job satisfaction will also increase in the degree. Similarly, job security
also has a positive impact on the job satisfaction which means that job insecurity leads to job
dissatisfaction as cited by Khalid et al. (2012). These results partially support the study of
Hussain (2012) conducted in The Punjab on the banking sector which stated that certain
factors such as job security, good supervision, promotional opportunities, pay and
relationship with co-workers impact on employees’ job satisfaction levels. Another factor
which came out to be significant is the working conditions. Yasuharu et al. (2009) stated
through their research that good working conditions predict positive job satisfaction levels of
the employees which mean that working conditions have a direct relationship with the job
satisfaction. On the other hand, the factors that were recorded as insignificant in this part of
the analysis are salaries and co-workers relationship with job satisfaction.
A study conducted by Young et al. (2014) empirically proved that salaries has an inverse
relationship with the job satisfaction with = -.49. This shows that with the increase in
salary, job satisfaction does not increase because Lahore is the second largest city of Pakistan
where workers do not rely on employees’ salaries satisfaction but on other factors as
discussed above. Furthermore, the relationship between job satisfaction and supervision
contradicts the findings of Harmer and Findlay (2005) in which they stated that supervision is
negatively associated with the job satisfaction. Similarly, Luddy (2005) stated that
supervision and job satisfaction possess weak correlation with the job satisfaction, whereas,
co-workers did not even reach the significance level and hence, it is predicted that co-workers
show weak relationship or no relationship with job satisfaction (Hussain, 2012).
These results are also partially supported by empirical findings of Rast and Tourani (2012) in
the airline industry of Iran which revealed that supervision, present pay, relationship with co-
workers, opportunities for promotion and nature of work are important factors of job
satisfaction. Moreover, findings of Ahmad et al. (2012) demonstrated that employee motive
along with its four major components indicated that pay and benefits, work environment,
191
organisational vision and management systems all have positive and significant impacts on
customers’ satisfaction levels in the airline industry of Pakistan. Different studies have
proclaimed the importance of different factors the in airline industry which is due to
differences in the needs and wants of the employees.
The study of Yew (2008) in the tourism industry indicates that there are three major factors of
employee satisfaction. These include job security, promotional opportunities and interesting
work. Hence, this study is supported by his findings that there is a positive and significant
relationship between employee job satisfaction and job security and promotion. Moreover, the
results are consistent with the findings of Saeed and Farooqi (2013) in which it was revealed
that employee relations, salary, supervision and efficiency all have high influential impacts on
job satisfaction in Pakistan while other studies have shown opposite results.
The main reason for the variance in the perception of employees is due to variances in the
needs of workers with respect to time. Since Lahore (in Pakistan) is a big city harbouring the
manufacturing industries, employees work totally on commission basis where employee job
satisfaction totally depends on promotion, job security and the working environment. There is
no fixed salaries system in the manufacturing industry of Pakistan as a result of which salaries
does not show a significant relationship with the job satisfaction with the workers of the
manufacturing industry in that country.
The results of Uddin et al. (2016) revealed that the relationship between job security and job
satisfaction is insignificant having a significance value (p>0.05). Furthermore, this study fills
in a gap in the literature by analysing the job satisfaction levels of employees working in the
public and sector manufacturing companies in Lahore-Pakistan. Tanjeen’s (2013) study
carried out in the telecommunications sector of Bangladesh revealed that job security is one
of the most influential factors of job satisfaction in the telecom industry. The research
conducted by Ravichandran et al. (2015) on job satisfaction of employees in the
manufacturing industry of Puducherry in India revealed that promotion, work environment
and working conditions improve the job satisfaction levels of manufacturing employees.
Furthermore, their findings revealed that manufacturing management needs to focus on the
working environment so that the employees would feel secure at work. This shows that the
above mentioned three predictors of job satisfaction have direct influences on the job
satisfaction of employees working in the manufacturing industry. Hence, previous findings

192
support the present study. The influences of certain intrinsic factors are also recorded as
significant and their contributions i.e. (R2value) of responsibility, achievement, job security
and work itself towards job satisfaction was recorded as 0.731 which means the variation
shown by these factors is accounted as 73.1 per cent approximately (Raza et al. 2015). These
findings support the current results as these factors possessed significant relationships with
job satisfaction.
From the above literature, it can be seen that job satisfaction is a vast topic in the
management field. Researchers have come up with similar or dissimilar results which vary
from time to time concerning the nature of the study, the desires of the workforce and the
country in which the study is being conducted.
Since this study compares the job satisfaction in a private sector and the public sector of
Pakistan; consequently, a T-Test was adopted to find out if a significant difference exists
between the two sectors in Pakistan. The findings revealed that a significant difference exists
between the public and private sectors of Lahore. It is demonstrated from the mean values
and the p values (p<.05) that public sector employees are more satisfied as compared to
private sector employees.
The findings of this research are supported by the study conducted by Khan and Parveen
(2014) on the public and private banks in India, in which it was revealed that a significant
difference exists between the public and private sectors. Their findings further revealed that
public sector employees have higher satisfaction rates as compared to the private sector
employees. The main reason is that the public sector employees are considered important
assets for the Pakistani government. They have to provide good environment and better
working conditions. All their employees work under proper supervision and their job are
secured for long term with promotion offers if they are working in the public sector for more
than a year. Whereas, private sectors does not offer secure jobs to their employees as they are
not contract based and they can fire their employees anytime. Moreover, they do not provide
reward to their employees for performing tasks on time as a result of which there is less hope
of achievement of organisational goals. This shows that organisations which do not provide
proper facilities to their employees face high staff turnover and more absenteeism rates.
193
As discussed earlier in chapter two that various researchers have depicted different results
regarding job satisfaction in the public and private sectors. For example, a study conducted by
Hassan et al. (2011) argued that the major factors that contribute to the job satisfaction of
private sector employees include: job security, incentives, working conditions, organisational
operations and rewards. A comparative study conducted by Khalid et al. (2012) in the public
and private universities of the Punjab concluded that employees in the private sector were
satisfied with supervision, promotion and pay. This demonstrates that workers of the private
sector are satisfied with the supervision. On the other hand, the public sector employees
showed the positive and significant levels of promotion and working conditions. In the view
of Masood et al. (2014), he depicted a significant relationship between working conditions
and employee job satisfaction in the public and private sector organisations of Pakistan. This
reveals that working conditions play important roles in depicting employee satisfaction levels.
Management should, therefore, further work on providing efficient and better and healthy
working conditions to their workers to get effective outcomes.
Another predictor of job satisfaction in the public sector is promotion. The results of positive
and significant relationships between promotion and job satisfaction in the public sector are
supported by the research of Malik et al. (2010) on the public sector teachers in Pakistan. It
also revealed that promotion has a high impact on job satisfaction in public sector universities
of Pakistan. Pragya and Sandeep (2015) conducted research on the public and private sector
banks and revealed that working conditions have direct impact on the overall job satisfaction
of bank employees. On the other hand, a study by Hassan et al. (2011) on the private sector
banks revealed that job security is directly related to job satisfaction.
The results of this study contradict the findings of a study conducted by Hussain (2012) on
the public and private sectors banks of the Punjab in which he stated that public and private
sector employees do not show significant differences in the satisfaction levels. However,
results of Padhy and Bhuyan (2015) indicate that the public and private banks employees
possess significant differences regarding various predictors of job satisfaction and
promotions, supervision, security, relation with co-workers, nature of job employee’s
empowerment.
This study is supported by work done by Mihajlov and Mihajlov (2016) in which they stated
that the general job satisfaction of both the public and private sector employees differ

194
significantly from each other. According to the survey report, most of the studies have also
shown the extent of satisfaction levels of employees in America as suggested by Chen (2008)
which explained that more than 40 percentage of the employees showed either high
satisfaction rates or were just satisfied their work. Only twenty percentage of the workers
show enthusiasm in their work, thirty-three percentage were highly dissatisfied, and twenty-
one percentage of the workers wanted to change their jobs (Chen, 2008) as mentioned by
Gajic et al. (2014). Similarly, research conducted by Chatterjee and Chattopadhyay (2015)
conducted on the public and private sector employees of the banking industry in Kolkata-
India revealed that a significant differences exist between the public and private sector
employees. Their study further indicated that public sector employees were more satisfied
with the intrinsic factors and the private sector employees were more satisfied with extrinsic
factors.
However, this study contradicts their findings as public sector employees were satisfied with
both intrinsic and extrinsic factors. The main reason for the difference in the results as the
nature of the study is different with respect to location, industry and participants. According
to Ara (2004) previous findings revealed that the overall performance of the manufacturing
industry declined mainly because of poor quality of products, less contact with foreign
market, slow growth of Human Resource practice and less investment. None of these studies
explained how to overcome this issue. As previously discussed in chapter two it can be seen
that employee’s job satisfaction plays an important in the productivity of an organisation
which means that human resource managers of the manufacturing industry should focus on
the factors which can enhance job satisfaction level among employees.
The research findings revealed that both extrinsic and intrinsic factors play a significant role
in enhancing the employees’ job satisfaction. This indicates that these variables possess high
abilities to influence the perceptions of the workforce towards work in active and satisfying
ways. Interestingly, the research findings further revealed that the independent variables as
discussed previously have the most influential impact on the public sector employees
whereas, private sector employees showed less job satisfaction.
The main similarities between the previous and existing study is that this study has
considered various factors that contribute towards employee job satisfactory. For this purpose
combination of theories has been taken into account (See Chapter Two). Moreover, all factors
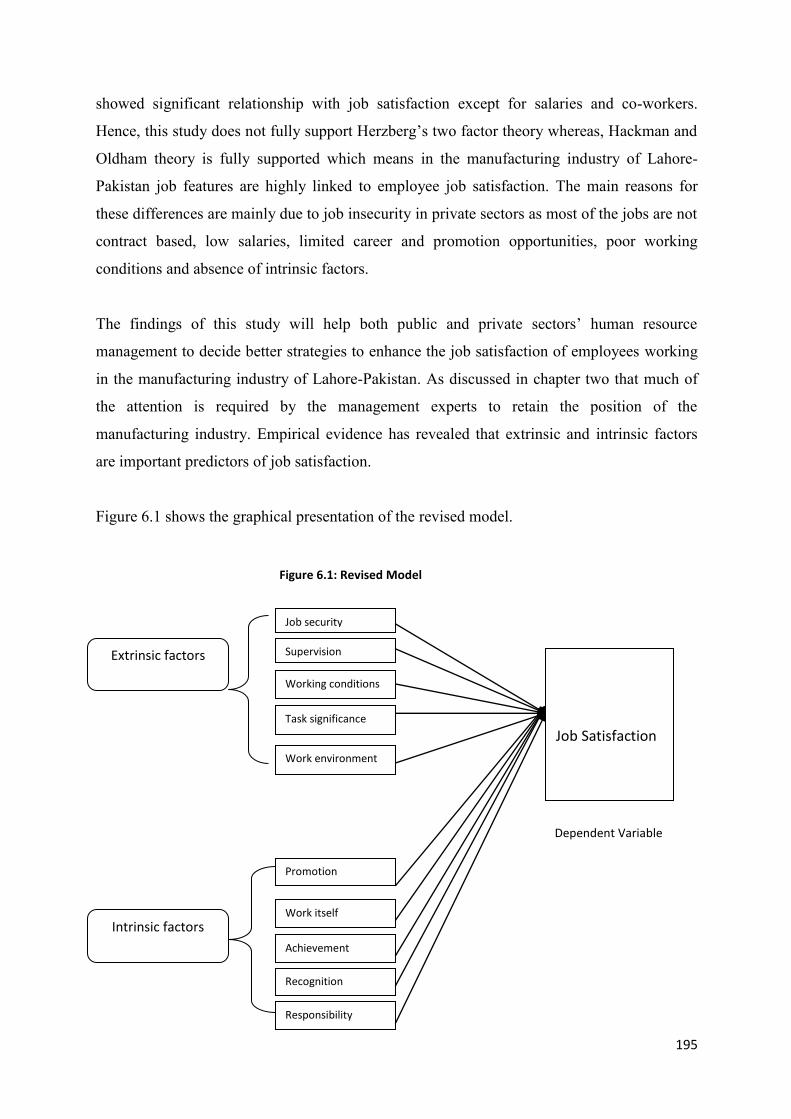
195
showed significant relationship with job satisfaction except for salaries and co-workers.
Hence, this study does not fully support Herzberg’s two factor theory whereas, Hackman and
Oldham theory is fully supported which means in the manufacturing industry of Lahore-
Pakistan job features are highly linked to employee job satisfaction. The main reasons for
these differences are mainly due to job insecurity in private sectors as most of the jobs are not
contract based, low salaries, limited career and promotion opportunities, poor working
conditions and absence of intrinsic factors.
The findings of this study will help both public and private sectors’ human resource
management to decide better strategies to enhance the job satisfaction of employees working
in the manufacturing industry of Lahore-Pakistan. As discussed in chapter two that much of
the attention is required by the management experts to retain the position of the
manufacturing industry. Empirical evidence has revealed that extrinsic and intrinsic factors
are important predictors of job satisfaction.
Figure 6.1 shows the graphical presentation of the revised model.
Figure 6.1: Revised Model
Dependent Variable
Promotion
Job security
Supervision
Working conditions
Extrinsic factors
Intrinsic factors
Task significance
Work environment
Work itself
Achievement
Recognition
Responsibility
Job Satisfaction

196
The implications of this study are discussed in chapter seven.
6.4 Conclusion
In this chapter, the researcher has discussed the main findings in the light of the literature.
The discussion consisted of different sections in which the researcher provided information
regarding scales applied in this research and hypothesis testing.
The results revealed that a positive relationship exists between job satisfaction and the
independent variables (intrinsic and extrinsic) factors. However, the researcher has considered
the significance levels to analyse the relationship between the dependent and independent
variables. From the research findings, it is revealed that job security, supervision, working
conditions, task significance, work environment, promotion, work itself, achievement,
recognition and responsibility possess a significant relationship with job satisfaction whereas;
salaries and co-workers possess an insignificant relationship with job satisfaction. However,
the relationship between these variables and job satisfaction is positive as its beta coefficient
values were positive. This study mainly focuses to analyse the influence of intrinsic and
extrinsic factors on the job satisfaction of employees in the manufacturing industries in
Lahore-Pakistan. The data that was used to predict the job satisfaction levels was based on a
cross-sectional approach which was collected from employees of two different sectors (i.e.
public and private) manufacturing companies of Lahore-Pakistan.
In this research project, the researcher formulates the hypotheses from the literature review.
The developed hypotheses are mainly based on the relationships between the dependent
variable (job satisfaction) and the independent variables and to find out whether a significant
difference exists between the public and private sector employees of manufacturing industry
in Pakistan. The results are supported as cited by Ayub (2010) signifying that previous studies
have also revealed that a significant difference exists between the public and the private
sector employees with respect to certain factors (Ayub, 2010). However, their findings were
applicable to the banking industry only.
The research findings of this study reveal that all motivational factors are positively
associated with job satisfaction in the public sector of the manufacturing industry as
compared to the private sector. This shows that much attention is still required to look for the
197
factors which could enhance employee job satisfaction in private sectors of manufacturing
industry in Lahore-Pakistan
In this regard, the difference is measured using independent samples’ T-Test. Interestingly;
the results have reveal that the public sector is a better performer as compared to the private
sector as the employees in the public sector are more satisfied with their jobs than the private
sector employees. Moreover, the attributes that were used to measure the job satisfaction
levels reveal that both (private and private) sector employees differ statistically from each
other. This difference is evaluated based on the average mean values and level of
significance. The average mean values of the public sector employees are considerably higher
than the private sector employees regarding intrinsic and extrinsic factors and the job
satisfaction levels.
In the next chapter, the researcher discusses the implications along with the limitations
associated with this study and gives suggestions for future researchers to find out ways to
boost job satisfaction levels among private sector employees of the manufacturing industry in
Lahore- Pakistan.
198
Chapter Seven: Conclusion, Implications, Contribution and
Recommendations
7.1 Introduction
The motive of the research examination is to perform a comparative analysis measuring job
satisfaction in the public and private leading manufacturing companies of Lahore in Pakistan.
The research study is carried out to clarify the relationship between the dependent variable
(job satisfaction) and independent variables (intrinsic and extrinsic) factors. The research used
particular independent and dependent variables and then measured the impact of independent
variables on the job satisfaction (dependent variable). This chapter concludes the research
findings and elaborates on which objectives were fulfilled during the research. The chapter is
complemented by the theoretical and practical implications, limitations of the study and
recommendations. The final explanation is presented as the contribution to knowledge from
the research.
This study aims to explore the job satisfaction of employees working in the public and private
manufacturing firms of Lahore-Pakistan. It also investigates the relationship levels of
employees at the workplace by running a multiple regression analysis. The central target is to
analyse the job satisfaction levels of some employees of the manufacturing industries in
Pakistan using particular modes of job satisfaction. Another target is to recognise the
influence of certain facets upon job satisfaction of employees working in the public and
private sector manufacturing companies in Pakistan.
Particular objectives of the research involve some fundamental links to the literature review
concerning specific and essential elements of job satisfaction in the public and private sectors
in Lahore-Pakistan. The objectives also delineate the relationship between the dependent
variable (job satisfaction) and the independent variables of the research study. The research
develops a theoretical framework of job satisfaction which is later utilised for testing the
independent variables in the proposed hypotheses. The research tested the job satisfaction
theoretical model among the employees of the public and private sectors in Lahore-Pakistan.
199
7.2 Thesis Overview
The research was carried out to discuss the impact of job satisfaction on employees working
in the public and private sector manufacturing companies situated in Lahore-Pakistan. This
chapter discusses the approaches employed by the researcher. The main purpose of the
research is to analyse and observe the determinants of job satisfaction (Dependent Variable)
and find out the relationship between job satisfaction and the extrinsic as well as intrinsic
factors.
The significance of the study hinges on the impact and results of the independent variables on
the dependent variable. The research objectives have all been achieved using statistical
analysis. The research problem has been highlighted, and the study’s contribution of new
knowledge to existing knowledge is identified in the study.
This chapter concludes the research with a summary of all chapters, the conclusions drawn,
the contribution made to existing knowledge and recommendations made. The research
revolves around in the principal topic of job satisfaction on employees in the public and
private sector manufacturing companies in Lahore–Pakistan. The research, therefore, gives
recommendations on the designed theme of this study.
This research chose particular independent variables in order to identify their effects on the
dependent variable (Job Satisfaction); and also to check their dependence levels on job
satisfaction. This study assumed the form of a comparative study. The reason for performing
a comparative analysis is to check whether the Human Resource management practices in the
Developed Countries of Europe and North America (which the researcher reviewed in the
Literature) are same as carried out in the Manufacturing Industries of the public and private
sectors of Lahore-Pakistan.
Hlatywayo, Mlanga, and Zingwe (2013), in one of their comparative studies, it is stated that
job satisfaction is a particular factor or variable which performs the main function of the
independent variables like employee’s nature of work, salaries and security. The study also
revealed that they also assist in calculating the job satisfaction levels of employees. Thus, the
research findings and analyses helped in identifying the significance of job satisfaction levels
vis-à-vis the independent variables used in the research. It also shows how important the role
200
of job satisfaction is within the organisation or company, and for making the employee
remain and work for the company. This also clarifies the correlation of job satisfaction with
the independent variables in the public and private sectors in Pakistan. Also, it has been
shown in a research study that in Pakistan, public sectors are more hierarchal and bureaucratic
in nature. Here the managers are given prominent positions and authorities for achieving
certain outcomes in the company. By assigning such responsibilities to them help them to
achieve their targets and it makes their work quite challenging. The vast majority of the
studies reported that employees working in government firms should be made satisfied by the
management as it results in making the organisation profitable and it also helps to fulfil the
goals of the organisations effectively. This also prompts in an upgrading of the achievement
of an association with various results.
This research consists of seven chapters. The summary of each chapter is given as follows:
Chapter 1
In this chapter the researcher discusses the research background and highlights the research
aim and objectives along with the development need in public and private sectors of Pakistan.
It further discusses the concept of development in an organisation and the practices required
for keeping their employees satisfied and motivated who are serving in the public and private
sectors of the manufacturing industry in Lahore-Pakistan.
Chapter 2
The second chapter reviews the different theories and concepts of job satisfaction. The
fundamental purpose of carrying out a literature reviewis to give a comprehensive knowledge
of job satisfaction. Since, this study is comparing public and private sectors; it needs
investigations of various factors which are held responsible for enhancing employee job
satisfaction mainly in the manufacturing industry of Lahore-Pakistan as it has failed to retain
its position in the market.
It is revealed from the literature that public versus private sector is a debate topic (Kumari &
Pandey, 2011). Various authors possess different concepts of controversies about employee
job satisfaction in public and private sectors. Existing studies have shown that the factors
which influence job satisfaction are broadly studied. However, the findings of their work are
often controversial (De Gieter & Hofmans, 2015).
201
Chapter 3
In chapter three the researcher discusses important factors of employee job satisfaction and
designs the conceptual framework to evaluate the relationship between the dependent variable
(job satisfaction) and the independent variables (salaries, co-workers, job security,
supervision, working conditions, task significance, work environment, promotion, work itself,
achievement, recognition and responsibility).
Chapter 4
In this section, the researcher designs the methodology suitable for achieving the objectives
of the study. It further discusses the rationale for the selection of appropriate research
philosophy, research approach along with research strategy. Different statistical techniques
suitable for this study mainly confirmatory factor analysis, multiple regression analysis and
independent samples T-Test are also discussed in this chapter.
Chapter 5
The fifth chapter represents the results obtained with the help of Statistical Package for the
Social Sciences (SPSS). The main purpose of this chapter is to verify the hypothesis. To
check the relationship between the job satisfaction and the independent variables multiple
regression analysis was run. To investigate the contribution of the variables to the public and
private manufacturing companies, a separate regression analysis was run each time to check
their contributions as well which their R-square values. In conclusion, the regression analysis
tested seven hypotheses. In order to check the differences between the two groups, a T-Test is
adopted, and the results reveal that public sector firms are better performers as compared to
private sector firms. The first and second hypotheses were partially accepted and rest of the
hypotheses were fully supported.
Chapter 6
In this chapter the researcher discusses the results of the main findings with the help of
literature review. The findings revealed that a significant relationship exists between the job
satisfaction and job security, supervision, working conditions, task significance, work
environment, promotion, work itself, achievement, recognition and responsibility except for
salaries and co-workers. Similarly, a significant difference was recorded for public and
private sectors.
202
Chapter 7
This chapter discusses the conclusion of the research project along with research implications,
limitations along with opportunities for further researchers and knowledge contribution.
Based on the research findings, the researcher made recommendations to the managers and
human resource practitioners of public and private sectors of the manufacturing industry of
Lahore-Pakistan.
7.3 Realisation of Objectives
Following are the main objectives of research.
Objective 1: To critically evaluate the secondary research on job satisfaction within the
manufacturing industry of Pakistan. The successful accomplishment of this objective is
achieved in chapter two and three.
Objective 2: To identify the relationship between job satisfaction and extrinsic as well as
intrinsic factors of the manufacturing of Lahore-Pakistan. To achieve this objective multiple
regression was performed and the findings revealed that extrinsic and intrinsic factors have an
influential impact on employee job satisfaction.
Objective 3: To find out the difference between the public and private employees of the
manufacturing industry of Lahore-Pakistan. In chapter five it is seen that the perception of
public and private sector employees differ significantly from each other with respect to job
satisfaction and extrinsic as well as intrinsic factors. Hence, this objective is also successfully
achieved with the help of t-test.
Objective 4: To analyse the existing framework of job satisfaction and develop a model used
in improving job satisfaction in the manufacturing industry of Lahore-Pakistan. The findings
in chapter five revealed that all the indicators of job satisfaction were significantly associated
with the job satisfaction except for salaries and co-workers. However, these two factors
possess positive beta value with the job satisfaction. Therefore, this objective is also
successfully achieved.

203
7.4 Theoretical Implications
In this study the researcher build the theoretical model based on the relationship between the
job satisfaction and the independent variables (salaries, co-workers, job security, supervision,
working conditions, task significance, work environment, promotion, work itself,
achievement, recognition and responsibility). This model was designed after critical
evaluation of job satisfaction. This study is influenced by analysing Lahore’s public and
private manufacturing companies. This study revolves around a comparative analysis
performed between the public and private sectors.
A number of studies have researched job satisfaction and its results with employees working
in public and private banks as mentioned by (Seleena & Gnanadhas, 2013). Various
researchers are still exploring the factors responsible for job satisfaction as their influence on
employees varies with respect to societies and nations (Govindan, 2013; Mahmood et al.
2012). The second territory for exploration concentrates on the relationship of job satisfaction
with salaries levels. This analysis tries to clarify why workers get satisfied with their salaries
and motivations and do not leave their jobs.
This analysis will give a stage to future researchers to research the relationship between job
satisfaction and independent variables further. Here are a few authoritative elements which
help job satisfaction of employees, i.e. salaries, co-workers, working conditions, promotion,
supervision and job security. The future researcher could consider other factors which can
enhance employees’ job satisfaction levels in public and private sectors of manufacturing
industry of Lahore-Pakistan.
The designed conceptual framework showed that employees’ job satisfaction hold a
significant relationship among the previously mentioned dependent and independent variables
except for salaries and co-workers. Notwithstanding the way that numerous prior inspiration
studies and job satisfaction hypotheses investigated the employees’ job satisfaction levels, in
any case, few of them perceive the relationship between employee job satisfaction and their
determinants. As this research is based on this relationship, it is worth specifying for
management purposes, recommending to the offices in Lahore-Pakistan to consider the
results of this study to classify zones in a requirement for further change in the sectors.

204
The perceptive effect of the independent variables selected for this research study was
inspected on account of employees’ job satisfaction. The variables were observed to be huge,
in any case, one indicator employees’ co-workers and salaries were not found be critical
indicators of employees’ job satisfaction. The current theories help to illuminate the
significance of an employee job satisfaction in this research. This study, therefore, helped to
develop the job satisfaction theory with respect to the relationships between job satisfaction
and the independent variables.
The exact discoveries produced from this study support the analysis that job satisfaction
levels of employees’ enhance job satisfaction at the workplace. It also helped to look over the
comparative analysis so that analysts may compare and contrast the independent variables
under employees’ job satisfaction working in both the public and private sectors of the
manufacturing industry in Lahore. This study endeavoured to exhibit an understanding of
employees’ job satisfaction in Lahore- Pakistan especially and in the space of employees’ job
satisfaction by and large.
7. 5 Practical Implications
The regression analysis results reveal that variables (working conditions, promotion,
supervision, task significance, working environment, achievement, recognition,
responsibility, work itself and job security) have significant impacts on a job satisfaction. It is
still a significant achievement that two independent variables i.e. salaries and co-workers
show insignificant relationships with job satisfaction however, both of these factors possess
positive relationship with the job satisfaction. Over the long haul, job satisfaction influences
the worker’s job security and supervision; hence it affects the job satisfaction levels of
employees, and it also builds motivation among them.
This study has various practical implications. In any case, some essential pragmatic
management decisions for public and private managers of manufacturing industry are taken
later. Besides, from the analysed implications for the hypothesis of workers’ job satisfaction,
the present study has likewise contributed noteworthy information. The theoretical framework
and discoveries created with the support of the dependent and independent variables reveal
that, organisation arrangements in regards to job satisfaction ought to look into the spot where
205
employees’ job security can create room for job satisfaction and worker motivation. The
public sectors of Lahore-Pakistan value both extrinsic and intrinsic factors more.
The impacts that the findings have on practice includes the development of human resource
management practitioners in both public and private sectors of manufacturing industry to
decide better strategies to increase employee job satisfaction. It is recommended that the
policy makers should provide better salary packages to their employees. Moreover, the
private sector practitioners need to provide better working conditions, different tasks should
be allotted to employees to make the work more interesting to the workers and to achieve the
goals on time, to give contractual jobs and give recognition to employees. In this way both
the sectors can be beneficial for the economy of a country.
Finally, with regards to job clarity, this study discovered less proof in the point of view of
private sector experts to foresee job security and supervision. This may be because in
actuality, the nature of employment of private sector employees is such that they have to look
at and analyse themselves concerning their clients and do not need supervision to perform
their job responsibilities. Be that as it may, the privately owned company managers are
proposed to make arrangements which bolster clear sets of expectations and diminish
ambiguities out in the private sector to improve both extrinsic and intrinsic factors when they
run over with any difficult situations.
Most noteworthy, implications of current postulation are that workers having a place with the
public and private sector organisations in Lahore-Pakistan may develop and decide uplifting
practices on the premise of authoritative work characteristics and identity attitude
components. This study assists human resource management to redesign the guidelines about
the importance of employees in the workplace as it has a direct impact on the performance of
the organisation.
In conclusion, this study provides the opportunity for other researchers to investigate further
the factors which could help to increase the job satisfaction of employees working in the
private sector as their mean values are recorded less as compared to public sector employees.
By exploring the relationships with other organisational factors i.e. the nature of the work,
benefits, job status and other useful factors, researchers can find out better ways to influence
the perception of private sector employees towards job satisfaction. Moreover, the future
206
researchers will gain an advantage from this research by further analysing the relationships
between the job satisfaction and independent variables (both extrinsic and intrinsic) based on
different public and private industries. These results further provide implications for the
policy makers of the private sectors so that they could comprehend the desires of their
employees by offering them better organisational features as this will help to satisfy their
employees and reduce high staff turnover rates. Hence, before implementing any strategy,
management should know the needs of the workforce to have more fruitful results.
7.6 Study Limitations
Various factors which hinder in achieving the research objectives and slow the process of
data collection ultimately lead to the research limitations. Therefore, it is essential to take into
consider the limitations that are linked with the research project as this prepares the researcher
to take measures which could help to reduce the study limitations.
This study has also gone through number of limitations which took place while employing
aims and objectives of the research. The limitations of the study are given as follows:
The study is limited to human resource department only. However, the further researchers
can carry out the comparative study with respect to the departments of the public and
private sectors of the manufacturing employees in Lahore-Pakistan.
Further due to limitation of time researcher has to follow strict schedule. This let the
researcher to formulate objectives which could be achieved on time.
Other limitations of this study are that, the study is limited to the ownership of only the
two sectors i.e. public and private. Also this study considered the employees of only the
main leading manufacturing companies in Lahore-Pakistan. Hence, the research findings
could not be applied to other employees due to the nature of the industry and business.
Another limitation is that the study adopted a quantitative approach whereas a qualitative
approach gives an in-depth perception of employees towards the job which is one the
207
recommendations made by the study for future researchers to apply using a qualitative
approach.
Moreover, limited factors have been included in this study as there are other factors which
could enhance the job satisfaction of employees. The main limitation of this study is that it
adopted a stratified random sampling technique to compare the sectors by selecting public
and privately owned companies which are always associated with the risk of bias as
explained by Saunders et al (2009). As a result, the generalizability of the results is
restricted to the respective companies only as this study has just considered the ownerships
of the sectors (i.e. public and private). This led the further researchers to use other
sampling techniques and hence, by further expanding the present study researchers would
have an opportunity to explore the determinants of job satisfaction in the selected
companies of Pakistan in Lahore and other provinces.
7.7 Recommendations
The research yields numerous findings and outcomes in regards to the comparative analysis
performed between the public and private sectors of the manufacturing industries operating in
Lahore-Pakistan. Previous studies have shown that there are many influencing factors upon
which job satisfaction levels of employees rely. The factors are physical, psychological and
environmental which affect employees’ job satisfaction levels in Lahore-Pakistan. However,
this study only considered organisational factors as it is based on the study of Khalid et al.
(2012) which differs with respect to nature of business and factors involved in enhancing job
satisfaction of employees.
Moreover, after the analysis, it is concluded that the acknowledged factors are either fully or
partially supposed to impact employee’s job satisfaction. Based on the research findings the
researcher has made following recommendations:
1. Management ought to give careful consideration to employees’ job satisfaction while
providing salaries packages to employees.
2. Management should be concerned regarding adding extra perks on the salaries
(mainly monetary advantages) so that it may help in boosting the job satisfaction
208
levels of employees. This also helps the employees to stick to their jobs for longer
periods of time.
3. Private sector management should focus on giving employees job security, comforting
work conditions and great workplace environments for boosting job satisfaction
levels.
4. Management should also provide more opportunities for developmental procedures
and should promote to the aptitudes and capacities of their workers.
5. Employees are content with having well-disposed working environments. This
demonstrates, therefore, that the private sector must get more familiar with their
employees and make workers consider themselves to be leaders, and not as
supervisors.
6. Since workers are occupied with having great collaboration with co-workers,
organisations and companies should make it a point to have a workplace where great
participation and common appreciation for workers exist.
7. Employees should be given recognition in the private sector so that they should feel
confidence in the workplace and perform well.
8. The human resource management of private sector should adopt new motivation
techniques to enhance the job satisfaction level of their employees.
9. The government should introduce a mechanism through both public and private
sectors could share and profit from their research findings to enhance employee job
satisfaction.
10. Management should introduce new intrinsic rewards for their employees mainly in
private sector as majority of the employees showed low levels of job satisfaction.
The above mentioned recommendations imply that human resource practitioners should
design such strategies which can enhance the employee job satisfaction thereby supporting
their businesses in long term.
Future researchers should focus on adopting qualitative methodology to examine the
perceptions of respondents towards job satisfaction. They are advised to investigate the
factors of job satisfaction which could further enhance the job satisfaction levels. Pay and co-
workers’ relationships were recorded as weak but this does not mean that the management
should ignore the importance of pay.
209
As previous researchers revealed, the impact on pay on job satisfaction is positively
associated. However, the main difference in the findings was due to the culture, nature of
business and needs and wants of the employees which differs with respect to time and other
demographic factors. Hence, it is recommended that the future researchers should examine
the influence of demographic factors as well.
7.8 Knowledge Contribution
This research study has identified some of the independent variables’ (both intrinsic and
extrinsic) relationships which was recorded significant for promotion, job security,
supervision, task significance, working environment, working conditions, achievement,
recognition, responsibility and work itself with the job satisfaction while salaries and co-
workers’ impact was observed as insignificant. As this study is a comparative study,
therefore, it analysed the effect of job satisfaction of employees working in the public and
private sectors of manufacturing industry located in Lahore-Pakistan.
The research findings contributed to knowledge as well as literature by developing the job
satisfaction theory with respect to the relationship between job satisfaction and independent
variables with particular reference to the manufacturing industry of Lahore-Pakistan. This
contributes the perspective of a less developed country (Pakistan) in comparison to the
developed countries of Europe and North America.
Batool (2010) suggested that there are factors which need clarifications such as the
differences in job satisfaction levels among employees in the two sectors of public and
private. For the attainment of this project, the researcher developed a framework to establish
the relationship between job satisfaction and its variables in the public and private sectors of
the manufacturing industry of Lahore in Pakistan.
Previous studies were mainly based in the Western countries (Yang and Wang, 2013) and
limited research has been conducted on the comparative analysis of job satisfaction among
the public and private sectors of Pakistan. Kumari and Pandey (2011) stated that the
comparison between public sector and private sector is a debate which seems to be a never-
ending topic. This shows that different researchers presented various controversial findings
based on these two sectors as both sectors provide scopes in different ways (Kumari &
210
Pandey, 2011). Hence, conducting the research on both sectors proves to be significant and
useful for the human resource practitioners and businesspeople in Lahore-Pakistan. Here the
development of human resource needs much attention both in the public and private sector
organisations. This is because they are accountable to the nation of Pakistan (Mohammad &
Kolachi, 2013) and the private sectors which constitute 77% of privately owned companies
(Mangi et al. 2012) which means more than half of Pakistan rely on private sector
organisations. It is important, therefore, to measure the degree by which certain factors
influence the job satisfaction of employees.
The conceptual framework was designed after critical evaluation of the factors that contribute
towards employees’ job satisfaction. The formulated research hypothesis are either supported
or rejected by means of statistical techniques. The theoretical framework revealed that a
positive relationship exists between job satisfaction and the independent variables as
discussed previously which was carried out with help of multiple regression analysis and the
differences were measured employing a t-test.
There had been researches conducted in the Western countries, but there was limited access to
a country like Pakistan where employees’ job satisfaction levels were not measured in the
public and private sectors of the manufacturing industry in Lahore-Pakistan. More so, these
industries faced problems in terms of their performances and growth and had declined by 11
per cent of Gross Domestic Product as suggested by Memon and Tahir (2012). Hence, with
the help of analysis, the researcher identified the factors which could increase the
performances of the employees which have a direct impact on the success of an organisation
in terms of profitability and generation of revenue to the economy of a country.
This study closed the gap in the literature by investigating the relationship between the
dependent and independent variables in manufacturing industry of Lahore in Pakistan as little
evidence is provided on the job satisfaction of employees working in large organisations in
the country as stated by Rukh et al. (2015). Since, manufacturing industry is one of the major
operating businesses in Pakistan and shares approximately 18.7 per cent of Gross Domestic
Product (GDP) as mentioned by Memon and Tahir (2012). Therefore, this study will help the
human resource managers to enhance the job satisfaction of employees in the manufacturing
industry of Lahore-Pakistan as employees’ job satisfaction is directly proportional to the
performance of an organisation as stated by Aziri (2011).

211
7.9 Need for Further Research
Although this study has determined factors in the manufacturing industry of Lahore-Pakistan
that contributes towards the enhancement of employee job satisfaction, a lot of research is
still required to understand better the influence of these factors in other regions of Pakistan.
The future researchers need to further explore the factors which can enhance the job
satisfaction in the private sectors of the manufacturing industry of Lahore-Pakistan. Since,
each industry is distinct from each other future researchers could be motivated to apply this
model in small scale manufacturing companies to evaluate employee’s perception towards job
satisfaction.
212
References
Abbasi, A. S., Hameed, I. & Bibi, A. (2011). Team management: The Islamic paradigm,
African Journal of Business Management, 5(5), pp.1975–1982.
Abugre, J. B. (2012). How managerial interactions affect employees’ work output in
Ghanian Organizations. African Journal of Economic and Management Studies, 3(2), pp.
204-226.
Abugre, J.B. (2011). Perceived satisfaction in sustained outcomes of employee
communication in Ghanaian organizations, Journal of Management Policy and Practice,
12(7), pp.37-49.
ACAS, (2010). Digest on job security: A reference document for Higher Education
institutions with input from UCEA and the HE Trade Unions, p.4. [Online] Available at:
https://www.ucu.org.uk/media/3778/ACAS-Digest-on-job-security-a-reference-document-
for-HEIs-Jan-10/pdf/acas_digestjobsecurity_jan10.pdf [Accessed 15 June 2016].
Acuna, E. & Rodriguez, C. (2004). A meta analysis study of outlier detection methods in
classification. [Online] Available at: http://academic.uprm.edu/~eacuna/paperout.pdf
[Accessed 19 July 2015].
Adebayo, S. O., & Ogunsina, S. O. (2011). Influence of supervisory behaviour and job
stress on job satisfaction and turnover intention of police personnel in Ekiti State. Journal of
Management and Strategy, 2(3), pp.13-20.
Adeniji, A.A. (2011). Organizational climate and job satisfaction among academic staff in
some selected private universities in southwest Nigeria. [Online] Available at:
http://medcontent.metapress.com/index/A65RM03P4874243N.pdf [Accessed 6 March
2015].
Adenike, A. (2011). Organizational climate as a predictor of employee job satisfaction:
Evidence from Covenant University. Business Intelligence Journal, 4(1), pp. 151-165.
Ahmad, H., Ahmad, K., & Shah, A. I. (2010). Relationship between job satisfaction, job
performance attitude towards work and organizational commitment. European Journal of
Social Science, 18(2), pp.257–267.

213
Ahmad, S., Khalil, A. B., Rashed, C. A. A., Iqbal, M., & Ferdoushi, N.(2012). Effect of
some selected factors on job satisfaction in public banking. Journal of Business and
Management, 5(3), pp.685–699.
Alderfer, C. P. (1969). An empirical test of a new theory of human needs. Organizational
behaviour and Human Performance,4(2), pp. 142-175.
Ali, R. M., & Wajidi, F. A. (2013). Factors influencing job satisfaction in public. Global
Journal of Management and Business Research: Administration and Management,13(8),
pp.60-66.
Aliakbari, M., & Kafshgar, N. B. (2013). On the relationship between teachers’ sense of
responsibility and their job satisfaction: The case of Iranian high school teachers. European
Online Journal of Natural and Social Sciences, 2(2), pp. 487-501.
Aliseda, A. (2007). Abductive reasoning: Challenges ahead, Theoria. An International
Journal for Theory, History and Foundations of Science, 22(3), pp.261-270.
Allen, N. J., & Meyer, J. P. (1996). Affective, continuance, and normative commitment to
the organization: An examination of construct validity. Journal of Vocational Behaviour,
49(3), pp. 252-276.
Allen, N., & Meyer, J. (1990). Organizational socialization tactics: A longitudinal analysis
of links to newcomers’ commitment and role orientation. The Academy of Management
Journal, 33(44), pp.847-58.
Allison, P. (2001). Missing data. Thousand Oaks, CA: Sage Publications, p.72.
Alshitri, K. (2013). An investigation of factors affecting job satisfaction among R & D
center employees in Saudi Arabia. The Journal of Human Resources Management
Research, 2013, pp.1–10.
Andersen, R. (2008). Modern methods for robust regression. Thousand Oaks, CA: Sage
Publications.
Ara, I. (2004). Is Pakistan’s manufacturing sector competitive? Pakistan Development
Review, 43(4), pp.685-706.
Arthur, T., & Paul, L. R. (1965). Industrial jobs and the worker. Boston: Harvard
214
University.
Asegid, A., Belachew, T., & Yimam, E. (2014). Factors influencing job satisfaction and
anticipated turnover among nurses in Sidama zone public health facilities, south Ethiopia.
Nursing Research and Practice, 10(1), pp. 1-26.
Ashraf, M., Ahmad, N., Shaikh, O. A., Bhatti, S.R., & Soomro, A.H. (2013). The
determinants of job satisfaction in public service organization. European Scientific Journal,
9(35), pp.362–377.
Atambo, W., Kabare, K., Munene, C., & Nyamwamu, W. (2012). Enhancing the role of
employee recognition towards improving performance: A survey of Kenyatta national
hospital, Kenya. International Journal of Arts and Commerce, 1(7), pp. 95-109.
Aycan, Z., Kanungo, R., Mendonca, M., Yu, K., Deller, J., Stahl, G., & Kurshid, A. (2000).
Impact of culture on human resource management practices: A 10-country comparison.
Applied Psychology-An International Review, 49(1), pp.192–221.
Ayub, N. (2010). A comparative study of private and public universities teachers’ job
satisfaction, in O. F. V. Feigenblatt, ed., Alternative Perspectives in the Humanities and the
Social Sciences, pp. 86-95.
Azeem, S. M. (2010). Job satisfaction and organizational commitment among employees in
the Sultanate of Oman. Psychology, 1(04), pp.295-299.
Aziri, B. (2011). Job satisfaction : A literature review. Management Research and Practice,
3(4), pp.77–86.
Aziz, R. (2013). Comparative study of job satisfaction of public and private university
teachers in Khyber Pakhtun Pakistan. A thesis submitted in partial fulfilment of the
requirements of the degree of doctor of philosophy in education. Nowshera: Nortehrn
University, pp. 1-179.
Bakotic, D., & Babic, T. (2013). Relationship between working conditions and job
satisfaction: The case of Croatian Shipbuilding Company. International Journal of Business
and Social Science, 4(2), pp.206-213.
Banjoko, S. A. (2006). Managing corporate reward systems. Ibadan: Pumark Nigeria
Limited.
215
Bas, T., & Ardic, K. (2002). A comparison of job satisfaction between public and private
university academicians in Turkey. METU Studies in Development, 29 (1-2), pp. 27-46.
Batool, S. H. (2010). Perceptions about participative management practices in the
universities libraries of Punjab: An exploratory study of senior professional staff.
Unpublished.
Behling, O., Labovitz, G., & Kosmo, R. (1968). The Herzberg controversy: A critical
reappraisal. Academy of Management Journal, 11(1), pp.99-108.
Beiske, B. (2007). Research methods: Uses and limitations of questionnaires, interviews
and case studies. Grin Verlag: Germany.
Bell, J. (2005). Doing your Research Project. [Online] Available at:
http://books.google.com/books?id=aroefdSRc8AC&pgis=1 [Accessed 8 March 2015].
Benrazavi, S. R., & Silong, A.D. (2013). Employees’ job satisfaction and its influcence on
willingness to work in teams. Journal of Management Ploicy and Practice,14(1), pp. 127-
140.
Benson, S. G & Dundis, S. P. (2003). Understanding and motivating health care
employees: integrating Maslow’s hierarchy of needs, training and technology. Journal of
Nursing Management, 11(5), pp. 315–320.
Bhattacherjee, A. (2012). Social science research: principles, methods, and practices.
[Online] Available at:
http://scholarcommons.usf.edu/cgi/viewcontent.cgi?article=1002&context=oa_textbooks
[Accessed 16 April 2016].
Bhutto, N. A., Laghari, M. K., & Butt, F. D. (2012). Comparative study of organizational
climate and job satisfaction in public, private and foreign banks, Asian Social Science,8(4),
pp.259-267.
Blonski, K., & Jefmanski, B. (2013). Determinants of satisfaction of th employee of local
government units. Economics & Sociology, 6(2), pp.158–171.
Böckerman, P., & Ilmakunnas, P. (2012). The job satisfaction-productivity nexus: A study
using matched survey and register data. Industrial & Labor Relations Review, 65(2),
pp.244–262.
216
Brainard, J. (2005). Postdoctoral researcher’s value structured training over pay, survey
says. Chronicle of Higher Education, 51(32), pp.21-28.
Brass, D. J. (1981). Structural relationships, job characteristics, and worker satisfaction and
performance. Administrative Science Quarterly,26(3), pp. 331-48.
Brayfield, A. H., & Rothe, H. F. (1951). An index of job satisfaction. Journal of Applied
Psychology, 35(5), pp.307-311.
Bright, L. (2008). Does public service motivation really make a difference on the job
satisfaction and turnover intentions of public employees? American Review of Public
Administration, 38( 2), pp. 149-166.
Bryman, A. (2006). Integrating quantitative and qualitative research: How is it done?
Qualitative Research, 6(1), pp. 97-113.
Bryman, A., & Bell, E. (2003). Business Research Methods. Oxford: University Press.
Buchanan, D., & Huczynski, A. (2004). Organisational behaviour.An introductory text.
Harlow: Prentice Hall.
Buchanan, D., & Huczynski, A. (2004). Organizational behaviour. USA: Prentice Hall.
Burns, N., & Grove, S. K. (2003). Understanding nursing research. Philadelphia:
W.B.Saunders Company, p.195.
Burrel, G., & Morgan, G. (1982). Sociological paradigms and organisational analysis.
Elements of the sociology of corporate life. London: Heinemann.
Campbell, D., & Campbell, S. (2008). Introduction to regression and data analysis. Statlap
Workshop Series, pp.1-15.
Carr, G. (2005). Investigating the motivation of retail managers at a retail organisation in the
Western Cape. A min-thesis submitted in partial fulfilment of the requirements for the
degree of magister commercii in the department of industrial psychology, faculty of
economic and management science. Cape Town, South Africa: University of the Western
Cape.
Caspi, A., Wright, B. R., Moffitt, T. E. & Silva, P. A. (1998). Early failure in the labor
market: Childhood and adolescent predictors of unemployment in the transition to
217
adulthood. American Sociological Review, 63(3), pp. 424-451.
Caulton, J. R. (2012). The development and use of the theory of ERG: A literature review.
Celik, M. (2011). A theoretical approach to the job satisfaction. Polish Journal of
Management Studies, 4(7), pp.7-15.
Certo, S. C., & Certo, S. T. (2006). Modern Management. New Delhi: Prentice Hall, p.2.
Charmaz, K. (2006). Constructing grounded theory, a practical guide through qualitative
analysis. London, Thousand Oaks: Sage.
Charniak, E., & McDermott, D. (1985). Introduction to artificial intelligence. Reading, MA:
Addison Wesley.
Chatterjee, I., & Chattopadhyay, M. (2015). The impact of motivational factors on job
satisfaction of public and private sector bank employees. International Journal of Science
Technology and Management, 4(1), pp.51-58.
Chaudhry, M. S., Sabir, H. M., Rafi, N., & Kalyar, M. N. (2011). Exploring the relationship
between salary satisfaction and job satisfaction: A comparison of public and private sector
organizations. The Journal of Commerce, 3(4), pp.1-14.
Chen, L. H. (2008). Job satisfaction among information system personnel. Computers in
Human Behavior, 24(1), pp.105-118.
Chen, Z. X., Tsui, A. S., & Farh, J. L. (2002). Loyalty to supervisor vs. organizational
commitment: relationships to employee performance in China. Journal of Occupational and
Organizational Psychology,7(3), pp. 339-356.
Churchill, G. A. (1979). A paradigm for developing better measures of marketing
constructs. Journal of Marketing Research, 16(1), pp.64-73.
Clark, A. E., & Oswald, A. J. (1996). Satisfaction and Comparison Income, Journal of
Public Economics, 61(3), pp.359-381.
Cohen, L., Manion, L., & Morrison, K. (2007). Research methods in education. London:
Routledge.
Collis, J., & Hussey, R. (2003). Business Research: A Practical Guide for Undergraduate

218
and Postgraduate Students. 2nd ed. Basingstoke: Macmillam Business.
Commonwealth Network, (2016). Find Industry and Manufacturing expertise in Pakistan.
[Online] Available at: http://www.commonwealthofnations.org/sectors-
pakistan/business/industry_and_manufacturing/ [Assessed 30 October 2016].
Costello, A. B., & Osborne, J. W. (2005). Best practices in exploratory factor analysis: Four
recommendations for getting the most from your analysis. Practical Assessment, Research
& Evaluation, 10(7), pp. 1-9.
Creative Research Systems, (2016). [Online] Available at:
http://www.surveysystem.com/sscalc.htm [Accessed 15 January 2016].
Creswell, J. W. (2009). The Selection of a Research Approach. Research design:
qualitative, quantitative, and mixed methods approaches. 3rd ed. London: Sage
Publications. pp.3–22.
Creswell, J. W. (2014). Research design qualitative, quantitative, and mixed methods
approaches. 4th ed. California: Sage Publications.
Cross, D. (1973). The worker opinion survey: A measure of shop-floor satisfaction.
Occupational Psychologt, 47(3-4), pp.193-208.
D'Addio, A. C., Eriksson, T., & Frijters, P. (2003). An analysis of the determinants of job
satisfaction when individuals’ baseline satisfaction levels may differ.The activities of CAM
are financed by a grant from The Danish National Research Foundation. Social Science
Research, pp.1-33.
Danish, R. Q., & Usman, A. (2010). Impact of reward and recognition onn job satisfaction
and motivation: An empirical study from Pakistan. International Journal of Business and
Management, 5(2), pp.159-167.
De Gieter, S., & Hofmans, J. (2015). How reward satisfaction affects employees’ turnover
intentions and performance: An individual differences approach. Human Resource
Management Journal, 25(2), pp.200-216.
De Vaus, D. A. (2001). Research design in social research, London: Sage Publications,
pp.34-52.
219
Dillman, D. A. (2007). Mail and internet surveys: The Tailored Design Method 2007 update
with new internet, visual, and mixed-mode guide. Hoboken, New Jersey: John Wiley &
Sons, Inc.
Dong, Q., Elliott, M. R., & Raghunathan, T. E. (2014). A nonparametric method to generate
synthetic populations to adjust for complex sampling design features. Survey Methodology,
40(1), pp.29-46.
Drucker, P. F. (1995). Managing in a Time of Great Change. New York: Penguin Books
USA.
Durst, S. L., & DeSantis, V. S. (1997). The determinants of Job satisfaction among federal,
state, and local government employees. State and Local Government Review, 29(1), pp. 7-
16.
Eder, P., & Eisenberger, R. (2008). Perceived organizational support: Reducing the negative
influence of coworker withdrawal behavior. Journal of Management, 34(1), pp.55-58.
Ellickson, M. C., & Logsdon, K. (2001). Determinants of job satisfaction of Municipal
Government employees. State and Local government Review,33 (3), pp. 173-184.
Elnaga, A. A., & Imran, Amen. (2014). The impact of employee empowerment on job
satisfaction. American Journal of Research Communication, 2(1), pp. 1-14.
Emerging leadership journeys, Regent University School of Global Leadership and
Entrepreneurship, 5(1), pp. 2-8.
Eseka, J. A. (2009). Organizational behaviour understanding and application. Ondo: Sylva
Publisher Limited.
Ethridge, D. (2004). Research methodology in applied economics: organizing, planning,
and conducting economic research. Oxford: Blackwell.
Ewen, R., Smith, P., Hulin, C., & Locke, E. (1966). An empirical test of the Herzberg two-
factor theory. Journal of Applied Psychology, 50(6), pp.544-550.
Fabrigar, L. R., Wegener, D. T., MacCallum, R. C., & Strahan, E. J. (1999). Evaluating the
use of exploratory factor analysis in psychological research. Psychological Methods, 4(3),
272–299.

220
Fann, K. T. (2012). Peirce’s theory of abduction. The Hague. The Netherland: Martinus
Nijhoff.
Fayol, H. (1949). General and Industrial Management. New York: Pitman.
Field, A. (2005). Discovering statistics using SPSS: (And sex, drugs and rock n’roll).
Introducing statistical methods. 2nd ed. London: Sage Publications.
Field, A. (2009). Discoverig statistics using SPSS:(And sex, drugs and rock n’roll).
Introducing statistical methods. 3rd ed. London: Sage Publications, pp.1-685.
Fink, A. (2003). The survey Hand book. 2nd ed. Thousand Oaks, CA: Sage Publications.
Flowers, P. (2009). Research philosophies – Importance and relevance. Leading Learning
and Change, 1(3), pp.1–5.
Forum, W.E. (2009). The travel & tourism competitiveness report, Available at:
http://www.weforum.org/reports/travel-tourism-competitiveness-report-2009 [Accessed 7
March 2016].
Freeman, R. B. (1978). Job Satisfaction as an Economic Variable. American Economic
Review, 68(2), pp.135-141.
Frey, B. S., & Stutzer, A. (2002). What can economists learn from happiness research?
Journal of Economic Literature, 40(2), pp.402–435.
Gajic, T., Kovacevic, B., & Penic, M. (2014). Employees’ satisfaction in travel agencies.
African Journal of Bussines Management, 8(14), pp.540–550.
Gamboa, L. F., Garcia-Suaza, A., & Rodriguez-Acosta, M. (2011). Job satisfaction in a
developing country: Exploring the work-family rivalry, Federal Reserve Bank of St Louis,
St. Louis.
Gawel, J. (1997). Performance management: Changing behaviour that drives
organizational effectiveness. 4th ed. New York: John Wiley & Sons.
Ghasemi, A., & Zahediasl, S. (2012), Normality test for statistical analysis: A guide for non-
statistician, International Journal of Endocrinology and Metabolism, 10(2), pp.486-489.
Gilbreth, F. B., & Gilbreth, L. M. (1917). Applied motion study. New York: Sturgis Walton.
221
Gingery, T. (2009). Sampling demystified: Probability vs. Non-probability sampling.
[Online] Available at: http://survey.cvent.com/blog/market-research-design-tips-
2/sampling-demystified-probability-vs-nonprobability-sampling [Accessed 13 March 2015].
Glass, G. V., & Hopkins, K. D. (1984). Statistical methods in education and psychology.
2nd ed. Boston: Allyn and Bacon.
Gordan, V. (2011). Exploring the job satisaction of municipal clerks. Review of Public
Personnel Adminstration,31(2), pp.190-208.
Gorsuch, R. L. (1990). Common factor analysis versus component analysis: Some well and
little known facts. Multivariate Behavioral Research,25(1), pp.33–39.
Govindan, S. (2013).Job Satisfaction. Saarbrucken: LAP LAMBERT Academic Publishing.
Grace, D. H., & Khalsa, S. A. (2003). Re-recruiting faculty and staff: The antidote to
today’s high attrition. Independent school, 62(3), pp.20-27.
Grant, A. M. (2008). The significance of task significance: Job performance effects,
relational mechanisms, and boundary conditions. Journal of Applied Psychology,93(1),
pp.108-124.
Gravetter, F. J., & Wallnau, L. B. (2000). Statistics for the behavioral sciences. 5th ed.
Belmont, CA: Wadsworth.
Greenberg, J., & Baron, R. A. (2003). Behaviour in organizations: Understanding and
managing the human side of work. 8th ed. New Jersey: Pearson Education International.
Griffin, R. W. (2006). Management. 8th ed. Newyork: Houghton Mifflin Company.
Gupta, M., & Sharma, P. (2009). Job satisfaction level among employees: A case study of
Jammu Region, ICFAI Journal of Management Research,8(5), pp.17-25.
Hackman, J. R., & Oldham, C. R. (1975). Development of the job diagnostic survey.
Journal ofApplied Psycholog, 60(2), pp.159-170.
Hair, J. F., Jr., Anderson, R. E., Tatham, R. L., & Black, W. C. (1995). Multivariate Data
Analysis.3rd ed. New York: Macmillan.
Hair, J., Black, W., Babin, B., Anderson, R., & Tatham, R. (2006). Multivariate data
222
analysis. 6th ed. Uppersaddle River, New Jersey: Pearson Prentice Hall.
Halepota, J. A. (2011). Determinants of work Attributes and personality aspects towards
employees’ job satisfaction. A thesis submitted for the degree of doctor of philosophy. West
London: Brunel University, pp.1-247.
Haorei, W. (2012). A study on job satisfaction and its consequences on work productivity in
textiles mills. Journal of Business Management and Social Sciences Research, 1(3), pp. 50 –
56.
Harman, G., H. (1965). Inference to the best explanation. ThePhilosophical Review, 74(1),
pp. 88-95.
Harmer, R., & Findlay, B. (2005). The effect of workplace relationships on employee job
satisfaction for 25-35 years old. In the 5th annual conference of the APS on the phycology
of relationship interest group: The good, the bad, and the ugly in personal, national and
international relationships. Melbourne, November 12-13, 2005. Australian Catholic
University, Melbourne. pp. 76-79.
Hassan, M. Hassan, S., Khan, K. U., & Naseem, M. A. (2011). Employee retention as a
challenge in leather industry. Global Journal of Human Social Science, 11(2), pp.8-13.
Hassan, Y., Ud-din, K., Mir, Z., Ahmad, K., Mateen, A., Ahmad, W., & Nasir, A.B. (2011).
Job satisfaction in private banking sector of Pakistan. Global Journal of Management and
Business Research,11(12), pp. 84-93.
Hatch, M. J., & Cunliffe, A. L. (2006). Organization Theory. 2nd ed. Oxford University
Press.
Heery, E., & Noon, M. (2001). A Dictionary of Human Resource Management, Oxford
University Press.
Helman, R., Copeland, C., VanDerhei, J., & Salisbury, D. (2008). EBRI 2008 recent retirees
survey: Report of findings (Issue Brief No. 319). Washington, DC: Employee Benefit
Research Institute. Retrieved from http://www.ebri.org/pdf/briefspdf/EBRI_IB_07-
2008.pdf.
Henry, G. T. (1990). Practical sampling. Thousand Oaks, CA: Sage Publications.
223
Herzberg, F. (1966). Work and the nature of man. New York: The World Publishing
Company.
Hlatywayo, C., Mlanga, T., & Zingwe, T. (2013). Neuroticism as a determinant of job
satisfaction among bank employees. Mediterranean Journal of Social Sciences, 4(13), pp.
549-554.
Holden, M. T., & Lynch, P. (2004). Choosing the appropriate methodology: Understanding
research philosophy. The Marketing Review, 4(4), 397-409.
Hoque, F., Rabbany, G., Anny, S. A. & Akhter, A. (2016). Level of job satisfaction in
agribusiness sector in Bangladesh: An application of Hertzberg two factors motivation
theory. International Journal of Economics, Commerce and Management, 4(6), pp.419-445.
Hussain, R. I. (2012). Job Satisfaction among employees of banks: A comparative analysis
between public and private sector banks of Punjab, Pakistan, International Journal of Asian
Social Science, 2(11), pp. 1915-1924.
Hyder, M., & Batool, S. H. (2013). Job satisfaction among public and private
University/degree awarding institution librarians of Lahore: A comparative study. Pakistan
Journal of Library and Information Science, 14(1), pp.16–25.
Iqbal, S., Ehsan, S., Rizwan, M., Noreen, M., & Rizwan, M. (2014). The impact of
organisational commitment, job satisfaction, job stress and leadership support on turnover
intention in educational institutes, 4(2), pp.181-195.
Irad, B. G. (eds.) (2005). Outlier Detection. Data Mining and Knowledge Discovery
Handbook, Israel: Springer. pp.131–146.
Islam, M. Z., & Siengthai, S. (2009) Quality of work life and organizational performance:
Empirical evidence from Dhaka export processing zone. In ILO Conference on regulating
for decent work. Geneva, 8-10th July 2009. Geneva: International labour office, pp. 1-19.
Islam, M. S., & Islam, M. M. (2014). A Comparative study of job satisfaction in baking: A
Case study of public and private bank sectors, European Journal of Business and
Management, 6(21), pp.105-111.
Ivancevich, J. M., Konopaske, R., & Matteson, M. T. (2008). Organizational behaviour
and management. 8th ed. New York: McGraw-Hill Higher Education.
224
Iverson, R. D. (1996). Employee acceptance of organizational change: The role of
organizational commitment. International Journal of Human Resource Management, 7 (1),
pp. 122-149.
Jain, R., & Kaur, S. (2014). Impact of work environment on job satisfaction. International
Journal of Scientific and Research Publication, 4(1), pp.1–8.
Javed, M., Balouch, R., & Hassan, F. (2014). Determinants of job satisfaction and its impact
on employee performance and turnover intentions, International Journal of Learning &
Development, 4(2), pp.1-21.
Jawahar, I. (2006). Correlates of satisfaction with performance appraisal feedback. Journal
of Labor Research, 27(2), pp.213-236.
Johnson, B., & Christensen, L. (2010). Educational research: quantitative, qualitative, and
mixed approaches. UK: Sage Publications, pp. 32-130.
Judge, T., & Klinger, R. (2008). Job satisfaction: Subjective well-Being at work. The
science of subjective well-being. New York: Guilford Publications, pp.393–413.
Jung, K., Jae Moon, M. & Hahm, S. D. (2007). Do age, gender, and sector affect job
satisfaction? Results from the Korean labor and income panel data. Review of Public
Personnel Administration, 27(2), pp.125–146.
Kaiser, H. F. (1960). The application of electronic computers to factor analysis. Educational
and Psychological Measurement, 20(1), pp.141-151.
Kaur, H. (2012). Job satisfaction during recession period: A study on public & private
insurance in Pakistan. International Journal of Advanced Research in Management and
Social Sciences, 1(1), pp.24-42.
Kelemen, M. L. & Rumens, N. (2008). An introduction to critical management research.
London: Sage Publications.
Kendall, E., & Robinson, C. (1975). Motivation and productivity of the technical employee.
Industrial Management, 17(6), pp.1-8.
Khalid, S., & Irshad, M. Z. (2010). Job satisfaction among Bank employees in Punjab,
Pakistan: A comparative study. European Journal of Social Sciences, 17(4), pp.570-577.
225
Khalid, S., Irshad, M. Z., & Mahmood, B. (2012). Job Satisfaction among Academic Staff:
A comparative analysis between public and private sector universities of Punjab, Pakistan.
International Journal of Business and Management, 7(1), pp.126–136.
Khan, A. H., Nawaz, M. M., Aleem, M., & Hamid, W. (2012). Impact of job satisfaction on
employee performance : An empirical study of autonomous medical institutions of Pakistan.
African Journal of Business Management, 6(7), pp.2697–2705.
Khan, N. A., & Parveen, S. (2014). A comparative study of job satisfaction of employees in
public and private sector banks in India with reference to U.P. State, Human Resource
Management Journal, 26(2), pp.813-820.
Kim, S. (2009). IT employee job satisfaction in the public sector. International Journal of
Public Administration, 32(12), pp. 1070-1097.
Kinzl, J. F., Knotzer, H., Traweger, C., Lederer, W., Heidegger, T., & Benzer, A. (2005).
Influence of working conditions on job satisfaction in anesthetists. British Journal of
Anesthesia, 94(2), pp. 211-215.
Koustelios, D. A. (2001). Personal characteristics and job satisfaction of Greek teachers.
The International Journal of Educational Management,7(15), pp.354-358.
Koutsoyians, A. (1991). Modern Microeconomics. 2nd ed. London: Macmillan Education
Ltd.
Kreitner, R., & Kinicki, A. (2007). Organizational behavior.7th ed. Boston, MA: McGraw –
Hill Irwin
Krejcie, R. V., & Morgan, D. W. (1970). Determining sample size for research activities.
Educational and psychological measurement. 30. pp. 607-610.
Kron, Z. M., (2016). Lahore, Pakistan. Conservation of the Urban Fabric. [Online]
Available at: http://web.mit.edu/akpia/www/AKPsite/4.239/lahore/lahore.html
[Accessed 24 June 2016].
Kuhn, T. S. (1970). The structure of scientific revolutions. 2nd ed. Chicago, IL: University
of Chicago Press.
Kumari, G., & Pandey, K. M. (2011). Job satisfaction in public sector and private sector: A
226
comparison, International Journal of Innovation, Management and Technology, 2(3),
pp.222-228.
Latif, K., Shahid, M. N., Sohil, N., & Shahbaz, M. (2011). Job satisfaction among public
and private college teachers of District Faisalabad, Pakistan : A comparative analysis.
Interdisciplinary Journal of Comtemporary Research in Business, 3(8), pp.235–242.
Lee, J. J., & Ok, C. (2011). Effects of workplace friendship on employee job satisfaction,
organizational citizenship behavior, turnover intention, absenteeism, and task performance.
The 16th Annual graduate education & graduate students research conference in hospitality
& tourism. Track 2, Poster Session.
Lehman, J. (2014). Facets of Job Satisfaction. A thesis submitted in partial fulfilment for the
requirements for the degree of master of public administration. Texas: Texas State
University.
Levy, P. S., & Lemeshow, S. (2013). Sampling of populations: Methods and applications.
4th ed. New York: John Wiley & Sons.
Linley, P. A., Maltby, J., Wood, A. M., Osborne, G., & Hurling, R. (2009). Measuring
happiness: The higher order factor structure of subjective and psychological well-being
measures. Personality and Individual Differences,47(8), pp.878−884.
Locke, E. A. (1969). What is Job Satisfaction? Organisational Behaviour and Human
Performance, 4(4), pp. 309-336.
Locke, E. A. (1970). Job satisfaction and job performance: A theoretical analysis.
Organizational Behavior and Human Performance,5(5), pp. 484-500.
Locke, E.A. (1976). The nature and causes of job satisfaction, in Dunnette, M. D. Handbook
of industrial and organisational psychology. Chicago: Rand McNally.
Luddy, N. (2005). Job satisfaction among employees at a public health institution in the
Western Cape. A min-thesis submitted in partial fulfilment of the requirements for the
degree of magister commercii in the department of industrial psychology, faculty of
economic and management science. Cape Town, South Africa: University of the Western
Cape.
Luthans, F. (1998). Organisational Behaviour. 8th ed. Boston: Irwin McGraw-Hill.
227
Lynch, S. M. (2003). Introduction to applied Bayesian statistics and estimation for social
scientists. New York: Springer.
Macdonald, S., & Maclntyre, P. (1997). The Generic Job Satisfaction Scale. Employee
Assistance Quarterly, 13(2), pp.1–16.
Mafini, C., & Pooe, D. (2013). The relationship between employee satisfaction and
organisational performance: Evidence from a South African government department. South
African Journal Of Industrial Psychology, 39(1), pp. 1-13.
Mahmood, Z., Basharat, M., & Bashir, Z. (2012). Review of classical management theories.
International Journal of Social Sciences and Education, 2(1), pp. 512-522.
Malik, M. E., Danish, R. Q., & Munir, Y. (2012). The impact of pay and promotion on job
satisfaction: Evidence from higher education institutes of Pakistan. American Journal of
Economics, 2(4), pp.6-9.
Malik, M. E., Nawab, S., Naeem, B., & Danish, R. Q. (2010). Job satisfaction and
organizational commitment of university teachers in public sector of Pakistan, International
Journal of Business and Management, 5(6), pp.17-26.
Mangi, R. A., Jhatial, A. A., Shah, S. A. A., & Ghumro, I. A. (2012). Human resource
management practices in private sector organisations in Pakistan: Study of cultural
influences. Global Journal of Management and Business Research, 12(7), pp. 20-30.
Markey, R., Ravenswood, K., & Webber, D. J. (2012). The impact of the quality of the work
environment on employees’ intention to quit. University of the West of England, Faculty of
Business and Law.
Maslow, A. H. (1943). A theory of human motivation. Psychological Review, 50(4), pp.370-
96.
Masood, A., Ain, Q. U., Aslam, R., Rizwan, M. (2014). Factors affecting employee
satisfaction of the public and private sector organisations of Pakistan. International Journal of
Human Resource Studies, 4(2), pp.97-121.
Mathis, R. L., & Jackson, J. H. (2004). Human Resource Management. 10th ed. Singapore:
Thomson Learning.

228
Mayo, E. (1949). Hawthorne and the Western Electric Company: The social problems of an
industrial civilisation. London: Routledge and Kegan Paul.
McCluskey, A., & Lalkhen, A. G. (2007). Statistics IV: Interpreting the results of statistical
tests. Continuing Education in Anaesthesia, Critical Care and Pain, 7(6), pp.208–212.
McCroskey, J. C. (2006). An introduction to rhetorical communication. 9th ed. Boston, Mass:
Allyn & Bacon.
McGregor, S. L. T., & Murnane, J. A. (2010). Paradigm, methodology and method:
Intellectual integrity in consumer scholarship. International Journal of Consumer Studies,
34(4), pp.419-427.
Memon, G. R. (2007). Education in Pakistan: The key issues, problems and the new
challenges. Journal of Management and Social Sciences, 3(1), pp.47-55.
Memon, M. A., & Tahir, I. M. (2012). Performance analysis of manufacturing companies in
Pakistan. Business Management Dynamics, 1(7), pp.12-21.
Michaels, E., Handfield-Jones, H., & Axelrod, B. (2001). The War for Talent. Boston:
Harvard Business School Press.
Mihajlov, S., & Mihajlov, N. (2016). Comparing public and private employees' job
satisfaction and turnover intention, MEST Journal , 4(1), pp.75-86.
Miller, D., Le Breton-Miller, I., & Scholnick, B. (2008). Stewardship versus stagnation: An
empirical comparison of small family and non-family businesses. Journal of Management
Studies, 45(1), pp. 51-78.
Mohammad, J., & Kolachi, N. A. (2013). Accountability of HR through Proper Supervision:
A case of public sector in. International Journal of Business and Social Science, 4(3), p. 102.
Moore, E. C., & Richard S. R. (1964). Studies in the philosophy of Charles Sanders Peirce.
Amherst: University of Massachusetts Press.
Morgeson, F. P., & Humphrey, S. E. (2006). The work design questionnaire (WDQ):
Developing and validating a comprehensive measure for assessing job design and the nature
of work. Journal of Applied Psychology, 91(6), pp.1321-1339.
Morris, T., Lydka H., & O’Creevy M. F. (1993). Can commitment be managed? A
229
longitudinal analysis of employee commitment and human resource policies. Human
Resource Management Journal, 3(3), pp.21-42.
Muhammad, N., & Akhter, M. (2010). Supervision, salary and opportunities for promotion as
related to job satisfaction. ASA University Review, 4(1), pp.255-261.
Narayan, P.K. (2004), Economic impact of tourism on Fiji’s economy: empirical evidence
from the computable general equilibrium model. Tourism Economics, 10(4), pp. 419–433.
Naseem, A., Sadia, E. S., & Malik, K. P. (2011). Impact of employee satisfaction on success
of organization: Relation between customer experience and employee satisfaction.
International Journal of Multidisciplinary Science and Engineering, 2(5), pp.41-46.
Nasir, Z.M., (2001). Earnings differential between public and private sectors in Pakistan.
Pakistan Development Review, 39(2), pp.111–130.
National bank of Pakistan, (2016). Employee Communication programme. [Online] Available
at: https://www.nbp.com.pk/HumanResource/index.aspx. [Accessed 23 April 2016].
Naveed, A., Usman, A., & Bushra, F. (2011). Promotion : A predictor of job satisfaction A study of glass industry of Lahore (Pakistan). International Journal of Business and Social Science, 2(16), pp.301–305.
Neuman, W. L. (2003). Social research methods: Qualitative and quantitative approaches.
5th ed. Boston, MA: Allyn and Bacon.
O’Brien, R. M. (2007). A caution regarding rules of thumb for variance inflation factors.
Quantity and Quality, 41(5), pp.673-690.
Okpara, J. O. (2002). The impact of salary differential on managerial job satisfaction: A study
of the gender gap and its implications for management education and practice in a developing
economy. The journal of Business in Developing Nations, 8, pp.65-92.
One World Nations Online, (2016). [Online] Available at:
http://www.nationsonline.org/oneworld/countries_by_area.htm [Accessed 23 June 2016].
Oosthuizen, T. F .J. (2001). Motivation influencing worker performance in a technical
division of Telkom SA. Acta Commercii, 1(1), pp.19-30.
Oshagbemi, T. (2003). Personal correlates of job satisfaction: Empirical evidence from UK

230
universities. International Journal of Social Economics, 30(12), pp.1210-1232.
Osibanjo, A. O., Gberevbie, D. E., Adeniji, A. A., & Oludayo, A. O. (2015). Relationship
modelling between work environment, employee productivity, and supervision in the
Nigerian public sector. American Journal of Management, 15(2), pp.9-23.
Ozguner, Z., & Ozguner, M. (2014). A managerial point of view on the relationship between
of Maslow’s hierarchy of needs and Herzberg’s dual factor theory. International Journal of
Business and Social Science, 5(7), pp. 207-215.
Padhy, P.K., & Bhuyan, J. (2015). Determinant of job satisfaction in public and private
sector: An empirical study. International Journal of Engineering Technology, Management
and Applied Sciences, 3(1), pp.70-81.
Pakistan Bureau of Statistics, (2015). Compendium on environment statistics of Pakistan.
[Online] Available at:
http://www.pbs.gov.pk/sites/default/files//crops_and_climates/compendium_environment/co
mpendium_environment_2015.pdf [Accessed 13 January, 2017].
Pakistan Economic Survey, (2014-15). Ministry of Finance. [Online] Available at:
http://www.finance.gov.pk/survey_1415.htm [Accessed 08 September 2015].
Pallant, J. (2001), SPSS Survival Manual 2001. 2nd ed. Chicago, Illinois USA: SPSS Inc.
S.Wacker Drive.
Pallant, J. (2005), SPSS Survival Manual.2nd ed. Chicago, Illinois USA: SPSS Inc. S.Wacker
Drive, pp1-142.
Pallant, J. (2007), SPSS Survival Manual. 6th ed. Chicago, Illinois USA: SPSS Inc. S.Wacker
Drive.
Pandey, C. & Khare, R. (2012). Impact of job satisfaction and organizational. International
Journal of Social Science & Interdisciplinary Research, 1(8), pp.26–41.
Park, J. S., & Kim, T. H. (2009). Do types of organizational culture matter in nurse job
satisfaction and turnover intention? Leadership in Health Services, 22(1), pp.20-38.
Park, S., Henkin, A. B., & Egley, R. (2005). Teacher team commitment, teamwork, and trust:
exploring associations, Journal of Educational Administration, 43(5), pp.462-79.
231
Parvin, M. M., & Kabir, M. M. N. (2011). Factors Affecting Employee Job Satisfaction of
Pharmaceutical Sector. Australian Journal of Business and Management Research,1(9),
pp.113-123.
Porter, L. W., & Lawler, E. E. (1968). Managerial Attitudes and Performance. Homewood,
IL: Dorsey Press and Richard D.Irwin.
Pragya, S., & Sandeep, M. (2015). Job satisfaction : A comparative study of private and
public sector banks. Advances in Management, 8(4), pp.12–16.
Rahman, Khalil-Ur., Akhter, W., & Khan, S, U. (2017). Factors affecting employee job
satisfaction: A comparative study of conventional and Islamic insurance. Cogent Business
and Management, 4(1), pp. 1-15.
Rainey, H. G. (2009). Understanding and managing public organisations. 4th ed. San
Francisco, CA: Jossey-Brass.
Rainey, H. G., & Bozeman, B. (2000). Comparing Public and Private Organizations:
Empirical Research and the Power of the A Priori. Journal of Public Administration Research
and Theory, 10(2), pp.447-469.
RANDOM.ORG, (2016). [Online] Available at: https://www.random.org/ [Accessed 11
January 2016].
Rast, S., & Tourani, A. (2012). Evaluation of employees ’ job satisfaction and role of gender
difference : An empirical study at airline industry in Iran. International journal of Business
and Social Science, 3(7), pp.91–100.
Ravichandran, A., Rajan, L. J. S.,& Kumar, B. S. (2015). A study on job satisfaction of
employees of manufacturing industry in Puducherry, India. International Journal of
Innovative Research & Development, 4(2), pp.334-349.
Raza, M. Y., Akhtar, M. W., Husnain, M., & Akhtar, M. S. (2015). The impact of intrinsic
motivation on employee’s job satisfaction. Management and Organisational Studies,2(3),
pp.80-88.
Raziqa, A., & Maulabakhsh, R. (2015). Impact of working environment on job satisfaction,
2nd Global conference on business, economics, management and tourism. Czech Republic,
30-31 October 2014. Prague, Czech Republic: Procedia Economics and Finance 23 (2015),
232
pp. 717 – 725.
Rea, L. M., & Parker, R. A. (2014). Designing and conducting survey research: A
comprehensive guide. 4th ed. San Francisco, CA: John Wiley & Sons.
Reichertz, J. (2007). Abduction: The logic of discovery of grounded theory. London. England:
Sage Publications, pp. 214-228.
Reichertz, J. (2009). Abduction: The logic of discovery of grounded theory. Forum
Qualitative Sozialforschung / Forum: Qualitative Social Research.
Reichertz, J. (2014). Induction, deduction, abduction. In: U. Flick, ed. The Sage handbook of
qualitative data analysis. London: Sage Publications, pp.123-135.
Reisel, D. W., Probst, T. M., Chia, S. L., Maloles, C. M., & König, C. J. (2010). The Effects
of job insecurity on job satisfaction, organizational citizenship behaviour, deviant behaviour,
and negative emotions of employees. International Studies of Management and Organization,
40(1), pp.74–91.
Remenyi, D., Williams, B., Money, A. & Swartz, E. (1998). Doing research in business and
management: An introduction to process and method. London: Sage Publications.
Resnik, D. B. (2015). What is ethics in research & why is it important? [Online] National institute of environmental health sciences. Available at: https://www.niehs.nih.gov/research/resources/bioethics/whatis/ [Accessed 25 November 2016].
Rhodes, C. (2015). UK steel industry: Manufacturing: statistics and policy. House of
Commons Library, Briefing Paper 07317. [Online] Available at:
file:///C:/Users/Home/Downloads/CBP-7317.pdf [Accessed 17 January 2017].
Robbins, S. P., & Sanghi, S. (2006). Organizational behavior. 11th ed. India: Dorling
Kindersley.
Robbins, S. P. (1998). Organisational behaviour: Concepts, controversies, applications. 8th
ed. New Jersey: Prentice Hall.
Rossberg, J. I., Eiring, O., & Friis, S. (2004) Working environment and job satisfaction: a
psychometric evaluation of the working environment scale 10. Social Psychiatry and
Psychiatric Epidemiology, 39(7), pp.576–580.

233
Rousseau, D. M. (1977). Technological differences in job characteristics, employee
satisfaction and motivation: A synthesis of job design research and socio-technical systems
theory. Organisational Behaviour and Human Performance, 19(1), pp.18 – 42.
Rukh, L., Choudhary, M. A., & Abbasi, S. A. (2015). Analysis of factors affecting employee
satisfaction: A case study from Pakistan, IOS Press, 52(1), pp. 137-152.
Russell, B. (2001). The problems of philosophy. Oxford: Oxford University Press.
Rynes, S. L., Gerhart, B., & Minette, K. A. (2004). The importance of pay in employee
motivation: Discrepancies between what people say and what they do. Human Resource
Management, 43(4), pp.381–394.
Sabarirajan, A., Meharajan, T., & Arun, B. (2010). A study on the various welfare measures
and their impact on QWL provided by the textile mills with reference to Salem District,
Tamil Nadu, India. Asian Journal of Management Research, 1(1), pp.15–24.
Saeed, I., Waseem, M., Sikander, S., & Rizwan, M. (2014). The relationship of turnover
intention with job satisfaction, job performance, leader member exchange, emotional
intelligence and organizational commitment. International Journal of Learning &
Development, 4(2), pp. 242-256.
Saeed, K., & Farooqi, Y. A. (2013). Examining the relationship between work life balance,
job stress and job satisfaction among university teachers. International Journal of
Multidisciplinary Sciences and Engineering, 5(6), pp.9-16.
Sarker, M. S. I., & Khan, M. R. A. (2013). Classical and neoclassical approaches of
management: An overview. IOSR Journal of Business and Management, 14(6), pp.1-5.
Saunders, M., Lewis, P., & Thornhill, A. (2007). Research methods for business students.4th
ed. Prentice Hall: London, pp. 2-450.
Saunders, M., Lewis, P., & Thornhill, A. (2009). Research methods for business students. 5th
ed. Harlow, England: Pearson Education Limited, pp.2-466.
Saunders, M., Lewis, P., & Thornill, A. (2012). Research methods for business students. 6th
ed. Harlow, England: Pearson Education Limited.
Scarpello, V., & Campbell, J. P. (1983). Job satisfaction: Are all the parts there? Personnel

234
Psychology, 36(3), pp.577-600.
Scheid, K. (2010). Job Satisfaction: What is it? Why is it important? How can you get it?,
pp.1–6. [Online] Available at: http://docplayer.net/37637499-Job-satisfaction-what-is-it-why-
is-it-important-how-can-you-get-it-by-kevin-scheid.html [Accessed 02 June 2015].
Schlomer, G.L. (2010). Best practices for missing data management in counseling
psychology, Journal of Counseling Psychology, 57(1), pp.1-10.
Schumacker, R. E., & Lomax, R. G. (1996). A beginner’s guide to structural equation
modelling. New Jersey: Lawrence Erlbaum Associates, Publishers.
Sekaran, U. (2005). Research methods for business: A skill-building approach. 4th ed. New
York: John Wiley & Sons.
Sekaran, U., & Bougie, R. (2010). Research methods for business: A skill building approach.
5th ed. Chichester: John Willey & Sons Ltd.
Seleena, R. and Gnanadhas, E. (2013). Job satisfaction. Saarbrucken: LAP LAMBERT
Academic Publishing.
Sell, L., & Cleal, B. (2011). Job satisfaction, work environment, and rewards: Motivational
theory revisited. Labour, 25(1), pp.1-23.
Shah, A. (2011). Manufacturing and Mining. In Pakistan Economic Survey 2010-2011.
Government of Pakistan: Ministry of Finance, pp.35-46. [Online] Available at:
http://www.finance.gov.pk/survey/chapter_11/03-Manufacturing%20and%20Mining.pdf
[Accessed 16 February 2017].
Shaikh, M. A., Bhutto, N. A., & Maitlo, Q. (2012). Facets of Job Satisfaction and its
association with Performance. International Journal of Business and Social Science, 3(7),
pp.322-326.
Singh, R. N. (1983). Management thought and thinkers, New Delhi: Sultan Chand & Sons.
Siu, O. (2002). Occupational stressors and well-being among Chinese employees: The role of
organisational commitment. Applied Psychology: An International Review, 51(4),
pp.527−544.
SleepeingAway, (2005). Guide to Pakistan. [Online] Available at:

235
http://www.sleepingaway.com/World/Asia/Pakistan/Lahore/guide.html [Accessed 01
November 2016].
Smith, J. L., Sturrock, H. J. W., Olives C., Solomon A. W., & Brooker, S.J. (2013).
Comparing the performance of cluster random sampling and integrated threshold mapping for
targeting trachoma control, using computer simulation. PLOS Neglected Tropical Diseases,
7(8), pp. 1-10. [Online] Available at:
http://journals.plos.org/plosntds/article/file?id=10.1371/journal.pntd.0002389&type=printable
[Accessed 21 February 2017].
Smith, P. C., Kendall, L. M., & Hulin, C. L. (1969). The measurement of satisfaction in work
and retirement. Chicago: Rand McNally.
Snijders, T. A. B., & Bosker, R. J. (1999). Multilevel analysis: An introduction to basic and
advanced multilevel modelling. London: Sage Publications.
Soiferman, L. K. (2010). Compare and contrast inductive and deductive research
approaches, pp.1-23. [Online] Available at: http://files.eric.ed.gov/fulltext/ED542066.pdf
[Accessed 10 November 2014].
Sousa-Poza, A., & Sousa-Poza A. A. (2000). Well-being at work: A cross-national analysis of
the levels and determinants of job satisfaction. Journal of Socio-Economics, 29(6), pp.517-
538.
Spector, P. E. (2000). Organisational Psychology: Research and practice, New York: John
Wiley & Sons.
Steger, M. F., Dik, B. J., & Duffy, R. D. (2012). Measuring meaningful work: The work and
meaning inventory (WAMI). Journal of Career Assessment, 20(3), pp.1-16.
Stello, C. M. (2011). Herzberg’s two-factor theory of job satisfaction: An integrative
literature review. Unpublished.
Stevens, J. (1996). Applied multivariate statistics for the social sciences. 3rd ed. Mahwah,
New Jersey: Lawrence Erlbaum Associates, p.72.
Steyn, G. M. (2002). A Theoretical analysis of educator motivation and morale. Educare,
31(1 & 2), pp. 82-101.

236
Suhr, D. D. (2006). Exploratory or confirmatory factor analysis? In proceedings of the thirty-
first Annual SAS Users Group International Conference. Cary: SAS Institute. pp. 1-17.
Tabachnick, B. G., & Fidell, L. S. (2001). Using multivariate statistics. 4th ed. Needham
Heights, MA: Allyn & Bacon, pp.1-200.
Tabachnick, B. G., & Fidell, L. S. (2007). Using multivariate statistics. 5th ed. Boston, Mass:
Pearson.
Tabachnick, B. G., & Fidell, L. S. (2013). Using multivariate statistics. 6th ed. Upper Saddle
River, New Jersey: Pearson.
Tai, F. M., & Chuang, P. Y. (2014). Job satisfaction of university staff. The Journal of
Human Resource and Adult Learning, 10(1), pp.51–64.
Tanjeen, E. (2013). A study on factors affecting job satisfaction of telecommunication
industries in Bangladesh. Journal of Business and Management, 8(6), pp.80-86.
Tavakol, M., & Dennick, R. (2011). Making sense of Cronbach’s alpha. International Journal
of Medical Education, 2, pp. 53-55.
Taylor, F. W. (1911). The principles of scientific management. New York: Harper.
Tella, A., Ayeni, C. O., & Popoola, S. O. (2007). Work motivation, job satisfaction and
organizational commitment of library personnel in academic and research libraries in Oyo
State, Nigeria. Library Philosophy and Practice, pp.1-16. [Online] Available at:
http://digitalcommons.unl.edu/cgi/viewcontent.cgi?article=1118&context=libphilprac
[Accessed 19 July 2016].
Tett, R. P., & Meyer, J. P. (1993). Job satisfaction, organizational commitment, turnover
intention, and turnover: Path analyses based on meta-analytic findings. Personnel
Psychology, 46(2), pp. 259-293.
Thompson, W. L. (Ed.). (2004). Sampling rare or elusive species: Concepts, designs, and
techniques for estimating population parameters. Washington DC: Island Press.
Ting, Y. (1997). Determinants of job satisfaction of federal government employees. Public
Personnel Management, 26(3), pp. 313-334.
Trochim, W. M. K. (2006). Research methods knowledge base. [Online] Available at:
237
http://www.socialresearchmethods.net [Accessed 15 November 2014].
Turkyilmaz, A. A., Akman, G., Ozkan, C., & Pastuszak, Z. (2011), Empirical study of public
sector employee loyalty and satisfaction. Industrial Management and Data Systems,111(5),
pp. 675-696.
Uddin, Md. J., Kabir, Md. Z, Rahman, Md. Mostafizur,, Akhter, R. (2016). Factors affecting
overall job satisfaction of mobile telecom employees in Bangladesh. International Journal of
Innovation and Scientific Research, 21(1), pp. 1-10.
Uprichard, E., (2013). Sampling: bridging probability and non-probability
designs. International Journal of Social Research Methodology, 16(1), pp.1-11.
US Library of Congress, (2010). Linguistics and ethnic groups. [Online] Available at:
http://countrystudies.us/pakistan/31.htm [Accessed 10 August 2015].
USC Libraries, (2014). Research guides. [Online] Available at:
http://libguides.usc.edu/writingguide/researchdesigns [Accessed 07 January 2014].
Verschuren, P., & Doorewaard, H. (1999). Designing a research project. Utrecht: Lemma.
Volkwein, J. F., & Zhou, Y. (2003). Testing a model of administrative job
satisfaction. Research in Higher Education, 44(2), pp.149-171.
Wanous, J. P., Reichers, A. E., & Hudy, M. J. (1997). Overall job satisfaction: How good are
single-item measures? Jounal of Applied Psychology, 82(2), pp.247-252.
Waqas, A., Bashir, U., Sattar, M. F., Abdullah, H. M., Hussain, I., Anjum, W., Ali, M. A., &
Arshad, R. (2014). Factors influencing job satisfaction and its impact on job loyalty.
International Journal of Learning & Development, 4(2), pp.141–161.
Weaver, K., & Olson, J. K. (2006). Understanding paradigms used for nursing research.
Journal of Advanced Nursing, 53(4), pp.459-469.
Weber, M. (1947). The theory of social and economic organization. New York: Oxford
University Press.
Weiss, D. J., Dawis, R. V., England, G. W., & Lofquist, L. H. (1967). Manual of the
Minnesota Satisfaction Questionnaire. Minneapolis: The University of Minnesota Press.

238
West, J.P., & Berman E.M. (2009). Job satisfaction of public managers in special districts.
Review of Public Personnel Administration,29(4), pp. 327-353.
Yang, X., & Wang, W. (2013). Exploring the determinants of job satisfaction of civil servants
in Beijing, China. Public Personnel Management, 42(4), pp. 566-587.
Yasir, K., & Fawad, H. (2009). Pay and Job Satisfaction: A comparative analysis of different
Pakistani commercial banks. Munich personal RePEc Archive, 16059, pp. 1-20. [Online]
Available at: https://mpra.ub.uni-muenchen.de/16059/1/MPRA_paper_16059.pdf [Accessed
22 September 2015].
Yasuharu, T., Keiko, H., Makiko, O., Seiji, B., Harou, Y., & Shunzo, K. (2009). The
Interrelationships between working conditions, job satisfaction, burnout and mental health
among hospital physicians in Japan: A path analysis. Industrial Health, 47(2), pp. 166-172.
Yew, L. T. (2008). Job satisfaction and affective commitment: a study of employees in the
tourism industry in Sarawak, Malaysia. World Review of Entrepreneurship, Management and
Sustainable Development, 4(1), pp.85 - 101.
Yin, R. K. (2009). Case study research: Design and methods. 4th ed. London: Sage
Publications.
Young, L., Milner, M., Edmunds, D., Pentsil, G., & Broman, M. (2014). The tenuous
relationship between salary and satisfaction. Journal of Behavioral Studies in Business, 7(9),
pp.1–9.
Yuzuk, R. P. (1961). The assessment of employee morale: A comparison of two measures.
Columbus, OH: Ohio State University.

239
Appendix A: (Covering Letter and Survey Questionnaire)
Dear Respondents,
I am a PhD student at London School of Commerce in the United Kingdom. I wish to collect
data from you and the topic of my research on the topic “Job Satisfaction of Public and
Private Sectors of Manufacturing Industry in Lahore, Pakistan”. The questionnaire that you
will need to fill in will require 20 minutes of your time. I assure that this information will be
used for the academic purpose only by keeping the collected information confidential which
means that the researcher will not use your names or ID numbers.
The questionnaires are divided into two parts. In part (I) you are required to provide the
answers from the given options and in part (II) you will tick the relevant answers to the best
of you knowledge.
PART (I)
1. Age: .............................. a. <25 Years b. 25-34 Years c. 35-44 Years d. 45+ Years
2. Gender: ........................ a. Male b. Female
3. Experience: .................. a. 1-5 Years b. 6-10 Years c. 11-15 Years d. 16+ Years
4. Education: .................... a. Matric b. Intermediate c. Bachelors d. Masters
5. Sector: ......................... a. Public b. Private
6. Position: ...................... a. Manager b. Non-manager
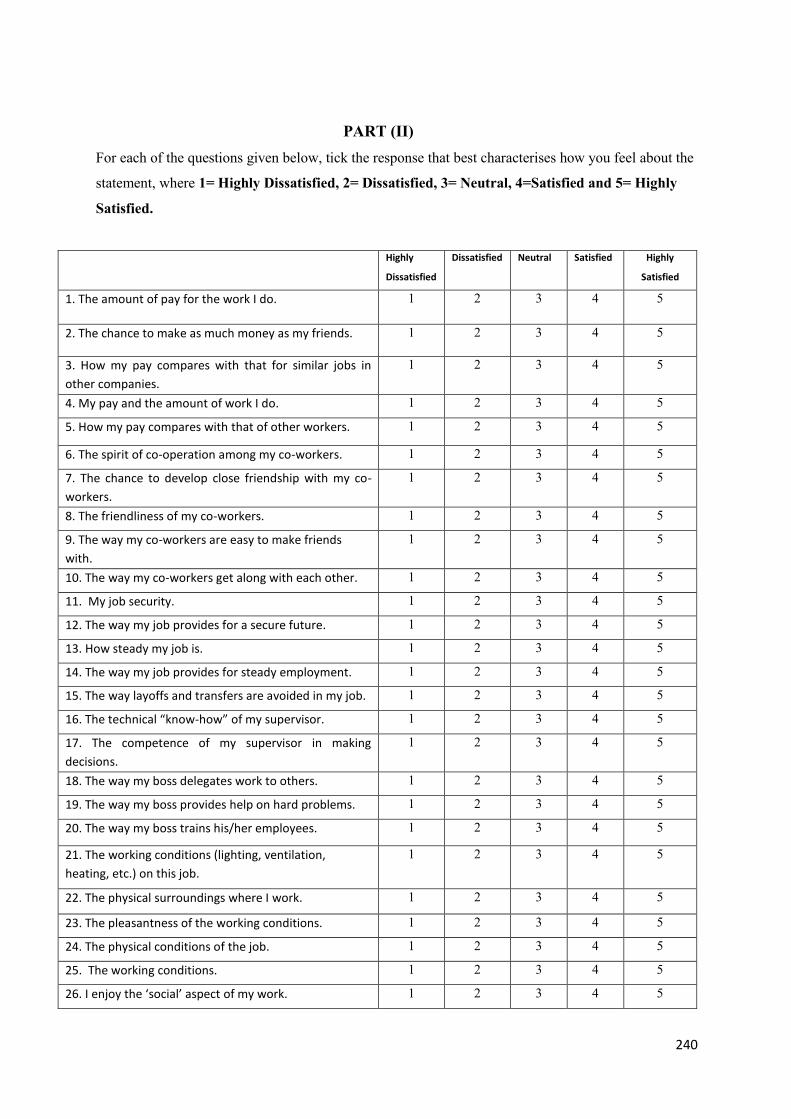
240
PART (II) For each of the questions given below, tick the response that best characterises how you feel about the
statement, where 1= Highly Dissatisfied, 2= Dissatisfied, 3= Neutral, 4=Satisfied and 5= Highly
Satisfied.
Highly
Dissatisfied
Dissatisfied Neutral Satisfied Highly
Satisfied
1. The amount of pay for the work I do. 1 2 3 4 5
2. The chance to make as much money as my friends. 1 2 3 4 5
3. How my pay compares with that for similar jobs in
other companies.
1 2 3 4 5
4. My pay and the amount of work I do. 1 2 3 4 5
5. How my pay compares with that of other workers. 4. The chance to do something different every day. 1 2 3 4 5
6. The spirit of co-operation among my co-workers. 1 2 3 4 5
7. The chance to develop close friendship with my co-
workers.
1 2 3 4 5
8. The friendliness of my co-workers. 1 2 3 4 5
9. The way my co-workers are easy to make friends
with.
1 2 3 4 5
10. The way my co-workers get along with each other. 1 2 3 4 5
11. My job security. 1 2 3 4 5
12. The way my job provides for a secure future. 1 2 3 4 5
13. How steady my job is. 1 2 3 4 5
14. The way my job provides for steady employment. 1 2 3 4 5
15. The way layoffs and transfers are avoided in my job. 1 2 3 4 5
16. The technical “know-how” of my supervisor. 1 2 3 4 5
17. The competence of my supervisor in making
decisions.
1 2 3 4 5
18. The way my boss delegates work to others. 1 2 3 4 5
19. The way my boss provides help on hard problems. 1 2 3 4 5
20. The way my boss trains his/her employees. 1 2 3 4 5
21. The working conditions (lighting, ventilation,
heating, etc.) on this job.
1 2 3 4 5
22. The physical surroundings where I work. 1 2 3 4 5
23. The pleasantness of the working conditions. 1 2 3 4 5
24. The physical conditions of the job. 1 2 3 4 5
25. The working conditions. 1 2 3 4 5
26. I enjoy the ‘social’ aspect of my work. 1 2 3 4 5

241
27. I am satisfied with my surrounding environment. 1 2 3 4 5
28. I enjoy interacting with my colleague. 1 2 3 4 5
29. Your job has great impact on the people outside the
organisation.
1 2 3 4 5
30. The results of your work are likely to affect the lives
of other people.
1 2 3 4 5
31. Your job is very important and significant in the
broader scheme of things.
1 2 3 4 5
32. The opportunity to do different things from time to
time variety in my work.
1 2 3 4 5
33. The variety in my work. 1 2 3 4 5
34. The routine in my work. 1 2 3 4 5
35. The chance to do something different every day. 1 2 3 4 5
36. The chance to do many things on the job. 1 2 3 4 5
37. I have a good sense of what makes my job
meaningful.
1 2 3 4 5
38. I have discovered work that has a satisfying purpose. 1 2 3 4 5
39. Being able to see the results of the work I do. 1 2 3 4 5
40. Being able to take pride in a job done. 1 2 3 4 5
41. Being able to do something worthwhile. 1 2 3 4 5
42. The way I am noticed when I do a good job. 1 2 3 4 5
43. The way I get full credit for the work I do. 1 2 3 4 5
44. The recognition I get for the work I do. 1 2 3 4 5
45. The chance to be responsible for planning my work. 1 2 3 4 5
46. The chance to make decisions on my work. 1 2 3 4 5
47. Overall, I am pleased with my work. 1 2 3 4 5
48. My job in this organisation has met my expectations. 1 2 3 4 5
49. Overall, I am satisfied in my current practice. 1 2 3 4 5
50. My current work situation is not a major source of
frustration in my life.
1 2 3 4 5
51. In general, I like my job. 1 2 3 4 5
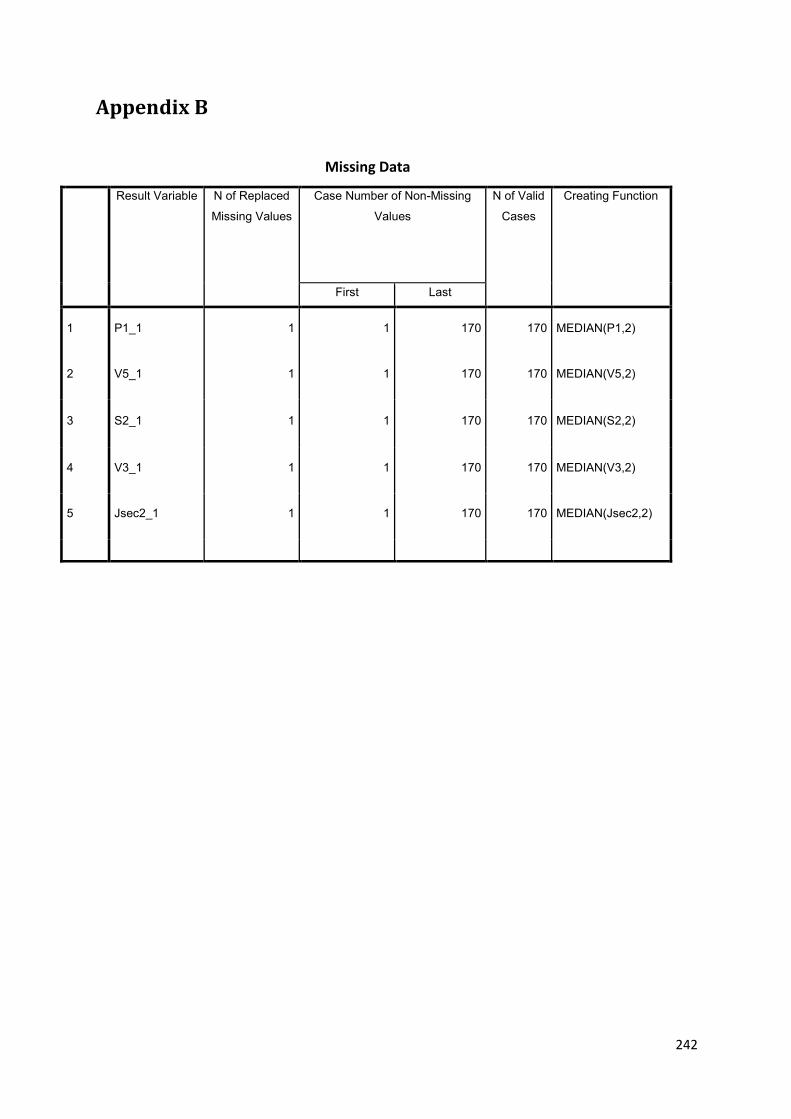
242
Appendix B
Missing Data
Result Variable N of Replaced
Missing Values
Case Number of Non-Missing
Values
N of Valid
Cases
Creating Function
First Last
1 P1_1 1 1 170 170 MEDIAN(P1,2)
2 V5_1 1 1 170 170 MEDIAN(V5,2)
3 S2_1 1 1 170 170 MEDIAN(S2,2)
4 V3_1 1 1 170 170 MEDIAN(V3,2)
5 Jsec2_1 1 1 170 170 MEDIAN(Jsec2,2)
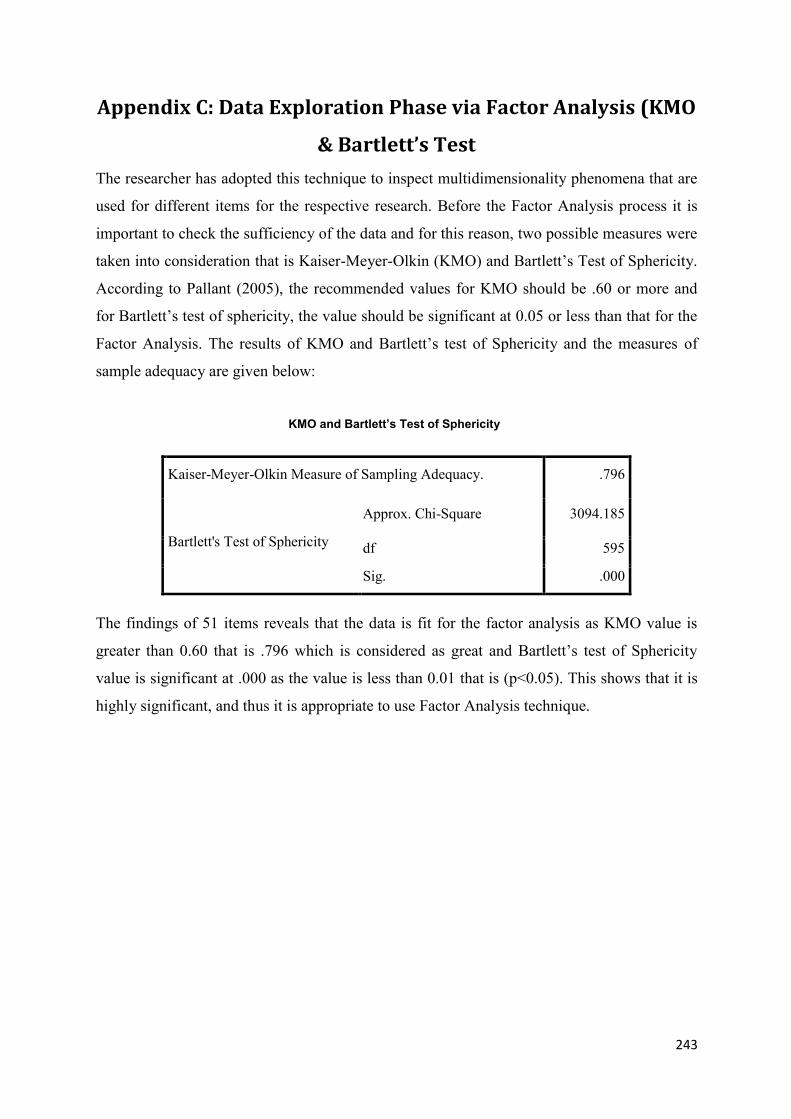
243
Appendix C: Data Exploration Phase via Factor Analysis (KMO
& Bartlett’s Test
The researcher has adopted this technique to inspect multidimensionality phenomena that are
used for different items for the respective research. Before the Factor Analysis process it is
important to check the sufficiency of the data and for this reason, two possible measures were
taken into consideration that is Kaiser-Meyer-Olkin (KMO) and Bartlett’s Test of Sphericity.
According to Pallant (2005), the recommended values for KMO should be .60 or more and
for Bartlett’s test of sphericity, the value should be significant at 0.05 or less than that for the
Factor Analysis. The results of KMO and Bartlett’s test of Sphericity and the measures of
sample adequacy are given below:
KMO and Bartlett’s Test of Sphericity
Kaiser-Meyer-Olkin Measure of Sampling Adequacy. .796
Bartlett's Test of Sphericity
Approx. Chi-Square 3094.185
df 595
Sig. .000
The findings of 51 items reveals that the data is fit for the factor analysis as KMO value is
greater than 0.60 that is .796 which is considered as great and Bartlett’s test of Sphericity
value is significant at .000 as the value is less than 0.01 that is (p<0.05). This shows that it is
highly significant, and thus it is appropriate to use Factor Analysis technique.

244
Appendix D: Sampling Frame 1. Crescent Steel 2. Electrical Equipment Manufacturing Ltd
3. M.B Spring 4. Falcon Fans
5. Acrotec 6. Fast Cables Ltd
7. AJC Engineering (Pvt) Ltd 8. Fazal Din’s Pharma Plus
9. NBS Engineering Company 10. GRP Engineers
11. Descon Engineering Ltd 12. Haseeb Waqas Group
13. Bayer HealthCare 14. Hi-Warble Pharmaceuticals (Pvt) Ltd
15. English Pharmaceutical Industries 16. Master Tile & Ceramics Industries Ltd
17. Marketing International Services (Pvt) Ltd 18. Mehmood Enterprises
19. Iqbal Carpet 20. MSOLPK
21. Metro Group 22. Lahore Fans
23. Colgate-Palmolive 24. Pak British Chilled Roller Industries
25. Pak Clay Tiles Industries 26. Rafiq Engineering Industries Ltd
27. Pakistan State Oil 28. Servis Industries Ltd
29. Powerex International (Pvt) Ltd 30. Shabbir Tiles and Ceramics Industries Ltd
31. Siemens Engineering Ltd 32. Synarome Manufacturing Ltd
33. Twig Business Solutions 34. Wilshire Labs Ltd
35. WAK Ltd 36. Zamil Steel
37. Zia Pharmacy 38. Babu Jee Manufacturing Company
39. Dada Chiragh Manufacturing Company 40. Green Wood
41. Akbar Fans 42. HA Rasheed & Sons (Reliance Home Appliances
43. Namra Plastic Industries 44. Rehman Industries
45. Shahid Brothers 46. China Engineering Company
47. ZAB Electrical Industries 48. A.D Sons Enterprises
49. Tuba Fans 50. A-One Electrical Industry
51. A-One Sanitary Fittings 52. Abdullah Electrical Industries
53. Abrar Electrical Industry 54. Adeel Electric Company
55. Advance Pipe industries 56. Ayan Corporation
57. Afzal Electrical Industries 58. Akbar Fans Ittehad Chemicals
59. Ahsan Electrical Industries 60. Bato Carpets
61. Al-Asif Printing and Packages 62. Tata Fans
63. Arooj Garments Accessories Ltd 64. Al-Makka Corporation
65. City Herbal Care Industries 66. Al Meena Marine Engineers
67. Al-Meraj Fans 68. Al-Meraj Fans
69. Citizen Fans & Washing Machines 70. Al-Noor Electric Industries
71. Zahoor Cotton Mills Ltd 72. Azeemi Laboratories
73. Allied Engineering Industry 74. Babson Noller Corporation
75. Almadni Bricks Company 76. Batala Pharmaceutical Company
77. Amin Fans 78. Beco Fans
79. Amreli Steels Industries 80. Bright Star Fans
81. Millat Tractors 82. Captain PQ Chemical Industries
83. Anmol Fans 84. Castpro Engineering
85. Arky International 86. Al-Riaz Fans
87. ASAD Electrical Industry 88. Champion Fans
89. Asiacon (Pvt) Ltd 90. Bata Pakistan
245
91. Awan Electrical Industries 92. Ghani Automobiles Company Ltd
93. Atlantis Chemical Industries 94. Fauji Fertilizers
95. Ansari Sugar Mills Ltd 96. Cleantouch Software Corporation
97. Hafiz Engineering Works 98. Hassan Electric Industries
99. Hameed Electric Industry 100. Haroon Enterprises
101.Hammad Brothers