job evaluation and remuneration benchmarking of the ... report_feb_2001.pdf · job evaluation and...
TRANSCRIPT

STRICTLY CONFIDENTIAL
Job Evaluation and Remuneration Benchmarking of the positions of Principal Officer and Assistant
Principal Officer (standard scales)
Inbucon Ireland Ltd. – International Business
Consultants
Prepared by: Inbucon Ireland Ltd. 63 Fitzwilliam Square Dublin 2
Strictly Confidential Mr. Sean O’Riordain
General Secretary AHCPS
Flemings Hall 12 Flemings Place
Dublin 4

Job Evaluation and Remuneration Benchmarking of the positions of Principal Officer and Assistant
Principal Officer (standard scales) Contents
1. Introduction
2. Inbucon Ireland Ltd. – About Us 2.1 Inbucon Ireland – HR and Remuneration Consultancy Experience
2.2 Inbucon Ireland – Public Sector Experience
2.3 Inbucon Ireland – Private Sector Experience
3. Project Methodology 3.1 Job Profiles
3.2 Job Evaluation Methodology
3.3 Identification of Comparable Positions in the Private Sector
4. Project Results 4.1 Job Content – Comparisons
4.2 Basic Salary – Comparisons
4.3 Non-Salary Remuneration
4.3.1 Pension
4.3.2 Bonus, Share Option, Profit Share
4.3.3 Company Car / Car Allowance
4.3.4 Other Fringe Benefits
5. Conclusions Appendices Appendix Ia Listing of Participating Jobholders in Evaluation Process Appendix Ib Listing of Participating Jobholders in Evaluation Process Appendix II Detailed Description of Inbucon Ireland Pay Points © Appendix III Relevant Pages from the Report on Executive Salaries & Fringe
Benefits in Ireland 2005-2006
1
1. Introduction
The Association of Higher Civil and Public Servants (AHCPS) appointed Inbucon Ireland
in April 2005 to conduct a job evaluation and remuneration analysis for the positions of
Principal Officer and Assistant Principal Officer in the Civil Service.
Inbucon Ireland is well qualified to carry out this work, since we undertook similar
exercises in 1989/90 and, in connection with the first phase of Public Service
Benchmarking, in 2000/01.
The results of this project, reported hereunder, will form a critical input to the
Association’s submission to the second phase of Public Service Benchmarking.
Under the first review of the Public Service Benchmarking Body in 2000/2001, Principal
Officers were awarded an 11.7% increase in basic salary, and Assistant Principal
Officers were awarded 13.8%. This increase has since been applied, together with
increases under the Sustaining Progress national pay agreement.
Inbucon Ireland’s Pay Points System © was used to conduct the job evaluation project
for both positions, and to compare them against equivalent jobs in the private sector.
Inbucon Ireland’s Executive Remuneration Database, used to compile and analyse data
for Inbucon’s Report on Executive Salaries & Fringe Benefits in Ireland, provided all
private sector remuneration information.
This report details how Inbucon undertook the project, and presents the results of the job
evaluation and remuneration benchmarking.

2
2. Inbucon Ireland Ltd. – HR & Remuneration Consultancy Experience
Inbucon Ireland Limited (International Business Consultants) is a leading human
resource consultancy based in Dublin. Originally founded in 1930, Inbucon Ireland has
operated in the Irish market since 1959. As experts in Organisational Development,
Remuneration, Reward Management and Job Evaluation, our methodologies are
recognised in both the public and private sector. Inbucon Ireland has vast knowledge
and experience of survey design. We subject all of our products to rigorous reliability
and validity testing. We are committed to upgrading our existing products and to
providing tailor made survey solutions to meet all our client needs.
Inbucon specialises in helping clients solve problems and improve management
effectiveness across a wide range of HR issues. Inbucon’s Consultancy and Reward
Management Services include:
Consultancy
• Designing and conducting in-company employee attitude surveys using both
quantitative and qualitative methods
• Assisting client companies on a range of organisational review, structuring
and development assignments, from the analysis, through design and
implementation stages
• Developing customised employee performance appraisal schemes with full
staff training and implementation
Reward Management
• Researching and publishing the Inbucon Executive Salary and Fringe Benefit
Survey. Now in its 41st year, the survey, which was last published in October
2004, is established as the most comprehensive of its kind in Ireland.
• Conducting customised surveys on salaries, performance related pay, fringe
benefits for individual companies and industry sectors across Irish industry
• Advising on salary levels and benefits packages and providing comparative
international salary and benefits information
• Auditing reward management systems and procedures and developing
implementation strategies and structures appropriate to meet business needs

3
• Designing and implementing appropriate job evaluation schemes
• Designing performance related pay systems
• Advising on flexible benefits design
Inbucon’s Public Sector Experience
Inbucon has worked with various sections of the Public Sector in the areas of
remuneration policy, job evaluation and performance management.
Inbucon’s Consultancy services in the public sector include:
• Work on behalf of the AHCPS in 1989/90 in the course of an arbitration
hearing on a pay claim, and in 2000/01 in relation to the work of the Public
Service Benchmarking Body.
• Work on behalf of other Trade Unions and Staff Associations for the Public
Service Benchmarking Body in 2000/01 including:
o IMPACT – the Public Sector Trade Union
o Association of Garda Chief Superintendents
o Association of Garda Sergeants & Inspectors
o Irish Dental Surgeons in Ireland
o Representative Association of Commissioned Officers in Ireland
o Permanent Defence Forces Other Ranks Representative
Association
o Irish Federation of University Teachers
• Secretariat to the State Solicitors Association of Ireland
• Association of Chief Fire Officers in Ireland – Pay Increase Submission
to the Labour Court
• The Review Body on Higher Remuneration in the Public Sector
• Remuneration and Job Evaluation Reviews for CEOs and Managing
Directors in semi-state companies
• A series of Remuneration and Job Evaluation Reviews for senior
management, staff and technical grade positions within the ESB

4
Inbucon’s Private Sector Experience
Inbucon has carried out a range of Human Resource Consultancy projects in the private
sector and semi state companies in Ireland. Our clients include companies of all sizes
and we assist them with the development and implementation of effective business and
remuneration solutions, tailored to their specific needs. Current and recent projects
include assignments with:
• Kerry Group
• Allied Signal Ireland Limited
• Modus Media International
• Henkel Ireland / Loctite
• Ulster Bank Ltd.
• Wellman International
• Allied Irish Bank Finance & Leasing
• Electricity Supply Board
• Eircom Phonewatch
• Beckman Coulter
• FBD Insurance
• Bio Medical Research
• EirGrid Plc.
• Stafford Lynch
• Boston Scientific (Ireland)
• Aventis Pharma
• Field Boxmore Healthcare Packaging
• Radio Telefís Éireann • Protim Abrasives Ltd. • Logstrup Ireland Ltd. • Zurich Bank Ireland • Beamish & Crawford plc.
• Lifestyle Sports

5
3. Project Methodology
The project was split into two phases as follows:
• Job Evaluation
• Remuneration Comparison
Both are examined in detail in this section of the report.

6
3.1 Job Profiles – Principal Officer and Assistant Principal Officer A Job Profile Questionnaire (attached at Appendix I) was designed by Inbucon, and,
together with a letter explaining the job evaluation process, distributed to a
representative sample of Principal Officers and Assistant Principal Officers, for
completion and return to Inbucon Ireland.
Twenty-seven Principal Officers and forty-three Assistant Principal Officers completed
and returned job profile forms, and the data returned in these forms was inputted into a
specially designed database for analysis by the consultants. A full listing of those
jobholders can be seen at Appendices I(a) and I(b).
The Job Profile Form examined each grade under the following headings:
• Identification (Name, Grade, Department/Agency, Location)
• Position in Organisation
• Main Purpose of the Job
• Key Long Term Objectives
• Main Duties of the Job
• Dimensions (size indicators – turnover, employee number, budget etc.)
• Knowledge, Skills and Experience
• Complexity & Creativity
• Judgement, Decisions and Recommendations
• Contacts & Communications
• Changes in the Workplace since the last Public Service Benchmarking Body
(e.g. Performance Verification)
• Special Features
The consultants also undertook a number of face-to-face interviews with jobholders who
completed and returned their job profile forms, in order to gain a better understanding of
the jobs in question and validate that our analysis of both grades was relevant and
accurate.

7
3.2 Job Evaluation - Methodology Once the face-to-face interviews were complete and details inputted into the database,
the job profiles were evaluated using the Inbucon Pay Points © Job Evaluation System.
This method was designed for and has been applied to the evaluation of all types of
positions across all functions in the public and private sector.
Briefly stated, “pay points” assesses jobs under five factors or competencies – points are
awarded against each factor, the sum of which then yields the pay points for each job.
The factors used for this evaluation are:
• Factor 1 Knowledge and Experience
• Factor 2 Complexity and Creativity
• Factor 3 Judgements and Decisions
• Factor 4 Influence / Operational Responsibility
• Factor 5 Contacts and Communications
The ranks and level of points received correspond to different total remuneration levels
in the Inbucon Ireland Remuneration Database:
Rank 2 Managing Director 700+
Rank 3 Full time Directors of the Board 550-699
Rank 4 Functional Directors 475-549
Rank 5 Senior Management 375-474
Rank 6 Middle Management 320-374
Rank 7 Lower/Middle Management 275-319
Rank 8 Senior Staff 250-274
Rank 9 Junior Staff 230-249
A more detailed description of the Pay Points System is included at Appendix II.

8
3.3 Identification of Comparators in the Private Sector For this project, the jobholder information gathered during the questionnaire and
interview phase described above was used to assign pay points for Principal Officer and
Assistant Principal Officer under the five factors described above. Results were then
compared to equivalent positions from the Inbucon Executive Remuneration database.
The Civil Services has a total of about 33,000 employees, and is one of the largest
employers in the State. With twenty separate Departments, the average number of
employees per Department is over 1,600. The consultants targeted companies with a
total employee number of over 1,000 as comparative companies to the civil services.
Company size is relevant when benchmarking remuneration packages, in order to
ensure that like is compared with like.

9
4. Project Results ______________________________________________________________________
4.1 Job Content – Comparisons Executive positions covered in the Inbucon Remuneration Database include all white
collar management positions, from Managing Director down, covering all functions.
Inbucon’s ranking system grades each position as described in Section 3 above – Rank
2 is equal to a Managing Director, Rank 3 a Director on the Board, Rank 4 a Functional
Director, Rank 5 a Senior Manager etc.
Inbucon found that the pay points which should be awarded to both Principal Officer and
Assistant Principal Officer, and their relationships to the points for Ranks 4 and 5
respectively, are as follows:
Table 1a – Principal Officer & Rank 4 Pay Points Principal Officer Range 445-562
Rank 4 Range 475-549
Principal Officer Median 525
Rank 4 Median 512
Table 1b – Assistant Principal Officer & Rank 5 Pay Points
Assistant Principal Officer Range 360-503
Rank 5 Range 375-474
Assistant Principal Officer Median 425.3
Rank 5 Median 424.5
Classification of both Ranks 4 and 5, as defined in Inbucon’s annual Report on
Executive Salaries & Fringe Benefits, are as follows:
Rank 4: Head of a major division or function of the organisation. Not a main board
member. Reports to Rank 3 (Director) level, but in some cases can also
report to Rank 2 (Chief Executive) level.
Rank 5: Senior Manager of the organisation. Reports to Rank 3 (Director) level or
Rank 4 (Functional Director) level.

10
The tables above show us that the grades of Principal Officers and Assistant Principal
Officers in the public sector are directly linked with Inbucon Ranks 4 and 5 respectively.
Consequently, pay for both grades should be in line with the remuneration packages
applicable to their private sector counterparts. This will be explored in Section 4.2
below.
4.2 Basic Salary – Comparisons Principal Officer and Assistant Principal Officer salary scales were as follows in
September 2005 (i.e. the same reference date as that for our own 2005 Report on
Executive Salaries & Fringe Benefits in Ireland):
Table 2 – Salary Scales (€)
Principal Officer
Assistant Principal Officer
1. 75,036 1. 57,630 2. 78,216 2. 59,786 3. 81,376 3. 61,942 4. 84,564 4. 64,099 5. 87,247 5. 66,257
6. 67,504
LSI 1 90,032 LSI 1 69,679
LSI 2 94,205 LSI 2 71,859
Average 85,415* Average 66,896* ___________________________________________________________________ *In January 2001, Burham House undertook a large survey of AHCPS members, which revealed that the average salary of Principal Officers was 97.9% of the fifth point on their scale, and the average salary of Assistant Principal Officers 99.1% of the sixth point of theirs. We have used the same percentage relationships in the current instance.

11
Each scale consists of a number of fixed pay points, numbered above as 1-5 for
Principal Officers, 1-6 for Assistant Principal Officers, which are incremented on an
annual basis. Additionally, two long service increments (LSI 1 & 2 above) are awarded
three and six years respectively, after the maximum standard increment has been
attained in each grade.
As already stated, in order to compare like with like, private sector companies with
employee numbers of over 1,000 were used in the comparison.
Statistical data for basic salaries of Rank 4 and Rank 5 jobholders in the private sector
as of September 2005, taken from the Inbucon Report on Executive Salaries & Fringe
Benefits for that date for companies with an employee number greater than 1,000
(relevant pages attached at Appendix III) can be seen in Table 3.
Table 3 – Basic Salary (€), Private Sector Ranks 4 and 5 (+1,000 Employees) UD UQ MD LQ LD AV * Rank 4 165,283 146,265 110,684 97,785 85,010 123,122
Rank 5 114,917 90,343 77,737 65,000 49,206 79,550 * UD = Upper Decile, UQ = Upper Quartile, MD = Median, LQ = Lower Quartile, LD = Lower Decile AV = Average (Arithmetic Mean)
The results from comparing the data in Tables 2 and 3 are set out in Table 4 below.

12
Table 4 – Average Basic Salary (€), PO/APO versus Private Sector comparators ______________________________________________________________________
Principal Officer Salary 85,415
Private Sector Rank 4 (1,000+Employees) 123,122
Rank 4 Differential: € + 37,797
% + 44.2%
Assistant Principal Officer 66,896
Private Sector Rank 4 (1,000+Employees) 79,550
Rank 5 Differential: € + 12,654
% + 18.9%
______________________________________________________________________
As can be seen from the table, average salaries for Private Sector Rank 4 managers are
very considerably (i.e. over 44%) higher than those of Principal Officers, and salaries for
Rank 5 managers considerable (almost 19%) greater than those of Assistant Principal
Officers.
4.3 Non-Salary Remuneration - Comparisons In addition to basic salary, Rank 4 and 5 jobholders in the private sector receive a
number of extra incentives and benefits that may not be present in the public sector.
These are examined below.
4.3.1 Bonus and Profit Share Performance-related pay is not available to Principal Officers or Assistant Principal
Officers. However, in the private sector, bonuses (including profit shares) form a large
part of the overall package, being normally measured against a series of targets, from
individual through to company-wide objectives.
Table 5 below examines the total remuneration (Basic Salary plus Bonus) for those
Rank 4 and Rank 5 jobholders in companies with over 1,000 employees.
13
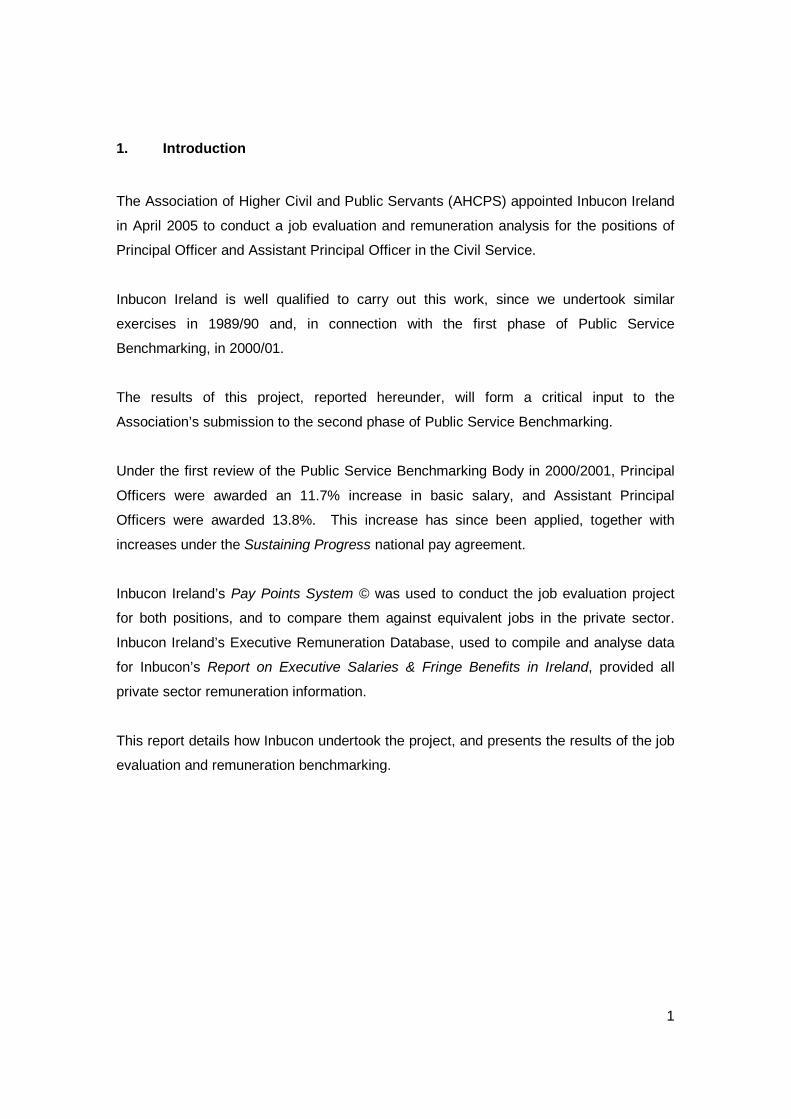
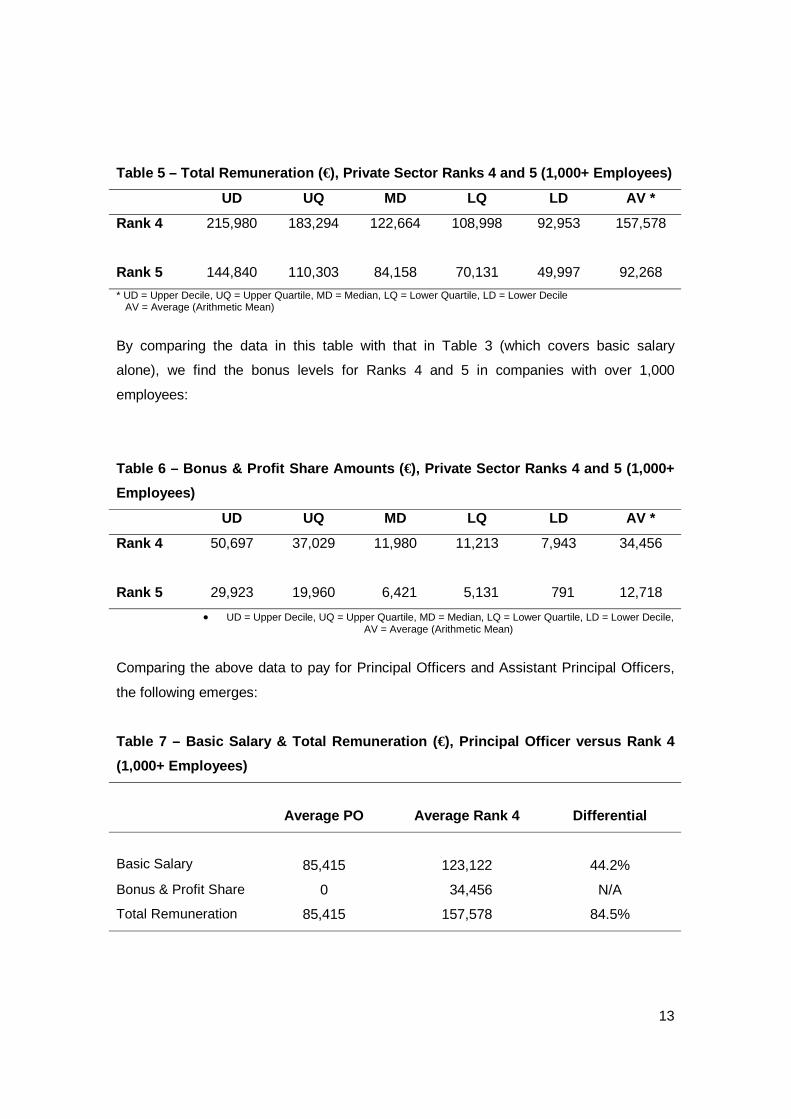
Table 5 – Total Remuneration (€), Private Sector Ranks 4 and 5 (1,000+ Employees) UD UQ MD LQ LD AV * Rank 4 215,980 183,294 122,664 108,998 92,953 157,578
Rank 5 144,840 110,303 84,158 70,131 49,997 92,268 * UD = Upper Decile, UQ = Upper Quartile, MD = Median, LQ = Lower Quartile, LD = Lower Decile AV = Average (Arithmetic Mean)
By comparing the data in this table with that in Table 3 (which covers basic salary
alone), we find the bonus levels for Ranks 4 and 5 in companies with over 1,000
employees:
Table 6 – Bonus & Profit Share Amounts (€), Private Sector Ranks 4 and 5 (1,000+ Employees) UD UQ MD LQ LD AV * Rank 4 50,697 37,029 11,980 11,213 7,943 34,456
Rank 5 29,923 19,960 6,421 5,131 791 12,718 • UD = Upper Decile, UQ = Upper Quartile, MD = Median, LQ = Lower Quartile, LD = Lower Decile,
AV = Average (Arithmetic Mean) Comparing the above data to pay for Principal Officers and Assistant Principal Officers,
the following emerges:
Table 7 – Basic Salary & Total Remuneration (€), Principal Officer versus Rank 4 (1,000+ Employees)
Average PO
Average Rank 4
Differential
Basic Salary
85,415
123,122
44.2% Bonus & Profit Share 0 34,456 N/A Total Remuneration 85,415 157,578 84.5%

14
Table 8 – Basic Salary & Total Remuneration (€), Assistant Principal Officer versus Rank 5 (1,000+ Employees)
Average APO
Average Rank 5
Differential
Basic Salary
66,896
79,550
18.9% Bonus & Profit Share 0 12,718 N/A Total Remuneration 66,896 92,268 37.9%
It will be immediately apparent that the existence of significant levels of performance-
related pay in the private sector, compared with its absence at PO and APO levels in the
Civil Service, dramatically increases the comparative advantage of the former over the
latter.
4.3.2 Share Options In 2005, Share Option schemes had an incidence of 13.3 for Rank 4 jobholders and
6.5% for Rank 5 jobholders. Such options are not, of course, available to those who are
employed in the Civil Service.
4.3.3 Company Car / Car Allowance Principal Officers and Assistant Principal Officers are not entitled to a company car or
car allowance as a fringe benefit. They do, of course, receive mileage allowance at
standard civil service rates, as do 25.4% of Rank 4 jobholders, and 26.5% of Rank 5
jobholders, in the private sector.
More importantly, however, in the private sector the following benefits, separate from
that of mileage allowance, are still applicable:

15
Table 9 – Company Car & Car Allowances, Ranks 4 and 5 Incidence of
Company Car Incidence of Car
Allowance Combined Incidence
Rank 4 41.0% 24.1% 65.1% Rank 5 42.4% 13.3% 55.7%
The combined incidence of these two types of scheme is important, since it is almost
invariable the case that Car Allowances are fixed at levels which approximately equate
to the Revenue benefit-in-kind figure of a Company Car, which might otherwise have
been provided.
Cross-referencing the average salaries paid to both Rank 4 and Rank 5 jobholders in the
private sector to the date contained in Table 38 of our 2005 Report, we calculate the
average value of a company car to be €51,717 for Rank 4 jobholders, and €32,411 for
Rank 5 jobholders.
The benefit-in-kind on a car, made available by an employer for an employee’s private
use, is 30% of the original market value of the car, where the employer also pays for all
the normal running costs (petrol, insurance, tax, services). This implies a BIK figure of
€15,515 for Rank 4 jobholders, and €9,723 for Rank 5 jobholders. Adjusting for the
combined incidence figures in Table 9 above, provision of a company car or car
allowance can thus be calculated to add circa €10,100 and €5,415 to the average basic
salary of Ranks 4 and 5 respectively.
This enhances still further the remuneration advantages of Rank 4 and 5 managers in
the private sector compared with their PO and APO comparators in the Civil Service.

16
4.3.4 Pension Public Sector Pension Schemes The current civil service pension and lump sum on retirement are subject to a minimum
of 2 year’s service, and both pension and lump sum are payable for each year of
service.
The defined benefit pension scheme is calculated on 1/80th of gross pensionable
remuneration for each year, subject to a maximum of 40/80ths (1/2 salary). The lump
sum is calculated on 3/80ths of gross pensionable remuneration for each year of service
subject to a maximum of 120/80ths. The lump sum payment is tax-free.
For example, an Assistant Principal Officer on a salary (including LSI 2) of €71,859
retires from the Civil Service at age 65 after 40 years service receives:
Pension = €71,859 * 1/80th * 40 = € 35,929
Lump Sum = €71,859 * 3/80ths * 40 €107,788
A spouses pension is 50% of the pension entitlement in the event of death after
retirement, and there is also a life cover scheme in place which covers 1.5 times current
salary in the event of death in service.
Pensions are also linked to public sector salary increases after retirement.
Private Sector Pension Schemes In the private sector in 2005, Inbucon found there is almost a forty-sixty split between
defined benefit and defined contribution pensions offered by organisations.
The vast majority of defined benefit schemes are based on final salary of the employee
in question, and calculated on 1/60th of gross pensionable salary per annum. The most
common maximum sum set for pensionable pay is 66% of final salary – however, there
is no lump sum payable to the employee on retirement.

17
For example, a Rank 5 manager in the private sector on a salary of €71,859 retires from
his organisation at age 65 after 40 years service receives:
Pension = €71,859 * 1/60th * 40 = €47,906
This figure of €47,906 is €11,977 (or 33.3%) higher than the maximum Assistant
Principal Officer pension of €35.929 calculated on the previous page. The difference of
€11,977 is, moreover, equivalent to 16.7% of the LSI 2 salary of €71,859 for assistant
Principal Officers. This implies that an APO could be contributing 16.7% of his/her
maximum salary towards pension costs – a remarkable high contribution rate – simply to
attain the equivalent pension of a Rank 5 private sector manager.
A spouses pension in case of death after retirement is 59.5% the jobholders pension,
compared with 50% in the case of Assistant Principals and Principal Officers.
The incidence of life coverage in the private sector for Ranks 4 and 5 is 85.05% of all
jobholders, and the average multiple of basic salary paid is 3.85. This is very much
higher than the 1.5 multiple applicable within the Civil Service.
After retirement, defined benefit pensions are normally indexed automatically by 5% or
more in 36.84% of companies, by the Consumer Price Index in 31.58 of companies, and
on a discretionary basis in 26.32 of companies.
However, there is now a trend for more private sector companies (53% of companies in
2004; 61% in 2005) to offer defined contribution pensions to their employees, whereby
both employee and employer contribute to a pension fund. This seems to be the case in
particular for new employees in private sector organisations, where they will start on a
defined contribution scheme despite the fact that a defined benefit scheme is already in
place for existing employees. It seems that private sector companies no longer wish to
pay the cost associated with defined benefit schemes as their own liabilities grow with
burgeoning wage increases, and now prefer their employees to bear some risk load in
this regard.

18
For defined contribution pension schemes in the private sector, employee’s contributions
range up to 7.5% of basic salary in the majority (86.5%) of companies, and employer’s
annual contributions range from 5%-7.5% of basic salary (36% of companies) to over
7.5% (52% of companies). Participants in defined contribution schemes are entitled to
all investment returns (although they do bear a certain investment risk at the same time).
Twenty-five per cent of the pension fund is payable tax-free on retirement, and the
remainder can be reinvested in an annuity or annual retirement fund.
In overall terms, therefore, certain aspects of pension schemes operated in the public
sector are generous in comparison to private sector pensions, in particular the lump sum
payable on retirement, the indexation of pensions to public sector salary increases after
retirement, and the fact that the Irish Government is the main pension guarantor. There
is thus a public perception that public sector pension benefits are greater than those on
offer in the private sector.
But it must, in contrast, be appreciated that there are a number of pros associated with
private sector pension schemes. These include the relatively high levels of contribution
by both employer and employee; the flexibility of investment options; the fact that 20.5%
of companies base pension on all emoluments, rather than on basic salary alone; and
the potential for the benefits of defined contribution scheme to exceed those of defined
benefit schemes. To these must be added the fact that total private sector remuneration
is, in any event, very considerable higher for Rank 4 and Rank 5 managers than for POs
and APOs in the Civil Service.
In short, it is difficult to be in any way definitive as to the relative value to employees of
the private sector and Civil Service pension regimes at senior management levels.

19
4.3.5 Other Fringe Benefits Additional benefits are also offered in the private sector as below:
Table 10 – Additional Fringe Benefits, Ranks 4 and 5, Private Sector Incidence of
Medical Insurance Incidence of Subsidised
Meals Rank 4 64.44 33.33 Rank 5 50.00 34.99
Private sector companies tend to pay the majority of the cost of medical insurance for
their employee (normally over 90%). Medical insurance and subsidised meals are not
available to Principal Officers or Assistant Principal Officers.
Other perquisites on offer in the private sector include professional subscriptions, low
interest loans (particularly in the financial sector) and educational assistance.

20
5. Conclusions
Inbucon’s conclusions in relation to the job evaluation carried out for Principal Officers
and Assistant Principal Officers and the remuneration comparisons with analogous
private sector positions arising from that evaluation are as follows:
• The Inbucon Pay Points © System conclusively shows that Principal Officers
and Assistant Principal Officers are directly comparable with Rank 4 and
Rank 5 managers, respectively, in the private sector, in respect of the role
and job content of both grades.
• In view of this link, the basic salaries alone of Principal Officers and
Assistant Principal Officers need to be increased by 44.2% and 18.9%
respectively, to bring them in line with the basic salaries earned by Ranks 4
and 5 in the private sector.
• Moreover, when account is taken of bonus and profit share schemes
present in the private sector, yet absent in the public sector, Principal Officer
and Assistant Principal Officer salaries need to be increased in total by 85.5% and 37.9% respectively.
• Moreover, account must further be taken of the value of additional benefits
(especially company car/car allowance, subsidised medical insurance,
subsidised meals) enjoyed by private sector equivalents to Principal Officers
and Assistant Principal Officers. These indicate that the salary increases
required to match comparable private sector jobs are even higher than the
percentages just mentioned.
• Consideration must, of course be given to the pension entitlements of
Principal Officers and Assistant Principal Officers compared with their private
sector counterparts. But it must be stressed that there is little evidence that
the pensions factor would significantly alter the percentage increases for
Principal Officers and Assistant Principal Officers already indicated.
In short, there is a strong case for the remuneration packages of Assistant Principal
Officers and – more particularly - Principal Officers in the public sector to be increased
substantially to benchmark them against their private sector comparators.
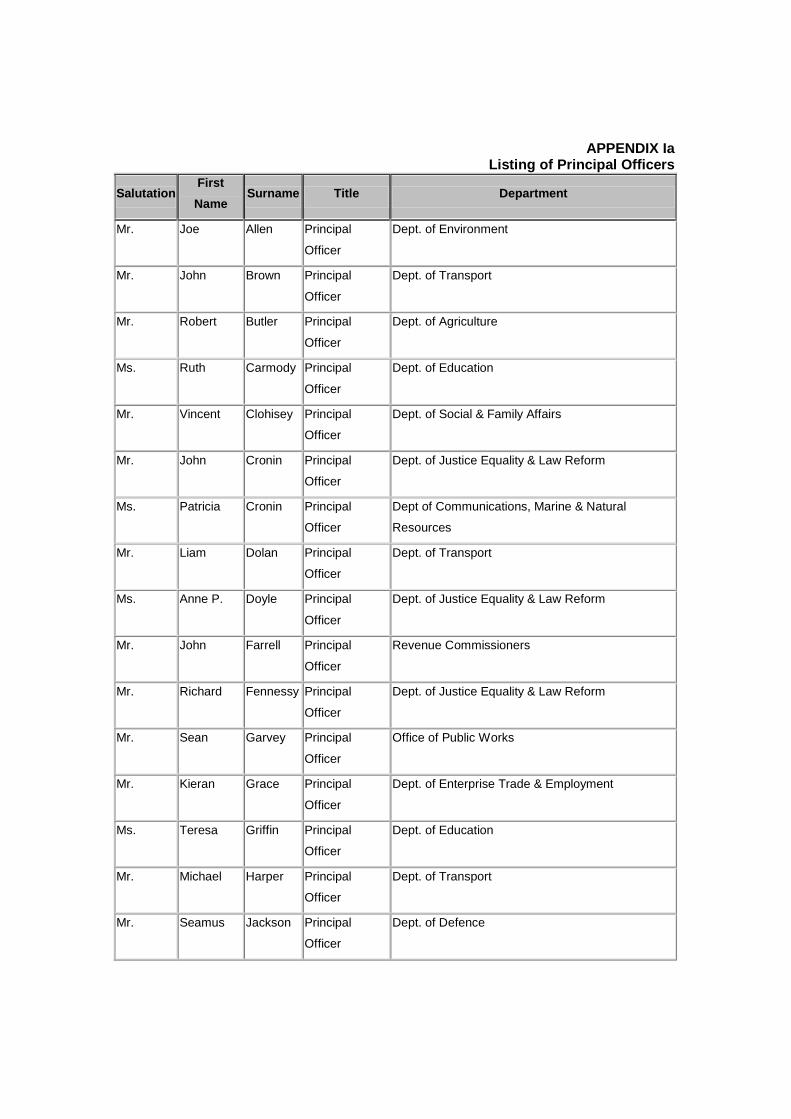
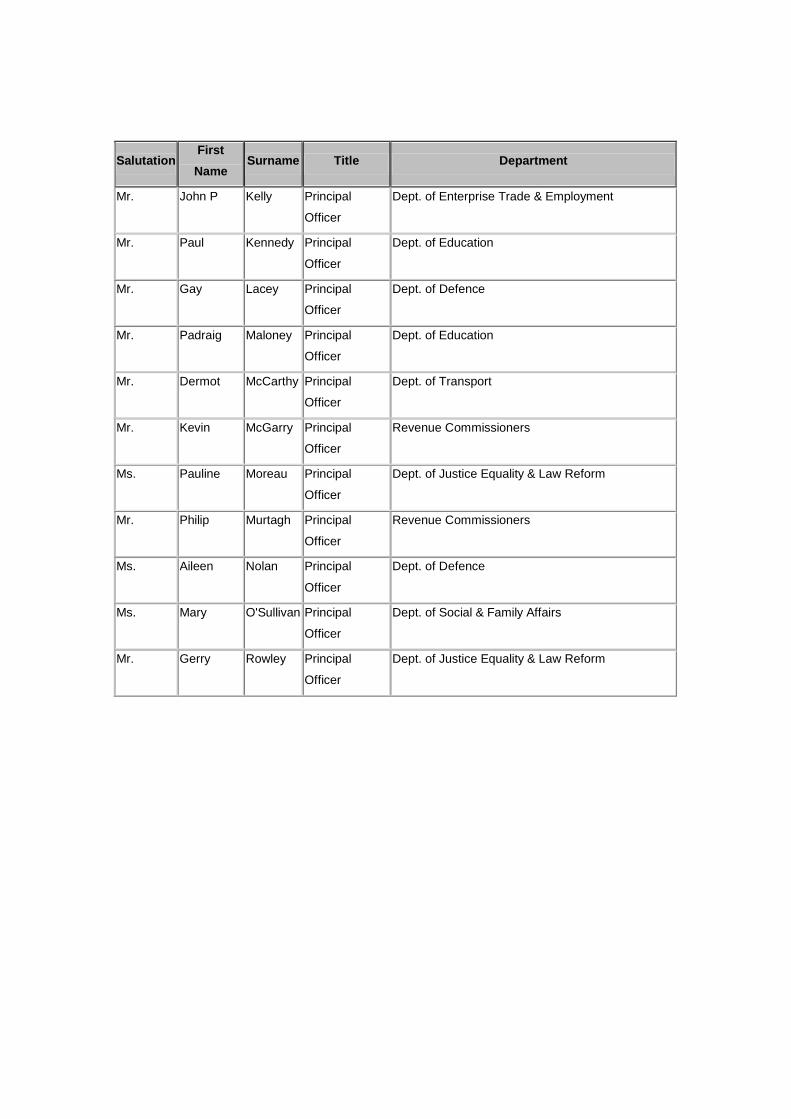
APPENDIX Ia Listing of Principal Officers
Salutation First Name
Surname Title Department
Mr. Joe Allen Principal
Officer
Dept. of Environment
Mr. John Brown Principal
Officer
Dept. of Transport
Mr. Robert Butler Principal
Officer
Dept. of Agriculture
Ms. Ruth Carmody Principal
Officer
Dept. of Education
Mr. Vincent Clohisey Principal
Officer
Dept. of Social & Family Affairs
Mr. John Cronin Principal
Officer
Dept. of Justice Equality & Law Reform
Ms. Patricia Cronin Principal
Officer
Dept of Communications, Marine & Natural
Resources
Mr. Liam Dolan Principal
Officer
Dept. of Transport
Ms. Anne P. Doyle Principal
Officer
Dept. of Justice Equality & Law Reform
Mr. John Farrell Principal
Officer
Revenue Commissioners
Mr. Richard Fennessy Principal
Officer
Dept. of Justice Equality & Law Reform
Mr. Sean Garvey Principal
Officer
Office of Public Works
Mr. Kieran Grace Principal
Officer
Dept. of Enterprise Trade & Employment
Ms. Teresa Griffin Principal
Officer
Dept. of Education
Mr. Michael Harper Principal
Officer
Dept. of Transport
Mr. Seamus Jackson Principal
Officer
Dept. of Defence
Salutation First Name
Surname Title Department
Mr. John P Kelly Principal
Officer
Dept. of Enterprise Trade & Employment
Mr. Paul Kennedy Principal
Officer
Dept. of Education
Mr. Gay Lacey Principal
Officer
Dept. of Defence
Mr. Padraig Maloney Principal
Officer
Dept. of Education
Mr. Dermot McCarthy Principal
Officer
Dept. of Transport
Mr. Kevin McGarry Principal
Officer
Revenue Commissioners
Ms. Pauline Moreau Principal
Officer
Dept. of Justice Equality & Law Reform
Mr. Philip Murtagh Principal
Officer
Revenue Commissioners
Ms. Aileen Nolan Principal
Officer
Dept. of Defence
Ms. Mary O'Sullivan Principal
Officer
Dept. of Social & Family Affairs
Mr. Gerry Rowley Principal
Officer
Dept. of Justice Equality & Law Reform

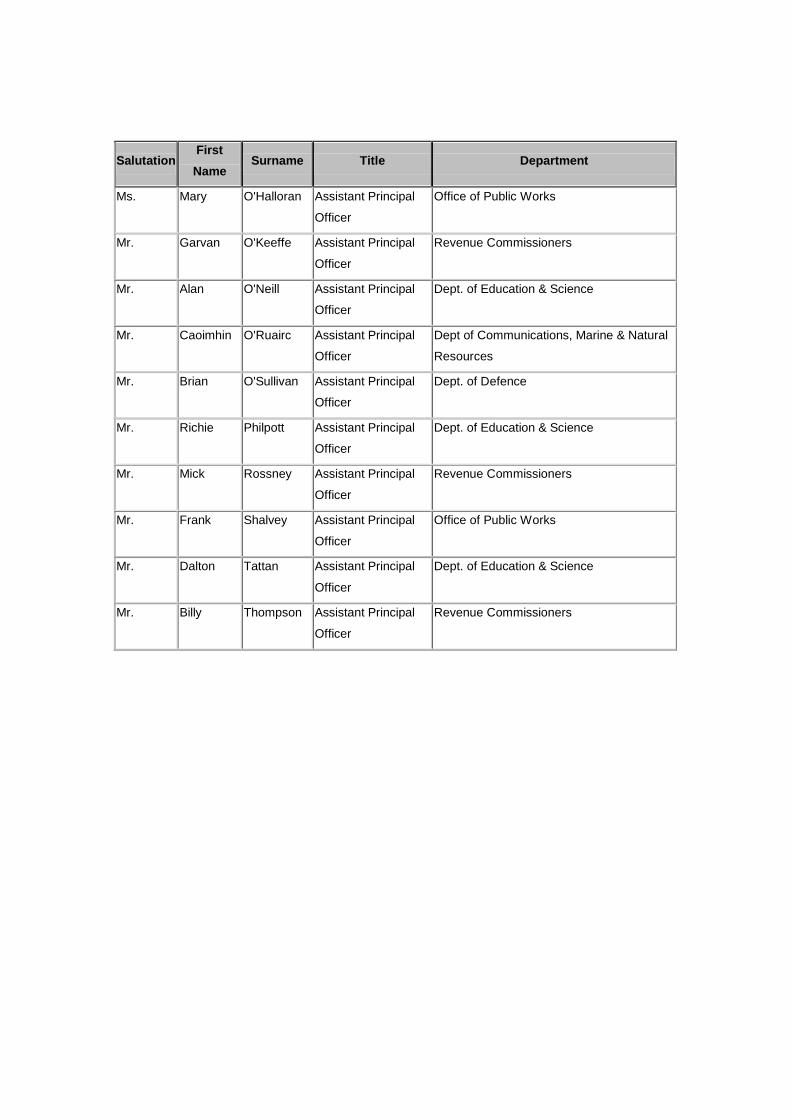
APPENDIX Ib Listing of Assistant Principal Officers
Salutation First Name
Surname Title Department
Mr. Brian Brogan Assistant Principal
Officer
Department of Health
Mr. Jim Caddle Assistant Principal
Officer
Department of Agriculture
Mr. John Carey Assistant Principal
Officer
Dept. of Social & Family Affairs
Ms. Patsy Carr Assistant Principal
Officer
Department of Health
Ms. Deirdre Creaney Assistant Principal
Officer
Dept. of Defence
Mr. Stephen Falvey Assistant Principal
Officer
Dept. of Education & Science
Ms. Brid Farrell Assistant Principal
Officer
Department of Agriculture
Ms. Maria Grogan Assistant Principal
Officer
Dept. of Education & Science
Mr. Gregory Hall Assistant Principal
Officer
Department of Agriculture
Ms. Shelia Hanley Assistant Principal
Officer
Revenue Commissioners
Mr. John Hanney Assistant Principal
Officer
Dept. of Defence
Ms. Mary Horan Assistant Principal
Officer
Dept. of Education & Science
Mr. John Hughes Assistant Principal
Officer
Dept. of Enterprise Trade & Employment
Ms. Jacky Hynes Assistant Principal
Officer
Dept. of Education & Science
Ms. Deirdre Kavanagh Assistant Principal
Officer
Department of Agriculture
Mr. Pat Keane Assistant Principal
Officer
Dept. of Environment

Salutation First Name
Surname Title Department
Mr. Jason Kearney Assistant Principal
Officer
Dept. of Environment
Mr. Jim Kelly Assistant Principal
Officer
Dept. of Environment
Ms. Jean Kelly Assistant Principal
Officer
Dept. of Transport
Mr. Liam Keogh Assistant Principal
Officer
Dept. of Transport
Ms. Mary Kinsella Assistant Principal
Officer
Dept of Communications, Marine & Natural
Resources
Mr. Gerry Lawlor Assistant Principal
Officer
Revenue Commissioners
Mr. Ray Lehane Assistant Principal
Officer
Dept. of Social & Family Affairs
Mr. Tom Lehane Assistant Principal
Officer
Dept. of Social & Family Affairs
Ms. Deirdre McAndrew Assistant Principal
Officer
Dept. of Education & Science
Ms. Mary Moloney Assistant Principal
Officer
Dept. of Social & Family Affairs
Mr. Denis Moynihan Assistant Principal
Officer
Dept. of Social & Family Affairs
Ms. Margaret Mulhair Assistant Principal
Officer
Land Registry
Mr. Kevin Mulkerrins Assistant Principal
Officer
Revenue Commissioners
Mr. Ronain O Dunain Assistant Principal
Officer
Office of Public Works
Mr. Ed O'Callaghan Assistant Principal
Officer
Dept. of Transport
Ms. Brigitta O'Doherty Assistant Principal
Officer
Dept. of Defence
Mr. Joe Pat O'Donnell Assistant Principal
Officer
Office of Public Works
Salutation First Name
Surname Title Department
Ms. Mary O'Halloran Assistant Principal
Officer
Office of Public Works
Mr. Garvan O'Keeffe Assistant Principal
Officer
Revenue Commissioners
Mr. Alan O'Neill Assistant Principal
Officer
Dept. of Education & Science
Mr. Caoimhin O'Ruairc Assistant Principal
Officer
Dept of Communications, Marine & Natural
Resources
Mr. Brian O'Sullivan Assistant Principal
Officer
Dept. of Defence
Mr. Richie Philpott Assistant Principal
Officer
Dept. of Education & Science
Mr. Mick Rossney Assistant Principal
Officer
Revenue Commissioners
Mr. Frank Shalvey Assistant Principal
Officer
Office of Public Works
Mr. Dalton Tattan Assistant Principal
Officer
Dept. of Education & Science
Mr. Billy Thompson Assistant Principal
Officer
Revenue Commissioners

Appendix II
Inbucon Ireland Pay Points ©
INBUCON PAY POINTS
METHOD OF JOB EVALUATION The INBUCON PAY POINTS system has been developed to improve the link between job evaluation (defining a grade structure) and reliable information on current salary levels. INBUCON PAY POINTS can therefore be applied to: 1. Determine market related salaries for senior executives and middle management
jobs. 2. As an analytical method for evaluating all white collar, technical and management jobs. 3. To check and update salary structures on a regular and on-going basis. The system is flexible. It can thus be used purely for pricing jobs more accurately, or as a reliable method of job evaluation, or for salary administration where it provides a salary link between a grade structure and an extensive market-related salary database. It is particularly useful in pay comparability studies, where comparisons are often required between jobs in different sectors/organisations - e.g. civil service and semi-state jobs as compared to jobs in the private sector.

SUMMARY OF SALIENT FEATURES • it is an analytical points system for evaluating all white collar, technical and
management jobs • job worth is quantified on a points scale • points can be linked to the Inbucon Salary database to provide appropriate and
current salaries for different jobs • it provides a ready means for setting up a company grading and salary structure and
for maintaining that structure in line with market movements • the approach takes into account the characteristics of the company and its own
salary objectives in relation to the market • it can be applied as a desk exercise or with full participation of employees in the
company • it is flexible, simple to apply and there is no heavy commitment in terms of central
resources for the upkeep of the system • a monitoring and updating service at which the company and Salary factors are re-
assessed annually is available through the Inbucon Salary Research Unit.

EVALUATING JOBS Initial Job Ranking All job evaluation basically does is to produce a pecking order or ranking of jobs in order of importance. As a forerunner to scoring jobs by a points system it is extremely useful to choose a sample of the jobs to be evaluated and to rank these first. Whilst not essential, we recommend that this step is undertaken as it readily highlights any fundamental differences between the company's own inbuilt and informal value system and the results likely to be produced by the points scoring method. The ranking of sample jobs is usually carried out by executives from the company. The level of participation required from the managers concerned will depend upon circumstances and objectives. Ranking takes very little time and management resource. The methods used can vary from simply writing down an agreed pecking order to using paired comparisons to arrive at a result by consensus. Applying the Technique The Inbucon Pay Points technique is applied in six basic steps, some of which are common to other systems of job evaluation:-
(i) Prepare Job Descriptions
(ii) Assess each job against a series of factors
(iii) Convert each factor assessment into a points score
(iv) Use the total of points scored for each job to establish a rank order
(v) Use the rank order to develop a grade structure
(vi) Calibrate the grade structure with reference to: - company characteristics and policies - market rates

Appendix III Inbucon Report on Executive Salaries & Fringe Benefits 2005-2006 – Relevant Pages
64 4.6 EMPLOYEE NUMBERS OVER 1,000 Overview During the period September 2004 - September 2005 executive salary increases for companies in this employee range were running at an overall average of 5.08% for basic salary and at 4.58% for total remuneration.
Analysis of Employee Numbers Over 1,000 by Operational Activity
Distribution5%
Other3%
Services62.5%
Sales12.5%
Manufac-turing39%
Table 25.1 - Basic Salary by Rank where Employee Number is Over 1,000 Rank Upper
Decile Upper
Quartile Median Lower
Quartile Lower Decile
Mean No. of Execs
2 Managing Director of the Unit 553,800 441,000 375,000 281,163 189,915 362,661 25 3 Full Time Directors of the Board 408,000 332,000 250,000 173,925 133,399 263,338 66 4 Heads of Major Functions 165,283 146,265 110,684 97,785 85,010 123,122 70 5 Senior Management of the Unit 114,917 90,343 77,737 65,000 49,206 79,550 174 6 Middle Management of the Unit 108,792 73,307 59,564 49,871 43,505 65,447 108 7 Lower Management of the Unit 57,663 53,789 42,670 37,065 34,759 46,476 185 8 Senior Staff 49,431 44,051 40,000 36,220 30,335 40,232 25 9 Junior Staff 40,460 38,135 31,814 26,500 26,000 32,995 94
All 271,000 144,585 88,761 55,824 40,000 122,130 747 Table 25.2 - Total Remuneration by Rank where Employee Number is Over 1,000 Rank Upper
Decile Upper
Quartile Median Lower
Quartile Lower Decile
Mean No. of Execs
2 Managing Director of the Unit 761,600 631,500 525,000 321,101 246,459 509,358 25 3 Full Time Directors of the Board 583,600 459,000 365,000 217,300 158,526 363,961 66 4 Heads of Major Functions 215,980 183,294 122,664 108,998 92,953 157,578 70 5 Senior Management of the Unit 144,840 110,303 84,158 70,131 49,997 92,268 174 6 Middle Management of the Unit 120,026 90,668 68,000 53,550 45,680 74,852 108 7 Lower Management of the Unit 65,353 57,516 48,300 40,407 34,893 51,465 185 8 Senior Staff 55,152 49,163 42,840 39,712 32,120 43,894 25 9 Junior Staff 40,460 38,868 32,426 28,777 26,357 34,139 94
All 396,000 181,745 100,000 58,869 42,840 157,072 747


65 Table 25.3 - Basic Salary and Total Remuneration by Function and Rank where Employee Number is Over 1,000 Basic Salary Total Remuneration
Rank Median Average Median Average Top Management 2 375,000 362661 525000 509,358 3 287,000 296766 396000 397,100 4 145,222 146649 184205 222,795 5 76,272 76633 84158 89,965 All 250,000 265247 349000 355,659
Personnel/Human Resources 3 - 184515 - 217,609 4 110,123 106622 121051 122,801 5 109,555 98115 120868 107,347 6 81,300 86706 87000 100,020 7 - 39583 - 41,833 9 29,500 31365 30770 32,000 All 81,894 88418 92263 100,954
Sales 3 - 242472 - 356,405 5 78,850 81594 120638 120,655 6 47,830 47638 74323 74,386 7 - 37529 - 57,227 All 66,528 86024 90668 125,206
Finance 3 258,000 265,836 379,000 375,956 4 168,080 164,224 215,721 230,210 5 79,449 81,329 84,925 91,338 6 63,030 55,150 63,030 59,318 7 45,000 41,106 50,200 45,521 9 - 30,782 - 32,717 All 104,944 160,922 140,491 217,934
Marketing/Public Relations 3 239,000 222,080 378,000 346,436 4 132,363 132,398 162,302 169,305 5 70,909 74,084 89,344 85,848 6 47,287 56,115 49,652 61,403 8 40,000 39,926 40,769 40,459 All 72,010 108,303 90,427 145,739
Manufacturing 3 - 196,601 - 289,490 4 100,109 107,138 110,042 119,226 5 67,304 66,617 68,598 69,400 6 62,661 61,388 64,036 66,654 All 77,804 79,891 79,918 89,173
Technical 4 130,598 124,612 165,000 163,897 5 87,072 86,797 100,680 104,599 6 70,735 83,439 85,183 92,121 All 100,000 100,276 115,980 124,384
Information Technology 3 - 136,076 - 169,634 4 97,696 103,544 114,012 114,530 5 78,933 81,409 93,652 95,971 6 - 56,013 - 60,263 7 42,840 47,750 47,600 50,161 All 77,210 80,324 84,603 91,506
Logistics & Procurement 4 101,028 111,380 111,052 125,078 5 73,874 74,447 80,976 80,237 All 83,134 84,900 83,134 94,355
Financial Services 5 101,253 107,483 125,009 137,780 All 99,029 101,813 118,907 130,361
Secretarial 8 36,740 39,810 40,454 42,299 9 34,746 33,794 35,414 34,652 All 36,220 36,501 38,681 38,043

66 Table 25.4 - Basic Salary and Total Remuneration by Job where Employee Number is Over 1,000 Basic Salary Total Remuneration Median Average Median Average Top Management Managing Director 375,000 362,661 525,000 509,358 Chief Operations Officer 161,777 188,954 206,369 269,667 Regional Manager 130,875 152,277 161,974 189,208 Branch Manager 82,585 113,530 104,158 148,661 Company Secretary 148,908 130,371 170,181 155,555 Legal Executive - 131,359 - 160,524 Personnel/Human Resources Director of Personnel/Human Resources 133,414 131,154 178,586 164,172 Training Manager 74,586 92,663 94,860 103,570 Employee Relations Manager 90,562 93,176 100,562 104,143 Compensation & Benefits Manager - 93,123 - 104,642 Organisation & Development Manager 81,483 81,897 86,558 88,240 Recruitment Manager - 91,312 - 101,526 HR Officer 74,041 62,263 75,464 67,147 Sales Director of Sales 134,444 188,458 189,155 272,780 National / Key Accounts Manager 69,333 73,167 77,371 99,562 Sales Executive - 41,278 - 72,910 Junior Sales Executive - 39,436 - 48,741 Other Sales Executives 38,760 49,706 77,520 70,296 Finance Director of Finance 255,000 260,126 364,000 368,943 Cost/Management Accountant 73,116 70,389 73,116 76,523 Financial Accountant 83,490 85,121 84,925 98,573 Credit Controller 63,908 55,745 65,124 64,119 Payroll Manager 44,930 46,057 49,911 48,739 Accounts Assistant 29,564 29,219 32,164 31,372 Other Finance Executives 76,067 79,241 77,530 84,249 Marketing/Public Relations Director of Marketing 186,819 181,128 254,483 260,667 Brand Manager - 60,659 - 67,185 Market Research Manager 62,055 67,583 63,330 68,220 Public Relations/Advertising Executive 78,229 80,071 85,160 86,934 Marketing Assistant 40,000 39,926 40,769 40,459 Other Marketing Executives 55,755 54,048 67,367 65,541 Manufacturing Director of Manufacturing 161,601 157,101 196,990 212,296 Production /Plant Manager 98,711 99,713 108,506 111,337 Shift Production Supervisor 47,069 53,258 47,974 55,542 Quality Assurance Manager 81,588 82,074 83,157 84,503 Technical Director of Technical Function 147,000 145,151 190,000 216,973 Maintenance/Facilities Engineering Manager 96,291 101,791 123,167 128,534 Director of Research & Development - 150,728 - 173,986 Maintenance Supervisor/Team Leader 57,737 60,824 57,737 65,986 Plant Engineer 72,445 68,653 78,531 77,180 Project Development Management Executive - 84,475 - 95,963 Information Technology Director of Information Technology 136,076 133,745 169,634 161,775 IT Manager 90,000 86,858 102,700 95,392 Project Manager - 81,750 - 86,356 Systems Analyst 60,644 70,760 61,810 75,525 Analyst Programmer 36,500 41,873 39,100 43,705 Other IT Executives 53,508 59,345 53,508 66,587 Logistics & Procurement Director of Distribution 130,433 132,893 159,028 157,510 Director of Materials 91,837 84,968 95,538 89,932 Supply Chain Manager - 76,881 - 86,567 Purchasing Manager 73,874 70,852 80,976 74,403 Other Logistics & Procurement Executives 45,000 60,915 50,000 67,417 Secretarial Executive Secretary 43,920 43,606 44,353 45,220 Senior Secretary 38,135 40,095 38,970 41,798 Secretary 30,335 30,421 32,120 31,239 Receptionist 27,816 28,361 29,340 29,401