job erg sustainable city 27-7-11
TRANSCRIPT

8/6/2019 Job Erg Sustainable City 27-7-11
http://slidepdf.com/reader/full/job-erg-sustainable-city-27-7-11 1/32
Sustainable Cities
Dan HoornwegLead Urban Advisor, World BankJune 16, 2011
THE WORLD BANK
8/6/2019 Job Erg Sustainable City 27-7-11
http://slidepdf.com/reader/full/job-erg-sustainable-city-27-7-11 2/32
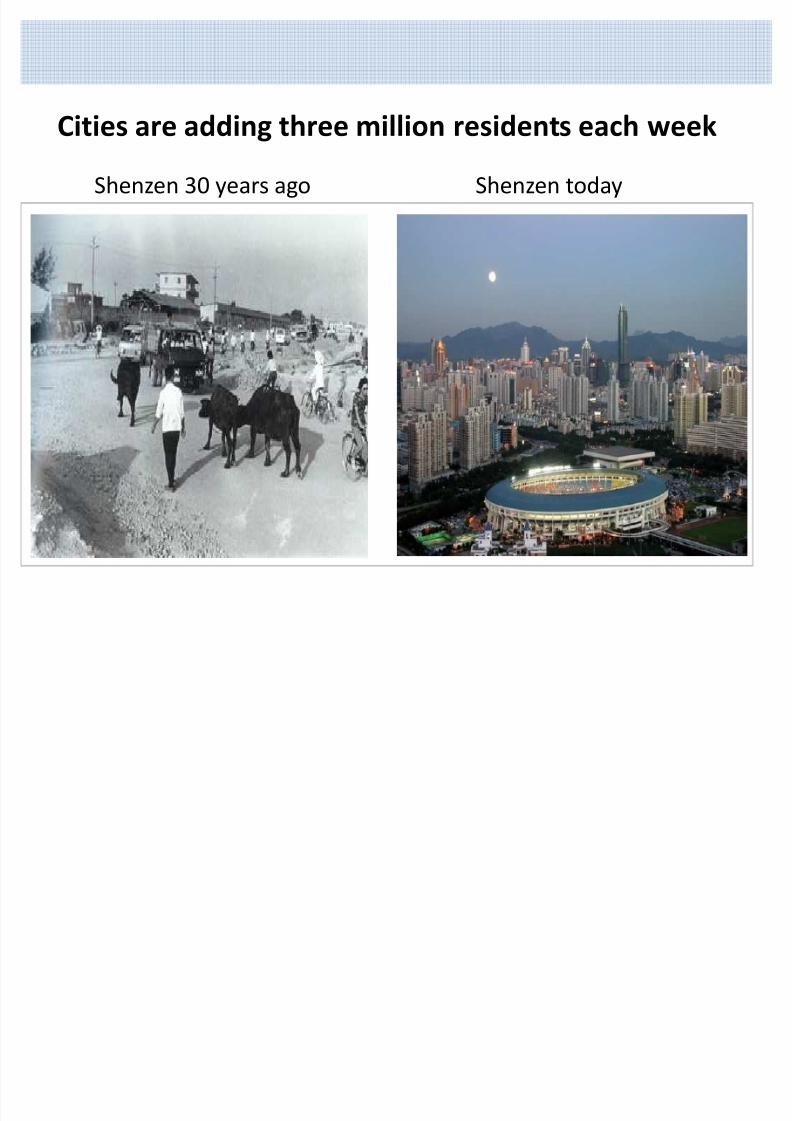
Cities are adding three million residents each weekShenzen 30 years ago Shenzen today
8/6/2019 Job Erg Sustainable City 27-7-11
http://slidepdf.com/reader/full/job-erg-sustainable-city-27-7-11 3/32
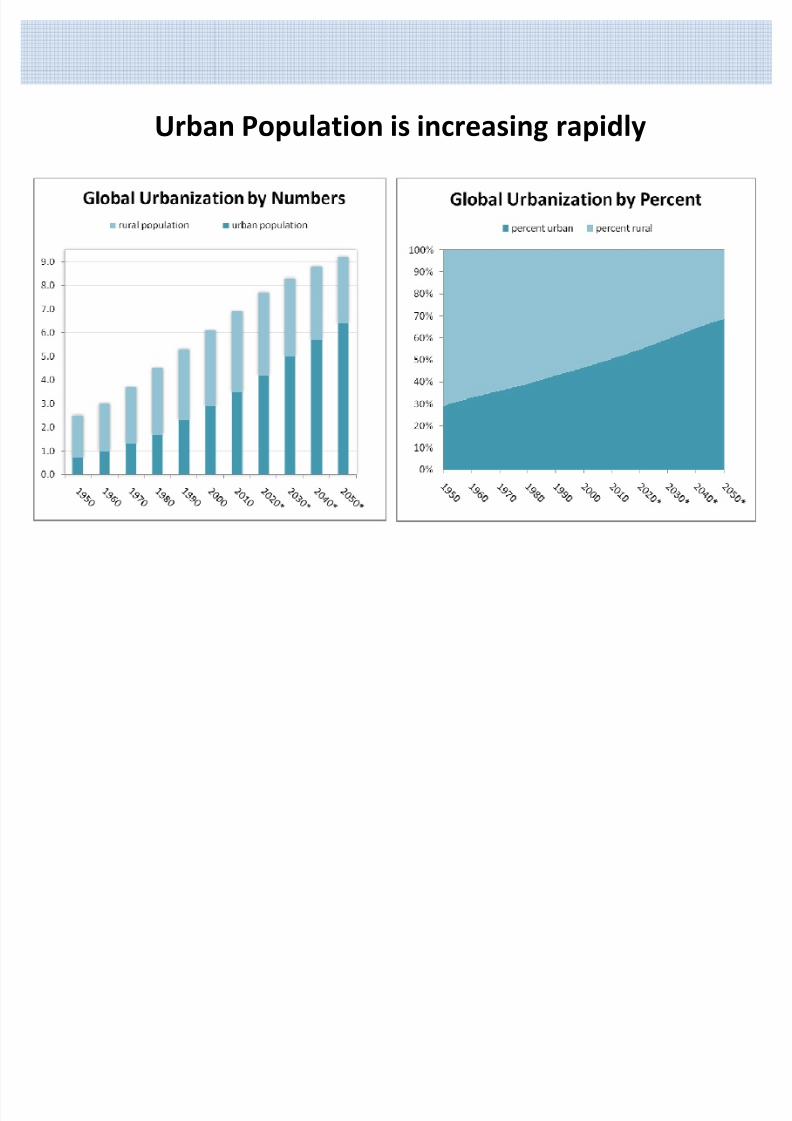
Urban Population is increasing rapidly

8/6/2019 Job Erg Sustainable City 27-7-11
http://slidepdf.com/reader/full/job-erg-sustainable-city-27-7-11 4/32
Cities are drivers of economic growth

8/6/2019 Job Erg Sustainable City 27-7-11
http://slidepdf.com/reader/full/job-erg-sustainable-city-27-7-11 5/32
Cities have significant impact on GDP and GHG
emissionsPopulation(Millions)
GHG Emissions(M tCO2e)
GDP(billion $ PPP)
1. China: 1,192 1. USA: 7,107 1. USA: 14,202
2. India: 916 2. China: 4,058 2. 50 Largest Cities: 9,564
3 . 50 Largest Cities: 500 3 . 50 Largest Cities: 2 ,606 3 . C40 Cities: 8,781
4 . C40 Cities: 393 4 . C40 Cities: 2 ,364 4. China: 7,903
5. USA: 301 5. Russian Federation: 2,193 5. Japan: 4,354
6. Indonesia: 190 6. Japan: 1,374 6 . Top 10 GHG Cities: 4,313
7. Brazil: 159 7 . Top 10 GHG Cities: 1,367 7. India: 3,388
8. Russian Federation: 142 8. India: 1,214 8. Germany: 2,925
9 . Top 10 GHG Cities: 136 9. Germany: 956 9. Russian Federation: 2,288
10. Japan: 128 10. Canada: 747 10. United Kingdom: 2,176

8/6/2019 Job Erg Sustainable City 27-7-11
http://slidepdf.com/reader/full/job-erg-sustainable-city-27-7-11 6/32
Hierarchy of Sustainable Cities
Source: Henry Jewell

8/6/2019 Job Erg Sustainable City 27-7-11
http://slidepdf.com/reader/full/job-erg-sustainable-city-27-7-11 7/32
City Index: Philips

8/6/2019 Job Erg Sustainable City 27-7-11
http://slidepdf.com/reader/full/job-erg-sustainable-city-27-7-11 8/32
City Index: The Atlantic 1 New York 2 Toronto3 San Francisco4 Stockholm5 Sydney6 London7 Chicago8 Paris9 Singapore
10 Hong Kong11 Houston12 Los Angeles13 Berlin14 Tokyo15 Madrid16 Seoul17 Beijing
18 Abu Dhabi19 Shanghai20 Mexico City21 Moscow22 Santiago23 Istanbul24 Sao Paulo25 Johannesburg
26 Mumbai

8/6/2019 Job Erg Sustainable City 27-7-11
http://slidepdf.com/reader/full/job-erg-sustainable-city-27-7-11 9/32
City Index: Monocle
Monocle S elects H elsinki a s Most
L ive ab le C ity in the W orld
1 Helsinki2 Zurich3 Copenhagen
Monocle s Top Three Liveable Cities 2011

8/6/2019 Job Erg Sustainable City 27-7-11
http://slidepdf.com/reader/full/job-erg-sustainable-city-27-7-11 10/32
U rban form and density significantly impactenergy consumption

8/6/2019 Job Erg Sustainable City 27-7-11
http://slidepdf.com/reader/full/job-erg-sustainable-city-27-7-11 11/32
U rban Form Determines Cities Energy Efficiency
Source: Bertaud, A., and T. Pode, Jr., Density in Atlanta: Implications for Traffic and Transit (Los Angeles: Reason Foundation, 2007).
8/6/2019 Job Erg Sustainable City 27-7-11
http://slidepdf.com/reader/full/job-erg-sustainable-city-27-7-11 12/32
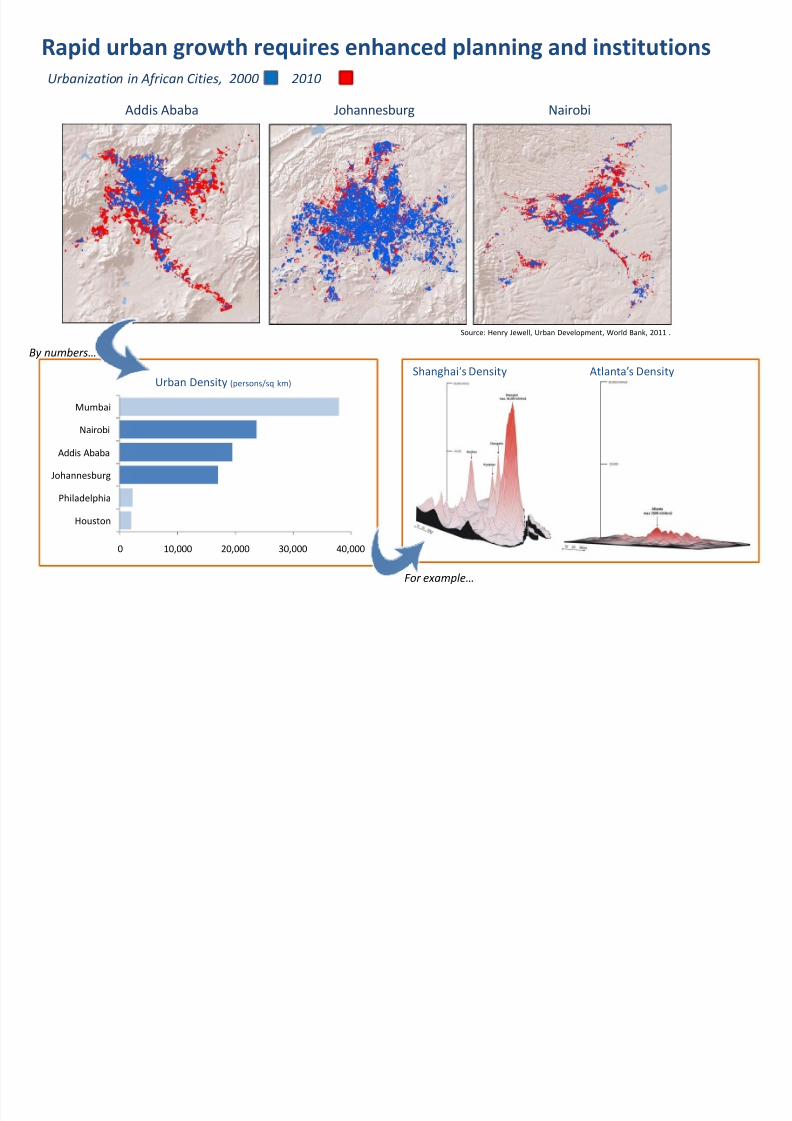
R apid urban growth requires enhanced planning and institutions
NairobiJohannesburgAddis Ababa
0 10,000 20,000 30,000 40,000
Houston
Philadelphia
Johannesburg
Addis Ababa
Nairobi
Mumbai
Urban Density (persons/sq km)
Source: Henry Jewell, Urban Development, World Bank, 2011 .
Shanghai s Density Atlanta s Density
By numbers
For example
2000 2010Urbanization in African Cities,

8/6/2019 Job Erg Sustainable City 27-7-11
http://slidepdf.com/reader/full/job-erg-sustainable-city-27-7-11 13/32
W orld Bank Activities in Sustainable Cities
Mayors Task Force on climate change and the urban poor
GHG Emissions Standard, in partnership with the U N
Urban Risk Assessment
City-Wide Approach to Carbon Finance
Eco2 Cities
Global City Indicators Facility
Joint Work Program with U NEP, UN-HABITAT and CitiesAlliance
Urban Metabolism

8/6/2019 Job Erg Sustainable City 27-7-11
http://slidepdf.com/reader/full/job-erg-sustainable-city-27-7-11 14/32
Mayor s Task Force on Climate Change, DisasterR isk and the U rban poor
Mayor s Task Force set up in December 2009,members include: Dar es Salaam, Jakarta, MexicoCity, and Sao Paulo
Objectives of the Task Force:o Improve the understanding of the linkages between
urban poverty, climate change and disastermanagement with a focus on the delivery of sustainable basic services
o Identify good practice examples where vulnerabilityhas been reduced
o Identify financing opportunities for cities to addressthese issues
Approach: Global study and 4 city level case studiesunderstanding urban risk
Dar es Salaam
Jakarta
Mexico City
Sao Paulo
8/6/2019 Job Erg Sustainable City 27-7-11
http://slidepdf.com/reader/full/job-erg-sustainable-city-27-7-11 15/32
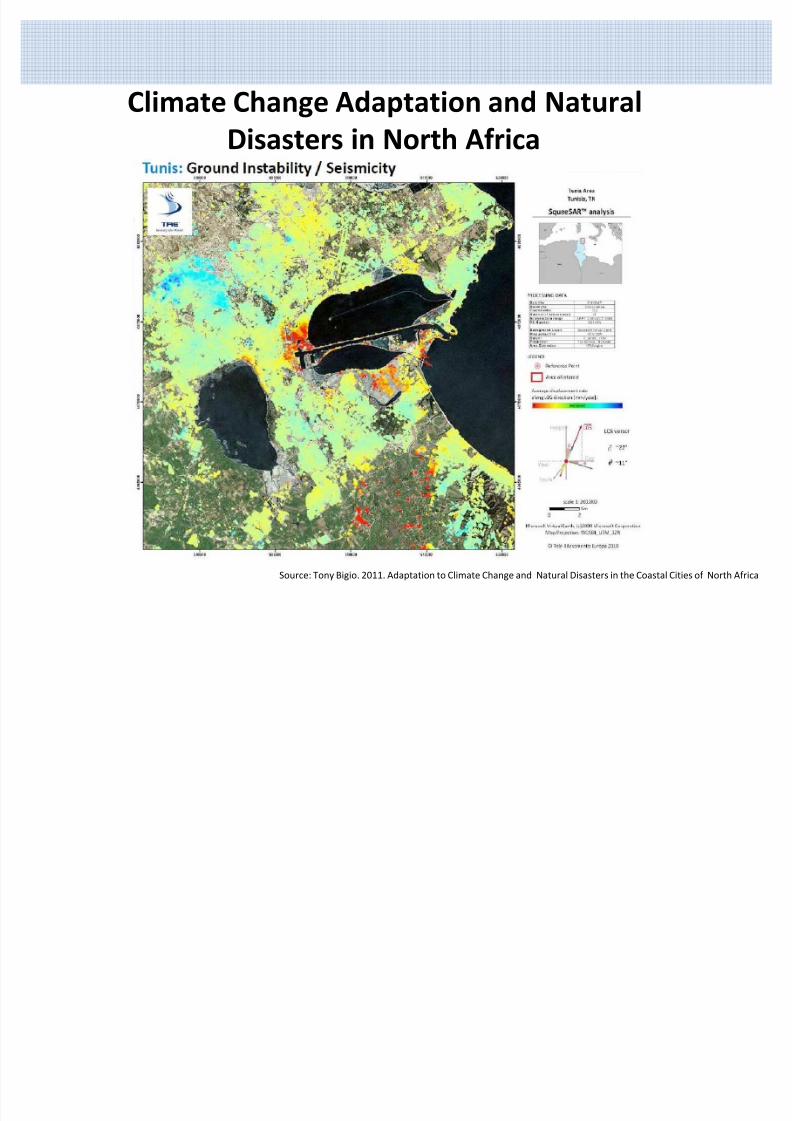
Climate Change Adaptation and Natural
Disasters in North Africa
Source: Tony Bigio. 2011. Adaptation to Climate Change and Natural Disasters in the Coastal Cities of North Africa
8/6/2019 Job Erg Sustainable City 27-7-11
http://slidepdf.com/reader/full/job-erg-sustainable-city-27-7-11 16/32
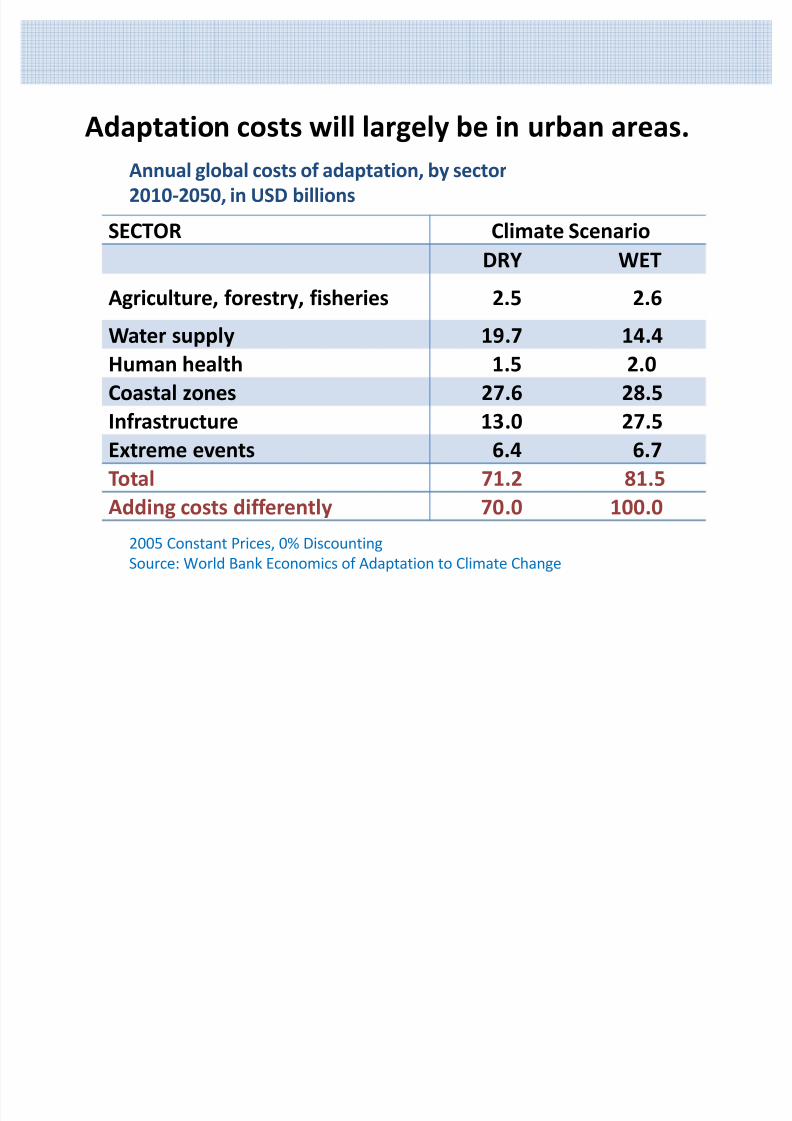
SECTOR Climate ScenarioDRY W ET
Agriculture, forestry, fisheries 2. 5 2. 6
W ater supply 19 . 7 14 . 4Human health 1 . 5 2. 0Coastal zones 2 7 . 6 2 8 . 5Infrastructure 13 . 0 2 7 . 5Extreme events 6 . 4 6 . 7Total 71 .2 81 . 5Adding costs differently 70 . 0 100 . 0
2005 Constant Prices, 0% DiscountingSource: World Bank Economics of Adaptation to Climate Change
Annual global costs of adaptation, by sector2 010- 2 050, in U SD billions
Adaptation costs will largely be in urban areas.

8/6/2019 Job Erg Sustainable City 27-7-11
http://slidepdf.com/reader/full/job-erg-sustainable-city-27-7-11 17/32
Greenhouse Gas Standard for calculating emissionsA open, global protocol for attributing GHG emissions isneeded in order to establish baselines and monitor progress
Proliferation of protocols and methods for city GHGinventories
e.g. ICLEI USA; Bilan carbone (France); Project 2 Degrees(CCI); GRIP (Europe); CO2 Grobbilanz (Germany)
Launched at World Urban Forum in Rio, March 2010; now inpartnership with C40
Work ongoing with client cities, in conjunction with WBGregional operations
Amman, Bangkok, Dar es Salaam, Jakarta, MexicoCity, Quezon City, Sao PauloInterest from EAP to work with a number of Chinesecities
8/6/2019 Job Erg Sustainable City 27-7-11
http://slidepdf.com/reader/full/job-erg-sustainable-city-27-7-11 18/32
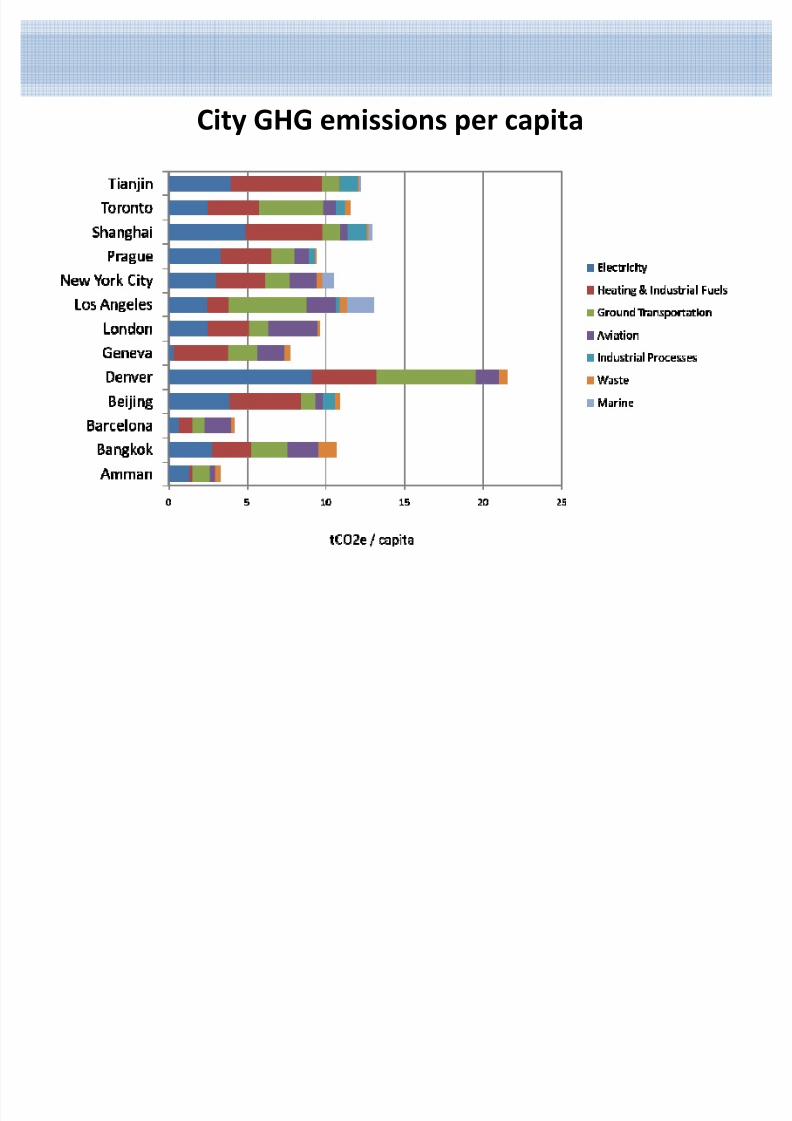
City GHG emissions per capita

8/6/2019 Job Erg Sustainable City 27-7-11
http://slidepdf.com/reader/full/job-erg-sustainable-city-27-7-11 19/32
W hich neighborhood has the lowest GHG emissions?
Whitby 13.02 tCO2e/cap (residential only)
East York 1.31 tCO2e/cap ( residential only) Etobicoke 6.62 tCO2e/cap ( residential only)
8/6/2019 Job Erg Sustainable City 27-7-11
http://slidepdf.com/reader/full/job-erg-sustainable-city-27-7-11 20/32
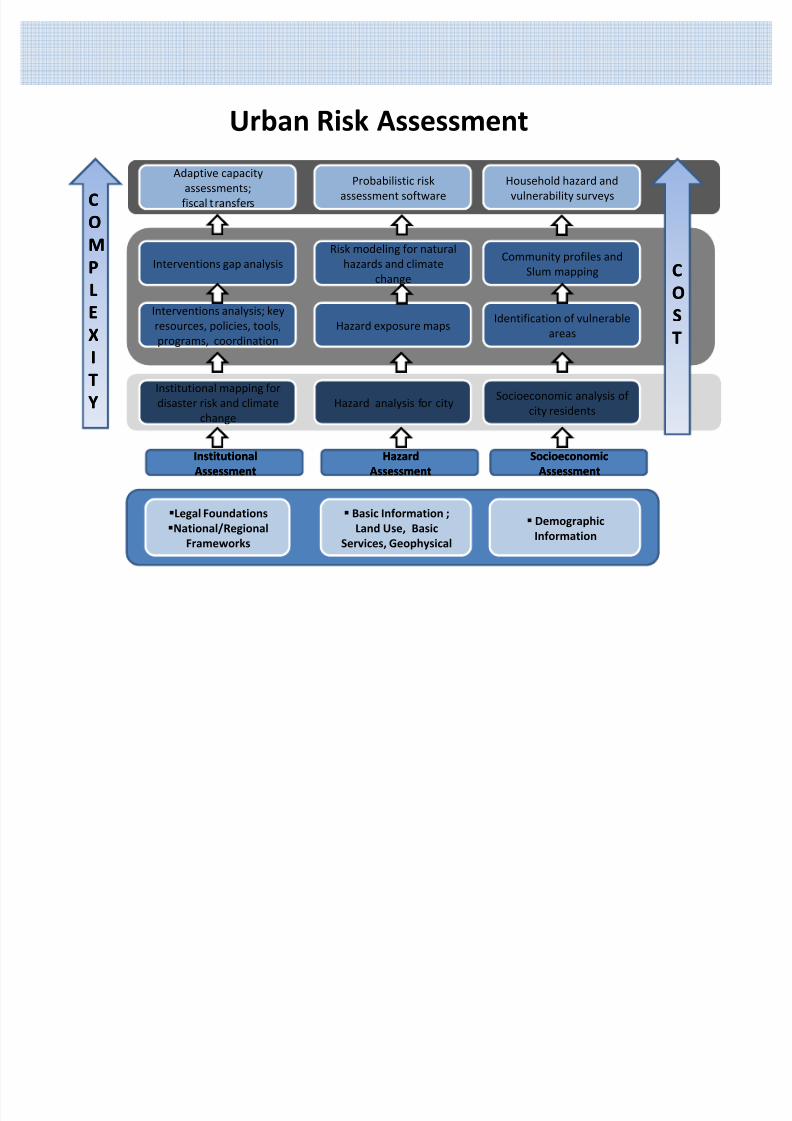
U rban R isk Assessment
InstitutionalInstitutionalAssessmentAssessment
HazardHazardAssessmentAssessment
SocioeconomicSocioeconomicAssessmentAssessment
Legal FoundationsNational/ R egional
Frameworks
Basic Information ;Land U se, Basic
Services, Geophysical
DemographicInformation
Institutional mapping fordisaster risk and climate
change
Hazard analysis for citySocioeconomic analysis of
city residents
Interventions analysis; keyresources, policies, tools,programs, coordination
Hazard exposure mapsIdentification of vulnerable
areas
Interventions gap analysisRisk modeling for natural
hazards and climate
change
Community profiles andSlum mapping
Adaptive capacityassessments;
fiscal t ransfers
Probabilistic riskassessment software
Household hazard andvulnerability surveys
CCOOSSTT
CCOOMMPPLLEEXXIITTYY

8/6/2019 Job Erg Sustainable City 27-7-11
http://slidepdf.com/reader/full/job-erg-sustainable-city-27-7-11 21/32
Adaptation Cost Curves
Source: ClimateWorks Foundation, Global Environment Facility, European Commission, McKinsey& Company, The RockefellerFoundation, Standard Chartered Bank and Swiss Re. (2009) Shaping Climate Resilient Development; a framework for decision-making.

8/6/2019 Job Erg Sustainable City 27-7-11
http://slidepdf.com/reader/full/job-erg-sustainable-city-27-7-11 22/32
Marginal Abatement Cost Curves
Source: McKinsey 2009.

8/6/2019 Job Erg Sustainable City 27-7-11
http://slidepdf.com/reader/full/job-erg-sustainable-city-27-7-11 23/32
City-wide Approach to Carbon FinanceDraw on existing methodologies to combine projects across differentsectors in a single carbon finance program of activities
The methodology is currently being piloted in Amman and is underreview by the CDM board.

8/6/2019 Job Erg Sustainable City 27-7-11
http://slidepdf.com/reader/full/job-erg-sustainable-city-27-7-11 24/32
Global City Indicators Facility
Bank-initiated, with over 10 partners and piloted in 9 cities
Global City Indicator Facility established in October 2008 at theUniversity of Toronto to oversee the Program
City-led program: cities actively participate through collection andanalysis process
A single comprehensive system for measuring and monitoring cityperformance and quality of life that will:o Enable elected officials, city managers, and public to monitor
the performance of cities over timeo Facilitate comparisons across cities and over timeo Foster information sharing and learning across cities
Over 100 cities across 35 countries have joined

8/6/2019 Job Erg Sustainable City 27-7-11
http://slidepdf.com/reader/full/job-erg-sustainable-city-27-7-11 25/32
W ater Supply
Fossil Fuels
N atural GasFuel Oil LPG Kerosene Diesel Oil Gasoline Jet Kerosene
Marine FuelOil
2,143 TJ 12,998 TJ 1,910 TJ 1,640 TJ 26,236 TJ 20,187 TJ 12,709 TJ 668 TJ
180 MCM/a
73 MCM/a
ElectricityGeneration
Consumption5,500 GWh
T&D Losses
770 GWh
W astewater
Aviation & Marine
3,766 ktCO 2 e
983 ktCO 2 e
1,012 ktCO 2 e
Landfill W aste
669 kt
Greenhouse GasEmissions
Carbon Dioxide 9,136 ktCO 2 e
Methane 1,029 ktCO 2 e
N itrous Oxide 92 ktCO 2 e
10,256 ktCO 2 e
20.4 MJ/m 2
Total Radiation
Organic Waste 294 kt
Paper, Cardboard, Textiles 197 kt
Plastics, Glass, Metal 136 kt
Other Materials 42 kt
Renewables 34 GWh
Fuel Oil 2,744 GWh
Diesel Oil 19 GWh
N atural Gas 3,472 GWh
6,270 GWh
61 ktCO 2 e
1,008 ktCO 2 e520 ktCO 2 e
2,906 ktCO 2 e
Cropland
Manufacturing & Industry
Commercial, Institutional & Residential Road
Transport
Amman, JordanUrban Metabolism
Source: L. Sugar 2011.

8/6/2019 Job Erg Sustainable City 27-7-11
http://slidepdf.com/reader/full/job-erg-sustainable-city-27-7-11 26/32
Cape Town, SouthAfricaUrban Metabolism
Source: L. Sugar 2011.

8/6/2019 Job Erg Sustainable City 27-7-11
http://slidepdf.com/reader/full/job-erg-sustainable-city-27-7-11 27/32
Financial Flows for Climate Action in Developing Countries
Source: Atteridge et al. (2009 ). Bilateral Finance Institutions and Climate Change: A Mapping of Climate Portfolios, Stockholm Environment Institute.

8/6/2019 Job Erg Sustainable City 27-7-11
http://slidepdf.com/reader/full/job-erg-sustainable-city-27-7-11 28/32
A growing menu of climate finance instruments
Adaptation
The AdaptationFund
Special ClimateChange Fund
Global Facility forDisaster Risk
Reduction & Recovery
Least DevelopedCountry Fund
Mitigation
GlobalEnvironmentalFacility (GEF)
Carbon Funds
Carbon PartnershipFacility
Forest InvestmentProgram
Forest CarbonPartnership Facility
Scaling UpRenewable Energy
for the Poor
Clean TechnologyFund
Pilot Programfor ClimateResilience
GlobalEnvironmentalFacility (GEF)
RiskInstruments

8/6/2019 Job Erg Sustainable City 27-7-11
http://slidepdf.com/reader/full/job-erg-sustainable-city-27-7-11 29/32
Climate Finance Options for Cities

8/6/2019 Job Erg Sustainable City 27-7-11
http://slidepdf.com/reader/full/job-erg-sustainable-city-27-7-11 30/32
Matching:A professional dating service thatautomatically matches urban policymakers,decision makers and technical professionalsto each other worldwide.
Messaging:Get in direct contact with your counterpartsin other cities.
Communities of Practice:Community-based Q&A.
1. CONNECTIONS
Exchange:Tightly-focused videoconferences on themost knotty knowledge gaps.
Policy insights:New collaborative research on policy-relevantquestions.
Briefings:Pithy summaries of knowledge exchangeevents, and expert viewpoints.
2 .KNOWLEDGE
Indicators:Common indicators to benchmark citiesfor international comparisons.
Integration with Open311 and Google:Open access to municipal-level data.
3 . CITIES DATA
Our Objective
UrbanKnowledge.Org aims to put the world s best knowledge and data in the hands of policymakers andpractitioners,in order to harness urban growth for better development outcomes.
Our 3 Components
Our 4 Thematic Pillars
ECONOMIC: rural-to-urban transition.
Happens once in a country's lifetime...but how can it best be facilitated foreconomic growth?
ENVIRONMENTAL: sustainable urbangrowth
Low-density cities are hardwiringenvironmental costs
...so how to manage urbanization toimprove sustainability?
GOVERNANCE: creating accountable citiesand townsPoorly governed cities don t deliver on thepromise of urbanization...so what systems of governance are suited
for managing urbanization?Pillar 1 Pillar 2 Pillar 3 Pillar 4
SOCIAL: social inclusion and mobility
Urbanization embodies structuralinequalities...so how to incorporate the urban poor in
a city's economic fabric?
Meet our Partners:
And you?
U rbanization Knowledge Platform

8/6/2019 Job Erg Sustainable City 27-7-11
http://slidepdf.com/reader/full/job-erg-sustainable-city-27-7-11 31/32
Climate change is an important cross-cuttingproblem, but it is also one among many .
Figure: Exceeding the safe operating space in global environmental systems The green circle above represents the proposed safeoperating space for each system above. Red shading denotes an estimate of the current status of each. The boundaries rate of
biodiversity loss, climate change and human interference with the nitrogen cycle are far beyond the safe operating space(Rockstrom et al 2009).
31
8/6/2019 Job Erg Sustainable City 27-7-11
http://slidepdf.com/reader/full/job-erg-sustainable-city-27-7-11 32/32
Thank You