joão otávio dourado monteiro · resumo estendido introdução: a velocidade de chama laminar é...
TRANSCRIPT

João Otávio Dourado Monteiro
LAMINAR FLAME SPEED OF FUEL MIXTURES APPLIED TO
SPARK IGNITION INTERNAL COMBUSTION ENGINES
Dissertation submitted to the
Mechanical Engineering Graduate
Program of the Federal University
of Santa Catarina in partial
fulfillment of the requirements for
the degree of Master of Mechanical
Engineering.
Supervisor: Prof. Amir Antônio
Martins de Oliveira Jr., PhD.
Florianópolis
2015


João Otávio Dourado Monteiro
LAMINAR FLAME SPEED FOR FUEL MIXTURES FOR SPARK
IGNITION COMBUSTION ENGINES
This Dissertation was considered adequate to obtain the degree of
Master of Mechanical Engineering and was approved on its final version by
the Mechanical Engineering Graduate Program.
Florianópolis, September 30th 2015.
________________________ Prof. Armando Albertazzi Gonçalves Jr., Dr. Eng.
Mechanical Engineering Graduate Program Chair
Examining board:
________________________ Prof. Amir Antônio Martins de Oliveira Jr., PhD
Supervisor
Federal University of Santa Catarina
________________________
Prof. Armando Albertazzi Gonçalves Jr., Dr.Eng.
Federal University of Santa Catarina
________________________
Prof. Cesar José Deschamps, Ph.D.
Federal University of Santa Catarina
________________________
Prof. Fernando Marcelo Pereira, Dr.Eng.
Federal University of Rio Grande do Sul


ACKNOWLEDGEMENTS
I thank my parents, Ana Rita Ribas Dourado and Avelino José
Monteiro, my brother José Vitor Dourado Monteiro, and my sister Maria
Clara Dourado Monteiro, also my girlfriend Luana Cristina Wilvert.
I thank my supervisor Amir Antônio Martins Oliveira Jr., and the
professors of the combustion and termal systems laboratory Leonel Rincón
Cancino and Edson Bazzo.
I thank the LabCET staff and colleagues, Gilson Nunes Maia,
Ricardo Morel Hartmann, Eduardo Morel Hartmann, Amir Roberto De Toni,
Leandro Alves de Oliveira, Camila Rigoni Medeiros, Roberto Wolf
Francisco Jr., Renzo Fabricio Figueroa Piña, Alexandre Schmidt Ferreira.
I thank the company PETROBRAS and the CNPq for the financial
support and the employees Edimilson Jesus de Oliveira and Mauro Iurk
Rocha.
I thank the Federal University of Santa Catarina and the Mechanical
Engineering Graduate Program and everyone that contributed to the
development of this work and my formation as an engineer.


ABSTRACT
The laminar flame speed is a physicochemical parameter of the
combustion of premixed mixtures. It is relevant in the design and analysis of
combustion systems, such as internal combustion engines and gas turbines,
in risk analysis of accidents with gas fuels, as well as, a global target to the
development of detailed chemical kinetics models for combustion. Here, the
laminar flame speeds of ethanol, iso-octane, n-heptane, gasoline, gasoline
with 27% ethanol in volume, two surrogates for the gasoline and the gasoline
with ethanol, in mixture with dry air were measured at 100 kPa, temperature
range from 298 K to 408 K, and equivalence ratio from 0.6 to 1.4. The
measurements were made in a constant volume reactor equipped with a high-
speed camera (10000 FPS), for the visualization of the spherically expanding
flame front propagation using the Schlieren method. Unstretched laminar
flame speed was obtained through extrapolation using a linear relation
between flame stretch rate and flame propagation velocity. The effect of
temperature on flame speed was evidenced and two empirical equations were
curve fitted to the measurements relating the flame speed to the equivalence
ratio. A global equation to calculate laminar flame speed as a function of
equivalence ratio and temperature was also curve-fitted for each fuel. The
results agree with values found in the literature for the pure substances within
10 %. The temperature dependence parameter is also in good agreement with
the literature within an error band of 10 % of the measurement. The deviation
from the curve-fitted equations and the measurements is smaller than 4%.
The surrogate proposed also represented with great accuracy the laminar
flame speed of the gasoline and the gasoline with ethanol addition, with a
maximum difference of 2 %.
Keywords: Constant volume reactor, Laminar flame speed, Gasoline,
Ethanol, Gasoline surrogate.


Título: MEDIÇÃO DE VELOCIDADE DE CHAMA LAMINAR DE
MISTURAS AR-COMBUSTÍVEL PARA MOTORES DE IGNIÇÃO
POR CENTELHA
RESUMO
A velocidade de chama laminar é uma característica físico-química
da combustão de misturas contendo oxidante e combustível pré-misturados.
É um parâmetro utilizado no projeto e análise de sistemas de combustão,
como motores e turbinas a gás, nas análises de risco, como em acidentes
envolvendo gases, e como parâmetro global para o desenvolvimento de
modelos de cinética química de combustão. Nesse trabalho, a velocidade de
chama laminar foi medida para os seguintes combustíveis: etanol, iso-octano,
n-heptano, gasolina, gasolina com adição de 27% de etanol, e duas misturas
que emulam o comportamento (surrogates) da gasolina e da gasolina com
adição de etanol. As condições iniciais para os experimentos foram 100 kPa,
temperaturas variando de 298 K até 408 K, e razão de equivalência de 0,6 até
1,4. Os experimentos foram realizados em um reator de volume constante,
equipado com uma câmera de alta velocidade (10000 FPS) usada para a
visualização da propagação da frente de chama no interior do reator com o
método Schlieren. A velocidade de chama laminar plana foi obtida através da
extrapolação linear da relação entre a velocidade de propagação da chama e
a taxa de estiramento. O parâmetro de dependência com a temperatura foi
calculado para cada combustível em cada razão de equivalência. Duas curvas
de ajuste dos dados experimentais (função polinomial de terceiro grau e
exponencial) foram obtidas para relacionar velocidade de chama laminar e
razão de equivalência para cada temperatura. Uma equação global para
calcular velocidade de chama laminar em função de temperatura e razão de
equivalência para cada combustível também foi determinada. O resultados
obtidos mostram uma boa concordância com a literatura, com diferenças
menores que 10 % para as substâncias puras. O parâmetro de dependência
com a temperatura também está em boa concordância com os valores
encontrados na literatura dentro da faixa de erro experimental de 10 % do
valor medido. O uso da equação global resulta em desvio menor que 4 % para
os valores medidos. Os surrogates investigados representam a velocidade de
chama laminar da gasolina e da gasolina com adição de etanol dentro de um
desvio de máximo de 2 %.
Palavras-chave: Reator de volume constante, Velocidade de chama laminar,
Gasolina, Etanol, Surrogate.


RESUMO ESTENDIDO
Introdução: A velocidade de chama laminar é um dos parametros
essenciais para a análise e predição da performance das mais variadas
máquinas a combustão. A maioria dos modelos de combustão turbulenta
requerem o conhecimento da velocidade de chama laminar da mistura
ar/combustível em função da razão de equivalência, temperatura e pressão.
Além disso, dados experimentais confiáveis são necessários para testar e
calibrar modelos cinéticos de combustão. A velocidade de chama laminar
também é importante no projeto de queimadores, turbinas a gás, e para
predições de explosões.
A velocidade de chama laminar de misturas de ar com iso-octano,
n-heptano e etanol, foi investigada extensivamente principalmente na última
década. Porém, mesmo assim a diferença entre medições com diferentes
métodos é muitas vezes maior que a incerteza experimental, o que leva a crer
que medições ainda são necessárias a fim de se estabelecer uma valor mais
correto. Além destes combustíveis puros, também se faz necessário testar
combustíveis convencionais, como a gasolina, principalmente por não ser
viável representar quimicamente através de um modelo cinético de
combustão toda a complexidade de elementos que compõem a gasolina.
Desta forma também é importante que sejam estabelecidos surrogates
confiáveis e que representem com devida precisão as propriedades da
gasolina.
Objetivos: O objetivo principal é medir a velocidade de chama
laminar de misturas de hidrocarbonetos e ar para motores a combustão interna
com ignição por centelha. Objetivos específicos são: medir e comparar com
a literatura disponível a velocidade de chama laminar de combustíveis puros
como iso-octano, n-heptano e etanol, para validar as medições. Mediar a
velocidade de chama laminar da Gasolina A (sem adição de etanol) e
Gasolina C (Mistura de gasolina A e 27 % de etanol em volume). Propor um
surrogate para a gasolina A, composto por uma mistura binária de iso-octano
e n-heptano, e um surrogate para a gasolina C, formulado adicionando 27 %
de etanol ao surrogate para a gasolina A, e finalmente averiguar a
concordância entre a velocidade de chama laminar entre os surrogates e os
combustíveis reais a fim de acertar se estes resultam em uma boa simulação
da velocidade de chama laminar das gasolinas A e C. Além disso, através das
medições feitas são determinadas relações empíricas para que a velocidade
de chama laminar possa ser obtida também fora dos pontos experimentais, e
também é feita a determinação do parâmetro de dependência com a
temperatura
Método: Para se realizarem as medições de velocidade de chama
laminar um reator de volume constante é utilizado.

O reator consiste em dois hemisférios juntos formando uma esfera
de raio de 150 mm, os hemisférios possuem cada um uma janela de quartzo
de 75 mm de raio e 5 mm em espessura através das quais luz pode passar pelo
reator possibilitando a visualização da chama, O reator tem um volume total
de 14,8 L.
O reator é equipado com sistema de controle de temperatura,
composto por uma manta térmica com uma potência máxima de aquecimento
de 900 W e duas lâmpadas de 250 W totalizando um sistema de aquecimento
de 1400 W, o reator pode ser aquecido até 135 ºC e a temperatura é controlada
por 3 termopares localizados nas superfícies externas do reator, e um
termopar em seu interior cuja ponta se encontra a 40 mm do centro afim de
se controlar a temperatura dos gases antes da combustão.
A pressão no interior da câmara é monitorada por um transdutor
de pressão localizado na parede do reator que mede a evolução da pressão na
câmara conforme a reação de combustão ocorre. Além disso a pressão de ar
com a qual o reator e preenchido também é controlada por outro transdutor
na linha de alimentação de ar.
Para o sistema de ignição é utilizado um sistema de controle
elétrico para controlar a energia descarregada pela centelha. Em todos os
experimentos o sistema de controle descarrega sempre a mesma energia na
centelha. A centelha por sua vez ocorre no centro do reator, para tal são
utilizadas duas velas automotivas prolongadas por fios de cobre de 1 mm em
diâmetro que se encontram a uma distância de 2 mm entre um e outro no
centro geométrico do reator, é nesta distância em que a centelha de ignição
de estabelece.
Para a obtenção de imagens da propagação da chama esférica no
interior do reator é utilizado o método Schllieren com uma montagem tipo Z.
Este sistema ótico de obtenção de imagens é composto por dois espelhos
esféricos com 152,4 mm em diâmetro e uma distância focal de 1524 mm um
ponto de luz composto por um LED de 5 mm e uma faca para melhorar a
precisão da imagem. Através da montagem deste sistema é utilizada uma
câmera digital de alta velocidade capaz de obter 10000 FPS e capturar pela
diferença da densidade entre os gases queimados e não-queimados a posição
da frente de chama a cada instante de tempo.
O combustível é injetado no reator utilizando uma seringa,
previamente à injeção do combustível a bomba de vácuo é acionada, criando
uma pressão absoluta de 0,2 mPa o que possibilita a completa evaporação do
combustível. O reator, após a evaporação do combustível, é preenchido com
ar seco até a pressão inicial previamente selecionada.
A velocidade de propagação da chama obtida através das imagens
adquiridas pela câmera de alta velocidade é igual a velocidade de chama
estirada em relação aos gases queimados. Para que seja possível relacionar
esta velocidade com a velocidade de chama laminar é necessário empregar

uma modelo que relaciona a velocidade de chama estirada a taxa de
estiramento e a velocidade de chama não-estirada. O modelo utilizado é o
modelo linear, largamente utilizado na literatura e que forneceu bons
resultados.
Desta forma foram feitos experimentos e foi medida a velocidade
de chama laminar para todos os combustíveis (iso-octano, n-heptano, etanol,
gasolina A, gasolina C, surrogate A, e surrogate C).
O surrogate A foi desenvolvido através de uma mistura de 66 %
de iso-octano e 33 % de n-heptano em volume e o surrogate C é resultado da
mistura dentre surrogate A e 27 % de etanol em volume.
Resultados: Os resultados obtidos foram satisfatórios, para as
substâncias puras (iso-octano, n-heptano e etanol) em todos os 5 níveis de
temperaturas testados e todas as razões de equivalência os resultados de
velocidade de chama estiveram de acordo com a literatura revisada. O
parâmetro de dependência com a temperatura para estes combustíveis apesar
da grande incerteza experimental associada, em torno de 10 %, também
mostrou uma boa concordância com a literatura revisada.
Os resultados obtidos com as substâncias puras em comparação
com a literatura revisada, pela boa concordância, possibilitaram a segurança
necessária para se realizar medições com as gasolinas, que são combustíveis
cuja comparação com outros resultados experimentais não é possível devido
a grande diferença de composição.
Como resultados dos experimentos com gasolina A, C e
surrogates A e C, pode-se afirmar que ambos os surrogates modelam com
precisão a velocidade de chama laminar respectiva gasolina, para todas as
faixas de temperatura e também de razão de equivalência testadas, uma vez
que a diferença entre os pontos experimentais nunca foi maior de 2 %. O
parâmetro de dependência da temperatura dos surrogates também teve um
resultado satisfatório uma vez que a diferença entre os valores dos surrogates
e das gasolinas sempre esteve dentro das incertezas experimentais.
Desta forma como uma conclusão geral pode-se afirmar que os
surrogates A e C testados representam com a qualidade esperada a velocidade
de chama laminar da gasolina A e C respectivamente.
Além disso, as equações empíricas para todos os combustíveis
testados também modelaram com grande qualidade os resultados
experimentais obtidos, uma vez que o uso de qualquer equação empírica
resultou em uma diferença de no máximo 4 % do real valor medido para o
combustível em questão.


LIST OF FIGURES
Figure 2-1 – Explosion limits ...................................................................... 36 Figure 2-2 – Schematic of the classification of flame type ......................... 39 Figure 2-3 – Flame front propagation. ........................................................ 40 Figure 2-4 – Representation of the flame in the CVR. ................................ 41 Figure 2-5 - Mallard–Le Chatelier description of the temperature in a laminar
flame wave. ................................................................................................. 45 Figure 2-6 – Control volume and boundary conditions for the Spalding’s
model for flame speed ................................................................................. 47 Figure 2-7 – Influence of equivalence ratio on laminar flame speed. ......... 50 Figure 2-8 - Influence of unburnt mixture temperature on laminar flame
speed. .......................................................................................................... 51 Figure 2-9 - Influence of unburnt mixture temperature on laminar flame
speed. .......................................................................................................... 52 Figure 2-10 – Categorization of flame speed measurement experiments.... 54 Figure 2-11 - Schematic diagram of the reactor developed by Metghalchi and
Keck. ........................................................................................................... 57 Figure 2-12 - Experimental apparatus used by Eisazadeh-Far (2010). ....... 58 Figure 2-13 – Diagram of a simple Schlieren system. ................................ 59 Figure 2-14 – Differences of knife-edge positions and forms in Schlieren
imaging: (a) Circular knife-edge; (b) Vertical knife-edge; (c) Horizontal
knife-edge. .................................................................................................. 61 Figure 2-15 – Representation of a typical Z-type Schlieren arrangement. .. 62 Figure 2-16 – Coma aberration representation. ........................................... 62 Figure 2-17 - Astigmatism aberration representation. ................................. 64 Figure 3-1 – Exploded view of the CVR’s main components. .................... 71 Figure 3-2 – Air filling system schematic. .................................................. 73 Figure 3-3 - Evacuation system schematic. ................................................. 73 Figure 3-4 - Dimensions of the optical system............................................ 75 Figure 3-5 – Optical system photo. 1- punctual light source; 2 and 4- spherical
mirrors; 3- CVR; 5- cutting edge; 6- camera. ............................................. 76 Figure 3-6 – Experimental apparatus. ......................................................... 76 Figure 3-7 – Pressure and flame radius data. .............................................. 79 Figure 3-8 – Stretched flame speed versus strech rate. ............................... 80 Figure 3-9 – Selected data for linear regression. ......................................... 81 Figure 4-1– Spherical flame evolution. N-heptane at Tu= 398 K. ............... 86 Figure 4-2 – Comparison for extrapolation of the third degree and exponential
fitting curves for laminar flame speed as a function of equivalence ratio. .. 87 Figure 4-3 – Comparison of wrinkle in flames. Tu = 398 K; ϕ = 1.4 rf = 50
mm. (a) n-hepthane; (b) gasoline A; (c) iso-octane; (d) ethanol. ................ 89

Figure 4-4 – Results of laminar flame speed of n-heptane versus equivalence
ratio at 298 K. .............................................................................................. 90 Figure 4-5 – Results of laminar flame speed of n-heptane versus equivalence
ratio at 323 K. .............................................................................................. 90 Figure 4-6– Results of laminar flame speed of n-heptane versus equivalence
ratio at 348 K. Other references measured at different temperatures. ......... 91 Figure 4-7– Results of laminar flame speed of n-heptane versus equivalence
ratio at 373K. ............................................................................................... 91 Figure 4-8– Results of laminar flame speed of n-heptane versus equivalence
ratio at 398 K. .............................................................................................. 92 Figure 4-9 – Laminar flame speed versus unburned mixture temperature. . 94 Figure 4-10 – Temperature dependence parameter versus equivalence ratio
for n-heptane. .............................................................................................. 95 Figure 4-11 - Deviation in percentage of the flame speed measured values
from the flame speed calculated values using the global fitting curve versus
normalized equivalence ratio for n-heptane. ............................................... 96 Figure 4-12 – Results of laminar flame speed of iso-octane versus
equivalence ratio at 298 K. .......................................................................... 98 Figure 4-13 – Results of laminar flame speed of iso-octane versus
equivalence ratio at 323 K. .......................................................................... 98 Figure 4-14– Results of laminar flame speed of iso-octane versus equivalence
ratio at 348 K. .............................................................................................. 99 Figure 4-15– Results of laminar flame speed of iso-octane versus equivalence
ratio at 373K. ............................................................................................... 99 Figure 4-16– Results of laminar flame speed of iso-octane versus equivalence
ratio at 398 K. ............................................................................................ 100 Figure 4-17 – Laminar flame speed versus unburned mixture temperature for
iso-octane. ................................................................................................. 102 Figure 4-18 – Temperature dependence parameter versus equivalence ratio
for iso-octane. ............................................................................................ 103 Figure 4-19 - Deviation in percentage of the flame speed measured values
from the flame speed calculated values using the global fitting curve versus
normalized equivalence ratio for iso-octane. ............................................. 104 Figure 4-20– Results of laminar flame speed of ethanol versus equivalence
ratio at 348 K. ............................................................................................ 105 Figure 4-21– Results of laminar flame speed of ethanol versus equivalence
ratio at 373K. ............................................................................................. 105 Figure 4-22– Results of laminar flame speed of ethanol versus equivalence
ratio at 398 K. ............................................................................................ 106 Figure 4-23 – Laminar flame speed versus unburned mixture temperature for
ethanol. ...................................................................................................... 107 Figure 4-24 – Temperature dependence parameter versus equivalence ratio
for ethanol. ................................................................................................ 108

Figure 4-25 - Deviation in percentage of the flame speed measured values
from the flame speed calculated values using the global fitting curve versus
normalized equivalence ratio for ethanol. ................................................. 109 Figure 4-26– Results of laminar flame speed of gasoline A and surrogate A
versus equivalence ratio at 373 K. ............................................................ 110 Figure 4-27– Results of laminar flame speed of gasoline A and surrogate A
versus equivalence ratio at 398 K. ............................................................ 111 Figure 4-28– Results of laminar flame speed of gasoline A and surrogate A
versus equivalence ratio at 408 K. ............................................................ 111 Figure 4-29 – Laminar flame speed versus unburned mixture temperature for
gasoline A. ................................................................................................ 114 Figure 4-30– Laminar flame speed versus unburned mixture temperature for
surrogate A. ............................................................................................... 114 Figure 4-31 – Temperature dependence parameter versus equivalence ratio
for gasoline A and surrogate A. ................................................................ 116 Figure 4-32 - Deviation in percentage of the flame speed measured values
from the flame speed calculated values using the global fitting curve versus
normalized equivalence ratio for gasoline A. ............................................ 117 Figure 4-33 - Deviation in percentage of the flame speed measured values
from the flame speed calculated values using the global fitting curve versus
normalized equivalence ratio for surrogate A. .......................................... 118 Figure 4-34– Results of laminar flame speed of gasoline C and surrogate C
versus equivalence ratio at 373 K. ............................................................ 119 Figure 4-35– Results of laminar flame speed of gasoline C and surrogate C
versus equivalence ratio at 398 K. ............................................................ 119 Figure 4-36– Results of laminar flame speed of gasoline C and surrogate C
versus equivalence ratio at 408 K. ............................................................ 120 Figure 4-37 – Laminar flame speed versus unburned mixture temperature for
gasoline C.................................................................................................. 122 Figure 4-38– Laminar flame speed versus unburned mixture temperature for
surrogate C. ............................................................................................... 122 Figure 4-39 – Temperature dependence parameter versus equivalence ratio
for gasoline C and surrogate C. ................................................................. 124 Figure 4-40 - Deviation in percentage of the flame speed measured values
from the flame speed calculated values using the global fitting curve versus
normalized equivalence ratio for gasoline C. ............................................ 125 Figure 4-41 - Deviation in percentage of the flame speed measured values
from the flame speed calculated values using the global fitting curve versus
normalized equivalence ratio for surrogate C. .......................................... 126 Figure 4-42 – Comparison of laminar flame speed versus equivalence ratio
of all tested fuels at 398 K......................................................................... 127


LIST OF TABLES
Table 2-1 – Literature review on n-heptane and iso-octane flame speeds
measurements. ............................................................................................. 67 Table 2-2 – Content of ethanol in gasoline worldwide. Volume fraction. .. 68 Table 2-3 – Literature review on ethanol flame speeds measurements. ..... 69 Table 3-1 – Initial parameters of example experiment. ............................... 79 Table 3-2 – Results of the linear regression parameters. ............................. 81 Table 3-3 – Results and inputs of the equilibrium calculation. ................... 82 Table 3-4 – Variables relevant to flame speed determination and
corresponding uncertainties. ....................................................................... 83 Table 4-1 – Parameters of Equation (4.1) for n-heptane. ............................ 93 Table 4-2– Parameters of Equation (4.2) for n-heptane. ............................. 93 Table 4-3 – Parameters of Equation (4.3) for n-heptane. ............................ 94 Table 4-4 - Differences for utilizing the average or the quadratic function for
the temperature dependence parameter. ...................................................... 97 Table 4-5– Parameters of Equation (4.1) for iso-octane. .......................... 101 Table 4-6– Parameters of Equation (4.2) for iso-octane. .......................... 101 Table 4-7 – Parameters of Equation (4.3) for iso-octane. ......................... 102 Table 4-8– Parameters of Equation (4.1) for ethanol. ............................... 106 Table 4-9– Parameters of Equation (4.2) for ethanol. ............................... 107 Table 4-10 – Parameters of Equation (4.3) for ethanol. ............................ 108 Table 4-11– Parameters of Equation (4.1) for gasoline A. ........................ 112 Table 4-12– Parameters of Equation (4.2) for gasoline A. ........................ 112 Table 4-13– Parameters of Equation (4.1) for surrogate A. ...................... 113 Table 4-14– Parameters of Equation (4.2) for surrogate A. ...................... 113 Table 4-15 – Parameters of Equation (4.3) for gasoline A. ....................... 115 Table 4-16 – Parameters of Equation (4.3) for surrogate A. ..................... 115 Table 4-17– Parameters of Equation (4.1) for gasoline C. ........................ 120 Table 4-18– Parameters of Equation (4.2) for gasoline C. ........................ 120 Table 4-19– Parameters of Equation (4.1) for surrogate C. ...................... 121 Table 4-20– Parameters of Equation (4.2) for surrogate C. ...................... 121 Table 4-21 – Parameters of Equation (4.3) for gasoline C. ....................... 123 Table 4-22 – Parameters of Equation (4.3) for surrogate C. ..................... 123


SYMBOL LIST
SYMBOL Description Unity
(A/F) Air/fuel rate -
(A/F)stoic Stoichiometric air/fuel rate -
(F/A) Fuel/air rate -
(F/A) stoic Stoichiometric fuel/air rate -
[f] Volumetric molar concentration of fuel mol/m3
[O] Volumetric molar concentration of oxidizer mol/m3
A Area m2
a Constant of the cubic fitting curve m/s
b Constant of the cubic fitting curve m/s
c Constant of the cubic fitting curve m/s
c0 Light speed in vacuum m/s
cp Specific heat at constant pressure J/(kgK)
CVR Constant volume reactor -
D Mass diffusivity m2/s
d Constant of the cubic fitting curve m/s
E Expansion factor -
e Constant of the quadratic fitting curve -
EA Activation energy J/mol
f Constant of the quadratic fitting curve -
g Constant of the quadratic fitting curve -
k Thermal conductivity W/(mK)
Lb Markstein length of the unburned mixture m
Le Lewis number -
ma Mass of air kg
mf Mass of fuel kg
�̇� Mass flow rate kg/s
𝐦′′̇ Mass flow rate per area kg/(m2s)
MMa Molecular mass of air kg/mol

n Refractive index -
na Air mol number mol
Nc Number of carbon atoms in the elementary
molecular formula -
nf Fuel mol number mol
NH Number of hydrogen atoms in the elementary
molecular formula -
NO Number of oxigen atoms in the elementary
molecular formula -
P Pressure Pa
P0 Pressure of the reference state Pa
Pu Pressure of the unburned mixture Pa
R2 Adjusted R squared -
rf Flame radius m
rM Reactant limiting layer m
rT Thermal limiting layer m
Ru Universal gas constant J/(molK)
SL Unstretched laminar flame speed in relation to the
unburned mixture m/s
SL,b Unstretched laminar flame speed in relation to the
burned mixture m/s
SL,u Unstretched laminar flame speed in relation to the
unburned mixture m/s
SL0 Laminar flame speed at reference state m/s
Sn,b Stretched laminar flame speed in relation to the
burned mixture m/s
Sn,u Stretched laminar flame speed in relation to the
unburned mixture m/s
t Time s
T Temperature K
T0 Temperature of the reference state K
Tb Temperature of the burned mixture K
Ti Temperature of ignition K
Tu Temperature of the unburned mixture K
u Standard uncertainty -

ub Velocity of the burned mixture m/s
uu Velocity of the unburned mixture m/s
VCVR Volume of the CVR m3
x7H16 n-heptane molar fraction -
xC8H18 iso-octane molar fraction -
xO2 Oxygen molar fraction -
Ydil Mass fraction of diluent -
Yf Mass fraction of fuel -
YO Mass fraction of oxidizer -
YP Mass fraction of products -
α Temperature dependence parameter -
αT Thermal diffusivity m2/s
�̅� Average temperature dependence parameter -
β Pressure dependence parameter -
δ Reaction zone thickness m
Δ
Average of the deviation in percentage of the
flame speed measured values from the flame speed
calculated values using the global fitting curve and
quadratic equation for the temperature dependence
parameter
%
Δhc Heat of combustion J
ε
Average of the deviation in percentage of the
flame speed measured values from the flame speed
calculated values using the global fitting curve and
average for the temperature dependence parameter
%
η Constant of the exponential fitting curve -
θ angle º
κ Stretch rate s-1
ν Mass ratio of oxidizer and fuel -
ξ Constant of the exponential fitting curve -
ρb Density of the burned mixture kg/m3
ρu Density of the unburned mixture kg/m3
σ Constant of the exponential fitting curve -
τc Chemical time s

τt Thermic time s
ϕ Equivalence ratio -
ω Constant of the exponential fitting curve m/s
�̇� Reaction rate mol/(m3s)
�̅� Mean reaction rate mol/(m3s)

TABLE OF CONTENTS
1 INTRODUCTION .......................................................................... 27 1.1 MOTIVATION .................................................................................... 27 1.1.1 Biofuels .......................................................................................... 28 1.1.2 Vehicular energetic efficiency ........................................................ 30 1.2 OBJECTIVES ..................................................................................... 32 1.2.1 General objectives .......................................................................... 32 1.2.2 Specific objectives .......................................................................... 32 2 LITERATURE REVIEW ............................................................... 34 2.1 DEFINITIONS.................................................................................... 34 2.1.1 Combustion and equivalence ratio.................................................. 34 2.1.2 Explosion and flammability limits ................................................. 35 2.1.3 Flame and basic flame types ........................................................... 38 2.1.4 Laminar flame speed and stretch rate ............................................. 40 2.2 LAMINAR FLAME SPEED................................................................... 44 2.2.1 Mallard and Le Chatelier’s model .................................................. 44 2.2.2 Spalding’s Model............................................................................ 46 2.2.3 Governing elements of flame speed ............................................... 49 2.2.4 Empiric formulations for flame speed modeling ............................ 52 2.3 FLAME SPEED MEASUREMENTS ....................................................... 53 2.4 CONSTANT VOLUME REACTOR ........................................................ 55 2.4.1 Bradley and Hundy (1971) – Leeds University .............................. 56 2.4.2 Metghalchi and Keck (1980) – MIT ............................................... 56 2.4.3 Eisazadeh-Far (2010) - Northeastern University ............................ 57 2.4.4 The Schlieren optic method ............................................................ 58 2.4.5 Optic Method .................................................................................. 64 2.5 FUELS AND BIOFUELS ...................................................................... 66 2.5.1 Gasoline and surrogates .................................................................. 66 2.5.2 Biofuels .......................................................................................... 68 3 MATERIALS AND METHODS ................................................... 71 3.1 EXPERIMENTAL APPARATUS ............................................................ 71 3.1.1 Constant volume reactor ................................................................. 71 3.1.2 Filling system ................................................................................. 72 3.1.3 Evacuation system .......................................................................... 73 3.1.4 Data acquisition and sensors system............................................... 74 3.1.5 Ignition system ............................................................................... 74 3.1.6 Optical system ................................................................................ 75 3.2 EXPERIMENTAL PROCEDURE ......................................................... 76 3.2.1 Step-by-step experimental procedure ............................................. 77 3.3 METHOD TO CALCULATE THE LAMINAR FLAME SPEED .......... 77 3.3.1 Equivalence ratio ............................................................................ 77 3.3.2 Flame speed calculation example ................................................... 78

3.3.3 Determination of uncertainties ........................................................ 82 3.4 COMPOSITION OF THE SURROGATE .................................................. 83 4 RESULTS ....................................................................................... 85 4.1 N-HEPTANE ..................................................................................... 89 4.2 ISO-OCTANE .................................................................................... 97 4.3 ETHANOL ....................................................................................... 104 4.4 GASOLINE A AND SURROGATE A ................................................... 110 4.5 GASOLINE C AND SURROGATE C ................................................... 118 5 CONCLUSIONS .......................................................................... 128 BIBLIOGRAPHIC REFERENCE ............................................................ 131 APPENDIX A - Effects of stretch and Lewis number on spherical
flame……………………………………………...……………………....137
APPENDIX B – Uncertainty analysis………………………………….....142
APPENDIX C - Detailed step-by-step experimental procedure…..….......146

27
1 INTRODUCTION
1.1 MOTIVATION
The study of combustion is of great importance in our society. In
just one quick look around, one can realize the huge quantity of machines
operating through combustion that sustain our life style. According to the
Brazilian Energy Balance 2014 (2014), 82% of total primary energy
consumption (electricity and fuels) is generated by means of a combustion
process. This percentage corresponds to approximately 80% of industrial
consumption and almost 100% of the transport sector. If the total amount of
energy produced by combustion processes in Brazil is compared to the annual
amount of electricity produced in a record year by Itaipu Hydroelectric Plant
(in 2013 Itaipu produced an amount of energy equivalent to 8.48 Mtep) it
would be comparable to 28.6 Itaipus. In terms of the amount of fuel
consumed, the production of oil products in domestic refineries amounted to
107.8 Mtep, a value that has increased 6.5% over the previous year. Diesel
and gasoline alone accounted for 39.2% and 20.5%, respectively, of the total.
Besides being the 7th economy, worldwide, Brazil represents only 1.2% of
the world´s energy consumption, giving a dimension of the world energy
consumption produced by combustion. Therefore, our lives depend vastly on
the work and heat harnessed by combustion systems. It is only logical to think
that even a small contribution on the knowledge of combustion can contribute
significantly on enhancing the quality of our life and of our environment.
There is a wide variety of conditions in which the combustion
processes commonly occur, for example, as dictated by the variations of the
amount of fuel and air in the combustible mixture and the mixture initial state,
determined by the fuel type (gas, liquid or solid), temperature, and pressure.
For transportation fuels, the different types of engines, such as alternative
engines and gas turbines, and ignition strategies, such as spark or
compression ignition, are just a few of the possible strategies used to better
explore the heat and work provided by the combustion processes.
In order to understand which strategy is better in each case and to
improve its efficiency, it is necessary to characterize the parameters of the
combustion that are relevant to the desired engine type. In the engine point of
view, overall parameters, such as, the amount of gas and particulate pollutants
emitted by unit power or distance travelled, the fuel conversion efficiency (a
First-Law efficiency), the engine performance in terms of torque and power
are commonly measured, reported and optimized. The fuels usually have their
thermo-physical properties, such as heat content, vapor pressure, density,
dynamic viscosity and surface tension regulated within somewhat narrow
bands. Besides these one-sided parameters, it is well recognized that

28
parameters that measure the properties for normal combustion and control of
the combustion in the engine are also needed to be quantified in order to
qualify the fuel as a suitable commercial fuel. The most commonly measured
combustion characteristic for alternative internal combustion engines are the
octane number (RON/MON), for the spark ignited engines, and the cetane
number (CN), for the compression ignited engines. These parameters depend
intimately on the formulation of the fuel, i.e., on the relative amount of each
hydrocarbon family present in the fuel formulation. The fuel formulation is
not completely set from design, but is mostly a product of the oil processing
operations that take place in the oil refinery and, as such, may present
variations that depend on the origin of the oil and profitability considerations.
Nevertheless, the final engine parameters must remain within the bounds
established by the regulations.
With the continued tightening environmental regulations imposed,
the great variety of oils being produced word-wide nowadays, the fine tuning
needed to optimize the profitability in the refinery operations, and the
increase in the penetration of biofuels from different origins and submitted to
different processing routes, it has become clear that the classical fuel quality
as expressed by RON/MON, for example, are not enough to distinguish,
predict and optimize engine design, control, and reliability. The fuel industry
and engine manufacturers must rely in combustion characteristics that closely
reproduce the conditions found in the combustion chambers of internal
combustion engines. The combustion characteristics comprise those related
to molecular mixing, ignition, flame or reaction propagation, transition from
a deflagration to a detonation phenomena, flame quenching and ignition.
These phenomena are closely related to properties of the fuel air-mixture,
from which, the detailed path taken by the reactions, or detailed chemical
reaction mechanism, form the most fundamental chemical characteristic.
Since flames are propagating waves, the flow-chemistry interaction form the
most important fundamental physical characteristic.
This work focuses on the flame propagation after initiated by an
electrical spark, a condition found in spark ignited internal combustion
engines. Therefore, flame initiation and propagation are the important
combustion characteristic to be measured and analyzed. A secondary aspect
is on the effect that biofuels exert in the combustion characteristic of oil
derived fuels.
1.1.1 Biofuels
The main driving force to increase the use of biofuels is that they
are renewable, something like liquid solar energy. Depending on how they
are produced, they contribute very little to carbon emissions and climate
change. According to IPCC (2014), in 2004 road transport accounted for 74%

29
of total CO2 transport emissions, which in turn represents 23% of the world’s
energy-related CO2 emissions. Biofuels could mitigate a significant fraction
of these emissions. Another benefit of the use of biofuels is their effect in
creating local value chains since their production is more evenly distributed
over the planet than that of fossil fuels. For countries with limited availability
of oil, they are a strategic option as well.
The idea of using biofuels, specially ethanol, as an automotive fuel
is not new, but in fact it remounts to the very beginnings of the use of internal
combustion engines (ICE). In 1826, Samuel Morey used ethanol in his early
ICEs prototypes, as also did Nikolaus Otto, in 1860. Henry Ford introduced,
in 1908, an ethanol adjusted carburetor for the “T” Model, and stated to the
New York Times, in 1925, that ethanol was “the fuel of the future”. Brazil is
currently the country with the largest fleet fueled by ethanol, the first car
reported as running on ethanol was a Ford that in 1925 ran for 230 km using
hydrated ethanol with a percentage of water as high as 30%. PAGLIUSO
(2010). According to the Brazilian Automotive Manufacturer Nacional
Association ANFAVEA (2014), 75% of the 2.8 millions of light duty
vehicles produced in 2012 run with both gasoline or ethanol and any mixture
of both fuels and the country produces about 17 million cubic meters of
ethanol per year.
Biogasoline can be understood as a liquid fuel for spark-ignited
engines obtained from biomass, either vegetal or animal, as well as from
waste. Alcohols, mainly ethanol, are by far the most used biofuel.
Fermentation and distillation are the most frequently used processes for the
production of biofuel. Several crops can be used, such as sugar cane, corn,
beetroot, wheat, and sorghum. Many other processes aimed at producing
fuels for spark-ignition engines from biomass are under research and
development. ZHAO (2010). A few examples are enzymatic hydrolysis of
cellulosic materials followed by fermentation; microorganisms able to deliver
a diesel-like fuel instead of an alcohol; and conversion of butyric acid
obtained from sugar fermentation to hexane. Other include microorganisms
that could produce ethanol from syngas; blends of glycerol (a by-product of
biodiesel) with propanol, propanediol and gasoline; and even conversion of
dehydrated ethanol to biogasoline. Some of these processes seem promising;
some seem more difficult to be successful. Production of dehydrated ethanol
is energy demanding, in fact dehydration is one of the most important factors
that drops energy efficiency in US corn-based production, taking about 14%
of the gross energy input in the process. Likewise, conversion of dehydrated
ethanol to biogasoline surely takes some extra energy, dropping energy
efficiency even further. Finally, in small fractions, ethanol can be mixed
easily with gasoline without any penalty for the engine and even benefiting
the environment. PAGLIUSO (2010).

30
1.1.2 Vehicular energetic efficiency
Many other technologies, besides biofuels, are developed with the
same goal of improving overall vehicular energy efficiency and reducing
global emissions. The main driving force for this development are the
regulations regarding emissions of greenhouse gases and other pollutants.
One example is the introduction of high-speed direct injection compression
ignition Diesel engines. This technology is the major responsible for the
reduction of the emission of carbon monoxide in Europe in the last decade.
Today it corresponds to approximately half of the cars sold in Western
Europe.
Some of the promising research areas, with the goal of improving
vehicular energetic efficiency are as listed by the US Energy Department
(2015):
Combustion engine research: focuses on improving new
combustion strategies, by improving the efficiency in which the
fuel is burnt. That can greatly improve engine efficiency and
minimize the emissions formation in the engine itself. Some
examples are: low temperature combustion and lean combustion.
Emissions reduction research: focuses on reducing the cost and
improving the efficiency of after treatment technologies that
reduce exhaust emissions. It also has software to help calculate
greenhouse gas and other emissions.
Waste heat recovery research: focuses on improving technology
that converts wasted engine heat into electricity that can power
vehicle accessories and auxiliary loads.
Fuel effects research: focuses on better understanding how fuels
from new sources can affect advanced combustion systems. As an
example: development of detailed kinetics mechanisms, or
characterization of physical/chemical fuel properties. This is the
context in which this work is inserted.
Lubricants research: focuses on improving lubricants that can
improve the fuel efficiency of future and current vehicles in the
fleet.
Idling reduction work: focuses on minimizing unnecessary idling
from vehicles.
Lightweighting research: focuses on lowering the cost and
improving the performance of lightweight materials like high-
strength steel, aluminum, magnesium, and carbon fiber.
Aerodynamics and other parasitic loss research focuses on
reducing the energy lost to non-engine sources such as drag,

31
braking, rolling resistance, and auxiliary loads like air
conditioning.
Improvement in the efficiency in the conversion of fuels to work
has also focused fossil fuels. Even with all the advantages provided by the
biofuels, the combination of high calorific power and low refinery costs, still
makes gasoline the main and most utilized fuel in light duty vehicles in the
world. Pitz, Cernansky, et al. (2007) have highlighted the need of
characterizing complex fuels using simpler surrogates. Computational
combustion modeling is an essential, complementary tool to engine
experiments. The combination of computational fluid dynamics (CFD) and
detailed chemical kinetics provides the opportunity to efficiently optimizing
ICE performance for a given fuel composition. Consequently, computational
chemistry models are needed to represent the combustion of gasoline in
practical devices such as homogeneous charge compression ignition (HCCI)
engines and spark ignited (SI) engines. Unfortunately, it is not currently
possible to represent the complex chemistry of full blend gasolines in a
detailed chemical kinetic model. Not only are the kinetics of all of the
components not well determined, but the chemical kinetic interactions among
them are not fully understood. Moreover, the large number of components
would lead to an unwieldy number of reactions, species, and thermochemical
parameters. Even restricting the number of initial fuel species to be
considered to less than ten results in a very large dimensional chemical
model. In fact the inclusion of complex geometries and transport phenomena
required in an engine combustion model and the available computational
resources limit the number of species that can be considered within engine
combustion codes. While the long-term goal to increase the number of
species considered should remain, there are presently practical reasons to
represent full blend gasoline chemical kinetics with a small number of pure
components.
Within this scenario, this work focus the measurement of laminar
flame speed for gasoline, ethanol, and surrogate mixtures formed by two
components. The laminar flame speed is one of the most essential parameters
for analysis and performance predictions of various combustion engines. The
majority of turbulent combustion models require a knowledge of laminar
flame speed of the fuel/air mixture as a function of equivalence ratio,
temperature, and pressure. Also, reliable experimental data are needed in
order to test and calibrate thermokinetic combustion models which have been
quite successful for combustion predictions of hydrocarbon fuels. GÜLDER
(1984). Laminar flame speed is also important in the design of burners, gas
turbines, and for the prediction of explosions. DIRRENBERGER, GLAUDE,
et al. (2014). Given the importance of this property, the following set of
objectives is proposed for this work.

32
1.2 OBJECTIVES
1.2.1 General objectives
The main objective of this work is to measure the laminar flame
speed of hydrocarbon fuels for spark ignited (SI) engines. The fuels include
ethanol, refinery gasoline, commercial gasoline, a gasoline surrogate, and
mixtures of the surrogate and ethanol.
The measurements are obtained from image analysis of Schlieren
photography of the spherical flame propagation in a Constant Volume
Reactor (CVR).
The measurement conditions are: Initial temperature from 298 K
to 408 K, initial pressure of 100 kPa, and equivalence ratio from 0.8 to 1.3.
These conditions provides a basis for the analysis of the combustion in spark
ignited internal combustion engines.
1.2.2 Specific objectives
In order to accomplish the general objective, a set of specific
objectives are listed:
To compare the measurements obtained in the proposed
experimental set up and method of analysis to results available in
literature as a form of validation. This is made by comparing
measurements of laminar flame speed for n-heptane and iso-
octane, which are primary reference fuels, at initial temperature of
298 K, 323 K, 348 K, 373 K, and 398 K, and equivalence ratio of
0.8; 0.9; 1.0; 1.1; 1.2, and 1.3.
To analyze the behavior of the experimental set-up in respect to
the basics of premixed flame ignition and propagation and to
established the uncertainty related to the measured laminar flame
speeds.
To measure the laminar flame speed of ethanol at the initial
temperatures of 348 K, 373 K, and 398 K, and equivalence ratio
of 0.8; 0.9; 1.0; 1.1; 1.2, and 1.3.
To measure the laminar flame speed of the Brazilian pure gasoline,
known as gasoline A, at the initial temperatures of 373 K, 398 K
and 408 K, and equivalence ratio of 0.8; 0.9; 1.0; 1.1; 1.2 and 1.3.
To measure the laminar flame speed of the Brazilian commercial
gasoline, with 27% of ethanol addition, known as gasoline C, at
the initial temperatures of 373 K, 398 K and 408 K, and
equivalence ratio of 0.8; 0.9; 1.0; 1.1; 1.2 and 1.3.

33
To propose a surrogate for gasoline A formed by a mixture of n-
heptane and iso-octane that emulate the behavior of the laminar
flame speed of the gasoline A, and to measure the laminar flame
speed of the surrogate at the initial temperatures of 373 K, 398 K
and 408 K, and equivalence ratio of 0.8; 0.9; 1.0; 1.1; 1.2 and 1.3.
To propose a surrogate for gasoline C formed by a mixture of n-
heptane, iso-octane, and ethanol that emulate the behavior of the
laminar flame speed of the gasoline C, and to measure the laminar
flame speed of the surrogate at the initial temperatures of 373 K,
398 K and 408 K, and equivalence ratio of 0.8; 0.9; 1.0; 1.1; 1.2
and 1.3.
To discuss the differences among the results of laminar flame
speed obtained for each fuel and surrogate.
The present work is part of a project developed in the Laboratory
for Combustion and Thermal Systems Engineering of the Federal University
of Santa Catarina, LabCET/UFSC, in partnership with PETROBRAS,
entitled “Analysis of the combustion of alternative aviation fuels”. The main
objective of the project is to study characteristics of chemical kinetics,
combustion, and emissions, of hydrocarbons and oxygenated fuels, and its
application to formulations of aviation fuels.

34
2 LITERATURE REVIEW
2.1 DEFINITIONS
In this section, the definitions of the most important variables and
concepts explored in this work are explained.
2.1.1 Combustion and equivalence ratio
Combustion is defined as a “rapid chemical combination of a
substance with oxygen, involving the production of heat and light.” This
definition as given by the Oxford Dictionary emphasizes at first the
importance of chemical reactions in combustion. Also, it emphasizes the
reason why combustion is so important: it converts the energy stored in the
chemical bonds of the atoms in the fuel and the oxidizer into heat, that can be
utilized in a great variety of ways, and harnessed in an engine to produce
work. As a reference, 1 kg of gasoline at 298 K, 100 kPa, contains roughly
43 MJ of internal energy, that, when converted in an elapsed time of 1 s,
would produce 43 MW of thermal energy. This is equivalent to the
consumption of the CFM56-7B27 gas turbine used in the Boeing 737-800.
In a combustion reaction, the amount of oxidizer that will react
completely with the fuel is defined as the stoichiometric quantity of the
oxidizer, it can be expressed in molar or mass basis. In order to exemplify the
application of this concept, take a generic fuel composed by a hydrocarbon
of the type C H , reacting with dry air. The global reaction is represented
by Equation (2.1).
2 2 2 2 23,76 2 3,76C H a O N xCO y H O aN (2.1)
Throughout this paper, dry air will be always taken to have the
composition of 20.939±0.006 % of 2O as determined by Picard, Davis, et
al. (2008), and other gases are represented by nitrogen.
The parameter defined as air-fuel ratio is defined as the proportion
between the masses of air and fuel in the Equation (2.1). Therefore, the air-
fuel ratio is:
4,76
1
a a
stoic f f
m MMA a
F m MM
(2.2)
in Equation (2.2), the subscripts a and f denote air and fuel, m is the mass
in kilograms and MM the molar mass, the parameter a is the same one

35
found in the Equation (2.1). By balancing the Equation (2.1), and substituting
the value of a in Equation (2.2), the air-fuel ratio is determined. As the
Equation (2.1) represents the global equation to complete oxidation of fuel
and consumption of oxygen this air-fuel ratio is denominated stoichiometric
air-fuel ratio, and this is denoted by the subscript stoic .
When the system presents predetermined quantities of fuel and air,
a new parameter is defined in order to quantify this ratio of air and fuel in
relation to the stoichiometric ratio. This parameter is the equivalence ratio
:
1
4,76stoic
f f
a astoic
f
a
n MMA
n MMF A
A MM
F A a M
F
M
F
(2.3)
where n is the number of moles. Therefore, when 1 , the mixture in
question is composed by a greater fuel-air ratio then the stoichiometric
mixture would be, thus it is denominated a fuel rich mixture, or simply “rich”,
while a value of 1 represents a mixture composed by a lesser fuel-air
ratio then its stoichiometric counterpart, thus it is denominated a fuel lean
mixture, or simply “lean”. Finally a mixture where 1 is denominated a
stoichiometric mixture.
Besides the composition, for a chemical reaction to happen, the
reagent system must be submitted to specific thermodynamic conditions of
temperature and pressure that will activate the initiation reactions by
overcoming the activation energy. This is explored next.
2.1.2 Explosion and flammability limits
Mixtures of hydrocarbons and oxygen react very slowly at
temperatures below 200°C. As the temperature increases, a variety of
oxygen-containing compounds begin to form. GLASSMAN and YETTER
(2008). As the temperature is increased further, CO and H2O begin to
predominate in the products and H2O2 (hydrogen peroxide), CH2O
(formaldehyde), CO2 , and other compounds begin to appear. At 300–400°C,
a faint light often appears, and this light may be followed by one or more blue
flames that successively traverse the reaction vessel. These light emissions
are called cool flames and can be followed by an explosion.
At temperatures around 300–400°C and slightly higher, explosive
reactions in hydrocarbon–air mixtures can take place. Thus, explosion limits

36
exist in hydrocarbon oxidation. A general representation of the explosion
limits of hydrocarbons is shown in Figure 2-1.
Figure 2-1 – Explosion limits
Source: GLASSMAN and YETTER (2008)
Understanding the existence and features of the explosion limits is
important in this study, this problem is described as discussed by Glassman
and Yetter (2008).
When the thermal conditions for point 1 exist, some oxidation
reaction begins; thus, some heat must be released. If the experimental
configuration is assumed to be non-adiabatic then the heat of reaction is
dissipated infinitely fast and the temperature remains at its initial value. As
a result steady reaction prevails and a slight pressure rise is observed. When
conditions such as those at point 2 prevail, the rate of chain carrier generation
exceeds the rate of chain termination; hence the reaction rate becomes
progressively greater, and subsequently an explosion, or, in the context here,
ignition occurs.
Generally, pressure is used as a measure of the extent of reaction,
although, of course, other measures can be used as well. The sensitivity of
the measuring device determines the point at which a change in initial
conditions is first detected. Essentially, this change in initial conditions
(pressure) is not noted until after some time interval and such interval can be
related to the time required to reach degenerate branching stage or some other
stage in which chain branching begins to affect overall reaction. This time
interval is considered to be an induction period and to correspond to the
ignition event. This induction period will vary considerably with temperature
thus an increase in temperature increases the rates of the reactions leading to
branching, thereby shortening the induction period. The isothermal events
discussed in this paragraph essentially define chemical chain ignition.

37
Now if one begins at conditions similar to point 1—except that the
experimental configuration is adiabatic—the reaction will self-heat until the
temperature of the mixture moves the system into the explosive reaction
regime. This type of event is called two-stage ignition and there are two
induction periods, or ignition times, associated with it.
The first stage is associated with the time (τc , chemical time) to
build up to the degenerate branching step or the critical concentration of
radicals or other chain carriers, and the second (τt , thermal time) is associated
with the subsequent steady reaction step and it is the time until the system
reaches thermal explosion (ignition) condition. Generally, τc > τt.
If the initial thermal condition begins in the chain explosive
regime, such as point 2, the induction period τc still exists; however, there is
no requirement for self-heating, so the mixture immediately explodes. In
essence, τt → 0.
In many practical systems, one cannot distinguish the two stages
of ignition process since τc > τt; thus the time that one measures is
predominantly the chemical induction period.
Sometimes point 2 will exist in the cool-flame regime. Again, the
physical conditions of the non-adiabatic experiment can be such that the
passage of the cool flame can raise the temperature so that the flame condition
moves from a position characterized by point 1 to one characterized by point
4. This phenomenon is also called two-stage ignition. The region of point 4
is not a chain branching explosion, but a self-heating explosion. Again, an
induction period τc is associated with the initial cool-flame stage and a
subsequent time τt is associated with the self-heating aspect.
If the reacting system is initiated under conditions similar to point
4, pure thermal explosions develop and these explosions have thermal
induction or ignition times associated with them.
It is the spark at the center of the reactor that is responsible for
taking the system from a steady condition such as point 1, to a condition
where thermal explosion is developed, such as point 4. This ignition form,
spark ignition, is called forced ignition and there is a minimum ignition
energy concept attached to its notion, which will be discussed later on.
The concept of flammability is related to the composition of the
unburned gas mixture as explained by Turns (1996).
Experiments show that a flame will propagate only within a range
of mixture strengths between the so-called lower and upper limits of
flammability. The lower limit is the leanest mixture < 1 that will allow
steady flame propagation, while the upper limit represents the richest mixture
> 1.
Ignition can occur in mixtures above or under the flammability
limits, but no flame propagation is observed. Such phenomena occurs

38
because the flame does not release enough heat thus the generation of chain
carriers is lower than the rate of chain termination. As a result the flame cools
and extinguishes.
Although flammability limits are physicochemical properties of
the fuel-air mixture, experimental flammability limits are related to heat
losses from the system, in addition to the mixture properties, and, hence, are
generally ‘apparatus dependent’. Even if conduction losses are minimal,
radiation losses can account for the existence of flammability limits Turns
(1996).
2.1.3 Flame and basic flame types
A flame is defined by Turns (1996), as “a self-sustaining
propagation of a localized combustion zone at subsonic velocities”. It is
important to highlight some keywords of this definition. First, the flame must
be “self-sustaining” that means, the reaction must generate sufficient heat to
“pre-heat” the reactant’s mixture to a point where the rate of chain carrier
generation exceeds the rate of chain termination. Second, flame must be
localized; that is, the flame occupies only a small portion of the combustible
mixture at any instant. The third key word is subsonic. A discrete combustion
wave that travels subsonically is termed a deflagration. It is also possible for
combustion waves to propagate at supersonic velocities. Such a wave is
called a detonation. The fundamental propagation mechanisms are different
in deflagrations and detonations therefore these are distinct phenomena.
Detonations are beyond the scope of this work.
At this point, this definition of flame is sufficient. Further
complementation to the definition of the flame, like its modeling, regions,
and velocity are discussed later on.
Flames are typically divided in two types regarding the sort of fuel
and oxidizer mixing: premixed flames and nonpremixed flames. Each one of
these two types are further characterized regarding the fluid motion: laminar
and turbulent.

39
Figure 2-2 – Schematic of the classification of flame type
Source: WARNATZ, MAAS and DIBBLE (2006).
As described by Glassman and Yetter (2008), in nonpremixed
flames the mixing rate of fuel and oxidizer is slow relative to the reaction rate
thus the mixing controls the burning rate. The fuel and oxidizer come
together in a reaction zone through molecular and/or turbulent diffusion. The
fuel may be in the form of a gaseous jet or in condensed medium (either liquid
or solid), and the oxidizer may be a flowing gas stream or the quiescent
atmosphere. The distinctive characteristic of a diffusion flame is that the
burning (or fuel consumption) rate is determined by the rate at which the fuel
and oxidizer are brought together in proper proportions for reaction.
In a premixed flame, as the name suggests, fuel and oxidizer are
mixed to a molecular level prior to the existence of the flame. If an ignition
source applied locally raises the temperature substantially, or causes a high
concentration of radicals to form, a flame will propagate through the gaseous
mixture.
The Figure 2-2 presents a schematic of this classification, and
practical examples of where each type of flame is found. Although it is
difficult to observe a single type of flame in most practical machines, there is
a governing regime, and in laboratory conditions these regimen are studied.
For instance, in a spark-ignition engine, turbulent premixed flame is
dominant but detonation can also occur. In addition, in compression-ignition
engines, turbulent nonpremixed flames are dominant but premixed flames
also play an important role.
This work presents a study of premixed laminar flames that are
created inside a Constant Volume Reactor (CVR), and initiated by a spark.

40
These flames are produced and optically probed to evaluate laminar flame
speed. As the flame grows, in specific cases, transition to turbulent regimen
such as wrinkled or corrugated flames may occur. Such cases will be
discussed in ensuing chapters.
2.1.4 Laminar flame speed and stretch rate
When a premixed gaseous fuel–oxidizer mixture within the
flammability limits is contained in a long tube, with both ends opened, a
combustion wave will propagate down the tube if an ignition source is applied
at one end. The velocity of this wave is controlled by transport processes,
mainly simultaneous heat conduction and diffusion of radicals. In this
propagating combustion wave, subsequent reaction, after the ignition source
is removed, is induced in the layer of gas ahead of the flame front by thermal
and mass transport.
The flame velocity, or laminar flame speed, is more precisely
defined by Glassman and Yetter (2008) as “the velocity at which unburned
gases move through the combustion wave in the direction normal to the wave
surface” in laminar flow. Therefore, if the wave propagating in the tube cited
in the beginning of the section is completely planar, and do not loose heat to
the walls of the tube, it will propagate at the laminar flame speed. The Figure
2-3 represents the flame front propagating at the laminar flame speed.
Figure 2-3 – Flame front propagation.
Source: GLASSMAN and YETTER (2008)
The laminar flame speed, denoted by LS , (where S stands for
“flame speed” and the subscript L for “unstretched and laminar”) is a
physical/chemical characteristic of reactants (fuel and equivalence ratio) and
initial conditions of temperature and pressure.
In the context of the CVR, some considerations must be made. The
speed in which the flame moves in the CVR experiment differs from the ideal
experiment in two characteristics. First, the flame in the CVR is stretched,
and second, the burned gas mixture expands in a region confined by the flame
therefore ‘masking’ the real laminar flame speed. There are means to deal
with both problems and the solution of the latter will aid in identifying some
of the major characteristic of the flame and of the CVR experiment.

41
The CVR is a closed vessel where a spherical flame propagates
radially from the center towards the walls. We exclude the initial flame
development, where the flame growth is still governed by the spark, and also
the moment where the flame front interacts with the wall increasing the
pressure (and temperature) of the unburned gas due to adiabatic compression.
These boundaries are used at all times in this work regarding laminar flame
speed calculations and modeling. Furthermore, in this particular discussion,
effects of flame curvature and stretching are ignored. The Figure 2-4 is a
representation of the flame in the CVR’s chamber.
Figure 2-4 – Representation of the flame in the CVR.
This model is presented by Peters (2000). The propagation
velocity fdr dt , defined as the temporal variation of the radius of the
spherical flame fr , is captured by the high speed camera that records
images of the flame development. The propagation velocity of the flame front
results from an imbalance of the flow velocity of the mixture and the flame
speed. Therefore, the propagation velocity in respect to a coordinate system
fixed in the reactor is:

42
,
f
u n u
dru S
dt (2.4)
,
f
b n b
dru S
dt (2.5)
where u is the velocity of the mixture in respect to a coordinate system fixed
in the reactor, and the subscripts u and b correspond to unburnt and burnt
mixtures. The laminar flame speed is therefore the flow velocity relative to a
control volume that moves with the flame front. The subscript n stands for
stretched denoting that the flame is not planar, therefore: stretched.
In a moving reference, attached to the flame, the balance of mass
flux through the flame front is:
f f
u u b b
dr dru u
dt dt
(2.6)
where is the density of the mixture. In this case of a laminar spherical
flame, the flow velocity bu of the burnt gas behind the flame front is zero,
due to symmetry. Then, Equation (2.6) yields:
f u b
u
u
dru
dt
(2.7)
Equation (2.7) states that the unburnt mixture velocity is induced
by gas expansion within the flame front.
Recognizing that 0bu , in Equation (2.5):
,
f
n b
drS
dt (2.8)
which leads to the conclusion that the propagation velocity captured by the
camera is equal to the stretched flame speed in relation to the burned mixture.
Working with Equations (2.4) and (2.7), it is found that:
, ,
b
n u n b
u
S S
(2.9)
Which means that stretched flame speed in relation to the unburned mixture
is equal to the stretched flame speed in relation to the burned mixture divided
by the expansion factor. The expansion factor is defined by:

43
u
b
E
(2.10)
Note that the fact that the flame is stretched never interfered in the
model, and it is possible to affirm that unstretched flame speed in relation to
the unburned mixture is equal to unstretched flame speed in relation to the
burned mixture divided by the expansion factor. That is:
,
,
L b
L u
SS
E (2.11)
A fundamental element of this example is that the flame is planar,
if the flame is concave, convex, spherical, or in any other form, the
propagation velocity is affected by stretch. The stretch rate acting on the
flame is defined as:
(ln ) 1d A dA
dt A dt (2.12)
where is the stretch rate of the flame and A is the surface area of the flame.
In the case studied in this work of a laminar spherical flame, then: 24A r
and the stretch rate is:
2
2
(4 )1 2
4
f f
f f
d r dr
r dt r dt
(2.13)
where fr is the radius of the flame at a given instant of time
To obtain the unstretched flame speed in relation to the burned
mixture, it is necessary to use models to correlate ,L bS , ,n bS and the stretch
rate . This is explored in the next sections of this work.
As the “unstretched laminar flame speed in relation to the
unburned mixture” is the main subject of study of this work, the subscript u, in this specific case, may, for the sake of simplicity, be suppressed. The
notation is then the one already pointed: LS .
This concludes the section (2.1): definitions. Some further
properties and physical variables that need definition are defined in the
context where they are inserted.
The following section, entitled “Laminar flame speed” advances
the topic, and treats about the physical and chemical structure of the flame,
models for the flame speed and physical variables that govern its behavior.

44
2.2 LAMINAR FLAME SPEED
Initial theoretical analyses for the determination of the laminar
flame speed fell into three categories: thermal theories, diffusion theories, and
comprehensive theories. The historical development followed approximately
the same order. Thermal theories for modeling laminar flame speeds initiate
at the mass and energy conservation equations. These first models are very
restrictive, and unfortunately cannot be used as a predictive tool, but they
offer basic insights to understand most primary principles that govern
laminar flame propagation.
Glassman and Yetter (2008) writes about the evolution of these
models. Thermal theories date back to Mallard and Le Chatelier, who
proposed that it is propagation of heat back through layers of gas that is the
controlling, mechanism in flame propagation. Later, there were
improvements in the thermal theories. Probably the most significant of these
is the theory proposed by Zeldovich. The theory included the diffusion of
molecules as well as heat, but did not include the diffusion of free radicals or
atoms. As a result, their approach emphasized a thermal mechanism and was
widely used in correlations of experimental flame velocities.
The theory was advanced further when it was postulated that the
reaction mechanism can be controlled not only by heat, but also by the
diffusion of certain active species such as radicals.
The theory of particle diffusion was first advanced in 1934 by
Lewis and von Elbe. More recently, rate-ratio asymptotic analyses have been
developed that provide formulas with greater accuracy and further
clarification of the wave structure.
It is easily recognized that any exact solution of laminar flame
propagation must make use of the basic equations of fluid dynamics modified
to account for the liberation and conduction of heat and for changes of
chemical species within the reaction zones.
To begin with, the Mallard and Le Chatelier thermal theory is
explored, as it is approached by Glassman and Yetter (2008).
2.2.1 Mallard and Le Chatelier’s model
To understand the analysis developed by Mallard and Le Chatelier,
first it is necessary to have in mind the temperature distribution that is
established in the combustion process. This distribution is presented in Figure
2-5.

45
Figure 2-5 - Mallard–Le Chatelier description of the temperature in a
laminar flame wave.
Source: GLASSMAN and YETTER (2008)
In Figure 2-5 T is temperature, and the subscripts , , and u b i mean
unburned mixture, burned mixture and ignition, respectively. is the
reaction zone thickness.
Mallard and Le Chatelier stated that heat conducted from zone II
is equal to that necessary to raise the unburned gases to the ignition
temperature (the boundary between zones I and II). If it is assumed that the
slope of the temperature curve is linear. The enthalpy balance then becomes:
(2.14)
is the mass rate of the unburned gas mixture, which is admitted to be
constant, pc is the specific heat at constant pressure, k the thermal
conductivity, and A is the cross-sectional area, taken as unity.
Since the problem as described is fundamentally one-dimensional,
and because the unburned gases enter normal to the wave, this velocity is by
definition, the laminar flame speed. Then the mass flux in Equation (2.14) is:
(2.15)
Substituting Equation (2.15) in Equation (2.14), the expression for
the flame speed obtained by Mallard and Le Chatelier is found:
1
δ
i
L
u up i
bk T TS
c T T
(2.16)

46
Unfortunately, in this expression is not known; therefore, a
better representation is required. Since is the reaction zone thickness, it is
possible to relate to LS . The total rate of mass per unit area entering the
reaction zone must be the mass rate of consumption in that zone for the steady
flow problem being considered. This consideration yields the expression:
(2.17)
where specifies the reaction rate in terms of concentration (in grams per
cubic centimeter) per unit time. Equation (2.16) for flame speed then
becomes:
(2.18)
This expression indicates that laminar flame speed is proportional
to the square root of the product between the thermic diffusivity and the
reaction rate and to the difference of temperatures between the burned gas
mixture and the ignition temperature. The burned gas mixture temperature
can also be interpreted as the adiabatic flame temperature.
The Mallard and Le Chatelier model clearly shows that the
mechanism that promotes the displacement of the flame is the heating of the
reactants by heat conduction from the region of burning. If the adiabatic flame
temperature is increased, so is the heat transfer rate, and by consequence the
flame speed. Therefore, the laminar flame speed is expected to be higher for
equivalence ratios near stoichiometry, where the adiabatic flame temperature
is also higher.
2.2.2 Spalding’s Model
A more recent model was developed by Spalding (1979) and
further explored by Turns (1996). Spalding’s model is restrictive, and does
not provide predictive results with enough quality to be compared with
experimental data. However it reveals and facilitates the understanding of
factors that influence the flame speed, and it includes mass transfer, which
adds more similarity to the real physics of the problem.
The model developed by Spalding begins with a set of hyphotesis:
a. Unidimensional problem; constant cross-sectional area;
Steady state.
b. Kinetic and potential energy, friction, and radiation are
neglected.
c. Pressure is constant

47
d. Mass diffusion is considered binary and modelled by
Fick’s Law; Heat diffusion is modelled by Fourier’s Law.
e. The Lewis Number Le defined as:
T
p
kLe
D c D
(2.19)
is equal 1. T is thermal diffusivity and D is mass diffusivity.
f. The specific heat of each chemical species is equal among
each other, and equal to the mixture.
g. Fuel and oxidizer react in a single step reaction forming
products, following the exothermic reaction:
(1 )f O P (2.20)
where f is the fuel, O the oxidizer, P the product, and the mass
ratio of oxidizer and fuel.
h. All fuel is consumed in the flame.
i. Temperature distribution in the flame is linear.
The control volume and boundary conditions are represented by
Figure 2-6.
Figure 2-6 – Control volume and boundary conditions for the Spalding’s
model for flame speed
Source: TURNS (1996)
The boundary conditions are:

48
0
0
u
b
T x T
dTx
dx
T x T
dTx
dx
(2.21)
Then, the mass conservation equations for the fuel, oxidizer and
product are:
(2.22)
(2.23)
(2.24)
where is the mass flow rate per area unit, , , f O PY Y Y are the mass
fractions of fuel oxidizer and products.
The energy conservation equation, where the condition of unitary
Lewis number is already imposed is:
(2.25)
ch is the heat of combustion of the fuel and can be represented by:
1c p b uh c T T (2.26)
The Equation (2.15) from the Mallard-Le Chatelier’s deduction is
also valid here:
(2.27)
Using Equations (2.22), (2.23), (2.24), (2.25), (2.26), (2.27) and
the boudary conditions (2.21). The solution for the laminar flame speed is
determined:

49
(2.28)
(2.29)
2 T
LS
(2.30)
where is the mean reaction rate, defined as:
(2.31)
Just as Equation (2.18), Equation (2.28) shows clearly which
thermophysical and thermochemical properties influence the laminar flame
speed. It is important to highlight the proportionally inverse relation between
flame speed and flame thickness.
The equations presented in both models are sufficient to
qualitatively predict the behavior of the flame speed in many practical cases,
but they do not predict with precision enough its value, due to difficulties in
calculating the reaction rate for example. Therefore, experimental analysis is
extremely helpful to further understand the role that the thermodynamic
properties play in the laminar flame speed. The following section is about
classical experiments and results obtained with methane flames, which
represents the behavior of the laminar flame speed for most hydrocarbons.
2.2.3 Governing elements of flame speed
In section 2.2.1 the influence of the equivalence ratio on the
laminar flame speed was briefly discussed. Beginning with a lean mixture,
the laminar flame speed increases as the amount of fuel in relation to oxidizer
increases, since there is a larger amount of fuel being oxidized which
increases the adiabatic flame temperature and the reaction rate. As the
equivalence ratio increases so does the flame speed to a maximum value at a
equivalence ratio around 1,1; this is also the point of maximum adiabatic
flame temperature. Then for richer mixtures the laminar flame speed
decreases.
The Figure 2-7 shows experimental data by different authors for
methane at 300 K and 100 kPa plotting laminar flame speed versus
equivalence ratio.

50
Figure 2-7 – Influence of equivalence ratio on laminar flame speed.
Source: TURNS (1996).
Temperature is perhaps the thermodynamic property that
influences the flame speed the most. Some of the reasons were already
explored, as the influence of the adiabatic flame temperature. Analyzing
equation (2.31), it can be inferred that increasing the unburned gas
temperature will increase the mean reaction rate, which will in turn increase
the flame speed. It is also known that the temperature influences
exponentially the rate of reaction, it is often modeled as presented by TURNS
(1996):
(2.32)
Where k is the rate coefficient, expressed by the empirical Arrhenius form:
exp( )A uk A E R T (2.33)
therefore it is expected also an exponential form dependence between flame
speed and temperature.
In Equation (2.33), A is a constant termed pre-exponential factor,
AE is the activation energy, and uR the universal gas constant. In Equation
(2.32), f and O are the volumetric molar concentration of fuel and
oxidizer.
The expected relation between both variables is indeed observed
in experiments as presented in Figure 2-8.

51
Figure 2-8 - Influence of unburnt mixture temperature on laminar flame
speed.
Source: TURNS (1996).
Pressure is also of great importance. As the initial pressure of the
unburned gases is increased, from a fluid mechanics point of view, the
momentum that the flame must overcome in order to continue propagation
also increases, therefore the flame speed is expected to decrease. Also the
pressure influences the density of the unburned mixture, and as it can be
observed by analyzing the equations of the previous section, an increase of
the unburned mixture density results in a decrease of the laminar flame speed.
Experiments developed by Bradley and Andrews (1972) with
methane flames in a CVR demonstrate this negative dependence of the flame
speed regarding initial pressure increase, as shown in Figure 2-9.

52
Figure 2-9 - Influence of unburnt mixture temperature on laminar flame
speed.
Source: TURNS (1996).
Other variables, that are relevant to this work, and affect flame
development are the Lewis number of the unburned mixture and the stretch
rate, discussion about this features may be found in the Appendix A .
The control of these parameters is of essential importance if the
objective is to measure laminar flame speed.
It is of great interest to relate, by means of empirical formulations,
the relation among these three variables and the laminar flame speed.
2.2.4 Empiric formulations for flame speed modeling
With the evolution of experiments, measurements of laminar flame
speed became more precise, and more suitable to explore new conditions, at
unprecedented temperatures and pressure levels, including evaluations for
liquid fuels with high evaporation temperatures. A great amount of data was
obtained thus enabling the proposal of empirical formulations.
Metghalchi and Keck (1980), developed a series of experiments
and proposed flame speed correlations., One of their expressions, which
presented a remarkable agreement with results and has wide application to
this day is the Equation (2.34):
0
0 0
1 2,1 dilL L
T PS S
T PY
(2.34)

53
where the subscript 0 refers to a reference state, usually 298 K and 1 atm.
The exponents and are adjusted by linear regression of experimental
curves, and are expressed as linear or quadratic functions of the equivalence
ratio. 0LS is the laminar flame speed measured in the reference conditions,
expressed as polynomial function of the equivalence ratio. dilY is the mass
fraction of diluent in the fuel-air mixture.
Therefore, by using this expression, it is possible to calculate the
laminar flame speed in any condition of temperature, pressure and
equivalence ratio, as far as the experiments are valid.
A great number of researchers have published works were some
form of the Equation (2.34) is used. It is worth mentioning the recent works
of: BROUSTAIL, SEERSB, et al. (2013); BRADLEY, LAWES and
MANSOUR (2009); KONNOV, MEUWISSEN and GOEY (2011); LIAO,
JIANG, et al. (2007); MANNAA, MANSOUR, et al. (2015); SILEGHEM,
ALEKSEEV, et al. (2013).
2.3 FLAME SPEED MEASUREMENTS
There are several methods to evaluate flame speed. The
experimental configurations are usually divided in two groups: stationary
flames and moving flames. The former group comprises experiments where,
as the name suggests, the flame is stationary to a reference point, the
laboratory, and in the latter group the flame moves in relation to the reference
point, which is usually the ignition point.
These groups may be further divided in six experiments categories:
Conical stationary flames, counter flow method, flat flame method, flames in
tubes, soap bubble method, and constant volume explosion, the latter being
employed in this study. The Figure 2-10 illustrates the different methods

54
Figure 2-10 – Categorization of flame speed measurement experiments.
Source: (a) KOBAYASHI, TAMURA, et al. (1996); (b) QIN, KOBAYASHI
and (2000); (c) VELOO, WANG, et al. (2010); (d) NIEMANN, SESHADRI
and WILLIAMS (2014); (e) WANG, WENG, et al. (2015); (f) KIM,
KATAOKA, et al. (2005); (g) KIM, MOGI and DOBASHI (2013); (h)
LIAO, JIANG, et al. (2007).

55
In a succinct explanation, each method can be described as
follows.
In conical stationary flames gas burns at the mouth of a tube, and
the shape of the Bunsen cone is recorded and measured.
The counter flow method consists in stabilizing a planar flame
between two nozzles, one delivering fuel-air mixture while the other
provides inert gas flow, the axial flow velocities are measured and related to
the laminar flame speed.
The flat flame method consists of placing either a porous metal
disk or a series of small tubes at the exit of the larger flow tube, thus
establishing suitable conditions for flat flames. The flame diameter is
measured, and the area is divided by the volume flow rate of unburned gas,
by doing so the laminar flame speed is determined. GLASSMAN and
YETTER (2008).
In the flames in tubes method, a gas mixture is placed in a
horizontal tube opened at one end; then the mixture is ignited at the open end
of the tube. The rate of progress of the flame into the unburned gas is the
flame speed.
The soap bubble method consists of a gas mixture contained in a
soap bubble and ignited at the center by a spark so that a spherical flame
spreads radially through the mixture. Because the gas is enclosed in a soap
film, the pressure remains constant. The growth of the flame front along the
radius is followed by photographic means. GLASSMAN and YETTER
(2008).
In the constant volume explosion method a premixed mixture of
fuel and air fills a spherical or cylindrical vessel and is ignited by a spark at
the center of the vessel. The evolution of the flame front is observed as well
as the pressure rise. The flame speed may be calculated through
thermodynamic considerations about the pressure curve or by acquisitions of
images of the flame radius evolution. The second method is used in this work.
The design of the reactor was mainly based in previous works
developed by BRADLEY and HUNDY (1971), METGHALCHI and KECK
(1980) and EISAZADEH-FAR (2010). The following section describes in
detail these three works.
2.4 CONSTANT VOLUME REACTOR
The choice of the constant volume reactor among the several other
experiments is based on the fact that the CVR is the most versatile one. It
makes possible measurements of the fluid dynamics of the flame, like
transition to turbulence, corrugated and wrinkled regimen. Studies of
flammability limits, minimal ignition energy, critical radius for flame

56
propagation and detonation are also possible. Laminar flame speed may be
determined by either pressure curve acquisition or optical measurements.
Detailed description of the reactor used is in the materials and
methods section of this work. For further information on the literature review
of the three works described in the following section, the reader may refer to
the work of Hartmann (2014), the author wrote a master’s dissertation on the
mechanical, electrical and data acquisition design of the CVR used to perform
the measurements.
2.4.1 Bradley and Hundy (1971) – Leeds University
Bradley and Hundy developed a pioneer work with laminar flame
speed measurements and constant volume reactors at Leeds University in
1971. The researchers designed a cast steel cylindrical reactor with 304.8 mm
in diameter and 304.8 mm in length. The reactor was equipped with two
rectangular glass windows, with 158.75 mm x 107.95 mm, which allow the
visualization of the reactor’s interior.
Ignition was promoted by capacitor discharge through electrodes
with a 0.635 mm distance. Pressure acquisition is made by a pressure sensor
mounted perpendicular to the vessel’s walls. The reactor was also equipped
with a thermocouple and a hot wire anemometer. Oscilloscopes were used to
record pressure sensor, thermocouple and anemometer data.
Flame visualization was made using reflexive plate interferometer,
similar to the Schlieren method. Images were recorded using a Fastax
rotating-prism high speed camera.
2.4.2 Metghalchi and Keck (1980) – MIT
In 1980 Metghalchi and Keck developed at the Massachusetts
Institute of Technology a constant volume reactor for high temperatures and
pressures.
The experimental apparatus consisted of a spherical reactor with
inner radius of 76.2 mm, and was projected to support pressures up to 70
MPa. Ignition system used a capacitive discharge system and ordinary
automotive spark plugs, where stainless steel electrodes were coupled so that
the spark could be generated in the center of the reactor.
The reactor was placed inside an electric oven and could be heated
up to 500 K. Both gaseous and liquid fuels could be tried. The pressure
acquisition was made with a Kistler® piezoelectric pressure sensor. The time
of flame arrival to the reactor walls was measured by ionization probes
located in three positions over the reactor perimeter.
The Figure 2-11 shows a schematic diagram of the reactor
developed by Metghalchi and Keck.

57
Figure 2-11 - Schematic diagram of the reactor developed by Metghalchi
and Keck.
Source: METGHALCHI and KECK (1980)
2.4.3 Eisazadeh-Far (2010) - Northeastern University
The reactor developed in the Northeastern University is a square
cylindrical SAE4140 steel vessel with inner diameter and length of 133.35
mm. The reactor has two silica windows, and is designed to support pressures
up to 43 MPa and temperatures up to 500 K.
Visualization of the flame is made possible using the “Z-type”
Schlieren, which consists of an arrangement of two spherical mirrors with a
152.4 mm diameter and a 1524 mm focal distance, a punctual light source
and a high-speed camera, with a 40000 frames per second acquisition rate.
The Figure 2-12 is a picture of the experimental apparatus used by Eisazadeh-
Far (2010).

58
Figure 2-12 - Experimental apparatus used by Eisazadeh-Far (2010).
Source: EISAZADEH-FAR (2010)
The CVR in this work uses the Schlieren method to acquire flame
images in a very similar arrangement of the one designed by EISAZADEH-
FAR (2010). The section that follows is a report about the main features,
concepts and operation of the Schlieren method.
2.4.4 The Schlieren optic method
Schlieren is a widely used method to “visualize phenomena in
transparent media”. SETTLES (2001). This technique makes it possible to
detect the disturbances, like local variations of density, that alter light
propagation through the air, or any other transparent medium.
The fundamental principle of the technique is the fact that light
slows upon interacting with matter. The refractive index 0n c c of a
transparent medium indicates this change, where c is the light speed in the
medium and 0c is the speed of light in vacuum, 3.108 m/s.
According to Settles (2001); for air and other gases there is a
simple linear relationship between the refractive index and the gas density
:
1n k (2.35)
k is the Gladstone-Dale coefficient, and is about 0,23 cm3/g for air at
standard conditions.

59
Settles (2001) exemplifies that air at 0°C and 1 bar pressure has n
= 1.000292 when trans-illuminated by light from the Sodium-D spectral line.
Helium, with n = 1.000035, is distinctly refractive upon mixing with air,
despite what appears to be only a minor difference in n. Alcohol vapor, at
around n = 1.0008, differs enough from air that its evaporation from an
alcoholic drink is clearly visible to Schlieren and shadowgraph equipment.
The refractivity 1n of a gas, depends upon gas composition,
temperature and density, and the wavelength of illumination. The flame
changes temperature, composition, pressure, velocity and density of the gas
mixture, and all these changes are detected by Schlieren.
Settles (2001) summarizes the basics of the Schlieren imaging. It
helps to begin as simply as possible with two lenses, geometric optics and a
point light source.
Figure 2-13 – Diagram of a simple Schlieren system.
Source: SETTLES (2001).
As shown in Figure 2-13, the beam from a "point" source is
collimated by a lens, and a second lens refocuses the beam to an image of a
point source. From there, the beam proceeds to a viewing screen where a real
inverted image of the test area is formed. At this point the optical system is
merely a projector, imaging opaque objects in the test area as silhouettes on
the screen. Transparent Schlieren objects are not imaged at all until a knife-
edge is added at the focus of the second lens. In practice, this knife-edge is
usually just an ordinary razor blade.
As the knife-edge advances toward the focal point, nothing
happens until it rather suddenly blocks the image of the light source, causing
the screen to go dark.
Let the knife-edge be positioned just prior to blocking the image
of the source point. If we now add Schlieren object S to the test area, it bends
light rays away from their original paths. Despite this, however, the second
lens focuses the ray from each point in S to a corresponding point in the
screen image. Two such rays are shown in Figure 2-13, one bent upward, the
other downward. Both refracted rays miss the focus of the optical system.
The upward-deflected ray brightens a point on the screen, but the downward-

60
deflected ray hits the knife-edge. Its corresponding image point is dark
against a bright background. For this particular point of the Schlieren object,
the phase difference causing a vertical gradient in the test area is converted
to an amplitude difference, and the invisible is made visible.
Generalizing from this example of individual rays, a finite
Schlieren object refracts many such rays in many directions. All downward
components of these ray deflections are blocked by the knife-edge, painting
at least a partial picture of the Schlieren object on the screen in shadows on a
bright background. This is - in basic physical terms - the essence of the
Schlieren effect.
A word about the orientation of the knife-edge: here shown
horizontal, it detects only vertical components in the Schlieren object. That
is, a simple knife-edge affects only those ray refractions with components
perpendicular to it. Refractions parallel to the edge, move rays along it but
not across it, so there is no change in cutoff or in screen illuminance.
Schlieren with purely horizontal gradients remains invisible despite the
presence of the knife-edge.
Settles (2001) sais that two Schlieren images are needed to
completely portray a Schlieren object: one with a horizontal and one with a
vertical knife-edge. In practice, a single knife-edge judiciously oriented is
often good enough. To illustrate this, three actual Schlieren images of the
same phenomenon with different cutoffs are shown in Figure 2-14. These
images were obtained by Schlieren photographs of the turbulent flame and
mixing phenomena of an oxy-acetylene torch.

61
Figure 2-14 – Differences of knife-edge positions and forms in Schlieren
imaging: (a) Circular knife-edge; (b) Vertical knife-edge; (c) Horizontal
knife-edge.
Source: SETTLES (2001).
The basic arrangement presented in Figure 2-13 is different from
practical cases, there is a great variability of sets using different lenses, and
also mirrors. Mirrors systems are reliable and cheap since satisfactory quality
can be achieved with simpler manufacturing techniques in comparison with
lenses. SETTLES (2001).
By far the most popular mirror system arrangement is the “Z-
Type”. SETTLES (2001). The method uses two oppositely-tilted, on-axis
mirrors. The combination of a diverging illuminator beam, an opposite
converging analyzer beam, and a parallel beam between the two mirrors
suggests the letter z, whence the name. The Figure 2-15 is a representation of
the features in the arrangement.
In Figure 2-15 the lamp represents a punctual divergent light
source positioned in the focal point of the parabolic mirror 1. Since the light
source is at the focal point, the divergent light rays emitted are reflected as
parallel rays by the mirror. The mirror is tilted by an angle of 1 . The now
parallel light rays collide with a second parabolic mirror, also tilted 2 , now
the parallel light rays converge, the knife-edge is positioned in the focal point
of the parabolic mirror. The camera that records the image is positioned
behind the knife-edge.

62
Figure 2-15 – Representation of a typical Z-type Schlieren arrangement.
Source: SETTLES (2001).
Although the Z-type Schlieren presents some advantages, the fact
that the mirrors are tilted off their optical axes generates some aberrations
that must be dealt with. Settles (2001) states that there are two off-axis
aberrations: coma and astigmatism. If either is allowed to get out of hand,
then there results uneven Schlieren-image illuminance even when the test
area is Schlieren-free.
By definition., SETTLES (2001). coma occurs when the direction
of light reflected from a mirror depends on the position of the point of
reflection. This is a consequence of tilting the Schlieren field mirrors off their
optical axes. In result, beginning with a point light source, a comatic optical
system spreads the point focus into a line. Different annular zones of the
mirror-face focus at different points along this line with different spot sizes.
The point focus becomes smeared into a region of flare with a bright core at
one end: a "comet," whence the name. This effect is repernted in Figure 2-16.
Figure 2-16 – Coma aberration representation.

63
This aberration grows in proportion to the offset angle , for a
given . SETTLES (2001). It is thus minimized by keeping small and
using long-focal-length mirrors. There are other reasons to do this as well,
but fortunately, since coma is generated at both Schlieren field mirrors, it is
possible to cancel its overall effect by tilting the mirrors at equal angles
2 1 in opposite directions from the central optical axis, forming a "z."
One must use identical mirrors, of course, and all optical elements must be
centered in a common plane: the plane of the page in Figure 2-15. Therefore
the z-type Schlieren arrangement is not susceptible to coma if the mirrors are
perfectly and identically figured, and are arranged carefully as just described.
Unlike coma, astigmatism cannot be eliminated from the z-type
Schlieren or any off-axis mirror system. The word literally means non-paint-
like, or failure to focus a point to a point. It arises from differences in path
length along the optical centerline and the mirror periphery. Due to finite off-
axis angles 1 and 2 , a point light source is imaged as two short lines at
right angles to one another and spaced apart a small distance along the optical
axis. Even though 1 and 2 are small and large focus mirrors are used,
some astigmatism is always present thus one must endure it.
Astigmatism smears or spreads the elemental source images from
various points of the test area along two short lines near the focus of the
second mirror. The second of these, called the sagittal focus. Here the
spreading is horizontal, i.e. in the plane of the Schlieren system. If we apply
a horizontal knife-edge, then despite the smearing, all elemental source
images are equally cut off. Uniform screen illuminance thus results and
visible astigmatism errors are avoided. Figure 2-17 represents the
astigmatism aberration.

64
Figure 2-17 - Astigmatism aberration representation.
Source: adapted from NIKON (2015).
In order to avoid astigmatism in the picture above, a horizontal
knife-edge should be positioned in the sagittal focal plane, and the camera
lens in the circle of least confusion, between the meridional focal plane and
the sagittal focal plane.
To this point in the literature review, we have covered the central
definitions needed to understand the ground features of combustion. It was
been explained the physics behind the phenomenon, and how to obtain data
in order to measure it, the next step is: how to interpret the data captured by
the experiment.
2.4.5 Optic Method
It was discussed in Section 2.1.4 that the propagation velocity
captured by the camera, by means of the Schlieren method is equal to the
stretched flame speed in relation to the burned mixture. Let’s remind
Equation (2.8):
,
f
n b
drS
dt (2.36)
To obtain the unstretched flame speed in relation to the burned
mixture, it is necessary to use models to correlate ,L bS , ,n bS and the stretch
rate .
The methodology is divided in two models, the first considers that
flame stretch correlates linearly with flame speed, the second considers this
correlation to be non-linear. The linear model is more extensively used in

65
literature given that it was derived earlier but also because in most cases it
models the experimental data with great accuracy. The second model was
developed later in order to best model the cases where the first lacked
accuracy, or just in order to explore if the difference between methods was
representative. The advantage of the latter is its better agreement with smaller
radius flames, with a larger stretch rate, but for flames with smaller stretch
rate, ( e.g. radius bigger than 15 mm) in most cases, the difference between
methods is usually negligible.
The linear method is used in the works of: GU, HAQ, et al.);
KELLEY, LIU, et al. (2011); KWON, HASSAN and FAETH (2000); LIAO,
JIANG, et al. (2007); BRADLEY, HICKS, et al. (1998) and BRADLEY,
LAWES and MANSOUR (2009). The non-linear method is adopted in the
works of: MIAO and LIU (2014); BROUSTAIL, SEERSB, et al. (2013);
BEECKMANN, CAI and PITSCH (2014); HALTER, TAHTOUH and
MOUNAÏM-ROUSSELLE (2010) and KELLEY, JOMAAS and LAW
(2009).
The linear method relates ‘stretched flame speed’ in relation to the
burned mixture to the ‘unstretched flame speed’ in relation to the burned
mixture and stretch rate by means of the expression:
, ,n b b L bS L S (2.37)
where bL , the inclination of the curve, is the Markstein length of the burned
mixture.
The non linear method relates the same physical variables using
the expression:
2 2
, ,
, , ,
ln 2n b n b b
L b L b L b
S S L
S S S
(2.38)
Once the unstretched flame speed in relation to the burned mixture
is established by either method, one simply falls back to Equation (2.11):
,L b
L
SS
E (2.39)
and the unstretched flame speed in relation to the unburned mixture is
determined.
Given these explanations regarding the experiments employed to
measure flame speed and the optical diagnostic of such flames, one must now
discuss the impact of the fuel in the measurements. In the next section a
review of flame speed measurements of the fuels studied in this work is
presented as well as a brief discussion about advantages and disadvantages in
their utilization.

66
2.5 FUELS AND BIOFUELS
2.5.1 Gasoline and surrogates
The main objective of this work is to measure laminar flame speed
of hydrocarbon fuels that simulate the behavior of gasoline. For conventional
liquid fuels like gasoline, it is not possible to represent the complex oxidation
chemistry with a chemical kinetic model. Since gasoline is a complex mixture
of hundreds of hydrocarbons, and because of the varying composition ,
surrogate mixtures must be used in experiments and calculations.
The term surrogate refers to a simpler representation of a fully
blended fuel. The simplest surrogate fuels consist of single components, e.g.,
the use of iso-octane as a gasoline surrogate. Binary blends of n-heptane and
iso-octane, the primary reference fuels for octane ratings, also find
widespread use as convenient surrogates. Ternary and larger surrogates are
commonly used to investigate the effects of chemical composition on internal
combustion engine (ICE) efficiency and emissions. With a suitable number
of components, it is also possible to model a fuel's physical properties (for
example, its distillation characteristics). PITZ, CERNANSKY, et al. (2007).
In order to determine the best composition for a surrogate fuel, one
needs to specify and understand how the surrogate fuel will be used.
Specifically, one needs to decide which combustion or fuel metric must be
predicted accurately when using a surrogate fuel model. These quantities are
referred to as “targets”. Example targets for surrogate fuels include fuel
properties (chemical composition, C/H ratio, density, evaporation
characteristics), engine characteristics (combustion phasing, bulk burn
duration, emissions), and laboratory data (flow reactor concentration
histories, flame speeds, ignition delays, etc.). PITZ, CERNANSKY, et al.
(2007).
Research teams from Lawrence Livermore National Laboratory,
Drexel University, Princeton University, University of Southern California,
ExxonMobil Research and Engineering, National Institute of Standards and
Technology and Stanford University, Pitz, Cernansky, et al. (2007),
suggested that three hydrocarbons species are very important in
compositions of gasoline surrogates: the linear alkane n-heptane, the highly
branched iso-octane, given that they are the primary reference fuel
components, and toluene, which is usually the most abundant aromatic in
gasoline. In this work, a binary gasoline surrogate comprising iso-octane and
n-heptane is investigated considering the flame speed as a target.
A great number of researchers have already studied the flame
speed of n-heptane and iso-octane, for various temperatures, pressures and
equivalence ratios. Table 2-1 shows a brief review of such works including

67
fuels, experimental method , and the conditions of temperature, pressure and
equivalence ratio studied.
Table 2-1 – Literature review on n-heptane and iso-octane flame speeds
measurements.
Authors Fuels Method Temperature
[K]
Pressure
[MPa] φ
GÜLDER (1984) iso-octane;
ethanol CVR 250-600 0.1
0.75-
1.4 BRADLEY, HICKS, et al.
(1998)
iso-octane;
n-heptane CVR 358-450 0.1-1
0.8-
1.3
DAVIS and LAW (1998)
iso-octane;
n-heptane
Counterf
low 298 0.1
0.6-
1.7
HUANG, SUNG
and ENG (2006)
iso-octane;
n-heptane;
exaust gas
Counterf
low 298 0.1
0.7-
1.4
SMALLBONE, LIU, et al. (2009)
n-heptane Counterf
low 350 0.1-0.2
0.7-
1.5
VAN LIPZIG,
NILSSON, et al.
(2011)
iso-octane;
n-heptane;
ethanol
Heat
flux 298-338 0.1
0.6-
1.3
BROUSTAIL,
SEERSB, et al. (2013)
iso-octane;
ethanol;
buthanol
CVR 400 0.1-10 0.8-
1.4
KELLEY, LIU,
et al. (2011) iso-octane
Counterf
low 350 0.1-1
0.8-
1.6
VAREA,
MODICA, et al.
(2012)
methane;
iso-octane;
ethanol
CVR 298-373 0.1-0.5 0.6-
1.5
SILEGHEM,
ALEKSEEV, et al. (2013)
iso-octane;
n-heptane;
toluene;
gasoline
Heat
flux 298-358 0.1
0.7-
1.3
DIRRENBERGE
R, GLAUDE, et
al. (2014)
iso-octane;
n-heptane;
toluene;
ethanol;
gasoline
Heat
flux 298-398 0.1
0.7-
1.5

68
RAU, HARTL, et al. (2015)
iso-octane;
ethanol
Heat
flux 298-399 0.1
0.7-
1.4
2.5.2 Biofuels
Ethanol, as already pointed out, is the most utilized biofuel in
blends with gasoline in the world. The Table 2-2 shows, in volume fraction,
the quatity of ethanol in gasoline sold worldwide.
Table 2-2 – Content of ethanol in gasoline worldwide. Volume fraction.
Country Ethanol blends
Austria 5%, 85%
Brazil 25%, 27%, 100%
Canada 5%
Germany 5%, 10%, 85%
USA 17%, 24%, 85%
Japan 3%
Source: RAU, HARTL, et al. (2015).
In comparison to gasoline Pagliuso (2010) argues that short carbon
chain alcohols tend to produce more power due to the following factors:
Lower stoichiometric air–fuel ratio: due to their intramolecular
oxygen content, alcohols demand less oxygen for complete
combustion. This leads to lower stoichiometric air–fuel ratios when
compared to gasoline, which means a higher specific energy, i.e.,
the amount of energy that can be generated per kg of inducted air.
In the other hand, engines fueled with them tend to show higher
volumetric fuel consumption.
Higher latent heat of vaporization: alcohols have a substantially
higher latent heat of vaporization than gasoline due to the hydrogen
bonds of the OH group. This enables a high evaporative charge
cooling that increases volumetric efficiency. Also, by reducing the
initial charge temperature, the knock limit can be expanded,
allowing for further improvements in power. Furthermore, the
reduction of charge temperature means that less compression work
is needed, again benefiting, cycle efficiency and power.
Higher octane rating: the higher octane rating of ethanol enables
higher compression ratios to be used with optimum spark advance,
a fact that improves both full-load performance and efficiency.

69
Higher laminar flame speed: Alcohols offer significantly higher
burning velocities than non-oxygenated hydrocarbons, allowing
more efficient power development due to the reduction of negative
work (less ignition advance is needed for the same angle of peak
pressure). This fact also gives them the ability to burn at rich mixture
strengths, which coupled with their high latent heat of vaporization
yields further increase in volumetric efficiency.
Mole ratio of products to reactants: the combustion of alcohols
generates a larger volume of combustion products, which allows the
development of higher cylinder pressures and potentially higher
power output.
Researchers have already reported flame speed measurements of
ethanol, in various temperatures, pressures and equivalence ratios. Table 2-3
shows a brief review of such works including fuels, experimental methods,
and the conditions of temperature, pressure and equivalence ratio studied.
Table 2-3 – Literature review on ethanol flame speeds measurements.
Authors Fuels Method Temperature
[K]
Pressure
[MPa] φ
LIAO, JIANG, et
al. (2007) ethanol CVR 358-550 0.1
0.7-
1.4 BRADLEY,
LAWES and
MANSOUR (2009) ethanol CVR 300-393 0.1-1.4
0.7-
1.5
VELOO, WANG, et al. (2010)
methanol;
ethanol; n-
butanol
Counterf
low 343 0.1
0.7-
1.5
KONNOV,
MEUWISSEN and
GOEY (2011) ethanol
Heat
flux 298-358 0.1
0.65-
1.55
VAN LIPZIG,
NILSSON, et al.
(2011)
iso-octane;
n-heptane;
ethanol
Heat
flux 298-338 0.1
0.6-
1.3
VAREA,
MODICA, et al. (2012)
methane;
iso-octane;
ethanol
CVR 298-373 0.1-0.5 0.6-
1.5
DIRRENBERGER,
GLAUDE, et al.
(2014)
iso-octane;
n-heptane;
toluene;
ethanol;
gasoline
Heat
flux 298-373 0.1
0.7-
1.5
RAU, HARTL, et
al. (2015)
iso-octane;
ethanol
Heat
flux 298-399 0.1
0.7-
1.4

70
This section concludes the literature review. Now most aspects
that concerns the measurements made in this work have been discussed. In
the next section the materials and methods used in the measurements are
enlightened.

71
3 MATERIALS AND METHODS
This chapter describes the experimental apparatus in detail, and the
method employed to measure flame speeds.
This description can also be found in the previous work of
Hartmann (2014), where the CVR was mounted to work with gaseous fuels.
Here, to experiment with liquid fuels some adaptations are made.
3.1 EXPERIMENTAL APPARATUS
The set of equipments used are distributed in six groups: (i) the
constant volume reactor; (ii) filling system; (iii) evacuation system; (iv) data
acquisition and sensors system; (v) ignition system; (vi) optical system.
3.1.1 Constant volume reactor
The CVR is designed to obtain images and pressure data of the
combustion process. It consists of two hemispheres with clearance to fit
quartz cylinders (windows), joined together to form a 150 mm radius sphere.
The total volume of the CVR is calculated using 3D modelling and is 14.8 L.
The windows are quartz cylinders with 190 mm in diameter and
50 mm thickness. They are mounted one in each hemisphere, and are
concentric and parallel to each other. Figure 3-1 shows an exploded view od
the CVR’s main componets.
Figure 3-1 – Exploded view of the CVR’s main components.
The hemispheres have holes for positioning one thermocouple,
dynamic pressure sensor, injection septum, spark plugs, and filling/emptying
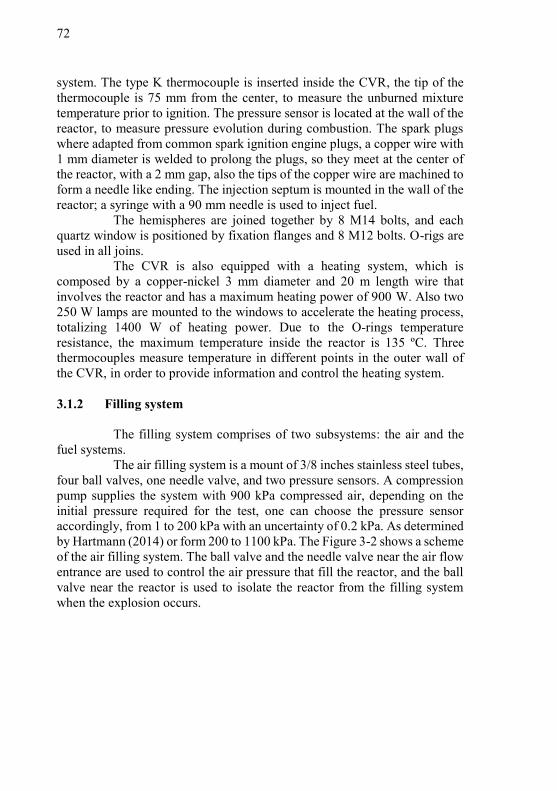
72
system. The type K thermocouple is inserted inside the CVR, the tip of the
thermocouple is 75 mm from the center, to measure the unburned mixture
temperature prior to ignition. The pressure sensor is located at the wall of the
reactor, to measure pressure evolution during combustion. The spark plugs
where adapted from common spark ignition engine plugs, a copper wire with
1 mm diameter is welded to prolong the plugs, so they meet at the center of
the reactor, with a 2 mm gap, also the tips of the copper wire are machined to
form a needle like ending. The injection septum is mounted in the wall of the
reactor; a syringe with a 90 mm needle is used to inject fuel.
The hemispheres are joined together by 8 M14 bolts, and each
quartz window is positioned by fixation flanges and 8 M12 bolts. O-rigs are
used in all joins.
The CVR is also equipped with a heating system, which is
composed by a copper-nickel 3 mm diameter and 20 m length wire that
involves the reactor and has a maximum heating power of 900 W. Also two
250 W lamps are mounted to the windows to accelerate the heating process,
totalizing 1400 W of heating power. Due to the O-rings temperature
resistance, the maximum temperature inside the reactor is 135 ºC. Three
thermocouples measure temperature in different points in the outer wall of
the CVR, in order to provide information and control the heating system.
3.1.2 Filling system
The filling system comprises of two subsystems: the air and the
fuel systems.
The air filling system is a mount of 3/8 inches stainless steel tubes,
four ball valves, one needle valve, and two pressure sensors. A compression
pump supplies the system with 900 kPa compressed air, depending on the
initial pressure required for the test, one can choose the pressure sensor
accordingly, from 1 to 200 kPa with an uncertainty of 0.2 kPa. As determined
by Hartmann (2014) or form 200 to 1100 kPa. The Figure 3-2 shows a scheme
of the air filling system. The ball valve and the needle valve near the air flow
entrance are used to control the air pressure that fill the reactor, and the ball
valve near the reactor is used to isolate the reactor from the filling system
when the explosion occurs.

73
Figure 3-2 – Air filling system schematic.
Source: Adapted from HARTMANN (2014).
To fill the reactor with the desired fuel volume, a balance and a
syringe are used, a septum allows the injection of the fuel in the reactor, and
isolates the reactor interior. The balance measures a maximum of 200 g with
an uncertainty of ±0.0002 g. With these two systems the user can fill the
reactor with the calculated values of fuel and air, to meet the specified
equivalence ratio, with an acceptable uncertainty. The uncertainty
calculations for the equivalence ratio can be found in the later sections.
3.1.3 Evacuation system
The evacuation system is mounted with 3/8 inches stainless steel
tubes, three ball valves and a vacuum pump.
The vacuum pump can reach a minimum pressure of 0.2 mPa and
a maximum flow of 6.2 m3/h. The low pressure allows the injected fuel to
evaporate inside the reactor, and provides cleaning between experiments.
The tube system is mounted to allow the gases inside the reactor
to be evacuated by the vacuum pump or directly to the atmosphere. The
Figure 3-3 shows a scheme of this mounting.
Figure 3-3 - Evacuation system schematic.
Source: Adapted from HARTMANN (2014).

74
3.1.4 Data acquisition and sensors system
The data obtained by the measurements made by the
thermocouples and static pressure sensors is read by a National Instruments®
data acquisition system, which communicates with a notebook through USB
plug.
The data acquisition system has three modules. One with four
isolated channels that acquire analogical electric potential difference, in the
range ±10 V, at an acquisition rate of 1 MHz (million samples per second),
16 bits resolution, entrance impedance of 1 GΩ, and a maximum uncertainty
of 0.003 V, this module is used to acquire data from the two static pressure
sensors in the evacuation and filling systems, the dynamic pressure sensor,
and the current sensor. The second module has 16 thermocouples channels
with an acquisition rate of 75 Hz, and is used to acquire temperature data
from the thermocouple inside the reactor and the three thermocouples of the
heating system. The last module has 32 channels of digital input and output,
with 7 μs of response time, and is used to control the ignition system.
To measure the pressure evolution inside the reactor while the
combustion occurs a Kistler® piezoelectric pressure sensor model 6041BS31
is mounted to the reactor inner wall. The sensor communicates with a
Kistler® charge amplifier model 5018A, which in turn communicates to the
data acquisition system. This pressure information is utilized only as a
complementary data to aid in the optical method, as it will be discussed later.
The four thermocouples are all type K, with a measuring range of
-200 to 1200 °C.
3.1.5 Ignition system
The ignition is controlled by an electrical system developed in the
previous work of Hartmann (2014). The principal features of the system are:
an automotive battery of 12 ±2 V to supply power to the system, a transformer
from 12 V to 220 V, a capacitor of 115 μF and an automotive coil with a 1:60
ratio. It is possible to vary the electric potential difference that charges the
capacitor from 0 to 220 V thus controlling the energy that it can discharge,
from 0 to 2 J. The energy deposited by the spark affects the development of
the flame up to a radius of 10 mm but does not affects the flame speed if it is
measured just beyond this point, as it is demonstrated by the experiments of
Kelley, Jomaas and Law (2009), and also corroborated in this work, a more
detailed discussion of this feature may be found in APPENDIX A. In order
to minimize any of these effects and adopt a constant pattern, the energy
discharged by the capacitor is set to 300 mJ in all experiments.

75
3.1.6 Optical system
As already pointed out the optical system adopted is a Z-type
Schlieren. The system was acquired from Edmund Optics® and is composed
by two spherical mirrors with 152.4 mm in diameter and a focal point distance
of 1524 mm with λ/8 precision, a punctual light source (5 mm LED lamp),
and a cutting edge.
The image acquisition is made by a IDT® high speed digital
camera model Y4-S2. The acquisition rate varies according with the
resolution utilized, the resolution of 256x256 pixels enables a maximal of
17700 frames per second. The rate utilized is 10000 FPS, the same rate of the
pressure sensor acquisition, that facilitates the relation of the data acquired
by both systems and also provides very good number of images that supports
reduction of the associated uncertainties.
The Figure 3-4 shows the dimensions of the optical system, and
the Figure 3-5 shows a photo of the actual optical system assembled.
Figure 3-4 - Dimensions of the optical system
Source: Adapted from HARTMANN (2014).

76
Figure 3-5 – Optical system photo. 1- punctual light source; 2 and 4-
spherical mirrors; 3- CVR; 5- cutting edge; 6- camera.
3.2 EXPERIMENTAL PROCEDURE
Each experiment must follow the same exact procedure, this is
fundamental in order to diminish flaws and enhance repeatability. Figure 3-6
shows the experimental apparatus that need to be managed in each
experiment.
A document listing each action the operator must do in sequence
in order to perform a series of experiments follows next to the Figure 3-6.
Figure 3-6 – Experimental apparatus.

77
3.2.1 Step-by-step experimental procedure
The experiment procedure follows 4 procedures: initialization,
filling, ignition, and emptying.
In the initialization the experimenter must set the parameters of the
experiment, such as: fuel to be tested, initial temperature and pressure. In the
filling procedure, the reactor is filled with the desired amount of fuel and air,
at the designated temperature and pressure. In the ignition procedure, the
mixture is ignited and the pressure and radius data are acquired. Finally in the
emptying procedure the reactor is emptied and prepared for a new
experiment.
In Appendix C a detailed step-by-step experimental procedure is
presented
Any operator that follows the steps thoroughly is capable of
acquiring data, in order to calculate the unstretched laminar flame speed, of
the determined air-fuel mixture, at the initial conditions of equivalence ratio,
pressure, and temperature.
3.3 METHOD TO CALCULATE THE LAMINAR FLAME SPEED
One of the objectives of this work is to study the dependence of
the laminar flame speed regarding the equivalence ratio.
Instruments do not directly measure the equivalence ratio,
contrarily from the initial pressure and temperature, it is calculated with
information collected by the measurements. In the next section this
calculation is explained.
3.3.1 Equivalence ratio
For every experiment there is an ideal equivalence ratio set by the
experimenter. Since the equivalence ratio calculation mathod depends on the
measured data of initial total pressure (unburned mixture pressure pu),
injected fuel mass, and initial temperature (unburned mixture temperature
Tu). The ideal equivalence ratio is never the real equivalence ratio of the
mixture in the reactor, it needs to be recalculated.
The assumptions made to determine the ideal mass of fuel and,
after, the real equivalence ratio are:
1. The fuel evaporates completely.
2. All gases behave as ideal gases and are modeled by the ideal gas
law equation of state.

78
3. The fuel composition is represented by the simplified molecular
formula: C H ON N NC H O .
then, the mass of fuel and the mixture equivalence ratio relate trough the
equation:
2
11
4 2
u f CVR OHC
f u u O
p MM V NNN
m R T x
(3.1)
fm is the mass of fuel, CVRV is the CVR volume and 2Ox is the oxygen molar
fraction in air.
First the experimenter must assign the ideal values of all variables
in Equation (3.1), except for fm , to obtain its value. After the fuel-air
mixture is injected and the temperature is stabilized, the software assigns the
measured values to all variables, except for , and the real value for the
equivalence ratio is determined.
Data from each experiment is recorded by the “CVR.vi” program
in two files, the first file, a .xls file, contains: Date and time of the experiment,
fuel used, initial temperature, mass of fuel, total initial pressure, the real
equivalence ratio, and finally data of pressure versus time measured by the
dynamic transducer in the wall of the reactor.
The second file is a video of the flame development, recorded by
the high speed camera at 10000 FPS. This file is converted by the “Video
Analysis.vi” program in a .xls file. The program, also developed in the work
of Hartmann (2014), recognizes the radius of the flame in each frame of the
video creating the .xls file that relates flame radius versus time. Uncertainty
related to this measurement is +/- 0.5 mm as determined by Hartmann (2014).
The data the .xls files, must be processed in order to calculate the
flame speed of the mixture in question. The method used, subject to this work,
is the optic method already discussed in the sections 2.1.4 and 2.4.5.
The next section will present some results and examples of the
calculations that are made to obtain the flame speed and other physical
characteristics of the flame.
3.3.2 Flame speed calculation example
The experiment exemplified here presents the initial conditions
expressed in
Table 3-1

79
Table 3-1 – Initial parameters of example experiment.
Date: 26/03/2015
Time: 15:46:20
Fuel: Iso-Octane
Equivalence ratio: 1.002
Initial pressure [kPa]: 100.1
Initial temperature [K]: 398.3
Full syringe [g]: 0.8471
Empty syringe [g]: -0.0008
Injected mass [g]: 0.8479
The data of pressure and flame radius fr is presented in the
Figure 3-7. Figure 3-7 – Pressure and flame radius data.
By deriving fr in relation to time, the stretched flame speed in
relation to the burned mixture ,n bS is determined, as it is denoted in
Equation (2.8). And it is also possible to determine the stretch rate using
Equation (2.13). At this point it is useful to remind Equation (2.37):

80
, ,n b b L bS L S (3.2)
By plotting the stretch rate in the x-axis and the stretched flame
speed in the y-axis, and adding a linear fit, then the inclination of the line
gives the value of bL and the intercept; the value of ,L bS .
Figure 3-8 – Stretched flame speed versus strech rate.
In order to perform the fitting correctly, some considerations must
be made. As it is shown in the work of Kelley, Jomaas and Law (2009) and
also investigated in this work, spark energy affects the flame propagation
until the flame is around 10 mm in radius, for the ignition energy used.
Furthermore, observing the Figure 3-7, it is possible to affirm that the
pressure starts to rise when the flame is around 35 mm in radius, thus
affecting the flame development.
In fact, a pattern is observed in every experiment: when the flame
is 30 mm in radius the pressure in the reactor is 1 kPa (1%) above the initial
pressure.
Therefore, two boundaries for the curve fitting are established: the
initial radius must be above 8 mm and the final radius must be below 40 mm,
then it is possible to guarantee that the radius of the flame used to determine
the flame speed is unaffected by the energy of the spark or the pressure rise.
Respecting these boundaries, linear regression is made.

81
In this example the radius range chosen for the fitting is
8 35fr mm, as it is shown in Figure 3-9.
Figure 3-9 – Selected data for linear regression.
Results of the linear regression parameters are presented in Table
3-2, where u is the standard uncertainty of the parameter:
Table 3-2 – Results of the linear regression parameters.
,L bS [mm/s]: 3276.4
bL [mm]: -1.017
,L bSu : 10.81
bLu : 0.029
R2: 0.9399
Number of points: 96
At this point the only feature left to determine the laminar flame
speed is the expansion factor.
The expansion factor is calculated using the software ChemKin-
PRO®. In the software, the expansion factor is calculated using the
equilibrium reactor model, the model calculates the adiabatic flame
temperature, radical species that might occur in the flame, as well as stable

82
reactants, products and its properties. The ChemKin-PRO® equilibrium
reactor employs the STANJAN library of routines in it’s solution method, all
that is required is thermodynamic data for all species in each phase
REACTION DESIGN (2008).
The thermodynamic data is the database found in the chemical
kinetic mechanism developed by Mehl, Pitz, et al. (2011).
The results of the equilibrium calculation in this example is
exposed in Table 3-3:
Table 3-3 – Results and inputs of the equilibrium calculation.
Initial temperature [K]: 398.15
Equilibrium temperature [K]: 2325.72
Initial specific volume [cm3/g]: 1093.54
Equilibrium specific volume [cm3/g]: 6837.03
Expansion factor: 6.25
Assuming that the burned gas mixture is at the equilibrium
temperature (adiabatic flame temperature). The expansion factor is calculated
simply by dividing the equilibrium specific volume by initial specific
volume.
Finally, the unstretched laminar flame speed in relation to the
unburned mixture is determined by dividing ,L bS by the expansion factor. In
this example the value found is: 52.40LS cm/s.
Since all results elapse from measurements, and every
measurement is subject to uncertainties, to calculate them is imperative. It is
also vital to determine which measurement needs improvement in order to
enhance the quality of the results. The next chapter treats about the
uncertainty of the measurements and its propagation over the results.
3.3.3 Determination of uncertainties
The uncertainty of measurements affects the uncertainty of the
variables calculated by these measurements, that are denominated indirectly
measured variables. Albaetazzi Jr. and Sousa (2008) presents a general
equation to estimate the uncertainty propagation:

83
2
12 2
1 1 1
2 ,n n n
i i j i j
i i j ii i j
f f fu G u X u X u X r X X
X X X
(3.3)
G is the variable to be determined by indirect measurement, ( )u X is the
standard uncertainty of the variable X , f is the function that relates the
indirect measured variable and the measured variables. ,i jr X X is the
estimative of the correlation coefficient of the measurement of the variables
iX and jX .
Table 3-4 shows the values and uncertainties of the variables in the
example of section 3.3.2. Details about uncertainty calculation are found in
the Appendix B
Table 3-4 – Variables relevant to flame speed determination and
corresponding uncertainties.
Initial pressure [kPa]: 100.1±0.2
Initial temperature [K]: 398±1
Injected mass [g]: 0.8479±0.0004
,L bS [mm/s]: 3276±11
bL [mm]: -1.01±0.03
Expansion factor: 6.25±0.01
Equivalence ratio: 1.002±0.008
LS [cm/s]: 52.4±0.9
3.4 COMPOSITION OF THE SURROGATE
Table 2-2 shows that the gasoline commercialized in Brazil has a
composition of 27 % of ethanol, in the gas stations it is sold after the name
of Common Gasoline, or Gasoline C. Gasoline without the addition of
ethanol is referred to by the name of Gasoline A. In this work, “Gasoline A”
refers to the “pure” gasoline without a addition of ethanol, and “Gasoline C”
refers to the gasoline A with addition of 27% in volume of ethanol, as it is
sold commercially. The terms “Surrogate A” and “Surrogate C” refer to the
surrogates developed to emulate flame speed of gasoline A and gasoline C
respectively.

84
As already pointed out, the surrogate of gasoline A (surrogate A)
studied in this work is composed by two hydrocarbon species: n-heptane and
iso-octane. After experiments of flame speed determination with h-heptane,
iso-octane and gasoline A, the composition of surrogate A is determined
using the system of equations:
7 16 7 16 8 18 8 18, , ,C H L C H C H L C H L GasAx S x S S (3.4)
7 16 8 18
1C H C Hx x (3.5)
where x is molar fraction, and the subscripts 7 16C H , 8 18C H and GasA ,
refer to n-heptane, iso-octane and gasoline A respectively.
Equations (3.4) and (3.5) are solved together, for every
equivalence ratio and temperature, and an average of the results is taken as
the final composition for surrogate A. This composition is found to be: 68%
of iso-octane and 32% of n-heptane in molar fraction. In volume fraction this
composition is: 66% iso-octane and 34% n-heptane.
Gasoline C is produced by adding 27% in volume of ethanol to
gasoline A, therefore the surrogate C follows the same method, it is produced
by adding 27% in volume of ethanol to surrogate A. This mixture results in a
composition for surrogate C of: 30% iso-octane, 19% n-heptane and 51% of
ethanol in molar fraction, or 48% iso-octane, 25% n-heptane and 27% of
ethanol in volume fraction.
This concludes the section 3: Materials and Methods. In the next
section, the results of the performed experiments is presented and discussed.

85
4 RESULTS
The images sequence produced by the video recorded by the high
speed camera is the most important data acquired to calculated laminar flame
speed using the method explored in this work. Figure 4-1 shows a sequence
of images, for three different equivalence ratios of a n-heptane spherical
flame propagating in the CVR’s chamber. The first three lines correspond to
the same time steps, and the last line the same radius, the columns are each
equivalence ratio.
The results are categorized by fuel, in each chapter, named after
the fuel. The following results are presented:
1) Flame speed versus equivalence ratio:
a) Measurements with uncertainty bars.
b) Comparison with other works.
c) Fitting curves of the measured values.
2) Flame speed versus unburned mixture
temperature:
a) Measurements.
b) Fitting curves of the measured values.
3) Temperature dependence parameter versus
equivalence ratio:
a) Measurements with uncertainty bars.
b) Comparison with other works.
c) Fitting curves of the measured values.
d) Global fitting curve.
4) Deviation in percentage of the flame speed
measured values from the flame speed calculated values using the
global fitting curve versus normalized equivalence ratio.

86
Figure 4-1– Spherical flame evolution. N-heptane at Tu= 398 K.
Two types of fitting curve to relate flame speed and equivalence
ratio are calculated, the first; a third degree polynomial:
2 3
LS a b c d (4.1)

87
The second fitting curve is the form proposed by GÜLDER
(1984):
2
expLS (4.2)
The polynomial function is recommended for interpolation of the
values, due to its better fitting, on the other hand, this function yields non
physical values for equivalences ratios values that are not in tested range, if
extrapolation of the equivalence ratio is needed it is highly recommended to
use the exponential equation, due to its stability. Figure 4-2 presents a
comparison of the extrapolation of both fitting curves, for the fittings data of
n-heptane unburned mixture temperature of 298 K and equivalence ratio of 1
are used. Figure 4-2 – Comparison for extrapolation of the third degree and
exponential fitting curves for laminar flame speed as a function of
equivalence ratio.
Equation (4.2) is interesting because differently from Equation
(4.1), it does not produce negative values for flame speed for extrapolated
lean or rich values of equivalence ratio.
The fitting curve that relates flame speed and unburned mixture is
an adaption of Equation (2.34):

88
,0
0
u
L u L
TS T S
T
(4.3)
where 0T is the reference temperature of 398 K, and ,0LS , is the reference
laminar flame speed calculated using Equation (4.1), with the equivalence
ratio concerned.
The temperature dependence parameter is the factor in
Equation (4.3), its dependence with equivalence ratio is modeled by a
quadratic curve:
2e f g (4.4)
Finally, a global fitting curve which allows calculating laminar
flame speed in any equivalence ratio and unburned mixture temperature is
derived by compiling Equation (4.1), Equation (4.3) and Equation (4.4):
2
,0
0
,
e f g
u
L u L
TS T S
T
(4.5)
where ,0LS is Equation (4.1) at the reference temperature.
For information about the method used by each author, it is
recommended to recur to Table 2-1 and Table 2-3.
It fits to highlight that there is a minimum unburned mixture
temperature for which it is possible to completely evaporate the fuel. The
results of n-heptane at 298 K make this evident. The laminar flame speed at
equivalence ratio greater than 1.3 are larger (5%) than the literature, and
values do not follow the same tendency as the literature and other
temperatures, this is evidence of lack of evaporation.
A second limitation is that for equivalence ratios larger than 1.4
when the flame is around 30 mm, its surface starts to wrinkle, and then it is
no longer possible to affirm that it is a laminar flame. This is observed in all
tested substances except for ethanol. Figure 4-3 illustrates this observation.

89
Figure 4-3 – Comparison of wrinkle in flames. Tu = 398 K; ϕ = 1.4 rf = 50
mm. (a) n-hepthane; (b) gasoline A; (c) iso-octane; (d) ethanol.
4.1 N-HEPTANE
Laminar flame speed of n-heptane is investigated in five
temperature levels: 298 K, 323 K, 348 K, 373 K and 398 K are evaluated. In
each temperature level, six equivalence ratio levels: 0.8; 0.9; 1.0; 1.1; 1.2 and
1.3.
Results of laminar flame speed versus equivalence ratio in each
temperature level are presented in Figure 4-4; Figure 4-5; Figure 4-6; Figure
4-7 and Figure 4-8. For information about the method used by each author, it
is recommended to recur to Table 2-1 and Table 2-3.

90
Figure 4-4 – Results of laminar flame speed of n-heptane versus
equivalence ratio at 298 K.
Figure 4-5 – Results of laminar flame speed of n-heptane versus
equivalence ratio at 323 K.

91
Figure 4-6– Results of laminar flame speed of n-heptane versus equivalence
ratio at 348 K. Other references measured at different temperatures.
Figure 4-7– Results of laminar flame speed of n-heptane versus equivalence
ratio at 373K.

92
Figure 4-8– Results of laminar flame speed of n-heptane versus equivalence
ratio at 398 K.
In Figure 4-4 the laminar flame speed measured for n-heptane at
298 K agrees well with the compared data, even though the large differences
among the results found in the literature which for this case is at maximum
10%, all results present a similar tendency. For rich mixtures, the measured
data differs form the tendency presented by the literature, that suggests lack
of evaporation of the fuel. This is not observed in Figure 4-5 to 4-8, in these
figures, the measured values follows the same tendency of the literature, it
can be concluded that evaporation occurred without problems for the 323,
348, 373 and 398 K temperature steps. Furthermore, the values measured
agreed very well for the literature found. In Figure 4-5 no other flame speed
data with the same unburned mixture temperature was found, therefore the
compared data at 323 K are compared with 318 K and 328 K, and the
measured values are in between the compared data, where they where
expected to be. In Figure 4-6 one can observe the large dispersion of
experimental results (from 51 to 46 cm/s at ϕ =1), that is due to the fact that
different temperatures are compared, the measured data follows the tendency
and presents the expected results. For the temperature of 373 K in Figure 4-7
no other work with data at similar temperatures is found. For the last
temperature step of 398 K great agreement with the literature is found, with
differences at maximum 3%.
Experimental uncertainty of the literature data, when given, is of
the same order of the measured data of this work.

93
Each point in the laminar flame speed versus equivalence ratio
figures, in this section and the following sections, corresponds to a single
experiment, a total of 345 experiments are presented in this work.
The parameters of Equation (4.1) and Equation (4.2) are described
in Table 4-1 and Table 4-2 respectively.
Table 4-1 – Parameters of Equation (4.1) for n-heptane.
Temperature [K] a b c d
298 -4.53 -32.13 158.89 -85.12
323 -252.81 627.47 -398.57 66.79
348 -48.97 87.14 84.63 -75.75
373 -112.58 298.13 -122.80 -8.95
398 -152.59 409.35 -207.74 10.13
Table 4-2– Parameters of Equation (4.2) for n-heptane.
Temperature [K]
298 3.077E-07 9.386 -1.012 5.288
323 3.711E-08 17.257 -3.346 3.497
348 8.941E-11 8.498 -0.592 7.751
373 3.683E-06 8.878 -1.088 4.894
398 8.665E-11 8.625 -0.636 7.548
In Figure 4-4; Figure 4-5; Figure 4-6; Figure 4-7 and Figure 4-8,
are also plotted the fittings of Equation (4.1) and Equation (4.2). For the cubic
fittings the results were good, the R2 parameter for Equation (4.1) is 0.98 and
for the exponential fitting the R2 parameter is 0.95 for Equation (4.2) in all
five cases.
To determine the temperature dependence parameter, it is
necessary to plot flame speed against unburned mixture temperature for each
equivalence ratio. Figure 4-9 demonstrate this dependence for the six levels
of equivalence ratio, the lines are the fitted equations using Equation (4.3),
and the figures are the measured data.

94
Figure 4-9 – Laminar flame speed versus unburned mixture temperature.
In Figure 4-9, the slope of each curve corresponds to the
temperature dependence parameter for each equivalence ratio. The dispersion
of the data varies for each curve significantly; for the worst case (ϕ =0.8) the
adjusted R2 is 0.88 with a standard deviation of 0,11, and the best case (ϕ
=1.1) the values are 0.99 and 0.04 for adjusted R2 and standard deviation
respectively. The parameters of Equation (4.3) are presented in Table 4-3.
These parameters can be substituted in Equation (4.3), then it is possible to
extrapolate or interpolate for any desired value of unburned mixture
temperature for a selected equivalence ratio, although extrapolation may
result in values of unknown uncertainty, because there is scarce data in
literature regarding comparison of this extrapolation to higher tempeartures
and actual measured values.
Table 4-3 – Parameters of Equation (4.3) for n-heptane.
,398KLS [cm/s]
0.8 47.1 1.777
0.9 54.9 1.752
1 59.1 1.585
1.1 59.8 1.486

95
1.2 56.9 1.473
1.3 50.7 1.560
The temperature dependence parameter varies with the
equivalence ratio as can be inferred by Figure 4-9, this is illustrated by Figure
4-10 as well as Equation (4.4). The standard deviation of each value from the
fitted curve, Equation (4.3), is plotted as an uncertainty bar.
Figure 4-10 – Temperature dependence parameter versus equivalence ratio
for n-heptane.
The values for the temperature dependence parameter vary over an
average of 1.61. The difference form the average is of the same degree as the
uncertainty of the value, therefore using the average value and assuming that
the temperature dependence parameter is constant regarding the equivalence
ratio may be a better solution, depending on the problem. This discussion is
addressed at the end of the section.
The global fitting equation for n-heptane is:
2
2 3
4.47 4.99 2.10
, 152.59 409.35 207.74 10.13398
uL u
TS T
(4.6)

96
Equation (4.6) allows calculating laminar flame speed as a
function of equivalence ratio and unburned mixture temperature. Note that
the third degree polynomial function (Equation (4.1)) may be substituted by
Equation (4.2). The consequences of this substitution are the same already
pointed out at the beginning of the section, worse representation of the
interpolated data but better characterization of extrapolated data. Also the
exponent of the temperature, the second degree polynomial function, is the
function that models the temperature dependence parameter, it may be
substituted by the average of the data, implications of this substitution are
explored in the next paragraphs and in Table 4-4.
It is very important to characterize the deviation from the
measured data that results from the use of Equation (4.6). Deviation in
percentage of the flame speed measured values from the flame speed
calculated values using the global fitting curve is illustrated by Figure 4-11.
Figure 4-11 - Deviation in percentage of the flame speed measured values
from the flame speed calculated values using the global fitting curve versus
normalized equivalence ratio for n-heptane.
By analyzing Figure 4-11 it is possible to affirm that the use of
Equation (4.6) will result in a deviation of utmost +/- 5% from the actual
value for the laminar flame speed of n-heptane.
The utilization of a quadratic function for the temperature
dependence parameter may result in not physically applicable values, if

97
extrapolation is needed. Since the values do not vary significantly, an average
can be used. Table 4-4, shows the differences for utilizing the average or the
quadratic function for the temperature dependence parameter. is the
average of the deviation in percentage of the flame speed measured values
from the flame speed calculated values using the global fitting curve and
quadratic equation for the temperature dependence parameter. is the
average of the deviation in percentage of the flame speed measured values
from the flame speed calculated values using the global fitting curve and
average for the temperature dependence parameter. is the standard
deviation of the values from which the averages are calculated.
Table 4-4 - Differences for utilizing the average or the quadratic function
for the temperature dependence parameter.
Fuel [%] [%] [%] [%]
iso-Octane 1,66 -0,25 1,77 0,26 1,96
n-Heptane 1,61 -0,31 2,10 -0,18 2,95
Ethanol 1,57 0,10 1,60 0,12 1,72
Gasoline A 1,69 -0,01 2,06 0,17 1,74
Surrogate A 1,72 -0,07 0,68 -0,13 1,09
Gasoline C 1,89 -0,38 0,83 -0,37 0,93
Surrogate C 1,89 -0,19 0,98 -0,23 0,98
4.2 ISO-OCTANE
Laminar flame speed of iso-octane is investigated in five
temperature levels: 298 K, 323 K, 348 K, 373 K and 398 K. In each
temperature level, six equivalence ratio levels: 0.8; 0.9; 1.0; 1.1; 1.2 and 1.3.
Results of laminar flame speed versus equivalence ratio in each
temperature level are presented in Figure 4-12; Figure 4-13; Figure 4-14;
Figure 4-15 and Figure 4-16.

98
Figure 4-12 – Results of laminar flame speed of iso-octane versus
equivalence ratio at 298 K.
Figure 4-13 – Results of laminar flame speed of iso-octane versus
equivalence ratio at 323 K.

99
Figure 4-14– Results of laminar flame speed of iso-octane versus
equivalence ratio at 348 K.
Figure 4-15– Results of laminar flame speed of iso-octane versus
equivalence ratio at 373K.

100
Figure 4-16– Results of laminar flame speed of iso-octane versus
equivalence ratio at 398 K.
As an overall conclusion by analyzing Figure 4-12; Figure 4-13;
Figure 4-14; Figure 4-15 and Figure 4-16, similarly to the results of n-
heptane, this measured data of iso-octane also agrees well with the results of
the literature, their variation with equivalence ratio and temperature are
coherent, and this validates the results as reliable. In Figure 4-12 the
calculated values fall between all compared data, the literature results spread
over a narrow range, from 33 to 35 cm/s for ϕ =1, the measured value in this
point is 33,8 cm/s, for the rich mixtures of ϕ >1.3, the flame speed calculated
is greater than the literature’s. This is possibly due to lack of evaporation, as
it is not observed in higher temperatures. For the 323 K initial temperature
the measured data is compared to data acquired at 318 and 328 K, and the
results fall in between the literature, this is represented in Figure 4-12. The
Figure 4-14 compares the measured values at 348 K with literature values at
338 K and 358 K, these data show a wider variation among the literature’s
results, but the values found in this work are coherent with the literature and
the other temperatures measured, this conclusion extends to the data
calculated at 373 K presented in Figure 4-15. In the 398 K temperature, the
values agree with the literature with a difference of 4% at maximum.
The parameters of Equation (4.1) and Equation (4.2) are described
in Table 4-5 and Table 4-6 respectively.

101
Table 4-5– Parameters of Equation (4.1) for iso-octane.
Temperature [K] a b c d
298 -127.87 314.99 -167.31 13.98
323 -118.51 291.81 -134.56 -0.55
348 -138.57 359.17 -196.21 17.98
373 -93.49 210.33 -17.68 -49.96
398 -88.73 211.26 -27.06 -42.59
Table 4-6– Parameters of Equation (4.2) for iso-octane.
Temperature [K]
298 3.32E-09 15.71 -2.47 4.06
323 9.30E-14 13.48 -1.24 6.21
348 4.86E-09 9.93 -0.98 5.84
373 1.15E-09 10.80 -1.11 5.70
398 4.85E-08 8.75 -0.83 6.01
In Figure 4-12; Figure 4-13; Figure 4-14; Figure 4-15 and Figure
4-16, are also plotted the fittings of Equation (4.1) and Equation (4.2). For all
fittings the results were good, the R2 parameter for Equation (4.1) is 0.98 and
0.95 for Equation (4.2) in all five cases.
Figure 4-17, as Figure 4-9 demonstrates the dependence between
flame speed and unburned mixture temperature, for the six levels of
equivalence ratio, the lines are the fitted equations using Equation (4.3) and
the figures are the measured data.

102
Figure 4-17 – Laminar flame speed versus unburned mixture temperature
for iso-octane.
In Figure 4-17, the conclusions are similar to the n-heptane case,
the slope of each curve corresponds to the temperature dependence parameter
for each equivalence ratio. The dispersion of the data varies for each curve
significantly; for the worst case (ϕ =0.8) the adjusted R2 is 0.92 with a
standard deviation of 0,08, and the best case (ϕ =1.2) the values are 0.99 and
0.04 for adjusted R2 and standard deviation respectively. The parameters of
Equation (4.3) are presented in Table 4-7. As it was previously highlighted,
these parameters can be substituted in Equation (4.3), then it is possible to
extrapolate or interpolate for any desired value of unburned mixture
temperature for a selected equivalence ratio. Table 4-7 – Parameters of Equation (4.3) for iso-octane.
,398KLS [cm/s]
0.8 41.2 1.717
0.9 48.4 1.565
1 52.9 1.547
1.1 54.2 1.599
1.2 52.2 1.698
1.3 46.6 1.845

103
The temperature dependence parameter varies with the
equivalence ratio as can be inferred by Figure 4-17, this is illustrated by
Figure 4-18 as well as Equation (4.4). The standard deviation of each value
from the fitted curve, Equation (4.3), is plotted as an uncertainty bar.
Figure 4-18 – Temperature dependence parameter versus equivalence ratio
for iso-octane.
The values for the dependence parameter vary over an average of
1.66. The difference form the average is of the same degree as the uncertainty
of the value as in the case of n-heptane, therefore using the average value and
assume that the temperature dependence parameter it constant regarding the
equivalence ratio may be a better solution, depending on the problem.
The global fitting equation for iso-octane is:
25.11 7.0
2 3
7 3.51
88.73 211.26 27.06 42.,398
59 uL u
TS T
(4.7)
Equation (4.7) be changed as described in the n-heptane case, the
exponential equation may be used in place of the third degree polynomial
function and the average of the temperature dependence parameter may

104
substitute the second degree polynomial function. The consequences of these
are the same as in the n-heptane case.
Deviation in percentage of the flame speed measured values from
the flame speed calculated values using the global fitting curve is illustrated
by Figure 4-19.
Figure 4-19 - Deviation in percentage of the flame speed measured values
from the flame speed calculated values using the global fitting curve versus
normalized equivalence ratio for iso-octane.
By analyzing Figure 4-19 it is possible to affirm that the use of
Equation (4.6) will result in a deviation of utmost +/- 4% from the actual
value for the laminar flame speed of iso-octane.
4.3 ETHANOL
Laminar flame speed of ethanol is investigated in three
temperature levels: 348 K, 373 K and 398 K. In each temperature level, six
equivalence ratio levels: 0.8; 0.9; 1.0; 1.1; 1.2 and 1.3.
Results of laminar flame speed versus equivalence ratio in each
temperature level are presented in Figure 4-20; Figure 4-21, and
Figure 4-22.

105
Figure 4-20– Results of laminar flame speed of ethanol versus equivalence
ratio at 348 K.
Figure 4-21– Results of laminar flame speed of ethanol versus equivalence
ratio at 373K.

106
Figure 4-22– Results of laminar flame speed of ethanol versus equivalence
ratio at 398 K.
For ethanol only three temperatures steps are probed, this is due to
evaporation difficulties at lower temperatures. The conclusion of the results
presented in Figure 4-20; Figure 4-21, and
Figure 4-22, is the same for the n-heptane and iso-octane cases, the
agreement with the literature data is good, the difference is at average 3 %,
which is smaller than the difference among the literature values, that in some
cases are as high as 7 %. All cases follow the same tendency in the variation
of flame speed with temperature, and these results validate the values as
reliable.
The parameters of Equation (4.1) and Equation (4.2) are described
in Table 4-8 and Table 4-9 respectively.
Table 4-8– Parameters of Equation (4.1) for ethanol.
Temperature [K] a b c d
348 -13.77 -21.06 194.07 -109.09
373 -11.44 -37.86 237.05 -130.28
398 -90.10 211.55 -7.70 -51.44

107
Table 4-9– Parameters of Equation (4.2) for ethanol.
Temperature [K]
348 1.76E-07 8.86 -0.86 5.75
373 5.93E-08 8.82 -0.81 6.07
398 1.12E-05 8.22 -0.94 5.07
In Figure 4-20; Figure 4-21, and
Figure 4-22, are also plotted the fittings of Equation (4.1) and
Equation (4.2). For all fittings the results were good, the R2 parameter for
Equation (4.1) is 0.98 and 0.95 for Equation (4.2) in all three cases.
Figure 4-23 demonstrate the dependence between flame speed and
unburned mixture temperature, for six levels of equivalence ratio, the lines
are the fitted equations using Equation (4.3) and the figures are the measured
data.
Figure 4-23 – Laminar flame speed versus unburned mixture temperature
for ethanol.
In Figure 4-23 the dispersion of the data varies for each curve
significantly; for the worst case (ϕ =1.2) the adjusted R2 is 0.95 with a
standard deviation of 0,13, and the best case (ϕ =0.8) the values are 0.99 and

108
0.06 for adjusted R2 and standard deviation respectively. The parameters of
Equation (4.3) are presented in Table 4-10.
Table 4-10 – Parameters of Equation (4.3) for ethanol.
,398KLS [cm/s]
0.8 47.9 1.724
0.9 56.6 1.650
1 62.3 1.534
1.1 64.8 1.445
1.2 63.8 1.439
1.3 58.9 1.600
The temperature dependence parameter varies with the
equivalence ratio as can be inferred by Figure 4-23, this is illustrated by
Figure 4-24 as well as Equation (4.4). The standard deviation of each value
from the fitted curve, Equation (4.3), is plotted as an uncertainty bar.
Figure 4-24 – Temperature dependence parameter versus equivalence ratio
for ethanol.

109
The values for the dependence parameter vary over an average of
1.57. The difference form the average is of the same degree as the uncertainty
of the value as in the case of n-heptane, therefore using the average value and
assume that the temperature dependence parameter it constant regarding the
equivalence ratio may be a better solution, depending on the problem.
The global fitting equation for ethanol is:
25.06 6.4
2 3
4 2.88
90.10 211.55 7.70 51.48
4,39
uL u
TS T
(4.8)
Equation (4.8) may be changed as described in the n-heptane and
iso-octane cases, the exponential equation may be used in place of the third
degree polynomial function and the average of the temperature dependence
parameter may substitute the second degree polynomial function. The
consequences of these are the same as in the previous cases.
Deviation in percentage of the flame speed measured values from
the flame speed calculated values using the global fitting curve is illustrated
by Figure 4-25.
Figure 4-25 - Deviation in percentage of the flame speed measured values
from the flame speed calculated values using the global fitting curve versus
normalized equivalence ratio for ethanol.

110
By analyzing Figure 4-25 it is possible to affirm that the use of
Equation (4.6) will result in a deviation of utmost +/- 3 % from the actual
value for the laminar flame speed of ethanol.
4.4 GASOLINE A AND SURROGATE A
Laminar flame speed of gasoline A and surrogate A are
investigated in three temperature levels: 373 K, 398 K and 408 K. In each
temperature level, six equivalence ratio levels: 0.8; 0.9; 1.0; 1.1; 1.2 and 1.3.
Results of laminar flame speed versus equivalence ratio in each
temperature level are presented in Figure 4-26; Figure 4-27, and Figure 4-28.
Figure 4-26– Results of laminar flame speed of gasoline A and surrogate A
versus equivalence ratio at 373 K.

111
Figure 4-27– Results of laminar flame speed of gasoline A and surrogate A
versus equivalence ratio at 398 K.
Figure 4-28– Results of laminar flame speed of gasoline A and surrogate A
versus equivalence ratio at 408 K.

112
Compared to the substances already studied, gasolines are very
different, as already pointed out, gasolines are a blend of a great number of
different hydrocarbons, aromatics, linear and ramified hydrocarbons
represent the most common species found in gasolines, this results in a higher
vapor pressure. These aspects limited the test temperatures to a minimum of
373 K due to evaporation difficulties. Comparison with the literature is not
made in the gasoline A or C cases, there is very few data, and they vary over
a wide range, due to different composition of gasoline, the data is not reliable
for comparison. The data presented in Figure 4-26; Figure 4-27, and Figure
4-28 is supported by the results of the pure substances cases, as their values
are reliable, then it leads to the conclusion that the results of gasoline A and
surrogate A are also reliable. Comparing the evolution of the laminar flame
speed values over the equivalence ratio range, of the three temperatures, point
of maximum is the same, for both gasoline A and surrogate A, and present
the same tendency, this coherence is expected.
The results presented in Figure 4-26; Figure 4-27, and Figure 4-28
also lead to the conclusion that the surrogate A composition is adequate to
model the laminar flame speed of gasoline A, as the difference between the
experimental values is never greater then 2 %.
The parameters of Equation (4.1) and Equation (4.2) are described
in Table 4-11 and Table 4-12 respectively, for gasoline A.
Table 4-11– Parameters of Equation (4.1) for gasoline A.
Temperature [K] a b c d
373 -206.01 569.05 -388.03 74.81
398 -120.66 315.37 -128.56 -11.21
408 -13.84 18.06 144.93 -92.56
Table 4-12– Parameters of Equation (4.2) for gasoline A.
Temperature [K]
373 4.08E-08 9.33 -0.97 5.65
398 4.54E-11 8.76 -0.64 7.59
408 1.93E-06 7.49 -0.73 5.86
Parameters of Equation (4.1) and Equation (4.2) are described in
Table 4-13 and Table 4-14 respectively, for surrogate A.

113
Table 4-13– Parameters of Equation (4.1) for surrogate A.
Temperature [K] a b c d
373 -131.29 342.75 -162.41 0.82
398 -128.41 329.43 -134.07 -11.62
408 -65.02 149.81 37.50 -65.03
Table 4-14– Parameters of Equation (4.2) for surrogate A.
Temperature [K]
373 1.19E-10 8.85 -0.68 7.29
398 4.99E-08 9.33 -0.96 5.67
408 8.55E-08 8.86 -0.88 5.81
In Figure 4-26; Figure 4-27, and Figure 4-28 are also plotted the
fittings of Equation (4.1) and Equation (4.2) for gasoline and surrogate A. For
all fittings the results were good, the R2 parameter for Equation (4.1) is 0.99
and 0.94 for Equation (4.2) in all three cases for gasoline and surrogate A.
Figure 4-29 and Figure 4-30, for gasoline A and surrogate A
respectively, demonstrate the dependence between flame speed and unburned
mixture temperature, for six levels of equivalence ratio, the lines are the fitted
equations using Equation (4.3).

114
Figure 4-29 – Laminar flame speed versus unburned mixture temperature
for gasoline A.
Figure 4-30– Laminar flame speed versus unburned mixture temperature
for surrogate A.

115
In Figure 4-29 and Figure 4-30, the slope of each curve
corresponds to the temperature dependence parameter for each equivalence
ratio. The dispersion of the data varies for each curve significantly; for the
worst case of gasoline A in Figure 4-29 (ϕ =0.8) the adjusted R2 is 0.97 with
a standard deviation of 0,12, and the best case (ϕ =1.1) the values are 0.99
and 0.01 for adjusted R2 and standard deviation respectively; for the worst
case of surrogate A in Figure 4-30 (ϕ =0.8) the adjusted R2 is 0.96 with a
standard deviation of 0,12, and the best case (ϕ =1.1) the values are 0.99 and
0.01 for adjusted R2 and standard deviation respectively. The parameters of
Equation (4.3) are presented in Table 4-15 and Table 4-16 for gasoline A and
surrogate A, respectively. These parameters can be substituted in Equation
(4.3), then it is possible to extrapolate or interpolate for any desired value of
unburned mixture temperature for a selected equivalence ratio.
Table 4-15 – Parameters of Equation (4.3) for gasoline A.
,398KLS [cm/s]
0.8 43.6 1.730
0.9 50.9 1.385
1 54.9 1.460
1.1 55.8 1.691
1.2 53.3 1.925
1.3 47.4 1.986
Table 4-16 – Parameters of Equation (4.3) for surrogate A.
,398KLS [cm/s]
0.8 43.4 1.562
0.9 51.0 1.492
1 55.3 1.564
1.1 56.3 1.708
1.2 53.8 1.893
1.3 47.8 2.103
The temperature dependence parameter varies with the
equivalence ratio as can be inferred by Figure 4-29 and Figure 4-30, this is
illustrated by Figure 4-31 as well as Equation (4.4). The standard deviation
of each value from the fitted curve, Equation (4.3), is plotted as an uncertainty
bar.

116
Figure 4-31 – Temperature dependence parameter versus equivalence ratio
for gasoline A and surrogate A.
The great agreement of the laminar flame speed of the surrogate A
and gasoline A extends to the temperature dependence parameter, the
difference of each value is never greater than the standard deviation.
The values for the dependence parameter vary over an average of
1.70 for gasoline A and 1,72 for surrogate A. As suggested in the previous
cases substitution of the quadratic function by the average value may be done
observing the consequences already pointed out in the previous fuels cases.
The global fitting equation for gasoline A is:
25.87 9.1
2
0
3
4.76
120.66 315.37 128.56 11,398
.21 uL u
TS T
(4.9)
The global fitting equation for surrogate A is:
24.05 5.7
2
8
3
3.30
128.41 329.43 134.07 11,398
.62 uL u
TS T
(4.10)

117
Equation (4.9) and (4.10) may be changed as described in the
previous cases, the exponential equation may be used in place of the third
degree polynomial function and the average of the temperature dependence
parameter may substitute the second degree polynomial function. The
consequences of these are the same as in the previous cases
Deviation in percentage of the flame speed measured values from
the flame speed calculated values using the global fitting curve is illustrated
by Figure 4-32 and Figure 4-33, for gasoline A and surrogate A respectively.
Figure 4-32 - Deviation in percentage of the flame speed measured values
from the flame speed calculated values using the global fitting curve versus
normalized equivalence ratio for gasoline A.

118
Figure 4-33 - Deviation in percentage of the flame speed measured values
from the flame speed calculated values using the global fitting curve versus
normalized equivalence ratio for surrogate A.
By analyzing Figure 4-32 and Figure 4-33 it is possible to affirm
that the use of Equation (4.9) will result in a deviation of utmost +/- 3 % from
the actual value for the laminar flame speed of gasoline A, and +/- 2% for
surrogate A.
4.5 GASOLINE C AND SURROGATE C
Laminar flame speed of gasoline C and surrogate C are
investigated in three temperature levels: 373 K, 398 K and 408 K. In each
temperature level, six equivalence ratio levels: 0.8; 0.9; 1.0; 1.1; 1.2 and 1.3.
Results of laminar flame speed versus equivalence ratio in each
temperature level are presented in Figure 4-34; Figure 4-35, and Figure 4-36.

119
Figure 4-34– Results of laminar flame speed of gasoline C and surrogate C
versus equivalence ratio at 373 K.
Figure 4-35– Results of laminar flame speed of gasoline C and surrogate C
versus equivalence ratio at 398 K.

120
Figure 4-36– Results of laminar flame speed of gasoline C and surrogate C
versus equivalence ratio at 408 K.
The results presented in Figure 4-34; Figure 4-35, and Figure 4-36,
lead to the same conclusions as the gasoline and surrogate A case, the
difference between each measured value of gasoline C and surrogate C in
never greater than 2 % that validates the surrogate C as a very good model
for the laminar flame speed of gasoline C.
The parameters of Equation (4.1) and Equation (4.2) are described
in Table 4-11 and Table 4-12 respectively, for gasoline C.
Table 4-17– Parameters of Equation (4.1) for gasoline C.
Temperature [K] a b c d
373 -74.88 177.20 -3.47 -48.32
398 13.24 -79.05 255.40 -132.92
408 -76.28 189.40 -0.34 -53.52
Table 4-18– Parameters of Equation (4.2) for gasoline C.
Temperature [K]
373 3.02E-08 9.15 -0.90 5.85
398 1.37E-07 8.36 -0.79 6.00
408 1.52E-07 8.28 -0.79 6.00

121
Parameters of Equation (4.1) and Equation (4.2) are described in
Table 4-13 and Table 4-14 respectively, for surrogate C. Table 4-19– Parameters of Equation (4.1) for surrogate C.
Temperature [K] a b c d
373 -47.00 105.80 55.43 -63.94
398 -1.37 -32.63 206.75 -116.23
408 -11.64 1.87 177.61 -108.80
Table 4-20– Parameters of Equation (4.2) for surrogate C.
Temperature [K]
373 1.17E-07 8.61 -0.85 5.82
398 2.89E-07 8.00 -0.75 6.04
408 2.56E-07 8.01 -0.76 6.05
In Figure 4-34; Figure 4-35, and Figure 4-36 are also plotted the
fittings of Equation (4.1) and Equation (4.2) for gasoline and surrogate C. For
all fittings the results were good, the R2 parameter for Equation (4.1) is 0.99
and 0.94 for Equation (4.2) in all three cases for gasoline and surrogate C.
Figure 4-37 and Figure 4-38, for gasoline C and surrogate C
respectively, demonstrate the dependence between flame speed and unburned
mixture temperature, for six levels of equivalence ratio, the lines are the fitted
equations using Equation (4.3).

122
Figure 4-37 – Laminar flame speed versus unburned mixture temperature
for gasoline C.
Figure 4-38– Laminar flame speed versus unburned mixture temperature
for surrogate C.

123
In Figure 4-37 and Figure 4-38, the slope of each curve
corresponds to the temperature dependence parameter for each equivalence
ratio. The dispersion of the data varies for each curve significantly; for the
worst case of gasoline C in Figure 4-37 (ϕ =1.3) the adjusted R2 is 0.95 with
a standard deviation of 0,20, and the best case (ϕ =1.0) the values are 0.99
and 0.01 for adjusted R2 and standard deviation respectively; for the worst
case of surrogate C in Figure 4-38 (ϕ =1.2) the adjusted R2 is 0.95 with a
standard deviation of 0,17, and the best case (ϕ =1.0) the values are 0.99 and
0.01 for adjusted R2 and standard deviation respectively. The parameters of
Equation (4.3) are presented in Table 4-21 and Table 4-22 for gasoline C and
surrogate C, respectively. These parameters can be substituted in Equation
(4.3), then it is possible to extrapolate or interpolate for any desired value of
unburned mixture temperature for a selected equivalence ratio, although
extrapolation for temperatures far from 700 K, because there is scarce data in
literature regarding comparison of this extrapolation and actual measured
values.
Table 4-21 – Parameters of Equation (4.3) for gasoline C.
,398KLS [cm/s]
0.8 45.4 1.974
0.9 52.1 1.791
1 56.7 1.774
1.1 58.4 1.836
1.2 56.5 1.933
1.3 50.1 2.042
Table 4-22 – Parameters of Equation (4.3) for surrogate C.
,398KLS [cm/s]
0.8 45.3 1.848
0.9 52.0 1.761
1 56.5 1.793
1.1 58.2 1.870
1.2 56.3 1.951
1.3 50.3 2.130

124
The temperature dependence parameter varies with the
equivalence ratio, this is illustrated by Figure 4-39 as well as Equation (4.4).
Figure 4-39 – Temperature dependence parameter versus equivalence ratio
for gasoline C and surrogate C.
The great agreement of the laminar flame speed of the surrogate C
and gasoline C extends to the temperature dependence parameter, the
difference of each value is never greater than the standard deviation.
The values for the dependence parameter vary over an average of
1.89 for gasoline C and 1,89 for surrogate C. As suggested in the previous
cases substitution of the quadratic function by the average value may be done
observing the consequences already pointed out in the previous fuels cases.
The global fitting equation for gasoline C is:
25.31 6.9
2
3 3.42
313.24 79.05 255.40 132.,398
92 uL u
TS T
(4.11)
The global fitting equation for surrogate C is:

125
21.69 0.2
3
0 0.4
2
3
1.37 32.63 206.75 116.,39
38
2 uL u
TS T
(4.12)
Equation (4.11) and (4.12) may be changed as described in the
previous cases, the exponential equation may be used in place of the third
degree polynomial function and the average of the temperature dependence
parameter may substitute the second degree polynomial function. The
consequences of these are the same as in the previous cases.
Deviation in percentage of the flame speed measured values from
the flame speed calculated values using the global fitting curve is illustrated
by Figure 4-40 and Figure 4-41, for gasoline C and surrogate C respectively.
Figure 4-40 - Deviation in percentage of the flame speed measured values
from the flame speed calculated values using the global fitting curve versus
normalized equivalence ratio for gasoline C.

126
Figure 4-41 - Deviation in percentage of the flame speed measured values
from the flame speed calculated values using the global fitting curve versus
normalized equivalence ratio for surrogate C.
By analyzing Figure 4-40 and Figure 4-41 it is possible to affirm
that the use of Equation (4.9) will result in a deviation of utmost +/- 2 % from
the actual value for the laminar flame speed of gasoline C and surrogate C.
Finally it is very useful to compare the flame speed of all fuels
tested ate a same temperature level versus the equivalence ratio. Figure 4-42
shows this comparison, the lines for each fuel are the cubic fitting curve ate
398 K. In the figure it is possible to preview some of the conclusions
presented in the next section and also some results already discussed in this
section.
The curve of the laminar flame speed of ethanol is higher than all
other fuels tested, and also presents a maximum value slightly dislocated to a
richer mixture of equivalence ratio of around 1.12. N-heptane presents the
second higher flame speed, and iso-octane is the presents the slower flame
speed for the tested fuels, both fuels present the maximum point of flame
speed at equivalence ratio of around 1.05 as it is also the case of gasoline and
surrogate A. Gasoline and surrogate A present flame speed just above iso-
octane’s. The addition of 27 % of ethanol to the gasoline and to the surrogate
results in a higher flame speed, but not as high as n-heptane’s, also it is
possible to perceive the addition of ethanol by analyzing the curve peak
which is slightly dislocated to a richer mixture (1.1), just as is also the ethanol
curve.

127
Figure 4-42 – Comparison of laminar flame speed versus equivalence ratio
of all tested fuels at 398 K.

128
5 CONCLUSIONS
In this work, the laminar flame speeds of ethanol, iso-octane, n-
heptane, gasoline, gasoline with 27% ethanol in volume, two surrogates for
the gasoline and the gasoline with ethanol, in mixture with dry air were
measured at 100 kPa, temperature range from 298 K to 408 K, and
equivalence ratio from 0.6 to 1.4. The measurements were made in a constant
volume reactor equipped with a high-speed camera (10000 FPS), for the
visualization of the spherically expanding flame front propagation using the
Schlieren method. Unstretched laminar flame speed was obtained through
extrapolation using a linear relation between flame stretch rate and flame
propagation velocity.
The main conclusions of the work are:
1. The results of laminar flame speed for the three pure substances (n-
heptane, iso-octane and ethanol) are in accordance to the values found in
literature. The values measured here differ up to 10 % when compared
with values obtained from different sources. The good agreement with
the literature validates the equipment and method.
2. The measurements were limited in the lower temperature and in the
richer side by the minimum initial temperature needed to evaporate the
fuel. The results for n-heptane at 298 K make this evident. The laminar
flame speed at equivalence ratio greater than 1.3 are larger (5%) than the
literature, and the values do not follow the same tendency as the literature
at other temperatures. This disagreement suggests lack of evaporation in
the experiments conducted in the rich side, at lower temperature.
3. A second limitation of the method is found at equivalence ratios larger
than 1.4 when the flame radius is around 30 mm. Experiments show that
the flame surface starts to wrinkle due to thermo-diffusive instability and
the propagation of the flame front deviates from that of a laminar flame.
This is observed in all tested fuels except for ethanol.
4. The laminar flame speed measured for the surrogates differ by, at most,
2 % when compared to the measurements for the commercial gasolines.
The hypothesis of formulating the surrogate using the mole fraction to
average the laminar flame speed for the pure components provided a
good approximation, since the difference between the laminar flame
speed of the surrogate and the corresponding gasoline is never greater
than 2%.
5. Despite the fact that the surrogates emulate with precision the laminar
flame speed of gasoline, the composition is not indicated for other
purposes besides flame speed simulations, since the surrogates lack and
aromatic substance. Aromatics are a very representative substance of
gasoline, composing up to 40 % in volume, and in order to emulate
further features related to its combustion an aromatic must be included.

129
The lack of an aromatic on the surrogates composition did not impaired
the results because the laminar flame speed of most aromatics such as
toluene is very close to the laminar flame speed of the gasoline itself as
it can be observed in the work of Dirrenberger, Glaude, et al. (2014).
6. Ethanol addition to gasoline produces an augmentation of the laminar
flame speed and dislocates the maximum point to a slightly richer value
of equivalence ratio. The addition of 27 % of ethanol dislocates the
maximum point of laminar flame speed from approximately 1.05 to 1.10
and accelerates approximately 3.5 % at the maximum point.
7. Both curves used to curve fit the measurements (third degree polynomial
and exponential function) presented good agreement with the
measurements. The third degree curve presents a better fitting, with an
adjusted R2 of 0.98 in average for all curves, against an adjusted R2 of
0.94 for the exponential function.
8. The use of the global fitting curve is recommended to obtain values for
laminar flame speed in conditions that are not measured. The deviation
in percentage for the calculated values using the global fitting curve from
the measured values is at maximum 4%. However, extrapolations far
from the range measured are not recommended, since the curve fits may
deviate in an unknown way. In this sense, the use of the exponential
function by Goulder is safer for extrapolation.
9. The temperature dependence parameter is in good agreement with the
literature. The uncertainty related to its determination is large, being
around 10 % of the value. Therefore, a larger set of experiments is
suggested to determine a value with a smaller uncertainty.
10. Gasoline C presented a larger temperature dependence for lean mixtures
than Gasoline A. At lean mixtures, the temperature dependence of
ethanol is greater than gasoline A, while for rich mixtures, there is an
inversion, the temperature dependence of gasoline A is greater than
ethanol. At rich mixtures the difference between the temperature
dependence of gasoline A and C decreases and is equal for equivalence
ratio of 1.3. This leads to conclude that the addition of ethanol affects
temperature dependence at the equivalence ratio when ethanol’s is
greater than the substance it is being added to.
11. Although a quadratic function best describes the dependence of the
temperature exponent with the equivalence ratio, a constant value can be
used for both gasolines providing essentially the same standard deviation
when the values predicted by the curve fit is compared to the
measurements.
In order to improve the quality of the results obtained and to better
understand the features of the flame established in the CVR’s chamber the
following suggestions for subsequent research are listed:

130
1. Perform new calculations of the laminar flame speed, assuming a non-
linear function to obtain the non-stretched flame speed in relation to the
unburned.
2. Obtain the elementary composition of the test fuels by means of a proper
test, instead of their standard average values.
3. Perform new calculations of the expansion factor utilizing the
elementary composition of the fuels ant their lower heating value.
4. Perform experiments in other temperature steps in order to reduce
uncertainty of the temperature dependence parameter.
5. Perform tests to determine the pressure dependence parameter.

131
BIBLIOGRAPHIC REFERENCE
ALBERTAZZI JR., A.; SOUSA, A. R. D. Fundamentos de Metrologia
Científica e Industrial. 1ª. ed. Barueri: Manole, v. 1, 2008. ISBN 405.
ANFAVEA.
http://www.anfavea.com.br/tabelas2007/autoveiculos/tabela10_producao.pd
f, 2014. Access in: 20 oct. 2014.
BEECKMANN, J.; CAI, L.; PITSCH, H. Experimental investigation of the
laminar burning velocities of methanol, ethanol, n-propanol, and n-butanol
at high pressure. Fuel, v. 117, p. 340-350, 2014.
BRADLEY, D. et al. The measurements of laminar burning velocities and
markstein numbers for iso-octane-air and iso-octane-n-heptane-air at
elevated temperatures and pressures in an explosion bomb. Combustion
and flame, n. 115, p. 126-144, 1998.
BRADLEY, D.; ANDREWS, G. E. The Burning Velocity of Methane-Air
Mixtures. Combustion and Flame, 1972. 275-288.
BRADLEY, D.; HUNDY, G. F. Burning velocities of methane-air
mixtures using hot-wire anemometers in closed-vessel explosions. [S.l.]:
[s.n.], 1971. ISBN Symposium (International) on Combustion, Volume 13,
1971, Páginas 575-583.
BRADLEY, D.; LAWES, M.; MANSOUR, M. S. Explosion bomb
measurements of ethanol–air laminar gaseous flame characteristics at
pressures up to 1.4 MPa. Combustion and Flame, v. 156, p. 1462-1470,
2009.
Brazilian Energy Balance 2014. Empresa de Pesquisa Energética. Rio de
Janeiro, p. 288. 2014.
BROUSTAIL, G. et al. Experimental determination of laminar burning
velocity for butanol and ethanol iso-octane blends. Fuel, v. 90, p. 1-6, 2013.
DAVIS, S. G.; LAW, C. K. Laminar flame speeds and oxidation kinetics of
iso-octane-air and n-heptane-air flames. International Symposium on
Combustion, v. 27, p. 521-527, 1998.

132
DIRRENBERGER, P. et al. Laminar burning velocity of gasolines with
addition of ethanol. Fuel, v. 115, p. 162-169, 2014.
EDMUND OPTICS. Edmund Optics, 2014. Disponivel em:
<http://www.edmundoptics.com/testing-targets/testing-alignment/schlieren-
systems/71-013>. Access in: 14 mar. 2014.
EISAZADEH-FAR, K. Burning speeds, flame kernel formation and
flame structure of bio-jet and JP8 fuels at high temperatures and
pressures. [S.l.]: [s.n.], 2010. ISBN PhD. Thesis, The Department of
Mechanical and Industrial Engineering, Northeastern University, Boston,
Massachusetts, 2010.
GLASSMAN, I.; YETTER, R. A. Combustion. 4ª. ed. Londres: Elsevier,
2008. 773 p.
GU, X. J. et al. Laminar Burning Velocity and Markstein Lengths of
Methane–Air Mixtures. Combustion and Flame, 2000. 41-58.
GÜLDER, Ö. L. Burning velocities of ethanol-isooctane blends.
Combustion and Flame, v. 56, p. 261-268, 1984.
GÜLDER, Ö. L. Correlations of Laminar Combustion Data for Alternative
S.I. Engine Fuels. SAE Technical Paper 841000, doi:10.4271/841000,
1984.
HALTER, F.; TAHTOUH, T.; MOUNAÏM-ROUSSELLE, C. Nonlinear
effects of stretch on the flame front propagation. Combustion and Flame,
v. 157, p. 1825-1832, 2010.
HARTMANN, E. M. INSTRUMENTAÇÃO E
OPERACIONALIZAÇÃO DE UM REATOR DE VOLUME
CONSTANTE PARA MEDIÇÃO DE VELOCIDADE DE CHAMA
LAMINAR. Master's Dissertation, UNIVERSIDADE FEDERAL DE
SANTA CARATINA, Departamento de Engenharia Mecânica,
Florianópolis: 2014.
HUANG, Y.; SUNG, C. J.; ENG, J. A. Measurements of Laminar Burning
Velocities for Natural Gas-Hidrogen-Air Mixtures. Combustion and
Flame, p. 302-311, 2006.

133
IPCC. http://mitigation2014.org/report/final-draft/. http:
//mitigation2014.org/, 20 oct. 2014. Disponivel em:
<http://mitigation2014.org/>. Access in: 20 oct. 2014.
KELLEY, A. P. et al. Laminar flame speeds, non-premixed stagnation
ignition, and reduced mechanisms in the oxidation of iso-octane.
Proceedings of the Combustion Institute, v. 33, p. 501-508, 2011.
KELLEY, A. P.; JOMAAS, G.; LAW, C. K. Critical radius for sustained
propagation of spark-ignited spherical flames. Combustion and Flame, v.
156, n. 5, p. 1006-1013, 2009.
KIM, N. I. et al. Flammability limits of stationary flames in tubes at low
pressure. Combustion and Flame, n. 141, p. 78-88, 2005.
KIM, W. K.; MOGI, T.; DOBASHI, R. Fundamental study on accidental
explosion behavior of hydrogen-air mixtures in an open space.
International Journal of Hydrogen Energy, n. 38, p. 8024-8029, 2013.
KOBAYASHI, H. et al. Burning velocity of turbulent premixed flames in a
high-pressure environment. Twenty-Sixth Symposium (International) on
Combustion/The Combustion Institute, p. 386-396, 1996.
KONNOV, A. A.; MEUWISSEN, R. J.; GOEY, L. P. H. D. The
temperature dependence of the laminar burning velocity of ethanol flames.
Proceedings of the Combustion Institute, v. 33, p. 1011-1019, 2011.
KWON, O. C.; HASSAN, M. I.; FAETH, G. M. Flame/Stretch Interactions
of Premixed Fuel-Vapor/O2/N2 Flames. Journal of Propulsion and
Power, v. 16, p. 513-522, 2000.
LAW, C. K. Combustion physics. 1. ed. Cambridge: Cambridge University
Press, 2006. 722 p.
LIAO, S. Y. et al. Determination of the laminar burning velocities for
mixtures of ethanol and air at elevated temperatures. Applied Thermal
Engineering, v. 27, p. 374-380, 2007.
MANNAA, O. et al. Laminar burning velocities at elevated pressures for
gasoline and gasoline surrogates associated with RON. Combustion and
Flame, v. 162, n. 6, p. 2311–2321, 2015.

134
MEHL, M. et al. Kinetic modeling of gasoline surrogate components and
mixtures under engine conditions. Proceedings of the Combustion
Institute, v. 33, n. 1, p. 193-200, 2011.
METGHALCHI, M.; KECK, J. C. Laminar burning velocity of propane-
air mixtures at high temperature and pressure. [S.l.]: [s.n.], 1980. ISBN
Combustion and Flame, Volume 38, 1980, Páginas 143-154.
METGHALCHI, M.; KECK, J. C. Burning Velocities of Mixtures of Air
with Methanol, Isooctane, and Indolene at High Pressures and
Temperatures. Combustion and Flame, 1982. 191-210.
MIAO, H.; LIU, Y. Measuring the laminar burning velocity and Markstein
length of premixed methane-nitrogen-air mixtures with the consideration of
nonlinear stretch effects. Fuel, v. 121, p. 208-205, 2014.
NATIONAL INTITUTE OF STANDARDS AND TECHNOLOGY, 2015.
Disponivel em: <http://www.nist.gov/>. Access in: 03 aug. 2015.
NIEMANN, U.; SESHADRI, K.; WILLIAMS, F. A. Methane, ethane, and
ethylene laminar counterflow diffusion flames at elevated pressures:
Experimental and computational investigations up to 2.0 MPa. Combustion
and Flame, n. 161, p. 138-146, 2014.
NIKON. http://www.microscopyu.com. MicroscopyU the source for
microscophy education, 2015. Disponivel em:
<http://www.microscopyu.com/articles/optics/images/aberrations/astigfigur
e2.jpg>. Access in: 03 aug. 2015.
PAGLIUSO, J. D. Biofuels for spark-ignition engines. In: ZHAO, H.
Advanced direct injection combustion engine technologies and
development Volume 1: Gasoline and gas engines. Boca Raton: CRC Press
LLC, 2010. p. 298.
PETERS, N. Turbulent Combustion. Cambridge: Cambridge University
Press, 2000.
PICARD, A. et al. Revised formula for the density of moist. Metrologia, n.
45, p. 149–155, 2008.

135
PITZ, W. J. et al. Development of an Experimental Database and Chemical
Kinetic Models for Surrogate Gasoline Fuels. SAE Paper No. 2007-01-
0175, 2007.
QIN, X.; KOBAYASHI, H.; , T. N. Laminar burning velocity of hydrogen-
air premixed flames at elevated pressure. Experimental Thermal and
Fluid Science, n. 21, p. 58-63, 2000.
RAU, F. et al. Laminar burning velocity measurements using the Heat Flux
method and numerical predictions of iso-octane/ethanol blends for different
preheat temperatures. Fuel, n. 140, p. 10-16, 2015.
REACTION DESIGN. CHEMKIN-PRO® Software Theory Manual.
San Diego: [s.n.], 2008.
SETTLES, G. S. Schlieren und shadowgraph techniques: visualizing
phenomena in transparent media. Berlin: Springer, 2001.
SILEGHEM, L. et al. Laminar burning velocity of gasoline and the gasoline
surrogate components iso-octane, n-heptane and toluene. Fuel, v. 112, p.
355-365, 2013.
SMALLBONE, A. J. et al. Experimental and modeling study of laminar
flame speed and non-premixed counterflow ignition of n-heptane.
Proceedings of the Combustion Institute, n. 32, p. 1245-1252, 2009.
SPALDING, D. B. Combustion and Mass Transfer. 1ª. ed. Londres:
Pergamon, 1979.
TURNS, S. R. An Introduction to Combustion: Concepts and
Applications. 2ª. ed. [S.l.]: McGraw-Hill, 1996. 565 p.
US ENERGY DEPARTMENT. Vehicle Technologies Office: Fuel
Efficiency and Emissions. http: //energy.gov, 23 jun. 2015. Disponivel em:
<http://energy.gov/eere/vehicles/vehicle-technologies-office-fuel-
efficiency-and-emissions>.
VAN LIPZIG, J. P. J. et al. Laminar burning velocities of n-heptane, iso-
octane, ethanol and their binary and tertiary mixtures. Fuel, v. 90, p. 2773-
2781, 2011.

136
VAREA, E. et al. Measurement of laminar burning velocity and Markstein
length relative to fresh gases using a new postprocessing procedure:
Application to laminar spherical flames for methane, ethanol and
isooctane/air mixtures. Combustion and Flame, n. 159, p. 577-590, 2012.
VELOO, P. S. et al. A comparative experimental and computational study
of methanol, ethanol, and n-butanol flames. Combustion and Flame, v.
157, p. 1989-2004, 2010.
WANG, Z. H. et al. Effect of H2/CO ratio and N2/CO2 dilution rate on
laminar burning velocity of syngas investigated by direct measurement and
simulation. Fuel, n. 141, p. 285-292, 2015.
WARNATZ, J.; MAAS, U.; DIBBLE, R. W. Combustion. 4th. ed. Berlin:
Springer, 2006.
WIESER, M. E. et al. Atomic weights of the elements 2011 (IUPAC
Technical Report). Pure and Applied Chemistry, v. 85, n. 5, 2013.
WON, S. H. et al. Characterization of Global Combustion Properties
with Simple Fuel Property Measurements for Alternative Jet Fuels.
Propulsion and Energy Forum 50th AIAA/ASME/SAE/ASEE Joint
Propulsion Conference. Cleveland: [s.n.]. 2014.
ZHAO, H. Advanced direct injection combustion engine technologies
and development. [S.l.]: Woodhead Publishing Limited, v. 1: Gasoline and
gas engines, 2010.

137
APPENDIX A - Effects of stretch and Lewis number on spherical flame
To understand the effects of stretch over the development of the
spherical flame is fundamental to properly interpret the results obtained in the
experiments. The discussion presented here is mostly based on LAW (2006).
Let us consider the positively stretched, outwardly propagating
flame whose radius fr is much larger than its thickness. In an interval t , the
flame radius grows by an amount , ,f f T Mr r r r , where Tr and Mr are
respectively the radii for the thermal and limiting reactant layers. Then the
volume for the thermal energy will be increased by an approximate amount:
3 3 24 4
43 3
T f T T fr r r r r (A.1)
while that for the reactant concentration by:
24 M fr r (A.2)
Figure A-1 illustrates the flame radius and the thermal and reactants radii
layers.
Figure A-1 – Representation of spherical flame propagation, flame radius
and the thermal and reactants radii layers.
Source: Adapted from LAW (2006).
The increase in the thermal limiting layers structure represents an
increased extent of heat transfer away from the reaction region, while an
increase in the reactant limiting layer represents an increased amount of
reactant supply to the reaction region. Consequently, if T Mr r , that is,
1Le , then the flame temperature is expected to be reduced from the

138
adiabatic flame temperature, thus decelerating the flame propagation, while
the opposite is true for 1Le .
It is expected that stretch will promote flame propagation, for
mixtures with 1Le and halt flame propagation for 1Le , this relation is
expressed by the Markstein length (Lb) calculated in Equation (2.37). Lb is
the inclination of the curve that relates the stretched flame speed and the
stretch rate. Figure A-2 shows stretched flame speed versus stretch rate for
hydrogen flames. For rich hydrogen flames, Lewis number is greater than
one, and as the stretch grows, the flame speed reduces, flame with
equivalence ratio of 0.9 presents a Lewis number near unity, and the influence
of stretch on flame speed is almost null, finally for equivalence ratio of 0.5
when 1Le stretch accelerates the flame propagation.
Figure A-2 – Stretched flame speed versus stretch rate for hydrogen flame
at unburned mixture temperature of 298 K.
Another important feature discussed by Kelley, Jomaas and Law
(2009), is the competition between stretch and energy supplied by the ignition
source. This competition can result in the extinction of the propagating flame,
for 1Le if the ignition energy is not sufficient to drive the reaction front to
a radius at which stretch effects are reduced, this is the case for lean
hydrocarbons flames.

139
For 1Le mixtures, the flame does not extinguish as long as a
flame kernel can be established. This is reasonable because the initial state of
the flame is the strongest, with a flame temperature that is higher than that of
the unstretched planar flame. The response of the 1Le flame, however, is
different, for sufficiently large values of the energy input, the flame speed
first decreases to a minimum value, and then increases to approach the planar
value. For weaker ignition kernels, the continuously decelerating flame
cannot recover and eventually extinguishes at a finite size. This results in a 3
regimen flame propagation, represented by Figure A-3, with data of stretched
flame speed against flame radius of iso-octane flame at equivalence ratio of
0.75, which corresponds to 1Le .
Figure A-3 - Stretched flame speed versus flame radius for iso-octane flame
(ϕ = 0.75 Tu=398 K).
Won, Veloo, et al. (2014) explain the three phases. Regime 1 is
the ignition energy driven flame propagation regime, where the excessively
high flame speed is observed first due to the sudden thermal expansion of the
ignition kernel, and later attenuated by the dissipation of thermal energy.
Regime 2 is a weak flame regime, where the fuel chemistry starts to populate
the radical pool and subsequently establishes the flame structure and
sustaining heat release, resulting into the fast transition from a thickened to
thin reaction zone. Regime 3 is the normal flame propagation regime, where

140
the unstretched planar laminar flame speed can be extracted by the linear
extrapolation.
To finalize the discussion on flame development it will be
addressed the influence of the Lewis number on flame wrinkling, which is
the phenomenon shown in Figure 4-3. There are three modes of intrinsic
cellular instability, namely diffusional-thermal instability, hydrodynamic
instability, and buoyancy-driven instability. Hydrodynamic instabilities are
caused by the difference of density of the burned and unburned mixture, and
are observed in flames developing in a sufficiently large pressure of unburned
mixture. Buoyancy-driven instabilities is induced by a body force, such as
gravity. These two instabilities modes, although present, do not explain the
difference among the difference of wrinkle in the flames pictured in Figure
4-3. Diffusional-thermal instabilities, which are caused by unbalance of mass
and heat diffusion, explain this difference. For the case in the picture (ϕ =
1,4) the Lewis number of ethanol-air mixture is greater than unity, and n-
heptane, iso-octane and gasoline smaller.
Law (2006) explain this phenomenon. The initially planar flame
must be perturbed, into alternating convex and concave segments toward the
unburned mixture, this perturbation is caused by the interaction with the
electrodes. Figure A-4 represents the effects of the Lewis number on the
instabilities.
Figure A-4 – Nonequidiffusion influence on flame stability.
Source: Adapted from LAW (2006).

141
The concave and convex segments are governed by the same
mechanisms of flame stretch addressed in this chapter. For a 1Le flame,
the burning is intensified at the concave segment and weakened at the convex
segment, leading to smoothing of the wrinkles. Consequently, such a flame
is cellularly stable. Conversely, by the same reasoning a 1Le flame is
cellularly unstable.

142
APPENDIX B - Uncertainty analysis
Uncertainty propagation calculation is made as already described.
In this section, details about the uncertainties of every measurement is
explained. The physical variables which uncertainty calculation is pertinent
are: pressure of the unburned mixture up , mass of injected fuel fm ,
unburned mixture temperature uT , the fuel composition C H ON N NC H O ,
reactor volume CVRV , oxygen molar fraction in air 2Ox , universal ideal gas
constant uR , molecular mass of the components MM , unstretched laminar
flame speed in relation to the burned mixture ,n bS , expansion ratio E . This
are the variables that are needed to calculate the equivalence ratio and the
laminar flame speed using Equation (3.1) and Equation (2.11) respectively.
The standard uncertainty of the measurement equipment together
with the data acquisition systems was already asserted in the previous work
of Hartmann (2014), the results are summarized in this section.
Each parameter of standard uncertainty presented in this section is
used in Equation (3.3), this equation is evaluated individually for every
experiment, and the results of the propagated standard uncertainty are plotted
as uncertainty bars in the laminar flame speed versus equivalence ratio
figures. Correlation of the variables is not considered.
B.1 Static pressure sensor
The initial pressure on the reactor, as already described, is
measured by a pressure sensor with a maximum pressure of 200 kPa and an
uncertainty of 0.08% of the full scale. The data acquisition system, which is
also described in the previous sections, reads the data of the pressure sensor
with an uncertainty of 0.015% of the full scale, that is 10 V.
The standard uncertainty of the pressure measurement system
(pressure sensor and data acquisition) is 0.2 uu p kPa .
B.2 Mass balance
The mass balance as already described, measures up to 200 g with
an 0.0002 g standard uncertainty. As the mass of fuel injected is the result of
the difference of the mass of the syringe prior and after injection, the standard
uncertainty of the injected fuel mass is 0.0004 gfmu .

143
B.3 Thermocouple
The thermocouple that measures the temperature of the unburned
mixture is a type K special with a range from -35 to 1260 °C and a standard
uncertainty coupled with the acquisition system of 1.1uu T K.
B.4 Fuel composition
All fuels, ethanol, n-heptane, iso-octane, gasoline A and gasoline
C where provided by PETROBRAS.
Ethanol presents a purity of 99.5 %, iso-octane and n-heptane: 99.0
%. Gasoline A and C are a complex mixture of several substances, their
simplified molecular formulas are represented by 7.55 14.70C H and 4,85 10.47C H
for gasoline A and C respectively, as data supplied by PETROBRAS.
Surrogates are prepared in 200 mL mixtures each using a burette,
the burette presents and standard uncertainty of 0.5 mL. That represents a
standard uncertainty of 0.25 % in volume composition for each fuel in the
surrogate.
To translate this impurity data into uncertainty the following
method is used. Let us use the simplified molecular formula of iso-octane as
an example: 8 18C H . The 1 % impurity present in the iso-octane samples is
assumed to translate directly into uncertainty in the carbon and hydrogen
numbers of the molecular formula. Therefore, with uncertainties represented,
the simplified molecular formula of iso-octane is: 8.00 0.08 18.00 0.18C H . For
gasoline A and gasoline C a 2% uncertainty is imposed. For surrogate A and
C the uncertainty of the burette is added to the uncertainty related to the
impurity of the substances.
This method results in an overestimate of the uncertainties,
because it is known that other substances present in the fuel samples,
classified as impurities, have a similar molecular composition to the most
abundant substance, a more precise calculation would result in a minor
uncertainty. Table B-1 shows the composition and related standard
uncertainty for each fuel.
Table B-1 – Table of uncertainty in fuels molecular composition.
Fuel NC u(NC) NH u(NH) NO u(NO)
iso-Octane 8.00 0.08 18.00 0.18 0 0.000
n-Heptane 7.00 0.07 16.00 0.16 0 0.000
Ethanol 2.00 0.01 6.00 0.03 1.000 0.005

144
Gasoline A 7.55 0.15 14.7 0.3 0 0.000
Gasoline C 4.85 0.10 10.5 0.2 0.49 0.01
Surrogate A 7.62 0.10 17.2 0.2 0 0.00
Surrogate C 4.76 0.06 11.5 0.1 0.508 0.006
B.5 Reactor volume
The CVR volume is evaluated using a 3D model, in order to assert
an uncertainty, due to construction and manufacturing imperfections, it is
assumed that the radius of the reactor is ±1 mm than designed, this deviation
is assumed as uncertainty. This method results is a calculated volume of 14.8
L and standard uncertainty of 0.1 LCVRu V .
B.6 Dry air composition and universal ideal gas constant and molecular
masses
Dry air is taken to have the composition of 0.20939 in molar
fraction of 2O as determined by PICARD, DAVIS, et al. (2008), other gases
are represented by nitrogen. The standard uncertainty is also determined by
PICARD, DAVIS, et al. (2008) as 2
0.00006Oxu .
Universal ideal gas constant and its uncertainty is taken from the
2014 CODATA recommended values available in the NATIONAL
INTITUTE OF STANDARDS AND TECHNOLOGY (2015) webpage. It’s
value is Ru = 8.3144598 J.mol-1.K-1 and standard uncertainty
1 10.0000048 J.mol .Kuu R .
Atomic weight of carbon, hydrogen and oxygen used to calculate
the molar mass of the fuel is taken from the values and standard uncertainties
from the 2011 IUPAC technical report WIESER, HOLDEN, et al. (2013).
Table B-2 shows the values.
Table B-2 – Table of uncertainty in atomic weight of elements.
Element Atomic weight (MM) Uncertainty u(MM)
Carbon 12.010 0.001
Hydrogen 1.0079 0.0001
Oxygen 15.9994 0.0004
Source: WIESER, HOLDEN, et al. (2013).

145
B.7 Unstretched laminar flame speed in relation to the burned mixture
The unstretched laminar flame speed in relation to the burned
mixture, is calculated as the intercept od the linear fitting equation that relates
stretched laminar flame speed in relation to the burned mixture versus stretch
rate, as it is already described. The standard uncertainty related to its value is
assumed as the standard deviation of the intercept. I falls for a great majority
experiments in the value of , 10 mm/sn bSu .
B.8 Expansion ratio
The method for calculate the expansion ratio is already described.
In order to assert an uncertainty related to its calculation, the method used is.
Calculate the expansion ratio using the ideal composition of the fuel as if it
is 100 % pure, and then repeat the calculation with the real purity and
assuming the impure fraction is not reactive, the difference from this two
values is found to be the standard uncertainty of the expansion ratio. This
method yields a value, for a great majority of experiments of 0.01 u E
.
B.9 Temperature dependence parameter
The standard uncertainty of temperature dependence parameter is
assumed to be the standard deviation of the fitting curve used to perform its
calculation.

146
APPENDIX C - Detailed step-by-step experimental procedure
A. Experiment initialization
1) Turn all dispositive on.
2) Check the 3 USB connections to the PC.
3) Check grip in the window’s bolts.
a) In case heating/cooling occurs, bolts must be opened.
b) If the temperature is constant the bolts must be tightened in 3 steps
of: 5 N.m; 10 N.m; 15 N.m.
4) In the PC open CVR.vi
a) Monitor the temperature
i) Click “heating” tab
(1) Check and control the heating system temperature.
(2) Control and wait until the heating reaches permanent
regime.
b) Check the camera
i) Click “Camera” tab.
ii) Click “Live” button.
(1) Calibrate optical system positioning, in order to obtain gray
tone image.
c) Test the spark
i) Click “Pressure” tab.
ii) Click “spark” button.
iii) Check reading of the current sensor.
2) Calibrate the mass balance
a) After the balance is at least 45 min on.
b) In the balance: Click “tar”.
c) Position the 200 g mass in the center of the balance.
d) Wait until the balance shows 200.0000 g.
e) Take the 200 g mass out.

147
B. Experiment procedure
1) In CVR.vi program enter the following:
a) Fuel name.
b) Fuel composition.
c) Pressure and temperature of the unburned fuel-air mixture.
d) Equivalence ratio.
2) Clean CVR:
a) Valve settings:
i) SV = open.
ii) NV = closed.
iii) PV1 = closed.
iv) PV2 = open.
v) RVi = open.
vi) RVo = open.
vii) VV = closed.
viii) AV = open.
b) Control the NV opening and control the pressure measured by the
P1 sensor in 130 kPa for 45 s.
3) Create vacuum:
a) Close SV, NV and AV.
b) Open VV.
c) Turn the vacuum pump on.
d) Wait until the pressure inside the reactor is stabilized to the
minimum of the pump capacity.
e) Close RVi and RVo in this order.
f) Turn the vacuum pump off.
g) Open AV.
4) Inject the fuel:

148
a) Check the “Ideal fuel mass” shown in the “pressure” tab of the
“CVR.vi” program.
b) Fill the syringe with fuel
c) Empty the syringe.
d) Place the empty syringe in the balance
e) Click “TAR”.
f) Fill the syringe with the ideal fuel mass.
g) Measure the mass of the full syringe in the balance.
h) Type in the “Full syringe” input the mass measured by the balance.
i) Insert the syringe in the CVR septum.
j) Press the syringe piston to the end.
k) Place the empty syringe in the mass balance.
l) Type in the “Empty syringe” input the mass measured by the
balance.
5) Fill the Reactor with air:
a) Close NV.
b) Open SV.
c) Open NV with caution.
d) Open RVi.
e) Control NV and SV until the pressure real and ideal pressure shown
in the “pressure” are equal.
f) Close NV, SV and RVi.
g) Wait until temperature inside the reactor is stabilized:
i) In the “heating” tab.
ii) Check the “inner temperature”.
iii) The temperature stabilizes in utmost 7 min.
h) Open RVi.
i) Check total real pressure.
j) Deactivate the static pressure sensor by clicking the green button in
the “pressure” tab.

149
k) Close RVi.
6) Spark:
a) Check in the tab “Camera”:
i) Click “Live”
(1) If the image is not a uniform shade of gray: recalibrate the
optical system.
ii) Click “Live”
b) Check if the ignition box is on:
i) Screen lights on.
ii) Initial voltage is the specified.
c) Check if RVi and RVo are closed.
d) Return to the “Pressure” tab:
i) Click the “spark” button.
ii) Follow on screen the pressure evolution.
iii) Click “save video” button.
7) Preparation for next experiment:
a) Close VV.
b) Open RVo and RVi in this order.
c) Return to the step 1 of the experiment proceeding.
C. Finalization of the experimental proceeding.
1) Do the step 1 and 2 of the experiment proceeding.
2) Untighten the bolts of the windows.
3) Set the valves to the positions:
i) SV = closed.
ii) NV = opened.
iii) PV1 = closed.
iv) PV2 = open.

150
v) RVi = open.
vi) RVo = open.
vii) VV = open.
viii) AV = open.
4) Turn all the devices off.