jm group interim report january – march …mb.cision.com/main/1261/2507028/830958.pdf · segment...
TRANSCRIPT

JM GROUP INTERIM REPORTJANUARY – MARCH 2018
1/2018

JANUARY–MARCH APR.–MAR. FULL-YEARSEK M 2018 2017 2017/2018 2017
Revenue 4,054 4,245 16,817 17,008
Operating profit 528 570 2,327 2,369
Operating margin, % 13.0 13.4 13.8 13.9
Profit before tax 512 829 2,262 2,579
Cash flow from operating activities –18 1,001 994 2,013
Return on equity, % 30.5 38.7
Equity/assets ratio, % 40 41 40
Earnings per share, SEK 5.70 9.90 26.80 31.00
Number of residential units sold 480 864 2,716 3,100
Number of housing starts 570 813 3,630 3,873
Number of residential units in current production 7,672 7,901 8,200
Revenue according to IFRS 3,825 4,157 16,943 17,275
Operating profit according to IFRS 507 582 2,381 2,456
Earnings per share according to IFRS, SEK 5.50 10.00 27.40 31.90
IFRS 15 Revenue from Contracts with Customers is applied to the consolidated income statement and balance sheet, which means that revenue and profit and loss for JM’s operations outside of Sweden, JM International, are reported according to the completed contract method. Segment reporting and project management are reported according to the percentage of completion method. The consolidated statements in accordance with IFRS are presented on pages 21-22. For definitions of key financial figures, see the document entitled “Definitions of key financial figures” at jm.se/investors.Unless otherwise specified, the analysis and comments in this interim report are based on JM’s segment reporting.
Cover photo: Fyrtornet, Dalénum, Lidingö
ACCORDING TO SEGMENT REPORTING
2
JANUARY – MARCH 2018
Revenue decreased to SEK 4,054m (4,245) and operating profit decreased to SEK 528m (570). The operating margin amounted to 13.0 percent (13.4)
Profit before tax decreased to SEK 512m (829) 1). Profit after tax decreased to SEK 399m (706) 1)
Return on equity for the past twelve months was 30.5 percent (36.1) 1). Earnings per share for the first quarter decreased to SEK 5.70 (9.90) 1)
Consolidated cash flow including net investment in properties was SEK –18m (1,001)
The number of residential units sold decreased to 480 (864) and housing starts decreased to 570 (813)
1) Including gains of SEK 275m from the sale of the participations in Småa AB in 2017
CAUTIOUS MARKET FOR NEW PRODUCTION IN STOCKHOLM
– STABILIZATION OF HOUSE PRICES IN SWEDEN AND NORWAY
2 J M G R O U P I N T E R I M R E P O RT J A N U A RY – M A R C H 2 0 1 8

Strandviks Flyglar, Gustavsberg, Värmdö
3
“The housing market in Stockholm continued to be cautious during the first quarter, but prices stabi-lized. The cautious market applies in particular to new production of homes with a long time until occupancy. Lower sales and a lower number of housing starts in Stockholm decreased the cur-rent production volume during the quarter. We are planning to
increase the number of housing starts during the year, assuming that the housing market stabilizes and that planning processes are stable. Housing starts in Stockholm during the first quarter were supported by a normal level of reservations, where profitability continues to be good in the current production volume.
The housing operations in the rest of Sweden are showing a positive development with good profitability levels in a market that continues to be stable, and prices remained more or less the same during the first quarter.
In Norway, the level of activity on the housing market was good with a slight increase in prices, and the housing market in Finland was stable during the first quarter.
We have noted an increase in the supply of residential develop-ment properties in Stockholm, and JM has a very good position to take advantage of the possibilities for acquisitions that may arise. In the rest of Sweden, competition for land is tough. JM’s strong financial position also supports our decision to prioritize the start of new housing projects.
One of the housing starts is the high-rise Fyrtornet, Lidingö’s new landmark in Dalénum, which will have a panorama view of Saltsjön and Djurgården. With 22 floors and glassed-in corner balconies, the building will have a beautiful design. The project also includes a sister building with eight floors. We will start production on 129 residential units here in this beautiful location next to the water and close to the commuter ferry to Nybroplan in downtown Stockholm.
In an excellent location in Gustavsberg, Värmdö, we started the first phase with 56 senior housing units in the Strandviks Flyglar project. We will build four buildings here in a park environment next to the bay, Farstaviken, with a view of the harbor.
As of 2018, all JM residential units that enter into the pre-construction phase will be certified in accordance with the Nordic Swan Ecolabel. The idea is that the efforts we have made over a period of many years to create a healthy environment and sustainable development should be more visible for housing cus-tomers. We are thus the first Nordic construction company to certify the entire Group’s production of its own residential units in accordance with the Nordic Swan Ecolabel. The Nordic Swan Ecolabel verifies that the buildings are energy-efficient, have good ventilation and are built with moisture-resistant materials that are free from substances harmful to the environment and people's health. This is a natural step in our efforts to be a market leader in sustainable housing.
We are well-positioned with a good project portfolio that we continue to improve for the housing of the future, at the same time as our strong balance sheet offers us freedom of action.”
Johan Skoglund, President and CEO
GROUP
3J M G R O U P I N T E R I M R E P O RT J A N U A RY – M A R C H 2 0 1 8

JANUARY–MARCH APRIL–MARCH FULL-YEAR
OPERATING MARGIN BY BUSINESS SEGMENT, % 2018 2017 2017/2018 2017
JM Residential Stockholm 18.6 18.9 20.1 20.1
JM Residential Sweden 16.8 14.3 16.2 15.5JM International 7.5 7.2 8.4 8.3JM Construction 0.0 1.8 0.0 0.4
JANUARY–MARCH APRIL–MARCH FULL-YEAR
OPERATING PROFIT BY BUSINESS SEGMENT, SEK M 2018 2017 2017/2018 2017
JM Residential Stockholm 274 347 1,365 1,438JM Residential Sweden 213 164 718 669JM International 53 58 266 271JM Property Development 2 7 22 27JM Construction 0 10 1 11Group-wide expenses –14 –16 –45 –47
Total 528 570 2,327 2,369
Of which property sales 11 - 25 14
1) According to segment reporting
335 379 372 445570 528
0
4
8
12
16
20
0
500
1 000
1 500
2 000
2 500
Q12013
Q3 Q12014
Q3 Q12015
Q3 Q12016
Q3 Q12017
Q3 Q12018
SEK m %OPERATING PROFIT AND OPERATING MARGIN
GROUP
1)
12-month period margin (%)
12-month period operating profit (SEK m)
Operating profit per quarter (SEK m)
REVENUEGROUP
1)
2 875 3 0373 417
3 7574 245 4 054
0
3 000
6 000
9 000
12 000
15 000
18 000
0
1 000
2 000
3 000
4 000
5 000
6 000
Q12013
Q3 Q12014
Q3 Q12015
Q3 Q12016
Q3 Q12017
Q3 Q12018
Revenue per quarter 12-month period
SEK m SEK m
1) According to segment reporting
4
MARKET, SALES AND HOUSING STARTS
JANUARY – MARCH 2018
The housing market in Stockholm continued to be cautious during the first quarter, but prices stabilized. Lower sales and a lower number of housing starts decreased the current production vol-ume during the quarter. Housing starts in Stockholm during the quarter were supported by a normal level of reservations, and profitability continues to be good in the current production vol-ume.
The housing operations in the rest of Sweden are showing a positive development with good profitability levels in a market that continues to be stable, and prices remained more or less the same during the first quarter.
In Norway, the level of activity on the housing market was good with a slight increase in prices, and the housing market in Finland was stable during the first quarter.
Population growth in our main markets, coupled with contin-ued low interest rates, supports demand for housing.
The number of residential units sold in the form of signed con-tracts was 480 (864) 1). The percentage of sold or reserved homes in relation to current production amounts to 61 percent (78), with an interval of 60-65 percent considered normal. JM Residential Stockholm sold 117 residential units (354), JM Residential Sweden sold 244 (321), JM International sold 119 (189) and JM Property Development sold 0 (0).
The number of housing starts amounted to 570 (813) 2). JM Residential Stockholm started production on 215 residential units (300), JM Residential Sweden on 286 (343), JM International on 69 (170) and JM Property Development on 0 (0).
In addition to demand, planning processes continue to be an important criterion for the rate of housing starts.
The number of residential units in current production amounted to 7,672 (7,901), of which 553 are rental units and res-idential care units (416).
1) Of which 0 rental units and residential care units (0).2) Of which 0 rental units and residential care units (0).
4 J M G R O U P I N T E R I M R E P O RT J A N U A RY – M A R C H 2 0 1 8

RESIDENTIAL UNITS IN CURRENT PRODUCTION 3/31/2018 3/31/2017 12/31/2017
Number of residential units in current production 1) 2) 7,672 7,901 8,200Percentage of sold residential units in current production, % 3) 54 66 58Percentage reserved residential units in current production, % 7 12 7Percentage sold and reserved residential units in current production, % 61 78 65
1) Of which rental units and residential care units in current production in JM Property Development – are not included in the percentage of sold and reserved residential units in current production 553 416 553
Including residential units in projects where costs incurred are only reported as project properties under construction 553 416 553
2) Beginning with production start-up through f inal occupancy according to plan.3) Percentage of sold residential units expressed as binding contract with the end customer.
UNSOLD UNITS 3/31/2018 3/31/2017 12/31/2017
Completed production, number of unsold units 1) 96 66 72
The number of unsold residential units in the balance sheet reported as “Participations in tenant-owners associations, etc.” 79 52 821) After f inal occupancy according to plan.
574694 748
856 813
570
0
1 000
2 000
3 000
4 000
5 000
0
500
1 000
1 500
2 000
2 500
Q12013
Q3 Q12014
Q3 Q12015
Q3 Q12016
Q3 Q12017
Q3 Q12018
Housing starts per quarter 12-month period
NumberHOUSING STARTS
GROUP Number
0
20
40
60
80
100
0
2 000
4 000
6 000
8 000
10 000
Q12013
Q3 Q12014
Q3 Q12015
Q3 Q12016
Q3 Q12017
Q3 Q12018
NumberRESIDENTIAL UNITS IN CURRENT PRODUCTION
%
JM InternationalJM Residential SwedenJM Residential Stockholm
Normal level sold/reserved (60-65%)Percentage sold/reserved, Group (%)
Total1)
1) Including rental units and residential care units in JM Property Development – not included in percentage of sold/reserved
5
RESIDENTIAL BUILDING RIGHTS
JANUARY – MARCH 2018
The number of available building rights at the end of the first quarter amounted to 34,900 (33,600), of which 19,400 (18,500) are recognized in the balance sheet. Capital tied up in building rights (development properties in the balance sheet) for residen-tial units increased to SEK 8,565m (6,837).
JM acquired development properties for residential units during the first quarter for SEK 1,396m (355), of which SEK 948m relates to JM Residential Stockholm, SEK 109m to JM Residential Sweden and SEK 339m to JM International.
REVENUE, OPERATING PROFIT AND OPERATING MARGIN
JANUARY – MARCH 2018
Consolidated revenue according to segment reporting for the first quarter decreased to SEK 4,054m (4,245). Revenue restated according to IFRS decreased to SEK 3,825m (4,157).
Operating profit according to segment reporting decreased to SEK 528m (570) and the operating margin amounted to 13.0 percent (13.4). Operating profit restated according to IFRS decreased to SEK 507m (582). The restatement is related to JM International and had an effect on earnings of SEK –21m (12).
During the first quarter properties were sold for SEK 69m (0) with gains of SEK 11m (0).
Rental income from JM’s project properties increased to SEK 14m (8). Net rental income increased to SEK 8m (4).
5J M G R O U P I N T E R I M R E P O RT J A N U A RY – M A R C H 2 0 1 8

JANUARY–MARCH APRIL–MARCH FULL-YEAR
SEK M 2018 2017 2017/2018 2017
Financial income 1) 1 275 5 279Financial expenses –17 –16 –70 –69
Financial income and expenses –16 259 –65 2101) Of which gains from the sale of participations in Småa AB - 275 - 275
JANUARY–MARCH APRIL–MARCH FULL-YEAR
ACCORDING TO SEGMENT REPORTING, SEK M 2018 2017 2017/2018 2017
Interest-bearing net liabilities(+)/receivables(–) at beginning of the period –790 435 –778 435Change in interest-bearing net liabilities/receivables 42 –1,213 30 –1,225
Interest-bearing net liabilities(+)/receivables(–) at end of the period –748 –778 –748 –790
-320 -243 -348-95
1 099
-18
-1 500
-1 000
-500
0
500
1 000
1 500
Q12013
Q3 Q12014
Q3 Q12015
Q3 Q12016
Q3 Q12017
Q3 Q12018
Cash flow per quarter 12-month period
SEK mCASH FLOW
GROUP
1)
-748-1
-0,5
0
0,5
1
1,5
-1 000
-500
0
500
1 000
1 500
2014 2015 2016 2017 31 March2018
Interest-bearing net liabilities(+)/receivables(-) Debt/equity ratio
SEK mINTEREST-BEARING NET LIABILITIES(+)/RECEIVABLES(-)
GROUP times
1)
1) Total cash flow for the period 1) According to segment reporting
6
FINANCIAL ITEMS
JANUARY – MARCH 2018
Net financial items remained the same compared to the previous year taking into account the sale in 2017 of the participations in Småa AB.
Total interest-bearing loans according to segment reporting was SEK 1,820m (1,845), of which the provision for pensions comprised SEK 1,264m (1,252). At the end of the first quarter, the average interest rate for the total interest-bearing loan stock including pension liabilities was 2.5 percent (2.4). The average term for fixed-rate loans excluding the pension liability was 0.2 years (0.4).Consolidated available liquidity was SEK 5,364m (5,419). Aside from cash and cash equivalents of SEK 2,564m (2,619), this
includes unutilized overdraft facilities and credit lines totaling SEK 2,800m (2,800), where credit agreements for SEK 2,400m had an average maturity of 2.4 years (1.2).
Interest-bearing net receivables according to segment reporting totaled SEK 748m (778) at the end of the first quar-ter. Non-interest-bearing liabilities for completed property acquisitions amounted to SEK 1,375m (463). Of these liabilities, SEK 675m (313) were current.
The valuation of financial assets and liabilities shows that there is no material difference between the carrying amount and the fair value.
6 J M G R O U P I N T E R I M R E P O RT J A N U A RY – M A R C H 2 0 1 8

7
CASH FLOW
JANUARY – MARCH 2018
Cash flow from operating activities according to segment report-ing was SEK –18m (1,001) during the first quarter. Net invest-ments in development properties resulted in a cash flow of SEK –318m (122). Holdings of repurchased residential units resulted in a cash flow of SEK –13m (–39). Consolidated cash flow attrib-utable to project properties (sales minus investment) during the first quarter was SEK –118m (–86).
RISKS AND UNCERTAINTIES
JM’s risk and risk management policies are presented in the 2017 Annual Report on pages 30-33. No significant changes have occurred to change these reported risks.
BUY-BACK AND HOLDINGS OF OWN SHARES
After the 2017 Annual General Meeting, 1,476,421 shares were bought back for SEK 375m. No acquisitions were made during the first quarter of 2018.
The number of outstanding shares, excluding holdings of own shares, at March 31, 2018, totals 69,583,262.
PERSONNEL
The number of employees at the end of the first quarter was 2,570 (2,444). The number of wage-earners was 1,002 (1,008) and the number of salaried employees was 1,568 (1,436). Cur-rent staffing is considered well balanced for the current proj-ect volume and some adjustments are made on a regular basis. Demand on the labor market is strong for qualified project devel-opment skills.
7J M G R O U P I N T E R I M R E P O RT J A N U A RY – M A R C H 2 0 1 8

JANUARY–MARCH APRIL–MARCH FULL-YEAR
SEK M 2018 2017 2017/2018 2017
Revenue 1,475 1,840 6,786 7,151Operating profit 1) 274 347 1,365 1,438Operating margin, % 18.6 18.9 20.1 20.1Average operating capital 4,663 4,450Return on operating capital, % 29.3 32.3Operating cash flow –77 498 1,028 1,603Carrying amount, development properties 5,229 4,121 4,406Number of available building rights 13,300 12,800 13,400Number of residential units sold 117 354 915 1,152Number of housing starts 215 300 1,358 1,443Number of residential units in current production 3,510 3,714 3,842Number of employees 926 2) 854 877
1) Of which property sales - - 6 6
2) Of which 42 employees who were previously organizationally placed under JM Construction
263294
347
274
0
5
10
15
20
25
30
0
100
200
300
400
500
600
Q12015
Q3 Q12016
Q3 Q12017
Q3 Q12018
Operating profit per quarter (SEK m) 12-month period margin (%)
SEK m %OPERATING PROFIT AND OPERATING MARGIN
JM RESIDENTIAL STOCKHOLM
-413
460 498
-77
-1 000
-500
0
500
1 000
1 500
2 000
Q12015
Q3 Q12016
Q3 Q12017
Q3 Q12018
Cash flow per quarter 12-month period
CASH FLOWJM RESIDENTIAL STOCKHOLMSEK m
88
The average prices on the existing home market did not change during the first quarter. The supply of homes continued to be high, and in particular in some local markets.
Competition for well-situated land for housing is judged to be relatively low at the same time as the supply of properties for housing development is relatively high. However, prices of building rights are still at a level that requires selective acquisition.
The housing market in Stockholm continued to be cautious during the first quarter, particularly with regard to new produc-tion.
Customers are showing strong interest in JM’s projects, but are taking a cautious approach to signing contracts early in the pro-cess. Residential units available for sale in the business segment largely have planned occupancy in 2019 and 2020.
Housing starts in Stockholm during the first quarter were sup-ported by a normal level of reservations, and profitability contin-ues to be good in the current production volume. The plan is to
increase the number of housing starts during the year, assuming that the housing market stabilizes and that planning processes are stable.
Business segment revenue decreased to SEK 1,475m (1,840). The lower revenue in the first quarter is due to lower sales, a lower number of housing starts, and a low level of land trans-ferred to projects during the quarter. The operating profit was SEK 274m (347). Profit was burdened by lower sales, at the same time as completed projects had a positive effect on profit during the quarter. The operating margin was 18.6 percent (18.9).
Cash flow during the first quarter is in balance taking into con-sideration the increase in development properties.
Production was started in the first quarter on 215 residential units in apartment buildings in Lidingö, Stockholm and Värmdö.
During the first quarter, JM purchased building rights corre-sponding to 777 residential units in Solna, Stockholm and Täby.
BUSINESS SEGMENTSJM RESIDENTIAL STOCKHOLM The JM Residential Stockholm business segment develops residential projects in Greater Stockholm. Operations include acquisitions of development prop-erties, planning, pre-construction, production and sales of residential units.
J M G R O U P I N T E R I M R E P O RT J A N U A RY – M A R C H 2 0 1 8

JANUARY–MARCH APRIL–MARCH FULL-YEAR
SEK M 2018 2017 2017/2018 2017
Revenue 1,269 1,146 4,432 4,309Operating profit 1) 213 164 718 669Operating margin, % 16.8 14.3 16.2 15.5Average operating capital 897 892Return on operating capital, % 80.0 75.0Operating cash flow 232 497 351 616Carrying amount, development properties 1,394 1,322 1,540Number of available building rights 10,200 9,800 10,100Number of residential units sold 244 321 1,225 1,302Number of housing starts 286 343 1,354 1,411Number of residential units in current production 2,210 2,169 2,351Number of employees 592 581 590
1) Of which property sales 0 - 0 -
60
105
164
213
0
2
4
6
8
10
12
14
16
18
0
30
60
90
120
150
180
210
240
270
Q12015
Q3 Q12016
Q3 Q12017
Q3 Q12018
Operating profit per quarter (SEK m) 12-month period margin (%)
SEK m %OPERATING PROFIT AND OPERATING MARGIN
JM RESIDENTIAL SWEDEN
79174
497
232
-300
-100
100
300
500
700
900
1 100
Q12015
Q3 Q12016
Q3 Q12017
Q3 Q12018
Cash flow per quarter 12-month period
CASH FLOWJM RESIDENTIAL SWEDENSEK m
99
Average prices on the existing home market in the business segment stabilized during the first quarter following the decline in the fall of 2017. Two exceptions are Uppsala and Linköping, where prices continued to decrease slightly. The supply on certain local markets continues to be large.
Competition for land for housing is tough. Interest in JM’s proj-ects is stable, and customers’ willingness to sign a contract early in the process is at a normal level.
The business segment’s revenue increased to SEK 1,269m (1,146), and operating profit increased to SEK 213m (164). The operating margin increased to 16.8 percent (14.3). The profit and
the margin improved as a result of good demand and an increase in prices in recent years.
Cash flow during the first quarter is in balance taking into consideration the decrease in development properties and the increase in working capital.
Production was started in the first quarter on 286 residential units in apartment buildings in Lund, Gothenburg, Örebro and Uppsala.
During the first quarter, JM purchased building rights corre-sponding to 350 residential units in Gothenburg, Linköping and Uppsala.
JM RESIDENTIAL SWEDEN The JM Residential Sweden business segment develops residential projects in growth areas in Sweden, excluding Greater Stockholm. Operations include acquisitions of development properties, planning, pre-construction, production and sales of residential units. Contracting operations are also conducted to a limited extent.
J M G R O U P I N T E R I M R E P O RT J A N U A RY – M A R C H 2 0 1 8

JANUARY–MARCH APRIL–MARCH FULL-YEAR
SEK M 2018 2017 2017/2018 2017
Revenue 710 807 3,165 3,262- of which JM Norway 604 698 2,683 2,777
Operating profit 1) 53 58 266 271- of which JM Norway 50 56 257 263
Operating margin, % 7.5 7.2 8.4 8.3- of which JM Norway 8.3 8.0 9.6 9.5
Average operating capital 2,273 2,175
Return on operating capital, % 11.7 12.5
Operating cash flow 92 78 133 119
Carrying amount, development properties 1,932 1,394 1,545
Carrying amount, project properties 8 13 7
Number of available building rights 10,600 10,100 10,500
Number of residential units sold 119 189 576 646
Number of housing starts 69 170 781 882
Number of residential units in current production 1,399 1,602 1,454
Number of employees 417 373 406
1) Of which property sales 11 - 11 0
3140
5853
0
2
4
6
8
10
0
20
40
60
80
100
Q12015
Q3 Q12016
Q3 Q12017
Q3 Q12018
Operating profit per quarter (SEK m) 12-month period margin (%)
SEK m %OPERATING PROFIT AND OPERATING MARGIN
JM INTERNATIONAL
-53
74 78 92
-400
-200
0
200
400
600
800
Q12015
Q3 Q12016
Q3 Q12017
Q3 Q12018
Cash flow per quarter 12-month period
CASH FLOWJM INTERNATIONALSEK m
1010
Business segment revenue decreased to SEK 710m (807) and operating profit decreased to SEK 53m (58). The operating mar-gin was 7.5 percent (7.2).
A temporary decrease in working capital strengthened cash flow during the first quarter.
NORWAY
Prices on the existing home market in Norway increased slightly during the first quarter, and the level of activity has been good. The time to closing is longer than it has been in previous years.
JM Norway’s revenue decreased to SEK 604m (698) and oper-ating profit decreased to SEK 50m (56). The operating margin was 8.3 percent (8.0).
During the first quarter, 84 residential units (135) were sold and production began on 69 units (129). Housing starts during the first quarter consist of residential units in apartment buildings in Lillestrøm outside of Oslo and single-family homes in Horten and Sandefjord. The number of residential units in current production amounted to 1,138 (1,327).
The low level of housing starts is in line with the annual plan, and this number will increase during the year assuming a stable market and stable planning conditions.
During the first quarter, JM purchased building rights corresponding to 570 residential units in the Oslo region and 24 in Bergen.
Available building rights correspond to 7,700 residential units (7,500).
JM INTERNATIONAL The JM International business segment develops residential projects primarily in Norway and Finland. Revenue and profit for the business segment is reported according to the percentage of completion method. Contracting operations are also conducted to a limited extent in Norway, and as of 2018 they are reported in the JM Construction business segment. Comparative figures have been restated.
J M G R O U P I N T E R I M R E P O RT J A N U A RY – M A R C H 2 0 1 8

Lundkvartalet, Skedsmo, Norway
1111
FINLAND
The housing market in the Helsinki region was stable during the first quarter. The housing market is in balance and activity is good.
During the first quarter, 32 residential units (53) were sold and production began on 0 units (41). The number of residential units in current production amounted to 261 (275).
During the quarter, JM purchased building rights corresponding to 0 residential units (105).
Available building rights correspond to 2,700 residential units (2,400).
BELGIUM
JM closed its operations in Belgium in the first quarter of 2017. JM is still the owner of one development property and two resi-dential units that are for sale. During the first quarter, 3 residential units (1) were sold.
Available building rights correspond to 200 residential units (200).
J M G R O U P I N T E R I M R E P O RT J A N U A RY – M A R C H 2 0 1 8

JANUARY–MARCH APRIL–MARCH FULL-YEAR
SEK M 2018 2017 2017/2018 2017
Revenue 15 18 57 60Operating profit 1) 2 7 22 27Average operating capital 910 800Return on operating capital, % 2.4 3.4Operating cash flow –109 –71 –454 –416Carrying amount, development properties 10 35 10Carrying amount, project properties 1,185 675 1,067Number of available building rights 2) 800 900 800Number of residential units sold 2) - - - -Number of housing starts 2) - - 137 137Number of residential units in current production 2) 553 416 553Number of employees 47 30 35
1) Of which property sales - - 8 8
2) Refers to rental units and residential care units.
15
6 7
2
-10
0
10
20
30
Q12015
Q3 Q12016
Q3 Q12017
Q3 Q12018
Operating profit per quarter (SEK m)
SEK mOPERATING PROFIT
JM PROPERTY DEVELOPMENT
-5
69
-71-109
-600
-300
0
300
Q12015
Q3 Q12016
Q3 Q12017
Q3 Q12018
Cash flow per quarter 12-month period
CASH FLOWJM PROPERTY DEVELOPMENTSEK m
1212
Business segment revenue decreased to SEK 15m (18), of which rental income was SEK 14m (8). Operating profit was SEK 2m (7). The operating profit was burdened by start-up costs for the new business operations, JM@home. Net rental income for project properties increased to SEK 8m (3).
Cash flow during the first quarter is negative due to ongoing investments in project properties.
Within the Dalénum area on Lidingö, the occupancy rate in the remaining commercial buildings that will not be demolished was 91 percent. Within the Bolinder area in Kallhäll, Järfälla, the occupancy rate in the buildings that will not be demolished was 94 percent.
The Dalénum rental project consisting of 97 apartments was completed in 2016 and is held in JM’s balance sheet. All apart-ments are rented out.
Production is underway on four rental projects in JM’s own bal-ance sheet: the Tjärtunnan project in Stureby, 187 residential units with occupancy in 2018; the Spaken project in Hägernäs, Täby, 136 residential units with occupancy planned for 2018/2019; the Alphyddan project in Sickla, Nacka, 93 student apartments with occupancy planned for 2018; and Alba Lilium, Bredäng, 137 resi-dential units with occupancy planned for 2019.
JM PROPERTY DEVELOPMENT The JM Property Development business segment primarily develops rental units, residential care units and commercial properties in Greater Stockholm. The business segment's entire portfolio comprises project development properties. This business segment also includes JM@home as of January 1, 2018, which offers economic and technical management services to tenant-owners associations as well as home services.
J M G R O U P I N T E R I M R E P O RT J A N U A RY – M A R C H 2 0 1 8

JANUARY–MARCH APRIL–MARCH FULL-YEAR
SEK M 2018 2017 2017/2018 2017
Revenue 1) 698 552 2,897 2,751Operating profit 0 10 1 11Operating margin, % 0.0 1.8 0.0 0.4Operating cash flow –154 31 –99 86Carrying amount, development properties 42 50 42Number of employees 432 464 462
1) Of which internal 113 118 520 525
1813 10
0
-2
-1
0
1
2
3
4
5
-20
-10
0
10
20
30
40
50
Q12015
Q3 Q12016
Q3 Q12017
Q3 Q12018
Operating profit per quarter (SEK m) 12-month period margin (%)
SEK m %OPERATING PROFIT AND OPERATING MARGIN
JM CONSTRUCTION
77
-49
31
-154-200
-150
-100
-50
0
50
100
150
200
Q12015
Q3 Q12016
Q3 Q12017
Q3 Q12018
Cash flow per quarter 12-month period
CASH FLOWJM CONSTRUCTIONSEK m
1313
Demand in the contracting market in Stockholm is at a good level. Both the building and civil engineering markets are stable, although there is tough competition for the assignments. Demand in the contracting market in Oslo is also at a good level. Orders are good in the business segment, with a large number of projects in current production.
Business segment revenue increased to SEK 698m (552), of which the operations in Norway amounted to SEK 144m (115), and the operating profit decreased to SEK 0m (10). The profit was affected by a negative revaluation in current projects in the Swedish operations. A long-term project is underway in the business segment to raise profitability.
Cash flow is burdened by a temporary increase in working capital. The business segment received a number of assignments during
the first quarter, of which the largest was land work in the future freight harbor at Stockholm Norvik in Nynäshamn for Ports of Stockholm. JM Construction also entered into a five-year cooper-ation agreement with Riksbyggen.
The largest ongoing projects are a new operational area at Arlanda Airport (Swedavia), new production of a school (Vallentuna Municipality), new production of apartment buildings in Norra Djurgårdsstaden (HSB and Riksbyggen) and new pro-duction of apartment buildings in Tyresö (Småa and Riksbyggen). The largest ongoing project in the Norwegian operations is the new production of apartments in Strømmen (JM Norge AS).
JM CONSTRUCTIONThe JM Construction business segment carries out construction work for external and internal customers in Greater Stockholm and Oslo. Contracting operations conducted in Norway are reported in the JM Construction business segment as of January 1, 2018. Comparative figures have been restated.
J M G R O U P I N T E R I M R E P O RT J A N U A RY – M A R C H 2 0 1 8

CONDENSED CONSOLIDATED INCOME STATEMENT
JANUARY–MARCH APRIL–MARCH FULL-YEAR
ACCORDING TO SEGMENT REPORTING, SEK M 2018 2017 2017/2018 2017
Revenue 4,054 4,245 16,817 17,008Production and operating costs –3,265 –3,429 –13,484 –13,648
Gross profit 789 816 3,333 3,360Selling and administrative expenses –272 –246 –1,031 –1,005Gains/losses on the sale of property 11 - 25 14
Operating profit 528 570 2,327 2,369Financial income and expenses –16 259 –65 210
Profit before tax 512 829 2,262 2,579Taxes –113 –123 –375 –385
Profit for the period 399 706 1,887 2,194
Other comprehensive income 87 –14 91 –10
Comprehensive income for the period 486 692 1,978 2,184
Earnings per share 1), diluted, SEK 5.70 9.90 26.80 31.00
Average number of shares, diluted 69,800,801 71,520,740 70,431,773 70,844,023
1) Net prof it for the period.
CONDENSED CONSOLIDATED BALANCE SHEET
ACCORDING TO SEGMENT REPORTING, SEK M 3/31/2018 3/31/2017 12/31/2017
ASSETSNon-current assets 221 215 209Project properties 1,193 688 1,074Development properties 8,607 6,922 7,543Participations in tenant-owners associations, etc. 309 205 309Current receivables 1) 3,828 3,173 3,698Cash and cash equivalents 2,564 2,619 2,572
Total current assets 16,501 13,607 15,196
Total assets 16,722 13,822 15,405
EQUITY AND LIABILITIES 2)
Shareholders’ equity 6,664 5,725 6,178Non-current interest-bearing liabilities 220 259 203Other non-current liabilities 700 150 273Non-current provisions 2,846 2,321 2,656
Total non-current liabilities 3,766 2,730 3,132Current interest-bearing liabilities 336 334 332Other current liabilities 5,831 4,932 5,654Current provisions 125 101 109
Total current liabilities 6,292 5,367 6,095
Total equity and liabilities 16,722 13,822 15,405
1) Of which receivables from property sales 78 60 83
2) Of which liabilities for property acquisition 1,448 580 794
GROUP – SEGMENT REPORTING
1414 J M G R O U P I N T E R I M R E P O RT J A N U A RY – M A R C H 2 0 1 8

CONDENSED CONSOLIDATED STATEMENT OF CHANGES IN EQUITY
JANUARY–MARCH FULL-YEAR
ACCORDING TO SEGMENT REPORTING, SEK M 2018 2017 2017
Opening balance at beginning of period 6,178 5,158 5,158Total comprehensive income for the period 486 692 2,184Dividend - - –675Conversion of convertible loan - 0 10Equity component of convertible debentures - - 1Buy-back of shares - –125 –500
Closing balance at the end of the period 6,664 5,725 6,178
CONDENSED CONSOLIDATED STATEMENT OF CASH FLOWS
JANUARY–MARCH APRIL–MARCH FULL-YEAR
ACCORDING TO SEGMENT REPORTING, SEK M 2018 2017 2017/2018 2017
Cash flow from operating activities before change in working capital and taxes 756 656 3,195 3,095Paid tax –261 –99 –523 –361Investment in development properties, etc. 1) –949 –591 –2,852 –2,494Payment on account for development properties, etc. 2) 618 674 1,982 2,038Investment in project properties –118 –86 –522 –490
Sale of project properties - - 6 6Change in current liabilities/receivables –64 447 –292 219
Cash flow from operating activities –18 1,001 994 2,013
Cash flow from investing activities –1 307 3) –8 300 3)
Loans raised 49 21 242 214Amortization of debt –48 –105 –241 –298Buy-back of shares - –125 –375 –500Dividend - - –675 –675
Cash flow from financing activities 1 –209 –1,049 –1,259
Cash flow for the period –18 1,099 –63 1,054
Cash and cash equivalents at end of the period 2,564 2,619 2,564 2,572
1) Of which investment in participations in tenant-owners associations and freehold residential units –180 –162 –593 –575
2) Of which the sale of participations in tenant-owners associations and freehold residential units 167 123 539 495
3) Of which SEK 310m refers to the sale of the participations in Småa AB.
GROUP KEY FIGURES
JANUARY–MARCH APRIL–MARCH FULL-YEAR
ACCORDING TO SEGMENT REPORTING, % 2018 2017 2017/2018 2017
Operating margin 13.0 13.4 13.8 13.9Return on capital employed 30.5 38.7Return on equity 29.1 35.1Debt/equity ratio, multiple - - -Equity/assets ratio 40 41 40
1515J M G R O U P I N T E R I M R E P O RT J A N U A RY – M A R C H 2 0 1 8

REVENUE BY COUNTRY
JANUARY–MARCH APRIL–MARCH FULL-YEAR
SEK M 2018 2017 2017/2018 2017
Sweden 3,215 3,323 13,171 13,279Norway 733 813 3,164 3,244Finland 94 108 468 482Belgium 12 1 14 3
Total 4,054 4,245 16,817 17,008
REVENUE BY BUSINESS SEGMENT
JANUARY–MARCH APRIL–MARCH FULL-YEAR
SEK M 2018 2017 2017/2018 2017
JM Residential Stockholm 1,475 1,840 6,786 7,151JM Residential Sweden 1,269 1,146 4,432 4,309JM International 710 807 3,165 3,262JM Property Development 15 18 57 60JM Construction 698 552 2,897 2,751Elimination –113 –118 –520 –525
Total 4,054 4,245 16,817 17,008
OPERATING PROFIT BY BUSINESS SEGMENT
JANUARY–MARCH APRIL–MARCH FULL-YEAR
SEK M 2018 2017 2017/2018 2017
JM Residential Stockholm 274 347 1,365 1,438JM Residential Sweden 213 164 718 669JM International 53 58 266 271JM Property Development 2 7 22 27JM Construction 0 10 1 11Group-wide expenses –14 –16 –45 –47
Total 528 570 2,327 2,369
OPERATING MARGIN BY BUSINESS SEGMENT
JANUARY–MARCH APRIL–MARCH FULL-YEAR
% 2018 2017 2017/2018 2017
JM Residential Stockholm 18.6 18.9 20.1 20.1JM Residential Sweden 16.8 14.3 16.2 15.5JM International 7.5 7.2 8.4 8.3JM Construction 0.0 1.8 0.0 0.4
AVERAGE OPERATING CAPITAL BY BUSINESS SEGMENT
APRIL–MARCH FULL-YEAR
SEK M 2017/2018 2017
JM Residential Stockholm 4,663 4,450JM Residential Sweden 897 892JM International 2,273 2,175JM Property Development 910 800
RETURN ON OPERATING CAPITAL BY BUSINESS SEGMENT
APRIL–MARCH FULL-YEAR
% 2017/2018 2017
JM Residential Stockholm 29.3 32.3JM Residential Sweden 80.0 75.0JM International 11.7 12.5JM Property Development 2.4 3.4
16
ACCORDING TO SEGMENT REPORTING
16 J M G R O U P I N T E R I M R E P O RT J A N U A RY – M A R C H 2 0 1 8
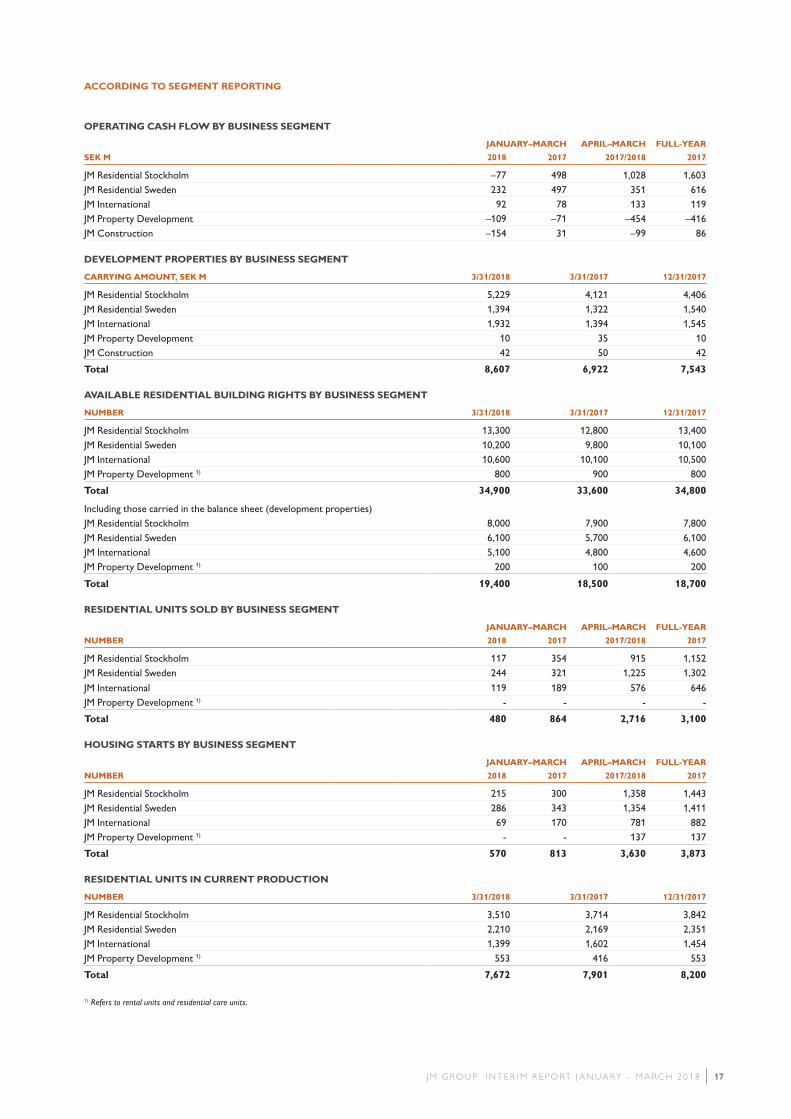
OPERATING CASH FLOW BY BUSINESS SEGMENT
JANUARY–MARCH APRIL–MARCH FULL-YEAR
SEK M 2018 2017 2017/2018 2017
JM Residential Stockholm –77 498 1,028 1,603JM Residential Sweden 232 497 351 616JM International 92 78 133 119JM Property Development –109 –71 –454 –416JM Construction –154 31 –99 86
DEVELOPMENT PROPERTIES BY BUSINESS SEGMENT
CARRYING AMOUNT, SEK M 3/31/2018 3/31/2017 12/31/2017
JM Residential Stockholm 5,229 4,121 4,406JM Residential Sweden 1,394 1,322 1,540JM International 1,932 1,394 1,545JM Property Development 10 35 10JM Construction 42 50 42
Total 8,607 6,922 7,543
AVAILABLE RESIDENTIAL BUILDING RIGHTS BY BUSINESS SEGMENT
NUMBER 3/31/2018 3/31/2017 12/31/2017
JM Residential Stockholm 13,300 12,800 13,400JM Residential Sweden 10,200 9,800 10,100JM International 10,600 10,100 10,500JM Property Development 1) 800 900 800
Total 34,900 33,600 34,800
Including those carried in the balance sheet (development properties)JM Residential Stockholm 8,000 7,900 7,800JM Residential Sweden 6,100 5,700 6,100JM International 5,100 4,800 4,600JM Property Development 1) 200 100 200
Total 19,400 18,500 18,700
RESIDENTIAL UNITS SOLD BY BUSINESS SEGMENT
JANUARY–MARCH APRIL–MARCH FULL-YEAR
NUMBER 2018 2017 2017/2018 2017
JM Residential Stockholm 117 354 915 1,152JM Residential Sweden 244 321 1,225 1,302
JM International 119 189 576 646JM Property Development 1) - - - -
Total 480 864 2,716 3,100
HOUSING STARTS BY BUSINESS SEGMENT
JANUARY–MARCH APRIL–MARCH FULL-YEAR
NUMBER 2018 2017 2017/2018 2017
JM Residential Stockholm 215 300 1,358 1,443JM Residential Sweden 286 343 1,354 1,411JM International 69 170 781 882JM Property Development 1) - - 137 137
Total 570 813 3,630 3,873
RESIDENTIAL UNITS IN CURRENT PRODUCTION
NUMBER 3/31/2018 3/31/2017 12/31/2017
JM Residential Stockholm 3,510 3,714 3,842JM Residential Sweden 2,210 2,169 2,351JM International 1,399 1,602 1,454JM Property Development 1) 553 416 553
Total 7,672 7,901 8,200
1) Refers to rental units and residential care units.
17
ACCORDING TO SEGMENT REPORTING
17J M G R O U P I N T E R I M R E P O RT J A N U A RY – M A R C H 2 0 1 8

GROUP FIVE-YEAR OVERVIEWACCORDING TO SEGMENT REPORTING, SEK M 2017 2016 2015 2014 2013
Revenue 17,008 15,752 14,447 13,869 12,652Operating profit 2,369 2,011 1,590 1,716 1,576Profit before tax 2,579 1,951 1,518 1,641 1,517Total assets 15,405 12,848 12,230 12,545 11,394Cash flow from operating activities 2,013 1,957 –230 978 898Interest-bearing net liabilities (+)/receivables (–) –790 435 1,198 –337 –642Operating margin, % 13.9 12.8 11.0 12.4 12.5Return on equity, % 38.7 31.4 24.8 26.5 25.1Equity/assets ratio, % 40 40 38 37 40Earnings per share, SEK 31.00 21.20 15.50 16.00 14.50Dividend per share, SEK 11.00 9.50 8.25 8.00 7.25Number of available building rights 34,800 32,500 31,100 29,400 27,700Number of residential units sold 3,100 3,843 3,770 3,195 3,265Number of housing starts 3,873 4,187 3,731 3,445 2,953Number of residential units in current production 8,200 7,984 7,212 6,375 5,609
1) Board proposal
PROJECT PROPERTIES, GROUP
CARRYING AMOUNT, SEK M 3/31/2018 3/31/2017 12/31/2017
Properties under development 955 451 837Completed rental unit properties 224 218 224Completed commercial properties 14 19 13
Total 1,193 688 1,074
DEVELOPMENT PROPERTIES, GROUP
JANUARY–MARCH APRIL–MARCH FULL-YEAR
CARRYING AMOUNT, SEK M 2018 2017 2017/2018 2017
Opening balance at beginning of period 7,543 7,121 6,922 7,121New purchases 1,396 355 3,058 2,017Transferred to production –375 –539 –1,370 –1,534Other 43 –15 –3 –61
Closing balance at the end of the period 8,607 6,922 8,607 7,543
18
ACCORDING TO SEGMENT REPORTING
18 J M G R O U P I N T E R I M R E P O RT J A N U A RY – M A R C H 2 0 1 8

GROUP QUARTERLY OVERVIEW
ACCORDING TO SEGMENT REPORTING, SEK M 2018 2017
INCOME STATEMENT Q 1 Q 4 Q 3 Q 2 Q 1
Revenue 4,054 4,551 3,813 4,399 4,245Production and operating costs –3,265 –3,659 –3,047 –3,513 –3,429Gross profit 789 892 766 886 816Selling and administrative expenses –272 –254 –223 –282 –246Gains/losses on the sale of property 11 0 - 14 -Operating profit 528 638 543 618 570Financial income and expenses –16 –17 –15 –17 259Profit before tax 512 621 528 601 829Taxes –113 –15 –117 –130 –123Profit for the period 399 606 411 471 706
CONSOLIDATED BALANCE SHEET 3/31 12/31 9/30 6/30 3/31
ASSETSNon-current assets 221 209 211 213 215Project properties 1,193 1,074 878 791 688Development properties 8,607 7,543 6,984 6,892 6,922Participations in tenant-owners associations, etc. 309 309 267 269 205Current receivables 3,828 3,698 3,524 3,477 3,173Cash and cash equivalents 2,564 2,572 2,557 2,211 2,619Total current assets 16,501 15,196 14,210 13,640 13,607Total assets 16,722 15,405 14,421 13,853 13,822
EQUITY AND LIABILITIESShareholders’ equity 6,664 6,178 5,653 5,381 5,725Non-current interest-bearing liabilities 220 203 333 223 259Other non-current liabilities 700 273 150 150 150Non-current provisions 2,846 2,656 2,405 2,371 2,321Total non-current liabilities 3,766 3,132 2,888 2,744 2,730Current interest-bearing liabilities 336 332 204 435 334Other current liabilities 5,831 5,654 5,564 5,184 4,932Current provisions 125 109 112 109 101Total current liabilities 6,292 6,095 5,880 5,728 5,367Total equity and liabilities 16,722 15,405 14,421 13,853 13,822
CASH FLOW STATEMENT Q 1 Q 4 Q 3 Q 2 Q 1
From operating activities –18 145 574 293 1,001From investing activities –1 –3 –1 –3 307From financing activities 1 –128 –225 –697 –209Total cash flow for the period –18 14 348 –407 1,099Cash and cash equivalents at end of the period 2,564 2,572 2,557 2,211 2,619
INTEREST-BEARING NET LIABILITIES/RECEIVABLES Q 1 Q 4 Q 3 Q 2 Q 1
Interest-bearing net liabilities(+)/receivables(–) at beginning of the period –790 –727 –274 –778 435Change in interest-bearing net liabilities/receivables 42 –63 –453 504 –1,213Interest-bearing net liabilities(+)/receivables(–) at end of the period –748 –790 –727 –274 –778
DEVELOPMENT PROPERTIES Q 1 Q 4 Q 3 Q 2 Q 1
Carrying amount at beginning of period 7,543 6,984 6,892 6,922 7,121New purchases 1,396 803 477 382 355Transferred to production –375 –228 –379 –388 –539Other 43 –16 –6 –24 –15Carrying amount at end of period 8,607 7,543 6,984 6,892 6,922
KEY RATIOS Q 1 Q 4 Q 3 Q 2 Q 1
Operating margin, % 13.0 14.0 14.2 14.0 13.4Debt/equity ratio, multiple - - - - -Equity/assets ratio, % 40 40 39 39 41Earnings per share, SEK 5.70 8.60 5.80 6.70 9.90Number of available building rights 34,900 34,800 34,800 34,600 33,600Number of residential units sold 480 684 681 871 864Number of housing starts 570 1,183 971 906 813Number of residential units in current production 7,672 8,200 7,739 7,641 7,901
1919J M G R O U P I N T E R I M R E P O RT J A N U A RY – M A R C H 2 0 1 8

BUSINESS SEGMENT QUARTERLY OVERVIEW
ACCORDING TO SEGMENT REPORTING, SEK M 2018 2017
JM RESIDENTIAL STOCKHOLM Q 1 Q 4 Q 3 Q 2 Q 1
Revenue 1,475 1,820 1,613 1,878 1,840Operating profit 1) 274 397 331 363 347Operating margin, % 18.6 21.8 20.5 19.3 18.9Average operating capital 4,663 4,450 4,374 4,354 4,345Return on operating capital, % 2) 29.3 32.3 32.6 32.3 31.0Operating cash flow –77 225 505 375 498Carrying amount, development properties 5,229 4,406 3,941 4,074 4,121Number of available building rights 13,300 13,400 13,300 13,000 12,800Number of residential units sold 117 197 213 388 354Number of housing starts 215 324 365 454 300Number of residential units in current production 3,510 3,842 3,837 3,598 3,7141) Of which property sales - - - 6 -
JM RESIDENTIAL SWEDEN Q 1 Q 4 Q 3 Q 2 Q 1
Revenue 1,269 1,094 916 1,153 1,146Operating profit 1) 213 181 149 175 164Operating margin, % 16.8 16.5 16.3 15.2 14.3Average operating capital 897 892 898 893 967Return on operating capital, % 2) 80.0 75.0 68.4 67.2 55.7Operating cash flow 232 159 –11 –29 497Carrying amount, development properties 1,394 1,540 1,486 1,225 1,322Number of available building rights 10,200 10,100 10,100 10,000 9,800Number of residential units sold 244 301 332 348 321Number of housing starts 286 360 372 336 343Number of residential units in current production 2,210 2,351 2,196 2,279 2,1691) Of which property sales 0 - - - -
JM INTERNATIONAL Q 1 Q 4 Q 3 Q 2 Q 1
Revenue 710 926 721 808 807Operating profit 1) 53 84 63 66 58Operating margin, % 7.5 9.1 8.7 8.2 7.2Average operating capital 2,273 2,175 2,106 2,074 2,028Return on operating capital, % 2) 11.7 12.5 12.0 12.0 10.3Operating cash flow 92 –207 179 69 78Carrying amount, development properties 1,932 1,545 1,497 1,533 1,394Carrying amount, project properties 8 7 14 12 13Number of available building rights 10,600 10,500 10,500 10,700 10,100Number of residential units sold 119 186 136 135 189Number of housing starts 69 362 234 116 170Number of residential units in current production 1,399 1,454 1,290 1,348 1,6021) Of which property sales 11 0 - - -
JM PROPERTY DEVELOPMENT Q 1 Q 4 Q 3 Q 2 Q 1
Revenue 15 12 11 19 18Operating profit 1) 2 3 0 17 7Average operating capital 910 800 697 623 550Return on operating capital, % 2) 2.4 3.4 6.0 7.9 5.6Operating cash flow –109 –203 –65 –77 –71Carrying amount, development properties 10 10 10 10 35Carrying amount, project properties 1,185 1,067 864 779 675Number of available building rights 3) 800 800 900 900 900Number of residential units sold 3) - - - - -Number of housing starts 3) - 137 - - -Number of residential units in current production 3) 553 553 416 416 4161) Of which property sales - - - 8 -3) Refers to rental units and residential care units.
JM CONSTRUCTION Q 1 Q 4 Q 3 Q 2 Q 1
Revenue 698 833 689 677 552Operating profit 0 –13 5 9 10Operating margin, % 0.0 –1.6 0.7 1.3 1.8Operating cash flow –154 40 78 –63 31
JM OTHER Q 1 Q 4 Q 3 Q 2 Q 1
Revenue (elimination) –113 –134 –137 –136 –118Operating profit (Group-wide expenses) –14 –14 –5 –12 –16
2) Calculated on 12-month rolling prof its and average capital.
2020 J M G R O U P I N T E R I M R E P O RT J A N U A RY – M A R C H 2 0 1 8

CONDENSED CONSOLIDATED INCOME STATEMENT
JANUARY–MARCH APRIL–MARCH FULL-YEAR
ACCORDING TO IFRS, SEK M 2018 2017 2017/2018 2017
Revenue 3,825 4,157 16,943 17,275Production and operating costs –3,057 –3,329 –13,556 –13,828
Gross profit 768 828 3,387 3,447Selling and administrative expenses –272 –246 –1,031 –1,005Gains/losses on the sale of property 11 - 25 14
Operating profit 507 582 2,381 2,456Financial income and expenses –16 259 –65 210
Profit before tax 491 841 2,316 2,666Taxes –110 –129 –388 –407
Profit for the period 381 712 1,928 2,259
Other comprehensive incomeItems that will be reclassif ied as incomeTranslation differences from the translation of foreign operations 78 –12 46 –44Items that will not be reclassif ied as incomeRestatement of defined-benefit pensions 0 0 53 53Tax attributable to other comprehensive income 0 0 –12 –12
Comprehensive income for the period 459 700 2,015 2,256Net profit for the period is attributable to shareholders of the Parent Company 381 712 1,928 2,259Comprehensive income for the period is attributable to shareholders of the Parent Company 459 700 2,015 2,256
Earnings per share 1), basic, attributable to shareholders of the Parent Company, SEK 5.50 10.00 27.40 32.00Earnings per share 1), diluted, attributable to shareholders of the Parent Company, SEK 5.50 10.00 27.40 31.90
Number of outstanding shares at end of period 69,583,262 71,010,408 69,583,262 69,583,262
Average number of shares, basic 69,583,262 71,288,879 70,222,029 70,642,592
Average number of shares, diluted 69,800,801 71,520,740 70,431,773 70,844,023
1) Net prof it for the period.
CONDENSED CONSOLIDATED BALANCE SHEET
ACCORDING TO IFRS, SEK M 3/31/2018 3/31/2017 12/31/2017
ASSETSNon-current assets 221 215 209Project properties 1,193 688 1,074Development properties 8,607 6,922 7,543Participations in tenant-owners associations, etc. 309 205 309Work in progress 2,651 2,187 2,291Current receivables 3,105 2,520 2,949Cash and cash equivalents 2,564 2,619 2,572
Total current assets 18,429 15,141 16,738
Total assets 18,650 15,356 16,947
EQUITY AND LIABILITIES 1) 2)
Shareholders’ equity 6,502 5,526 6,043Non-current interest-bearing liabilities 220 259 203Other non-current liabilities 700 150 273Non-current provisions 2,804 2,267 2,619
Total non-current liabilities 3,724 2,676 3,095
Current interest-bearing liabilities 2,162 2,240 1,728Other current liabilities 6,137 4,813 5,972Current provisions 125 101 109
Total current liabilities 8,424 7,154 7,809
Total equity and liabilities 18,650 15,356 16,947
Pledged assets 503 708 744Contingent liabilities 9,547 10,254 9,9931) Of which project f inancing JM International 2,203 1,906 1,857
2) Of which liabilities for property acquisition 1,448 580 794
GROUP – IFRS
2121J M G R O U P I N T E R I M R E P O RT J A N U A RY – M A R C H 2 0 1 8

CONDENSED CONSOLIDATED STATEMENT OF CHANGES IN EQUITY
JANUARY–MARCH FULL-YEAR
ACCORDING TO IFRS, SEK M 2018 2017 2017
Opening balance at beginning of period 6,043 4,951 4,951Total comprehensive income for the period 459 700 2,256Dividend - - –675Conversion of convertible loan - 0 10Equity component of convertible debentures - - 1Buy-back of shares - –125 –500
Closing balance at the end of the period 6,502 5,526 6,043
CONDENSED CONSOLIDATED STATEMENT OF CASH FLOWS
JANUARY–MARCH APRIL–MARCH FULL-YEAR
ACCORDING TO IFRS, SEK M 2018 2017 2017/2018 2017
Cash flow from operating activities before change in working capital and taxes 735 668 3,249 3,182Paid tax –261 –99 –523 –361Investment in development properties, etc. 1) –949 –591 –2,852 –2,494Payment on account for development properties, etc.2) 618 674 1,982 2,038Investment in project properties –118 –86 –522 –490
Sale of project properties - - 6 6Change in current liabilities/receivables –378 359 –215 522
Cash flow from operating activities –353 925 1,125 2,403
Cash flow from investing activities –1 307 3) –8 300 3)
Loans raised 49 21 242 214Amortization of debt –48 –105 –241 –298Loans raised, project financing 411 160 1,043 792Amortization of debt, project financing –76 –84 –1,174 –1,182Buy-back of shares - –125 –375 –500Dividend - - –675 –675
Cash flow from financing activities 336 –133 –1,180 –1,649
Cash flow for the period –18 1,099 –63 1,054
Cash and cash equivalents at end of the period 2,564 2,619 2,564 2,572
1) Of which investment in participations in tenant-owners associations and freehold residential units –180 –162 –593 –575
2) Of which sale of participations in tenant-owners associations and freehold residential units 167 123 539 495
3) Of which SEK 310m refers to the sale of the participations in Småa AB.
ACCOUNTING PRINCIPLES
This interim report for the first quarter of 2018 has been prepared in accordance with IAS 34 Interim Financial Reporting and the Swedish Annual Accounts Act. The consolidated accounts were prepared in accordance with the International Financial Reporting Standards (IFRS). Since the Parent Company is an enterprise within the EU, only EU-approved IFRS are applied. The Parent Company’s accounts were prepared in accordance with RFR 2.
The accounting principles and methods of calculation for the Group have not changed compared to the description on pages 82-85 of the 2017 Annual Report with two exceptions: IFRS 15 Revenue from Contracts with Customers and IFRS 9 Financial Instruments apply as of January 1, 2018. However, the transition to IFRS 15 and IFRS 9 has not had any impact on the Group’s or the Parent Compa-ny’s performance and financial position. For more information about JM’s implementation of IFRS 15 and IFRS 9, refer to pages 82-85 in the 2017 Annual Report.
2222 J M G R O U P I N T E R I M R E P O RT J A N U A RY – M A R C H 2 0 1 8

JM APPLIES THE FOLLOWING NEW STANDARDS AS OF 2018
IFRS 15 REVENUE FROM CONTRACTS WITH CUSTOMERS
IFRS 15 refers to the recognition of revenue from contracts and the sale of some non-financial assets.
JM makes the assessment that the reporting of the project development of residential units in Sweden can continue to occur with the application of the percentage of completion method. The contracts with the tenant-owners association are entered into simultaneously, are priced as a single unit and are assessed to constitute a performance obligation. Since JM is contractually obligated to deliver a specific building and during the course of the project is entitled to payment, the assessment is made that revenue must be reported over time, i.e. using the percentage of completion method.
With regard to corresponding business in Norway and Finland, the assessment is made that there is no entitlement to payment, which means that, in the same manner as today, revenue must be reported at a specific point in time, i.e. completion. The assessment is also made that revenue in JM Construction can continue to be reported using the percentage of completion method since the construction is carried out on land that the cus-tomer controls.As a whole, IFRS 15 is not considered to result in any changes to JM’s revenue recognition principles.
IFRS 9 FINANCIAL INSTRUMENTS
IFRS 9 refers to the reporting of financial instruments. It contains rules for classification and measurement of financial assets and liabilities, impairment of financial instruments and hedge account-ing. JM makes the assessment that IFRS 9 could affect the mea-surement of some receivables, but the effect is not considered material.
For more information about JM’s application of IFRS 15 and IFRS 9, refer to pages 82-85 in the 2017 Annual Report.
SEGMENT REPORTING
JM’s contracting operations in Norway are reported in the JM Construction business segment as of 2018. Comparative figures for the business segments JM International and JM Construction have been restated.
PARENT COMPANYCONDENSED INCOME STATEMENT, PARENT COMPANY
JANUARY–MARCH FULL-YEAR
SEK M 2018 2017 2017
Net sales 2,730 3,047 11,602Production and operating costs –2,080 –2,379 –8,878
Gross profit 650 668 2,724Selling and administrative expenses –199 –174 –699Gains/losses on the sale of property 0 - 14
Operating profit 451 494 2,039Financial income and expenses –8 262 310
Profit before appropriations and tax 433 756 2,349Appropriations - - –167
Profit before tax 433 756 2,182Taxes –97 –106 –288
Profit for the period 336 650 1,894
CONDENSED BALANCE SHEET, PARENT COMPANY
SEK M 3/31/2018 3/31/2017 12/31/2017
AssetsNon-current assets 1,365 1,237 1,221Current assets 10,893 9,119 10,155
Total assets 12,258 10,356 11,376
Equity and liabilities Shareholders’ equity 3,386 2,835 3,050Untaxed reserves 2,360 2,170 2,360Provisions 1,518 944 1,334Non-current liabilities 765 254 340Current liabilities 4,229 4,153 4,292
Total equity and liabilities 12,258 10,356 11,376Pledged assets 169 169 169Contingent liabilities 9,672 10,378 10,162
2323J M G R O U P I N T E R I M R E P O RT J A N U A RY – M A R C H 2 0 1 8

CONSOLIDATED INCOME STATEMENT JANUARY–MARCH APRIL–MARCH FULL-YEAR
SEK M 2018 2017 2017/2018 2017
Revenue for the period (segment reporting) 4,054 4,245 16,817 17,008Restatement JM International –229 –88 126 267
Revenue for the period (IFRS) 3,825 4,157 16,943 17,275
Operating profit/loss for the period (segment reporting) 528 570 2,327 2,369
Restatement JM International –21 12 54 87Operating profit/loss for the period (IFRS) 507 582 2,381 2,456
Profit/loss for the period (segment reporting) 399 706 1,887 2,194
Restatement JM International –18 6 41 65
Profit/loss for the period (IFRS) 381 712 1,928 2,259
CONSOLIDATED BALANCE SHEET
SEK M 3/31/2018 3/31/2017 12/31/2017
Balance sheet total (segment reporting) 16,722 13,822 15,405Restatement JM International –275 –372 –315Reclassification project financing JM International 1,826 1,906 1,396Reclassification project financing JM International, non-interest-bearing 1) 377 - 461Balance sheet total (IFRS) 18,650 15,356 16,9471) Billing on account to customers
CONSOLIDATED EQUITY
SEK M 3/31/2018 3/31/2017 12/31/2017
Equity (segment reporting) 6,664 5,725 6,178Restatement JM International –162 –199 –135Equity (IFRS) 6,502 5,526 6,043
GROUP KEY FIGURES
% 3/31/2018 3/31/2017 12/31/2017
Equity/assets ratio (segment reporting) 40 41 40Equity/assets ratio (IFRS) 35 36 35
CONSOLIDATED CASH FLOWJANUARY–MARCH APRIL–MARCH FULL-YEAR
SEK M 2018 2017 2017/2018 2017
Cash flow from operating activities (segment reporting) –18 1,001 994 2,013Reclassification project financing JM International –335 –76 131 390
Cash flow from operating activities (IFRS) –353 925 1,125 2,403
CONSOLIDATED INTEREST-BEARING NET LIABILITIES/RECEIVABLES
SEK M 3/31/2018 3/31/2017 12/31/2017
Interest-bearing net liabilities (+)/receivables (–) at end of period (segment reporting) –748 –778 –790Reclassification project financing JM International 1,826 1,906 1,396
Interest-bearing net liabilities (+)/receivables (–) at end of period (IFRS) 1,078 1,128 606
REVENUE PER BUSINESS SEGMENT ACCORDING TO IFRS 15JANUARY–MARCH APRIL–MARCH FULL-YEAR
SEK M 2018 2017 2017/2018 2017
JM Residential Stockholm 1,475 1,840 6,786 7,151JM Residential Sweden 1,269 1,146 4,432 4,309JM International 481 719 3,291 3,529JM Property Development 15 18 57 60JM Construction 698 552 2,897 2,751Elimination –113 –118 –520 –525
Total 3,825 4,157 16,943 17,275
RECONCILIATION BETWEEN SEGMENT REPORT-ING AND IFRS
2424 J M G R O U P I N T E R I M R E P O RT J A N U A RY – M A R C H 2 0 1 8

25
The company’s auditors did not review this interim report.
Stockholm, April 27, 2018JM AB (publ)
Johan SkoglundPresident and Chief Executive Officer
25J M G R O U P I N T E R I M R E P O RT J A N U A RY – M A R C H 2 0 1 8

BUSINESS CONCEPT
With people in focus and through constant development, we create homes and sustainable living environments.
VISION
We are laying the foundations for a better life.
BUSINESS
JM is one of the leading developers of housing and residential areas in the Nordic region.
Operations focus on new production of homes in attractive locations, with the main focus on expanding metropolitan areas and university towns in Sweden, Norway and Finland. We are also involved in project development of commercial premises and contract work, primarily in the Greater Stockholm area.
JM should promote long-term sustainability work in all its oper-ations. Annual sales total approximately SEK 17 billion and the company has around 2,600 employees. JM AB is a public limited company listed on NASDAQ Stockholm, Large Cap segment.
FINANCIAL TARGETS AND DIVIDENDS POLICY
The operating margin should amount to 10 percent, including gains/losses from property sales. The visible equity ratio should amount to 35 percent over a business cycle.
Over time, the dividend should reflect the earnings trend in total operating activities and over a business cycle on average cor-respond to 50 percent of consolidated profit after tax. Capital gains from property sales are a natural part of JM’s project devel-opment operations and therefore are included in the calculation of dividends.
JM's financial targets are defined based on segment reporting.
JM’s Annual Reports, Interim Reports and other financial information are available at jm.se/investors
DISCLOSURES
This information is information that JM AB is obliged to make public pursuant to the EU Market Abuse Regulation and the Securities Markets Act. The information was submitted for publication, through the agency of the contact person set out below, at 08.00 CET on April 27, 2018.
FOR MORE INFORMATION PLEASE CONTACT:
Claes Magnus Åkesson, CFO, Head of IRTel. +46 8 782 89 71
FINANCIAL CALENDAR
July 13, 2018 Interim Report January - June
October 25, 2018 Interim Report January - September
PRESS RELEASES, Q1 2018
March 28 JM selling property in Larvik, Norway
March 28 JM acquiring property in Asker, outside Oslo, Norway
March 26 JM acquiring building rights on Södermalm in Stockholm
March 22 JM acquiring building rights in Järvastaden, Solna
March 9 Notice of JM’s Annual General Meeting on
April 12, 2018
March 8 JM Construction doing site and engineering work at
Stockholm Norvik Port in Nynäshamn
February 23 Nomination Committee’s proposed Board composition
for JM AB’s 2018 Annual General Meeting
February 1 Year-end Report 2017
January 31 JM and Skanska continue to develop Täby Park
JM IN BRIEF
2626 J M G R O U P I N T E R I M R E P O RT J A N U A RY – M A R C H 2 0 1 8

Text: JM
Photo/Illustrations: Richard Hammarskiöld, Sara Brehmer, Gunnar Kaiser, Elisabeth Toll, Carbonwhite

JM AB (publ)Mailing address SE-169 82 StockholmStreet address Gustav III:s boulevard 64, SolnaTelephone +46 8 782 87 00Fax +46 8 782 86 00Comp. Reg. No. 556045-2103Website www.jm.se/en