jimmycomelatey creek-lower sequim bay … monitoring plan... · restoration project: estuary...
TRANSCRIPT
JIMMYCOMELATEY CREEK-LOWER SEQUIM BAY ESTUARY RESTORATION PROJECT:
ESTUARY MONITORING PLAN
Prepared by: SHREFFLER ENVIRONMENTAL Dave Shreffler 3890 Lost Mountain Road Sequim, WA 98382-7925
Prepared for:
Jamestown S’Klallam Tribe 1033 Old Blyn Highway Sequim, WA 98382
EPA Contract Number: BG-97012801 EPA Project Officer: Ralph Thomas Rogers, Region 10 EPA
January 09, 2004

Estuary Monitoring Plan
EXECUTIVE SUMMARY
This monitoring plan describes all tasks to monitor the success or failure of the estuary restoration
elements of the Jimmycomelately Creek-Lower Sequim Bay Estuary Restoration Project. This
plan is a companion document to the existing Jimmycomelately Creek Realignment
Monitoring Plan (Shreffler 2001). For the sake of clarity, some sections of the JCL Creek
Monitoring Plan have been repeated here rather than referring the reader back to that document.
In contrast to the network of structurally and functionally connected habitats that historically
occurred in Jimmycomelately Creek (JCL) and the Lower Sequim Bay Estuary (the estuary), the
existing habitats are fragmented and not properly functioning. A century of logging, road
development, commercial development, railroad construction, dredging, wetland drainage and
fill, diking, native vegetation removal, introduction of exotic species, agriculture, residential
development, and stream relocation and channelization have resulted in direct loss of wetlands
and other historic riverine and estuarine habitats. These human activities have also contributed to
reduced floodplain function and the present dysfunctional condition of JCL, Dean Creek, and the
Lower Sequim Bay Estuary.
The vision of the Jamestown S’Klallam Tribe, Clallam County, Clallam Conservation District,
Washington Department of Fish and Wildlife, Washington State Department of Transportation,
Washington Department of Natural Resources, Environmental Protection Agency, U.S. Fish and
Wildlife Service, local private landowners, and other partners in the Jimmycomelately Creek-
Lower Sequim Bay Estuary Restoration Project (JCL-Estuary Restoration Project) is to: realign
Jimmycomelately Creek into one of its historic, sinuous channels; integrate this channel
realignment with improvements in, and restoration of, the estuary functions; reestablish the pre-
disturbance linkage between the fluvial and tidal energy regimes; reconnect JCL with the historic
floodplain; and alleviate pervasive flooding problems in the project area.
To achieve this vision, rigorous monitoring will be essential at all phases of the estuary
restoration: pre-project (baseline monitoring), during construction (implementation monitoring),
and post-project (effectiveness monitoring). The Estuary Design Group (EDG), which is
comprised of technical staff from many of the partner entities listed above, has identified the
following monitoring parameters for the proposed estuary restoration:

Estuary Monitoring Plan
• Ecological Processes: Hydrology and Sediment Transport & Deposition
• Habitat Conditions & Functions: Habitat Gains, Water & Sediment Quality, and Large
Woody Debris
• Biological Responses: Terrestrial Vegetation Establishment, Wetland Vegetation
Establishment, Invasive Vegetation Management, Eelgrass Recovery, Shellfish Recovery,
Salmonid Use, Invertebrate Use, and Bird Use.
As outlined in this plan, estuary monitoring is intended to proceed for a minimum of 10 years
post-construction at an estimated total cost of approximately $492,000 to implement all the
essential and recommended monitoring tasks identified in this plan. EDG determined that the
tasks listed as essential have higher priority than those listed as recommended. The estimated
total cost to implement only the essential tasks is approximately $400,000.
The participating partners in the JCL-Estuary Restoration Project are actively seeking to partner
with research organizations and funding agencies to implement the essential and recommended
tasks as opportunities become available. Priorities for monitoring will be influenced by funding
availability, staff availability, and EDG determinations of which monitoring parameters are most
likely to allow us to assess success or failure. This monitoring plan will be subject to future
revision, as deemed necessary by EDG or the participating partners.
Sections 1.0, 2.0, and 3.0 of this document provide background information, goals & objectives
of the project, and a summary of the proposed estuary restoration actions, respectively. Section
4.0 describes the monitoring tasks & performance criteria.
ii
Estuary Monitoring Plan
TABLE OF CONTENTS
1.0 INTRODUCTION 1.1 Purpose of this Monitoring Plan…………………………………………………… 1 1.2 Location of the Proposed Restoration Project…………………………………….. 2 1.3 Description of the Proposed Restoration Project………………………………….. 2 1.4 Conceptual Model of Controlling Factors, Habitat Structure, and Ecosystem
Functions…………………………………………………………………………... 6 2.0 VISION, GOALS & OBJECTIVES OF THE RESTORATION PROJECT…………… 9 3.0 SUMMARY OF PROPOSED ESTUARY RESTORATION ACTIONS……………… 13 4.0 ESTUARY MONITORING TASKS & PERFORMANCE CRITERIA………………. 19
4.1 Monitoring of Ecological Processes……………………………………………… 24
4.1.1 Hydrology……………………………………………………………….. 24 4.1.2 Sediment Transport & Deposition………………………………………. 29
4.2 Monitoring of Habitat Conditions & Functions………………………………….. 33
4.2.1 Habitat Gains……………………………………………………………. 33 4.2.2 Water & Sediment Quality……………………………………………... 36 4.2.3 Large Woody Debris…………………………………………………….. 42
4.3 Monitoring of Biological Responses…………………………………………….. 46
4.3.1 Terrestrial Vegetation Establishment……………………………………. 46 4.3.2 Wetland Vegetation Establishment……………………………………… 50 4.3.3 Invasive Vegetation Management……………………………………….. 53 4.3.4 Eelgrass Recovery…………………………………………………...….. 55 4.3.5 Shellfish Recovery…………………………………………………...….. 59 4.3.6 Salmonid Use…………………………….……………………………... 62 4.3.7 Invertebrate Use…………………………….…………………………... 66 4.3.8 Bird Use…………………………………………………...…………..... 70
5.0 ADAPTIVE MANAGEMENT………………………………………………………… 74 6.0 MONITORING RESPONSIBILITIES, SCHEDULE, & ESTIMATED
COSTS…………….……………………………………………………………………. 77 7.0 REPORTING & DISSEMINATION OF MONITORING RESULTS………………… 84 8.0 LITERATURE CITED…………………………………………………………………. 86
iii
Estuary Monitoring Plan
LIST OF FIGURES
1.1 The proposed project area for the Jimmycomelately Creek-Lower Sequim Bay Estuary Restoration Project………………………………………………………………… 3
1.2 Proposed phases of the Jimmycomelately Creek-Lower Sequim Bay Estuary Restoration Project………………………………………………………………… 4 1.3 Conceptual model for restoring the Lower Sequim Bay Estuary………………………..…. 7 3.1 Depiction of the planning units used by EDG in developing a conceptual plan for restoring the Lower Sequim Bay Estuary……………………………………………… 14 4.1 Generalized system development matrix showing: (A) pathways of development
from initial undesirable state to the desirable (target) state for both structural and functional conditions; and (B) the nine states a restored system can occupy during development……………………………………………………………………………….. 22
LIST OF TABLES
4.1 Summary of performance criteria for each estuary restoration monitoring task..…............ 20 6.1 Summary of estuary restoration monitoring tasks, subtasks, lead partners, and
schedule………………………………………………………………………………..….. 78 6.2 Summary of estimated costs for essential and recommended tasks of the 10-year estuary
restoration monitoring program…………………………………………………………… 80
iv

Estuary Monitoring Plan
ACKNOWLEDGMENTS I wish to thank Byron Rot and Lyn Muench of the Jamestown S’Kallam Tribe for providing
funding and guidance for production of this document. The following members of the estuary
design group (EDG) reviewed or provided input to this monitoring plan: Byron Rot, Lyn
Muench, Sam Gibboney (Sam Gibboney Engineering and Management Services), Pat Crain
(Clallam County), Randy Johnson (WDFW), Carl Ward (WSDOT), Ralph Thomas Rogers
(EPA), and Pat McCullough (Engineering Services Associates, Inc.). I also benefited from
discussions with Chris May (Battelle Marine Sciences Laboratory) about water and sediment
quality monitoring, Ron Thom (Battelle Marine Sciences Laboratory) about eelgrass recovery,
Kelly Toy (Jamestown S’Klallam Tribe) about shellfish recovery, and Karen Holtrop (volunteer)
about bird use of the estuary.
On behalf of EDG, I praise the invaluable contributions to the JCL-Estuary Restoration Project
that have been made by Streamkeepers of Clallam County, led by Ed Chadd and Hannah Merrill,
and WDFW volunteers working on the JCL summer chum broodstock recovery program, led by
Cheri Scalf and Thom Johnson.
The team approach to restoration continues to be a hallmark of this project. I feel fortunate to
have the ongoing opportunity to collaborate with the many, enthusiastic project partners.
v
Estuary Monitoring Plan
ABBREVIATIONS USED IN THIS REPORT
BMP = best management practice CCD = Clallam Conservation District DNR = Washington State Department of Natural Resources EPA = Environmental Protection Agency ESA =Endangered Species Act ft = feet hrs = hours JCL-Estuary Restoration Project = Jimmycomelately Creek-Lower Sequim Bay Estuary
Restoration Project JCL = Jimmycomelately Creek JKT = Jamestown S’Klallam Tribe LWD = large woody debris m = meter m2 = square meter MLLW = mean lower low water OBH = Old Blyn Highway ODT = Olympic Discovery Trail PTC = Peninsula Trails Coalition The Tribe = Jamestown S’Klallam Tribe TPH = total petroleum hydrocarbon TSS = total suspended solids USFWS = U. S. Fish and Wildlife Service WDFW = Washington Department of Fish and Wildlife WSDOT = Washington State Department of Transportation yd3 = cubic yard yr = year
vi

Estuary Monitoring Plan
LOWER SEQUIM BAY ESTUARY MONITORING PLAN
1.0 INTRODUCTION 1.1 Purpose of this Monitoring Plan The purpose of this monitoring plan is to describe all tasks to monitor the success or failure of the
estuary restoration elements of the Jimmycomelately Creek - Lower Sequim Bay Estuary
Restoration Project (JCL-Estuary Restoration Project). This plan is intended as a companion
document to the Jimmycomelately Creek Realignment Monitoring Plan (Shreffler 2001).
Together, these two monitoring plans are intended to encompass the entire freshwater-nearshore
gradient. These plans recognize the connectivity of the nearshore with other freshwater
(upstream), terrestrial, shoreline, and marine ecosystems.
As with the JCL Creek Realignment Monitoring Plan, the foundation of this estuary monitoring
plan is a conceptual model (described in Section 1.4) that links controlling factors, habitat
structure, and ecosystem functions. Proceeding from the conceptual model is the following
logical sequence of activities designed to evaluate success or failure of the estuary restoration
portion of the JCL-Estuary Restoration Project:
1) develop a conceptual model
2) state restoration goals
3) state specific objectives for each goal
4) develop measurable performance criteria for each objective
5) monitor to document whether performance criteria are met
6) use adaptive management and contingency measures if performance criteria are not met
7) disseminate the results of this project (regardless of “success” or “failure”).
Monitoring will be essential at three stages of the restoration process: pre-project (baseline)
monitoring, during construction (implementation) monitoring, and post-project (effectiveness)
monitoring. Monitoring tasks are divided into three, inter-related categories: ecological
processes monitoring, habitat conditions and functions monitoring, and biological responses
monitoring.
1
Estuary Monitoring Plan
Shreffler Environmental developed this plan at the request of the Jamestown S’Klallam Tribe
(JKT). The technical aspects of this monitoring plan are consistent with “Guidance for Protection
and Restoration of the Nearshore Ecosystems of Puget Sound” (NST 2003) prepared by the
Nearshore Science Team (NST) for the Puget Sound Nearshore Ecosystem Restoration Program
(PSNERP). Where applicable, this monitoring plan has drawn upon draft monitoring protocols
newly released by the Washington Salmon Recovery Funding Board (Crawford 2003), as well as
other guidance documents (USDA/SCS 1992, Hruby and Brower 1994, Federal Interagency
Stream Restoration Working Group 1998, Schneider and Sprecher 2000, Simenstad and Cordell
2000, Thom 2000, Independent Science Panel 2000, and Inter-Fluve 2001).
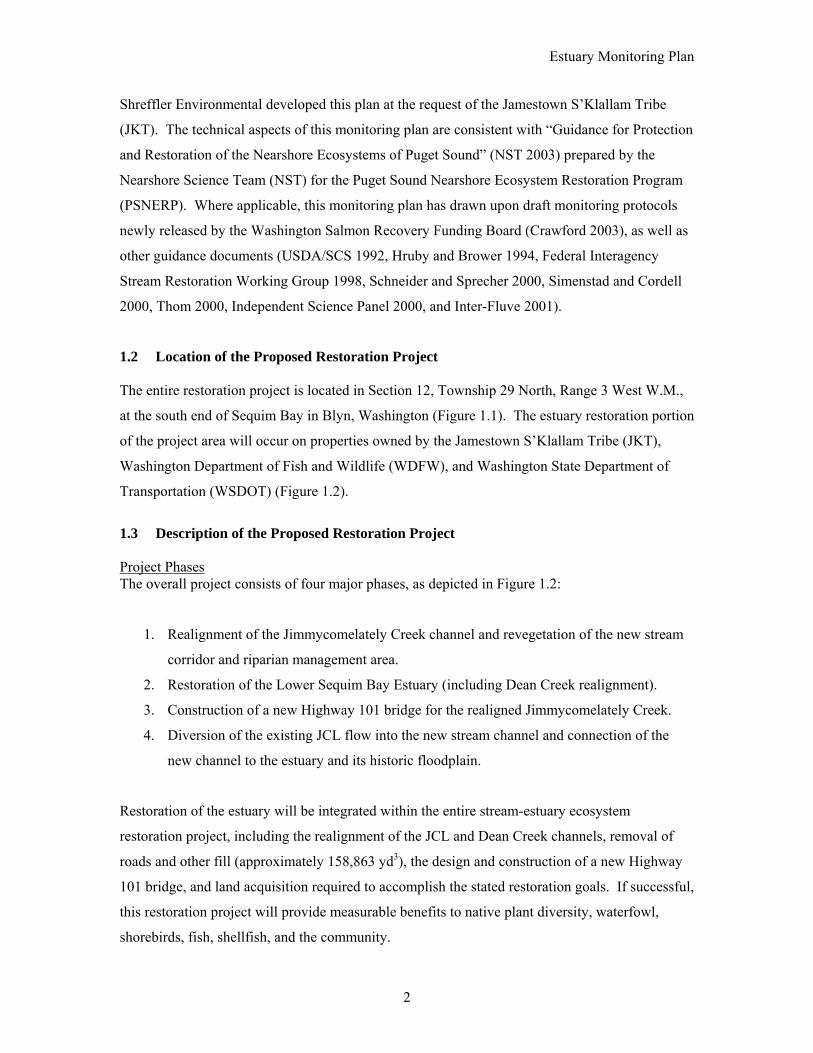
1.2 Location of the Proposed Restoration Project The entire restoration project is located in Section 12, Township 29 North, Range 3 West W.M.,
at the south end of Sequim Bay in Blyn, Washington (Figure 1.1). The estuary restoration portion
of the project area will occur on properties owned by the Jamestown S’Klallam Tribe (JKT),
Washington Department of Fish and Wildlife (WDFW), and Washington State Department of
Transportation (WSDOT) (Figure 1.2).
1.3 Description of the Proposed Restoration Project Project Phases The overall project consists of four major phases, as depicted in Figure 1.2:
1. Realignment of the Jimmycomelately Creek channel and revegetation of the new stream
corridor and riparian management area.
2. Restoration of the Lower Sequim Bay Estuary (including Dean Creek realignment).
3. Construction of a new Highway 101 bridge for the realigned Jimmycomelately Creek.
4. Diversion of the existing JCL flow into the new stream channel and connection of the
new channel to the estuary and its historic floodplain.
Restoration of the estuary will be integrated within the entire stream-estuary ecosystem
restoration project, including the realignment of the JCL and Dean Creek channels, removal of
roads and other fill (approximately 158,863 yd3), the design and construction of a new Highway
101 bridge, and land acquisition required to accomplish the stated restoration goals. If successful,
this restoration project will provide measurable benefits to native plant diversity, waterfowl,
shorebirds, fish, shellfish, and the community.
2
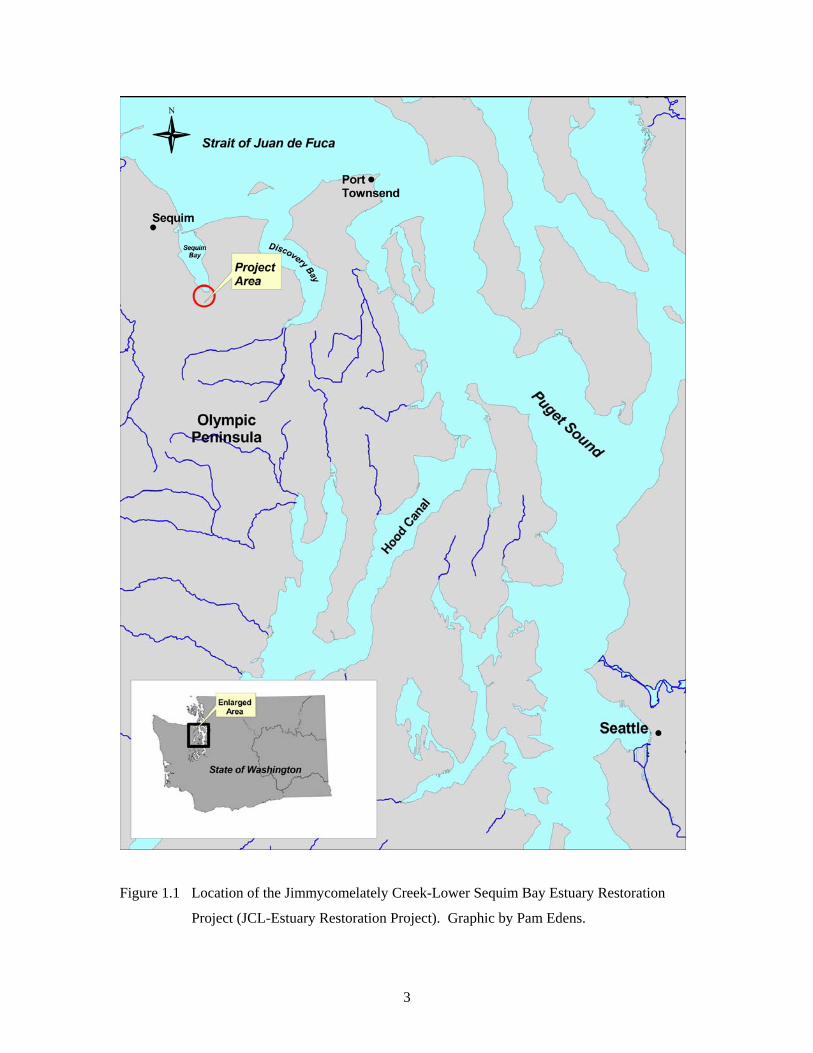
Figure 1.1 Location of the Jimmycomelately Creek-Lower Sequim Bay Estuary Restoration
Project (JCL-Estuary Restoration Project). Graphic by Pam Edens.
3
Figure 1.2. Proposed phases of the Jimmycomelately Creek-Lower Sequim Bay Estuary
Restoration Project (JCL-Estuary Restoration Project). Graphic by Pam Edens.
4
Estuary Monitoring Plan
Background: Why Restoration is Needed (excerpted from Shreffler 2000, A Preliminary Plan for Restoring Jimmycomelately Creek and the Lower Sequim Bay Estuary) Jimmycomelately Creek (JCL) is an unfortunate example of human degradation of natural
ecosystems. In contrast to the network of structurally and functionally connected habitats that
historically occurred in JCL and lower Sequim Bay, the existing habitats in the Bay are isolated
and fragmented. A century of logging, road development, commercial development, railroad
construction, dredging, wetland and other aquatic area fill, diking, native vegetation removal,
agriculture, and residential development have resulted in direct loss of wetlands and other historic
riverine and estuarine habitats. These human activities have also contributed to reduced
floodplain function and the present dysfunctional condition of Jimmycomelately Creek and the
Lower Sequim Bay Estuary.
The former, dendritic JCL channel has been dredged, straightened, and confined. The once
extensive tidal marshes at the mouth of JCL have been filled to provide space for roads, railroads,
commercial enterprises, and private residences. The historic corridor for fish and wildlife
movement from nearshore mudflat, eelgrass, and emergent marsh habitats to the upper JCL
watershed with forested terrestrial and fringing riparian habitat has been severely altered.
Sediment and water quality in both JCL and the estuary have degraded through time because of
human land-use practices. Dramatic sediment aggradation (build up) and resulting increased bed
elevations in the lower reaches of the existing JCL channel have contributed to recurring floods in
the basin. Flooding along the existing JCL channel poses an unacceptable risk of damage to
existing houses, properties, and infrastructure.
Dean Creek is a tributary to Sequim Bay and shares many of the same impairments as
Jimmycomelately Creek, but on a smaller scale. Like JCL, Dean Creek was moved into a
straightened artificial channel, and culverts and roads (Highway 101, Old Blyn Highway, and Log
Deck Road) have constricted both flood flows and tidal action. Non-native vegetation (e.g.,
Himalayan blackberry, Scot’s broom, and Japanese knotweed) have colonized the creek banks
and other associated fill, causing further constriction of the narrow, artificial creek channel.
These constrictions have contributed to a cycle of sediment build up at the mouth, as well as
downstream of culverts. The resultant flooding at road crossings, necessitates dredging of
blockages within the Dean Creek channel. Dean Creek is presently the most frequently dredged
creek in all of Clallam County (Pat McElroy, Clallam County Roads Department, personal
communication 2002).
5
Estuary Monitoring Plan
The cumulative effect of human activities has been fragmentation of the natural landscape into
smaller pieces with diminished functions and services for both natural resources and people. This
dysfunctional state: (1) limits the ability of JCL and the estuary to provide optimal feeding,
rearing, and breeding habitats in support of critical biological resources, including ESA-listed
summer chum salmon, other anadromous fish species, shellfish, shorebirds, and waterfowl; (2)
places property owners and local, state, and tribal infrastructure at a greater risk of flood damage;
and (3) highlights the urgent need to develop and implement integrated restoration actions in JCL,
Dean Creek, and the estuary.
In summary, despite the widely recognized ecological importance of the Jimmycomelately Creek-
Sequim Bay ecosystem, Jimmycomelatey Creek and Dean Creek are physically and ecologically
disconnected from the estuary and their respective historic floodplains, and are presently unable
to function as natural river systems with a naturally functioning connection to their estuary.
1.4 Conceptual Model of Controlling Factors, Habitat Structure, and Ecosystem
Functions A conceptual model is a useful tool for developing linkages between restoration goals and
performance criteria that can be used to assess overall performance of the restored system relative
to the stated goals (Thom and Wellman 1996). Moreover, a conceptual model forces the
individuals planning a restoration project to identify: (1) direct and indirect connections among
the physical, chemical, and biological components of the ecosystem, and (2) principal
components upon which to focus restoration and monitoring efforts.
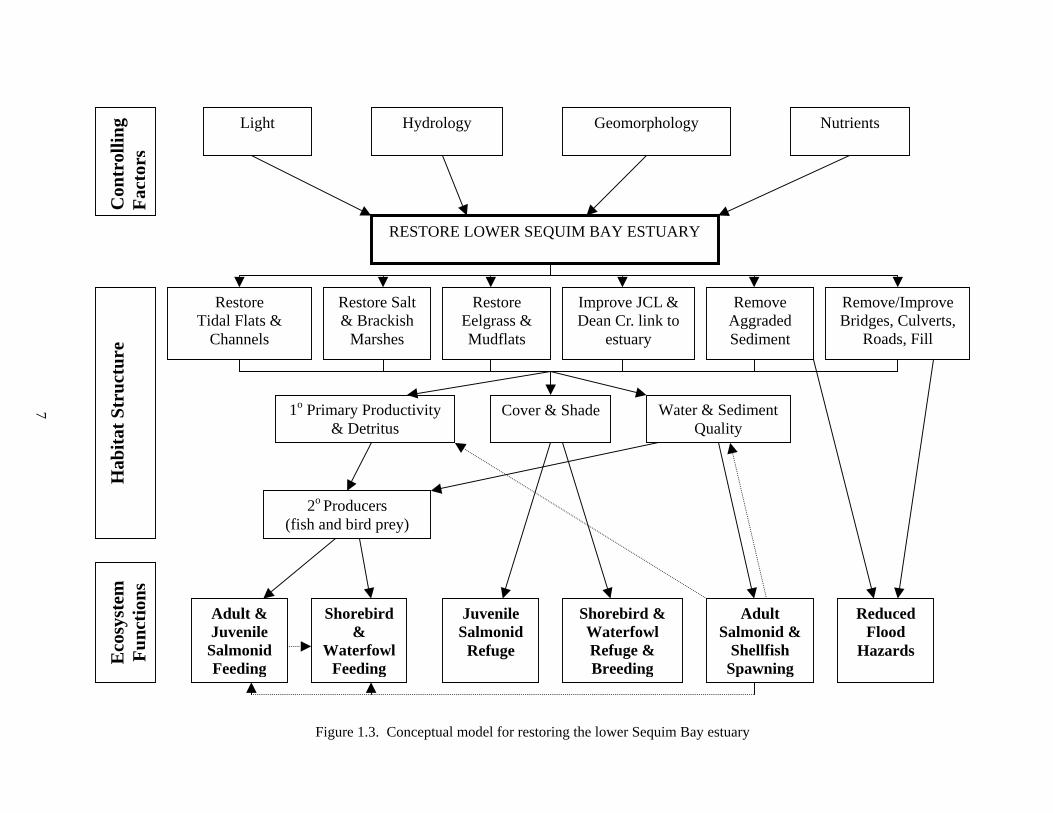
A conceptual model for restoring the estuary is presented here, which identifies connections
among controlling factors, habitat structure, and desired ecosystem functions (Figure 1.3). The
major controlling factors for restoring the estuary are light, hydrology, geomorphology, and
nutrients. For the purposes of this discussion, hydrology includes surface water and groundwater
quality and quantity and tidal prism. Geomorphology includes a suite of parameters such as
elevation relative to mean lower low water (MLLW), gradient, tidal channel characteristics (e.g.,
depth, width, cross-sectional area, sinuosity), and sediment character and quality. The desired
ecosystem functions are feeding, refuge, and breeding for salmonids, shellfish, shorebirds, and
waterfowl, and reduced flood hazards for people. The link between these desired ecosystem
functions and the controlling factors is the habitat structure.
6
C Fon
trol
ling
acto
rs
Light Hydrology Geomorphology
Restore Tidal Flats &
Channels
1o
(fi
Adult & Juvenile Salmonid Feeding E
cosy
stem
Fu
nctio
ns
Hab
itat S
truc
ture
Nutrients
7
RESTORE LOWER SEQUIM BAY ESTUARY
Restore Salt & Brackish
Marshes
Restore Eelgrass & Mudflats
Remove Aggraded Sediment
Remove/Improve Bridges, Culverts,
Roads, Fill
Primary Productivity & Detritus
Cover & Shade ater & Sediment Quality
2o Producers sh and bird prey)
Shorebird &
Waterfowl Feeding
Juvenile Salmonid
Refuge
Shorebird & Waterfowl Refuge & Bre
Adult Salmonid &
Shellfish Spawning
Impro Dean Cr. link to
estuary
Reduced Flood
Hazards
Figure 1.3. Conceptual model for restoring the low Bay estuary
eding
er Sequim
W
ve JCL &

Estuary Monitoring Plan
Thus, it is the habitat structure that must be changed in order to achieve the desired ecosystem
functions. To gain the desired ecosystem functions for restoring the estuary, the existing habitat
structure must be restored and protected in the following ways:
(1) Restore the tidal flats and channels within the estuary;
(2) Restore salt marsh and brackish marsh habitats within the estuary;
(3) Restore eelgrass and mudflats within the estuary;
(4) Improve the connections of JCL and Dean Creek to the estuary;
(5) Remove (selectively) aggraded sediment within the estuary;
(6) Remove and/or improve bridges and culverts,
(7) Remove (selectively) roads and other terrestrial fill;
(8) Improve stormwater management;
(9) Protect restored areas in perpetuity from future undesirable impacts.
Restoring and protecting the habitat structure in the estuary as outlined above should result in
increased primary and secondary production, improved organic matter flow and nutrient cycling,
improved detritus transport to the estuary, better water and sediment quality, and more prey
organisms for fish and birds. These improvements should result in better ecosystem functions
and services for salmonids, shellfish, birds, and people (for a more detailed explanation of the
expected benefits of estuary restoration see the Conceptual Plan for Restoring the Lower Sequim
Bay Estuary, Shreffler 2003).
8

Estuary Monitoring Plan
2.0 VISION, GOALS, AND OBJECTIVES OF THE RESTORATION PROJECT
The overall goal of the Jamestown S’Klallam Tribe for this project is to provide conservation and
protection, in perpetuity, of wetlands and creeks in the Jimmycomelately Creek-Sequim Bay
watershed, resulting in long-term protection and restoration of fish and shellfish resources to
harvestable levels.
The vision of Jamestown S’Klallam Tribe (JKT), Clallam County, Clallam Conservation District
(CCD), Washington Department of Fish and Wildlife (WDFW), Washington Department of
Natural Resources (DNR), Washington State Department of Transportation (WSDOT),
Environmental Protection Agency (EPA), U.S. Fish and Wildlife Service (USFWS), local private
landowners, and other participating partners is to: 1) realign Jimmycomelately Creek into one of
its historic, sinuous channels; 2) integrate this channel realignment with improvements in, and
restoration of, the estuary and floodplain functions; 3) reestablish the predisturbance linkage
between the fluvial and tidal energy regimes; and 4) alleviate pervasive flooding problems in the
project area. Although salmonids, shellfish, shorebirds, and waterfowl have been identified as the
target species groups for restoration, the participating partners explicitly intend to restore
ecosystem functions and processes of a properly functioning JCL-Lower Sequim Bay ecosystem,
thereby benefiting the full range of native species.
The participating partners acknowledge that this project, like any restoration project, must be
approached with humility and viewed as an experiment. Restoration of Jimmycomelately Creek
and the lower Sequim Bay estuary is a goal, not a guarantee. No one can predict exactly how the
JCL-Sequim Bay ecosystem will change, but the participating partners are committed to using the
best available science in its efforts to plan, implement, and monitor the proposed restoration
project. Over time, natural processes will determine the ultimate path of the restored ecosystem;
restoration is just the catalyst that sets these natural processes in motion.
Recognizing the dynamic nature of riverine and estuarine ecosystems, the intent of the
Jimmycomelately-Sequim Bay Estuary Restoration Project is to assist the “self-healing” capacity
of the ecosystem, rather than to achieve absolutely a desired end-point. Given the current
constraints of economics, politics, and the past and present human alteration of the landscape, the
goal is not to return the JCL-Sequim Bay ecosystem to a particular historic condition (e.g., 1914),
9

Estuary Monitoring Plan
but rather to restore and maintain the landscape processes that formed and sustained the habitats
to which biological resources have adapted.
By focusing on the larger landscape, the participating partners are working to ensure that these
restored habitats will be linked to existing viable habitats, as well as functionally and structurally
integrated into the watershed. This is a holistic, large-scale, long-term restoration effort,
involving many partners who are dedicated to ensuring that the project goals and objectives are
met, and that both natural resources and people are the beneficiaries. The project has broad local
and regional support, and the collective momentum required to move forward toward successful
restoration.
The participating partners have identified six design goals and interrelated objectives for the
project (see Shreffler 2000). The goals listed below are specific to the estuary:
Goal 1: Restore the southern end of Sequim Bay (lower Sequim Bay), including the tidal flats
and channels, the historic salt marsh, the Dean Creek channel, and the estuary of JCL
and Dean Creek for resident and migratory waterfowl and shorebird feeding, refuge,
and breeding, as well as habitat for juvenile salmon and shellfish.
Objective 1.1: Restore tidal flats and channels within the estuary.
Objective 1.2: Restore salt marsh and brackish marsh habitats within the estuary.
Objective 1.3: Restore eelgrass and mudflats within the estuary.
Objective 1.4: Remove (selectively) aggraded sediment from the estuary.
Objective 1.5: Reconnect JCL and Dean Creek to the estuary and restore the tidal
prism.
Objective 1.6: Remove the log yard access road and the portion of Old Blyn Highway
west of the existing JCL channel.
Objective 1.7: Remove fill, culverts, roads, bridges, or other channel/flow
constrictions (wherever and whenever feasible).
Objective 1.8: Demolish and remove existing structures within the estuary (e.g.,
dance hall, pump house, Old Blyn Shingle Mill foundation, log yard
structures).
Objective 1.9: Remove creosote-treated pilings.
10

Estuary Monitoring Plan
Goal 4: Restore the ESA-listed summer chum salmon population so that it is naturally self-
sustaining after completion of restoration activities in JCL and the estuary.
Objective 4.1: Coordinate with and complement the broodstock program already
underway for the JCL stock of summer chum salmon (the broodstock
program is currently being undertaken by JKT, WDFW, and volunteers
and is in response to the chronically low population size of the summer
chum run in JCL). This objective is essential in order to ensure that the
JCL broodstock program is consistent with the Summer Chum
Initiative and the recovery goals established by Point No Point Treaty
Council and Washington Department of Fish and Wildlife.
Objective 4.2: Ensure that the restoration activities in JCL and the estuary occur as
quickly as possible to allow natural spawning of the summer chum in
JCL, thereby reducing the risks of genetic or behavioral modification
of the stock by this broodstock program.
Goal 5: Develop rigorous monitoring requirements (pre-project, during construction, and post
project), maintenance actions, contingency actions, and reporting requirements to track
and achieve the above goals of this program.
Goal 6: Develop this project as a model for stream and estuary restoration and management, to
be used as a guide for larger-scale restoration efforts, especially restoration of estuaries
and the fluvial-tidal transition zone.
Objective 6.1: Provide educational opportunities and materials for the general public,
agencies, and decision-makers.
Objective 6.2: Document and publish an account of the restoration project planning,
implementation, monitoring, contingency actions, costs, and successes
or failures.
These stated design goals and objectives will be met while also:
1) Maintaining and/or improving public safety in the project vicinity, through actions such
as reduction of flood frequency, bridge design specifications, highway alignment, and
proper road approaches;
11
Estuary Monitoring Plan
2) Maintaining vehicular access to parcels under private ownership that remain after project
completion;
3) Accommodating the Olympic Discovery Trail to provide, to the extent practicable,
controlled public access;
4) Satisfying the goals, intent, and procedural requirements of local, state, and federal laws,
including the Endangered Species Act (ESA), the Clean Water Act (CWA), the Shoreline
Management Act, the Hydraulic Code, Clallam County’s Critical Areas Ordinance; and
Clallam County/WSDOT traffic and access requirements;
5) Ensuring that best management practices (BMPs) are implemented for upper watershed
human activities to control sediment, pollution, and alterations to instream hydrology;
and
6) Performing rigorous monitoring and adaptive management activities at all phases of the
project to ensure that all restored or enhanced habitats are resilient to natural and
anthropogenic disturbances, and will promote the long-term sustainability of all native
species in the landscape.
12
Estuary Monitoring Plan
3.0 SUMMARY OF PROPOSED ESTUARY RESTORATION ACTIONS
The following summary is a condensed version of the proposed estuary restoration actions from
the Conceptual Plan for Restoring the Lower Sequim Bay Estuary (Shreffler 2003). This section
is intended to provide an overview of these actions as depicted in Figure 3.1, for more specific
details and figures see the Conceptual Plan.
Log Deck Road
Proposed Restoration Actions and Related Activities
The proposed restoration actions are to:
• Remove the undersized (30 inch) culvert and the entire road bed (~ 900 linear feet) down
to mudflat or salt marsh elevations.
Related activities include:
• Restrict excavation to low tides (to avoid the need for sediment and erosion control
structures).
• Transport approximately 3,625 cubic yards of fill to an approved offsite disposal location.
• If there are old railroad pilings buried in the log deck road, use any that are not creosote-
treated in the estuary restoration.
Old Blyn Highway (OBH)
Proposed Restoration Actions and Related Activities
The proposed restoration actions are to:
• Remove the road bed and two undersized 30-inch culverts down to mudflat or brackish
marsh elevations from a point just east of the existing JCL channel west to the entrance to
the former RV Park.
Related activities include:
• Transport approximately 3,990 cubic yards of fill to an approved offsite upland location.
• At each edge of the estuary along the former OBH roadbed, construct a quarry spall
access road to PUD utility poles—this road will be designed to overtop at tides greater
than +8.0 feet MLLW
• Remove the county bridge over the existing JCL channel.
• Construct a turnaround terminus to OBH on the east side of the existing JCL channel.
13
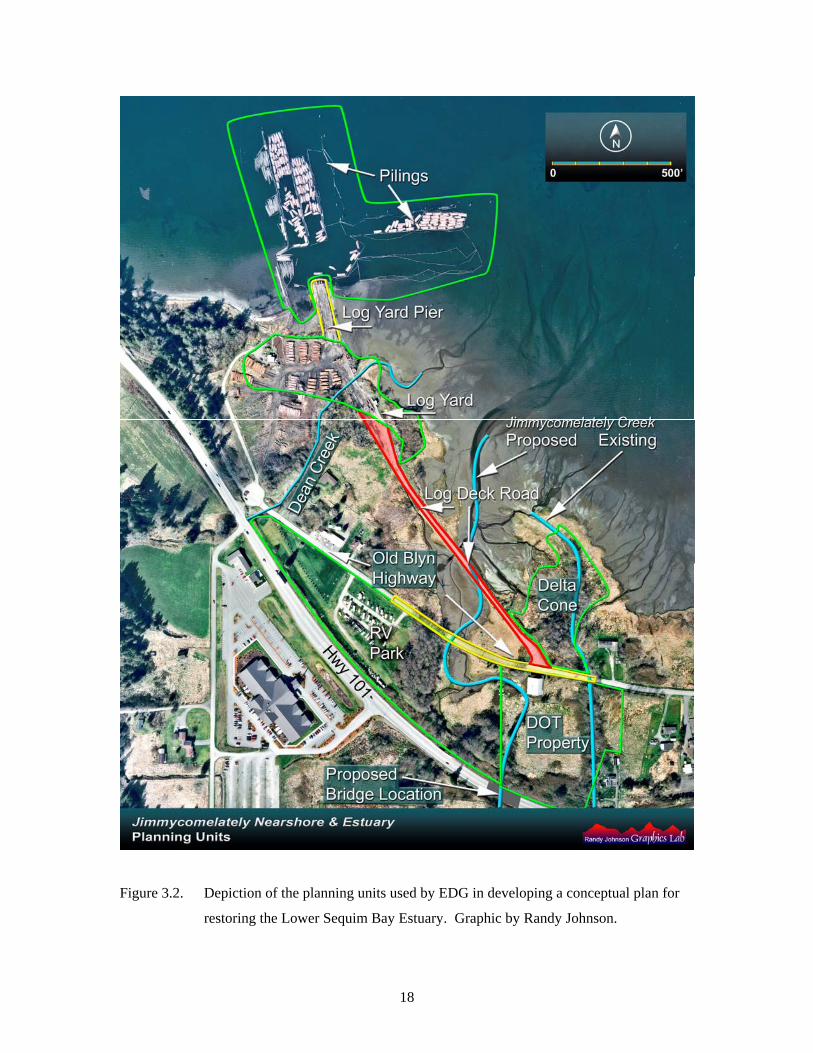
Figure 3.2. Depiction of the planning units used by EDG in developing a conceptual plan for
restoring the Lower Sequim Bay Estuary. Graphic by Randy Johnson.
18

Estuary Monitoring Plan
Log Yard Pier
Proposed Restoration Actions and Related Activities
The proposed restoration actions relative to the log yard pier are to:
• Remove the entire log yard pier down to tideflat elevation.
Related activities include:
• Restrict excavation to low tides.
• Dispose of approximately 20,000 cubic yards of fill at an approved offsite upland
location.
Log Yard
Proposed Restoration Actions and Related Activities
The proposed restoration actions at the log yard include:
• Excavate and grade the existing shoreline to the 1870 marsh edge, leaving a barrier spit in
front of a tidal marsh/lagoon system.
• Realign and restore Dean Creek.
• Place and bury LWD at the upper marsh edge and in the barrier spit, the tidal channel,
and Dean Creek.
• Hydroseed terrestrial areas.
• Plant native trees, shrubs, and groundcover in upland and riparian areas.
Related activities include:
• Decommission and remove structures, infrastructure, and debris.
• Transport logs left behind by Dunlap Towing to the terrestrial edge of the property and
stockpile them for use in the Dean Creek channel realignment, the tidal lagoon, and other
parts of the estuary.
• Clear and grub.
• Construct sediment and erosion control structures.
• Construct silt fences.
• Remove two utility poles, one with an attached transformer.
• Provide an access easement to the adjacent private property to the west.
• Remove approximately 58,667 cubic yards of fill and dispose at an approved offsite
upland location.
15
Estuary Monitoring Plan
Log Yard Pilings and Historical Log Yard Operations
Proposed Restoration Actions and Related Activities
The proposed restoration actions are to:
• Remove and dispose of all the treated pilings (and the surrounding sediment from the
base of each piling) at a contaminated waste site that can handle creosote-treated wood
and contaminated sediment.
• Leave behind the five untreated pilings and chain a string of three untreated logs to one of
the pilings to provide shorebird roosting habitat.
• Place a cone or spikes on the top of each untreated piling to deter perching by raptors.
RV Park
Proposed Restoration Actions and Related Activities
The proposed restoration actions are to:
• Remove blackberries and alder trees within a “triangle” on the eastern boundary of the
RV Park property and excavate to match the elevation of the adjacent natural marsh.
• Excavate/grade the eastern portion of the former RV Park to the 16-foot contour and
match it with the existing, natural marsh immediately to the north across the Old Blyn
Highway to ensure that these presently disconnected areas are hydrologically connected.
The remaining area to the west will be hydroseeded and restored to native terrestrial plant
communities.
• Construct a network of tidal channels through the brackish marsh.
• Plant native trees, shrubs, and groundcover in terrestrial areas.
Related activities include:
• Decommission and remove infrastructure.
• Clear and grub.
• Restrict excavation to low tides.
• Remove a portion of Old Blyn Highway and construct an alternate access to private
properties that remain within the project area.
• Dispose of approximately 14,000 cubic yards of fill in an approved onsite upland area.
16

Estuary Monitoring Plan
Delta Cone
Proposed Restoration Actions and Related Activities
The proposed restoration actions are to:
• Relocate the entire JCL creek out of its artificial channel and into a more sinuous,
realigned channel (the new channel must be active and the existing channel bed inactive
in advance of any actions at the delta cone).
• Remove and dispose of in an approved upland location approximately 13,500 cubic yards
of aggraded sediment to an elevation that will support salt marsh vegetation.
Olympic Discovery Trail (ODT)
Proposed Restoration Actions and Related Activities
• Remove all pilings, decking, beams, and other treated wood in the two trestle structures,
and, to the extent possible, contaminated sediment around the pilings; dispose of these at
a contaminated waste site that can handle creosote-treated wood. Replace these
structures with three new trail bridges (Dean Creek, tidal channel, existing JCL Creek.
• Provide public access, wildlife viewing, and interpretation.
Public Access & Interpretation
Proposed Actions
Because of the ecological sensitivity of the site, interpretive and educational elements will be
designed to discourage visitors from physically accessing and exploring the restored areas. The
intent is to encourage visitors to stay on the trail, rather than wandering on their own through
sensitive restored habitats. Viewing platforms will provide public access to the estuary.
Interpretive signage will help to educate trail users.
The following public facilities and interpretive signage have been proposed:
• Two off-trail “viewing platforms” will be constructed at optimal bird watching and
estuary viewing locations. Parking will be provided at the existing Sequim Bay Scenic
Overlook on Jamestown S’Klallam Tribe property to the east of the project area.
17

Estuary Monitoring Plan
• Two interpretive signs and benches will be installed at each of these viewing platforms.
These signs will increase public understanding of: 1) the history of the Blyn area; 2) the
process of restoring JCL creek and the estuary; and 3) the functions and values of our
natural aquatic lands.
• Washington State Department of Natural Resources Aquatic Land Enhancement Account
signs will also be installed at each viewing platform, as well as signs recognizing other
contributors to the project.
Eng (WSDOT) Property
Proposed Restoration Actions and Related Activities
The proposed restoration actions are to:
• Remove reed canary grass, blackberries and other invasive vegetation and grade to the
elevation of the adjacent brackish marsh.
• Construct a network of tidal channels through the brackish marsh and connect the
upstream end of the main tidal channel to the existing JCL channel.
• Hydroseed and plant native trees, shrubs, and groundcover in terrestrial areas.
Related actions include:
• Remove the dance hall and related infrastructure.
• Remove the dam in the existing tidal channel.
• Clear and grub.
• Construct sediment and erosion control structures.
• Construct silt fences.
18
Estuary Monitoring Plan
4.0 MONITORING TASKS & PERFORMANCE CRITERIA
In this section, monitoring tasks are organized into three categories: ecological processes
monitoring, habitat conditions and functions monitoring, and biological responses monitoring.
Ecological Processes tasks attempt to determine the success of physical or ecological process
restoration (e.g., has the tidal prism been restored?). Habitat Conditions and Functions tasks
attempt to determine the change and level of success of habitat conditions and functions over time
(e.g., did the estuary restoration actions result in a net gain of salt marsh habitat?). Biological
Response tasks attempt to determine the change and level of success of biological responses to
restoration actions over time (e.g., After 10 years, is the species composition of native wetland
plants greater than 80% comparable to that of appropriate reference sites?).
Monitoring tasks are described for the following phases of the overall restoration project: pre-
project (baseline) monitoring, during construction (implementation) monitoring, and post-project
(effectiveness) monitoring. Baseline monitoring documents project site conditions prior to
initiation of the restoration actions. Implementation monitoring determines whether the project
was constructed in accordance with the design specifications and permit conditions. Effectiveness
monitoring (also referred to as “success monitoring” or “performance monitoring”) documents
whether performance criteria were met. Performance criteria are the explicit, quantifiable
measures that will be used to determine whether the overall restoration project is performing as
expected and whether corrective actions (contingency measures) or adaptive management (see
Section 5.0) are required. Performance criteria for all the monitoring tasks are summarized in
Table 4.1. An example of a performance criterion is: the project area shall contain not greater
than 5% cover by area of invasive plant species after ten years.
Monitoring, as outlined in this plan, is intended to proceed for a minimum of 10 years post-
construction. Although monitoring of restoration sites is typically short-term (i.e., the usual 5-10
year monitoring framework of regulatory agencies), a longer period of monitoring is often
necessary to demonstrate whether or not ecological processes, habitat conditions and functions,
and biological responses are likely to be restored to the desired level. Thom (2000) suggested
that, “The [restored] system should be monitored long enough to provide reasonable assurances
that the system has either met its performance criteria or that it will likely not meet the criteria.
The [monitoring] program should extend to a point somewhere after the period of most rapid
change and into the period of stabilization of the system.”
19
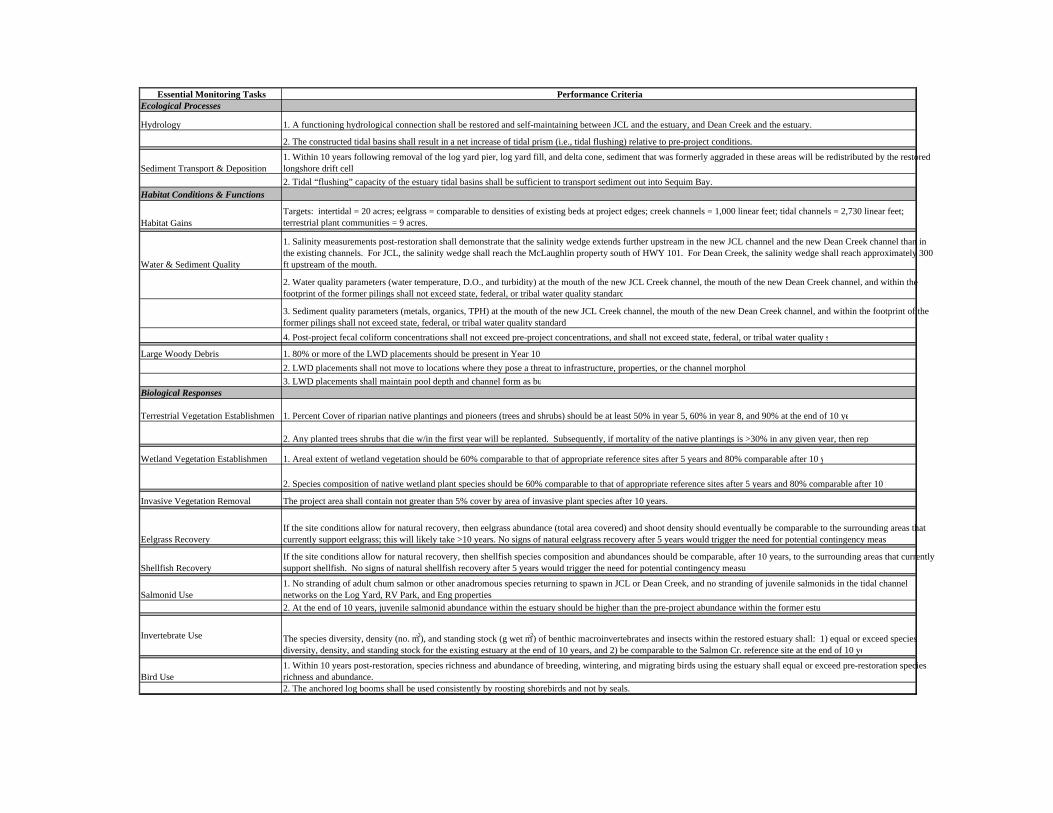
Essential Monitoring Tasks Performance CriteriaEcological Processes
Hydrology 1. A functioning hydrological connection shall be restored and self-maintaining between JCL and the estuary, and Dean Creek and the estuary.
2. The constructed tidal basins shall result in a net increase of tidal prism (i.e., tidal flushing) relative to pre-project conditions.
Sediment Transport & Deposition1. Within 10 years following removal of the log yard pier, log yard fill, and delta cone, sediment that was formerly aggraded in these areas will be redistributed by the restored longshore drift cell2. Tidal “flushing” capacity of the estuary tidal basins shall be sufficient to transport sediment out into Sequim Bay.
Habitat Conditions & Functions
Habitat GainsTargets: intertidal = 20 acres; eelgrass = comparable to densities of existing beds at project edges; creek channels = 1,000 linear feet; tidal channels = 2,730 linear feet; terrestrial plant communities = 9 acres.
Water & Sediment Quality
1. Salinity measurements post-restoration shall demonstrate that the salinity wedge extends further upstream in the new JCL channel and the new Dean Creek channel than in the existing channels. For JCL, the salinity wedge shall reach the McLaughlin property south of HWY 101. For Dean Creek, the salinity wedge shall reach approximately 300 ft upstream of the mouth.
2. Water quality parameters (water temperature, D.O., and turbidity) at the mouth of the new JCL Creek channel, the mouth of the new Dean Creek channel, and within the footprint of the former pilings shall not exceed state, federal, or tribal water quality standard
3. Sediment quality parameters (metals, organics, TPH) at the mouth of the new JCL Creek channel, the mouth of the new Dean Creek channel, and within the footprint of the former pilings shall not exceed state, federal, or tribal water quality standard4. Post-project fecal coliform concentrations shall not exceed pre-project concentrations, and shall not exceed state, federal, or tribal water quality s
Large Woody Debris 1. 80% or more of the LWD placements should be present in Year 102. LWD placements shall not move to locations where they pose a threat to infrastructure, properties, or the channel morpholo3. LWD placements shall maintain pool depth and channel form as bu
Biological Responses
Terrestrial Vegetation Establishmen 1. Percent Cover of riparian native plantings and pioneers (trees and shrubs) should be at least 50% in year 5, 60% in year 8, and 90% at the end of 10 ye
2. Any planted trees shrubs that die w/in the first year will be replanted. Subsequently, if mortality of the native plantings is >30% in any given year, then repl
Wetland Vegetation Establishmen 1. Areal extent of wetland vegetation should be 60% comparable to that of appropriate reference sites after 5 years and 80% comparable after 10 y
2. Species composition of native wetland plant species should be 60% comparable to that of appropriate reference sites after 5 years and 80% comparable after 10 y
Invasive Vegetation Removal The project area shall contain not greater than 5% cover by area of invasive plant species after 10 years.
Eelgrass RecoveryIf the site conditions allow for natural recovery, then eelgrass abundance (total area covered) and shoot density should eventually be comparable to the surrounding areas that currently support eelgrass; this will likely take >10 years. No signs of natural eelgrass recovery after 5 years would trigger the need for potential contingency meas
Shellfish RecoveryIf the site conditions allow for natural recovery, then shellfish species composition and abundances should be comparable, after 10 years, to the surrounding areas that currently support shellfish. No signs of natural shellfish recovery after 5 years would trigger the need for potential contingency measur
Salmonid Use1. No stranding of adult chum salmon or other anadromous species returning to spawn in JCL or Dean Creek, and no stranding of juvenile salmonids in the tidal channel networks on the Log Yard, RV Park, and Eng properties2. At the end of 10 years, juvenile salmonid abundance within the estuary should be higher than the pre-project abundance within the former estua
Invertebrate Use The species diversity, density (no. m-2), and standing stock (g wet m-2) of benthic macroinvertebrates and insects within the restored estuary shall: 1) equal or exceed species diversity, density, and standing stock for the existing estuary at the end of 10 years, and 2) be comparable to the Salmon Cr. reference site at the end of 10 ye
Bird Use1. Within 10 years post-restoration, species richness and abundance of breeding, wintering, and migrating birds using the estuary shall equal or exceed pre-restoration species richness and abundance. 2. The anchored log booms shall be used consistently by roosting shorebirds and not by seals.
Estuary Monitoring Plan
The goal of ecological restoration is to emulate a natural, functioning, self-regulating system that
is integrated with the ecological landscape in which it occurs (National Research Council 1992).
Although 5 to 10 years of monitoring is typically long enough to evaluate replacement of habitat
area (i.e. habitat gains) and occasionally some biological responses (e.g., fish use), this short time
period is rarely long enough to adequately evaluate restoration of ecological processes and habitat
functions. Indeed, recent ecological literature suggests that restoration sites may follow a
hypothetical path of development (a trajectory), which will eventually approach natural reference
sites (the target) through time, but this may take upwards of 50 years for brackish or salt marsh
habitats, and even longer for forested freshwater wetlands (e.g., Simenstad and Thom 1996;
Zedler and Callaway 1999, Simenstad and Cordell 2000). The Independent Science Panel (2000)
stated that recovery of natural functions in streams and riparian areas that support viable
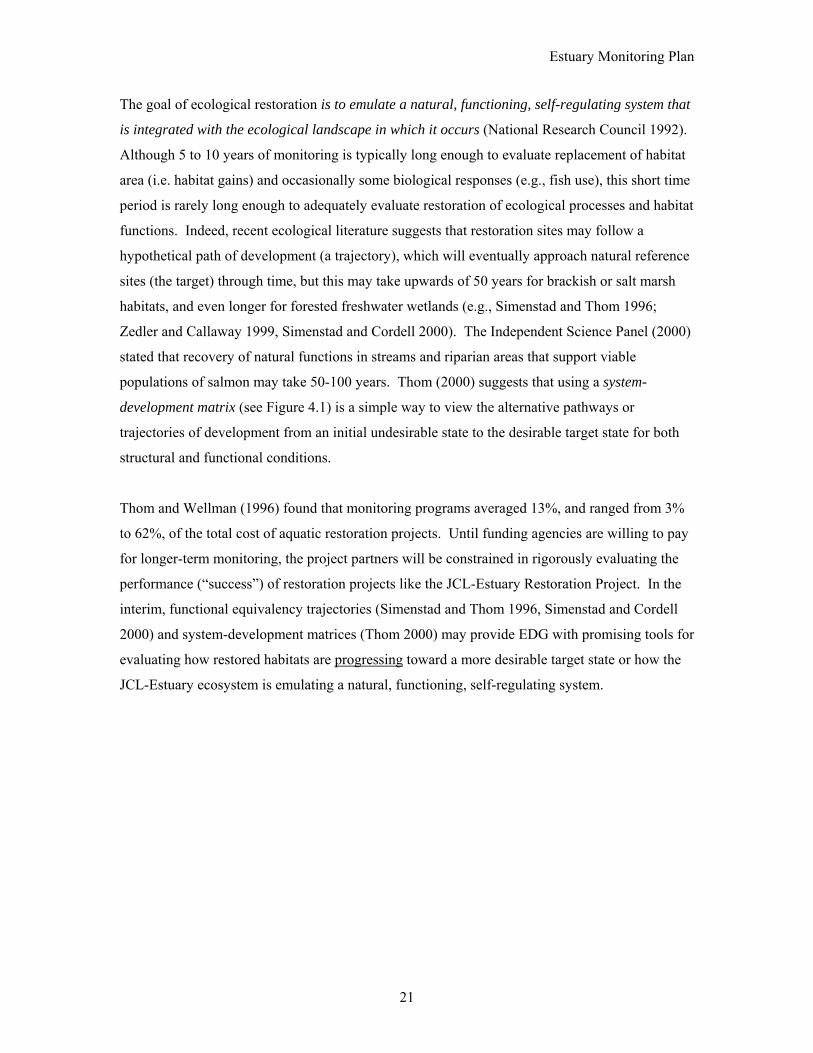
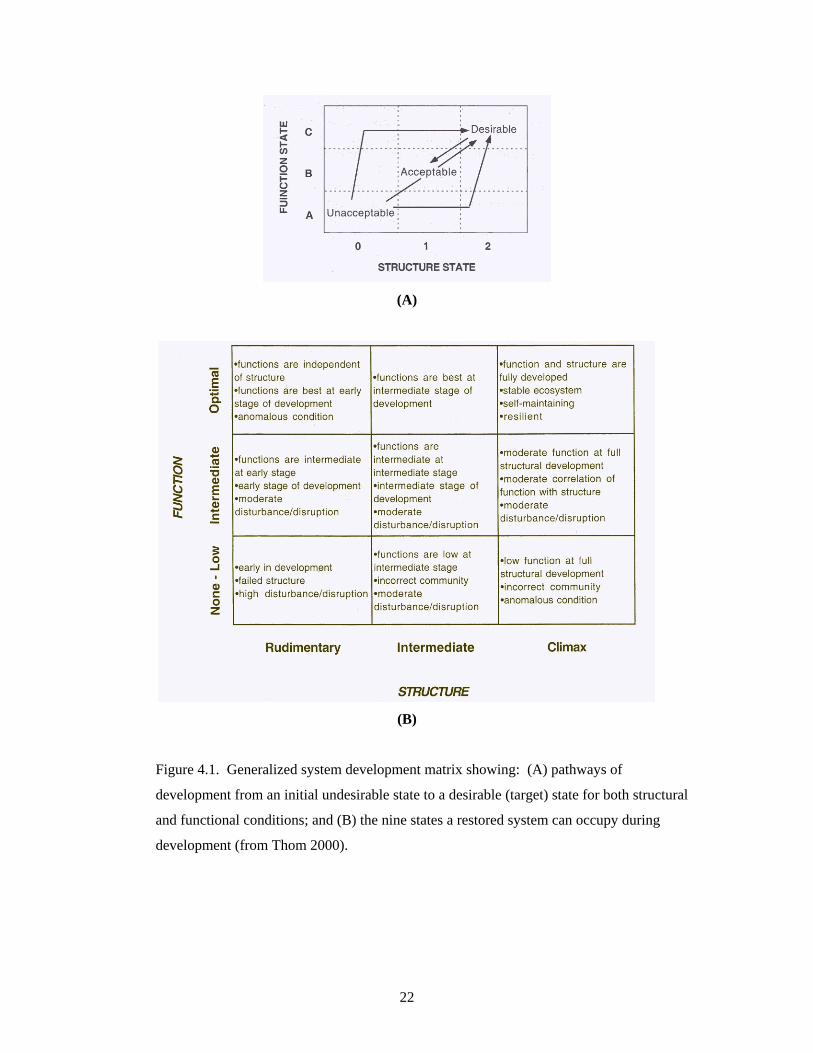
populations of salmon may take 50-100 years. Thom (2000) suggests that using a system-
development matrix (see Figure 4.1) is a simple way to view the alternative pathways or
trajectories of development from an initial undesirable state to the desirable target state for both
structural and functional conditions.
Thom and Wellman (1996) found that monitoring programs averaged 13%, and ranged from 3%
to 62%, of the total cost of aquatic restoration projects. Until funding agencies are willing to pay
for longer-term monitoring, the project partners will be constrained in rigorously evaluating the
performance (“success”) of restoration projects like the JCL-Estuary Restoration Project. In the
interim, functional equivalency trajectories (Simenstad and Thom 1996, Simenstad and Cordell
2000) and system-development matrices (Thom 2000) may provide EDG with promising tools for
evaluating how restored habitats are progressing toward a more desirable target state or how the
JCL-Estuary ecosystem is emulating a natural, functioning, self-regulating system.
21
(A)
(B)
Figure 4.1. Generalized system development matrix showing: (A) pathways of
development from an initial undesirable state to a desirable (target) state for both structural
and functional conditions; and (B) the nine states a restored system can occupy during
development (from Thom 2000).
22
Estuary Monitoring Plan
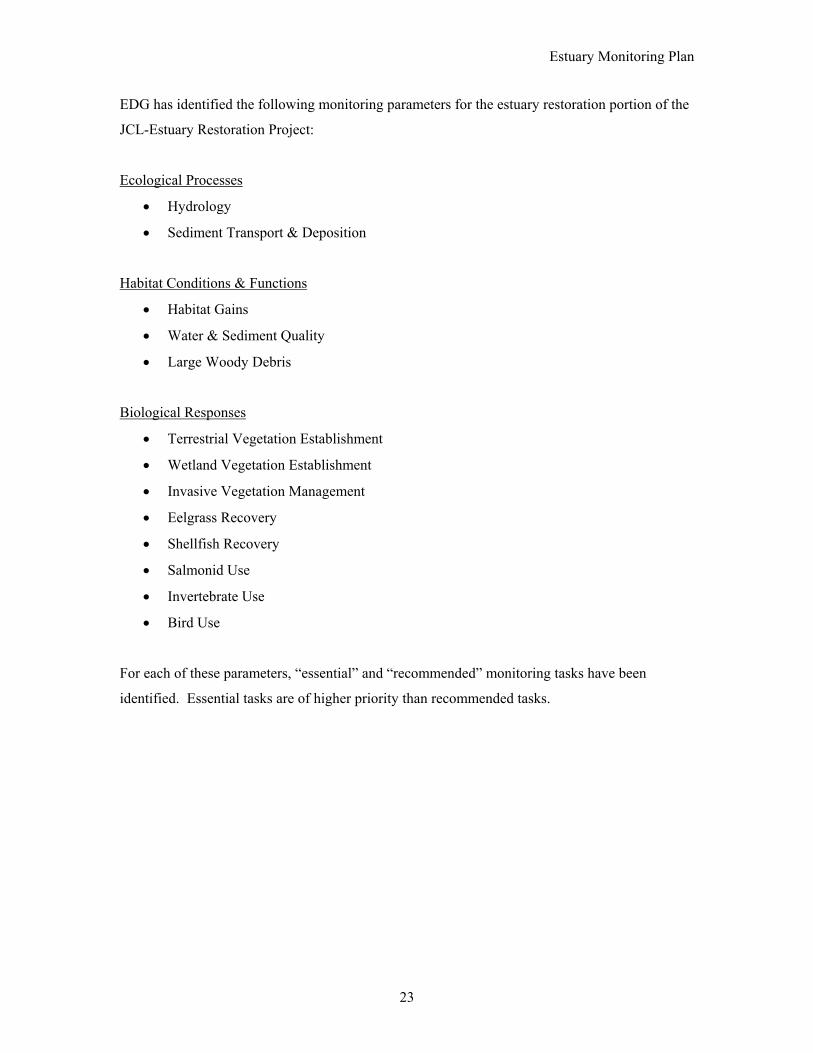
EDG has identified the following monitoring parameters for the estuary restoration portion of the
JCL-Estuary Restoration Project:
Ecological Processes
• Hydrology
• Sediment Transport & Deposition
Habitat Conditions & Functions
• Habitat Gains
• Water & Sediment Quality
• Large Woody Debris
Biological Responses
• Terrestrial Vegetation Establishment
• Wetland Vegetation Establishment
• Invasive Vegetation Management
• Eelgrass Recovery
• Shellfish Recovery
• Salmonid Use
• Invertebrate Use
• Bird Use
For each of these parameters, “essential” and “recommended” monitoring tasks have been
identified. Essential tasks are of higher priority than recommended tasks.
23
Estuary Monitoring Plan
4.1 MONITORING OF ECOLOGICAL PROCESSES
Ecological processes monitoring will focus on hydrology and sediment transport and deposition.
These processes are critical to the development of habitat that will support fish, shellfish,
shorebirds, waterfowl, and their invertebrate prey sources. According to the Nearshore Science
Team (NST 2003), hydrology, sediment, and food web processes have been the most affected by
stressors in the Puget Sound nearshore (the NST definition of nearshore includes estuaries).
Ecological processes generally evolve slowly, and thus monitoring of hydrology and sediment
processes will be performed for a minimum of 10 years post-restoration of the Lower Sequim
Bay Estuary.
4.1.1 HYDROLOGY
Historic and Current Conditions Historically, the project area was more open to and more influenced by both freshwater and tidal
flows. Prior to human disturbance of the landscape, Jimmycomelately Creek (JCL) and Dean
Creek meandered across their respective floodplains into an extensive estuary estimated to be
nearly triple the size of the current, disconnected estuary. Currently, both JCL and Dean Creek
are hydraulically disconnected from the estuary, and normal hydrological functions (e.g., nutrient
and sediment exchange, flood and stormwater desynchronization, groundwater exchange, and
support of stream baseflow) have been lost or altered (Shreffler 2000).
Restoration Objective
The restoration objective relative to hydrology is to restore the natural channel and floodplain
configurations of JCL, Dean Creek, and the estuary by realigning JCL and Dean Creek into
sinuous channels with access to the floodplain, and by removing channel constrictions in the
estuary (i.e., roads, culverts, and other fill).
Restoration Rationale
By removing roads, culverts, and other fill and restoring natural channel and floodplain
configurations of JCL and Dean Creek, there will once again be a functional hydrologic
connection between these creeks and the estuary. Semi-diurnal tidal fluctuations will also be
restored. A functional connection between each creek, its floodplain, and the estuary will
improve habitat of both restored creeks and the estuary for invertebrates, fish, and aquatic birds.
24
Estuary Monitoring Plan
BASELINE MONITORING
Methods and Data Analysis
1) Essential: Map the historic and current locations of the estuary [Note: Three types of
mapping have already been completed: a) Walker and Associates orthophotos with 2-ft contours;
b) Randy Johnson’s (WDFW) historical shoreline and salt marsh-edge maps based on 1870
shoreline surveys, 1926 and 2000 aerial photos, and 2002 soil test pit data, and c) Randy
Johnson’s conceptual depiction of the estuary circa 1800].
2) Essential: Install survey control points (CP), consisting of concrete monuments with steel
disks for the estuary. One CP has already been established near the former location of the old log
yard office; another CP has been established at the mouth of Dean Creek. A third CP will be
established on the Eng/WSDOT property, and a fourth will likely be established on the RV
Park/WDFW property. All monitoring data will be geo-referenced relative to these fixed control
points
3) Essential: Install a continuous recording tidal gauge at the new mouth of JCL and collect pre-
project data on tidal flux and velocities south of Old Blyn Hwy (downstream of the WSDOT tidal
basin and RV Park tidal basin).
Timeline, Personnel, Cost Estimate, and Lead
Timeline: Year 0 (prior to excavation of Dean Creek Channel and removal of estuary
blockages).
Personnel: 1) Map Creek & Estuary locations: Historic mapping was completed by WDFW in
November, 2000. Detailed survey mapping occurred in summer 2003 with additional
survey work to occur in summer 2004. Dean Creek has not yet been surveyed or
mapped.
2) Survey control: 1engineer 8 hrs
3) Tide gauge: 1 biologist 40 hrs + 1 technician 80 hrs
Cost: 1) Map Creek & Estuary locations: Completed by WDFW in November, 2000.
2) Survey control: $800 labor + $200 equipment
3) Tide gauge: $4,720
25

Estuary Monitoring Plan
Lead: 1) Map Creek & Estuary locations: WDFW, JKT/ESAI
2) Survey control: JKT/ESAI
3) Tide gauge: JKT
IMPLEMENTATION MONITORING
Methods & Data Analysis
1) Essential: Document that the design specifications for ground and bed elevations, gradients,
channel widths and slopes, meander radii and lengths, and other parameters shown on
engineering drawings are met for each element of the estuary restoration. Specifically, prepare
as-built drawings according to standard construction engineering practices for the following
estuary restoration elements:
a) Log Deck Road removal;
b) Old Blyn Highway removal;
c) Log Yard Pier removal;
d) Log Yard fill removal;
e) RV Park (WDFW) property tidal channel construction;
f) Delta Cone removal; and
g) Eng (WSDOT) property tidal channel construction.
2) Essential: Confirm on as-built drawings that all fish blockages or constrictions have been
removed from the project area (e.g., roads, culverts, dams, and other fill).
Note: As-built drawings for the JCL Creek realignment will be completed as part of the JCL
Creek monitoring plan (Shreffler 2001). As-built drawings for the Dean Creek realignment will
be completed as part of the addendum to the JCL Creek monitoring plan.
Timeline, Personnel, Cost Estimate, and Lead
Timeline: 1) As-built drawings: Year 0; as-built drawings should be completed immediately
after construction or deconstruction of each of the elements listed above.
2) Fish blockages: Year 0: immediately following construction or deconstruction of
each of the elements listed above.
26
Estuary Monitoring Plan
Personnel: 1) As-built drawings: 1 ESAI engineer, 40 hours (except for the Eng property, for
which as-built drawings will be completed by WSDOT).
2) Fish blockages: included in #1 above.
Cost: 1) As-built drawings: $4,000
2) Fish blockages: included in #1 above
Lead: 1) As-built drawings: JKT/ESAI
2) Fish blockages: JKT/ESAI
EFFECTIVENESS MONITORING
Methods & Data Analysis
1) Essential: Map the post-project configuration of the estuary, JCL, and Dean Creek to
document that tidal connections have been restored.
2) Essential: Compare pre-project and post-project data on tidal flux and velocities in the
realigned JCL channel south of Old Blyn Hwy (downstream of the WSDOT tidal basin and RV
Park tidal basin).
3) Essential: Make flood and ebb discharge measurements (over a range of flood and ebb tides)
at the sill of the WSDOT constructed tidal basin, the log yard tidal basin, and the RV Park tidal
basin.
Note: The JCL Creek Realignment Monitoring Plan (Shreffler 2001) calls for installing staff
gages with pressure transducers at two locations: (1) within the realigned JCL channel above
tidal influence; and (2) at the mouth of the realigned JCL creek. These gages and associated
cross-section surveys will facilitate tracking changes in hydrology (e.g., mean annual discharge,
channel flow capacity, tidal elevation, and tidal prism) post-restoration.
Performance Criteria
1) A functioning hydrological connection shall be restored and self-maintaining between JCL and
the estuary, and Dean Creek and the estuary.
27
Estuary Monitoring Plan
2) The constructed tidal basins shall result in a net increase of tidal prism (i.e., tidal flushing)
relative to pre-project conditions.
Timeline, Personnel, Cost Estimate, and Lead
Timeline: 1) Mapping: Year 1
2) Tide gauge: Years 1, 2, 3, 5, and 10
3) Tidal basin flows: Years 1, 2, 3, 5, and 10
Personnel: 1) Mapping: 1 biologist 8 hrs
2) Tide gauge: 2 technicians 16 hrs/yr
3) Tidal basin flows: 2 technicians 24 hrs/yr
Cost: 1) Mapping: $480
2) Tide gauge: $1,024/yr
3) Tidal basin flows: $1,536/yr
Lead: 1) Mapping: WDFW
2) Tide gauge: JKT
3) Tidal basin flows: JKT
Contingency Measures
If a functioning hydrological connection is not restored and self-maintaining between the two
creeks and the estuary, this aspect of the project would be deemed unsuccessful and serious
consideration would have to be given to what corrective actions could possibly result in desired
outcomes. If the tidal basins do not result in a net increase of tidal prism and sufficient flow to
transport sediment into Sequim Bay, then contingency measures could include: 1) waiting to see
whether the desired outcome may be achieved after a longer period of time; or 2) actively
manipulating the tidal basins (e.g., deepening and/or widening to increase the overall size).
28
Estuary Monitoring Plan
4.1.2 SEDIMENT TRANSPORT & DEPOSITION
Historic and Current Conditions
Inspection of historic U.S. Coast and Geodetic maps (1870, 1914, 1926) indicates that the JCL
and Dean Creek channels naturally migrated across the alluvial fan within the estuary, prior to the
time that roads, railroads, Highway 101, and dikes constricted the channel movements (see Figure
2.2, Shreffler 2000). Rerouting of the JCL and Dean Creek channels, loss of instream channel
complexity, and a decrease in tidal energy have decreased these channels’ ability to route
sediment through the system. Historic sediment transport rates and volumes are unknown and
difficult to assess accurately.
The construction of a pier off the end of the log yard resulted in disruption of longshore sediment
transport (Shreffler 2003). Because longshore drift in Sequim Bay is southerly along the west
side of the bay, the pier essentially trapped most suspended sediment, thereby “starving”
landscape features to the east of the pier of sediment. For example, EDG attributes the loss of the
former sand spit feature to the east of the pier to sediment starvation caused by the pier.
Restoration Objective
The restoration objectives relative to sediment transport are to:
1) Restore the natural pattern of longshore sediment transport by removing the log yard pier, log
yard fill, and delta cone, and
2) Allow the routing of sediment through the fluvial system and into the tidal system, by
removing estuary blockages (Log Deck Road, Old Blyn Highway, delta cone, culverts, dams, and
other fill) and restoring a functional connection between JCL, Dean Creek, and their combined
estuary that will enable the estuary to function once again as a sediment “pump” [note:
construction of a tidal channel network on the RV Park (WDFW) and Eng (WSDOT) properties
should also facilitate the routing of sediment into the estuary].
Restoration Rationale
Sediment mobility is critical to the ecological health of a river-estuary system, and “dynamically
stable” channels transport sediment downstream at the same rate that it is delivered to the system
from upstream. Dynamically stable channels maintain their general morphology over the time
29
Estuary Monitoring Plan
frame of centuries, although their stable pattern does not preclude lateral migration and associated
dynamics such as bank erosion and sediment deposition (Inter-Fluve 2001). By restoring natural
hydrology and sediment supply (suspended load and bedload) to the project area, sediment
transport and deposition will occur within the range of natural systems and proceed along a
trajectory toward natural conditions.
The accumulation of fine-grained sediment is indicative of environments that support the build up
of organic matter and a detritus-based food web. Organic-rich sediments provide an environment
where benthic invertebrate prey resources flourish, and hence provide the capacity for fish and
wildlife to forage. Thus, transport of fine sediments to the estuary where they can become
redistributed by longshore drift is critical in terms of providing habitat for juvenile salmonids,
other estuarine fish, shellfish, and shorebirds and their food base. Similarly, the deposition of
appropriate-sized gravel in the realigned JCL and Dean Creek channels is important in providing
suitable spawning habitat for adult salmonids.
BASELINE MONITORING
Methods & Data Analysis
1) Essential: Map the existing shoreline topography on an aerial photograph with particular
attention to sediment deposits at the mouths of both JCL Creek and Dean Creek, as well as the
area around the log yard pier and delta cone.
Note: As outlined in the JCL channel realignment monitoring plan (Shreffler 2001) aerial
photographs (1 inch = 500 feet) will be taken vertically over the project area and Salmon Creek
annually between March and April, as near as possible to solar noon when the tidal height is, at
minimum lower than +3 ft MLLW (-2 ft MLLW is ideal).
2) Essential: Survey cross sections to map the expected transport of sediment stored updrift from
the log yard pier.
Timeline, Personnel, Cost Estimate, and Lead
Timeline: 1) Mapping: Year 0
2) Cross sections: Year 0
30
Estuary Monitoring Plan
Personnel: 1) Mapping: 1 biologist 10 hrs
2) Cross sections: 1 biologist 24 hrs + 1 technician 24 hrs
Cost: 1) Mapping: $540 (note: aerial photo costs are already included in the JCL channel
realignment monitoring plan)
2) Cross sections: $2,064
Lead: 1) Mapping: JKT
2) Cross sections: JKT
IMPLEMENTATION MONITORING
1) Essential: Prepare as-built drawings of all estuary restoration features (i.e., Log Deck Road
removal, log yard fill removal, Old Blyn Highway removal, delta-cone removal, tidal channel
construction at RV Park and Eng) that have an effect on sediment transport/exchange or
longshore sediment transport (see Section 4.1.1).
EFFECTIVENESS MONITORING
Methods & Data Analysis
1) Essential: Map the shoreline topography on an aerial photograph following removal of all the
identified estuary blockages (Log Deck Road, Old Blyn Highway, delta cone, culverts, fills,
dam).
2) Essential: Re-survey cross sections updrift of the log yard pier to map the transport of
sediment following removal of the log yard pier.
3) Essential: Install permanent cross sections across selected tidal channels in the Eng tidal
basin, RV Park tidal basin, and log yard tidal basin to map the evolution of those constructed
channels.
Note: suspended sediment sampling during high flooding events will take place at the mouth of
JCL Creek and Dean Creek, as part of the JCL Creek monitoring plan. This sampling will
document the grain size of material being transported to the estuary during storm events.
31
Estuary Monitoring Plan
Performance Criteria
1) Within 10 years following removal of the log yard pier, log yard fill, and delta cone, sediment
that was formerly aggraded in these areas will be redistributed by the restored longshore drift cell.
[Note: within 5 years, sediment redistribution should be on a clear trajectory toward the above
performance criterion].
2) Tidal “flushing” capacity of the estuary tidal basins shall be sufficient to transport sediment out
into Sequim Bay.
Timeline, Personnel, Cost Estimate, and Lead
Timeline: 1) Mapping: Once/year in years 1-10
2) Longshore drift cross sections: Years 1, 4, 7, and 10
3) Tidal basin cross sections: Years 1, 4, 7, and 10
Personnel: 1) Mapping: 1 biologist 16 hrs/year
2) Longshore drift cross sections: 1 biologist 24 hrs/year + 1 technician 24 hrs/year
3) Tidal basin cross sections: 1 biologist 24 hrs/year + 1 technician 24 hrs/year
Cost: 1) Mapping: $864/year
2) Longshore drift cross sections: $2,064
3) Tidal basin cross sections: $2,064
Lead: JKT
Contingency Measures
Adequate sediment transport and deposition is critical for long-term functioning of the ecosystem
in support of invertebrates, fish, shellfish, birds, and their prey base. Contingency measures
could include attempts to identify whether the problem is caused by excessive sediment, a tidal
basin that is too small, inadequate roughness in the tidal channels (lwd), or stormwater runoff.
Each cause will have unique solutions.
32

Estuary Monitoring Plan
4.2 MONITORING OF HABITAT CONDITIONS & FUNCTIONS
Habitat conditions and functions monitoring tasks will focus on habitat gains, water and sediment
quality, and large woody debris. These tasks are intended to document improvements in habitat
conditions and functions that directly result from the restoration activities.
4.2.1 HABITAT GAINS
Historic and Current Conditions
It can be seen from analysis of historic photos and maps that the following habitats were formerly
more abundant in the project area (in terms of total acreage) than they are in current times:
emergent marsh, tidal channels, mudflat, and native riparian and terrestrial plant communities. It
is suspected that eelgrass was also more abundant pre-log yard development, but there is no data
to definitively support or refute that supposition.
Restoration Objective
The restoration objective is to increase the total acreage of properly functioning habitats,
including emergent marsh (low and high marsh), eelgrass, tidal channels, mudflat, and native
riparian and terrestrial plant communities relative to current conditions.
Restoration Rationale
It is predicted that gains in total acreage of properly functioning habitats will result in
corresponding gains in the species richness and abundance of flora and fauna that depend on
those habitats.
BASELINE MONITORING
Methods and Data Analysis
1) Essential: Identify major habitat types on an aerial photograph to define pre-restoration
habitat condition/distribution. Field verify habitat type classifications. Calculate acreage of each
habitat type.
Timeline, Personnel, Cost Estimate, and Lead
Timeline: Baseline in year 0
33

Estuary Monitoring Plan
Personnel: 1 biologist 16 hrs for aerial photo analysis + 1 biologist/botanist and 1 technician 8
hrs each for field verifications + 1 GIS specialist 8 hrs for mapping
Cost: $1,984
Lead: JKT
IMPLEMENTATION MONITORING
1) Essential: Prepare as-built drawings according to standard construction engineering practices
for all the estuary restoration elements (see Section 4.1.1).
EFFECTIVENESS MONITORING
Methods and Data Analysis
1) Essential: Repeat the baseline survey in years 1, 3, 5, and 10 and identify major habitat types
on an aerial photograph. Field verify habitat type classifications. Calculate acreage of each
habitat type. Compare changes in habitat areas (total acreage) between baseline conditions and
post-restoration conditions.
Performance Criteria
EDG has established the following targets for habitat gains (see Shreffler 2003):
• Intertidal: up to 20 acres (includes brackish marsh, salt marsh, unvegetated mudflats, and
intertidal areas that formerly supported eelgrass and other benthic and epibenthic plant
and animal communities)
• Eelgrass: natural recolonization to densities comparable to existing eelgrass beds at
project edges
• Creek channels (JCL and Dean): 1,000 linear feet
• Tidal channels: 2,730 linear feet
• Terrestrial: 9 acres (includes all native terrestrial plant communities; not all of this
acreage will be forested).
Timeline, Personnel, Cost Estimate, and Lead
Timeline: Years 1, 3, 5, 10
Personnel: 1 biologist 16 hrs for aerial photo analysis + 1 biologist/botanist and 1 technician 8
hrs each for field verifications + 1 GIS specialist
Cost: $1,984/year
Lead: JKT
34

Estuary Monitoring Plan
Contingency Measures
Contingency measures to increase the total acreage of the target habitats could include: altering
the hydrology, estuarine channel network morphology, or habitat elevations relative to MLLW;
planting native vegetation; or allowing more time for habitats to naturally recover. If invasive
species are a problem, contingency measures could include mechanical treatments (e.g. hand
clearing, burning, weed whacking, mowing) and/or, as a last resort, chemical treatments (e.g.
herbicides).
35
Estuary Monitoring Plan
4.2.2 WATER & SEDIMENT QUALITY
Historic and Current Conditions
No historic water or sediment quality data are available, pre-1961 for JCL, Dean Creek, or the
estuary.
Water and sediment quality in the JCL watershed has been impaired by a minimum of three land-
use practices: forestry, residential development, and animal keeping (Brastad et al. 1987).
Logging practices in the upper watershed prior to the mid-1980s contributed increased sediment
loads to JCL. Currently, sporadic logging is only taking place on state-owned land along the East
Fork of JCL, and this logging is not suspected to contribute sediment to JCL. Most of the known
failing septic systems that diminished water quality on the lower 0.7 miles of JCL have been
repaired or replaced. Animal keeping practices on the lower 0.7 miles of JCL have been changed
so that animals no longer have direct access to JCL. The Sequim Bay Watershed Management
Plan (1991) noted that, “water samples taken in the JCL drainage exceed state bacteria maximum
allowable levels by two-to three-fold.” However, fecal coliform data collected by Washington
State Department of Health (DOH) from 1992-1995 in marine waters at the mouth of JCL
showed no elevated values that exceed state or federal threshold criteria for fecal coliform
concentrations. Similarly, bi-monthly fecal coliform data collected by JKT at the mouth of JCL
and Dean Creek (1999 to present) have shown no elevated values.
Stormwater runoff in the vicinity of the proposed project has the potential to create significant
capacity and water/sediment quality problems. The creation of impervious surfaces such as
parking, rooftops, driveways, and roads results in increases in peak flows during and following
storms. Runoff can be high in pollutants such as nutrients, heavy metals, petroleum products, and
sediment. BMPs should be used for all new developments in the watershed.
The Sequim Bay Watershed Management Plan (SBWMP 1991) identified the log yard as one of
the six most significant sources of pollution into Sequim Bay. There are 86 creosote-treated
pilings and 5 untreated pilings between approximately 0 ft MLLW and -3.5 ft MLLW. The
creosote-treated pilings are presumed to cause adverse but undocumented effects to water and
sediment quality. Each piling also has an associated “footprint” that eliminates subtidal area that
may formerly have supported shellfish, eelgrass, or some other natural estuarine habitat.
36
Estuary Monitoring Plan
There are also certified harvestable commercial shellfish beds approximately 50 m west of the log
yard, and native shellfish at harvestable levels approximately 50 m to the east of the log yard. At
present, there are no harvestable clams within the area of the former log yard operations (Kelly
Curtis, former Shellfish Biologist for the Jamestown S’Klallam Tribe, personal communication
October 2002). The main water quality impacts affecting these tidelands are: 1) addition of
wood waste and chemical leachates from logs rafted in water, which contribute organic
substances to the water that can lead to oxygen depletion, and 2) burial or alteration of benthic
species.
Restoration Objective
The restoration objective is to improve water and sediment quality relative to current conditions
by realigning JCL and Dean Creek and reconnecting these creeks to the estuary, as well as
removing roads, culverts, and other fill, removing creosote-treated pilings (and the surrounding
sediment from the base of each piling), and improving stormwater management.
Restoration Rationale
Water and sediment quality can be degraded by nearly all human activities that affect the
landscape. The quality of water is the most important category of environmental factors affecting
the biota of stream ecosystems (Koski 1992).
BASELINE MONITORING
Methods and Data Analysis
The monitoring tasks listed below are either ongoing or planned:
• Ongoing Streamkeepers’ quarterly monitoring of air and water temperature, dissolved
oxygen (D.O.), conductivity, salinity, pH, turbidity, nitrate, and fecal coliform at four
reaches in the existing JCL Creek, as outlined in Section 3.2.2 of the JCL Creek
Realignment Monitoring Plan (Shreffler 2001).
• Ongoing Streamkeepers annual monitoring of benthic macroinvertebrates in the existing
JCL channel once/year in September or October (see Section 4.3.7).
• Planned water quality monitoring (daily air and water temperature, dissolved oxygen,
turbidity, and salinity measurements from June through September using a Hydrolab)
along the realigned JCL channel at the McLaughlin Property. This monitoring is outlined
in Section 3.2.2 of the JCL Creek Realignment Monitoring Plan (Shreffler 2001).
37

Estuary Monitoring Plan
• Ongoing JKT bi-monthly monitoring of fecal coliform in JCL and Dean Creek.
• Ongoing JKT monthly monitoring of dissolved oxygen, conductivity, pH, and
temperature in JCL and Dean Creek.
The following monitoring tasks shall be added:
1) Essential: Record weekly salinity measurements at the following JCL Creek stations: the
mouth of the existing JCL Creek, just below the JCL culvert under Highway 101, and ~200 feet
upstream of Highway 101; as well as the following Dean Creek stations: the mouth of the
existing Dean Creek, just below the Dean Creek culvert under Highway 101, and ~200 feet
upstream of Highway 101.
2) Recommended: Analyze surface sediment samples collected at the mouth of the existing JCL
Creek, the mouth of the existing Dean Creek, and 3 stations within the “footprint” of the pilings
for metals, organics, and total petroleum hydrocarbons (TPHs).
3) Recommended: Continue regular monitoring of fecal coliform concentrations in marine
waters of lower Sequim Bay (DOH).
Timeline, Personnel, Cost Estimate, and Lead
Timeline: 1) Salinity Measurements: Weekly, Year 0
2) Sediment Quality: Once, Year 0
3) Fecal Coliform: Monthly, Year 0
Personnel: 1) Salinity Measurements: 1 technician 52 hrs
2) Sediment Quality: 1 technician 16 hrs + 1 biologist 8 hrs for data analysis
3) Fecal Coliform: DOH
Cost: 1) Salinity Measurements: $1,664
2) Sediment Quality: $512 for technician + $432 for biologist + $500 for sample
processing (assumes 5 samples at ~$100/sample)
3) Fecal Coliform: no cost to project (DOH expense)
38
Estuary Monitoring Plan
Lead: 1) Salinity Measurements: JKT
2) Sediment Quality: JKT
3) Fecal Coliform: DOH
IMPLEMENTATION MONITORING
Visually inspect sediment and erosion control structures to prevent deleterious water quality
impacts.
EFFECTIVENESS MONITORING
Methods and Data Analysis
1) Essential: Record weekly salinity measurements at the following JCL Creek stations: the
mouth of the new JCL Creek, just below the Highway 101 bridge, and ~200 feet upstream of
Highway 101; as well as the following Dean Creek stations: the mouth of the new Dean Creek,
just below the Dean Creek culvert under Highway 101, and ~200 feet upstream of Highway 101.
Compare pre-project and post-project data.
2) Recommended: Analyze surface sediment samples collected at the mouth of the new JCL
Creek, the mouth of the new Dean Creek and 3 stations within the former “footprint” of the
pilings for metals, organics, and total petroleum hydrocarbons (TPHs).
3) Recommended: Continue monthly monitoring of fecal coliform concentrations in lower
Sequim Bay. Compare pre-project and post-project data.
Performance Criteria
1) Salinity measurements post-restoration shall demonstrate that the salinity wedge extends
further upstream in the new JCL channel and the new Dean Creek channel than in the existing
channels. For JCL, the salinity wedge shall reach the McLaughlin property south of HWY 101.
For Dean Creek, the salinity wedge shall reach approximately 300 ft upstream of the mouth.
2) Water quality parameters (water temperature, D.O., and turbidity) at the mouth of the new JCL
Creek channel, the mouth of the new Dean Creek channel, and within the footprint of the former
pilings shall not exceed state, federal, or tribal water quality standards. [Note: DOE standards
for freshwater are: water temperature < 13 degrees centigrade; DO > 7.0 mg/L, and turbidity not
39
Estuary Monitoring Plan
less than 5 NTU or 10% above background levels; At this time DOE has no standards for
temperature, D.O., and turbidity in waters that are >10 parts per thousand salinity].
3) Sediment quality parameters (metals, organics, TPH) at the mouth of the new JCL Creek
channel, the mouth of the new Dean Creek channel, and within the footprint of the former pilings
shall not exceed state, federal, or tribal water quality standards.
4) Post-project fecal coliform concentrations shall not exceed pre-project concentrations, and
shall not exceed state, federal, or tribal water quality standards.
Timeline, Personnel, Cost Estimate, and Lead
Timeline: 1) Salinity Measurements: Weekly, Years 1-3
2) Sediment Quality: Once annually, Years 1, 3, 5, 10
3) Fecal Coliform: Monthly, Years 1-10
Personnel: 1) Salinity Measurements: 1 technician 52 hrs/year
2) Sediment Quality: 1 technician 16 hrs/year + 1 biologist 8 hrs/year for data
analysis
3) Fecal Coliform: DOH
Cost: 1) Salinity Measurements: $1,664
2) Sediment Quality: $512/year for technician + $432/year for biologist + $500/year
for sample processing (assumes 5 samples at ~$100/sample)
3) Fecal Coliform: no cost to project
Lead: 1) Salinity Measurements: JKT
2) Sediment Quality: JKT
3) Fecal Coliform: DOH
Contingency Measures
If performance criteria are not met, the following contingency measures could be considered:
source control (of toxics or contaminants); improve stormwater management; improve septic
system operation and management; better enforce land-use regulations to limit impervious
surfaces; better enforce land-use regulations and/or encourage BMPs to limit the effects of
40

Estuary Monitoring Plan
mining, logging, conversion of forest lands to development, and other deleterious clearing of
riparian or wetland vegetation in the watershed; better enforce land use regulations to prevent
discharge from leaking septic tanks and eliminate domestic animal access to the JCL and Dean
Creek stream channels; and implementation of new land-use regulations, if necessary.
41
Estuary Monitoring Plan
4.2.3 LARGE WOODY DEBRIS
Historic and Current Conditions
Prior to human habitation of the Blyn area, the JCL valley was likely a cedar swamp at the head
of tidal influence interspersed with higher ground covered by old growth forest. In this
undisturbed condition, large woody debris (LWD) would likely have been distributed throughout
the estuary at the upper edges of the salt marsh and in tidal channels. At present, there is very
little LWD in the estuary, with the exception of a few logs (no branches or rootwads attached)
that are remnants from the historical use of the estuary as a log yard.
In 1999, two trained analysts assessed the condition of the riparian corridor along JCL using
aerial photos at a scale of 1:12000 (Bernthal et al. 1999). The extent, species composition, and
stand density of forested habitats, as well as the land use adjacent to these forested habitats, were
analyzed within a 200 ft. zone either side of the JCL channel, from the river mouth to the
uppermost extent of summer chum distribution. These data were not verified in the field.
Inspection of historical aerial photos indicated that the riparian corridor along the lower 1.5 miles
of the JCL has diminished in both width and length over the past century. Within the lower 1.5
miles of JCL where summer chum spawning occurs, land use is approximately 34% in forested
habitats, 38% in forestry, 12% in agriculture, 9% in roads and dikes, and 7% in residential land
uses. One hundred percent of the forested riparian corridor is in diameter classes less than 20 in.
diameter at breast height (dbh). The riparian species composition was 43% conifer dominated,
42% deciduous dominated, and 15% mixed conifer and deciduous. The ability of a riparian
corridor to supply large woody debris (LWD) over time is partly dependent on corridor width: a
50 ft no-cut corridor will supply 32% of LWD at age 200, a 135 ft corridor 77%, and a 210 ft
corridor 100% of LWD at age 200 (Bernthal et al. 1999). For JCL, sixty-nine percent of the
forested riparian corridor is less than 66 feet in width and thirty-one percent between 66 and 132
feet in width; no portion of the existing JCL riparian corridor is within the 210 foot classification
that is predicted to supply 100% of LWD at age 200. The loss of riparian habitat along JCL can
be attributed to forestry, agriculture, railroads, clearing of land for roads, and private residences.
Bank armoring along the lower half mile of JCL has also reduced the full functions of the
riverine-riparian habitat.
42
Estuary Monitoring Plan
Restoration Objective
The restoration objective is to install LWD into the estuarine tidal channels as both a hydraulic
feature and as a functional habitat, because there is unlikely to be any significant LWD
recruitment to the realigned JCL or Dean Creek channels or estuary for at least 20-50 years.
Restoration Rationale
By installing LWD into the estuarine tidal channels, EDG hopes to provide cover for juvenile
salmonids, as well as to “jumpstart” physical and biological processes within the channels until a
healthy riparian corridor has developed and LWD begins to naturally recruit to the estuary.
BASELINE MONITORING
See Bernthal et al. 1999 as described above in the Current Conditions. IMPLEMENTATION MONITORING
Methods and Data Analysis
A field biologist will be present on-site during construction to direct placement of wood by the
heavy equipment operators.
1) Essential: Map the location of each log with a GPS.
2) Essential: Photograph each significant LWD placement from a fixed location that is geo-
referenced.
3) Essential: Record the as-built depths of each pool associated with a LWD placement.
Timeline, Personnel, Cost Estimate, and Lead
Timeline: Year 0, during-construction
Personnel: 1) GPS/map: 1 biologist for 40 hours
2) Photo-document: 1 technician for 8 hrs
3) As-built pool depths: included in #1 above
Cost: 1) GPS/map: $2,160
2) Photo-document: $256
3) As-built pool depths: included in #1 above
43

Estuary Monitoring Plan
Lead: JKT
EFFECTIVENESS MONITORING
Methods and Data Analysis
Logjams will be constructed to resist coming apart in a flood or in winter storms at extreme high
tides. However, some movement of LWD is an expected and natural process.
1) Essential: Track movement of log jams annually using fixed photo points and GPS positions.
2) Essential: Track pool depth and dimensions using cross sections to document that logjams
create and maintain pool habitat.
3) Essential: Track changes in the number of pieces of wood per logjam.
Performance Criteria
1) 80% or more of the LWD placements should be present in Year 10.
2) LWD placements shall not move to locations where they pose a threat to infrastructure,
properties, or the channel morphology.
3) LWD placements shall maintain pool depth and channel form as built.
Timeline, Personnel, Cost Estimate, and Lead
Timeline: 1) Track movements of jams: Years 1, 3, 5, 10
2) Pool depths: Years 1, 5, 10
3) Pieces/jam: Years 1, 5, 10
Personnel: 1) Track movements of jams: 1 technician 8 hrs/year
2) Pool depths: 1 biologist 8 hrs/year
3) Pieces/jam: 1 technician + 1 biologist 8 hrs each/year
Cost: 1) Track movements of jams: $256/year
2) Pool depths: $432/year
3) Pieces/jam: $688/year
44

Estuary Monitoring Plan
Lead: JKT
Contingency Measures
Contingency measures could include adding more LWD and/or relocating or removing
problematic wood structures. LWD could be stockpiled on-site (in non-wetland areas) and
installed quickly in emergencies.
45
Estuary Monitoring Plan
4.3 MONITORING OF BIOLOGICAL RESPONSES
Biological responses monitoring tasks will focus on terrestrial and wetland vegetation
establishment, invasive vegetation management, eelgrass recovery, shellfish recovery, salmonid
use, invertebrate use, and bird use. These tasks are designed to evaluate the “success” of the
estuary restoration actions in improving the ecosystem for flora and fauna.
4.3.1 TERRESTRIAL VEGETATION ESTABLISHMENT
Restoration Objective
The restoration objective relative to terrestrial vegetation establishment is to re-establish native
vegetation (trees, shrubs, and groundcover) on portions of the former log yard property (~2.96
acres), the RV Park property (~3.20 acres), and the Eng property (target acreage presently
unknown).
Restoration Rationale
Restoring native vegetation will enhance wildlife habitat at the log yard, former RV Park, and
Eng property, and also improve the aesthetics of the project area relative to the bare, compacted
ground or invasive vegetation that currently exists in these locations. Vegetation will also help
screen wildlife habitat from the transportation corridors (Highway 101 and Olympic Discovery
Trail).
BASELINE MONITORING
Methods and Data Analysis
1) Essential: Identify transitional and terrestrial vegetation classes on an aerial photograph.
Field verify vegetation communities by species composition.
Timeline, Personnel, Cost Estimate, and Lead
Timeline: Baseline in year 0
Personnel: same as Habitat Gains section
Cost: already included in Habitat Gains section
Lead: JKT, WSDOT
46
Estuary Monitoring Plan
IMPLEMENTATION MONITORING
Methods and Data Analysis
A planting and watering plan (or irrigation system) will be developed closer to the time of the
actual revegetation effort.
1) Essential: Photo-document the entire revegetation process from permanently established
camera points.
2) Essential: Verify plantings by species, number of plants, and locations.
Timeline, Personnel, Cost Estimate, and Lead
Timeline: During construction in year 0
Personnel: Photodocument: 1 biologist 4 hrs to establish photo-points + 1 technician 8 hrs to
take photos
Verify plantings: 1 technician 8 hrs
Cost: Photodocument: $472
Verify plantings: $256
Lead: JKT, WSDOT
EFFECTIVENESS MONITORING
Methods and Data Analysis
1) Essential: Identify major vegetation types on an aerial photograph for each year of
monitoring. Visit the site to groundtruth vegetation communities twice/year in mid-spring and
late summer in years 1, 3, 5, 7, and 9, and once/year in late spring or early summer in years 2, 4,
6, 8, and 10. Field verify and categorize vegetation communities by species composition.
Establish permanent transects to identify species composition and percent canopy cover
(densiometer reading).
2) Essential: Establish and mark fixed test plots at the time of planting and monitor these plots
annually (once/year in mid-Summer) for densities, spacing, and survival of herb, shrub, and tree
47

Estuary Monitoring Plan
components. Make note of native and non-native pioneer species. [Note: suggested test plot size
for trees and shrub species is 1/50 acre, with a 3-ft radius test plot for monitoring herbs nested
within the 1/50 acre].
3) Essential: Photograph the revegetated areas from fixed camera points.
Performance Criteria
1) Percent Cover of native plantings and pioneers (trees and shrubs) should be at least 50% in
year 5, 60% in year 8, and 90% at the end of 10 years.
2) Plant survival: Any planted trees and shrubs that die within the first year will be replanted,
and/or other measures (e.g., watering, fencing, weeding) will be implemented as necessary to
assure survival. Subsequently, if mortality of the native plantings is greater than 30% in any
given year, then replant.
Timeline, Personnel, Cost Estimate, and Lead
Timeline: 1) Percent Cover: Twice/year in Years 1, 3, 5, 7, and 9; Once/year in Years 2, 4, 6, 8,
and 10; year 1 monitoring should take place within 4-6 months of planting to
determine whether replanting is necessary
2) Plant survival: Mid-summer once/year in years 1, 2, 3, 5, and 10
3) Photo-documentation: Twice/year (in driest and wettest periods of the year) in
years 1, 2, 3, 5, and 10
Personnel: 1) Percent Cover: 2 technicians 24 hrs/year each + 1 biologist 8 hrs/year for species
verifications
2) Plant survival: 2 technicians 12 hrs/year each + 1 biologist 8 hrs/year for species
verifications
3) Photo-documentation: 1 technician 8 hrs/year
Cost: 1) Percent Cover: $1,968/year + $200 supplies in Years 1, 3, 4, 7, and 9; $984/year
in Years, 2, 4, 6, 8, and 10.
2) Plant survival: $1,200/year for 2 technicians and 1 biologist
3) Photo-documentation: $256/year
48

Estuary Monitoring Plan
Lead: JKT, WSDOT Contingency Measures Potential causes of poor plant survival in year one could include improper installation, poor soil
structure and/or organic content, inadequate watering, herbivory, trampling, or competition
(especially from grasses). Excessive mortality in subsequent years will be addressed by one or
more of the following: additional plantings (same or replacement species as appropriate), soil
amendments, more frequent watering, weeding, fencing, management of non-native invasives that
may reestablish, and/or improved stewardship. In addition, alders could be thinned around year
10 to allow conifers to thrive.
49

Estuary Monitoring Plan
4.3.2 WETLAND VEGETATION ESTABLISHMENT
Historic and Current Conditions
The historic species composition and areal extent of estuarine wetland vegetation is unknown.
In December 2001, EPA and Shreffler Environmental conducted vegetation mapping in the
estuary portion of the project area north of Highway 101. Twenty-three different vegetation
communities were mapped, ranging in elevation from low salt marsh (typically dominated by
Salicornia virginica and Distichlis spicata) to high salt marsh (various dominants depending on
location).
Restoration Objective
To allow native estuarine wetland vegetation to naturally recolonize and re-establish in the
estuary at elevations capable of supporting wetland vegetation.
Restoration Rationale
Wetland vegetation provides habitat structure, facilitates sediment trapping, and serves as a
critical source of organic matter to support detritus-based food webs for juvenile salmonids,
shorebirds, and waterfowl. A review of the multitude of specific functions performed by
estuarine wetlands is provided in Shreffler (2000). EDG believes that the existing seedbed will
be sufficient to allow natural recolonization of the estuary, and at this time the only planned
planting will be approximately 700 Carex lyngbyei plants that were grown from seeds harvested
at the site in 1999. Those plants were installed in the restored log yard area in November 2003.
BASELINE MONITORING
Vegetation mapping completed in December 2001. IMPLEMENTATION MONITORING
None
EFFECTIVENESS MONITORING
Methods and Data Analysis
1) Essential: Identify the percent cover of wetland vegetation on aerial photographs, or use GPS
or traditional survey techniques to map the perimeter of wetland vegetation patches.
50

Estuary Monitoring Plan
2) Essential: Establish permanent transects and survey these transects during mid-summer to
determine species composition within a minimum of ten 0.25m x 0.25m quadrats randomly
distributed along each transect line. [Note: more than 10 sampling quadrats may be required,
depending on the length of the transects and expected variability in species composition]. Record
all plant species observed within each quadrat, and visually estimate percent cover of each
species within each quadrat.
3) Essential: Establish fixed camera points and photograph the areas that have naturally
recolonized with wetland vegetation.
Performance Criteria
1) Areal extent (percent cover) of wetland vegetation should be 60% comparable to that of
appropriate reference sites after 5 years and 80% comparable after 10 years.
2) Species composition of native wetland plant species should be 60% comparable to that of
appropriate reference sites after 5 years and 80% comparable after 10 years.
Timeline, Personnel, Cost Estimate, and Lead
Timeline: 1) Percent Cover: Mid-summer once/year in years 1, 2, 3, 5, and 10
2) Species composition: Mid-summer once/year in years 1, 2, 3, 5, and 10
3) Photo-document: Mid-summer once/year in years 1, 2, 3, 5, and 10
Personnel: 1) Percent Cover: 2 technicians 12 hrs/year each + 1 biologist 8 hrs/year
2) Species composition: same as percent cover
3) Photo-document: 1 technician 8 hrs/year
Cost: 1) Percent Cover: $1,200/year
2) Species composition: no additional cost, if done at same time as percent cover.
3) Photo-document: $256/year (note: no additional cost, if done at same time as
terrestrial photo-documentation).
Lead: JKT
51

Estuary Monitoring Plan
Contingency Measures
Excessive failure rates for plant establishment will be addressed with contingency measures.
Potential causes could include inadequate natural seed base, inappropriate elevations, poor soil
structure and/or organic content, herbivory, or competition. Contingency measures could include
plantings, soil amendments, watering, weeding, fencing, excavating to proper elevations,
management of non-native invasives that may reestablish, and/or improved stewardship.
52

Estuary Monitoring Plan
4.3.3 INVASIVE VEGETATION MANAGEMENT
Historic and Current Conditions
Historic conditions of invasive plants in the project area are unknown. Invasive plant species of
current particular concern at the restoration site are reed canary grass (Phalaris arundinacea),
Canada thistle (Cirsium arvense), Scot’s broom (Cytisus scoparius), Himalayan blackberry
(Rubus discolor), reedgrass (Phragmites communis), purple loosestrife (Lythrum salicaria), and
Japanese knotweed (Polygonum cuspidatum). Although Spartina alterniflora is not currently
present at the site, vigilance will be required to ensure that it doesn’t colonize given that EDG is
depending on natural regeneration.
Restoration Objective
The restoration objective relative to invasive vegetation management is to remove and control the
native and non-native, invasive species at the restoration site. The methods to be used in the
estuary are the same as those outlined in the Jimmycomelately Creek Revegetation Plan (Clallam
Conservation District 2001) for the JCL channel.
Restoration Rationale
Non-native, invasive plant species disrupt native plant community structure that provides higher
quality habitat and food for a variety of wildlife species, which, in turn, have evolved in
conjunction with native plant communities.
BASELINE MONITORING
Methods and Data Analysis
1) Essential: On aerial photographs, map locations of invasive species of concern in the existing
estuary.
Timeline, Personnel, Cost Estimate, and Lead
Timeline: Year 0
Personnel: 1 biologist 8 hrs
Cost: $480
Lead: JKT, EPA
53
Estuary Monitoring Plan
IMPLEMENTATION MONITORING
1) Essential: Excavate all invasive plant species, removing both above-ground and below-
ground plant structures when practicable.
EFFECTIVENESS MONITORING
Methods and Data Analysis
1) Essential: Following construction, re-map locations of invasive species of concern on aerial
photographs. Mechanically remove invasive plants (e.g. hand clearing, burning, weed whacking,
mowing), and monitor annually for their reappearance. Use mechanical control until natural
conditions (i.e., shading and/or saltwater) cause mortality. Chemical control is not considered an
acceptable means of control in salt marsh areas at this time.
Performance Criterion
The project area shall contain ≤5% cover by area of invasive plant species after 10 years.
Timeline, Personnel, Cost Estimate, and Lead
Timeline: Years 1, 5, and 10
Personnel: 1 technician 8 hrs/year + 1 biologist 8 hrs/year
Cost: $688/year
Lead: JKT, EPA
Contingency Measures
More than 5% cover by area of invasive plant species in any given monitoring year would trigger
the need for contingency measures. Contingency measures could include some combination of
mechanical treatments (e.g. hand clearing, burning, weed whacking, mowing).
54

Estuary Monitoring Plan
4.3.4 EELGRASS RECOVERY
Historic and Current Conditions
From 1892-2001, a log sorting and transportation operation was in business at the south end of
Sequim Bay. During that period (exact dates unknown), former wetlands and mudflats were
filled and a “pier” and multiple creosote-treated pilings were installed to facilitate the handling
and sorting of logs. The major impairments resulting from the pier, pilings, and log yard
operations are creosote contamination, other impacts to water quality, shading, prop wash, wood
debris, impacts to eelgrass, disruption of wildlife use of the area, and loss of estuarine mudflat
and wetland habitats (Shreffler 2003).
Current conditions immediately off shore of the log yard have been surveyed by Battelle Marine
Sciences Laboratory and JKT. In 1999, Battelle (Antrim 1999) conducted a video survey of
epibenthic habitat in the lower end of Sequim Bay, excluding the area within the boundaries of
the pilings and log rafts at the log transfer facility that were still in use at that time. In July 2001,
JKT staff surveyed substrate, wood waste, and algae (primarily Ulva spp. and Enteromorpha
spp.) at minus tides along transects stretching from ~0 ft to -2.0 ft MLLW, which were distributed
from the western edge of the log yard property to the mouth of JCL. In July 2002 and July 2003,
JKT staff mapped eelgrass beds to the northeast, and outside of, the footprint of the log yard
tidelands, using GPS at a -3 ft tide (MLLW). In September 2002, Battelle (Sargeant et al. 2002)
conducted a diver survey of eelgrass and wood waste within the area of the former log transfer
facility that is bounded by remaining pilings (“the footprint”).
Based on the Battelle and JKT surveys, eelgrass beds are present within approximately 90 m from
the western edge of the pilings (1999 Battelle video survey and 2002 diver confirmation) and
approximately 182 m from the eastern edge of the pilings (2002, 2003 JKT surveys). No eelgrass
was found within the log yard footprint by any of the various survey teams from Battelle or JKT.
The intertidal survey performed by JKT staff provided little indication of surface wood waste
deposits. Similarly, the Battelle divers found minimal bark, chip, or wood waste within the log
yard footprint, with the exception of several whole logs on the bottom that had presumably sunk
from log rafts. Sargeant et al. (2002) attributed the absence of eelgrass within the footprint to the
continuous human disturbance of the site since its establishment in the late 1800s.
55

Estuary Monitoring Plan
Sargeant et al. (2002) predicted that natural recolonization of eelgrass into the footprint would be
expected to occur gradually through the spreading of rhizomes from existing eelgrass beds, once
the existing pilings are removed, and assuming no further log rafting occurs at the site. The
minimal wood debris from the historical log yard operations is not expected to inhibit natural
expansion of the existing eelgrass beds. The dominant substrates of sand, mixed fines, and mud
present within the footprint are known to support eelgrass beds in comparable ecosystems that
have not previously been disturbed by logging operations.
Restoration Objective
To remove anthropogenic impairments (i.e., pier, pilings, fill) and allow existing eelgrass to
recover and expand into the footprint of the area formerly impacted by historic log rafting,
dredging, and related log yard operations. Note: 5 pilings that are not creosote-treated will
remain for shorebird roosting (see Section 3.0).
Restoration Rationale
Removal of anthropogenic impairments should facilitate natural recovery of the eelgrass beds,
without the need for a large-scale transplanting effort.
BASELINE MONITORING
Methods and Data Analysis
1) Essential: JKT completed a baseline survey of substrate, wood waste, and algae within
intertidal portions of the project area in July 2001.
2) Essential: Battelle Marine Sciences Laboratory completed a baseline survey of existing
eelgrass and wood waste within log yard “footprint” in September 2001 (Sargeant 2001).
3) Essential: JKT staff completed a survey of eelgrass to the east of the existing “footprint” of
the pilings in July 2002 and July 2003.
Timeline, Personnel, Cost Estimate, and Lead
Timeline: 1) JKT intertidal survey: July 2001
2) Battelle eelgrass survey: September 2002
3) JKT eelgrass surveys: July 2002, July 2003
56
Estuary Monitoring Plan
Personnel: 1) JKT intertidal survey: 1 biologist 8 hrs + 5 technicians, 8 hrs each
2) Battelle eelgrass survey: 3 divers
3) JKT eelgrass surveys: 1 biologist 8 hrs + 2 technicians, 8 hrs each + 1 GIS
specialist 8 hrs
Cost: 1) JKT intertidal survey: $1,712
2) Battelle eelgrass survey: $10,000
3) JKT eelgrass surveys: $1,376
Lead: 1) JKT intertidal survey: July 2001
2) Battelle eelgrass survey: Battelle Marine Sciences Laboratory (under contract to
JKT)
3) JKT eelgrass surveys: JKT
IMPLEMENTATION MONITORING
None
EFFECTIVENESS MONITORING
Methods and Data Analysis
1) Essential: Repeat the JKT low tide monitoring annually in years 1-10, with emphasis on the
western edge of the existing eelgrass bed to the east of the log yard footprint and the eastern edge
of the existing eelgrass bed to the west of the log yard footprint. [Note: This monitoring must be
performed on a low tide series that is at least -2.0 ft MLLW, and may need to be supplemented by
snorkeling observations or video in the portions of the project area that cannot be walked at low
tide].
2) Recommended: In years 5 and 10, repeat the diving survey within the former log yard
footprint, using the same transects as in year 0.
Performance Criterion
Monitoring will allow EDG to track the trajectory of eelgrass recovery into the formerly impacted
area. Given that no eelgrass currently exists within the impacted area, any natural recovery
would be a positive indication of success. The expectation is that if the site conditions allow for
natural recovery, then eelgrass abundance (total area covered) and shoot density should
eventually be comparable to the surrounding areas that currently support eelgrass. However,
57

Estuary Monitoring Plan
based on the best available science, EDG cannot currently predict how many years such recovery
will take. No signs of natural eelgrass recovery after 5 years would trigger the need for potential
contingency measures as outlined below.
Timeline, Personnel, Cost Estimate, and Lead
Timeline: 1) Low tide survey: Annually, Years 1-10
2) Diving survey: Years 5 and 10
Personnel: 1) Low tide survey: 1 biologist 8 hrs + 2 technicians, 8 hrs each + 1 GIS specialist 8
hrs for mapping
2) Diving survey: 3 divers
Cost: 1) Low tide survey: $1,376/yr
2) Diving survey: $10,000/yr
Lead: 1) Low tide survey: JKT
2) Diving survey: JKT/Battelle
Contingency Measures
If eelgrass fails to show signs of natural recovery at the site within 5 years, potential actions could
include: 1) removal of the few logs on the bottom; 2) partial or full removal of wood waste from
the bottom; and most likely 3) experimental transplanting of eelgrass.
58
Estuary Monitoring Plan
4.3.5 SHELLFISH RECOVERY
Historic and Current Conditions
Historical shellfish population abundances are unknown. The S’Klallam people, who have lived
in the area for thousands of years, used Jimmycomelately Creek, Dean Creek, and Sequim Bay as
traditional hunting, fishing, shellfishing, and gathering areas (Gunther 1927).
JKT performed shellfish surveys in 2001, 2002, 2003, which included measures of the total area
of the survey, total # of clams (littleneck and manila), total weight (g), density (lb/sq. ft.), total lbs
in survey area, and harvestable pounds. The most recent survey (2003) indicated 44,911
harvestable pounds of littlenecks and 27,423 harvestable pounds of manila clams within the
surveyed area. Harvestable size was defined as >38 mm. No harvestable clams of either species
were found within the footprint of the former log yard area. Privately-owned commercial clam
beds to the northwest of the former log yard are actively harvested.
Restoration Objective
To remove anthropogenic impairments (i.e., log yard pier, pilings, and fill) and allow shellfish to
recover and expand into the footprint of the area formerly impacted by historic log rafting,
dredging, and related log yard operations. The overall goal is to restore the populations of
shellfish in the former log yard area to harvestable levels.
Restoration Rationale
Removal of anthropogenic impairments should facilitate natural recovery of the shellfish
populations, without the need for a large-scale seeding effort.
BASELINE MONITORING
Methods and Data Analysis
1) Essential: JKT performed population surveys (species composition and abundances) in 2001,
2002, 2003, which represent the baseline, pre-project conditions.
Timeline, Personnel, Cost Estimate, and Lead
Timeline: 2001, 2002, 2003
Personnel: 1 shellfish biologist 8 hrs + 5 technicians, 8 hrs each + 1 GIS specialist 8 hrs for
mapping
59

Estuary Monitoring Plan
Cost: $2,144 labor + $100 supplies
Lead: JKT
IMPLEMENTATION MONITORING
Methods and Data Analysis
1) Recommended: Inventory historic shellfish species composition in the estuary by identifying
shells unearthed during the log yard excavation.
Timeline, Personnel, Cost Estimate, and Lead
Timeline: Year 0, post-excavation of log yard.
Personnel: 1 technician 8 hrs to collect shell samples + 1 shellfish biologist 8 hrs for
identifications
Cost: $688
Lead: JKT
EFFECTIVENESS MONITORING
Methods and Data Analysis
1) Essential: Repeat shellfish population surveys using the same methods in years 3, 5, and 10.
Performance Criterion
Monitoring will allow us to track shellfish recolonization of the formerly impacted area. Given
that no harvestable shellfish currently exist within the impacted area, any natural recovery would
be a positive indication of success. The expectation is that if the site conditions allow for natural
recovery, then shellfish species composition and abundances should eventually be comparable to
the surrounding areas that currently support shellfish. Substrate type (e.g., sand vs. mud vs.
gravel) strongly influences species composition and abundance. No signs of natural shellfish
recovery after 5 years would trigger the need for potential contingency measures as outlined
below.
Timeline, Personnel, Cost Estimate, and Lead
Timeline: Years 3, 5, 10.
Personnel: 1 shellfish biologist 8 hrs + 5 technicians, 8 hrs each + 1 GIS specialist 8 hrs for
mapping
Cost: $2,144 labor + $100/year supplies
60

Estuary Monitoring Plan
Lead: JKT
Contingency Measures
If there are no indications that shellfish are naturally recovering at the site within 5 years,
potential actions could include: 1) removal of logs on the bottom; 2) partial or full removal of
wood waste from the bottom; 3) experimental beach enhancement (e.g. beach graveling) and
seeding of shellfish.
61

Estuary Monitoring Plan
4.3.6 SALMONID USE
Historic and Current Conditions
Historic species and numbers of salmonids using the project area are unknown. The S’Klallam
people, who have lived in the area for thousands of years, used Jimmycomelately Creek and
Sequim Bay as traditional hunting, fishing, shellfishing, and gathering areas. Gunther (1927)
reports that the S’Klallam caught chum salmon in traps at the mouth of Jimmycomelately Creek
starting in late July, which is much earlier than the run now returns. Salo (1991) suggested that
historically chum salmon might have constituted up to 50% of the annual biomass of Pacific
Salmon in the North Pacific Ocean.
Anadromous fish species currently in the proposed project area include Hood Canal summer
chum salmon, coho salmon, winter steelhead, and sea-run cutthroat trout. Of these species,
summer chum salmon are of greatest concern because of their dramatic population declines and
federal ESA listing as a threatened species (Shreffler 2000). WDFW has implemented an
ongoing broodstock recovery program to try and save the dwindling run of JCL summer chum
(for details see Shreffler 2000).
Restoration Objective
The restoration objective relative to salmonid use is to restore unimpeded access to JCL, Dean
Creek, and the estuary for juvenile salmonids and returning adult spawners at all tidal elevations,
and to provide better rearing and spawning habitat than what is available in the existing Dean
Creek and JCL channels and the estuary. The overall goal is to restore the populations of
salmonids in these creeks to harvestable levels.
Restoration Rationale
This project will result in an increase in both habitat area and habitat functions. More habitat and
better functioning habitat should result in more salmonids using Dean Creek, JCL, and the
estuary.
BASELINE MONITORING
Methods and Data Analysis
The monitoring tasks listed below are already ongoing:
• Trap outmigrating smolts in JCL (JKT has pre-project data for 2002-2003)
62
Estuary Monitoring Plan
• Coho and chum spawning surveys (annually, WDFW)
• Returning spawner data and genetic analysis from the summer chum broodstock program
(WDFW, 1999-date).
The following monitoring task will be added to supplement the data from the above tasks:
1) Essential: Deploy a beach seine and minnow traps at a minimum of three locations (e.g., near
mouth of Dean Creek, near mouth of JCL, and somewhere in between the two creeks) to assess
species composition, abundance, outmigration timing, and length-frequency distributions of
juvenile salmon in the estuary (bi-weekly March to June). All fish will be released alive. The
fish use metric = number of juveniles/m2.
Timeline, Personnel, Cost Estimate, and Lead
Timeline: Baseline in year 0
Personnel: 2 technicians 8 hrs each/sampling period + 1 biologist for 8 hrs/sampling period (bi-
weekly Mar-Jun=8 sampling periods)
Cost: $7,552 for 3-person sampling team + $1,500 for beach seine & equipment
Lead: JKT
IMPLEMENTATION MONITORING
None identified.
EFFECTIVENESS MONITORING
Methods and Data Analysis
1) Essential: Perform visual surveys of returning adult chum salmon and other anadromous
species to ensure no stranding.
2) Essential: Perform visual surveys (or pole-seine sampling, if necessary) of juvenile salmonids
in the tidal channel networks on the Log Yard, RV Park, and Eng properties to ensure no
stranding of juvenile salmonids.
3) Essential: Deploy beach seines and minnow traps to assess species composition, abundance,
outmigration timing, and length-frequency distributions of juvenile salmon in the estuary (bi-
63
Estuary Monitoring Plan
weekly March to June); compare pre-restoration (baseline) data for the estuary to post-restoration
data (i.e., after removal of log yard pier, pilings, roads, fill, etc.).
*Note: EDG fully recognizes that an assessment of residence times and growth rates of juvenile
salmonids would provide a more definitive measure of the functional performance of the restored
system than mere abundance. However, EDG could not justify performing the necessary mark-
recapture study to attain data on residence times and growth rates, given the fact that JCL summer
chum are near extirpation and the unacceptable potential for additional mortalities associated with
any mark-recapture effort. Also, EDG (in conjunction with WDFW) will be closely monitoring
summer chum abundance and productivity numbers for JCL to make certain they are on a clear
trajectory toward meeting the Point No Point Treaty Tribes and Washington Department of Fish
and Wildlife (2003) planning targets of 520 spawners (productivity =1.0) or 330 spawners
(productivity =1.6).
Performance Criteria
1) No stranding of adult chum salmon or other anadromous species returning to spawn in JCL or
Dean Creek, and no stranding of juvenile salmonids in the tidal channel networks on the Log
Yard, RV Park, and Eng properties.
2) At the end of 10 years, juvenile salmonid abundance within the estuary should be higher than
the pre-project abundance within the former estuary.
Note: At the time the Jimmycomelately Creek Realignment Monitoring Plan (Shreffler 2001)
was completed, summer chum recovery targets for JCL had not been determined. It is now
appropriate to use the WDFW/PNPTC (2003) target escapement and productivity numbers as
“benchmarks” to evaluate the success of the habitat restoration actions in recovering JCL summer
chum. These targets are more appropriate for the JCL channel than for the estuary, and thus are
included in Summer Chum Addendum (September 2003) to the Jimmycomelately Creek
Realignment Monitoring Plan (Shreffler 2001).
Timeline, Personnel, Cost Estimate, and Lead
Timeline: 1) Stranding: Annually, years 1-10.
2) Juvenile surveys: Years 1, 2, 3, 5 and 10
64

Estuary Monitoring Plan
Personnel: 1) Stranding: WDFW volunteers
2) Juvenile surveys: 2 technicians + 1 biologist for 8 hrs/sampling period (bi-weekly
March-June=8 sampling periods)
Cost: 1) Stranding: No cost to project, if done by volunteers
2) Juvenile surveys: $7,552/year
Lead: 1) Stranding: WDFW
2) Juvenile surveys: JKT
Contingency Measures
If fish stranding is a problem, contingency measures could include removing any
constrictions/blockages of distributary channels resulting from accretion of sediment and/or
reconfiguring the tidal channel network. Failure to meet the performance criteria for juvenile
abundance would indicate that fundamental goals of the restoration project are not being met.
While specific causes of failure are difficult to predict at this point, an examination of the project
design, implementation, and site management would be required.
65
Estuary Monitoring Plan
4.3.7 INVERTEBRATE USE
Historic and Current Conditions
No historic information is available on invertebrate prey production within the existing estuary.
Invertebrates were presumably present in natural assemblages and densities prior to human
disturbance.
Current conditions are also basically unknown. The only available information on invertebrates
in the system is from macroinvertebrate sampling conducted once/year (2000-date) by
Streamkeepers at two reaches along the existing JCL channel. Reach 1 is downstream (north) of
Highway 101 and just south of the Old Blyn Highway Bridge. Reach 2 is upstream (south) of
Highway 101, near the McLaughlin property.
Restoration Objective
The restoration objective relative to invertebrate prey production is to ensure that juvenile
salmonids, as well as other fish species, shorebirds, and waterfowl using the estuary will have an
adequate food supply.
Restoration Rationale
The availability and quantity of invertebrate prey is a commonly accepted metric of the ability of
a habitat to promote juvenile salmonid production (Simenstad and Cordell 2000).
BASELINE MONITORING
Methods and Data Analysis
Streamkeepers is sampling benthic macroinvertebrates in the existing JCL channel once/year in
September or October using a Surber sampler and 500-micron mesh sieves. Invertebrate taxa are
identified to genus by an invertebrate taxonomist. Three field replicates are taken per sample,
and one of 10 replicates is sent to an independent laboratory for quality control checks. The
resulting data are used to calculate a genus-level, 10-metric benthic index of biotic integrity (B-
IBI) (Karr and Chu 1998).
66
Estuary Monitoring Plan
The following sampling could be added to supplement the Streamkeepers sampling:
1) Recommended: Benthic macroinvertebrates--Take 10 sediment core samples haphazardly
distributed in the estuary. Take core samples once in March, April, and May to a depth of 10 cm
using a PVC plastic core that samples an area of 0.0024 m2, as recommended by Cordell et al.
(1998). Fix all samples in the field using 5% buffered formaldehyde. Approximately 1 week
after fixation, wash benthic core samples through two sieve sizes: 0.5mm and 0.106mm.
Transfer samples to 50% isopropanol. Identify to species level all invertebrate taxa that are
known to be prey for juvenile salmonids, and record abundances of these species.
2) Recommended: Insects--Collect fallout insects in rectangular traps (55-cm x 38-cm plastic
storage bins) in March, April, and May. These floating traps rise and fall with the tide and are
kept in place by four vertical PVC pipes. They are designed to catch insects that fall from the air
or from riparian vegetation and, as such, measure direct input of insects to the aquatic ecosystem
(Cordell et al. 1998). Fill the traps to a depth of about 4 cm with propylene glycol-based
antifreeze, which acts as a preservative. Place five traps haphazardly in the estuary and leave in
place for 3 days. At the end of the sampling period, drain the preservative in each trap through a
0.106-mm sieve. Remove all insects from the sieve and place in sample jars with 50% isopropyl
alcohol. Identify to species level all insect taxa that are known to be prey for juvenile salmonids.
Timeline, Personnel, Cost Estimate, and Lead
Timeline: Monthly (March, April, May) in year 0
Personnel: Benthic core samples: 1 technician 24 hrs for sampling + 1 biologist 8 hrs for
establishing sampling sites and methods
Insect fallout samples: 1 technician 24 hrs for sampling + 1 biologist 8 hrs for
establishing sampling sites and methods
Invert. taxonomy: 1 taxonomist for macroinvertebrate and insect identification
Cost: Benthic core samples: $1,200
Insect fallout samples: $1,200
Invert. taxonomy: $3,000 (10 benthic samples/month x 3 months =30 samples + 10
insect samples/month x 3 months = 30 samples; so 60 samples total @ $50/sample)
67
Estuary Monitoring Plan
Lead: JKT, Streamkeepers
IMPLEMENTATION MONITORING
None
PERFORMANCE MONITORING
Methods and Data Analysis
1) Recommended: Repeat the methods outlined in the baseline monitoring section in restored
estuary and Salmon Creek reference site.
Performance Criteria
The species diversity, density (no. m-2), and standing stock (g wet m-2) of benthic
macroinvertebrates and insects within the restored estuary shall: 1) equal or exceed species
diversity, density, and standing stock for the existing estuary at the end of 10 years, and 2) be
comparable to the Salmon Creek reference site at the end of 10 years.
Timeline, Personnel, Cost Estimate, and Lead
Timeline: Monthly (March, April, May) in years 1, 3, 5, 7, and 10
Personnel: Benthic core samples: 1 technician 24 hrs for sampling + 1 biologist 8 hrs for
establishing sampling sites and methods
Insect fallout samples: 1 technician 24 hrs for sampling + 1 biologist 8 hrs for
establishing sampling sites and methods
Invert. taxonomy: 1 taxonomist for macroinvertebrate and insect identification
Cost: Benthic core samples: $1,200/year
Insect fallout samples: $1,200/year
Invert. taxonomy: $3,000/year (10 benthic samples/month x 3 months =30 samples +
10 insect samples/month x 3 months = 30 samples; so 60 samples total @
$50/sample)
Lead: JKT, Streamkeepers
68

Estuary Monitoring Plan
Contingency Measures
Lack of a productive benthic invertebrate community could indicate inadequate physical
conditions at the site, such as unsuitable sediment grain sizes or excessive scouring. Lack of
fallout insects could indicate inadequate riparian or marsh vegetation. Contingency measures
could include: altering the channel morphology to facilitate deposition of finer-grained sediments
and to reduce excessive scouring, or planting additional riparian and marsh vegetation to enhance
the insect community.
69

Estuary Monitoring Plan
4.3.8 BIRD USE
Historic and Current Conditions
Historic bird use of the Lower Sequim Bay Estuary is unknown, but the estuary likely supported
large concentrations of shorebirds, waterfowl and other coastal-dependent birds, given prime
estuarine habitats within the Pacific flyway. Currently, Sequim Bay is considered a significant
stop on the Pacific flyway, and there is a 10-year plan in place to increase the amount of protected
wetland acres in the bay by 1,000 acres.
Seventy-three bird species were recorded in the lower Sequim Bay estuary in 121 visits between
1996 and 2002, with a mean of 15 species/visit (Holtrop 2002). During that period, the mean
number of individuals/visit was 705. Lower Sequim Bay appears to be a major stopover and
wintering area for migrating waterfowl and shorebirds and the emergent marshes and mudflats
support an especially high species richness and abundance. A total of 21 shorebird and 25
waterfowl species use the estuary, attracting thousands of birds each year.
The emergent marshes and adjacent terrestrial habitats support a high diversity of landbirds.
Surveys in the 2002 and 2003 breeding seasons resulted in 58 landbird species in the vicinity of
the estuary (Holtrop, personal communication). Several Washington State Priority Species and
Species of Concern, as well as State and Federal Listed bird species, use the estuary.
Restoration Objective
The restoration objective relative to bird use is to increase the amount of habitat available for
birds and their prey resources in the estuary. At the time all creosote-treated pilings are removed
from the estuary, EDG has agreed to leave behind 5 untreated pilings with single, floating logs
attached for shorebird roosting.
Restoration Rationale
By increasing the amount of mudflat, emergent marsh, and eelgrass habitat, EDG expects to see a
corresponding increase in the total number of bird species (i.e., species richness) and the total
number of individuals of each species (i.e., abundance).
70
Estuary Monitoring Plan
BASELINE MONITORING
Methods and Data Analysis
Gene Kridler, a former USFWS employee and renowned ornithologist, conducted 121 bird counts
in lower Sequim Bay estuary from November 1996 to February 2002. During each visit, the birds
in the water and along the shore of the Bay between the Jamestown S’Klallam Tribal Center and
the log yard west of Dean Creek were counted using a spotting scope and binoculars. All water
bird species were counted, including shorebirds, swimmers (such as ducks and loons), waders
(such as herons), gulls and terns, and terrestrial-associated waterbirds (such as kingfishers).
Technicians from the Jamestown S’Klallam Tribe entered Kridler’s information in a database,
including weather and tide data at the time of each survey and the range boundaries of each
species. Each species was put in one of four range categories: visitor, winter, breeding season, or
year-round resident. Visitors include transients that stop to feed while migrating between
southern wintering and northern breeding grounds, or are post-breeding visitors that migrate here
in late summer from southern breeding grounds before heading further south for the winter.
Winter residents are species that are present in the Northern Olympic Peninsula area during the
winter, but that nest elsewhere. Breeding residents are present in this area only during the
breeding season of spring and summer, although they don’t necessarily nest at Sequim Bay.
Year-round residents are present in the area all year.
Karen Holtrop, a wildlife biologist, took over the counts from Gene Kridler in summer 2002, as
well as the management and analysis of the database. She determined bird species richness and
abundance by range category, year, and month. In addition to continuing the water bird counts,
she initiated landbird monitoring in the terrestrial habitats in and adjacent to the estuary.
Timeline, Personnel, Cost Estimate, and Lead
Timeline: Baseline data exist for 1995-2002
Personnel: 2 volunteers
Cost: volunteer contribution = $11,200 ($1,400/year x 8 years)
Lead: Karen Holtrop/JKT
IMPLEMENTATION MONITORING
None
71

Estuary Monitoring Plan
EFFECTIVENESS MONITORING
Methods and Data Analysis
1) Essential: Conduct annual water bird counts at 2-week intervals from late February through
early May, during the spring migration and August through October during the fall migration.
Make systematic observations from established viewing points of the number of each species
observed. Note the habitat of each species (e.g., water, trees, marsh vegetation, mudflat).
2) Essential: Conduct an annual breeding land bird survey (species & abundances) at least three
times in May and June. Note any indications of mating or nesting behavior.
3) Essential: Conduct at least three counts (species & abundances) annually of over-wintering
birds in December and January.
4) Essential: Observe species and abundances of shorebirds using the log booms anchored to the
untreated pilings offshore of the former log yard, at same time as bi-weekly water bird counts in
#1 above.
5) Essential: Compare bird species richness and abundance of individual species between the
estuary pre- and post-restoration.
Performance Criteria
1) Within 10 years post-restoration, species richness and abundance of breeding, wintering, and
migrating birds using the estuary shall equal or exceed pre-restoration species richness and
abundance.
2) The anchored log booms shall be used consistently by roosting shorebirds and not by seals.
Timeline, Personnel, Cost Estimate, and Lead
Timeline: Years 1-10
72
Estuary Monitoring Plan
Personnel: 1) Water bird counts: 2hrs/survey X 16 surveys/year = 32 hrs/year
2) Landbird surveys: 2 hrs/survey X 6 surveys/year = 12 hrs/year
3) Over-wintering counts: 2 hrs/survey X 6 surveys/year = 6 hrs/year
4) Log boom counts: 1 hr/survey X 16 surveys/year = 16 hrs/year
5) Data entry/analysis: 20 hrs/year
Cost: 1) Water bird counts: $1,120
2) Landbird surveys: $420
3) Over-wintering counts: $210
4) Log boom counts: $560
5) Data entry/analysis: $700
Lead: Karen Holtrop/JKT
Contingency Measures
Low bird use of the restored estuary would likely indicate too much human disturbance in the
area. Contingency measures could include eliminating public access or planting additional
vegetation to serve as a screen from Highway 101 noise. Low bird use of the estuary could also
indicate a lag time in development of appropriate prey resources or roosting/nesting habitat.
There are no good contingency measures to address such a lag other than time and patience.
Note: Use of the floating log booms by seals (in numbers considered to threaten spawning
salmon) would require reconfiguration of the log booms or their ultimate removal.
73
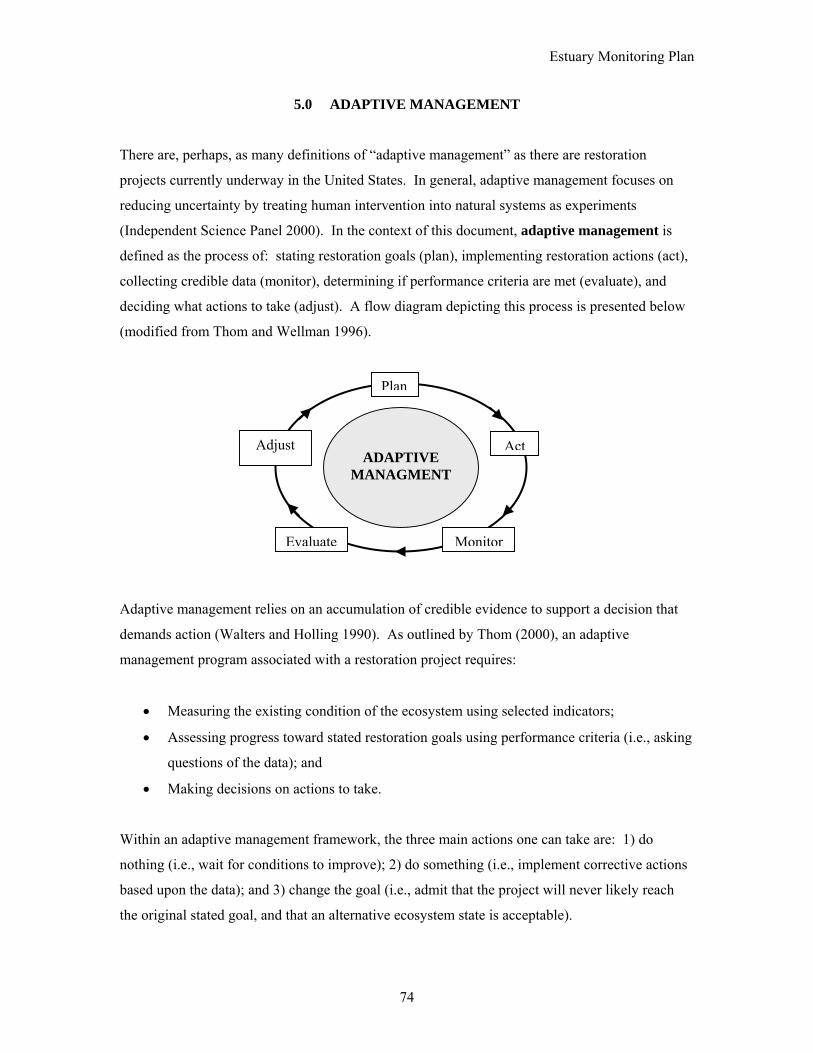
Estuary Monitoring Plan
5.0 ADAPTIVE MANAGEMENT
There are, perhaps, as many definitions of “adaptive management” as there are restoration
projects currently underway in the United States. In general, adaptive management focuses on
reducing uncertainty by treating human intervention into natural systems as experiments
(Independent Science Panel 2000). In the context of this document, adaptive management is
defined as the process of: stating restoration goals (plan), implementing restoration actions (act),
collecting credible data (monitor), determining if performance criteria are met (evaluate), and
deciding what actions to take (adjust). A flow diagram depicting this process is presented below
(modified from Thom and Wellman 1996).
e
AMA
Adjust
Adaptive management relies on an accumul
demands action (Walters and Holling 1990)
management program associated with a rest
• Measuring the existing condition of
• Assessing progress toward stated re
questions of the data); and
• Making decisions on actions to take
Within an adaptive management framework
nothing (i.e., wait for conditions to improve
based upon the data); and 3) change the goa
the original stated goal, and that an alternat
Plan
DAPTIVE NAGMENT
ation of credible evid
. As outlined by Tho
oration project requir
the ecosystem using
storation goals using
.
, the three main actio
); 2) do something (i
l (i.e., admit that the
ive ecosystem state is
74
Act
r
Monito Evaluatence to support a decision that
m (2000), an adaptive
es:
selected indicators;
performance criteria (i.e., asking
ns one can take are: 1) do
.e., implement corrective actions
project will never likely reach
acceptable).

Estuary Monitoring Plan
As summarized in Section 2.0, EDG has identified restoration goals and objectives, specific
measurable performance criteria to evaluate whether those objectives are being met, and potential
contingency measures if the objectives are not being met. Adaptive management is the process
by which EDG will collectively analyze all the monitoring data and available information,
determine the implications for restoration success or failure, and institute actions or policies to
make mid-course corrections. In other words, adaptive management is the feedback loop from
the assessment step (i.e., monitor) to the decision step (i.e., adjust).
Given the ten-year timeframe of this monitoring plan, it is important to recognize the potential
need to modify the plan. At least five types of changes to the monitoring plan can be envisioned
at this point (modified from Tanner 2000):
1. Changes in monitoring tasks: The science of ecosystem restoration is rapidly evolving
and it is likely that opportunities to improve the estuary monitoring program will be
identified (e.g., new or better equipment becomes available, standard monitoring
protocols are developed for this region, monitoring protocols can be improved based on
each previous year’s field experience).
2. Elimination of monitoring tasks: If consensus is reached among the technical group that
specific success criteria have been met, then associated monitoring tasks could cease.
Alternatively, the group could determine that a particular monitoring task is not returning
useful information, and therefore that task is not worth the expense of continuation. It’s
also conceivable that monitoring funds might no longer be available, and thus monitoring
priorities would have to be reconsidered.
3. Addition of new monitoring tasks: Monitoring in the first several years may show that
the technical group is not monitoring the appropriate parameters or species.
4. Changes in lead responsibilities for monitoring tasks: Over a ten-year period, staff
turnover is inevitable, and this could result in the lead for particular monitoring tasks
switching between entities. Changes in funding availability could also result in a
different entity taking the lead on a particular monitoring task(s).
5. Modification of project goals: As suggested by Thom (2000), one of the cornerstones of
applying adaptive management principles to coastal restoration projects is the ability to
modify project goals during the monitoring period.
75

Estuary Monitoring Plan
By using adaptive management, this monitoring plan attempts to balance the need for long-term
consistency and comparability in data collection with real-world practicality. As noted by Thom
and Wellman (1996), adaptive management recognizes the imperfect knowledge of
interdependencies within and among natural and social systems. Hence, monitoring plans must
be modified as technical knowledge improves and social preferences change.
76

Estuary Monitoring Plan
6.0 MONITORING TASKS, RESPONSIBILITIES, SCHEDULE, & ESTIMATED COSTS
In the interest of developing a framework that will help ensure that monitoring data is collected
consistently and systematically over the ten-year monitoring period, several summary tables have
been developed. All monitoring tasks, subtasks, responsible parties (lead partners), and the
monitoring schedule pre-construction, during construction (Year 0), and for ten years post-
construction (Years 1-10) are summarized in Table 6.1. Implementation of the monitoring plan
will depend on both volunteers (e.g., Audubon, Streamkeepers, WDFW broodstock recovery
program, and landowners) and staff from entities such as Clallam County, the Jamestown
S’Klallam Tribe (JKT), EPA, Streamkeepers, WDFW, Washington State Department of Health,
and U.S. Fish and Wildlife Service.
Preliminary cost estimates for each task and subtask over the 10-year monitoring period are
summarized in Table 6.2. As discussed in the previous section on adaptive management (Section
5.0), monitoring tasks or subtasks may be added, deleted, or changed when the monitoring data
provide credible evidence warranting such decisions. A good monitoring plan is an evolving one:
one which is rigorous enough to meet scientific standards and also adaptable enough to allow
modifications as technical knowledge improves, social preferences change, or funding sources
disappear.
The following are cost estimates for additional management elements of the monitoring plan:
Monitoring Coordination
Given the complexity of the monitoring program, the number of entities involved, and the 10-year
time span, one entity (or individual) will need to take the lead on coordination of all the various
monitoring. Adequate funds need to be available for hiring, contracting, and directing
subcontractors as needed, as well as inter-agency coordination to ensure that the monitoring is
being performed as outlined in this plan.
Estimated Cost: $5,000/year
77
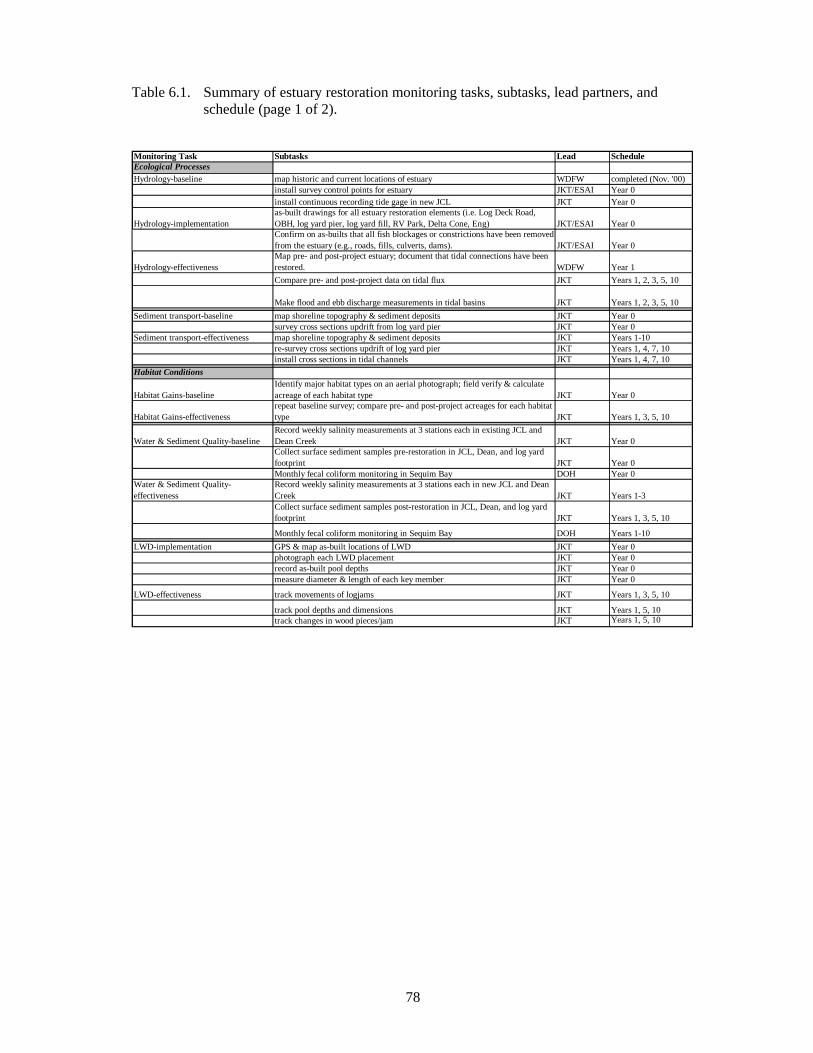
Table 6.1. Summary of estuary restoration monitoring tasks, subtasks, lead partners, and schedule (page 1 of 2).
Monitoring Task Subtasks Lead ScheduleEcological ProcessesHydrology-baseline map historic and current locations of estuary WDFW completed (Nov. '00)
install survey control points for estuary JKT/ESAI Year 0install continuous recording tide gage in new JCL JKT Year 0
Hydrology-implementationas-built drawings for all estuary restoration elements (i.e. Log Deck Road, OBH, log yard pier, log yard fill, RV Park, Delta Cone, Eng) JKT/ESAI Year 0Confirm on as-builts that all fish blockages or constrictions have been removed from the estuary (e.g., roads, fills, culverts, dams). JKT/ESAI Year 0
Hydrology-effectivenessMap pre- and post-project estuary; document that tidal connections have been restored. WDFW Year 1Compare pre- and post-project data on tidal flux JKT Years 1, 2, 3, 5, 10
Make flood and ebb discharge measurements in tidal basins JKT Years 1, 2, 3, 5, 10Sediment transport-baseline map shoreline topography & sediment deposits JKT Year 0
survey cross sections updrift from log yard pier JKT Year 0Sediment transport-effectiveness map shoreline topography & sediment deposits JKT Years 1-10
re-survey cross sections updrift of log yard pier JKT Years 1, 4, 7, 10install cross sections in tidal channels JKT Years 1, 4, 7, 10
Habitat Conditions
Habitat Gains-baselineIdentify major habitat types on an aerial photograph; field verify & calculate acreage of each habitat type JKT Year 0
Habitat Gains-effectivenessrepeat baseline survey; compare pre- and post-project acreages for each habitat type JKT Years 1, 3, 5, 10
Water & Sediment Quality-baselineRecord weekly salinity measurements at 3 stations each in existing JCL and Dean Creek JKT Year 0Collect surface sediment samples pre-restoration in JCL, Dean, and log yard footprint JKT Year 0Monthly fecal coliform monitoring in Sequim Bay DOH Year 0
Water & Sediment Quality-effectiveness
Record weekly salinity measurements at 3 stations each in new JCL and Dean Creek JKT Years 1-3Collect surface sediment samples post-restoration in JCL, Dean, and log yard footprint JKT Years 1, 3, 5, 10
Monthly fecal coliform monitoring in Sequim Bay DOH Years 1-10LWD-implementation GPS & map as-built locations of LWD JKT Year 0
photograph each LWD placement JKT Year 0record as-built pool depths JKT Year 0measure diameter & length of each key member JKT Year 0
LWD-effectiveness track movements of logjams JKT Years 1, 3, 5, 10
track pool depths and dimensions JKT Years 1, 5, 10track changes in wood pieces/jam JKT Years 1, 5, 10
78
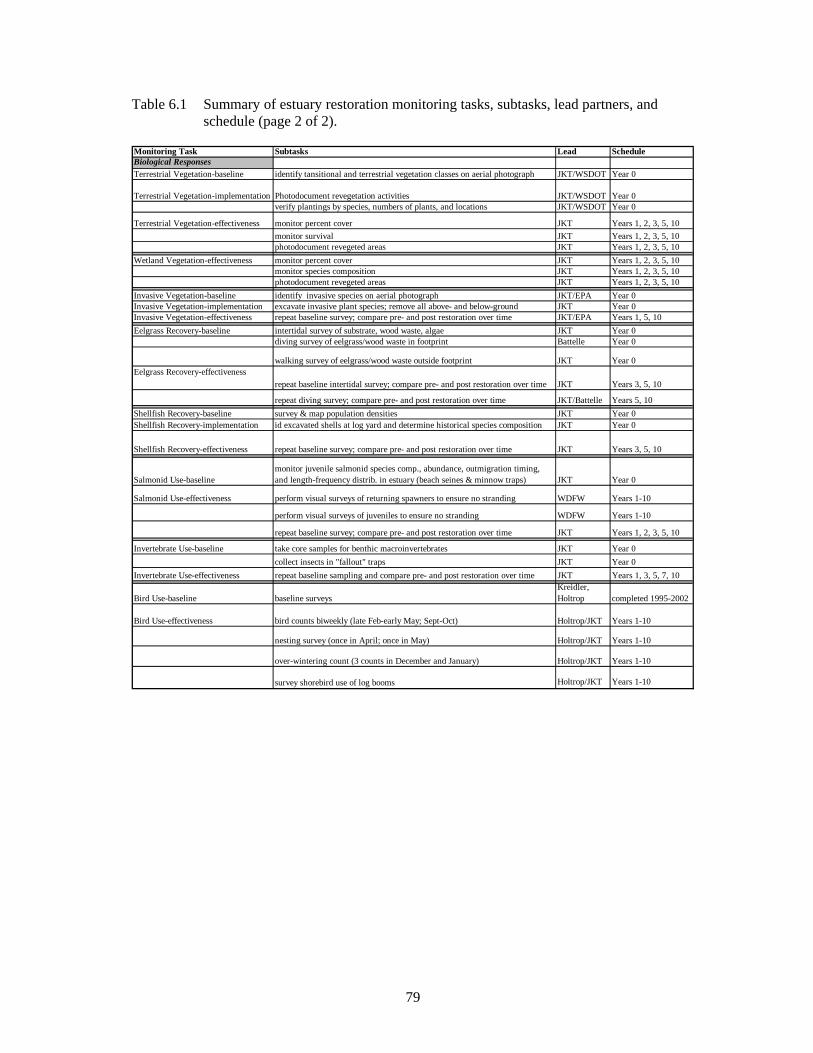
Table 6.1 Summary of estuary restoration monitoring tasks, subtasks, lead partners, and schedule (page 2 of 2).
Monitoring Task Subtasks Lead ScheduleBiological ResponsesTerrestrial Vegetation-baseline identify tansitional and terrestrial vegetation classes on aerial photograph JKT/WSDOT Year 0
Terrestrial Vegetation-implementation Photodocument revegetation activities JKT/WSDOT Year 0verify plantings by species, numbers of plants, and locations JKT/WSDOT Year 0
Terrestrial Vegetation-effectiveness monitor percent cover JKT Years 1, 2, 3, 5, 10monitor survival JKT Years 1, 2, 3, 5, 10photodocument revegeted areas JKT Years 1, 2, 3, 5, 10
Wetland Vegetation-effectiveness monitor percent cover JKT Years 1, 2, 3, 5, 10monitor species composition JKT Years 1, 2, 3, 5, 10photodocument revegeted areas JKT Years 1, 2, 3, 5, 10
Invasive Vegetation-baseline identify invasive species on aerial photograph JKT/EPA Year 0Invasive Vegetation-implementation excavate invasive plant species; remove all above- and below-ground JKT Year 0Invasive Vegetation-effectiveness repeat baseline survey; compare pre- and post restoration over time JKT/EPA Years 1, 5, 10Eelgrass Recovery-baseline intertidal survey of substrate, wood waste, algae JKT Year 0
diving survey of eelgrass/wood waste in footprint Battelle Year 0
walking survey of eelgrass/wood waste outside footprint JKT Year 0Eelgrass Recovery-effectiveness
repeat baseline intertidal survey; compare pre- and post restoration over time JKT Years 3, 5, 10
repeat diving survey; compare pre- and post restoration over time JKT/Battelle Years 5, 10Shellfish Recovery-baseline survey & map population densities JKT Year 0Shellfish Recovery-implementation id excavated shells at log yard and determine historical species composition JKT Year 0
Shellfish Recovery-effectiveness repeat baseline survey; compare pre- and post restoration over time JKT Years 3, 5, 10
Salmonid Use-baselinemonitor juvenile salmonid species comp., abundance, outmigration timing, and length-frequency distrib. in estuary (beach seines & minnow traps) JKT Year 0
Salmonid Use-effectiveness perform visual surveys of returning spawners to ensure no stranding WDFW Years 1-10
perform visual surveys of juveniles to ensure no stranding WDFW Years 1-10
repeat baseline survey; compare pre- and post restoration over time JKT Years 1, 2, 3, 5, 10
Invertebrate Use-baseline take core samples for benthic macroinvertebrates JKT Year 0collect insects in "fallout" traps JKT Year 0
Invertebrate Use-effectiveness repeat baseline sampling and compare pre- and post restoration over time JKT Years 1, 3, 5, 7, 10
Bird Use-baseline baseline surveysKreidler, Holtrop completed 1995-2002
Bird Use-effectiveness bird counts biweekly (late Feb-early May; Sept-Oct) Holtrop/JKT Years 1-10
nesting survey (once in April; once in May) Holtrop/JKT Years 1-10
over-wintering count (3 counts in December and January) Holtrop/JKT Years 1-10
survey shorebird use of log booms Holtrop/JKT Years 1-10
79
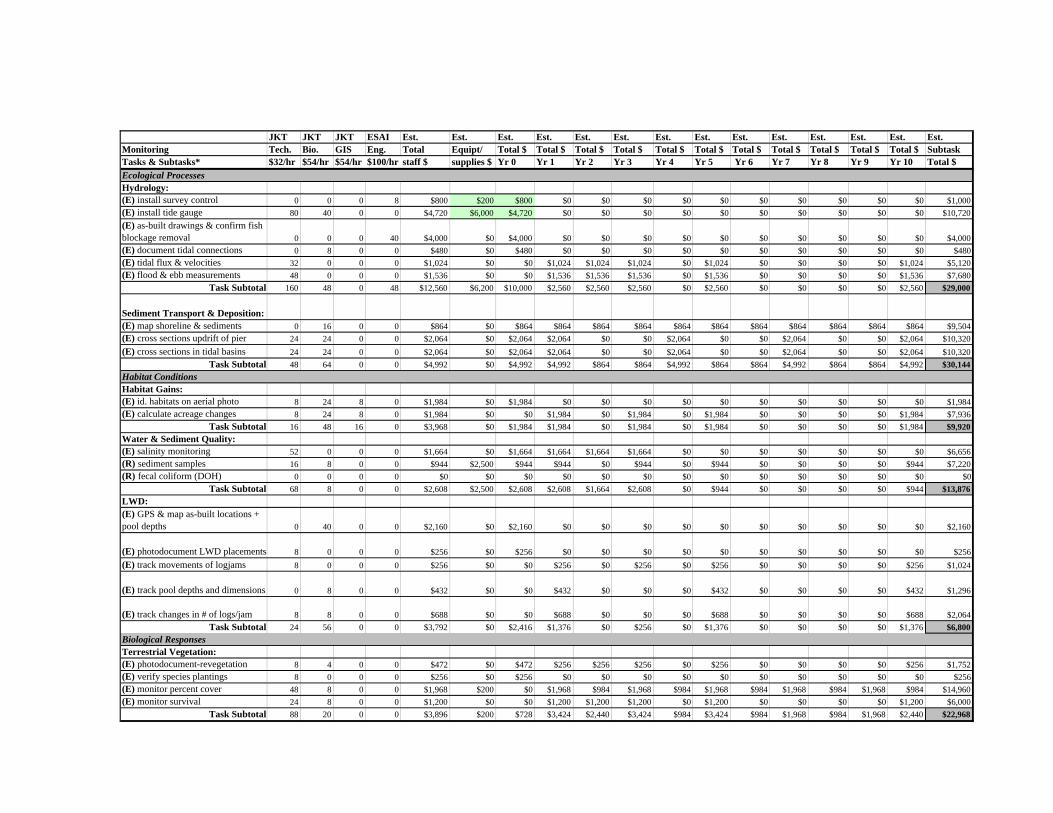
JKT JKT JKT ESAI Est. Est. Est. Est. Est. Est. Est. Est. Est. Est. Est. Est. Est. Est.Monitoring Tech. Bio. GIS Eng. Total Equipt/ Total $ Total $ Total $ Total $ Total $ Total $ Total $ Total $ Total $ Total $ Total $ SubtaskTasks & Subtasks* $32/hr $54/hr $54/hr $100/hr staff $ supplies $ Yr 0 Yr 1 Yr 2 Yr 3 Yr 4 Yr 5 Yr 6 Yr 7 Yr 8 Yr 9 Yr 10 Total $Ecological Processes Hydrology:(E) install survey control 0 0 0 8 $800 $200 $800 $0 $0 $0 $0 $0 $0 $0 $0 $0 $0 $1,000(E) install tide gauge 80 40 0 0 $4,720 $6,000 $4,720 $0 $0 $0 $0 $0 $0 $0 $0 $0 $0 $10,720(E) as-built drawings & confirm fish blockage removal 0 0 0 40 $4,000 $0 $4,000 $0 $0 $0 $0 $0 $0 $0 $0 $0 $0 $4,000(E) document tidal connections 0 8 0 0 $480 $0 $480 $0 $0 $0 $0 $0 $0 $0 $0 $0 $0 $480(E) tidal flux & velocities 32 0 0 0 $1,024 $0 $0 $1,024 $1,024 $1,024 $0 $1,024 $0 $0 $0 $0 $1,024 $5,120(E) flood & ebb measurements 48 0 0 0 $1,536 $0 $0 $1,536 $1,536 $1,536 $0 $1,536 $0 $0 $0 $0 $1,536 $7,680
Task Subtotal 160 48 0 48 $12,560 $6,200 $10,000 $2,560 $2,560 $2,560 $0 $2,560 $0 $0 $0 $0 $2,560 $29,000
Sediment Transport & Deposition:(E) map shoreline & sediments 0 16 0 0 $864 $0 $864 $864 $864 $864 $864 $864 $864 $864 $864 $864 $864 $9,504(E) cross sections updrift of pier 24 24 0 0 $2,064 $0 $2,064 $2,064 $0 $0 $2,064 $0 $0 $2,064 $0 $0 $2,064 $10,320(E) cross sections in tidal basins 24 24 0 0 $2,064 $0 $2,064 $2,064 $0 $0 $2,064 $0 $0 $2,064 $0 $0 $2,064 $10,320
Task Subtotal 48 64 0 0 $4,992 $0 $4,992 $4,992 $864 $864 $4,992 $864 $864 $4,992 $864 $864 $4,992 $30,144Habitat ConditionsHabitat Gains:(E) id. habitats on aerial photo 8 24 8 0 $1,984 $0 $1,984 $0 $0 $0 $0 $0 $0 $0 $0 $0 $0 $1,984(E) calculate acreage changes 8 24 8 0 $1,984 $0 $0 $1,984 $0 $1,984 $0 $1,984 $0 $0 $0 $0 $1,984 $7,936
Task Subtotal 16 48 16 0 $3,968 $0 $1,984 $1,984 $0 $1,984 $0 $1,984 $0 $0 $0 $0 $1,984 $9,920Water & Sediment Quality:(E) salinity monitoring 52 0 0 0 $1,664 $0 $1,664 $1,664 $1,664 $1,664 $0 $0 $0 $0 $0 $0 $0 $6,656(R) sediment samples 16 8 0 0 $944 $2,500 $944 $944 $0 $944 $0 $944 $0 $0 $0 $0 $944 $7,220(R) fecal coliform (DOH) 0 0 0 0 $0 $0 $0 $0 $0 $0 $0 $0 $0 $0 $0 $0 $0 $0
Task Subtotal 68 8 0 0 $2,608 $2,500 $2,608 $2,608 $1,664 $2,608 $0 $944 $0 $0 $0 $0 $944 $13,876LWD:(E) GPS & map as-built locations + pool depths 0 40 0 0 $2,160 $0 $2,160 $0 $0 $0 $0 $0 $0 $0 $0 $0 $0 $2,160
(E) photodocument LWD placements 8 0 0 0 $256 $0 $256 $0 $0 $0 $0 $0 $0 $0 $0 $0 $0 $256(E) track movements of logjams 8 0 0 0 $256 $0 $0 $256 $0 $256 $0 $256 $0 $0 $0 $0 $256 $1,024
(E) track pool depths and dimensions 0 8 0 0 $432 $0 $0 $432 $0 $0 $0 $432 $0 $0 $0 $0 $432 $1,296
(E) track changes in # of logs/jam 8 8 0 0 $688 $0 $0 $688 $0 $0 $0 $688 $0 $0 $0 $0 $688 $2,064Task Subtotal 24 56 0 0 $3,792 $0 $2,416 $1,376 $0 $256 $0 $1,376 $0 $0 $0 $0 $1,376 $6,800
Biological ResponsesTerrestrial Vegetation:(E) photodocument-revegetation 8 4 0 0 $472 $0 $472 $256 $256 $256 $0 $256 $0 $0 $0 $0 $256 $1,752(E) verify species plantings 8 0 0 0 $256 $0 $256 $0 $0 $0 $0 $0 $0 $0 $0 $0 $0 $256(E) monitor percent cover 48 8 0 0 $1,968 $200 $0 $1,968 $984 $1,968 $984 $1,968 $984 $1,968 $984 $1,968 $984 $14,960(E) monitor survival 24 8 0 0 $1,200 $0 $0 $1,200 $1,200 $1,200 $0 $1,200 $0 $0 $0 $0 $1,200 $6,000
Task Subtotal 88 20 0 0 $3,896 $200 $728 $3,424 $2,440 $3,424 $984 $3,424 $984 $1,968 $984 $1,968 $2,440 $22,968
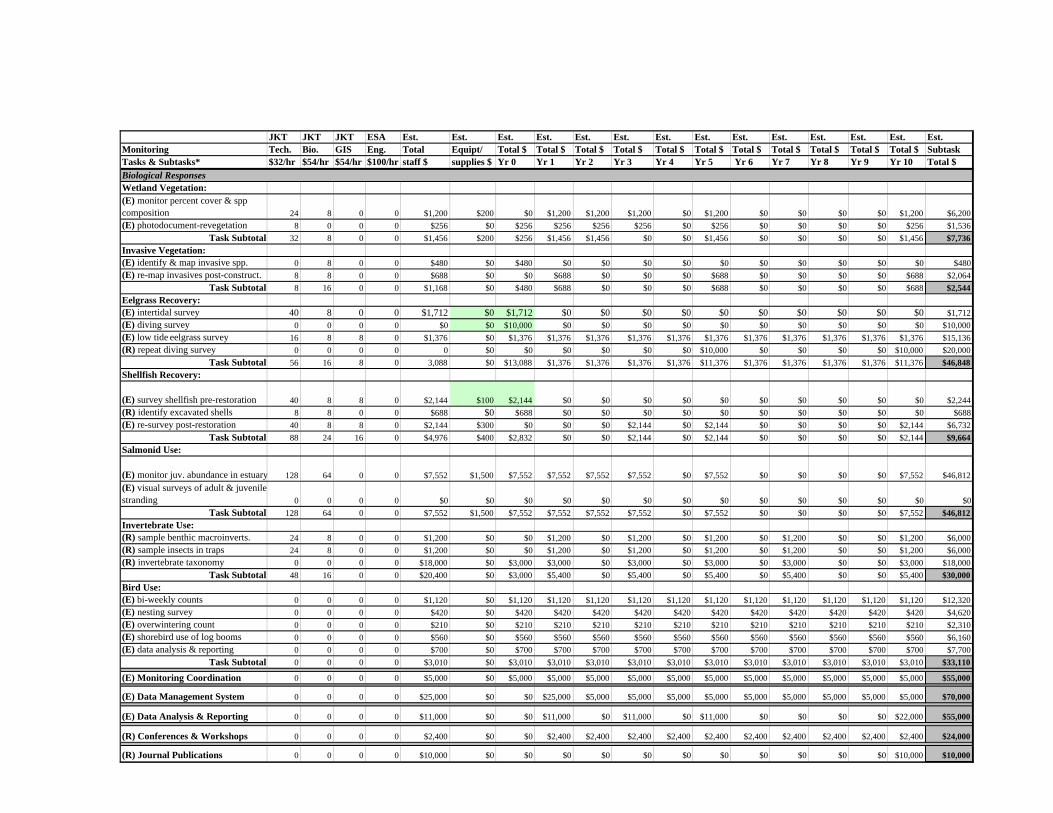
JKT JKT JKT ESA Est. Est. Est. Est. Est. Est. Est. Est. Est. Est. Est. Est. Est. Est.Monitoring Tech. Bio. GIS Eng. Total Equipt/ Total $ Total $ Total $ Total $ Total $ Total $ Total $ Total $ Total $ Total $ Total $ SubtaskTasks & Subtasks* $32/hr $54/hr $54/hr $100/hr staff $ supplies $ Yr 0 Yr 1 Yr 2 Yr 3 Yr 4 Yr 5 Yr 6 Yr 7 Yr 8 Yr 9 Yr 10 Total $Biological ResponsesWetland Vegetation:(E) monitor percent cover & spp composition 24 8 0 0 $1,200 $200 $0 $1,200 $1,200 $1,200 $0 $1,200 $0 $0 $0 $0 $1,200 $6,200(E) photodocument-revegetation 8 0 0 0 $256 $0 $256 $256 $256 $256 $0 $256 $0 $0 $0 $0 $256 $1,536
Task Subtotal 32 8 0 0 $1,456 $200 $256 $1,456 $1,456 $0 $0 $1,456 $0 $0 $0 $0 $1,456 $7,736Invasive Vegetation:(E) identify & map invasive spp. 0 8 0 0 $480 $0 $480 $0 $0 $0 $0 $0 $0 $0 $0 $0 $0 $480(E) re-map invasives post-construct. 8 8 0 0 $688 $0 $0 $688 $0 $0 $0 $688 $0 $0 $0 $0 $688 $2,064
Task Subtotal 8 16 0 0 $1,168 $0 $480 $688 $0 $0 $0 $688 $0 $0 $0 $0 $688 $2,544Eelgrass Recovery:(E) intertidal survey 40 8 0 0 $1,712 $0 $1,712 $0 $0 $0 $0 $0 $0 $0 $0 $0 $0 $1,712(E) diving survey 0 0 0 0 $0 $0 $10,000 $0 $0 $0 $0 $0 $0 $0 $0 $0 $0 $10,000(E) low tide eelgrass survey 16 8 8 0 $1,376 $0 $1,376 $1,376 $1,376 $1,376 $1,376 $1,376 $1,376 $1,376 $1,376 $1,376 $1,376 $15,136(R) repeat diving survey 0 0 0 0 0 $0 $0 $0 $0 $0 $0 $10,000 $0 $0 $0 $0 $10,000 $20,000
Task Subtotal 56 16 8 0 3,088 $0 $13,088 $1,376 $1,376 $1,376 $1,376 $11,376 $1,376 $1,376 $1,376 $1,376 $11,376 $46,848Shellfish Recovery:
(E) survey shellfish pre-restoration 40 8 8 0 $2,144 $100 $2,144 $0 $0 $0 $0 $0 $0 $0 $0 $0 $0 $2,244(R) identify excavated shells 8 8 0 0 $688 $0 $688 $0 $0 $0 $0 $0 $0 $0 $0 $0 $0 $688(E) re-survey post-restoration 40 8 8 0 $2,144 $300 $0 $0 $0 $2,144 $0 $2,144 $0 $0 $0 $0 $2,144 $6,732
Task Subtotal 88 24 16 0 $4,976 $400 $2,832 $0 $0 $2,144 $0 $2,144 $0 $0 $0 $0 $2,144 $9,664Salmonid Use:
(E) monitor juv. abundance in estuary 128 64 0 0 $7,552 $1,500 $7,552 $7,552 $7,552 $7,552 $0 $7,552 $0 $0 $0 $0 $7,552 $46,812(E) visual surveys of adult & juvenile stranding 0 0 0 0 $0 $0 $0 $0 $0 $0 $0 $0 $0 $0 $0 $0 $0 $0
Task Subtotal 128 64 0 0 $7,552 $1,500 $7,552 $7,552 $7,552 $7,552 $0 $7,552 $0 $0 $0 $0 $7,552 $46,812Invertebrate Use: (R) sample benthic macroinverts. 24 8 0 0 $1,200 $0 $0 $1,200 $0 $1,200 $0 $1,200 $0 $1,200 $0 $0 $1,200 $6,000(R) sample insects in traps 24 8 0 0 $1,200 $0 $0 $1,200 $0 $1,200 $0 $1,200 $0 $1,200 $0 $0 $1,200 $6,000(R) invertebrate taxonomy 0 0 0 0 $18,000 $0 $3,000 $3,000 $0 $3,000 $0 $3,000 $0 $3,000 $0 $0 $3,000 $18,000
Task Subtotal 48 16 0 0 $20,400 $0 $3,000 $5,400 $0 $5,400 $0 $5,400 $0 $5,400 $0 $0 $5,400 $30,000Bird Use:(E) bi-weekly counts 0 0 0 0 $1,120 $0 $1,120 $1,120 $1,120 $1,120 $1,120 $1,120 $1,120 $1,120 $1,120 $1,120 $1,120 $12,320(E) nesting survey 0 0 0 0 $420 $0 $420 $420 $420 $420 $420 $420 $420 $420 $420 $420 $420 $4,620(E) overwintering count 0 0 0 0 $210 $0 $210 $210 $210 $210 $210 $210 $210 $210 $210 $210 $210 $2,310(E) shorebird use of log booms 0 0 0 0 $560 $0 $560 $560 $560 $560 $560 $560 $560 $560 $560 $560 $560 $6,160(E) data analysis & reporting 0 0 0 0 $700 $0 $700 $700 $700 $700 $700 $700 $700 $700 $700 $700 $700 $7,700
Task Subtotal 0 0 0 0 $3,010 $0 $3,010 $3,010 $3,010 $3,010 $3,010 $3,010 $3,010 $3,010 $3,010 $3,010 $3,010 $33,110
(E) Monitoring Coordination 0 0 0 0 $5,000 $0 $5,000 $5,000 $5,000 $5,000 $5,000 $5,000 $5,000 $5,000 $5,000 $5,000 $5,000 $55,000
(E) Data Management System 0 0 0 0 $25,000 $0 $0 $25,000 $5,000 $5,000 $5,000 $5,000 $5,000 $5,000 $5,000 $5,000 $5,000 $70,000
(E) Data Analysis & Reporting 0 0 0 0 $11,000 $0 $0 $11,000 $0 $11,000 $0 $11,000 $0 $0 $0 $0 $22,000 $55,000
(R) Conferences & Workshops 0 0 0 0 $2,400 $0 $0 $2,400 $2,400 $2,400 $2,400 $2,400 $2,400 $2,400 $2,400 $2,400 $2,400 $24,000
(R) Journal Publications 0 0 0 0 $10,000 $0 $0 $0 $0 $0 $0 $0 $0 $0 $0 $0 $10,000 $10,000
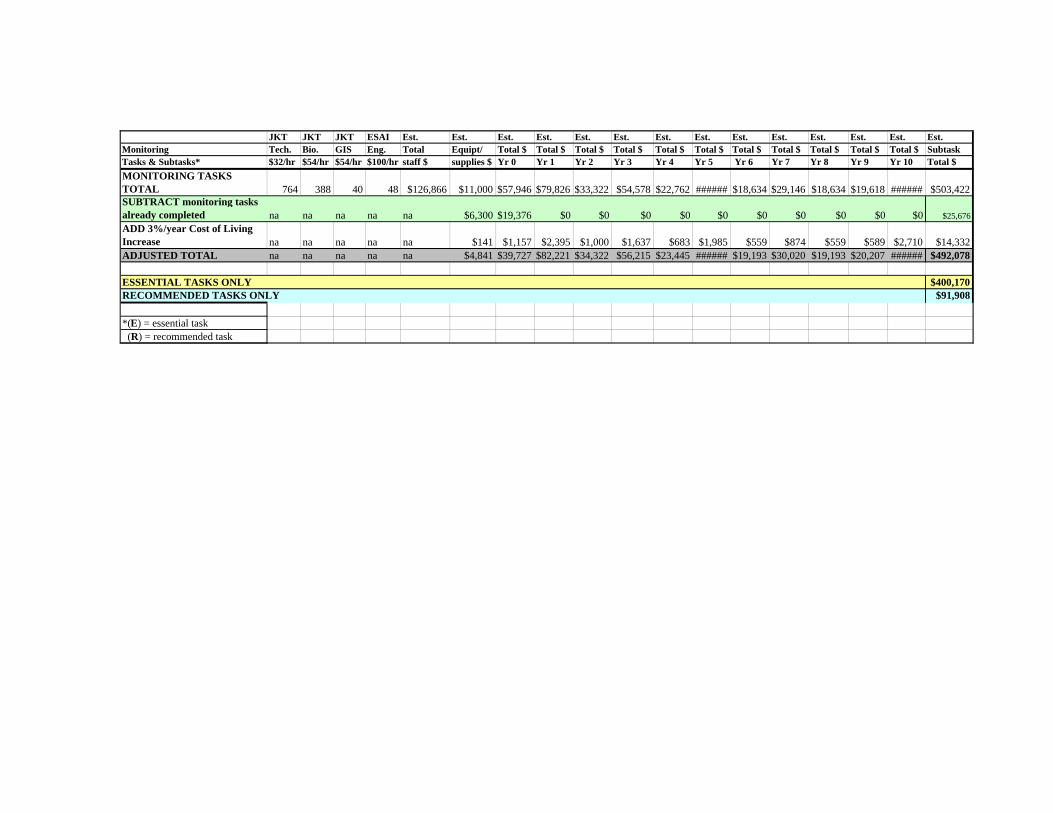
JKT JKT JKT ESAI Est. Est. Est. Est. Est. Est. Est. Est. Est. Est. Est. Est. Est. Est.Monitoring Tech. Bio. GIS Eng. Total Equipt/ Total $ Total $ Total $ Total $ Total $ Total $ Total $ Total $ Total $ Total $ Total $ SubtaskTasks & Subtasks* $32/hr $54/hr $54/hr $100/hr staff $ supplies $ Yr 0 Yr 1 Yr 2 Yr 3 Yr 4 Yr 5 Yr 6 Yr 7 Yr 8 Yr 9 Yr 10 Total $MONITORING TASKS TOTAL 764 388 40 48 $126,866 $11,000 $57,946 $79,826 $33,322 $54,578 $22,762 ###### $18,634 $29,146 $18,634 $19,618 ###### $503,422SUBTRACT monitoring tasks already completed na na na na na $6,300 $19,376 $0 $0 $0 $0 $0 $0 $0 $0 $0 $0 $25,676ADD 3%/year Cost of Living Increase na na na na na $141 $1,157 $2,395 $1,000 $1,637 $683 $1,985 $559 $874 $559 $589 $2,710 $14,332ADJUSTED TOTAL na na na na na $4,841 $39,727 $82,221 $34,322 $56,215 $23,445 ###### $19,193 $30,020 $19,193 $20,207 ###### $492,078
ESSENTIAL TASKS ONLY $400,170RECOMMENDED TASKS ONLY $91,908
*(E) = essential task (R) = recommended task

Estuary Monitoring Plan
Data Management System
For meaningful analysis, all monitoring data needs to be stored in a single system. JKT has
received a grant from EPA to design such a system in FY2004. Adequate funds need to be
available for staffing the system, as well as for future software and hardware upgrades.
Estimated Cost: $25,000 in FY2004; $5,000/yr in subsequent years through year 10.
83

Estuary Monitoring Plan
7.0 COORDINATION, REPORTING & DISSEMINATION OF MONITORING RESULTS
Given the clear local and regional interest, and potential national interest, in the results of this
restoration project, timely and accurate reporting and dissemination of monitoring results will be
critical.
Status Reports
At minimum, the participating parties in the restoration monitoring should produce a summary
report in years 1, 3, and 5, which:
• reviews all monitoring tasks that were completed,
• itemizes costs of the monitoring,
• summarizes all relevant data and information,
• evaluates whether performance criteria are being met,
• draws inferences about the status and trends in the ecological development of the restored
JCL channel, Dean Creek channel, and estuary,
• details any adaptive management or contingency measures that were implemented, and
• provides recommendations for subsequent monitoring.
The technical group should review draft monitoring reports, discuss the implications of the
results, and identify any contingency measures that need to be implemented immediately or in
future years of the monitoring program. Hard copies (or CDs) of the monitoring reports will be
provided to funding agencies and other interested parties. The final version of each report should
also be available on a website in an easily downloadable format, such as PDF.
Final Report
A final report should be produced at year 10, which draws conclusions about the overall success
or failure of the restoration project and provides recommendations or “lessons learned” about
planning, implementing, and monitoring that will benefit and guide future restoration projects.
Estimated Costs:
Data Analysis & Annual Reports (yrs 1, 3, 5): $10,000/yr + $1,000 printing/yr
Summary Report (year 10): $20,000 + $2,000 printing
84

Estuary Monitoring Plan
Conferences, Workshops, Public Meetings
Periodically, as opportunities arise, individuals from the participating partners should give
presentations at local, regional, and national conferences and workshops. In addition, public
meetings should be held locally in years three, five, and ten to present findings to landowners,
stakeholders, tribal members, agencies, researchers, and all interested citizens.
Estimated Costs: $2,400/year
Journal Publications
To the extent warranted, publications documenting the restoration plan (design and
implementation) and the success or failure of the restoration project should be submitted to peer-
reviewed, professional journals.
Estimated Costs: $10,000 in year 10
85
Estuary Monitoring Plan
8.0 LITERATURE CITED
Allendorf, F.W., D. Bayles, D.L. Bottom, K.P. Currens, C.A Frissell, D. Hankin, J.A.
Lichatowich, W. Nehlson, P.C. Trotter, and T.H. Williams. 1997. Prioritizing Pacific salmon stocks for conservation. Conservation Biology. 11:140-152.
Antrim, L. 1999. Letter report of the findings of an epibenthic habitat survey completed at the
south end of Sequim Bay. Prepared by Battelle Marine Sciences Laboratory for the Jamestown S’Klallam Tribe, Blyn, Washington.
Baccus, J.T., and E.A. Chadd. 2000. Steamkeepers of Clallam County Quality Assurance Project
Plan. Prepared by the Natural Resources Division, Clallam County Department of Community Development, Port Angeles, Washington.
Bernthal, C., T. Labbe, and B. Rot. 1999. Hood Canal/Eastern Strait of Juan de Fuca Summer
Chum Habitat Recovery Plan. Prepared by Point No Point Treaty Council, Skokomish Tribe, Port Gamble S’Klallam Tribe, Jamestown S’Klallam Tribe, and Washington Department of Fish and Wildlife.
Brastad, A., S. Waldrip, and B. White. 1987. Sequim Bay Water Quality Project and Basin
Planning Study. Clallam County Department of Community Development, Port Angeles, Washington.
Clallam Conservation District. 2001. Jimmycomelately Creek Revegetation Plan. Prepared by
the Clallam Conservation District, Port Angeles, Washington. Crawford, B. 2003. Sampling Protocols: Effectiveness Monitoring Habitat Restoration Project
Requirements. Prepared by Washington Salmon Recovery Funding Board. Draft 5/21/2003. Federal Interagency Stream Restoration Working Group. 1998. Stream Corridor Restoration:
Principles, Processes, and Practices. Gibboney, S. 2000A. Storm Water Management Plan for the East Blyn Basin. Prepared for the
Jamestown S’Klallam Tribe by Engineering and Management Services, Port Townsend, Washington.
Gibboney, S. 2000B. Storm Water Management Plan for the West Blyn Basin. Prepared for the
Jamestown S’Klallam Tribe by Engineering and Management Services, Port Townsend, Washington.
Gunther, E. 1927. Klallam Ethnography. University of Washington Publications in
Anthropology 1(5): 171-314. University of Washington Press. Seattle, Washington. Holtrop, K.K. 2002. Bird Species Richness and Abundance in Lower Sequim Bay Estuary.
Prepared for the Jamestown S’Klallam Tribe. Hruby, T., and C. Brower. 1994. Guidelines for Developing Freshwater Wetlands Mitigation
Plans and Proposals. Department of Ecology Publication #94-29. Washington State Department of Ecology, Olympia, Washington.
86
Estuary Monitoring Plan
Independent Science Panel. 2000. Recommendations for Monitoring Salmonid Recovery in Washington State. Report 2000-2. Governor’s Salmon Recovery Office, Olympia, Washington.
Inter-Fluve, Inc. 2001. Channel Design (Draft). Prepared by Inter-Fluve, Inc. for Washington
State Department of Transportation, Olympia, Washington. Karr, J.R., and E.W. Chu. 1998. Restoring Life in Running Waters: Better Biological
Monitoring. Island Press, Washington D.C. Koski, K.V. 1992. Restoring Stream Habitats Affected by Logging Activities. In Restoring the
Nations Marine Environment. G.W. Thayer (ed.) Maryland Sea Grant College, pp. 343-403. National Research Council (NRC). 1992. Restoration of Aquatic Ecosystems. National
Academy Press. Washington, D.C. Nearshore Science Team. 2003. Guidance For Protection And Restoration of The Nearshore
Ecosystems of Puget Sound. Draft 5 (5/2/03). Prepared in support of the Puget Sound Nearshore Ecosystem Restoration Program.
Point No Point Treaty Tribes and Washington Department of Fish and Wildlife. 2003. Summer
Chum Salmon Conservation Initiative: Supplemental Report No. 5, Interim Recovery Goals. May 2003 (DRAFT).
Salo, E.O. 1991. Life-History of Chum Salmon (Onchorhynchus keta). In Pacific Salmon Life-
Histories, C. Groot and L. Margolis (eds), pp. 395-445. UBC Press, Vancouver, Canada. Sargeant, S., J. Southard, A. Borde, and G. Williams. 2002. Baseline Survey of Nearshore
Habitat Associated with the Sequim Bay Log Transfer Facility. Prepared for the Jamestown S’Klallam Tribe by Battelle Marine Sciences Laboratory.
Schneider, C.B., and S.W. Sprecher. 2000. Wetlands Management Handbook. ERDC/EL SR-
00-16. Environmental Laboratory, U.S. Army Engineer Research and Development Center, Vicksburg, Mississippi.
Shreffler, D.K. 2000. A Preliminary Plan for Restoring Jimmycomelately Creek and the Lower
Sequim Bay Estuary. Phase I report prepared by Shreffler Environmental for Jamestown S’Klallam Tribe, Blyn, Washington.
Shreffler, D.K. 2001. Jimmycomelately Creek-Lower Sequim Bay Estuary Restoration Project-
Phase I Monitoring Plan: Jimmycomelately Creek Realignment. Prepared by Shreffler Environmental for the Jamestown S’Klallam Tribe, Blyn, Washington.
Shreffler, D.K. 2003. Jimmycomelately Creek-Lower Sequim Bay Estuary Restoration Project:
A Conceptual Plan for Restoring the Lower Sequim Bay Estuary. Prepared by Shreffler Environmental for Jamestown S’Klallam Tribe, Blyn, Washington.
Shreffler, D.K., and R.M. Thom. 1994. Monitoring Protocols for the Spencer Island Wetland
Restoration Project. Unpublished letter report from Battelle Marine Sciences Laboratory to U.S. Fish and Wildlife Service, dated January 16, 1994.
87

Estuary Monitoring Plan
Simenstad, C.A., and R.M. Thom. 1996. Functional equivalency trajectories of the restored Gog-Le-Hi-Te estuarine wetland. Ecological Applications 6:38-56.
Simenstad, C.A., and J.R. Cordell. 2000. Ecological Assessment Criteria for Restoring
Anadromous Salmonid Habitat in Pacific Northwest Estuaries. Ecological Engineering 15:283-302.
Tanner, C.D. 2000. Intertidal Habitat Projects Monitoring Program: Elliott Bay/Duwamish
Restoration Program. Prepared for the Elliott Bay/Duwamish Restoration Program Panel by U.S. Fish and Wildlife Service, Western Washington Office, Olympia, Washington.
Thom, R.M. 2000. Adaptive Management of Coastal Ecosystem Restoration Projects.
Ecological Engineering 15:365-372. Thom, R.M., and K.F. Wellman. 1996. Planning Aquatic Ecosystem Restoration Monitoring
Programs. IWR Report 96-R-23. U.S. Army Corps of Engineers, Institute for Water Resources, Alexandria, Virginia.
USDA/SCS. 1992. Engineering Field Handbook. Chapter 13: Wetland Restoration,
Enhancement, or Creation. 210-EFH,1/92. United States Department of Agriculture, Soil Conservation Service, Washington, D.C.
Walters, C.J., and C.S. Holling. 1990. Large-scale management experiments and learning by
doing. Ecology 71:2060-2068. Wolman, M.G. 1954. A method of sampling coarse river-bed material. Transactions of the
American Geophysical Union 35:951-956. Zedler, J.B., and J.C. Callaway. 1999. Tracking Wetland Restoration: Do Mitigation Sites
Follow Desired Trajectories? Restoration Ecology 7(1):69-73.
88