jimmy marin q2 magazine
DESCRIPTION
Jimmy Marin's Official Q2 MagazineTRANSCRIPT

A Member Of Real Living
PacUnion.com


Jimmy Marin Real Estate Report
Q2. 2011


Pacific Union International Luxury Real Estate Report
A Member Of Real Living
Pacific Union International Luxury Real Estate Report Q2. 2011
MARIN COUNTY
Pacific Union International Luxury Real Estate Report Q2. 2011
MARIN COUNTY
Pacific Union International Luxury Real Estate Report
MARIN COUNTYA Member Of Real Living
New Escrows Increase by 15% - 20% in Marin CountyReal Estate News vs. “Noise”
We recognize the “noise” you are exposed to via national and regional real estate news and quarterly reports. Most of these reports track closings (sales) and are reported anywhere from 30 – 60 days after the completion of the research cycle (either monthly or quarterly). The information is, by design, general in nature and somewhat dated by the time it is published. The S&P/Case-Shiller Report Index™ and the First Republic Prestige Home Index™ both report sales on a month-to-date, quarter-to-date or year-to-date basis. These reports provide retrospective and relative indicators of value and activity; however, they do not provide insight into future trends on a local basis.
Please understand that we believe real estate is local and furthermore, market activities and trends can be unique within a market (county) by neighborhood and/or by price point. We also believe that properties “under contract” or “new escrows” are the industry’s most meaningful indicator of near term trends.
Our review of Marin County real estate “under-contract” or “in-escrow” reveals encouraging movement even though it isn’t peak season. The chart below illustrates current trends (by percentage) for properties currently “under contract” vs. the same time period twelve (12) and twenty-four (24) months ago. So, while your specific neighborhood may be performing differently and pricing may be less than meets our sellers’ expectations, our markets are continuing to accelerate, at least in terms of properties “under contract”.
Listing inventory continues to exceed demand and increase at a faster pace than new escrows or properties under contract. Months of Inventory (above) illustrates that it would take between 3.7 and 11.5 months of current demand to exhaust the on-market inventory. This suggests that seller’s pricing is critical to be in the deal flow vs. in the active listing inventory. Do not underestimate the power of demand-based pricing. Price your property within local market demand tolerances and you will likely ratify a new escrow. Flirt with the high-end of your pricing range and prepare to simply be part of our inventory statistics.
In this market place, we encourage families to make housing decisions first, on the quality of the environment they are striving to accomplish at home and second, on the opportunity associated with their investment. It is our feeling that a “buy and hold” strategy for at least five (5) years will likely be a lucrative investment.
We do not see the “buyers’ window” closing. In a broader sense, we see more realistic sellers everyday which translates into more demand based, realistic pricing for pre-qualified, motivated buyers!
Please remember to seek out local news, trend analysis and advice for your real estate decisions. If you are a seller, be realistic on your presentation (by staging when recommended)and meet market demands with pricing. If you are a buyer, seizeopportunities when they arise, as the truly best priced propertiesgenerally receive multiple offers.
All Price Ranges
15.2%
46.3%
-7.7%
-28.8%
3.7
$1 million and Up
20.7%
65.5%
-30.1%
-24.6%
6.0
$3 Million and Up
17.8%
55.8%
-11.37%
19.4%
11.5
Single Family Homes and Condos
Under Contract (v 24 months ago)
Under Contract (v 12 months ago)
Listing Inventory (v 24 months ago)
Listing Inventory (v 12 months ago)
Months of Inventory
1800
1600
1400
1200
1000
800
600
400
200
0
For Sale Under Contract Sold
Jun 10 Jul 10 Aug 10 Sep 10 Oct 10 Nov 10 Dec 10 Jan 11 Feb 11 Mar 11 Apr 11 May 11 Jun 11
# o
f H
om
es
Market DynamicsSupply & Demand - # Homes (FS, UC, Sold)
Jun-10 through Jun-11
Jimmy Wanninger!iimmmmyy WWaannnniinnggeerr
!iimmmmyy WWaannnniinnggeerr990011 SSiirr FFrraanncciiss DDrraakkee BBllvvddKKeennttffiieelldd,, CCAA 9944990044441155..999900..88999900jjiimmmmyy@@jjiimmmmyymmaarriinn..ccoommwwwwww..!iimmmmyyMMaarriinn..ccoommDDRREE## 0011335522228877
441155..999900..88999900jjiimmmmyy@@jjiimmmmyymmaarriinn..ccoommwwwwww..!iimmmmyyMMaarriinn..ccoomm
990011 SSiirr FFrraanncciiss DDrraakkee BBllvvdd,, KKeennttffiieelldd,, CCAA 9944990044

Q2. 2011
A Member Of Real Living
Pacific Union International Luxury Real Estate Report Q2. 2011
HOME COMPARISONA Member Of Real Living
Pacific Union International Luxury Real Estate Report
HOME COMPARISON
Marin County $1 Million & Under - SFH
Source: BAREIS, as of June 30, 2011
Apr - Jun '09
$198,920,570
305
105
$680,000
$652,199
$1,000,000
Apr - Jun '10
$252,479,042
375
77
$670,000
$673,277
$1,000,000
Apr - Jun '11
$232,983,609
363
99
$631,400
$641,828
$993,350
'09 - '10% Change
27%
23%
-27%
-1%
3%
0%
'10 - '11% Change
-8%
-3%
29%
-6%
-5%
-1%
TIME PERIOD
VOLUME
HOMES SOLD
AVG. DAYS ON MKT
MEDIAN PRICE
AVERAGE PRICE
MAX PRICE SOLD
Marin County $1 Million & Higher - SFH
Source: BAREIS, as of June 30, 2011
Apr - Jun '09
$235,284,700
136
81
$1,487,500
$1,730,035
$5,200,000
Apr - Jun '10
$371,657,419
201
83
$1,550,000
$1,849,042
$7,800,000
Apr - Jun '11
$343,235,998
184
84
$1,520,500
$1,865,413
$8,750,000
'09 - '10% Change
58%
48%
2%
4%
7%
50%
'10 - '11% Change
-8%
-8%
1%
-2%
1%
12%
TIME PERIOD
VOLUME
HOMES SOLD
AVG. DAYS ON MKT
MEDIAN PRICE
AVERAGE PRICE
MAX PRICE SOLD
Marin County $1-$3 Million - SFH
Source: BAREIS, as of June 30, 2011
Apr - Jun '09
$202,171,700
127
79
$1,470,000
$1,591,903
$3,000,000
Apr - Jun '10
$277,911,169
177
81
$1,395,000
$1,570,120
$3,000,000
Apr - Jun '11
$273,737,338
168
82
$1,465,000
$1,629,389
$3,000,000
'09 - '10% Change
37%
39%
3%
-5%
-1%
0%
'10 - '11% Change
-2%
-5%
1%
5%
4%
0%
TIME PERIOD
VOLUME
HOMES SOLD
AVG. DAYS ON MKT
MEDIAN PRICE
AVERAGE PRICE
MAX PRICE SOLD
Marin County Market StatisticsQ2 2010 vs Q2 2011
Source: BAREIS, as of June 30, 2011
$1M and under
-8%
-3%
29%
-6%
-5%
$1M and higher
-8%
-8%
1%
-2%
1%
APR - JUN
VOLUME
HOMES SOLD
DOM
MEDIAN PRICE
AVERAGE PRICE
Marin County $3 Million & Higher - SFH
Source: BAREIS, as of June 30, 2011
Apr - Jun '09
$36,113,000
10
118
$3,240,250
$3,611,300
$5,200,000
Apr - Jun '10
$96,746,250
25
97
$3,350,000
$3,869,850
$7,800,000
Apr - Jun '11
$72,498,660
17
98
$3,800,000
$4,264,627
$8,750,000
'09 - '10% Change
168%
150%
-18%
3%
7%
50%
'10 - '11% Change
-25%
-32%
1%
13%
10%
12%
TIME PERIOD
VOLUME
HOMES SOLD
AVG. DAYS ON MKT
MEDIAN PRICE
AVERAGE PRICE
MAX PRICE SOLD
Marin County Median & Average Home PriceQ1 2009 - Q2 2011
Q109
$948,355
$720,910
Q209
$984,557
$775,000
Q309
$1,015,120
$800,000
Q409
$996,236
$753,000
Q110
$984,178
$751,000
Q210
$1,083,861
$816,500
Q310
$1,022,077
$790,000
Q410
$1,022,299
$763,500
Q1111
$937,817
$705,000
AVG. PRICE
MEDIAN PRICE
Source: BAREIS, June 30, 2011
Q211
$1,053,418
$779,000
WWee llooookk ffoorrwwaarrdd ttoo sseerrvviinngg yyoouu iinn 22001111..

A Member Of Real Living
Pacific Union International Luxury Real Estate Report Q2. 2011
SONOMA
Pacific Union International Luxury Real Estate Report Q2. 2011
SONOMA
Pacific Union International Luxury Real Estate Report
SONOMAA Member Of Real Living
New Escrows in Sonoma Valley Reveal Encouraging Movement Real Estate News vs. “Noise”
We recognize the “noise” you are exposed to via national and regional real estate news and quarterly reports. Most of these reports track closings (sales) and are reported anywhere from 30 – 60 days after the completion of the research cycle (either monthly or quarterly). The information is, by design, general in nature and somewhat dated by the time it is published. The S&P/Case-Shiller Report Index™ and the First Republic Prestige Home Index™ both report sales on a month-to-date, quarter-to-date or year-to-date basis. These reports provide retrospective and relative indicators of value and activity; however, they do not provide insight into future trends on a local basis.
Please understand that we believe real estate is local and furthermore, market activities and trends can be unique within a market (county) by neighborhood and/or by price point. We also believe that properties “under contract” or “new escrows” are the industry’s most meaningful indicator of near term trends.
Our review of Sonoma Valley real estate “under contract” or “in escrow” reveals encouraging movement. The chart below illustrates current trends (by percentage) for properties currently “under contract” as of the end of June. While your specific neighborhood may be performing differently and pricing may be less than meets sellers’ expectations, our markets are continuing to experience movement, at least in terms of units “under contract”.
Over 35% under contract is usually indicative of a sellers’ market while under 25% is usually indicative of a buyers’ market and the range between 25-35% under contract indicates a balanced market. This suggests that a seller’s pricing is critical to be seriously considered as an attractive purchase opportunity for a qualified buyer v. simply one of a long list of active inventory of homes for sale. One should not underestimate the power of demand-based pricing. By listing the property within local market demand tolerances, it will likely ratify a new escrow. By flirting with the high-end of the pricing range, one should prepare to simply be part of the inventory statistics.
In this market place, we encourage families to make housing decisions first, on the quality of the environment they are striving to accomplish at home and second, on the opportunity associated with their investment. It is our feeling that a “buy and hold” strategy for at least five (5) years will likely be a lucrative investment. We do not see the “buyers’ window” closing. In a broader sense, we see more realistic sellers everyday which translates into more demand-based, realistic pricing for pre-qualified, motivated buyers!
Please remember to seek out local news, trend analysis and advice for your real estate decisions. If you are a seller, be proactive in your presentation (by staging when recommended) and meet market demands with pricing. If you are a buyer, seize opportunities when they arise, as the truly best priced properties generally receive multiple offers.
As always, I am available to assist you with any of your real estate needsand look forward to hearing from you. Have a great summer.
Total ListingInventory
211
31
19
# of Properties Under Contract
58
6
4
% of Market Under Contract
27%
19%
21%
Sonoma
Glen Ellen
Kenwood
All Residential Properties(incl. Single Family/Condos/Ranches)
Jimmy Wanninger!iimmmmyy WWaannnniinnggeerr
!iimmmmyy WWaannnniinnggeerr990011 SSiirr FFrraanncciiss DDrraakkee BBllvvddKKeennttffiieelldd,, CCAA 9944990044441155..999900..88999900jjiimmmmyy@@jjiimmmmyymmaarriinn..ccoommwwwwww..!iimmmmyyMMaarriinn..ccoommDDRREE## 0011335522228877
441155..999900..88999900jjiimmmmyy@@jjiimmmmyymmaarriinn..ccoommwwwwww..!iimmmmyyMMaarriinn..ccoomm
990011 SSiirr FFrraanncciiss DDrraakkee BBllvvdd,, KKeennttffiieelldd,, CCAA 9944990044
Pacific Union International Luxury Real Estate Report Q2. 2011
HOME COMPARISON & CITY STATSA Member Of Real Living
Pacific Union International Luxury Real Estate Report Q2. 2011
HOME COMPARISONA Member Of Real Living
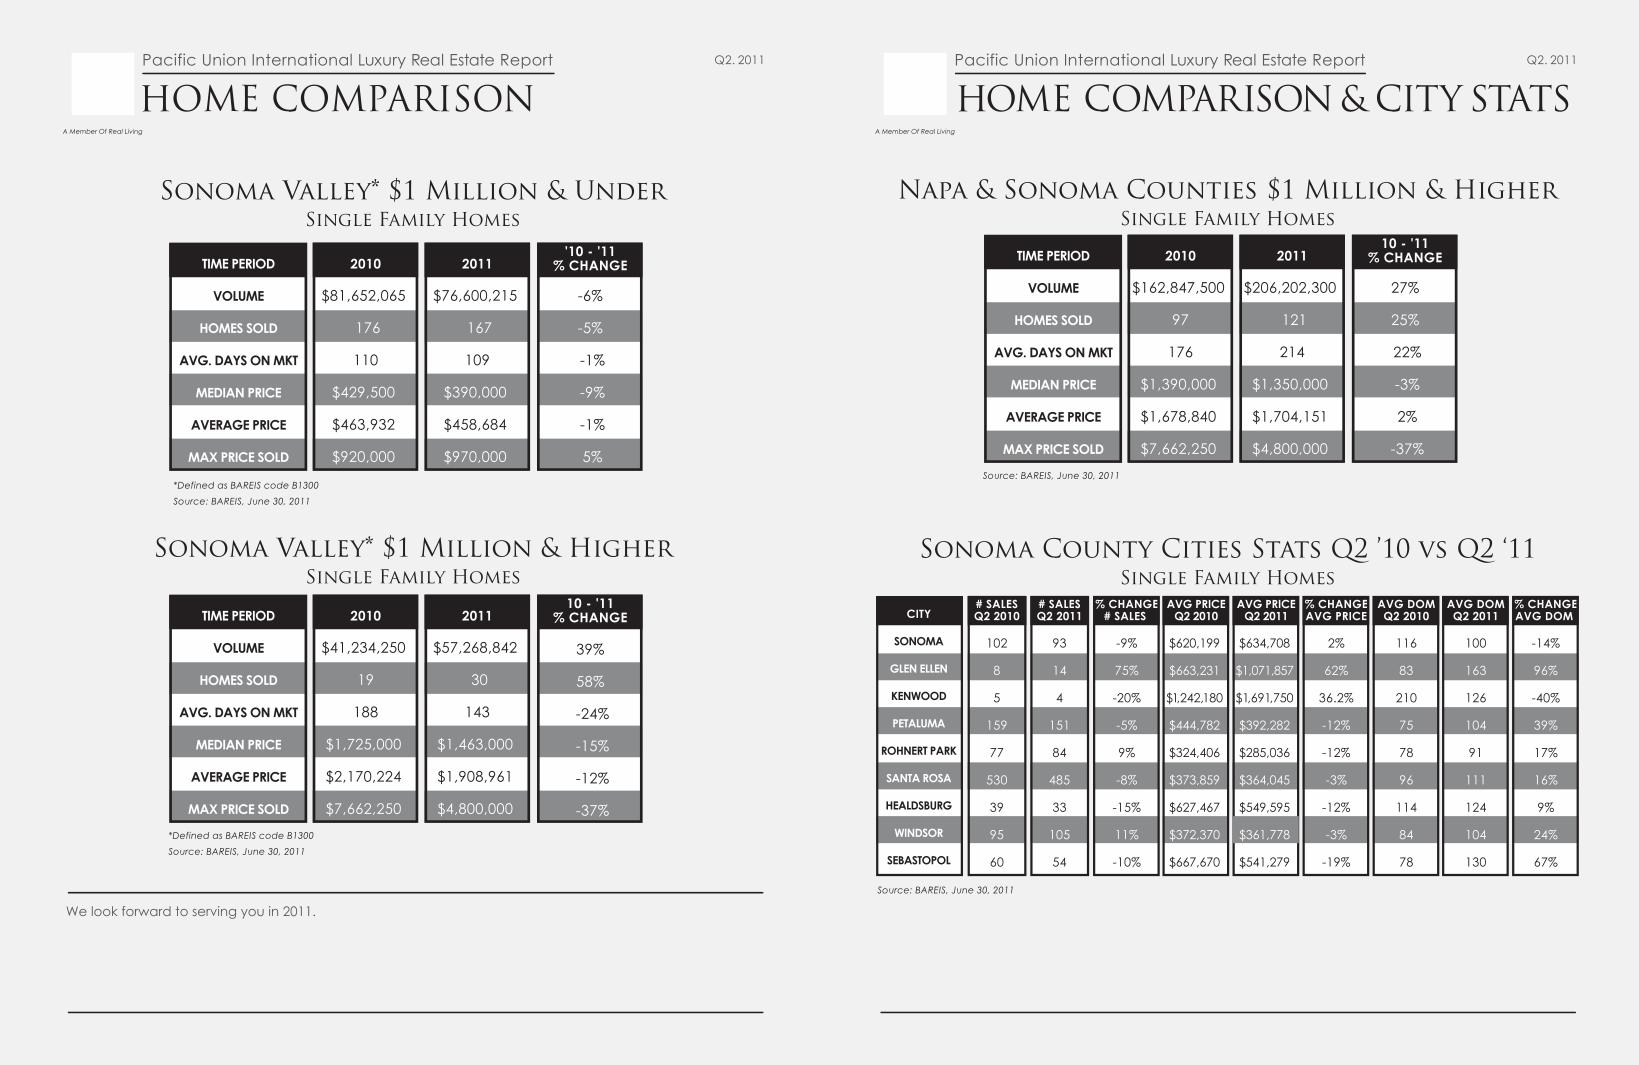
Napa & Sonoma Counties $1 Million & HigherSingle Family Homes
Source: BAREIS, June 30, 2011
Sonoma County Cities Stats Q2 ’10 vs Q2 ‘11Single Family Homes
Sonoma Valley* $1 Million & HigherSingle Family Homes
*Defined as BAREIS code B1300
Source: BAREIS, June 30, 2011
2010
$41,234,250
19
188
$1,725,000
$2,170,224
$7,662,250
2011
$57,268,842
30
143
$1,463,000
$1,908,961
$4,800,000
10 - '11% CHANGE
39%
58%
-24%
-15%
-12%
-37%
TIME PERIOD
VOLUME
HOMES SOLD
AVG. DAYS ON MKT
MEDIAN PRICE
AVERAGE PRICE
MAX PRICE SOLD
2010
$81,652,065
176
110
$429,500
$463,932
$920,000
2011
$76,600,215
167
109
$390,000
$458,684
$970,000
'10 - '11% CHANGE
-6%
-5%
-1%
-9%
-1%
5%
TIME PERIOD
VOLUME
HOMES SOLD
AVG. DAYS ON MKT
MEDIAN PRICE
AVERAGE PRICE
MAX PRICE SOLD
Sonoma Valley* $1 Million & UnderSingle Family Homes
*Defined as BAREIS code B1300
Source: BAREIS, June 30, 2011
# SALESQ2 2010
102
8
5
159
77
530
39
95
60
# SALESQ2 2011
93
14
4
151
84
485
33
105
54
% CHANGE# SALES
-9%
75%
-20%
-5%
9%
-8%
-15%
11%
-10%
AVG PRICEQ2 2010
$620,199
$663,231
$1,242,180
$444,782
$324,406
$373,859
$627,467
$372,370
$667,670
AVG PRICEQ2 2011
$634,708
$1,071,857
$1,691,750
$392,282
$285,036
$364,045
$549,595
$361,778
$541,279
% CHANGEAVG PRICE
2%
62%
36.2%
-12%
-12%
-3%
-12%
-3%
-19%
AVG DOMQ2 2010
116
83
210
75
78
96
114
84
78
AVG DOMQ2 2011
100
163
126
104
91
111
124
104
130
% CHANGEAVG DOM
-14%
96%
-40%
39%
17%
16%
9%
24%
67%
CITY
SONOMA
GLEN ELLEN
KENWOOD
PETALUMA
ROHNERT PARK
SANTA ROSA
HEALDSBURG
WINDSOR
SEBASTOPOL
Source: BAREIS, June 30, 2011
2010
$162,847,500
97
176
$1,390,000
$1,678,840
$7,662,250
2011
$206,202,300
121
214
$1,350,000
$1,704,151
$4,800,000
10 - '11% CHANGE
27%
25%
22%
-3%
2%
-37%
TIME PERIOD
VOLUME
HOMES SOLD
AVG. DAYS ON MKT
MEDIAN PRICE
AVERAGE PRICE
MAX PRICE SOLD
WWee llooookk ffoorrwwaarrdd ttoo sseerrvviinngg yyoouu iinn 22001111..

Real Estate News vs. “Noise”We recognize the “noise” you are exposed to via national and regional real estate news and quarterly reports. Most of these reports track closings (sales) and are reported anywhere from 30 – 60 days after the completion of the research cycle (either monthly or quarterly). The information is, by design, general in nature and somewhat dated by the time it is published. The S&P/Case-Shiller Report Index™ and the First Republic Prestige Home Index™ both report sales on a month-to-date, quarter-to-date or year-to-date basis. These reports provide retrospective and relative indicators of value and activity; however, they do not provide insight into future trends on a local basis.
As you can see in the graph below, sales volume has increased year-over-year in the mid-range market and dramatically so in the high end market. The number of properties sold has increased in all of Napa County markets, but again we are experiencing a vibrancy in the upper end market that we haven’t seen in quite some time. This is a reflection of the buyer’s confidence in that market and the value placed on what is being purchased. In the lower range market, median and average sale prices have fallen year-over-year primarily due to the number of properties being sold as short sale and bank-owned (REO) transactions.
We believe real estate is local and furthermore, market activities and trends can be unique within a market (county) by neighborhood and/or by price point, but do not underestimate the power of demand-based pricing. Price your property within local market demand tolerances and you will likely find a buyer willing and able to write an acceptable contract on your home in a short period of time.
In this market place, we encourage families to make housing decisions first, on the quality of the environment they are striving to accomplish at home and second, on the opportunity associated with their investment. It is our feeling that a “buy and hold” strategy for at least five (5) years will likely be a lucrative investment.
We do not see the “buyers’ window” closing. Interest rates continue to be at historic lows. In a broader sense, we see more realistic sellers every day which translates into more demand based, realistic pricing for pre-qualified, motivated buyers!
Please remember to seek out local news, trend analysis and advice for your real estate decisions. If you are a seller, be realistic on your presentation (by staging when recommended) and meet market demands with pricing. If you are a buyer, seize opportunities when they arise, as the truly best priced properties generally receive multiple offers.
A Member Of Real Living
Pacific Union International Real Estate ReportPacific Union International Real Estate Report Q2. 2011
NAPA COUNTY
Pacific Union International Real Estate Report Q2. 2011
NAPA COUNTY
NAPA COUNTYA Member Of Real Living
Under $500K
-6%
1%
20%
-9%
-7%
$500K - $1M
12%
12%
27%
3%
0%
$1M+
68%
71%
47%
2%
-2%
2010 vs. 2011
Volume
Units Sold
Days on Market
Median Price
Average Price
Jimmy Wanninger!iimmmmyy WWaannnniinnggeerr
!iimmmmyy WWaannnniinnggeerr990011 SSiirr FFrraanncciiss DDrraakkee BBllvvddKKeennttffiieelldd,, CCAA 9944990044441155..999900..88999900jjiimmmmyy@@jjiimmmmyymmaarriinn..ccoommwwwwww..!iimmmmyyMMaarriinn..ccoommDDRREE## 0011335522228877
441155..999900..88999900jjiimmmmyy@@jjiimmmmyymmaarriinn..ccoommwwwwww..!iimmmmyyMMaarriinn..ccoomm
990011 SSiirr FFrraanncciiss DDrraakkee BBllvvdd,, KKeennttffiieelldd,, CCAA 9944990044

Pacific Union International Real Estate Report Q2. 2011
HOME COMPARISON & CITY STATSA Member Of Real Living
Pacific Union International Real Estate Report Q2. 2011
HOME COMPARISONA Member Of Real Living
Napa City Stats Q2 2010 vs Q2 2011# SALESQ2 2010
206
81
15
19
6
0
2
# SALESQ2 2011
232
68
11
23
5
0
0
% CHANGE# SALES
13%
-16%
-27%
21%
-17%
0%
-100%
AVG PRICEQ2 2010
$420,881
$341,267
$687,065
$1,144,284
$651,000
$0
$762,500
AVG PRICEQ2 2011
$461,523
$277,468
$732,182
$1,278,792
$576,732
$0
$0
% CHANGEAVG PRICE
9.7%
-18.7%
7%
12%
-11%
N/A
-100%
AVG DOMQ2 2010
104
81
224
103
154
0
46
AVG DOMQ2 2011
135
80
151
228
143
0
0
% CHANGEAVG DOM
30%
-1%
-33%
121%
-7%
N/A
-100%
CITY
NAPA
CALISTOGA
ST. HELENA
YOUNTVILLE
RUTHERFORD
ANGWIN
AMERICANCANYON
Source: BAREIS, June 30, 2011
Napa County $500K & Under - Single Family Homes
Source: BAREIS, June 30, 2011
Apr - Jun '09
$70,121,609
230
88
$315,000
$304,877
$500,000
Apr - Jun '10
$83,717,831
262
87
$325,000
$319,534
$500,000
Apr - Jun '11
$73,962,630
256
101
$285,000
$288,917
$500,000
'09 - '10% Change
19%
14%
-1%
3%
4.8%
0%
'10 - '11% Change
-12%
-2%
16%
-12%
-10%
0%
TIME PERIOD
VOLUME
HOMES SOLD
AVG. DAYS ON MKT
MEDIAN PRICE
AVERAGE PRICE
MAX PRICE SOLD
Napa County $1 Million & Higher - Single Family Homes
Source: BAREIS, June 30, 2011
Apr - Jun '09
$31,394,168
18
121
$1,593,334
$1,744,120
$3,450,000
Apr - Jun '10
$29,266,250
15
196
$1,420,000
$1,951,083
$3,900,000
Apr - Jun '11
$56,655,900
30
300
$1,515,000
$1,888,530
$4,775,000
'09 - '10% Change
-7%
-17%
62%
-11%
12%
13%
'10 - '11% Change
94%
100%
53%
7%
-3%
22%
TIME PERIOD
VOLUME
HOMES SOLD
AVG. DAYS ON MKT
MEDIAN PRICE
AVERAGE PRICE
MAX PRICE SOLD
Napa County $500K - $1 Million - Single Family Homes
Source: BAREIS, June 30, 2011
Apr - Jun '09
$42,401,750
62
112
$635,000
$683,899
$1,000,000
Apr - Jun '10
$40,123,471
60
130
$637,000
$668,725
$995,000
Apr - Jun '11
$42,575,354
62
174
$666,500
$686,699
$965,000
'09 - '10% Change
-5%
-3%
16%
0.3%
-2.2%
-1%
'10 - '11% Change
6%
3%
34%
5%
3%
-3%
TIME PERIOD
VOLUME
HOMES SOLD
AVG. DAYS ON MKT
MEDIAN PRICE
AVERAGE PRICE
MAX PRICE SOLD
WWee llooookk ffoorrwwaarrdd ttoo sseerrvviinngg yyoouu iinn 22001111..


Pacific Union International Real Estate Report
A Member Of Real Living
Q2. 2011
SAN FRANCISCO
Pacific Union International Real Estate Report Q2. 2011
SAN FRANCISCO
Pacific Union International Real Estate Report
SAN FRANCISCOA Member Of Real Living
TENANCIES IN COMMON
CONDOMINIUMS
SINGLE FAMILY HOMESAs of June 30, 2011
Tenancies-inCommon
7%
Single FamilyHomes
48%Condos &
Co-ops45%
“All politics is local,” the memorable one-liner coined by iconic House Speaker Tip O’Neill, is a concept appropriately convertible to the often-elusive practice of divining general real estate pricing and direction. Pundits’ pronouncements regarding national, state-wide and even “Bay Area-wide” real estate valuation and trends too often ignore the myriad and substantial differences between properties situated in, say, Presidio Heights vs. Pittsburg (CA or PA), Noe Valley vs. Newark (CA or NJ), etc.
Accordingly, when faced with occasionally ominous proclamations – even from such well-regarded analysts as S&P/Case-Shiller – that “San Francisco” property values are going this way or that, careful and discriminating readers will take into account that S&P/Case-Shiller’s “San Francisco” is, in actuality, a combination of San Francisco, Contra Costa, San Mateo, Marin and Alam-eda counties. The disparities in terms of business base, cultural offerings, public services/infrastructure, economic vitality and general life-style, amenities, land scarcity and other factors between and among these five counties that influence real estate values are so striking as to call into question the usefulness of these predictions for the typical home-buyer and home-seller.
So where did the city and county of San Francisco stand at the end of Q2 2011? Carrying forward the overall performance of condos in Q1, Year-to-Date Q1/Q2 figures reported to the MLS showed robust increases in number of units sold (in all price ranges) versus Q1/Q2 2010, even as median sales price trended modestly downward. An appreciably higher number of under-$1M single family homes sold YTD 2011 than in Q1/Q2 2010, the median price (as with condos) slightly lower; volume and median sales price of higher-end SFHs were off to a somewhat great extent vs. 2010.
Condos – and, remarkably enough, higher-end condos – moved particularly well during the first half of 2011 as insightful and well-advised condo owners priced their units to sell.
As was the case when we closed out Q1, opportunities (for home buyers and sellers alike) abound as we enter Q3. And again contributing to an atmosphere of success are the still unusually attractive home mortgage rates, though speculation continues as to how long they will remain in the basement.
In any event, the prudent and perceptive buyer and seller will look behind and beyond real estate headlines – whether doom and gloom or breathlessly positive – and recognize that they may have limited (and perhaps even no) application to his or her particular situation. Because, like politics, “all real estate is local.”
Sincerely,
Q1/Q2 2011 YTD vs. Q1/Q2 2010, City-wide
remained even
Jimmy Wanninger!iimmmmyy WWaannnniinnggeerr
!iimmmmyy WWaannnniinnggeerr990011 SSiirr FFrraanncciiss DDrraakkee BBllvvddKKeennttffiieelldd,, CCAA 9944990044441155..999900..88999900jjiimmmmyy@@jjiimmmmyymmaarriinn..ccoommwwwwww..!iimmmmyyMMaarriinn..ccoommDDRREE## 0011335522228877
441155..999900..88999900jjiimmmmyy@@jjiimmmmyymmaarriinn..ccoommwwwwww..!iimmmmyyMMaarriinn..ccoomm
990011 SSiirr FFrraanncciiss DDrraakkee BBllvvdd,, KKeennttffiieelldd,, CCAA 9944990044

Q2. 2011
A Member Of Real Living
Pacific Union International Real Estate Report Q2. 2011
MEDIAN PRICEA Member Of Real Living
Pacific Union International Real Estate Report
homes sold comparison
Second Quarter Median Price ByProperty Type And Neighborhood
TENANCIES IN COMMON
CONDOMINIUMS
SINGLE FAMILY HOMES
San Francisco Units Sold by Property Typeand Neighborhood Q2 2011
TENANCIES IN COMMON
CONDOMINIUMS
SINGLE FAMILY HOMES
Source: SFAR MLS, June 30, 2011
Under $1 Million
$296,839,038
477
66
$624,000
$622,304
$1-3 Million
$243,069,675
157
47
$1,350,000
$1,548,214
$3 Million+
$106,612,769
24
88
$3,502,500
$4,442,199
'10 - '11% CHANGE
-5%
0%
25%
-7%
-5%
'10 - '11% CHANGE
-9%
-8%
-18%
-4%
0%
'10 - '11% CHANGE
-14%
-14%
42%
-7%
0%
Apr - Jun 2011
VOLUME
UNITS SOLD
AVERAGE DOM
MEDIAN PRICE
AVERAGE PRICE
Under $1 Million
$289,169,929
483
76
$599,000
$598,696
$1-2 Million
$120,588,969
93
57
$1,207,500
$1,296,656
$2 Million+
$80,465,500
28
74
$2,599,000
$2,873,768
'10 - '11% CHANGE
-12%
-9%
4%
-4%
-4%
'10 - '11% CHANGE
5%
4%
12%
-3%
0%
'10 - '11% CHANGE
93%
100%
10%
-8%
-3%
Apr - Jun 2011
VOLUME
UNITS SOLD
AVERAGE DOM
MEDIAN PRICE
AVERAGE PRICE
Single Family Homes Q2 2011 Sold Comparison
Condominiums Q2 2011 Sold Comparison
Tenancies In Common Q2 2011 Sold Comparison
Source: SFAR MLS, June 30, 2011
Source: SFAR MLS, June 30, 2011
$500K and under
$13,389,276
32
105
$427,000
$418,415
$500K and higher
$59,274,809
68
72
$727,000
$871,688
'10 - '11% CHANGE
-1%
-6%
4%
2%
5%
'10 - '11% CHANGE
78%
48%
-18%
10%
20%
Apr - Jun 2011
VOLUME
UNITS SOLD
AVERAGE DOM
MEDIAN PRICE
AVERAGE PRICE
Source: SFAR MLS, June 30, 2011
‘10‘11
$2.95M
$1.02M
$1.33M
$3.1M
$2M $1.27M $1.4M
$723K
$570K
$1.18M $1.25M
$762K $827K
$995K
$734K
$469K
$1.06M
$639K
$567K$588K$675K
$1.3M
$634K
$700K
$654K
$685K$700K
$540K
$1.09M
$699K
‘10
‘11 ‘10 ‘11 ‘10 ‘11‘10 ‘11
NOB/RUSSIAN/TELEGRAPH HILL
LOWER PACHEIGHTS/
HAYES/NOPA
NOE/CASTRO/HAIGHT
RICHMOND/SEACLIFF
PAC HEIGHTS/MARINA
$790K $758K $731K $660K $900K $785K $595K $542K $480K $424K$345K$357K$330K$338K
$393K$430K$435K
$723K
$835K
$713K
$475K
$615K
$470K
$642K
$501K
ST. FRANCIS WOOD/MIRALOMA/FOREST HILL
SUNSET/PARKSIDE
SOMA/MISSION/POTRERO
LAKE MERCED/INGLESIDE
BAYVIEW/EXCELSIOR
‘10 ‘11 ‘10
‘11‘10 ‘11 ‘10 ‘11
‘10‘11
SOMA/MISSION/POTRERO
NOE/CASTRO/HAIGHT
NOB/RUSSIAN/TELEGRAPH HILL
ST. FRANCIS WOOD/MIRALOMA/FOREST HILL
LAKE MERCED/INGLESIDE
RICHMOND/SEACLIFF
SUNSET/PARKSIDE
PAC HEIGHTS/MARINA
LOWER PAC HEIGHTS/HAYES/NOPA
BAYVIEW/EXCELSIOR
6494
128114 106
19
10 1065 46
1226
8
48
19
27
68
11
96
160
0
10200
186
26
213
13


Real Estate News v. Real Estate “Noise”There are two types of real estate information out there in the media. One we would call “noise” and is typically reported on a quarterly basis and covers a region or more often the nation. Most of these reports track closed sales and are reported anywhere from thirty to sixty days after the completion of the research cycle, either monthly or quarterly. The information is, by design, general in nature and somewhat dated by the time it is published. The S&P/Case-Shiller Report Index™ and the First Republic Prestige Home Index™ are two examples of this type of reporting. These reports provide retrospective and relative indicators of value and activity; however, they do not provide insight into future trends on a local basis.
The other type of real estate information is provided by experts who work day to day in a local market. This information often looks similar to the information we provide in this quarterly newsletter. We believe that real estate is local, and further, that market activities and trends can be unique within a marketplace or county depending upon specific neighborhoods or even specific price points. We also believe that properties under contract (pending sales) or new escrows are the industry’s most meaningful indicator of near term trends.
Our review of new escrows in the East Bay* real estate market reveals encouraging movement even though early summer is not usually considered the peak sales season. The chart below illustrates current trends by percentage for properties currently “under contract” versus the same time period twelve and twenty-four months ago. While specific neighborhoods may be performing differently and prices may be lower than meet sellers’ expectations, our markets under the million dollar price point are continuing to accelerate, at least in terms of units “under contract”.
As the Months of Inventory figures above indicate, the listing inventory in most price ranges is meeting current demand. Almost half of the sales in the second quarter closed at or above the original list price with an average of sixteen days on the market, confirming that the market responds quickly to well-priced properties and that a realistic list price is critical to attracting today’s qualified buyer. Do not underestimate the power of demand-based pricing. Price your property within local market demand tolerances and you will likely ratify a new escrow in your first three weeks on the market. Flirt with the high end of your price range and prepare to be part of inventory statistics.
In this marketplace, we encourage buyers to make housing decisions based first on the quality of the home environment they are seeking and second on the opportunity associated with their investment. It is our feeling that a “buy and hold” strategy for at least five years will likely make today’s home purchase a lucrative investment. We do not see the “buyers’ window” closing. In a broader sense, we see more realistic sellers everyday, which translates into more demand-based, realistic pricing for pre-approved, motivated buyers.
Please remember to seek out local news, trend analysis and professional advice for your real estate decisions. If you are a seller, be realistic about your presentation; stage your home when it is recommended andmeet market demands with realistic pricing. If you are a buyer, seize opportunities when theyarise, as the best priced properties continue to move quickly and often receive multiple offers.
Sincerely,
A Member Of Real Living
Pacific Union International Real Estate Report Q2. 2011
EAST BAY
Pacific Union International Real Estate Report Q2. 2011
EAST BAY
Pacific Union International Real Estate Report
EAST BAYA Member Of Real Living
All Price Ranges
38.5%
39.2%
30.9%
8.9%
2.1
$ 500K to $1 Million
12.0%
26.0%
19.8%
6.4%
1.9
$1 Million and Up
34.8%
-22.5%
-7.7%
-8.9%
3.1
Single Family Homes
Under Contract (v 24 months ago)
Under Contract (v 12 months ago)
Listing Inventory (v 24 months ago)
Listing Inventory (v 12 months ago)
Months of Inventory
Source: EBRD June 30, 2011 *Oakland zip codes 94602, 94609, 94610, 94611, 94618, 94619, 94705, Piedmont, Berkeley, Albany, Kensington and El Cerrito.
!ee llooookk ffoorrwwaarrdd ttoo sseerrvviinngg yyoouu iinn 22001111..
Jimmy WanningerJJiimmmmyy !aannnniinnggeerr
!iimmmmyy WWaannnniinnggeerr990011 SSiirr FFrraanncciiss DDrraakkee BBllvvddKKeennttffiieelldd,, CCAA 9944990044441155..999900..88999900jjiimmmmyy@@jjiimmmmyymmaarriinn..ccoommwwwwww..JJiimmmmyyMMaarriinn..ccoommDDRREE## 0011335522228877
441155..999900..88999900jjiimmmmyy@@jjiimmmmyymmaarriinn..ccoommwwwwww..JJiimmmmyyMMaarriinn..ccoomm
990011 SSiirr FFrraanncciiss DDrraakkee BBllvvdd,, KKeennttffiieelldd,, CCAA 9944990044

Pacific Union International Real Estate Report Q2. 2011
HOMES SOLD COMPARISONA Member Of Real Living
Pacific Union International Real Estate Report Q2. 2011
HOMES SOLD COMPARISONA Member Of Real Living
Kensington All Prices - Single Family Homes
Source: EBRD
Apr - Jun '09
$9,377,400
13
40
$775,000
$721,338
$975,000
Apr - Jun '10
$13,573,000
19
23
$750,000
$714,368
$935,000
Apr - Jun '11
$10,097,000
14
27
$702,500
$721,214
$1,275,000
'09 - '10% Change
45%
46%
-43%
-3%
-1%
-4%
'10 - '11% Change
-26%
-26%
17%
-6%
1%
36%
TIME PERIOD
VOLUME
HOMES SOLD
AVG. DAYS ON MKT
MEDIAN PRICE
AVERAGE PRICE
MAX PRICE SOLD
El Cerrito All Prices - Single Family Homes
Source: EBRD
Apr - Jun '09
$27,821,120
50
35
$542,500
$556,422
$910,000
Apr - Jun '10
$34,536,272
63
30
$560,000
$548,194
$834,136
Apr - Jun '11
$27,446,275
53
35
$487,000
$517,854
$875,000
'09 - '10% Change
24%
26%
-14%
3%
-1%
-8%
'10 - '11% Change
-21%
-16%
17%
-13%
-6%
5%
TIME PERIOD
VOLUME
HOMES SOLD
AVG. DAYS ON MKT
MEDIAN PRICE
AVERAGE PRICE
MAX PRICE SOLD
Piedmont All Prices - Single Family Homes
Source: EBRD
Apr - Jun '09
$35,920,600
26
37
$1,141,250
$1,381,561
$3,100,000
Apr - Jun '10
$35,328,000
25
19
$1,280,000
$1,413,120
$3,150,000
Apr - Jun '11
$64,658,048
42
20
$1,350,500
$1,539,477
$4,500,000
'09 - '10% Change
-1.6%
-4%
-49%
12%
2%
2%
'10 - '11% Change
83%
68%
5%
6%
9%
43%
TIME PERIOD
VOLUME
HOMES SOLD
AVG. DAYS ON MKT
MEDIAN PRICE
AVERAGE PRICE
MAX PRICE SOLD
Albany All Prices - Single Family Homes
Source: EBRD
Apr - Jun '09
$14,404,830
23
45
$620,000
$626,296
$867,000
Apr - Jun '10
$12,629,580
20
28
$585,700
$631,479
$975,000
Apr - Jun '11
$11,619,400
19
28
$585,000
$611,547
$1,089,000
'09 - '10% Change
-12%
-13%
-38%
-6%
1%
12%
'10 - '11% Change
-8%
-5%
0%
0%
-3%
12%
TIME PERIOD
VOLUME
HOMES SOLD
AVG. DAYS ON MKT
MEDIAN PRICE
AVERAGE PRICE
MAX PRICE SOLD
Berkeley All Prices - Single Family Homes
Source: EBRD
Apr - Jun '09
$98,352,844
138
34
$626,707
$712,701
$2,505,000
Apr - Jun '10
$124,789,616
152
24
$727,500
$820,984
$2,300,000
Apr - Jun '11
$107,539,950
148
29
$655,000
$726,621
$2,555,000
'09 - '10% Change
27%
10%
-29%
16%
15%
-8%
'10 - '11% Change
-14%
-3%
21%
-10%
-11%
11%
TIME PERIOD
VOLUME
HOMES SOLD
AVG. DAYS ON MKT
MEDIAN PRICE
AVERAGE PRICE
MAX PRICE SOLD
Oakland Area* All Prices - Single Family Homes
Source: EBRD
*Defined by Oakland zipcodes: 94602, 94609, 94610, 94611, 94618, 94619, 94705
Apr - Jun '09
$153,357,992
240
35
$632,500
$638,991
$2,000,000
Apr - Jun '10
$196,325,373
308
32
$610,000
$637,420
$2,250,000
Apr - Jun '11
$170,309,174
276
41
$572,500
$617,062
$2,405,000
'09 - '10% Change
28%
28%
-9%
-4%
0%
13%
'10 - '11% Change
-13%
-10%
28%
-6%
-3%
7%
TIME PERIOD
VOLUME
HOMES SOLD
AVG. DAYS ON MKT
MEDIAN PRICE
AVERAGE PRICE
MAX PRICE SOLD

www.JimmyMarin.com
Follow Jimmy Marin: