jim farmer as presented at the jisc/cetis conference november 15, 2006 | manchester uk
DESCRIPTION
Blended Learning: Pragmatic Innovation. Jim Farmer As presented at the JISC/CETIS Conference November 15, 2006 | Manchester UK. Is the recorder turned on? Jon. Types of eLearning. Sloan Consortium, September 2003. The JISC Conferences and the Enterprise Special Interest Group. - PowerPoint PPT PresentationTRANSCRIPT

Jim Farmer
As presented at the
JISC/CETIS ConferenceNovember 15, 2006 | Manchester UK
Blended Learning: Pragmatic Innovation

Is the recorder turned on?Jon

Georg
eto
wn
U
niv
ers
ity
Types of eLearning
Portion of Content Delivered Online Type of Course Typical Description
0% TraditionalCourse with no online technology used - content is delivered in writing or orally.
1 to 29% Web Facilitated
Course which uses web-based technology to facilitate what is essentially a face-to-face couse. Uses a course management system (CMS) or web pages to post the syllabus and assignments, for example.
30-69% Blended./Hybrid
Course that blends online and face-to-face delivery. Substantial proportion of the content is delivered online, typically uses online discussions, typically has some fact-to-face meetings.
80+% OnlineA course where most of the content is delived online. Typically has no face-to-face meetings.
Sloan Consortium, September 2003

The JISC Conferencesand the Enterprise Special
Interest Group

Georg
eto
wn
U
niv
ers
ityValue of communication
"Because of the JISC Conferences, the CETIS SIGs, and the collaborative projects encouraged by JISC, university IT managers became aware of the practices and developments of others, had the opportunity to learn of perspectives beyond their own university, and developed confidence and trust in the work of others. This has led to sharing that otherwise may not have occurred, and thus made their own work much more effective.“
Jim Farmer, “JISC/CETIS conference feedback,” email, 30 November 2005
Georg
eto
wn
U
niv
ers
ity
Cited work
Gustav Delius, Chris Sangwin, Neil Strickland, John Prashoud, Scott Wilson, Sean Mehan, Niall Sclater, Jason Cole, Stuart Lee, Ian Boston, Paul Miller, Mhari McAlpine, Oleg Liber, Harriet Truscott, Bill Olivier, Patrick McAndrew, Tish Roberts, Paul Walk, Vashti Jarach, Robert Sherratt, Chris Awre, Brian Kelly, Wilbert Kraan, Jon Mason, Randy Metcalfe, Colin Smythe, Mark Stubbs, Steve Jeyes

Georg
eto
wn
U
niv
ers
ityXCRI and the PESC course
catalog“In developing the XCRI specification for exchange of programme, curriculum, and course data, the Integration Working Group (and the CETIS Enterprise SIG) have developed a process that is very effective in authoring specifications that can be rapidly adopted and will have a long useful life. This could be a model for other projects creating specifications for a JISC service.”
Jim Farmer, “Notes, JISC/CETIS Conference,” 15 November 2005

Georg
eto
wn
U
niv
ers
ity
Drill and practice: algebra
Gustav Delius, “Serving Mathematics in a distributed e-learning environment, Final Report,” University of York, 24 May 2005
Georg
eto
wn
U
niv
ers
ity
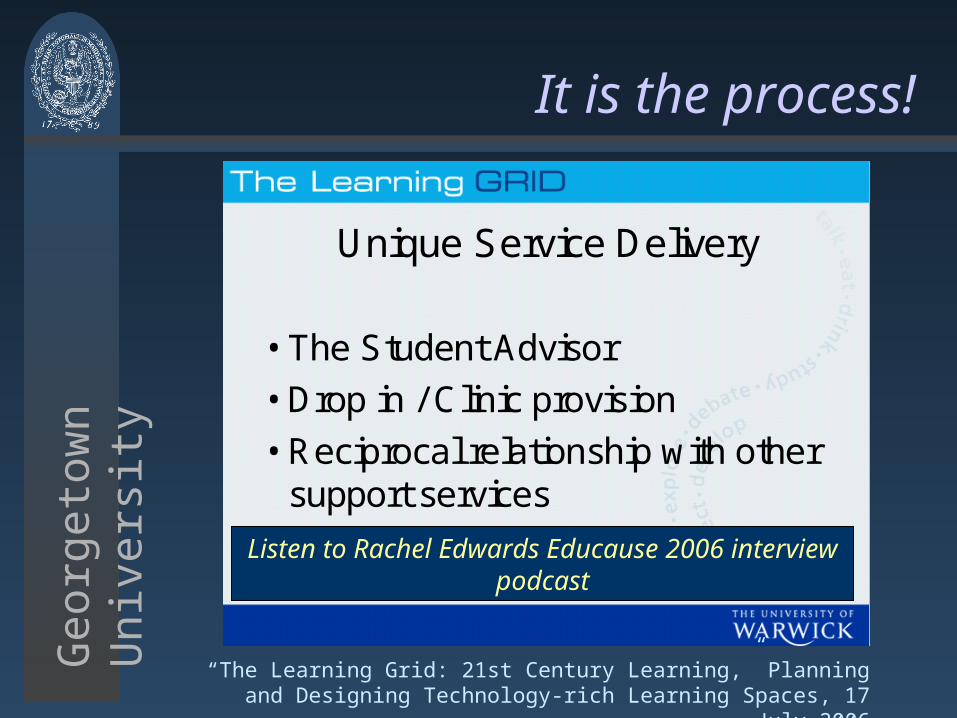
It is the process!
Unique Service Delivery
• The Student Advisor
• Drop in / Clinic provision
• Reciprocal relationship with other support services
Listen to Rachel Edwards Educause 2006 interview podcast
“The Learning Grid: 21st Century Learning,” Planning and Designing Technology-rich Learning Spaces, 17 July 2006

Increasing participationsome unintended consequences

Georg
eto
wn
U
niv
ers
ity
UK commitment
The UK government is committed to increasing the participation rate in college and university education.
Georg
eto
wn
U
niv
ers
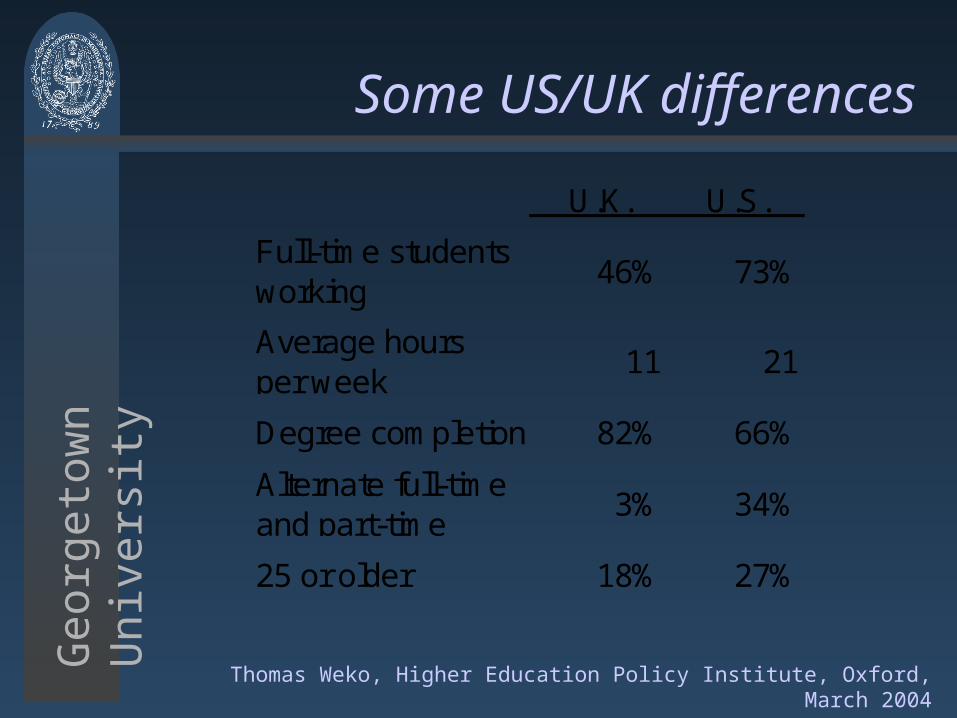
itySome US/UK differences
U.K. U.S.
Full-time studentsworking
46% 73%
Average hoursper week
11 21
Degree completion 82% 66%
Alternate full-timeand part-time
3% 34%
25 or older 18% 27%
Thomas Weko, Higher Education Policy Institute, Oxford, March 2004

Georg
eto
wn
U
niv
ers
ity
College and university graduates
Percent Graduating from Tertiary-Type A Education (2000)
0%
5%
10%
15%
20%
25%
30%
35%
40%
UnitedKingdom
NewZealand
Australia UnitedStates
Japan Sweden Canada
Per
cent
Gra
duat
ing
“International Comparisons,” U.S. Department of Education, May 2003

Georg
eto
wn
U
niv
ers
ityThe working participant
Hours Worked per Week
0
5
10
15
20
25
30
35
40
U.K. U.S. Base Additional
Hou
rs p
er W
eek

Georg
eto
wn
U
niv
ers
ity
Barriers to success
• Inadequate high school preparation
• Limited financial resources
• Constrained Time (schedule)
• Constrained Location
• Diverse learning styles
Georg
eto
wn
U
niv
ers
ity
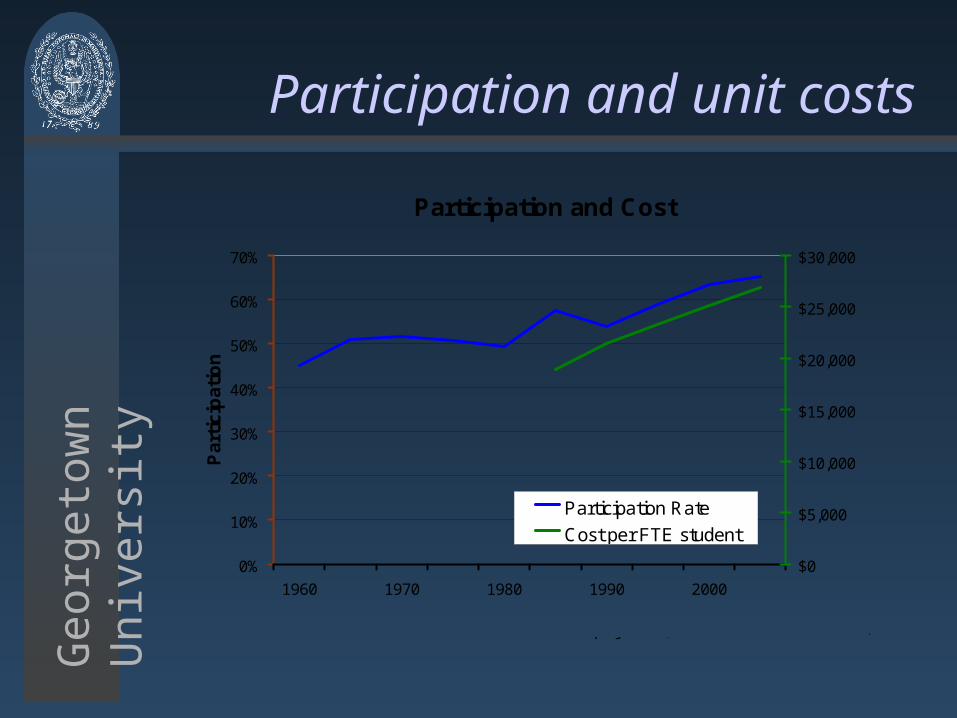
Participation and unit costs
Participation and Cost
0%
10%
20%
30%
40%
50%
60%
70%
1960 1970 1980 1990 2000
Par
tici
pat
ion
$0
$5,000
$10,000
$15,000
$20,000
$25,000
$30,000
Participation Rate
Cost per FTE student
Based on U.S. Department of Eduction reports and projections; costs in 2005 constant dollars..

Georg
eto
wn
U
niv
ers
ity
Cost of additional participants
Cost per FTE Student
$0
$10,000
$20,000
$30,000
$40,000
$50,000
$60,000
1990 2005 2005 Base 2005 Added
Cos
t pe
r F
TE
Stu
dent
53.8% 11.3%65.1%53.8%
In 2005 constant U.S. dollars

An American Perspective:The Challenges of Student
Access and Student Success

Georg
eto
wn
U
niv
ers
ity
The public perception
Tuition and Required Fees Public Universities
0%
5%
10%
15%
20%
25%
30%
35%
40%
45%
1999-2000 2000-2001 2001-2002 2002-2003 2003-2004
Pe
rce
nt
cha
ng
e
Tuition public universities
Consumer price index
Digest of Education Statistics 2004, NCES

Georg
eto
wn
U
niv
ers
ity
The student’s perspective
“The explosion of knowledge”
DerivativesHedging
Commercial PaperLoans
Bonds BondsStocks Stocks
1962 2002Finance Course, UCLA Anderson School of Management

Georg
eto
wn
U
niv
ers
ityThe government’s view
Estimated Changes in ProductivityU.S. Public Colleges and Universities
-20%
-15%
-10%
-5%
0%
5%
10%
15%
20%
99-00 00-01 01-02 02-03 03-04 04-05
Cu
mu
lativ
e C
ha
ng
e
FTE Student, Public 4
FTE Student, Public 2
U.S. Non-farm Business
Adjusted for inflation using the CPI

Georg
eto
wn
U
niv
ers
ity
The new reality
Funding U.S. Public Higher Education Students
-8%
-4%
0%
4%
8%
12%
16%
99-00 00-01 01-02 02-03 03-04 04-05
Fiv
e Y
ea
r C
ha
ng
e
Enrollment
State Appropriations
FundingGap
State Fiscal Conditions and Higher Education Funding, ASCU, Aug 2004
Appropriations adjusted for inflation
Funding Gap

Georg
eto
wn
U
niv
ers
ity
Since 1972 (1)
Then
Education is a “public good” and should be financed by the government.
Now
A student benefits from education and therefore should pay for it
Student loan industry was created
Student price response 3.3 to 8.8% per US$1,000 (1990)
Georg
eto
wn
U
niv
ers
ity
Purpose of higher education
• “[In the U.S.] A college education is principally, if not solely, an investment in personal advancement.”
• “… universities [in the U.S.] are shaped almost exclusively by the wants of students seeking educational credentials and business and governmental agencies seeking research outcomes.”
Zemsky, Wegner, and Massy, 2005

Georg
eto
wn
U
niv
ers
ity
Since 1972 (2)
ThenUniversities should only admit students
who are capable of succeeding
NowUniversities are responsible for the success
of any student who has completed high school or its equivalent
Although the proportion of high school graduates who go on to college has risen
substantially in recent decades, the college completion rate has failed to improve at
anywhere near the same pace. Spellings Report September 2006

The Role of Education Technology

Georg
eto
wn
U
niv
ers
ity
eLearning, what we know
• From current experience, improved learning especially for the less prepared
• Student preferences (in order)• Blended/Hybrid• Totally online• Traditional classroom
• “Common course redesign can lead to 40 percent savings in direct instructional costs of those courses—16% of total instructional costs or 8% increase in productivity.”
Graves “Order the Change, and Change the Order,” November 2004

Georg
eto
wn
U
niv
ers
ity
Differences in learning rates
Sillinger and Suppes, 1999
Time to Course CompletionAlgebra 2 and Pre-calculus
0
20
40
60
80
100
120
140
160
180
200
0% 25% 50% 75% 100%
Num
ber
of C
alen
dar
days
0
5
10
15
20
25
30
35
40
Hou
rs o
f T
erm
inal
Tim
e
Calendar DaysConnect TimePoly. (Calendar Days)

Georg
eto
wn
U
niv
ers
ity
The future of higher education
An assertion:
Because of the diverse student population, higher education must develop “mass customization” of teaching and learning appropriate for each individual specific student.
Georg
eto
wn
U
niv
ers
ity
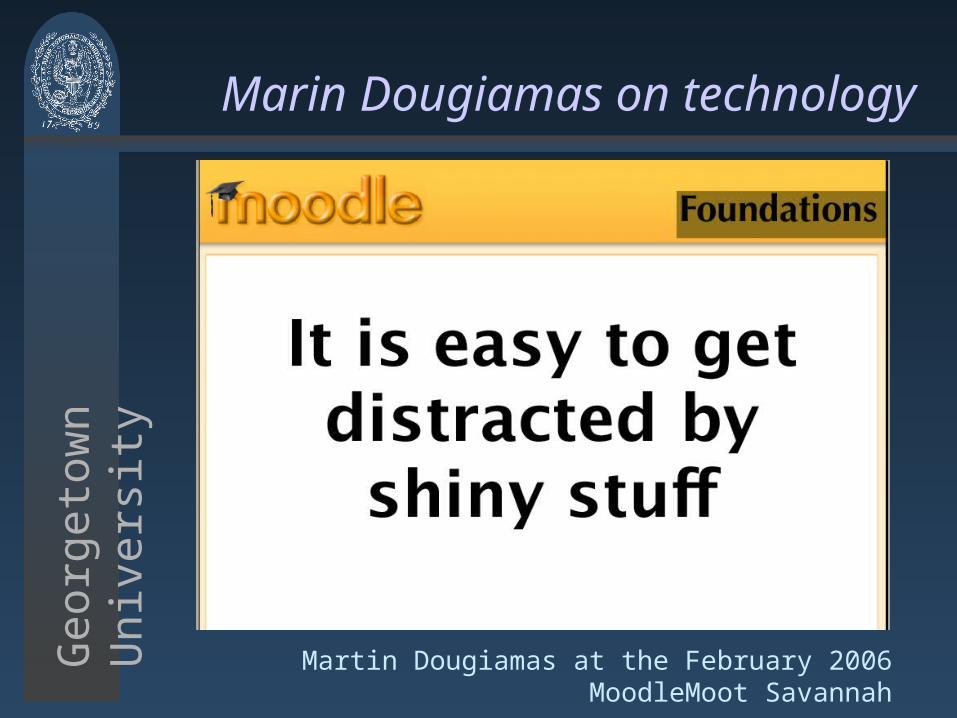
Marin Dougiamas on technology
Martin Dougiamas at the February 2006 MoodleMoot Savannah

Georg
eto
wn
U
niv
ers
ity
Research “Future implementation”
“The Personal Learning and Research Environment (PLRE) Working Group recommended further development of such an environment. The conference participants were aware this is a research project and further development and deployment of learning systems should be continued.”
Jim Farmer “Notes from the JISC/CETIS Conference, 15-16 November 2005, Harriot-Watts University, Edinburgh, Scotland,” 21
November 2005

Some alternatives

Georg
eto
wn
U
niv
ers
ity
The “model” is broken
FacultyDevelopers
Students
Education Technologists
Schools of Education
“management”
Government
Should CETIS create the broken links?
Georg
eto
wn
U
niv
ers
ity
JISC Priorities
Should JISC change its priorities? Yes, but it will be difficult. James [Dalziel] said the past policy had been to “let a thousand flowers bloom.” But with successful projects and an experienced research base, JISC could now be more selective and more focused. … to achieve the immediate goals of functionality and interoperability selecting key projects and insisting on the use of the e-Learning Framework will be important.Justin E. Tilton “Notes from the ‘E-Learning Tools, Standards, and Systems
Conference,’ Oxford, UK, 4-5 November 2004.

Georg
eto
wn
U
niv
ers
ity
Related opportunities
• In conjunction with open courseware, develop implement a “cartridge” specification to achieve critical mass. Save publishers from themselves.
• “Engineer” learning based on feedback from the use of eLearning systems.
Assess prescribe deliver

Georg
eto
wn
U
niv
ers
ity
Suggestions
• Focus on the relationship between pedagogy and eLearning. (Role for Schools of Education)
• For funding foundations and agencies:
• Only fund development of services or functions unique to higher education.
• Shift from funding development to funding pilot integration and implementation
• Document, promote the successful

Georg
eto
wn
U
niv
ers
ity
Suggestions for JISC/CETIS
• Involve Schools of Higher Education in the development of priorities.
• Require proposals, where possible, to estimate the availability of the proposed technology for broad implementation and the value to the community.
• Review prior work for technology that could be extended or integrated for implementation.

Georg
eto
wn
U
niv
ers
ity
Oleg Liber, CETIS
• … we should focus on the “immediate future.”
JISC/CETIS Conference, 14 November 2006
The end
[email protected]@Georgetown.edu
Based on a presentation by Justin E. Tilton, eLearning 2006, 12 February 2006

Georg
eto
wn
U
niv
ers
ity
Permissions
The presentation itself can be reproduced and redistributed provided there are no changes made to the content.

Supplementary material

Student Perspectives

Georg
eto
wn
U
niv
ers
ity
Administration
Instruction
Library
Research
The higher education web world
Actual screen shots of production applications, Justin E. Tilton, 2003

Georg
eto
wn
U
niv
ers
ity
Students expectations shaped by...
• [In the U.S.] Their experience applying for admissions and financial aid
• Their use of financial services portals
• Their use of the Internet
• Their life in a “real-time, information rich” environment.
Be prepared:
94% of Internet-using (78%) youths age 12-17 use the Internet for school research, 71% say it is the major source for their school projects and reports, 58% use a school or class Website, 17% have created a Webpage for school, 74% use Instant Messaging.
Pew Internet, August 2002

Georg
eto
wn
U
niv
ers
ity
Students now expect...
• Customer service 24 hours a day,7 days a week
• Complete information froma single source
• Information by Web, e-mail, telephone, facsimile, and wireless devices• response time of 15 seconds for telephone, 10
seconds for Web, and 2 hours for e-mail and facsimile
• access to a complete customer history

Georg
eto
wn
U
niv
ers
ity
Students prefer
• A portal
• Single sign-on even if that means revealing personal logons and passwords [aggregation/credential caching]
• Selection of content [portlets] and layout [user profile]
• Common portlet navigation and icons [consistent look & feel]

Georg
eto
wn
U
niv
ers
ity
Serving students
Mode of Service Per interaction
Web chat $7.50
Telephone chat 4.50
E-mail 2.50
Telephone self-service 1.85
Web self-service 0.65
Gartner/Avaya, CFO Jan 2005

eLearning: some results

Georg
eto
wn
U
niv
ers
ityRio Salado College and Plato
Math• Using commercially developed Interactive
Mathematics Rio Salado offered four courses with one instructor.
• The number of students in a section increased from 35 to 100.
• A course assistant was added to help with course management, freeing the instructor to focus on student learning.
Academic Systems Inc. Profile, October 2002

Georg
eto
wn
U
niv
ers
ity
Northern Oklahoma College
• Using Interactive Mathematics, the pass rate for Elementary Algebra increased from 45% to more than 70%.
• Sixty percent of the incoming students at Northern Oklahoma College are deficient in mathematics.
• “Students are passing math and staying in school,” Debbie Quirey said. “75 percent of our students who take one or more developmental math classes go on to pass college algebra.”
Plato Implementation Story, April 2004
Georg
eto
wn
U
niv
ers
ity
Student motivation to learn
• “Quirey and others in the department attribute the success to students being able to review the Interactive Mathematics instructional module over and over again until they understand it.”
• Plato Implementation Story, April 2004
• “According to instructors, students using Interactive Mathematics reported that they tended to go back and review the software’s instruction more often than ask questions of the instructor or ask for help from tutors.”
Thomas Coe, Mathematics Department Chair, Rio Salado CollegeAcademic Systems Profile, October 2002

Georg
eto
wn
U
niv
ers
ity
Student willingness to learn
• Students can accelerate their learning and finish more than one course level per term.
• “I have had up to 10 percent of my students complete two courses in a single semester. A few have even completed three courses.”
Kim Brown, Mathematics Department Chair, Tarrant County College
Plato Implementation Story, April 2004

Georg
eto
wn
U
niv
ers
ity
Types of e-Learning
Seizing the Opportunity: The Quality and Extent of Online Educationin the United States, 2002 and 2003, Sloan Consortium, Sep 2003
Portion of Content Delivered Online Type of Course Typical Description
0% TraditionalCourse with no online technology used - content is delivered in writing or orally.
1 to 29% Web Facilitated
Course which uses web-based technology to facilitate what is essentially a face-to-face couse. Uses a course management system (CMS) or web pages to post the syllabus and assignments, for example.
30-69% Blended./Hybrid
Course that blends online and face-to-face delivery. Substantial proportion of the content is delivered online, typically uses online discussions, typically has some fact-to-face meetings.
80+% OnlineA course where most of the content is delived online. Typically has no face-to-face meetings.

Georg
eto
wn
U
niv
ers
ity
Content and teachingTraditionalClassroom
BlendedLearning
LearningEnvironment 2015
Content delivery none or linear sequenced adaptive
Content format text, imagestext, images, audio, video
text, images, audio, video
Content source faculty faculty + supportinstructional design and multimedia specialists
Collaboration e-mail, forumse-mail, chat, forums, Wiki
e-mail, chat, forums, Wiki, audio and video conferencing
Learning station Web browserWeb browser with plug-ins
Web browser with plugins, personal learning environment for some courses

Georg
eto
wn
U
niv
ers
ity
Learning supportTraditionalClassroom
BlendedLearning
LearningEnvironment 2015
Library On-line catalogOn-line repository (JSTOR + ArtStor)
Course content, repositories, remedial learning objects
Faculty roleLecture, office hours
Lecture or review, on-line office hours
Lecture or review, on-line video-enhanced office hours
Academic supportTeaching assistants
Teaching assistants, help desk, assessment center
Tutors, help desk
Progress monitoring Interim grades Interim gradesContinuous assessment of mastery, learning styles, and effort

Georg
eto
wn
U
niv
ers
ity
Content development
TraditionalClassroom
BlendedLearning
LearningEnvironment 2015
Process Faculty choiceFaculty choice + multimedia development
Specialized course development roles and software, multimedia production facilities
Scope of content Faculty defined Faculty definedInterinstitutionally defined learning objectives (transfer)
AssessmentsFaculty authored
Faculty authored
Assessment specialist authors
Reuse None or limited None or limitedPublished and open learning objects and media objects

Georg
eto
wn
U
niv
ers
ity
Students learn at different rates
Time to Course Completion
0
50
100
150
200
250
0 25 50 75 100
Percentage of Students
Ca
len
da
r D
ays
0
5
10
15
20
25
Co
mp
ute
r C
on
ne
ct H
ou
rs
Calendar Days
Connect Time
Log. (Calendar Days)
Sillinger and Suppes, 1999

Georg
eto
wn
U
niv
ers
ity
Students work differently
Distribution of Time of a SessionAlgebra 2
0%
5%
10%
15%
20%
25%
1 2 3 4 5 6 7 8 9 10 11 12 13 14 15 16
Number of Hours per Session
Pe
rce
nta
ge
of S
tud
en
ts

Georg
eto
wn
U
niv
ers
ity
Characteristics of eLearning success
The three factors of quality assurance are content and instructor based on student performance and, separately, student course satisfaction. See also the U.K. student survey ranking instruction using 19 questions.
InstitutionContent
AuthoringCall
Center TransferQuality
AssuranceRelative
cost
Open University (UK) Central 24/7 Limited 3-factorRio Salado College Central 18/7 Arizona 3-factor LowerUniversity of Phoenix Central Local 3-factorCoastline College Central 18/7 California 3-factor LowerUniversity of Lubeck Central 14/7 EU 3-factor Lower
Georg
eto
wn
U
niv
ers
ityAccommodating student
needsEarly work by Pat Suppes has demonstrated that students have different learning styles, which he represented as “trajectories” of learning based on when different students mastered course content.
The flexibility of eLearning suggest opportunities to transform classical “term-based” learning.

Georg
eto
wn
U
niv
ers
ity
Learning trajectories
Based on the work of Pat Suppes at Stanford University
Conte
nt
Mast
ery
Cours
e G
rad
e
TimeEnd of
Scheduled Term
ABCDF

Georg
eto
wn
U
niv
ers
ity
Quick learner
Conte
nt
Mast
ery
Cours
e G
rad
e
TimeEnd of
Scheduled Term
ABCDF
Boredom vs. supplementary course content?
Georg
eto
wn
U
niv
ers
ity
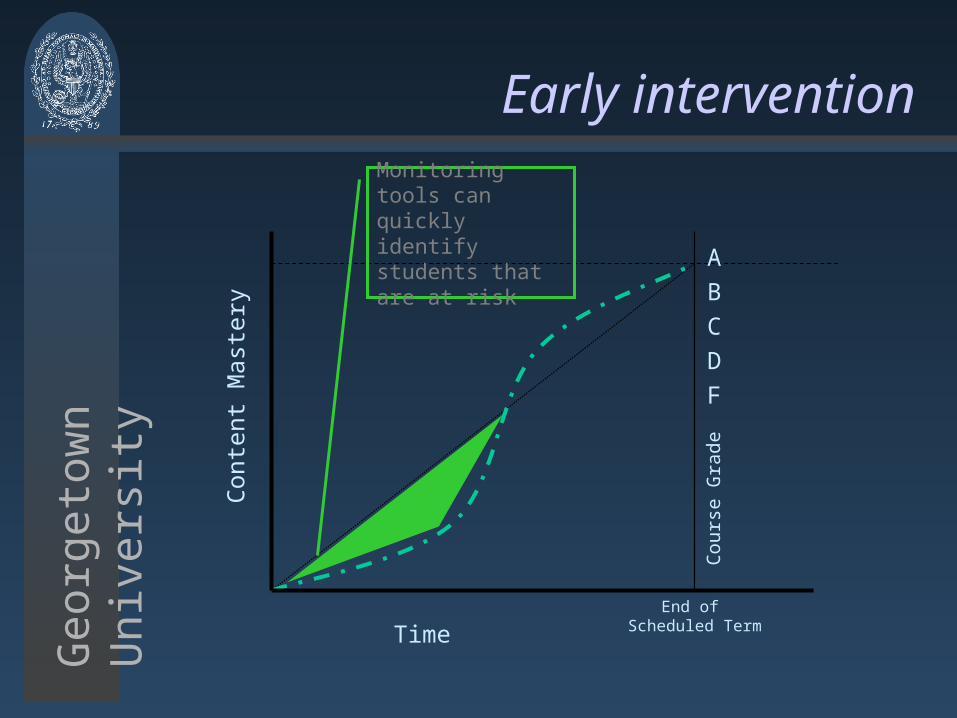
Early intervention
Conte
nt
Mast
ery
Cours
e G
rad
e
TimeEnd of
Scheduled Term
ABCDF
Monitoring tools can quickly identify students that are at risk
Georg
eto
wn
U
niv
ers
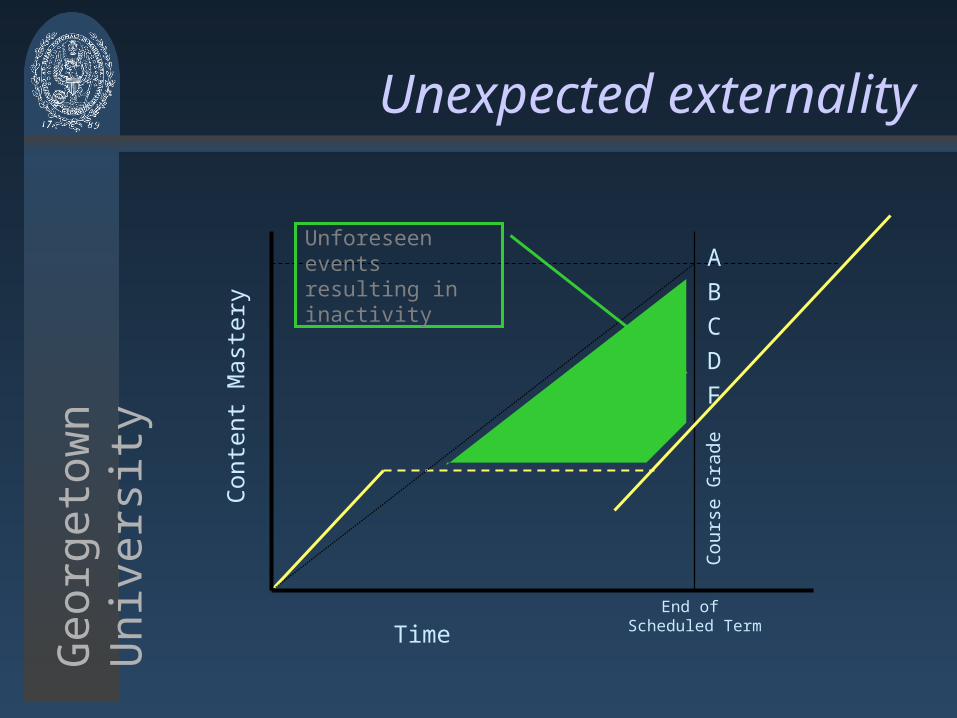
ityUnexpected externality
Conte
nt
Mast
ery
Cours
e G
rad
e
TimeEnd of
Scheduled Term
ABCDF
Unforeseen events resulting in inactivity
Georg
eto
wn
U
niv
ers
ity
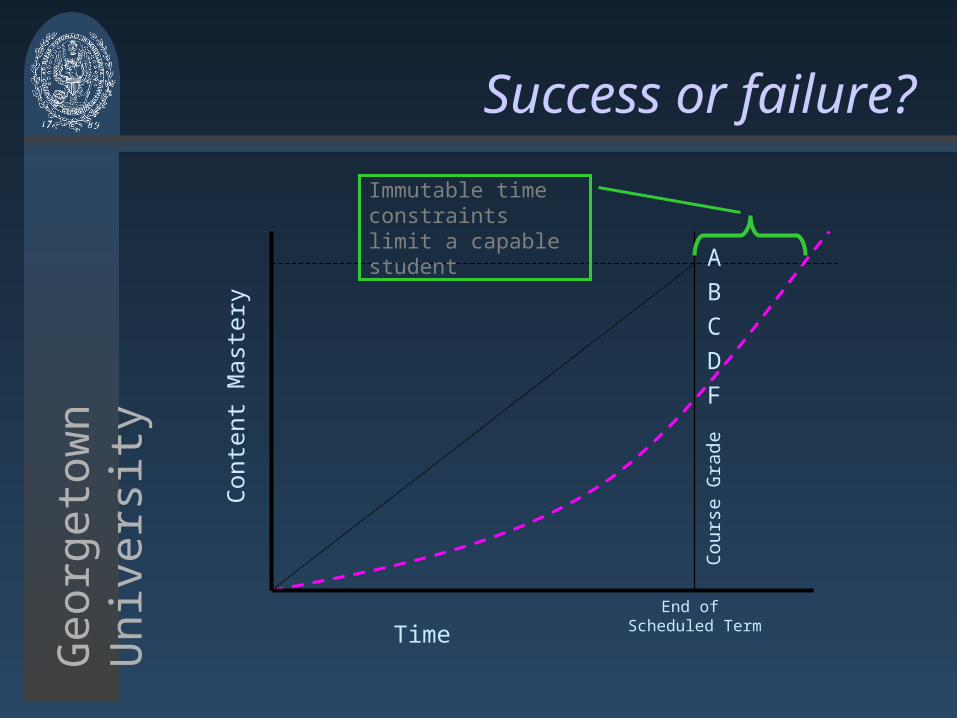
Success or failure?
Conte
nt
Mast
ery
Cours
e G
rad
e
TimeEnd of
Scheduled Term
ABCDF
Immutable time constraints limit a capable student

Georg
eto
wn
U
niv
ers
ity
Types of e-Learning
Seizing the Opportunity: The Quality and Extent of Online Educationin the United States, 2002 and 2003, Sloan Consortium, Sep 2003
Portion Online Type of Course0% Traditional
1 to 29% Web Facilitated30 to 79% Blended/Hybrid
80+% Online

Georg
eto
wn
U
niv
ers
ity
Student effortH
ours
per
week
to a
chie
ve
conte
nt
mast
ery
Method of instruction
Lecture/Discussion3h 2h 1h
Blended Collaboration Tutorial
12
9
6
3
0

The emerging learning environment

Georg
eto
wn
U
niv
ers
ityInvesting in courseware
Cost of Course Content per Studentfor various levels of Course Development costs
$0
$200
$400
$600
$800
$1,000
10 100 1,000 10,000
Class size, 3-year, 6-term course life
Cos
t per
stu
dent
US$6,000US$37,500US$120,000US$1,000,000
Georg
eto
wn
U
niv
ers
ity
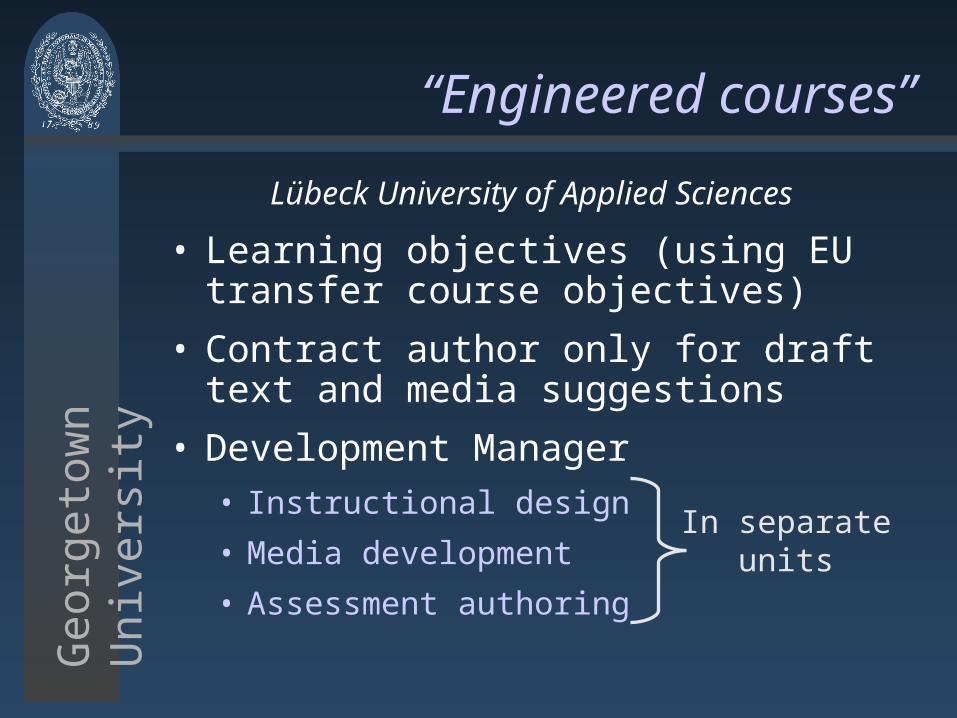
“Engineered courses”
Lübeck University of Applied Sciences
• Learning objectives (using EU transfer course objectives)
• Contract author only for draft text and media suggestions
• Development Manager• Instructional design
• Media development
• Assessment authoring
In separate units

Georg
eto
wn
U
niv
ers
ity
Academic services
Lübeck University of Applied Sciences
• Technical support (separate from faculty)
• Tutor
• Domain competence
• Native language of the student regardless of the language of the course
• Selected for ability to communicate
• Academic Services Support System
(see also University of Oxford and Open University UK)

The technology

Some alternatives
Georg
eto
wn
U
niv
ers
ity
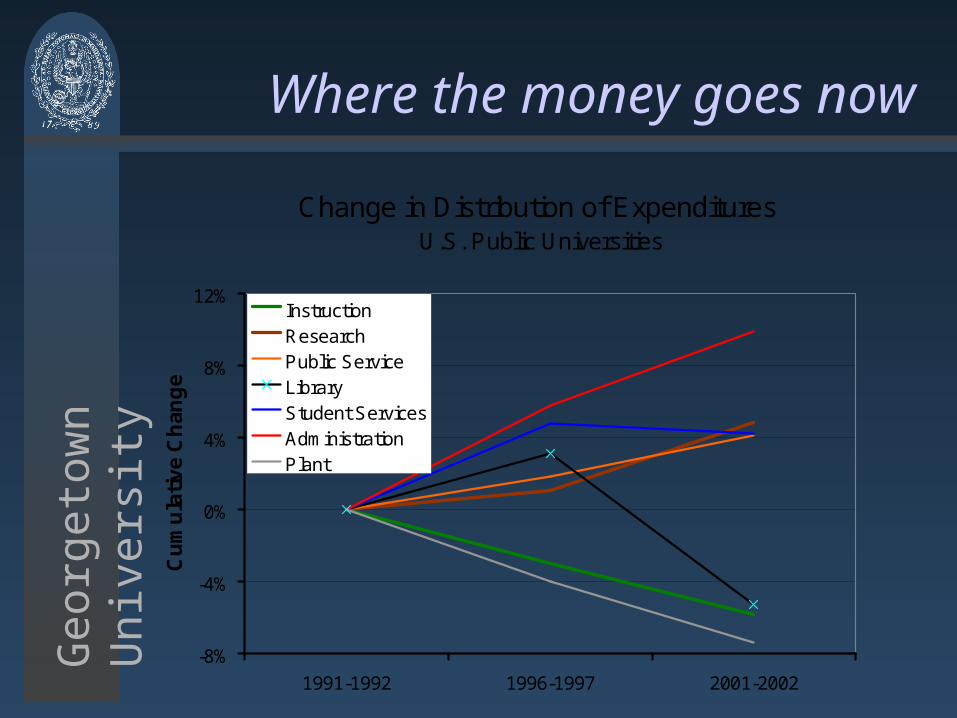
Where the money goes now
Change in Distribution of Expenditures U.S. Public Universities
-8%
-4%
0%
4%
8%
12%
1991-1992 1996-1997 2001-2002
Cu
mu
lati
ve C
han
ge
InstructionResearchPublic ServiceLibraryStudent ServicesAdministrationPlant
Georg
eto
wn
U
niv
ers
ity
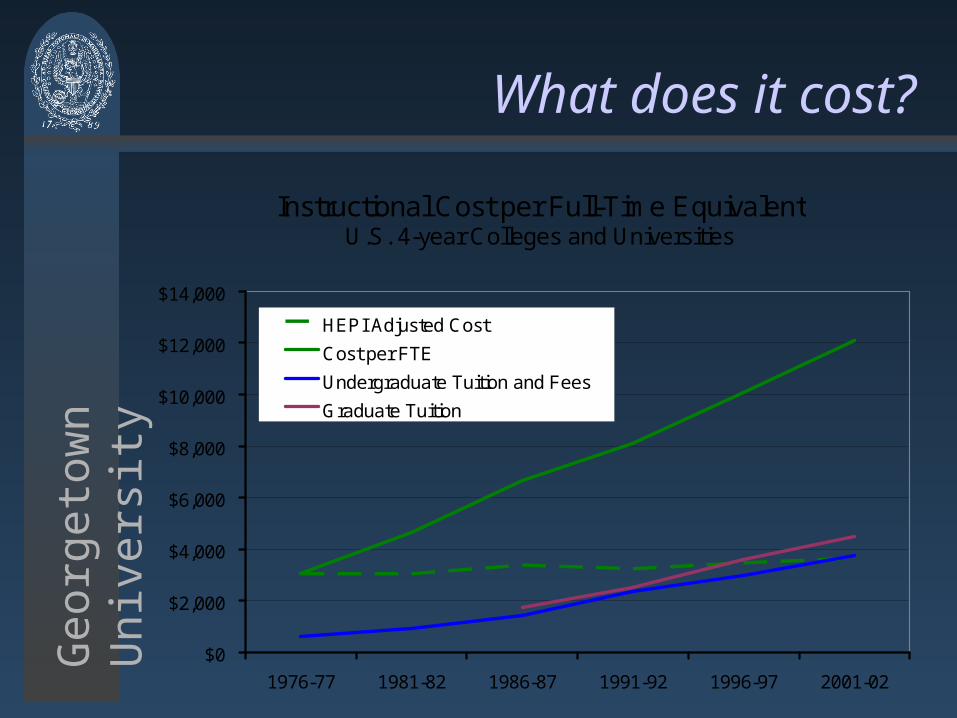
What does it cost?
Instructional Cost per Full-Time EquivalentU.S. 4-year Colleges and Universities
$0
$2,000
$4,000
$6,000
$8,000
$10,000
$12,000
$14,000
1976-77 1981-82 1986-87 1991-92 1996-97 2001-02
HEPI Adjusted Cost
Cost per FTE
Undergraduate Tuition and Fees
Graduate Tuition
Georg
eto
wn
U
niv
ers
ity
Use of eLearning
• “We did not hear that colleges looked to distance learning as a common strategy to help accommodate students and minimize loss of access. We do want to point out that one college that serves a large portion of its students through distance learning did find it economical to increase this portion. … with the infrastructures already in place, they could accommodate additional students in these programs more easily than in classrooms.”
Ensuring Access with Quality to California’s Community Colleges, May 2004
The emerging learning environment

Georg
eto
wn
U
niv
ers
ity
Observations
Based on observations by Bryan Williams, remote-learning.net, in supporting Moodle services.
• Students will continue learning if the eLearning resources are available.
• Quick learners will go beyond the scope of a course if materials are available.
• Those slow to learn or interruptions to their learning will succeed if given additional time.
Georg
eto
wn
U
niv
ers
ity
Basis for projections
• Twenty minutes of eLearning “drill and practice” time is equivalent to sixty minutes in a traditional classroom.
• Students are expected to spend three hours in study for each hour in lecture.
• Collaboration time differs sharply depending upon the characteristics of the group.
• Tutorials take additional time because of the interest and focus of the student (and achieve more than expected “course mastery.”
The emerging “market” for eLearning

Georg
eto
wn
U
niv
ers
ity
Proposed open /closed courseware
Open Courseware Learning Object
Courseware
Study hours 16 - 32 120 - 240 Tutors No Yes Tech support No Yes Examination Personal guidance As required Certification No Yes Pedagogy Yes Yes Peer group Informal Enrolled students
Forums By subject By course
Proposed, Open University of the Netherlands, Feb 2006

Georg
eto
wn
U
niv
ers
ity
Expected results
• “Learning on demand” in chunks (at no cost to the student)
• Incentive to either• Subscribe to tutorial support
• Participate as a student
• Seek “certification” by examination
paying current tuition
• Increase value of “brand” and gain course enrollments

Learning technology

Georg
eto
wn
U
niv
ers
ity
Summary of trends
• Professional specialists• Move process control from faculty to learning
designers (and learning systems)
• Mergers or consortia to achieve economies of scale
• Public pressures to improve cost/benefit
• More granular content, more flexibility in schedule, multi-format learning materials

Georg
eto
wn
U
niv
ers
ity
Barriers to success
• Change in culture from faculty-centered instruction to student learning
• Change in organization form – functional organization
• Acceptance of increased “automation”
• Development of feedback to achieve adaptive leaving activities
• Adoption of standard learning objectives for many undergraduate courses.
Georg
eto
wn
U
niv
ers
ity
To be successful
• Content interoperability is imperative
• New consortium-developed or commercial software with new functions and new architecture
• Open standards are required to reduce IT maintenance costs
• Specialization will require retraining current staff
Collaboration is key to lower unit costs

Georg
eto
wn
U
niv
ers
ity
Transformation is feasible
• eLearning has produced an experienced and knowledgeable cadre (many attending eLearning 2006).
• Increased effectiveness and reduced costs have been broadly demonstrated.
• All needed information and education technologies have been developed and are being used somewhere.

Georg
eto
wn
U
niv
ers
ity
The “model” is broken
FacultyDevelopers
Students
Education Technologists
Schools of Education
“management”
Government
Should CETIS create the broken links?