jfds 1940 lr - fruit & vegetable preservation resources · this study used in situ microscopic...
TRANSCRIPT
E:FoodEngineering&PhysicalProperties
Permeabilization of Plant Tissues by MonopolarPulsed Electric Fields: Effect of FrequencySuvaluk Asavasanti, William Ristenpart, Pieter Stroeve, and Diane M. Barrett
Abstract Pulsed electric fields (PEF) nonthermally induce cell membrane permeabilization and thereby improve dehy-dration and extraction efficiencies in food plant materials. Effects of electrical field strength and number of pulses onplant tissue integrity have been studied extensively. Two previous studies on the effect of pulse frequency, however, didnot provide a clear view: one study suggested no effect of frequency, while the other found a greater impact on tissueintegrity at lower frequency. This study establishes the effect of pulse frequency on integrity of onion tissues. Changesin electrical characteristics, ion leakage, texture parameters, and percent weight loss were quantified for a wide range ofpulse frequencies under conditions of fixed field strength and pulse number. Optical microscopy and viable-cell stainingprovided direct visualization of effects on individual cells. The key finding is that lower frequencies (f < 1 Hz) cause moredamage to tissue integrity than higher frequencies (f = 1 to 5000 Hz). Intriguingly, the optical microscopy observationsdemonstrate that the speed of intracellular convective motion (that is, cytoplasmic streaming) following PEF applicationis strongly correlated with PEF frequency. We provide the first in situ visualization of the intracellular consequence ofPEF at different frequencies in a plant tissue. We hypothesize that cytoplasmic streaming plays a significant role in movingconductive ionic species from permeabilized cells to the intercellular space between plant cells, making subsequent pulsesmore efficacious at sufficiently low frequencies. The results suggest that decreasing the pulse frequency in PEF mayminimize the number of pulses needed to achieve a desired amount of permeabilization, thus lowering the total energyconsumption.
Keywords: cytoplasmic streaming, electrical properties, pulse frequency, tissue integrity, viability staining
Practical Application: PEF cause pores to be formed in plant cell membranes, thereby improve moisture removal andpotential extraction of desirable components. This study used in situ microscopic evaluation of onion cells, as theywere pulsed with electric fields at different frequencies, to determine whether frequency was an important parameter.We illustrate that membranes were more effectively broken at lower frequencies as compared to higher frequencies.Application of this information will allow for improved design of PEF systems for more energy efficient dehydration orextraction of plant tissues.
IntroductionThe application of pulsed electric fields (PEF) for short dura-
tions of a few to several hundred microseconds is a nonthermaltechnology that is capable of inducing cell membrane permeabi-lization through a phenomenon called “electroporation.” Manyfood-processing applications have been developed based on theloss of cell membrane integrity following PEF treatment. Ini-tially, most of these efforts were focused on microbial inactivationin liquid foods and beverages (Qin and others 1998; Picart andCheftel 2003; Aronsson and others 2005). Recently, more interesthas been paid to PEF pretreatment of biological materials, such as
MS 20100702 Submitted 6/23/2010, Accepted 10/7/2010. Author Asavasanti iswith Biological and Agricultural Engineering Graduate Program, Univ. of CaliforniaDavis, One Shields Ave, Davis, CA 95616, U.S.A. Authors Asavasanti, Ristenpart,and Barrett are with Dept. of Food Science and Technology, Univ. of California Davis,One Shields Ave, Davis, CA 95616, U.S.A. Authors Ristenpart and Stroeve arewith Dept. of Chemical Engineering and Materials Science, Univ. of California Davis,One Shields Ave, Davis, CA 95616, U.S.A. Direct inquiries to authors Asavasantiand Barrett (E-mail: [email protected]; [email protected]).
potato, carrot, radish, apple, sugar beet, and so on, to expedite therate of dehydration and increase the extraction yield (Angersbachand Knorr 1997; Rastogi and others 1999; Angersbach and others2000; Bajgai and Hashinaga 2001; Bazhal and others 2001; Taiwoand others 2002; Kulshrestha and Sastry, 2003; Lebovka and oth-ers 2003a, 2003b, 2004). The advantage of PEF over traditionalthermal processing is that it may conserve nutritional values offruits and vegetables, while retaining the flavor, color, and tasteof fresh food materials. However, industrial use of PEF for non-thermal processing of heterogeneous food materials is limited dueto a lack of clear understanding about the mechanism of electri-cal breakdown processes in whole plant tissues and optimal PEFparameters.
The basic mechanism of electroporation has been studied pri-marily at the single-cell level in animal, plant, and microbial cells(Pavlin and others 2005). PEF effects are more complex in mul-ticellular systems. The presence of different cells with varyingelectrical and topological properties within multicellular tissueshas a pronounced influence on the effectiveness of electropora-tion (Lebovka and others 2001). Despite the complexity, at least6 studies suggest that PEF results in an increase in the electrical
C© 2010 Institute of Food Technologists R©E98 Journal of Food Science � Vol. 76, Nr. 1, 2011 doi: 10.1111/j.1750-3841.2010.01940.x
Further reproduction without permission is prohibited

E:Fo
odEn
ginee
ring&
Phys
icalP
ropert
ies
Permeabilization of onion by PEF . . .
conductivity and permeability of the whole plant tissue sample(Knorr and Angersbach 1998; Lebovka and others 2001, 2002;Fincan and Dejmek 2002, 2003; Asavasanti and others 2010). Fur-ther studies indicated that PEF causes a nonthermal rupture of thecellular membranes, thereby removing the cellular turgor compo-nent of texture and affecting the viscoelastic properties of the tis-sue (Fincan and Dejmek 2003; Lebovka and others 2003a, 2003b;Lebovka and others 2005). Because integrity of the cell membraneis important to the overall quality of fruits and vegetables, changesin electrical and physical properties, such as electrical conductiv-ity, ion leakage, texture, weight loss, have been widely used toevaluate plant tissue integrity (Knorr and Angersbach 1998; DeAndrade and others 1999; Arevalo and others 2003; Lebovka andothers 2004). Using these measures, it has been shown that mem-brane permeabilization is dependent on pulse amplitude (electricfield strength E), pulse shape, pulse duration (ti), and pulse num-ber (n) (Zimmermann and others 1974; Kanduser and Miklav-cic 2008; Vorobiev and Lebovka 2008). Increasing the electricalfield strength, pulse duration, or number of pulses can enhanceboth the degree of membrane rupture and increase the density(that is, number and size) of pores in the membrane and cell wall(Zimmermann 1986; Weaver and Chizmadzhev 1996; Knorr andAngersbach 1998; Fincan and Dejmek 2002; Arevalo and others2003; Bazhal and other 2003b; De Vito and others 2008; Asavas-anti and others 2010).
Little is known, however, about the effect of pulse frequency (f )on plant cell membrane electroporation (Vorobiev and Lebovka2008). Earlier studies have been carried out primarily with arti-ficial animal membranes, lipid vesicles, microbial, and animal cellsuspension cultures or with plant protoplasts. These studies sug-gest that lower pulse frequencies may cause more damage to thecell because there is more time for charging the cell membranesbetween pulses, thereby facilitating pore formation (Bruhn andothers 1997; Vernhes and others 1999, 2002; Bilska and others2000; Evrendilek and Zhang 2005; Loghavi and others 2008).Vernhes and others (1999) observed biphasic dependence of cellviability on pulse frequency in animal cell culture tissues. Cellviability increased when frequency increased from 0.5 to 10 Hz,then decreased at frequencies higher than 10 Hz. These authorsalso reported that increasing pulse frequency (>10 Hz) increasedPEF-induced permeabilization. In contrast, Evrendilek and Zhang(2005) reported that the efficiency of the PEF-induced pasteuriza-tion of Escherichia coli O157:H7 in both apple juice and skim milkdecreased as the pulse frequency increased from approximately 40to approximately 167 kHz. Despite the relative simplicity of cellsuspensions in comparison to animal or plant tissues, the effectof pulse frequency on cell integrity and viability is still unclear.Moreover, it is not clear that the effect of pulse frequency on sin-gle animal or microbial cell suspensions is necessarily the same as
for plant tissues. Intact tissues are necessarily more complex, sincethey are composed of heterogeneous distributions of cells withadjacent cell walls attached to each other, and with plasmodesmataproviding cytoplasmic connections between cells. Both of thesecharacteristics, as well as the close proximity of one cell to anotherwithin the tissue matrix, may affect electroporation. As discussedin recent reviews by Kanduser and Miklavcic (2008) and Vorobievand Lebovka (2008), the effect of pulse frequency on plant tissuesis not clear.
Indeed, only 2 studies have directly examined the effect of pulsefrequency on plant tissue permeabilization (Lebovka and others2000, 2001; see also Table 1). One study reported that chang-ing the pulse frequency between 10 and 1000 Hz had no effecton electroporation efficacy in apple tissue, while the other studyshowed that a frequency of 0.2 Hz caused significantly more tissuedamage than 100 Hz. This latter result is intriguing, because itsuggests that very low frequencies might be optimal for inflictingtissue damage. Since only 2 frequencies were examined, however,an optimal frequency was not established. Knowledge of the in-fluence of pulse frequency on plant tissue integrity and optimalfrequency level will make it possible for food processors to im-prove the efficiency and reduce the energy consumption of PEFprocesses applied to plant tissue dehydration or extraction.
Lebovka and others (2001) also proposed a model for the effectof PEF on plant, in terms of what they called a “correlated perco-lation phenomenon,” where membrane resealing and “moisturetransport” after PEF are taken into consideration. These authorssuggested that, for high pulse frequencies, the pulse repetition timemay not be long enough for pores to expand; therefore, relativelyless tissue is damaged. Apple slabs treated at 0.02 Hz yielded morebrown spots, which were interpreted as regions of permeabilizedand more conductive channels in the tissue after PEF. In contrast,the sample treated at 100 Hz had less brown spots. Because only 2frequency levels (that is, 0.02 and 100 Hz) were examined, how-ever, the effect of pulse frequency is unclear. More fundamentally,the details of the “moisture transport” phenomenon are unclear.
An important transport process in plant cells, heretofore uncon-sidered in the context of PEF, involves a convective phenomenonknown as “cytoplasmic streaming.” In living cells, molecular mo-tor proteins (including, for example, kinesin and myosin) pullorganelles, plastids, and vesicles along bundled actin microtubules,thereby inducing fluid motion throughout the cell (also knownin older literature as “cyclosis”). This convective fluid motionplays a significant role in metabolism and distribution of moleculesand proteins across organelle membranes (Pickard 2003; Taiz andZeiger 2006; Goldstein and others 2008; Verchot-Lubicz andGoldstein 2010). Movement of these subcellular organelles in-side the plant cell cytoplasm induces fluid flow both inside thecytoplasm and inside the vacuolar, which may comprise a large
Table 1–Summary of previous studies on effect of pulse frequency on integrity of PEF-treated plant tissues.
PEF condition
Frequency Field strength Pulse Pulse duration Nr of Treatment Report on effect ofSample (Hz) (V/cm) shape (μs) pulses time∗ pulse frequency Source
Apple tissue 10 to 1000 200 to 2200 Monopolar nearlyrectangular
100 1 to 100000 0.1 to 1000 ms Pulse frequency didnot influenceelectroporationeffect.
Lebovka andothers (2000)
Apple tissue 0.02 and 100 500 Monopolar nearlyrectangular
1000 10 10 ms Low pulse frequencyresulted in moretissue damage.
Lebovka andothers (2001)
∗ Total time that the electric field is applied.
Vol. 76, Nr. 1, 2011 � Journal of Food Science E99

E:FoodEngineering&PhysicalProperties
Permeabilization of onion by PEF . . .
percentage of the cell (Verchot-Lubicz and Goldstein 2010). Inplant cells, observed flow patterns include unidirectional stream-ing, fountain streaming, and spiral rotational streaming. Early stud-ies often associated the existence of cytoplasmic streaming with cellviability; loss of membrane permeability results in cessation of cy-toplasmic streaming (Angnes von and others 1995; Tirlapur andKonig 2002).
The objective of this study is to determine the effect of fre-quency on PEF efficacy in permeabilization of onion tissues. Elec-trical and physical properties of onion tissues were evaluated afterPEF treatment to determine changes in tissue integrity. Neutralred (NR) dye was used as an indicator in the determination of cellviability of onion tissues after PEF treatment. Finally, we performthe first in situ investigation of the effect of pulse frequency on cy-toplasmic streaming and mass transport inside PEF-treated onionepidermal cells.
Materials and Methods
Sample preparationSpanish yellow onions (Allium cepa) were obtained from Gills
Onions (Oxnard, Calif., U.S.A.) and kept in cold storage at 4 ◦C upto 3 mo. The size of the onion bulbs was selected between 7.5 and9 cm dia in order to standardize maturity. Prior to sampling, onionbulbs were equilibrated to room temperature (approximately 25◦C) before removing the papery outer scales and the 1st fleshy scale.The 3rd fleshy scale was cut into 2 cm dia disks along its mid sectionwith a core borer. The inner epidermal cell layer was removed andthe onion disks were rinsed with deionized water for 60 s. Excesswater was removed by gentle blotting with a tissue (Kimwipes,Kimberly-Clark Global Sales, Inc., Dallas, Tex., U.S.A.). To ensuregood contact between electrodes and onion tissues, samples withthickness of approximately 3 mm were carefully selected to matchthe depth of the well in the sample holder. Average sample diskthickness was obtained by measuring the sample thickness at 5different locations around the disk periphery with digital calipers(Model CD-6B, Mitutoyo Corp., Tokyo, Japan).
Pulsed electric fieldsA Plexiglas sample holder assembled with 2 2 cm dia flat stainless
steel electrodes was used as shown in Figure 1A. Prior to placing anonion disk into the sample holder, 1 mL of isotonic solution wasadded to the well to ensure good electrical contact between thesample and the electrodes. Note that the isotonic concentrationwas determined by weight gain or loss experiments, as describedin Saltveit (2002) and Gonzalez and others (2010b). The isotonicconcentration of mannitol for each lot of onions varied slightly,ranging from 0.2 to 0.3 M. The isotonic concentration was de-termined for each lot of samples in 3 replicates.
An onion sample of the same thickness as the well depth wasplaced between the 2 electrodes of the sample chambers withthe convex plane facing down. Isotonic solution was added tofill the overhead space of the well before the top part of thesample holder was assembled. A small hole in the bottom part ofthe sample holder provided an overflow exit for excess air andsolution. To ensure an airtight condition at atmospheric pressure,a constant sealing force was applied to the o-ring gaskets betweenthe top and bottom electrodes using an Arbor press with a fixeddeadweight. Because of the small hole, the sample itself was atatmospheric pressure.
PEFs were applied using the system described by Asavasantiand others (2010). The PEF system consisted of a high-voltagepower supply (PowerPAC HV, Bio-Rad, Hercules, Calif., U.S.A.),
a function generator (model 33220A, Agilent, Santa Clara, Calif.,U.S.A.), a PEF generator, a sample holder, and an oscilloscope(model TDS1012B, Tektronix, Beaverton, Oreg., U.S.A.) for sig-nal monitoring. The PEF generator provided monopolar positivepulses of rectangular shape with a pulse width ti = 100 μs. Themain range of frequencies investigated in this study was from 0.1to 1000 Hz. Frequencies lower and higher than this range wereoccasionally evaluated. To determine the effect of pulse frequencyon onion tissue integrity, 8 levels of pulse frequency f from 0.01to 5000 Hz were chosen: 0.01, 0.1, 1, 10, 100, 1000, 2000, and5000 Hz. A 9th set of experiments, with no applied field, served asa control. Experiments were carried out using a constant electricfield strength of 333 V/cm (that is, an applied potential of 100V over a distance of 0.3 cm between 2 electrodes) with a fixednumber of pulses, n = 10 pulses. These parameters were selectedbased on the results of our previous study (Asavasanti and others2010), which showed that these PEF conditions maximized thetissue damage. The total PEF time tPEF was 1000 μs for all condi-tions, while the total processing time, that is, ttotel = (n − 1)/f + tiapproximately (n − 1)/f when 1/f � ti, varied from approximately2 ms to 15 min. For the control samples, an onion disk was placedinto the sample holder for 2 min without applying PEF and thenanalyzed identically to the PEF-treated samples.
Finally, to demonstrate the possible energy minimization by re-ducing the number of pulses at lower frequencies, different com-binations of pulse frequency and number of pulses were explored.Onion disks were treated at different low pulse frequencies (thatis, 0.01, 0.1, and 0.5 Hz) and the number of pulses was variedfrom 0 (control) to 10 pulses.
Figure 1–Schematic diagram of PEF treatment chamber for: (A) onion bulbscale internal tissue (parenchyma), and (B) onion epidermis. Each treat-ment chamber is connected to the PEF generator unit during the treatmentand to the LCR meter during electrical characteristic determination.
E100 Journal of Food Science � Vol. 76, Nr. 1, 2011
E:Fo
odEn
ginee
ring&
Phys
icalP
ropert
ies
Permeabilization of onion by PEF . . .
Electrical characteristics and conductivity disintegrationindex determination
The electrical characteristics of onion tissue before and afterPEF were measured with an Inductance (L), Capacitance (C), andResistance (R) analyzer or a LCR meter (model 4284A, Hewlett-Packard/Agilent Technologies, Inc., Santa Clara, Calif., U.S.A.)at a frequency of 20 Hz. Kulshrestha and Sastry (2003) suggestedlow-frequency measurements for examining the effects of PEF oncell membranes, because living tissues, such as plant cells, have di-electric dispersions in the low-frequency region due to the effectsof cell membranes from ionic conduction and membrane chargingrelaxation mechanisms that do not occur at high frequencies. Theapplied potential across the sample was set at 1 V. The measure-ment parameters included resistance R (�), impedance Z (�), andconductance G (S). At least 15 samples were used to determinethe electrical characteristics of onion disk treated at f = 0.01 to5000 Hz and controls (f = 0 Hz).
The degree of tissue damage was obtained from the electricalconductivity disintegration index Z∗ (Lebovka and others 2002)
Z∗ = σ − σi
σd − σi= (G − Gi ) × L/A
(Gd − Gi ) × L/A= G − Gi
Gd − Gi(1)
where σ is the measured electrical conductivity (S/cm), L is thesample thickness (m), A is cross-sectional area of the sample (m2),L/A is the cell constant (cm−1), and the subscripts “i” and “d” re-fer to the conductivities of intact and completely ruptured tissue,respectively. Complete rupture of the onion tissue was accom-plished by 2 cycles of freezing (−18 ◦C) and thawing at ambienttemperature (Palta and others 1977a, 1977b; Gonzalez and others2010b). Our preliminary study on onions indicated that the aver-age conductivity of intact (Gi) and ruptured (Gd) onion tissues are227 ± 85 μS and 1620 ± 420 μS, respectively. From Eq. (1), Z∗= 0 for intact tissue (control, no PEF) and Z∗ = 1 for completelyruptured tissue (after 2 successive freeze/thaw cycles).
Electrolyte leakage determinationControl and PEF-treated onion disks were covered with damp
tissue paper to avoid moisture loss and chilled overnight in therefrigerator (Saltveit 2002; Gonzalez and others 2010b). To de-termine an electrolyte leakage profile, chilled samples were equi-librated at room temperature for 1 h prior to the measurement.Two onion disks were placed into a 50-mL plastic tube containing20 mL of an isotonic solution (0.2 M mannitol) preequilibratedat 25 ◦C. The electrical conductivity (σ ) of each sample, main-tained at 25 ◦C in a shaking circulating water bath (Lindberg/BlueModel SWB1122A-1, Thermo Fisher Scientific, Waltham, Mass.,U.S.A.), was measured in μS/cm by a conductivity meter (Acc-umet portable AP65, Fisher Scientific Pte Ltd., Pandan Crescent,Singapore), periodically for up to 300 min. The timing startedwhen the 2 disks for each sample were placed into the tube. Theinterval between measurements was 5 to 15 min at the beginningof the run, and longer (60 min) toward the end. After the finalmeasurement, the centrifuge tubes were capped and placed in afreezer overnight at −18 ◦C. The next day, the frozen sampleswere removed from the freezer and allowed to warm to roomtemperature, 25 ◦C. After a 2nd overnight freeze/thaw cycle, aconductivity measurement was taken and used as the “Total Con-ductivity.” Electrolyte leakage at any time t was calculated as “%Ion Leakage” as shown in Eq. (2).
%Ion Leakage(t ) = Conductivity(t )Total Conductivity
× 100 (2)
A preliminary study showed that the relationship between elec-trical conductivity and time follows an asymptotic curve as sug-gested by Saltveit (2002). Initially, the rate of electrolyte leakageincreased rapidly and then gradually leveled off after 240 min (datanot shown). For this reason, 300 min was used as the standard timeto evaluate the percent ion leakage of all samples. Average percention leakage was obtained from at least 5 samples.
Texture measurementPuncture tests were performed to 90% deformation of the orig-
inal onion scale thickness using a 2 mm dia flat-tipped cylindricalprobe with a Texture Analyzer (model TA.XT2i plus, TextureTechnologies Crop., Scarsdale, NY/Stable Micro Systems, Go-dalming, Surrey, U.K.) and a 5 kg load cell. The test speed was setat 1.0 mm/s. Texture parameters measured were maximum force(N), gradient (from initial point to 20% maximum force) (N/mm),and number of peaks after the maximum force (threshold force =0.1 N). These parameters were selected based on previous workby Gonzalez and others 2010a, 2010b in our research group, sug-gesting that maximum force, gradient, and number of peaks couldbe used as indicators of the hardness of the cells and intactness ofthe membranes. Fifteen disks of onion were used for each datapoint.
Percent weight loss determinationWeights of onion disks were measured with an analytical bal-
ance (model Adventurer Pro AV812, Ohaus Corp., Pine Brook,N.J., U.S.A.) before and after PEF. After treatment, disks were re-moved from the sample holder and gently blotted dry with a tissue(Kimwipes). Weight loss was calculated and expressed as percentchange in weight after PEF (W ) over an initial sample weight (Wi)as shown in Eq. (3).
%Weight loss = (Wi − W)/Wi × 100 (3)
Average percent weight loss was calculated from at least 4 repli-cates.
Viability staining and light microscopyControl and PEF-treated onion disks (approximately 2 cm in
diameter) were trimmed into square pieces (approximately 5 mmlong × 5 mm wide) using a razor blade. Then, the samples weremounted on a specimen holder with instant glue and allowed toharden for 5 min. To prevent the sample from drying, a piece ofParafilm M
R©(American National Can Com., Norwalk, Conn.,
U.S.A.) was placed on the upper surface of the onion piece. Sec-tions were obtained using a Vibratome 1000 Plus (The VibratomeCo., St. Louis, Mo., U.S.A.). The moving speed of razor bladeand amplitude of vibration were adjusted to level 6 to 7 (Gonzalezand others 2010a). From each piece, 2 sections of 400-μm thick-ness were obtained by sectioning the specimen perpendicular toboth epidermises. These sections were then used in staining andmicroscopic analysis.
NR dye (Standard Fluka, Sigma-Aldrich, St. Louis, Mo.,U.S.A.) solution was freshly prepared each time before stainingthe samples. An NR stock solution was prepared by diluting 0.5%NR in acetone for 15 min, then filtered twice using Whatmanfilter paper nr 1 (Whatman Intl. Ltd., Springfield Mill, Maidstone,Kent, U.K.). The filtered stock solution was diluted to 0.04% in0.3 M mannitol-0.01 M HEPES (N-[2-hydroxyethyl] piperazine-N′-[2-ethane-sulfonic acid]) (Sigma-Aldrich) buffer, pH 7.8, andused as the dyeing solution.
Vol. 76, Nr. 1, 2011 � Journal of Food Science E101

E:FoodEngineering&PhysicalProperties
Permeabilization of onion by PEF . . .
Prior to staining, samples were rinsed in deionized water toremove cellular debris and cell contents released by the mechan-ical damage of sectioning. Onion specimens were transferred toporcelain wells containing the dye solution and incubated at roomtemperature for 2 h. The specimens were rinsed twice for 5 mineach time in 0.3 M manitol-0.01 M HEPES buffer solution. Toobtain images of stained cells, specimens were mounted on a mi-croscope slide with a drop of deionized water, covered with a coverslip, and immediately observed with a light microscope (ModelBHS, Olympus System Microscope, Tokyo, Japan) at 4.0× objec-tive magnification. A color digital camera (Olympus MicroFire,Olympus America, Melville, N.Y., U.S.A.) attached to the micro-scope was used to capture images via an interface of the Olym-pus MicroFire software, V.2.3 (Optronics, Goleta, Calif., U.S.A.).Color photomicrographs (1600 × 1200 pixel resolution, whitebalance corrected) were captured from 2 selected areas, whichwere positioned between and equidistant from 2 vascular bundlesand 4 to 5 cell rows away from the outer epidermis, within theparenchyma tissue of each specimen (Gonzalez and others 2010a).
The entire range of selected frequencies (that is, control, 0.1 Hz,1 Hz, 1 kHz, and 5 kHz) was replicated on 2 separate days tobe able to make a qualitative comparison among micrographsobtained from the different frequency experiments. Fresh sampleswere stained immediately after standard sample preparation steps,while control samples were placed in the sample holder withoutapplying PEF for 2 min prior to staining. Four replicate disks wereused for each treatment, and from each disk, 2 micrographs wereobtained. One of 8 images was selected as a representative of thegroup for inclusion in the manuscript. The power level of thelighting source was fixed at the recommended photo setting (8 to9) of the microscope.
Cytoplasmic streaming investigationThe abaxial epidermal peel was manually stripped from the
concave surface of the 2nd outermost scale of the onion bulband cut into 5 × 5 mm sections. The sections were rinsed withdeionized water for 1 min to remove onion flesh debris prior tomounting to a special PEF treatment chamber (Figure 1B). Thechamber consisted of 2 parallel copper electrodes attached to a glassslide; the distance between the 2 electrodes was 3 mm. The sectionwas oriented such that the long axes of the cells were parallel tothe electrodes. Isotonic solution was used as a mounting mediaand a cover glass was carefully placed on top of the chamber toavoid entrapment of air bubbles.
The sample was observed in a phase contrast, transmittedlight microscope at an objective magnification of 20× (LeicaDMI3000B, Meyer Instruments Inc., Houston, Tex., U.S.A.). Thevideo was captured from the mid section of the sample, that is,about 8 cells down and 8 cells away from the electrode, for at least130 s with a CMOS color USB camera (EO-3112C, EdmundOptics Inc., Barrington, N.J., U.S.A.) at a frame rate of 12 framesper second and a pixel resolution of 1280 × 1024. Five frequencylevels were examined, that is, 0 Hz (control), 0.1 Hz, 1 Hz, 100 Hz,and 1 kHz. PEF was applied 30 s after the video was initiated. Theinitial 30 s of each video serves as the “control” for each partic-ular replicate. At least 3 replicates were performed for each pulsefrequency. Quantitative information about the cytoplasmic speedprofiles of epidermis subjected to different pulse frequencies wasdetermined using custom image analysis routines in MATLABversion 7.2.0.232 (Mathworks Inc., El Segundo, Calif., U.S.A.).For each treatment, an average speed was estimated from 2 set ofvideos, in which a total of 15 selected areas of about 60 × 60
pixels2 were analyzed. Three areas were selected to represent thecytoplasmic streaming speed profile within each cell and a totalof 5 cells were analyzed. At least 10 videos were analyzed for thecytoplasmic streaming speed profile, but qualitative informationabout the effect of pulse frequency on cytoplasmic streaming wasobtained from at least 4 videos per treatment. To determine theeffect of pulse frequency on cytoplasmic streaming, a normalizedstreaming speed U(t) was calculated as:
U (t ) = u(t )/u0 (4)
where u(t) is the cytoplasmic streaming speed at time t and u0 is thetime-averaged cytoplasmic streaming speed prior to application ofPEF for each particular sample, that is, the first 30 s of each video.In this fashion, natural variability in the cytoplasmic streamingspeed different cells and different tissues is accounted for. To com-pare the effects of different frequencies on cytoplasmic streaming,the “half-life” (t50), or the time required for the streaming speedto decay to 50% of its initial value, was determined. Because thecytoplasmic streaming speed may be affected by light (Shimmen2007), the control samples (with no PEF applied) were exposedto the same lighting conditions.
Statistical analysisData were analyzed using SAS 9.1 software (SAS Institute Inc.,
Cary, N.C., U.S.A.). The effect of pulse frequency on onion tissueintegrity was determined for a fixed electric field strength andnumber of pulses. One-way analysis of variance and Duncan’smultiple range tests were used to determine statistically significantdifferences among treatments (P < 0.05).
Results and Discussion
Effect of pulse frequency on electrical characteristics andconductivity disintegration index
The effects of pulse frequency on the resistance R, impedanceZ, conductance G, and electrical conductivity disintegration in-dex Z∗ of onion tissues treated with PEF at E = 333 V/cm,n = 10 pulses, and ti = 100 μs are shown in Figure 2 and 3,respectively. For all frequency levels (f = 0.01 to 5000 Hz), Rand Z values of the PEF-treated onion tissues are approximately30% to 80% lower than the controls, whereas the G value of thePEF-treated onion tissues is approximately 25% to 350% higherthan the controls. In biological tissues, previous investigators havefound that pores, formed in the cell membranes upon electric fieldexposure, result in a drop in electrical resistance as ions may moreeasily pass through the electroporated membrane (Coster 1965).The resistance of PEF-treated onion tissues decreases from approx-imately 5 k� (control) to about 1 k� for f = 0.01 and 0.1 Hz.At higher frequencies (f = 1 to 5000 Hz), the resistance of theonion tissues drops by approximately 2 to 3 k� (Figure 2). Theresults indicate that lower frequencies result in less resistance, andtherefore greater tissue damage than higher frequency applications.Figure 3 shows that low pulse frequencies (f < 1 Hz) yielded Z∗approximately 0.45, which is significantly higher (P < 0.05) thancontrols (Z∗ = 0) and samples treated at higher pulse frequen-cies of between 1 and 5000 Hz (Z∗ approximately 0.1 to 0.2).Above 10 Hz, increased pulse frequency has no significant effecton onion tissue integrity; Z∗ remained approximately constant(P < 0.05). An increase in Z∗ indicates increased permeability ofthe cell membrane and loss of plant tissue integrity, which resultsfrom PEF-induced cell membrane permeabilization or breakdown
E102 Journal of Food Science � Vol. 76, Nr. 1, 2011

E:Fo
odEn
ginee
ring&
Phys
icalP
ropert
ies
Permeabilization of onion by PEF . . .
(Zimmermann 1986; Lebovka and others 2000; Kulshrestha andothers 2008).
The results show that the electrical characteristics of onion bulbscale ground tissue are highly affected by the pulse frequency; asthe pulse frequency increases, the R and Z values increase, whileZ∗ values decrease (Figure 2 and 3). Our findings are qualitativelyin agreement with the previous studies on effect of pulse frequencyon plant tissue, listed in Table 1. Lebovka and others (2000) alsoreported that pulse repetition times within the interval of 1 to100 ms (or frequency of 10 to 1000 Hz) had the same influenceon thin apple slices treated with different electric field strengthsranging from 0.2 to 2.0 kV/cm, ti = 100 μs at 25 ◦C. Lebovkaand others (2001) found that PEF at 0.02 Hz resulted in moredamage, that is, higher relative conductivity, in apple tissue thanat 100 Hz. PEF-induced permeabilization of biological tissues hasbeen described as a correlated percolation phenomenon controlledby different key processes, for example, electroporation of cellularmembranes, time-dependent expansion of the pore size (in rangeof hundreds of μs to ms), resealing of membranes (in range ofseveral seconds to several minutes), and moisture transfer insidethe tissue structure (Zimmermann 1986; Tsong 1992; Bazhal andothers 2003a; Kanduser and Miklavcic, 2008).
Lebovka and others (2001) proposed a hypothesis that in case oflow pulse frequencies when the duration between 2 consecutivepulses (�t) exceeded the time required for resealing and moisturetransport, the damage process had a correlated percolation pattern.On the other hand, in the case of high pulse frequencies, there wasnot enough time for pores to expand or moisture transfer processto complete; thus, the damage process had a random character.Although simulated percolation patterns showed similar effect ofpulse frequency to the photographs of PEF-induced damage in ap-ple slabs, details concerning the structure of cellular material, andthe heterogeneous electrophysical properties within the samplewere not taken into account. Although the mechanism of PEF-induced damage in plant tissues is not yet completely understood,our study at 8 difference pulse frequencies provides additional ev-idences to support the conclusion that the lower pulse frequencies( f < 1 Hz) cause more damage to plant tissue integrity than thehigher frequencies.
Effect of pulse frequency on electrolyte leakage profile andpercent ion leakage
Figure 4 illustrates that control samples have an ion leakagevalue of approximately 10% at 300 min, which is most likely due
0
200
400
600
800
1000
1200
0
1
2
3
4
5
6
Control 0.01 Hz 0.1 Hz 1 Hz 10 Hz 100 Hz 1 kHz 2 kHz 5 kHz
Condu
ctance, G
(μS)
Impe
danc
e, Z
(kΩ
)
Pulse Frequency
Z (kΩ)
G (μS)
a
d d
cbc
b b bb
A
E
D
BBC B
CD BC
E
Figure 2–Effect of pulse frequency onimpedance Z and conductance G ofonion tissue (E = 333 V/cm, n = 10, ti
= 100 μs). Values with a commonletter do not differ significantly(Duncan’s multiple range test, P <0.05). Statistical comparisons aredone separately for each electricalcharacteristic as shown in differentcases.
Figure 3–Effect of pulse frequency onconductivity disintegration index Z∗ of oniontissue (E = 333 V/cm, n = 10, ti = 100 μs).Values with a common letter do not differsignificantly (Duncan’s multiple range test, P <0.05).
Vol. 76, Nr. 1, 2011 � Journal of Food Science E103
E:FoodEngineering&PhysicalProperties
Permeabilization of onion by PEF . . .
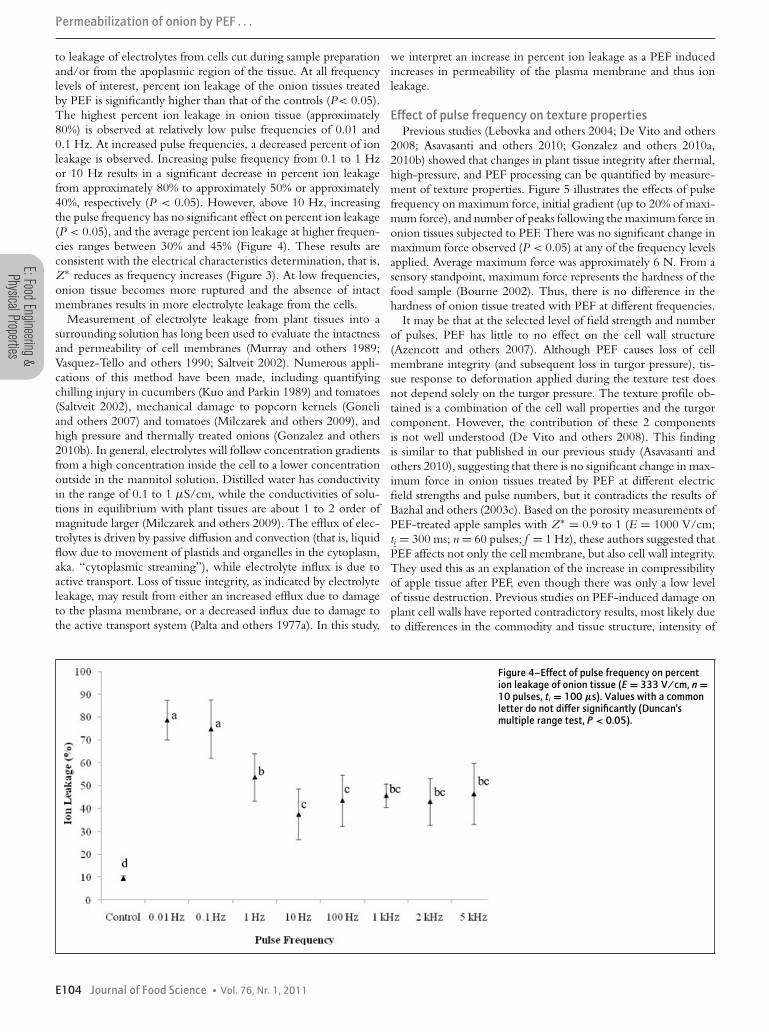
to leakage of electrolytes from cells cut during sample preparationand/or from the apoplasmic region of the tissue. At all frequencylevels of interest, percent ion leakage of the onion tissues treatedby PEF is significantly higher than that of the controls (P< 0.05).The highest percent ion leakage in onion tissue (approximately80%) is observed at relatively low pulse frequencies of 0.01 and0.1 Hz. At increased pulse frequencies, a decreased percent of ionleakage is observed. Increasing pulse frequency from 0.1 to 1 Hzor 10 Hz results in a significant decrease in percent ion leakagefrom approximately 80% to approximately 50% or approximately40%, respectively (P < 0.05). However, above 10 Hz, increasingthe pulse frequency has no significant effect on percent ion leakage(P < 0.05), and the average percent ion leakage at higher frequen-cies ranges between 30% and 45% (Figure 4). These results areconsistent with the electrical characteristics determination, that is,Z∗ reduces as frequency increases (Figure 3). At low frequencies,onion tissue becomes more ruptured and the absence of intactmembranes results in more electrolyte leakage from the cells.
Measurement of electrolyte leakage from plant tissues into asurrounding solution has long been used to evaluate the intactnessand permeability of cell membranes (Murray and others 1989;Vasquez-Tello and others 1990; Saltveit 2002). Numerous appli-cations of this method have been made, including quantifyingchilling injury in cucumbers (Kuo and Parkin 1989) and tomatoes(Saltveit 2002), mechanical damage to popcorn kernels (Goneliand others 2007) and tomatoes (Milczarek and others 2009), andhigh pressure and thermally treated onions (Gonzalez and others2010b). In general, electrolytes will follow concentration gradientsfrom a high concentration inside the cell to a lower concentrationoutside in the mannitol solution. Distilled water has conductivityin the range of 0.1 to 1 μS/cm, while the conductivities of solu-tions in equilibrium with plant tissues are about 1 to 2 order ofmagnitude larger (Milczarek and others 2009). The efflux of elec-trolytes is driven by passive diffusion and convection (that is, liquidflow due to movement of plastids and organelles in the cytoplasm,aka. “cytoplasmic streaming”), while electrolyte influx is due toactive transport. Loss of tissue integrity, as indicated by electrolyteleakage, may result from either an increased efflux due to damageto the plasma membrane, or a decreased influx due to damage tothe active transport system (Palta and others 1977a). In this study,
we interpret an increase in percent ion leakage as a PEF inducedincreases in permeability of the plasma membrane and thus ionleakage.
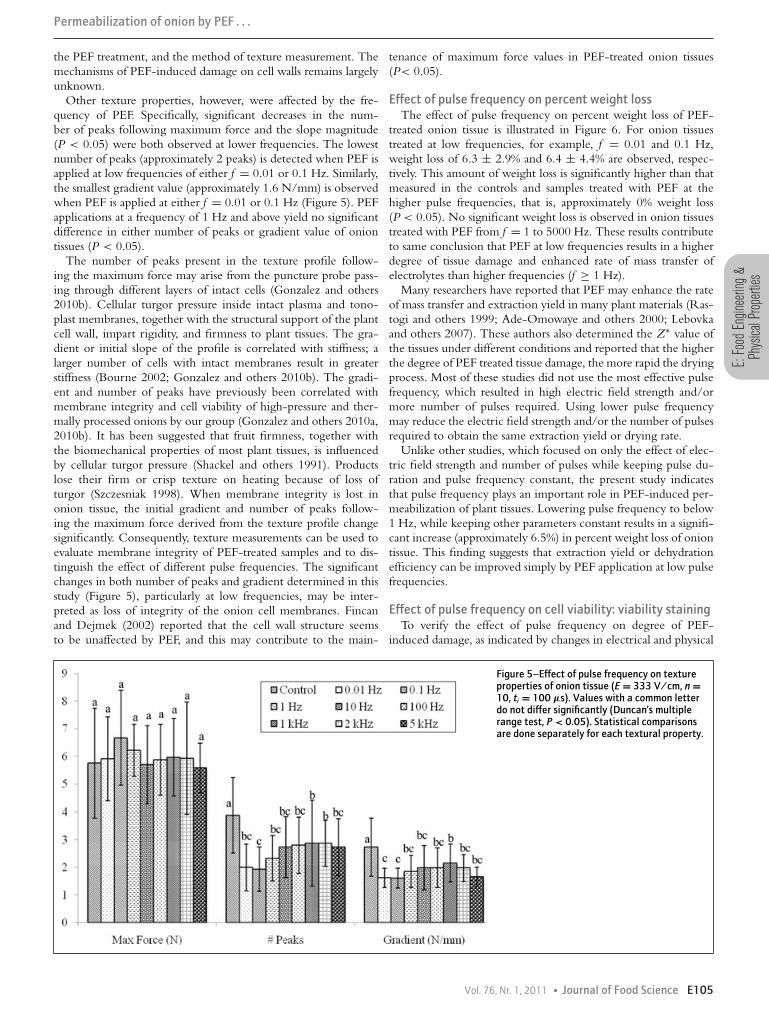
Effect of pulse frequency on texture propertiesPrevious studies (Lebovka and others 2004; De Vito and others
2008; Asavasanti and others 2010; Gonzalez and others 2010a,2010b) showed that changes in plant tissue integrity after thermal,high-pressure, and PEF processing can be quantified by measure-ment of texture properties. Figure 5 illustrates the effects of pulsefrequency on maximum force, initial gradient (up to 20% of maxi-mum force), and number of peaks following the maximum force inonion tissues subjected to PEF. There was no significant change inmaximum force observed (P < 0.05) at any of the frequency levelsapplied. Average maximum force was approximately 6 N. From asensory standpoint, maximum force represents the hardness of thefood sample (Bourne 2002). Thus, there is no difference in thehardness of onion tissue treated with PEF at different frequencies.
It may be that at the selected level of field strength and numberof pulses, PEF has little to no effect on the cell wall structure(Azencott and others 2007). Although PEF causes loss of cellmembrane integrity (and subsequent loss in turgor pressure), tis-sue response to deformation applied during the texture test doesnot depend solely on the turgor pressure. The texture profile ob-tained is a combination of the cell wall properties and the turgorcomponent. However, the contribution of these 2 componentsis not well understood (De Vito and others 2008). This findingis similar to that published in our previous study (Asavasanti andothers 2010), suggesting that there is no significant change in max-imum force in onion tissues treated by PEF at different electricfield strengths and pulse numbers, but it contradicts the results ofBazhal and others (2003c). Based on the porosity measurements ofPEF-treated apple samples with Z∗ = 0.9 to 1 (E = 1000 V/cm;ti = 300 ms; n = 60 pulses; f = 1 Hz), these authors suggested thatPEF affects not only the cell membrane, but also cell wall integrity.They used this as an explanation of the increase in compressibilityof apple tissue after PEF, even though there was only a low levelof tissue destruction. Previous studies on PEF-induced damage onplant cell walls have reported contradictory results, most likely dueto differences in the commodity and tissue structure, intensity of
Figure 4–Effect of pulse frequency on percention leakage of onion tissue (E = 333 V/cm, n =10 pulses, ti = 100 μs). Values with a commonletter do not differ significantly (Duncan’smultiple range test, P < 0.05).
E104 Journal of Food Science � Vol. 76, Nr. 1, 2011
E:Fo
odEn
ginee
ring&
Phys
icalP
ropert
ies
Permeabilization of onion by PEF . . .
the PEF treatment, and the method of texture measurement. Themechanisms of PEF-induced damage on cell walls remains largelyunknown.
Other texture properties, however, were affected by the fre-quency of PEF. Specifically, significant decreases in the num-ber of peaks following maximum force and the slope magnitude(P < 0.05) were both observed at lower frequencies. The lowestnumber of peaks (approximately 2 peaks) is detected when PEF isapplied at low frequencies of either f = 0.01 or 0.1 Hz. Similarly,the smallest gradient value (approximately 1.6 N/mm) is observedwhen PEF is applied at either f = 0.01 or 0.1 Hz (Figure 5). PEFapplications at a frequency of 1 Hz and above yield no significantdifference in either number of peaks or gradient value of oniontissues (P < 0.05).
The number of peaks present in the texture profile follow-ing the maximum force may arise from the puncture probe pass-ing through different layers of intact cells (Gonzalez and others2010b). Cellular turgor pressure inside intact plasma and tono-plast membranes, together with the structural support of the plantcell wall, impart rigidity, and firmness to plant tissues. The gra-dient or initial slope of the profile is correlated with stiffness; alarger number of cells with intact membranes result in greaterstiffness (Bourne 2002; Gonzalez and others 2010b). The gradi-ent and number of peaks have previously been correlated withmembrane integrity and cell viability of high-pressure and ther-mally processed onions by our group (Gonzalez and others 2010a,2010b). It has been suggested that fruit firmness, together withthe biomechanical properties of most plant tissues, is influencedby cellular turgor pressure (Shackel and others 1991). Productslose their firm or crisp texture on heating because of loss ofturgor (Szczesniak 1998). When membrane integrity is lost inonion tissue, the initial gradient and number of peaks follow-ing the maximum force derived from the texture profile changesignificantly. Consequently, texture measurements can be used toevaluate membrane integrity of PEF-treated samples and to dis-tinguish the effect of different pulse frequencies. The significantchanges in both number of peaks and gradient determined in thisstudy (Figure 5), particularly at low frequencies, may be inter-preted as loss of integrity of the onion cell membranes. Fincanand Dejmek (2002) reported that the cell wall structure seemsto be unaffected by PEF, and this may contribute to the main-
tenance of maximum force values in PEF-treated onion tissues(P< 0.05).
Effect of pulse frequency on percent weight lossThe effect of pulse frequency on percent weight loss of PEF-
treated onion tissue is illustrated in Figure 6. For onion tissuestreated at low frequencies, for example, f = 0.01 and 0.1 Hz,weight loss of 6.3 ± 2.9% and 6.4 ± 4.4% are observed, respec-tively. This amount of weight loss is significantly higher than thatmeasured in the controls and samples treated with PEF at thehigher pulse frequencies, that is, approximately 0% weight loss(P < 0.05). No significant weight loss is observed in onion tissuestreated with PEF from f = 1 to 5000 Hz. These results contributeto same conclusion that PEF at low frequencies results in a higherdegree of tissue damage and enhanced rate of mass transfer ofelectrolytes than higher frequencies (f ≥ 1 Hz).
Many researchers have reported that PEF may enhance the rateof mass transfer and extraction yield in many plant materials (Ras-togi and others 1999; Ade-Omowaye and others 2000; Lebovkaand others 2007). These authors also determined the Z∗ value ofthe tissues under different conditions and reported that the higherthe degree of PEF treated tissue damage, the more rapid the dryingprocess. Most of these studies did not use the most effective pulsefrequency, which resulted in high electric field strength and/ormore number of pulses required. Using lower pulse frequencymay reduce the electric field strength and/or the number of pulsesrequired to obtain the same extraction yield or drying rate.
Unlike other studies, which focused on only the effect of elec-tric field strength and number of pulses while keeping pulse du-ration and pulse frequency constant, the present study indicatesthat pulse frequency plays an important role in PEF-induced per-meabilization of plant tissues. Lowering pulse frequency to below1 Hz, while keeping other parameters constant results in a signifi-cant increase (approximately 6.5%) in percent weight loss of oniontissue. This finding suggests that extraction yield or dehydrationefficiency can be improved simply by PEF application at low pulsefrequencies.
Effect of pulse frequency on cell viability: viability stainingTo verify the effect of pulse frequency on degree of PEF-
induced damage, as indicated by changes in electrical and physical
Figure 5–Effect of pulse frequency on textureproperties of onion tissue (E = 333 V/cm, n =10, ti = 100 μs). Values with a common letterdo not differ significantly (Duncan’s multiplerange test, P < 0.05). Statistical comparisonsare done separately for each textural property.
Vol. 76, Nr. 1, 2011 � Journal of Food Science E105

E:FoodEngineering&PhysicalProperties
Permeabilization of onion by PEF . . .
properties of onion tissue, a viability staining technique was ap-plied to control and PEF samples at f = 0.1 Hz, 1 Hz, 1 kHz,and 5 kHz, respectively. These frequency levels were selected be-cause they show significant differences in onion tissue integrityafter PEF. Since there is no significant difference in Z∗ value,percent ion leakage, texture properties, or percent weight loss inonion tissue treated at either 0.01 or 0.1 Hz, the treatment at f =0.01 Hz was omitted because the time required for this applica-tion limits its practical application. Figure 7 shows representativephotomicrographs of NR stained onion tissues treated with differ-ent pulses frequencies. Control samples contain primarily viablecells, as shown in Figure 7A. Average onion parenchyma cell di-mensions are below 400 μm as reported by Gonzalez and others(2010a) and Ersus and Barrett (2010). NR staining distinguishes vi-able cells from nonviable cells. NR dye can easily diffuse throughintact plasmalemma and tonoplast membranes into the vacuole,where it accumulates due to ionization of the dye in the low-pHenvironment (for example, pH 5 to 5.5) inside the intact vacuole(Horobin and Kiernan 2002; Fincan and Dejmak 2002; Gonzalezand others 2010a). Viable cells are indicated by a concentrated redarea, while nonviable cells are interpreted to be those where dyeis more diffuse and not concentrated due to ruptured membranes.Damage to cells may result from mechanical damage during Vi-bratome sectioning of cells that are either greater than 400 μmin diameter, or partially aligned outside of the 400 μm sectioningrange. Cells may also become nonviable due to PEF-induced cell
membrane permeabilization. The black areas in the micrographsare air bubbles that may be trapped in the extracellular spacesof the cut surfaces during specimen preparation. To mitigate thisproblem, the specimens were fully submerged in deionized waterduring sectioning.
PEF at f = 0.1 and 1 Hz (Figure 7B and 7C) results in ruptureof most of the cells, while greater numbers of cells remain viablein onion tissues treated by PEF at higher frequencies, for example,1 and 5 kHz (Figure 7D and 7E). A similar method of viabilitystaining was used by Ersus and Barrett (2010). They observedsevere tissue damage in parenchyma cells, vascular bundles, andouter epidermal cells treated at E = 333 V/cm, ti = 100 μs,n = 10 pulses and f = 1 Hz, which is similar to the resultsreported here. The viability staining results further confirm thefinding that frequencies below 1 Hz result in more PEF-inducedpermeabilization of cells than the higher pulse frequencies. PEF at0.1 Hz results in the highest degree of cell permeabilization, while5 kHz yields the most intact cells. Our findings are in agreementwith the study of macroscopic structural changes of apple slabs afterPEF at E = 500 V/cm, ti = 1 ms and n = 10 at f = 0.02 and 100 Hzreported by Lebovka and others (2001). Their photographs showthat the lower frequency is associated with more damage to thecellular material than the higher frequency, as indicated by darkbrown spots (that is, enzymatic browning) on the sample. Theauthors hypothesized that brown spots correspond to formationof moisture-saturated and more conductive channels in the cellular
Figure 6–Effect of pulse frequency on percentweight loss of onion tissue treated with PEF (E =333 V/cm, n = 10 pulses, ti = 100 μs). Valueswith a common letter do not differ significantly(Duncan’s multiple range test, P < 0.05).
Figure 7–Representative photomicrographs ofonion tissue treated with PEF at different pulsefrequencies, E = 333 V/cm, n = 10 pulses: (A)control, (B) 0.1 Hz, (C) 1 Hz, (D) 1 kHz, (E) 5 kHz.Specimen thickness = 400 μm. Scale bar is100 μm.
E106 Journal of Food Science � Vol. 76, Nr. 1, 2011

E:Fo
odEn
ginee
ring&
Phys
icalP
ropert
ies
Permeabilization of onion by PEF . . .
structure. Their study yielded qualitative information about PEF-induced cellular damage in apple tissue at only one low- and onehigh-frequency level. The microscopic analyses presented hereof NR stained onion tissue provide the first direct correlationbetween electrical and physical properties and the cytology ofplant tissues subjected to wide range of PEF frequencies (that is,f = 0.1 to 5 kHz).
Effect of pulse frequency on cytoplasmic streamingA representative onion epidermis is shown in Figure 8A. The
arrows illustrate the direction of cytoplasmic streaming inside onecell at the particular plane of focus, while the boxes indicate typi-cal locations in which the streaming speed was measured. Becauseboth the magnitude and direction of cytoplasmic streaming variesthroughout each cell, multiple locations were used for measuringthe speed to obtain spatially averaged quantities. Observed flowdirections included unidirectional streaming, fountain streaming(in which the motion near the central axes of the cell is oppositeto that near the periphery), and spiral rotational streaming. Here,the streaming speed was calculated as the observed particle dis-placement per unit time interval for all plastids moving through a
given box. The resulting speeds as a function of time were thenaveraged over 3 boxes each in 5 different cells.
The normalized cytoplasmic streaming speed profiles for tissuestreated with different PEF pulse frequencies are shown in Fig-ure 8B. Here, time equal zero indicates application of the first PEFpulse. Several features of the data are notable. First, the magnitudeof the observed streaming velocities prior to PEF, approximately5 μm/s, is consistent with previous observations where velocitiesranged from 1 to 100 μm/s, with 10 μm/s reported as a typicalspeed (Pickard 2003). This observation suggests that the oniontissues used here are typical with respect to cytoplasmic stream-ing. Second, the streaming speed in the absence of PEF (that is,the control) was approximately constant in time, throughout theobservation period (130 s). This observation indicates that anychanges observed in cytoplasmic streaming speed subsequent toPEF are indeed due to PEF rather than some other effect (that is,microscope illumination).
In contrast to the control, samples treated with PEF showeda dramatic decline in the speed of cytoplasmic streaming. Weemphasize that no noticeable change in the direction of the cyto-plasmic streaming during or after application of PEF was observed;
Figure 8–Cytoplasmic streaming of onionepidermis. (A) Representative micrograph ofonion epidermis taken with a phase contrastmicroscope at 20× objective magnification.Scale bar is 100 μm. Square boxes(approximately 60 × 60 pixels2) representareas selected for analyzing cytoplasmicstreaming speed. Small arrows illustratedirection of cytoplasmic streaming inside thecell at the particular plane of focus. The largearrow indicates direction of the applied field.The enlarged diagram to the left illustrates theinterface between 2 adjacent cells, both ofwhich are surrounded by a cell wall and plasmamembrane, with the pectin-rich middle lamellabetween them. The cell on the left has beenpermeabilized by PEF; the cell on the right hasnot. Cytoplasmic streaming may enhance themovement of relatively high-conductivity fluid,originating inside the cell in the cytoplasm,through pores in the plasma membrane inducedby PEF, and into the lower conductivityextracellular space or apoplasm. (B) Normalizedcytoplasmic streaming speed profile of onionepidermis treated with PEF (E = 333V/cm, ti =100μs, n = 10 pulses) at different frequencies(that is control, 0.1 Hz, 1 Hz, 100 Hz, and 1kHz). Pulsed electric fields were applied at t = 0s; no PEF applied from t = −30 to 0 s. Smallarrows on top of the plot indicate time that PEFwas applied; these arrows were color codedaccording to each frequency of treatment. Totaltreatment time (ttotal) varies fromapproximately 0.009 s for 1 kHz treatment toapproximately 90 s for 0.1 Hz treatment. “t50” istime that the streaming speed reduces to 50%of its initial value.
Vol. 76, Nr. 1, 2011 � Journal of Food Science E107

E:FoodEngineering&PhysicalProperties
Permeabilization of onion by PEF . . .
the observed speed simply decayed with time following PEF. Therate of decline, however, was sensitive to the PEF frequency. Forthe low frequency of 0.1 Hz PEF, the average cytoplasmic stream-ing speed gradually dropped over a period of approximately 30 sto below 80% of its original streaming speed; the measured half-life was t50 = 13.7 s. However, at higher pulse frequencies, thatis, 1 Hz, 100 Hz, and 1 kHz, streaming dropped close to zeroalmost instantaneously; in these cases t50 approximately 3 s. Theseresults were highly reproducible; similar trends with respect topulse frequency were observed for at least 3 trial replicates (datanot shown). Significantly, the transition between rapid speed de-cay and gradual speed decay occurs at the same frequency range(between 1 and 0.1 Hz, respectively) where the amount of cellulardamage increases dramatically (as shown in Figure 2 to 6). WhenPEF at 0.1 Hz was applied, severe tissue rupture was observedas indicated by higher conductivity disintegration index, percention leakage and percent weight loss, significant changes in texturecharacteristics, and decreases in the number of viable cells (redarea in viability staining experiment) in comparison to the oniontissue treated at higher pulse frequencies.
It is widely accepted that the role of cytoplasmic streaming inplant cells is to facilitate mass transport by providing a convec-tive driving force that is faster than molecular diffusion drivenby concentration gradients (Pickard 2003, Goldstein and others2008). Although previous researchers have reported that cytoplas-mic streaming is affected by the application of an electrical cur-rent through the tissue (Hill 1941; Kishimoto and Akabori 1959;Tazawa and Kishimoto 1968; Simons 1981; Wong and Allen 1985;Angnes von and others 1995; Shimmen 2007), the strong corre-lation between persistence of cytoplasmic streaming and overalldamage to the tissue as a function of frequency has not beenpreviously reported.
The correlation between persistence of cytoplasmic streamingand increased damage at low frequencies suggests that cytoplasmicstreaming might play a significant role in increasing the cellulardamage at sufficiently low PEF frequencies. Cytoplasmic streamingmay enhance the movement of relatively high-conductivity fluid,originating inside the cell in the cytoplasm, through pores in theplasma membrane induced by PEF, and into the lower conductivityextracellular space or apoplasm, as illustrated in Figure 8A. Increas-ing the conductivity of the extracellular fluid around ruptured cellsmay create preferable paths for the next pulse to travel and reachmore intact cells. This fluid movement may also accelerate thephysical damage to the cell membrane initiated by electropora-tion. PEF at high pulse frequencies results in an abrupt cessationof cytoplasmic streaming, thus there is no longer movement of thefluid within the cytoplasm. Moreover, this abrupt cessation mayallow resealing of the cell membrane to begin, which may explainthe observation of more intact cells present in onion tissue treatedat higher frequency than in the tissue treated at lower frequency.
An approximate scaling analysis based on a cytoplasmic stream-ing convective time scale (td) yields a critical frequency similarto that observed experimentally. Given the average cytoplasmicstreaming speed u and the characteristic length of an onion epi-dermal cell L, the critical pulse frequency may be estimated as,
fcrit,c = u/L (5)
This frequency represents the (inverse) amount of time neces-sary for the flow to carry material a distance L. Substitution ofthe appropriate values (u approximately 5 μm/s, L approximately100 μm) yields a critical frequency of about 0.05 Hz for onion
epidermis (or a characteristic convective time of 20 s) that is consis-tent with our observed critical frequency of approximately 0.1 Hzin the damage characterization experiments.
It is unlikely that the fluid flow penetrates very effectively intothe apoplasm, given the high concentration of pectin in the middlelamella and the cell wall itself, both of which impede bulk fluidflow. Thus, the role of cytoplasmic streaming is more likely as ameans of enhancing the rate of diffusive flux into the apoplasmfollowing membrane rupture. In other words, the cytoplasmicstreaming helps deliver additional ions to the edge of the cellwall near the site of membrane rupture, thus helping maintaina maximal concentration gradient and maximizing the diffusiveflux. A diffusive time scale can be estimated as
fcrit,d = D/ l 2 (6)
where D is the effective diffusion coefficient of ion in cell wall,which is in an order-of-magnitude of 10−8 cm2/s (Meychik andothers 2003), and l is the cell wall thickness, which is approxi-mately 1 to 3 μm for onion epidermis (Lecain and others 1999;Hepworth and Bruce 2004). The quantity f crit,d represents theinverse amount of time necessary for ions to diffuse across theapoplasm. Substitution of characteristic values yields a critical fre-quency of about 0.1 Hz (or a characteristic diffusion time of 10s) that is in the same order-of-magnitude as the critical frequencybased on convective time scale. Thus, the PEF at a low frequencyof 0.1 Hz has the appropriate time period between the pulsesfor the ions to be redistributed by both convection and diffusionfrom one side of a permeabilized cell to the other side of thecell and through the apoplasm to adjacent intact cells, as sketchedin Figure 8A. When the next pulse is applied the more conduc-tive pathway has been established, thereby promoting damage toadjacent intact cells. The same argument applies for even lower fre-quencies (0.01 Hz or lower). For frequencies higher than 0.1 Hz,cytoplasmic streaming stops and the time periods are too short forthe redistribution of the ions to change the conductive pathwayto adjacent intact cells.
Reduction of energy consumption by selecting effectivepulse frequency
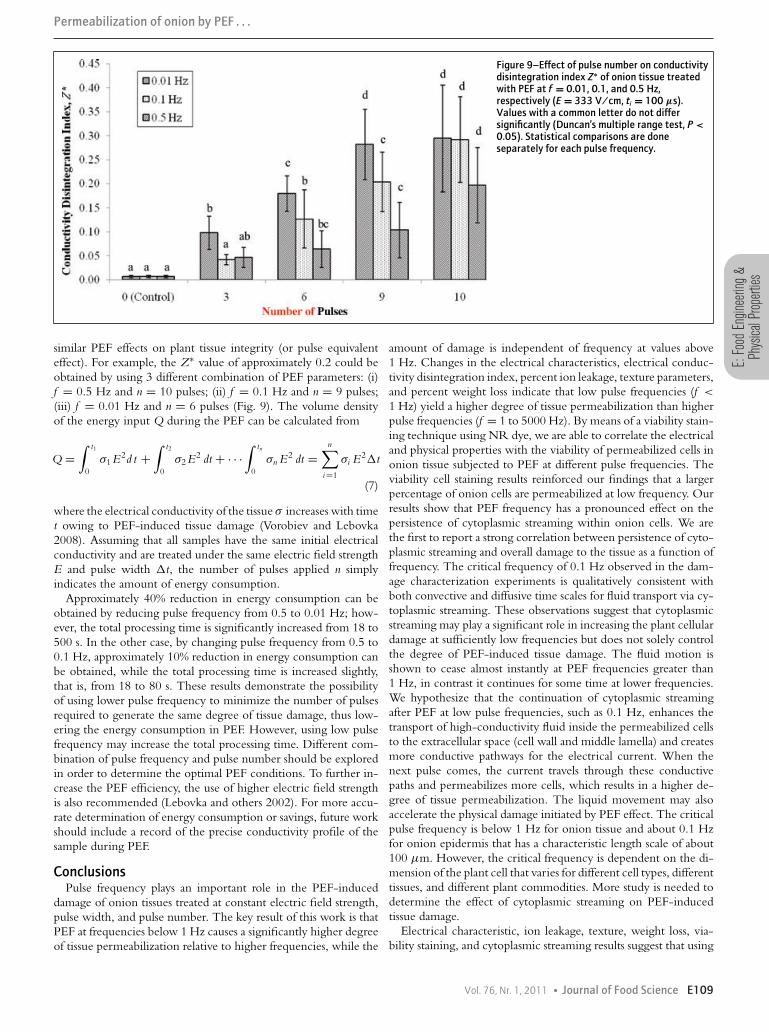
Selection of an optimal effective pulse frequency in combinationwith number of pulses applied may allow one to reduce the energyrequirements of PEF. Figure 9 shows the effect of pulse numberon integrity of onion tissues treated with PEF at different pulsefrequencies (f = 0.01, 0.1, and 0.5 Hz) at E = 333 V/cm andti = 100 μs. For all frequency levels used in this study, pulsenumber significantly affects the Z∗ value of PEF-treated oniontissues (P < 0.05). The lower the number of pulses, the lower thedegree of PEF-induced tissue damage. However, at f = 0.01 Hz,pulse number could be reduced from 10 to 9 without causinga significant reduction in degree of tissue permeabilization, asindicated by the Z∗ values (P < 0.05). Using the same electric fieldstrength of 333 V/cm, PEF at lower pulse frequencies, for example,f = 0.01 or 0.1 Hz, for only 10 pulses results in approximatelythe same level (approximately 80%) of ion leakage as that at f =1 Hz for 100 pulses as reported by Ersus and Barrett (2010). Notethat the total processing time is the same, that is, t = 90 s, for f= 0.1 Hz for 10 pulse and f = 1 Hz for 100 pulses, but the totaltime in which an electric field is applied to the sample is 10 timesless in the case of the lower frequency application.
To optimize the energy consumption in PEF, different combina-tions of pulse frequency and pulse number could be used to obtain
E108 Journal of Food Science � Vol. 76, Nr. 1, 2011
E:Fo
odEn
ginee
ring&
Phys
icalP
ropert
ies
Permeabilization of onion by PEF . . .
Figure 9–Effect of pulse number on conductivitydisintegration index Z∗ of onion tissue treatedwith PEF at f = 0.01, 0.1, and 0.5 Hz,respectively (E = 333 V/cm, ti = 100 μs).Values with a common letter do not differsignificantly (Duncan’s multiple range test, P <0.05). Statistical comparisons are doneseparately for each pulse frequency.
similar PEF effects on plant tissue integrity (or pulse equivalenteffect). For example, the Z∗ value of approximately 0.2 could beobtained by using 3 different combination of PEF parameters: (i)f = 0.5 Hz and n = 10 pulses; (ii) f = 0.1 Hz and n = 9 pulses;(iii) f = 0.01 Hz and n = 6 pulses (Fig. 9). The volume densityof the energy input Q during the PEF can be calculated from
Q =∫ t1
0σ1 E2d t +
∫ t2
0σ2 E2 dt + · · ·
∫ tn
0σn E2 dt =
n∑i=1
σi E2�t
(7)
where the electrical conductivity of the tissue σ increases with timet owing to PEF-induced tissue damage (Vorobiev and Lebovka2008). Assuming that all samples have the same initial electricalconductivity and are treated under the same electric field strengthE and pulse width �t, the number of pulses applied n simplyindicates the amount of energy consumption.
Approximately 40% reduction in energy consumption can beobtained by reducing pulse frequency from 0.5 to 0.01 Hz; how-ever, the total processing time is significantly increased from 18 to500 s. In the other case, by changing pulse frequency from 0.5 to0.1 Hz, approximately 10% reduction in energy consumption canbe obtained, while the total processing time is increased slightly,that is, from 18 to 80 s. These results demonstrate the possibilityof using lower pulse frequency to minimize the number of pulsesrequired to generate the same degree of tissue damage, thus low-ering the energy consumption in PEF. However, using low pulsefrequency may increase the total processing time. Different com-bination of pulse frequency and pulse number should be exploredin order to determine the optimal PEF conditions. To further in-crease the PEF efficiency, the use of higher electric field strengthis also recommended (Lebovka and others 2002). For more accu-rate determination of energy consumption or savings, future workshould include a record of the precise conductivity profile of thesample during PEF.
ConclusionsPulse frequency plays an important role in the PEF-induced
damage of onion tissues treated at constant electric field strength,pulse width, and pulse number. The key result of this work is thatPEF at frequencies below 1 Hz causes a significantly higher degreeof tissue permeabilization relative to higher frequencies, while the
amount of damage is independent of frequency at values above1 Hz. Changes in the electrical characteristics, electrical conduc-tivity disintegration index, percent ion leakage, texture parameters,and percent weight loss indicate that low pulse frequencies (f <
1 Hz) yield a higher degree of tissue permeabilization than higherpulse frequencies (f = 1 to 5000 Hz). By means of a viability stain-ing technique using NR dye, we are able to correlate the electricaland physical properties with the viability of permeabilized cells inonion tissue subjected to PEF at different pulse frequencies. Theviability cell staining results reinforced our findings that a largerpercentage of onion cells are permeabilized at low frequency. Ourresults show that PEF frequency has a pronounced effect on thepersistence of cytoplasmic streaming within onion cells. We arethe first to report a strong correlation between persistence of cyto-plasmic streaming and overall damage to the tissue as a function offrequency. The critical frequency of 0.1 Hz observed in the dam-age characterization experiments is qualitatively consistent withboth convective and diffusive time scales for fluid transport via cy-toplasmic streaming. These observations suggest that cytoplasmicstreaming may play a significant role in increasing the plant cellulardamage at sufficiently low frequencies but does not solely controlthe degree of PEF-induced tissue damage. The fluid motion isshown to cease almost instantly at PEF frequencies greater than1 Hz, in contrast it continues for some time at lower frequencies.We hypothesize that the continuation of cytoplasmic streamingafter PEF at low pulse frequencies, such as 0.1 Hz, enhances thetransport of high-conductivity fluid inside the permeabilized cellsto the extracellular space (cell wall and middle lamella) and createsmore conductive pathways for the electrical current. When thenext pulse comes, the current travels through these conductivepaths and permeabilizes more cells, which results in a higher de-gree of tissue permeabilization. The liquid movement may alsoaccelerate the physical damage initiated by PEF effect. The criticalpulse frequency is below 1 Hz for onion tissue and about 0.1 Hzfor onion epidermis that has a characteristic length scale of about100 μm. However, the critical frequency is dependent on the di-mension of the plant cell that varies for different cell types, differenttissues, and different plant commodities. More study is needed todetermine the effect of cytoplasmic streaming on PEF-inducedtissue damage.
Electrical characteristic, ion leakage, texture, weight loss, via-bility staining, and cytoplasmic streaming results suggest that using
Vol. 76, Nr. 1, 2011 � Journal of Food Science E109
E:FoodEngineering&PhysicalProperties
Permeabilization of onion by PEF . . .
lower pulse frequency can minimize the number of pulses requiredto achieve a desired amount of permeabilization, thus lowering thetotal energy consumption. The authors suggest the use of PEF atlow frequencies (f < 1 Hz) for increased yield and improved effi-ciency of juice extraction and dehydration processes in food plantmaterials. Different combinations of pulse frequency and numberof pulses should be explored in order to determine the optimalPEF conditions, since using low pulse frequency may increase thetotal processing time.
AcknowledgmentsThe authors would like to thank Professor Michael Delwiche,
Ken Shaw, James Gage, and Loan-anh Nguyen for their invaluablesuggestions and assistance on design and fabrication of PEF systemsat UC Davis. Our appreciation is also extended to Professor JudyJernstedt for providing us tips and tools for onion tissue imagingand putting us on track of cytoplasmic streaming, and to Dr. MariaE. Gonzalez for development of the onion cell viability stainingmethod using neutral red dye.
ReferencesAde-Omowaye BIO, Angersbach A, Eshtiaghi NM, Knorr D. 2000. Impact of high intensity
electric field pulses on cell permeabilization and as pre-processing step in coconut processing.Innov Food Sci Emerg Technol 1(3):203–9.
Angersbach A, Knorr D. 1997. High intensity electric field pulses as pre-treatment for affectingdehydration characteristics and rehydration properties of potato cubes. Nahrung 41:194–200.
Angersbach A, Heinz V, Knorr D. 2000. Effects of pulsed electric fields on cell membranes inreal food systems. Innov Food Sci Emerg Technol 1:135–49.
Angnes von K, Tewinkel M, Wingender R, Volkmann D, Schnabl H. 1995. Intracellularmovements and reorganization of electrically fused sunflower protoplasts. Int J Plant Sci156(6):764–73.
Arevalo P, Ngadi MO, Raghavan GSV, Bazhal MI. 2003. Color and conductivity changes inapple and potato slices subjected to pulsed electric field treatment. Paper presented at theASAE annual international meeting, July 27–30, 2003, Las Vegas, Nev.
Aronsson K, Ronner U, Borch E. 2005. Inactivation of Escherichia coli, Listeria innocua and Saccha-romyces cerevisiae in relation to membrane permeabilization and subsequent leakage of intracel-lular compounds due to pulsed electric field processing. Inter J Food Microbiol 99(1):19–32.
Asavasanti S, Ersus S, Ristenpart W, Stroeve P, Barrett DM. 2010. Critical electric field strengthsof onion tissues treated by pulsed electric fields. J Food Sci 75(7):E433–43.
Azencott HR, Peter GF, Prausanitz MR. 2007. Influence of the cell wall on intracellular deliveryto algal cells by electroporation and sonication. Ultrasound Med Biol 33(11):1805–17.
Bajgai TR, Hashinaga F. 2001. High electric field drying of Japanese radish. Drying Technol19(9):2291–302.
Bazhal MI, Lebovka NI, Vorobiev EI. 2001. Pulsed electric field treatment of apple tissue duringcompression for juice extraction. J Food Eng 50(3):129–39.
Bazhal MI, Lebovka NI, Vorobiev EI. 2003a. Optimization of pulsed electric field strength forelectroplasmolysis of vegetable tissues. Biosys Eng 86:339–45.
Bazhal MI, Ngadi MO, Raghavan VGS. 2003b. Influence of pulsed electroplazmolysis on theporous structure of apple tissue. Biosys Eng 86(1):51–7.
Bazhal MI, Ngadi MO, Raghavan VGS, Nguyen DH. 2003c. Textural changes in apple tissueduring pulsed electric field treatment. J Food Sci 68(1):249–53.
Bilska AO, DeBruin KA, Krassowska W. 2000. Theoretical modeling of the effects of shockduration, frequency, and strength on the degree of electroporation. Bioelectrochem 51:133–43.
Bourne M. 2002. Food texture and viscosity: concept and measurement. 2nd ed. Calif.: AcademicPress. 416 p.
Bruhn RE, Pedrow PD, Olsen RG, Barbosa-Canovas GV, Swanson BG. 1997. Electrical envi-ronment surrounding microbes exposed to electric fields. IEEE Trans Dielect Elect Insulation.4(6):806–12.
Coster HGL. 1965. A quantitative analysis of the voltage–current relationships of fixed chargemembranes and the associated property of “punch through”. Biophy J 5:669–86.
De Andrade ET, Correa PC, Martins JH, Alvarenga EM. 1999. Evaluation of mechanical damageto bean seeds using electrical conductivity. Rev Bras de Engenharia Agricola e Ambiental3:54–60.
De Vito F, Ferrari G, Lobovka NI, Shynkaryk NV, Vorobiev E. 2008. Pulse duration andefficiency of soft cellular tissue disintegration by pulsed electric fields. Food Bioprocess Technol1:307–13.
Ersus S, Barrett DM. 2010. Determination of membrane integrity in onion tissues treated bypulsed electric fields: use of microscopic images and ion leakage measurements. Innov FoodSci Emerg Technol 11(4):598–603.
Evrendilek GA, Zhang QH. 2005. Effects of pulse polarity and pulse delaying time on pulsedelectric fields-induced pasteurization of E. coli O157:H7. J Food Eng 68(2):271–6.
Fincan M, Dejmek P. 2002. In situ visualization of the effect of a pulsed electric field on planttissue. J Food Eng 55(3):223–30.
Fincan M, Dejmek P. 2003. Effect of osmotic pretreatment and pulsed electric field on theviscoelastic properties of potato tissue. J Food Eng 59(2–3):169–75.
Goldstein RE, Tuval I, Van De Meent JW. 2008. Micrifluidics of cytoplasmic streaming and itsimplications for intracellular transport. PNAS 105(10):3663–7.
Goneli ALD, Correa PC, Resende O, ReisNeto SA. 2007. Electrical conductivity for qualityevaluation of popcorn kernels subjected to mechanical damage. Biosys Eng 96:361–7.
Gonzalez ME, Jernstedt JA, Slaughter DC, Barrett DM. 2010a. Influence of cell integrityon textural properties of raw, high pressure, and thermally processed onions. J Food Sci75(7):E409–16.
Gonzalez ME, Anthon GE, Barrett DM. 2010b. Onion cells after high pressure and thermalprocessing: comparison of membrane integrity changes using different analytical methods andimpact on tissue texture. J Food Sci 75:E426–32.
Hepworth DG, Bruce DM. 2004. Relationships between primary plant cell wall architectureand mechanical properties for onion bulb scale epidermal cells. J Texture Stud 35:586–602.
Hill SE. 1941. The relation between protoplasmic streaming and the action potential in Nitellaand Chara. Biol Bull 81(2):296.
Horobin RW, Kiernan JA. 2002. Conn’s biological stains: a handbook of dyes, stains and flu-orochromes for use in biology and medicine. 10th ed. Trowbridge: Cromwell Press. 576p.
Kanduser M, Miklavcic D. 2008. Electroporation in biological cell and tissue: an overview.In: Vorobiev E, Lebovka N, editors. Electrotechnologies for extraction from food plants andbiomaterials. New York: Springer. p 1–38.
Kishimoto U, Akabori H. 1959. Protoplasmic streaming of an inernodal cell of Nitella flexilis: itscorrelation with electric stimulus. J Gen Physiol 42(6):1167–83.
Knorr D, Angersbach A. 1998. Impact of high-intensity electric field pulses on plant membranepermeabilization. Trends Food Sci Technol 9(5):185–91.
Kulshrestha S, Sastry SK. 2003. Frequency and voltage effects in enhanced diffusion duringmoderated electric field (MEF) treatment. Innov Food Sci Emerg Technol 4:189–94.
Kulshrestha SA, Sarang S, Loghavi L, Sastry SA. 2008. Moderate electrothermal treatments ofcellular tissues. In: Vorobiev E, Lebovka N, editors. Electrotechnologies for extraction fromfood plants and biomaterials. New York: Springer. p 83–94.
Kuo S, Parkin KL. 1989. Chilling injury in cucumbers (Cucumis sativa L.) associated with lipidperoxidation as measured by ethane evolution. J Food Sci 54:1488–91.
Lebovka NI, Bazhal MI, Vorobiev EI. 2000. Simulation and experimental investigation of foodmaterial breakage using pulsed electric field treatment. J Food Eng 44(4):213–23.
Lebovka NI, Bazhal MI, Vorobiev EI. 2001. Pulsed electric field breakage of cellular tissues:visualization of percolative properties. Innov Food Sci Emerg Technol 2:113–25.
Lebovka NI, Bazhal MI, Vorobiev EI. 2002. Estimation of characteristic damage time of foodmaterials in pulsed-electric fields. J Food Eng 54(4):337–46.
Lebovka NI, Praporscic I, Vorobiev EI. 2003a. Enhanced expression of juice from soft vegetabletissues by pulsed electric fields: consolidation stages analysis. J Food Eng 59:309–17.
Lebovka NI, Praporscic I, Vorobiev EI. 2003b. Enhanced leaching from sugar beet cossettes bypulsed electric field. J Food Eng 59:405–12.
Lebovka NI, Praporscic I, Vorobiev E. 2004. Combined treatment of apples by pulsed electricfields and by heating at moderate temperature. J Food Eng 65:211–7.
Lebovka NI, Praporscic I, Ghnimi S, Vorobiev E. 2005. Temperature enhanced electroporationunder the pulsed electric field treatment of food tissue. J Food Eng 69:177–84.
Lebovka NI, Shynkaryk NV, Vorobiev E. 2007. Pulsed electric field enhanced drying of potatotissue. J Food Eng 78(2):606–13.
Lecain S, Ng A, Parker ML, Smith AC, Waldron KW. 1999. Modification of cell-wall polymersof onion waste–Part 1.effect of pressure-cooking. Carbohydrate Polymers 38:59–67.
Loghavi L, Sastry SK, Yousef AE. 2008. Effect of moderate electric field frequency on growthkinetics and metabolic activity of Lactobacillus acidophilus. Biotechnol Prog 24: 148–53.
Meychik NR, Yermakov IP, Prokoptseva OS. 2003. Diffusion of an organic cation into rootcell walls. Biochem (Moscow) 68(7):760–71.
Milczarek RR, Saltveit ME, Garvey TC, McCarthy MJ. 2009. Assessment of tomato pericarpmechanical damage using multivariate analysis of magnetic resonance images. Postharvest BiolTechnol 52:189–95.
Murray MB, Cape JN, Fowler D. 1989. Quantification of frost damage in plant tissues by ratesof electrolyte leakage. New Phytol 113:307–11.
Pickard WF. 2003. The role of cytoplasmic streaming in symplastic transport. Plant Cell Environ26:1–15.
Palta J, Levitt J, Stadelmann EJ. 1977a. Freezing injury in onion bulb cells. Plant Physiol60:398–401.
Palta J, Levitt J, Stadelmann EJ. 1977b. Freezing tolerance of onion bulbs and significance offreeze-induced tissue infiltration. Cryobiology 14:614–9.
Pavlin M, Kanduser M, Rebersek M, Pucihar G, Hart FX, Magjarevic R, Miklavcic D. 2005.Effect of cell electroporation on the conductivity of a cell suspension. Biophy J 88:4378–90.
Picart L, Cheftel JC. 2003. Pulsed electric fields. In: Zeuthen P, Bogh-Sorensen L, editors. Foodpreservation techniques. Fla.: CRC Press. p 57–68.
Qin B, Barbosa-Canovas GV, Swanson BG, Pedrow PD, Olsen RG. 1998. Inactivating mi-croorganisms using a pulsed electric field continuous treatment system. IEEE Trans Ind Appl34(1):43–50.
Rastogi NK, Eshtiaghi MN, Knorr D. 1999. Accelerated mass transfer during osmotic dehydra-tion of high intensity electrical field pulse pre-treated carrots. J Food Sci 64:1020–1023.
Saltveit ME. 2002. The rate of ion leakage from chilling-sensitive tissue does not immediatelyincrease upon exposure to chilling temperatures. Postharvest Biol Technol 26:295–304.
Shackel KA, Greve C, Labavitch, JM, Ahmadi H. 1991. Cell turgor changes associated withripening in tomato pericarp tissue. Plant Physiol 97:814–16.
Shimmen T. 2007. The sliding theory of cytoplasmic streaming: fifty years of progress. J PlantResearch 120:31–43.
Simons PJ. 1981. The role of electricity in plant movement. New Phytol 87(1):11–37.Szczesniak AS. 1998. The meaning of textural characteristics of crispiness. J Texture Stud
19:51–59.Taiwo KA, Angersbach A, Knorr D. 2002. Influence of high intensity electric field pulses and
osmotic dehydration on the rehydration characteristics of apple slices at different temperatures.J Food Eng 52(2):185–92.
Taiz L, Zeiger E. 2006. Plant physiology. 4th ed. Mass.: Sinauer Assoc., Inc. 764 p.Tazawa M, Kishimoto U. 1968. Cessation of cytoplasmic streaming of Chara internodes during
action potential. Plant Cell Physio 9:361–68.Tirlapur UK, Konig K. 2002. Femtosecond near-infrared laser pulses as a versatile non-
invasive tool for intra-tissue nanoprocessing in plants without compromising viability. Plant J31(3):365–74.
Tsong TY. 1992. Time sequence of molecular events in electroporation. Chapter 4. In: ChangDC, Chassey BM, Saunders JA, Sowers AE, editors. Guide to electroporation and electrofu-sion. San Diego: Academic Press. p 47–61.
E110 Journal of Food Science � Vol. 76, Nr. 1, 2011
E:Fo
odEn
ginee
ring&
Phys
icalP
ropert
ies
Permeabilization of onion by PEF . . .
Vasquez-Tello A, Zuily-Fodil Y, Pham Thi AT, Viera da Silva JB. 1990. Electrolyte and Pileakages and soluble sugar content as physiological tests for screening resistance to water stressin Phaseolus and Vigna species. J Exp Bot 41(228):827–32.
Verchot-Lubicz J, Goldstein RE. 2010. Cytoplasmic streaming enables the distribution ofmolecules and vesicles in large plant cells. Protoplasma 240: 99–107.
Vernhes MC, Cabanes PA, Teissie J. 1999. Chinese hamster ovary cells sensitivity to localizedelectrical stresses. Bioelectrochem Bioenerg 48:17–25.
Vernhes MC, Benichiu A, Pernin P, Cananes PA, Teissie J. 2002. Elimination offree-living amoebae in fresh water with pulsed electric fields. Water Res 36:3429–38.
Vorobiev E, Lebovka N. 2008. Pulsed-electric-fields-induced effects in plant tissues. In: VorobievE, Lebovka N, editors. Electrotechnologies for extraction from food plants and biomaterials.New York: Springer. p 39–81.
Weaver JC, Chizmadzhev YA. 1996. Theory of electroporation: a review. BioelectrochemBioenerg 41(2):135–60.
Wong LS, Allen NS. 1985. Effects of radiofrequency electric fields on cytoplasmic streaming inNitella. Environ Exp Bot 25(1):17–22.
Zimmermann U, Pilwat G, Riemann F. 1974. Dielectric breakdown of cell membranes. BiophyJ 14;881–99.
Zimmermann U. 1986. Electric breakdown, electropermeabilization and electrofusion. RevPhysiol Biochem Pharmacol 105;176–256.
Supporting InformationThe following supporting information is available for this article.
Video 1: PEF-0.1Hz-HDVideo 2: PEF-1kHz-HD
Please note: Wiley-Blackwell is not responsible for the content orfunctionality of any supporting materials supplied by the authors.Any queries (other than missing material) should be directed tothe corresponding author for the article.
Vol. 76, Nr. 1, 2011 � Journal of Food Science E111