jennifer a. welsh and helen l. berry national centre …...1 social capital and mental health and...
TRANSCRIPT
1
Social capital and mental health and well-being
Jennifer A. Welsh and Helen L. Berry National Centre for Epidemiology and Population Health, The Australian
National University Paper presented at the Biennial HILDA Survey Research Conference 16-17 July 2009
ABSTRACT
Social capital has been linked to a number of positive outcomes, including for mental health. However, few studies have examined the role of social capital and mental health and wellbeing concurrently. The aim of this study was to use a nationally representative dataset to examine the relationship between structural and cognitive components of social capital and mental health and aspects of subjective well-being. Data were taken from wave 6 of he Household, Income and Labour Dynamics of Australia (HILDA) study (N=11,709). A twelve-item short form of the Australian Community Participation Questionnaire (ACPQ) provided the measures for structural social capital and measures of sense of belonging, tangible support, trust and reciprocity provided the cognitive social capital measures. Mental health was measured using the transformed sub-scale of the SF-36, and subjective well-being was measured with a range of satisfaction with life items. Our results demonstrated that both structural and cognitive aspects of social capital were related to both mental health and subjective well-being. We also found evidence of strong gender differences in this relationship. For men, social capital was more strongly related to mental health, but for women, social capital was a better predictor of satisfaction with life in general. These findings could not be accounted for by age, poverty, living alone, indigenous status, being responsible for dependents, or education level. Understanding that social capital may have different roles for men and women and that it has the potential to foster well-being as well as protect against poor mental health is important for service and policy development in this area.

2
There is a growing body of evidence to suggest that social capital is associated with a
broad range of social (Messner, Baumer, & Rosenfeld, 2004), economic (Woodhouse,
2006) and health outcomes (Kawachi, Subramanian, & Kim, 2008a). Social capital has
been associated with many health outcomes, including specific diseases such as
cardiovascular disease (Scheffler, Brown, Syme, Kawachi, Tolstykh, & Iribarren, 2008),
obesity and diabetes (Holtgrave & Crosby, 2006), as well as suicide and mortality rates
(Lochner, Kawachi, Brennan, & Buka, 2003). There is evidence to suggest that social
capital is more strongly related to mental health than it is to physical health (Berry &
Welsh, under review).
It is also widely agreed that the research on social capital and mental health is largely
based on inconsistent and problematic data. In the most comprehensive literature review
to date, De Silva and colleagues systematically reviewed twenty-one studies which
reported on the relationship between social capital and mental health (De Silva,
McKenzie, Harpham, & Huttly, 2005). The results of their review suggested that,
although social capital was loosely related to improved mental health, the evidence for
this relationship was inconsistent. Their results revealed that the strength and direction of
the relationship was dependent on the type of social capital (structural or cognitive) and
the level of measurement (individual or ecological level). These findings lead the authors
to concluded that ‘[c]urrent evidence is inadequate to inform the development of specific
social capital interventions to combat mental illness’ (De Silva et al., 2005 p.619).
The social capital literature suffers from two crucial problems (i) problems associated
with definitions and measurement and (ii) issues relating to a narrow approach to
defining mental health.
The social capital literature is plagued by problems of poor conceptualisation and
measurement (Falzer, 2007). Social capital has been termed an ‘elusive’ (Kawachi,
Subramanian, & Kim, 2008b), multidisciplinary and multifaceted concept and has proven
to be notoriously hard to define. There are numerous and often competing definitions

3
available, with differences based on theoretical traditions, levels of measurement and the
conceptual framework employed. As a result social capital has suffered from conceptual
confusion (Falzer, 2007), overuse, and is at risk of becoming an umbrella term (Portes,
1998).
These conceptual problems have weakened the measurement of social capital because it
is impossible to operationalise a concept that is not properly defined. Further,
measurement is often compromised by the use of ad hoc indicators which were not
designed to measure social capital. Measures are even sometimes be based on one or two
questionnaire items (see for example Lindstrom & Mohseni, 2009), which is problematic:
social capital is a multifaceted concept which should not be measured with so few items
(Kawachi et al., 2008b). While there have been attempts to develop measures of social
capital which encapsulate the complexity of the concept, few have been based in a solid
conceptual foundation needed for the task (Nieminen, Martelin, Koskinen, Simpura,
Alanen, Härkänen et al., 2008). As a result, the current body of research is often difficult
to synthesise and so, despite the growing number of papers, inconsistencies and
unknowns remain unresolved.
While social capital has proven difficult to define, it is generally agreed that it is
comprised of two components: “what people do” and “what people feel” or structural and
the cognitive components respectively (Harpham, Grant, & Thomas, 2002). In this study,
we use Putnam’s (2000) definition of social capital as (i) patterns of community
participation and (ii) social cohesion created by participation. Participation is the
structural component of social capital and cohesion is the cognitive component. A key
feature of this definition of social capital is the notion that the structural and cognitive
components of social capital are causally related. As shown in Figure 1: increased
community participation is associated with higher levels of social cohesion, and these
two combine to create social capital which, in turn, supports advantageous health
outcomes. Social capital may be conceptualised and measured at the individual or
collective level (De Silva et al., 2005). When measured at the individual level it may be
termed “personal social capital” (Berry & Rickwood, 2000).

4
With respect to the narrow understanding of mental health, most of the research in this
area examines the relationship between social capital and poor mental health (such as
psychological distress, depression or anxiety). Yet, there is more to mental health than
poor outcomes. Mental health can be conceptualised as having a well-being aspect, with
beneficial outcomes that flow when positive aspects of life are nurtured. The World
Health Organisation defines mental health as ‘[a] state of complete physical, mental and
social well-being, and not merely the absence of disease’ [World Health Organisation,
2005 #5407p. XVIII]. In Australia, too, mental health has been defined with positive
aspects as central to the theme: ‘the ability to think and learn, and the ability to
understand and live with [one’s] own emotions and the reaction of others’ (Herrman,
2001p.710). Research into the positive aspects of mental health focus on terms such as
happiness, satisfaction with life or quality of life (for an overview, see Diener, 1984).
While there is still debate about whether these terms can be used synonymously, it is
generally agreed that they all relate to the positive side of mental health – subjective well-
being.
There are few studies which have examined social capital and subjective well-being. In
perhaps the most comprehensive study, Helliwell and Putnam (2004) demonstrated that a
broad range of social capital indicators, such as contact with friends and neighbours,
community involvement and trust were associated with increased well-being across a
number of datasets and populations.
AIMS OF THE CURRENT STUDY The aims of this study were to use a nationally representative dataset, controlling for a
range of socio-demographic factors, to (i) examine the relationship between mental health
and aspects of satisfaction with life (ii), examine the relationship between both structural
and cognitive aspects of social capital and mental health and well-being and (iii)
controlling for physical health, assess the independent contributions of structural and
cognitive components of social capital in explaining variance in mental health and
satisfaction with life.

5
Methods
THE HILDA SURVEY Data for this study were taken from Wave 6 of the Household, Income and Labour
Dynamics of Australia (HILDA) Survey (Wooden, Freidin, & Watson, 2002). The
HILDA Survey is a nationally representative panel survey of Australian adults aged 15
years and over. Four separate survey instruments ask respondents to report on a large
range of aspects of life, including labour market and family dynamics, health and
socioeconomic information. One of these questionnaires is a self-complete questionnaire
in which respondents report on their health and provide psychosocial information. Data
are collected annually, and each wave of the Self-Completion Questionnaire includes a
special focus supplement that varies from year to year; included in Wave 6 were items
measuring personal social capital. All waves of the HILDA Survey have included items
tapping some very limited aspects of social capital (contact with family and friends,
membership of clubs, volunteering activity, trust,) and related constructs, such as social
support and neighbourhood cohesion. Additional items included in the Wave 6 Self-
Completion Questionnaire built on this base.
Participants and procedures. Wave 1 included a total of 13,969 respondents. Attrition,
and the addition of new entrants in waves 2-6, resulted in a 12,905 respondents in Wave
6. Data for this study were taken mostly from the Self-Completion Questionnaire for
Wave 6. However, satisfaction with life items were taken from the interviewer-
administered Responding Person Questionnaire. Respondents were 90.7% of the total
Wave 6 sample who returned their self-complete questionnaires, resulting in a final
sample of N=11,709 (N=5,462 men and N=6,247 women). Analyses were performed
using SPSS 17.0 for Windows (Statistical Package for Social Sciences, SPSS Inc.) and
Stata version 9.0 (StataCorp LP).

6
Measures. (i) Health: Mental health was measured using the transformed mental health
sub-scale of the SF-36, a widely used and extensively validated health screening
instrument (Ware, Snow, Kosinski, & Gandek, 1993). Scores range from 0-100 with
higher scores representing better mental health. Physical heath was measured using the
transformed physical functioning and general health sub-scales of the SF-36 to measure
physical health. Like the mental health sub-scale, scores for physical functioning and
general health sub-scales range from 0-100 with higher scores representing better
physical health. For more information on the mental health, physical functioning and
general health sub-scales in the HILDA Survey and their relationship to social capital see
( Berry & Welsh, under review).
(ii) Subjective well-being: The HILDA Survey contains a number of items which relate
to subjective perceptions of satisfaction with life. We selected items which were related
to two types of satisfaction: satisfaction with aspects of life and satisfaction with family
relationships.
Satisfaction with aspects of life: The Responding Person Questionnaire contains items
related to satisfaction with eight aspects of life: home, employment opportunities,
financial situation, how safe you feel, feeling part of local community, your heath, your
neighbourhood and your amount of free time. In addition to these items, the
questionnaire also contains an item about satisfaction with life in general, and we selected
this item too. While most of these aspects of life are applicable to all people, there were
respondents who indicated that satisfaction with employment opportunities were ‘not
applicable’. For this reason, analyses using this variable are based on N=9,094 (N=
4,426 men and N=4,668 women).
Satisfaction with family relationships: The Self Completion Questionnaire contains items
which relate to satisfaction with family members, taken from the Australian Institute of
Family Studies (AIFS) Australian Living Standards Study (Brownlee & McDonald,
1991). Not all these relationships were applicable to every respondent and, therefore,
analyses of these variables were based on different numbers of observations. We selected

7
items which related to three important relationships in life: satisfaction with partner
(N=8,402, 4,060 men and 4,342 women), with children (N= 7,736, 3,450 men and 4,286)
and with most recent former partner (N= 3,764, 1,756 men and 2,008 women).
For all satisfaction items, respondents were asked to rate how satisfied or dissatisfied they
were from 0 “totally dissatisfied” to 10 “totally satisfied”.
(iii) Community participation. Following the approach taken by Berry (2007, 2008b), we
used three approaches to measuring community participation: frequency of individual
types of participation, breadth across types of participation and perceptions about
participation.
Frequency of participation: Items measuring individual levels of community
participation were derived from the Australian Community Participation Questionnaire
(ACPQ), which measures fourteen distinct types of community participation, all are
defined by commitment, initiative and effort (Berry et al., 2007). A twelve-item short-
form of the ACPQ was developed for the HILDA Survey, to take account of items
already included in every wave. Respondents indicated on a six-point scale (from
1=“never” to 6=“very often”) how often they participated in each activity.
In order to take account of the overlap between items included in the twelve item short
form and items included in every wave of the HILDA Survey, items which tapped the
same type of participation were combined using an unweighted mean. This occurred in
three instances: two items were combined to create a contact with friends and family
variable, two to form a volunteering variable and two to make an item tapping
involvement in community organisations and groups.
Research has identified three broad domains of community participation: “informal social
connectedness”, “civic engagement” and “political participation”. Informal social
connectedness involves contact with family, friends and neighbours, (Hendry & Reid,
2000; Lee, Draper, & Lee, 2001; Putnam, 2000:115); civic engagement describes

8
participation in the form of volunteering and joining community groups, (Kuchukeeva &
John O’Loughlin, 2003; Putnam, 1995; Smidt, 1999; Uslaner & Conley, 2003); and
political participation involves local activism and political protest (McAllister, 1998;
Rich, 1999; Schudson, 1996). We assigned each of our twelve types of participation to
one of the three domains of participation. Exploratory factor analysis using maximum
likelihood factoring with oblimin rotation indicated that the items loaded on the expected
domains and, so, we created weighted mean scores for each domain.
Breadth of participation: We computed an index to examine the relationship between
breadth of participation and health. Preliminary analysis of the HILDA Survey revealed
seven types of community participation which independently predicted mental health:
contact with extended family, friends and neighbours, contact with friends and family,
attending organised community events, volunteering and political protest. Dichotomous
scores were created for each by mean-split. A score of zero was given if the respondent
scored below the mean, or one for scores equal to or greater than the mean. Scores for
each type of participation were summed to form an eight-point index (possible range=0-
7).
Perceptions of participation: There were no items specifically included in the HILDA
Survey which measured perceptions of participation. However, one item in the social
support measure taps enjoyment of participation. We included this item to measure
perceptions of participation.
(iii) Personal social cohesion: Social cohesion was measured using subjective ratings of
how well people perceived themselves to be connected to and part of their communities.
We used four indicators: A five-item measure of social trust and two items tapping
generalised reciprocity were included in the Wave 6 self-report questionnaire. The trust
items were taken from two sources: the Organisational Trust Inventory (Cummins &
Bromiley, 1996), as adapted for use in general populations by Berry and colleagues
(2008a; 2000; 2003), and the World Values Survey (Inglehart & et al., 1997). The
reciprocity items were also taken from the World Values Survey. Respondents indicated

9
on a seven-point Likert-type response format the degree to which they agreed or
disagreed with each of statements (from 1 “strongly disagree” to 7 “strongly agree”).
Each wave of the HILDA Survey includes a measure of social support (Henderson,
Duncan-Jones, McAuley, & Ritchie, 1978; Marshall & Barnett, 1993). Consistent with
the approach proposed by Cohen et al. (1985), who made the distinction between four
aspects of social support, including sense of belonging and tangible support, we created
two sub-scales derived from seven sense of belonging items and two tangible support
items.
(iv) Socio-demographic information: Each wave of the HILDA Survey contains
extensive socio-demographic information. We controlled in all analyses for: age,
Indigenous status, education level, responsibility for dependents, being in paid work,
living alone, and poverty (operationalised as receipt of a government pension, benefit of
allowance). Following the methods used by Berry & Welsh, (under review) we derived
two of these variables. Responsibility for dependents was created by categorising people
who reported that they lived in a household with children under 15 or with a dependent
student as ‘responsible for dependents’ and all others as ‘not responsible for dependents’.
A being in paid work variable was created by categorising people who reported that they
were employed in any way as ‘in paid work’ and those who reported they were
unemployed or not in the labour force (NILF) as ‘not in paid work’
Analytic Approach. In order to test the associations between mental health and the
satisfaction with life items, we produced Pearson Product Moment correlations. These
correlations were also produced to assess the association between mental health,
satisfaction with life and social capital (community participation and social cohesion).
Multiple hierarchical regression modelling was used to assess the independent
associations between social capital and mental health and aspects of satisfaction with life.
Preliminary analyses revealed that there were significant interactions between a number
of social capital factors and sex for both mental health and satisfaction with aspects of
life and relationships. For this reason, we computed separate models for men and
women. Predictor variables were added in blocks (in the order suggested by Figure 1)

10
and the model was evaluated at each step so that non-significant items were removed, one
at a time, until only significant predictors remained. We assessed mediation by
examining changes in standardised beta values at each block. Robust standard errors
were calculated in all analyses to account for the possibility of inflated correlations due to
the household being the primary sampling unit in the HILDA Survey. The data was
weighted so as to be representative of the Australian population.
Items were added in four blocks. Socio-demographic factors (age, sex, living alone,
poverty, in paid work, Indigenous status, education level and responsibility for
dependents) were added in block one, physical health (physical functioning and general
health) was added in block two. In block three, community participation was added
(informal social connectedness, civic engagement, political participation, breadth and
perceptions of participation) and personal social cohesion (sense of belonging, tangible
support, trust and reciprocity) was added in block four.
Results
Table 1 presents the means and standard deviations for mental health and the satisfaction
with life items. Men reported better mental health, and more satisfaction with their
employment opportunities, financial situation, feelings of safety, their amount of free
time and their current partner. Women reported greater satisfaction with life in general,
feeling part of their community, the neighbourhood in which they lived, their children
and their most recent former partner. There were no significant gender differences in
satisfaction with the home in which you live or satisfaction with health.
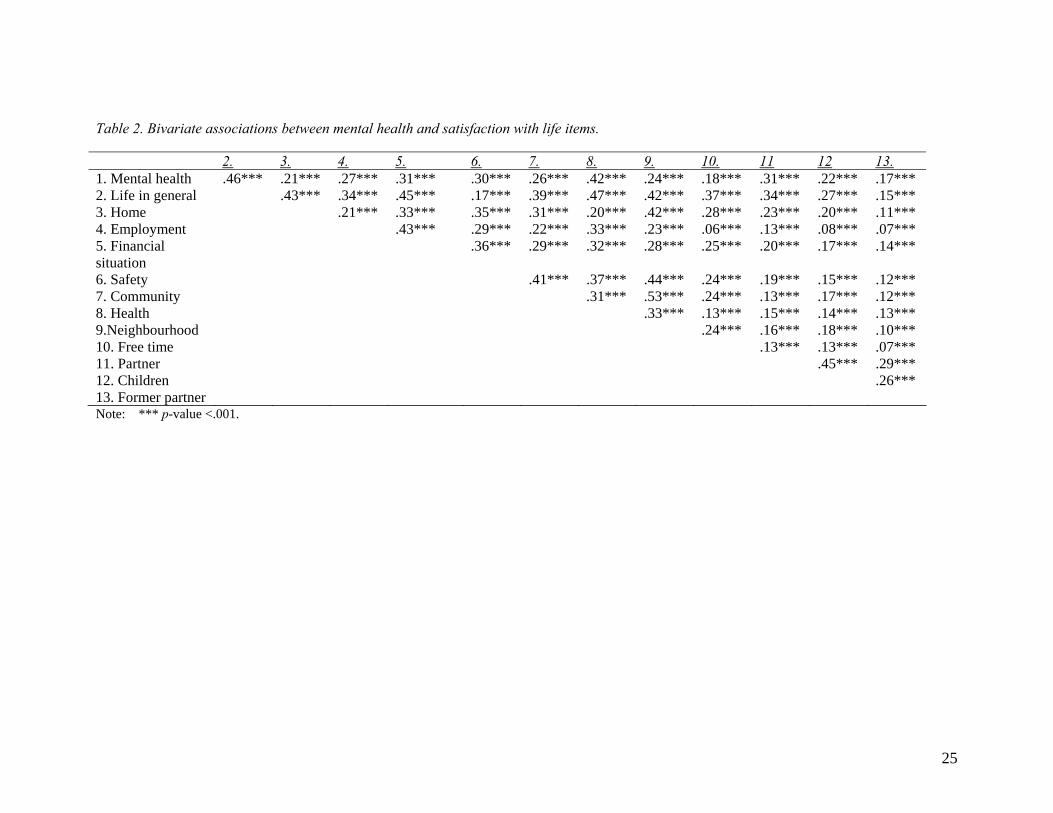
MENTAL HEALTH AND SATISFACTION WITH LIFE Bivariate correlations between mental health and the satisfaction with life variables
indicated that those that had better mental health were more likely to report being more
satisfied with all aspects of their life and relationships with family members (see Table
2). Similarly, those that reported being satisfied with one aspect of their life were more
11
likely to report being satisfied with all other aspects of their life. All correlations were
small to modest, indicating only a small amount of shared variance between the variables.
Table 3 presents the correlations between the components of social capital and mental
health and satisfaction with life. Overall, those that reported more community
participation and personal social cohesion also reported better mental health and greater
satisfaction with aspects of life. The only exception to this was that political participation
was not correlated with satisfaction with amount of free time, partner, children or former
partner. Correlations between domains of community participation and social cohesion,
and mental health and satisfaction with life were small to moderate.
MULTIPLE HIERARCHICAL REGRESSION MODELLING Separate multiple hierarchical regression analyses were performed for mental health,
satisfaction with life in general and with each aspect of satisfaction with life and
relationships. We included physical health in all analyses because it has been shown to
be associated with both mental health and satisfaction with life. In doing so, we
controlled for the hypothesis that poor physical health (compared to good physical health)
is a barrier to participation and contribute to dissatisfaction with life and problems with
relationships.
Mental health: The regression estimates for mental health scores for men and women can
be seen in Table 4. In model one, age, poverty and being in paid work predicted variance
in men’s and women’s mental health scores. Indigenous status also predicted women’s
mental health scores; living alone predicted men’s scores. Education and responsibility
for dependents did not contribute to the model for men or women. Socio-demographic
factors contributed 5% and 4% to explained variance in men’s and women’s mental
health scores respectively.
With the addition of health scores in model two, the percentage of explained variance
rose by 26% and 27% respectively for men and women. Both physical functioning and
general health contributed to this model. There was evidence, for both men and women,

12
that the effect of poverty was partially mediated by physical health. The standardised
beta values fell by 31% and 35% for men and women respectively, suggesting that the
relationship between living in poverty and poor mental health can be partially accounted
for by poor physical health. For women, Indigenous status became non-significant,
suggesting that the relationship been Indigenous status and mental health was mediated
by physical health.
In model three, community participation increased the proportion of variance in mental
health explained by 4% and 5% for men and women respectively. For men and women,
greater informal social connectedness predicted better mental health. For men but not
women, breadth of participation significantly predicted better mental health, and political
participation predicted worse mental health. For women, civic engagement and
perceptions of participation (enjoyment) also predicted better mental health. No
community participation variables were associated with worse mental heath for women.
In the fourth and final block, three aspects of social cohesion contributed to the model for
both men and women: greater sense of belonging, tangible support, and trust were related
to better mental health. Reciprocity did not retain significance in the model for men or
for women. There was evidence of mediation for men: living alone, political
participation and informal social connectedness all became non-significant, suggesting
that their relationship with mental health was accounted for by sense of belonging,
tangible support and trust. For women, there was evidence of full mediation in
perceptions of participation: the relationship between enjoying participation and mental
health was accounted for by aspects of social cohesion. For women, there was evidence
of partial mediation of the relationship between informal social connectedness and civic
engagement and mental health, as standardised beta values dropped by 31% and 76%
respectively. The final models accounted for 44% of the variance in mental health for
men and 41% for women.
Satisfaction with life in general: The regression estimates for satisfaction with life in
general for men and women can be seen in Table 5. For men and women, age, poverty,

13
living alone and education contributed to model one; living alone also contributed to the
variance in women’s satisfaction with life in general. Indigenous status and
responsibility for dependents did not contribute to the models for either gender. These
socio-demographic factors contributed to 2% of the variance in men’s satisfaction with
life in general, and 3% of women’s.
In model two, physical functioning and general health contributed to explaining variance
in satisfaction with life in general for men; physical functioning did not contribute to
variance in women’s satisfaction with life. Living in poverty became non-significant in
this model for men, suggesting that the relationship between poverty and satisfaction with
life in general can be accounted for by poor physical health. Socio-demographic factors
and physical health scores explained to 15% and 17% of the variance for men and women
respectively.
When community participation factors were added to the models in block three, the
percentage of variance in mental health explained increased by 3% and 4% for men and
women respectively. Informal social connectedness and civic engagement independently
predicted satisfaction with life in general for men and women. Breadth of participation
and perceptions of participation also predicted women’s satisfaction with life in general.
Political participation did not retain significance in the model for men or women.
In the final model, sense of belonging and tangible support independently predicted
variance in men’s and women’s satisfaction with life in general. Reciprocity also
predicted women satisfaction scores; while trust predicted men’s satisfaction with life in
general. Informal social connectedness became non-significant in the final model for
men and women, suggesting that the relationship between it and satisfaction with life was
fully mediated by aspects of personal social cohesion. For women, perceptions of
participation were also mediated by aspects of social cohesion. The final models
explained 22% and 24% of the variance in men’s and women’s satisfaction with life
scores.

14
Satisfaction with aspects of life and relationships with family members: The full
regression models and estimates for the satisfaction with aspects of life and family
members are too numerous to be presented in full here but are available from the authors.
Standardised beta values for all predictor variables, as well as the R-squared estimates for
the final models, are presented in Tables 6-8. Socio-demographic factors, health,
community participation and social cohesion predicted satisfaction with a wide range of
areas of life, including aspects of life and a number of important relationships.
Community participation and social cohesion varied in their ability to predict satisfaction
with aspects of life, with final r-squared estimates ranging from .04 to .51.
The socio-demographic factors which consistently predicted satisfaction with aspects of
life and relationships were (older) age and (absence of) poverty; Indigenous status did not
predict satisfaction with any aspects of life. General health predicted satisfaction with all
aspects of life for both men and women, and satisfaction with current partner. Physical
functioning was related only to satisfaction with the home, health, amount of free time
(for women), and satisfaction with current partner (for men).
Domains of participation, as well as breadth and perceptions of participation tended to be
related to satisfaction. Where this was the case, informal social connectedness, civic
engagement, breadth and perceptions of participation were related to better mental health,
but political participation predicted worse mental health. Sense of belonging, tangible
support and trust were consistently linked to satisfaction, such that greater sense of
belonging, tangible support and trust all predicted greater satisfaction. Reciprocity did
not predict most aspects of satisfaction, but did make an independent contribution to
predicting satisfaction with financial situation, safety, feeling part of the community,
health and neighbourhood.
There were gender differences in a number of the satisfaction with aspects of life
variables. Socio-demographic factors, community participation and social cohesion were
better at predicting satisfaction for women in feeling part of the community (R2 =.20 for
women compared with .16 for men) and amount of free time (R2= .18 for women, .16 for

15
men). However, the same factors were better at predicting satisfaction with current
partner for men (R2= .21) than they were for women (R2= .16). Some of the final R2s
were so small as to be negligible, as was the case with satisfaction with most recent
former partner (R2= .04 for men and .05 for women).
Discussion
The aims of this study were to use a nationally representative data set to examine the
relationship between poor mental health, elements of subjective wellbeing and social
capital. Consistent with previous research, we found sex differences in mental health
(Baum et al., 2000; Berry, 2008a) and satisfaction with life (Yamaoka, 2008), such that
men reported better mental health and women reported more satisfaction with life in
general. The relationship between mental health and satisfaction with life suggested that
those who reported better mental health also reported more satisfaction with all aspects of
life, including life in general – but not strongly so. There were sex differences in
satisfaction with aspects of life and family relationships, but they were not consistently
linked to men or to women. Also consistent with previous research (Berry et al., 2007;
Ziersch & Baum, 2004), we found that aspects of social capital were related to mental
health and satisfaction with life. However the strength of these relationships varied
across components of social capital and differed for men and women.
SOCIAL CAPITAL AND MENTAL HEALTH AND WELL-BEING Social capital was associated with mental health and satisfaction with a broad range of
aspects of life and relationships and these findings could not be accounted for by age,
Indigenous status, education level, responsibility for dependents, being in paid work,
living alone, or poverty. These relationships also could not be accounted for by physical
health, although, those who reported poor physical also reported poorer mental health and
(consistent with Berry and Welsh, under review) and less satisfaction with life.
Associations between social capital and mental health and satisfaction with life and
relationships were such that those that reported more informal social connectedness, civic

16
engagement, political participation, breath of participation and enjoyment of participation
also reported better mental health and more satisfaction with life and relationships. The
same was also true for social cohesion items: those that reported more sense of
belonging, tangible support, trust and reciprocity also reported better mental health and
more satisfaction with life and relationships.
GENDER DIFFERENCES IN MENTAL HEALTH AND WELL-BEING Consistent with previous research, our gendered analysis revealed that these relationships
are not uniform across men and women (Yamaoka, 2008). Different components of
social capital were related to mental health and satisfaction with life and relationships for
men and women and these components also differed in the strength of the associations for
men and women.
Social capital was a better predictor of mental health scores for men than it was for
women. More social capital indicators were retained in the final model and these
indicators together explained more of the variance in men’s mental health scores that they
did for women. However, the opposite was true for satisfaction with life in general;
social capital was better at predicting women’s scores than it was for men’s. A greater
number of social capital indicators remained significant in the final model for women and
they were able to account for more variation in women’s scores than they did for men.
This was also true for many of the results for satisfaction with aspects of life and family
life. Social capital was better at predicting women’s satisfaction with feeling part of the
community and amount of free time, yet it was better at predicting men’s satisfaction
with current partner.
Socio-economic status (and the related disadvantage) is cited as the most common
explanation for the gender differences in the relationship social capital and mental health
(Osborne, Ziersch, & Baum, 2008; Berry, 2008a). It has been argued that social capital
can be a liability for some, as it has the potential to place unwanted strain on women’s
lives. This may be too arduous for women who do not have the resources to deal with it
(Berry, 2008a). The findings of the present study provide further detail, by suggesting

17
that, for women, social capital may be more closely associated with fostering positive
feelings than to protecting against poor mental health outcomes.
In studying the subjective perceptions of participation, Berry (2008b) found that
perceptions of participation differed for men and women. Perceptions of participating
too much or too little and of enjoying participation were related to psychological distress
for both men and women. For men, but not for women, perceptions of not participation
enough were also related to distress. Together with the findings from this study, this
suggests that social capital may be a better predictor of women’s satisfaction with life and
relationships because women greater overall enjoyment, regardless of the type of
participation. In contrast, social capital is better for protecting against poor outcomes for
men because they are more selective in the ways in which they participate and are
sensitive to feelings of too much participation.
Our findings also revealed that social capital had different utility for different aspects of
well-being. Structural and cognitive components of social capital were better predictors
of mental health than they were of satisfaction with life in general. This could be due to
two reasons. Firstly, it may be that social capital is a better predictor of mental health
than it is of satisfaction with life. We cannot comment further on this hypothesis because
there are no studies, to our knowledge, which have made direct comparisons between
mental health and these elements of well-being. Secondly, this finding could be a
function of our measures of mental health and satisfaction with life. Our measure of
mental health is a transformed sub-scale of a widely used and validated measure while
our measures of satisfaction with aspects of life are based on single items.
COMMUNITY PARTICIPATION AND POOR MENTAL HEALTH AND WELL-BEING Previous research has demonstrated that, unlike all other forms of community
participation, political participation may be related to worse mental health (Berry et al.,
2007). We also found tentative support for this. Political participation did not predict
mental health for men or for women. However, it did significantly predict men’s
18
satisfaction with life in general as well as satisfaction with a number of aspects of life. In
all of these cases, political participation predicted less satisfaction.
LIMITATIONS We note four limitations to this study. (i) It could be argued that our measurement of
satisfaction with life was compromised because, as we noted above, we used single items
in our analysis. But there is substantial evidence to suggest that single item measures of
satisfaction are more stable and reliable than are scales (Shields & Wooden, 2003). (ii)
This study used cross-sectional data which does not permit inference about causality.
However, commenting on causal relationships was not our aim. Instead, our aim was to
comment on the relationship between social capital and elements of mental health and
well-being. (iii) Subjective measures of health and well-being which were not validated
against objective measures. However, there is evidence to suggest that subjective
measures of health are consistent with objective measures (Idler & Benyamini, 1997).
(iv) Finally, because we used individual level data, we are unable to describe the
relationship between community-level social capital and its relationship to mental health
and well-being. Multilevel studies, which describe relationships across different levels of
measurement, are an area for future research in this field (Kim, Subramanian, &
Kawachi, 2006; Kim & Kawachi, 2007; Subramanian, Lochner, & Kawachi, 2003).
It is also important to further examine the underlying mechanisms linking social capital
and multiple aspects of health and well-being. Few studies have attempted this task, and
only a handful have began to explore the mechanisms via which related factors, such as
socioeconomic status, may play out in these relationships. Advanced modelling
techniques, such as structural equations modelling, would be appropriate because they are
able to simultaneously examine the plausibility of multiple putative causal pathways.
Future research would also benefit from exploring the role that perceptions about
participation play in the relationship between social capital and well-being, as these may
be at least as strongly associated with mental health and well-being as is frequency of
participation (Berry, 2008b).
19
Despite these limitations, this study has practical applications. We have demonstrated
that social capital may have a role not only in preventing poor mental health outcomes,
but in fostering aspects of well-being. Interventions which promote community
participation (and, in turn, social cohesion) may be protective against mental health
problems and may promote well-being. Further research is needed to address the
question of where to best target social capital interventions.
CONCLUSION In this study, we used a nationally representative sample, with purposefully designed
measures to examine the relationship between components of social capital and mental
health and subjective well-being. We found that structural and cognitive components of
social capital were each related to both mental health and satisfaction with a wide range
of aspects of life, including life in general and relationships. In addition, our findings
supported and extended other research implications of gender differences in these
relationships. Social capital was better at predicting mental health scores for men than for
women, but the opposite was true for satisfaction; social capital was better at predicting
women’s satisfaction than it was for men. Policy and service interventions might benefit
from greater understanding of factors which foster positive feelings of satisfaction as well
as factors which protect against mental health problems.
20
References
Baum, F. E., Bush, R. A., Modra, C. C., Murray, C. J., Cox, E. M., Alexander, K. M., et al. (2000). Epidemiology of participation: An Australian community study. Journal of Epidemiology & Community Health, 54(6), 414-423.
Berry, H. L. (2008a). Social capital elite, excluded participators, busy working parents and aging, participating less: Types of community participators and their mental health. Social Psychiatry and Psychiatric Epidemiology, 43(7), 527-537.
Berry, H. L. (2008b). Subjective perceptions about sufficiency and enjoyment of community participation and associations with mental health. Australasian Epidemiologist, 15(3), 4-9.
Berry, H. L., & Rickwood, D. J. (2000). Measuring social capital at the individual level: Personal Social Capital, values and psychological distress. International Journal of Mental Health Promotion, 2(3), 35-44.
Berry, H. L., & Rodgers, B. (2003). Trust and distress in three generations of rural Australians. Australasian Psychiatry, 11(S), S131-137.
Berry, H. L., Rodgers, B., & Dear, K. B. G. (2007). Preliminary development and validation of an Australian community participation questionnaire: Types of participation and associations with distress in a coastal community. Social Science & Medicine, 64(8), 1719-1737.
Berry, H. L., & Welsh, J. A. (under review). Social capital and health in Australia: An overview from the Household, Income and Labour Dynamics in Australia Survey. Social Science & Medicine.
Brownlee, H., & McDonald, P. (1991). Institute Undertakes Three-Year Study into Australian Living Standards. Family Matters, 29, 40-43.
Cohen, S., Mermelstein, R., Kamarck, T., & Hoberman, H. M. (1985). Interpersonal Support Evaluation List. In G. S. Sarason & B. R. Sarason (Eds.), Social Support: Theory, Research and Application. Washington DC: Martinus Nijhoff.
Cummins, L. L., & Bromiley, P. (1996). The Organizational Trust Inventory (OTI): Development and validation. In R. M. Kramer & T. R. Tyler (Eds.), Trust in Organizations: Frontiers of Theory and Research pp. 302-330). California: Sage Publications.

21
De Silva, M. J., McKenzie, K., Harpham, T., & Huttly, S. R. A. (2005). Social capital and mental illness: A systematic review. Journal of Epidemiology & Community Health, 59(8), 619-627.
Diener, E. (1984). Subjective Well-Being. Psychological Bulletin, 95(3), 542-575.
Falzer, P. (2007). Developing and Using Social Capital in Public Mental Health. The Mental health Review., 12(3), 34-42.
Harpham, T., Grant, E., & Thomas, E. (2002). Measuring social capital within health surveys: Key issues. Health Policy & Planning, 17(1), 106-111.
Henderson, S., Duncan-Jones, P., McAuley, H., & Ritchie, K. (1978). The patient's primary group. British Journal of Psychiatry, 132, 74-86.
Hendry, L. B., & Reid, M. (2000). Social relationships and health: The meaning of social "connectedness" and how it relates to health concerns for rural Scottish adolescents. Journal of Adolescence, 23(6), 705-719.
Herrman, H. (2001). The need for mental health promotion. Australian and New Zealand Journal of Psychiatry, 35(6), 709-715.
Holtgrave, D. R., & Crosby, R. (2006). Is social capital a protective factor against obesity and diabetes? Findings from an exploratory study. Annals of Epidemiology, 16(5), 406-408.
Idler, E. L., & Benyamini, Y. (1997). Self-rated health and mortality: A review of twenty-seven community studies. Journal Of Health And Social Behavior, 38(1), 21-37.
Inglehart, R., & et al. (1997). World Values Surveys: Cumulative file for the first three waves. Ann Arbor: ICPSR Survey Data Archive.
Kawachi, I., Subramanian, S. V., & Kim, D. (2008a). Social Capital and Health. New York: Springer.
Kawachi, I., Subramanian, S. V., & Kim, D. (2008b). Social Capital and Health: A Decade of Progress and Beyond. In I. Kawachi, S. V. Subramanian & D. Kim (Eds.), Social Capital and Health New York: Springer
Kim, D., & Kawachi, I. (2007). U.S State-Level Social Capital and Health Related Quality of Life: Multilevel Evidence of Main, Mediating, and Modifying Effects. Annals of Epidemiology, 17(4), 258-269.
Kim, D., Subramanian, S. V., & Kawachi, I. (2006). Bonding versus bridging social capital and their associations with self rated health: a multilevel analysis of 40 US communities. Journal of Epidemiology & Community Health, 60, 116-122.

22
Kuchukeeva, A., & John O’Loughlin, J. (2003). Civic engagement and democratic consolidation in Kyrgyzstan. Eurasian Geography and Economics, 44(8), 557-587.
Lee, R. M., Draper, M., & Lee, S. (2001). Social connectedness, dysfunctional interpersonal behaviors, and psychological distress: Testing a mediator model. Journal of Counseling Psychology, 48(3), 310-318.
Lindstrom, M., & Mohseni, M. (2009). Social capital, political trust and self-reported psychological health: A population-based study. Social Science & Medicine, 68(3), 436-443.
Lochner, K. A., Kawachi, I., Brennan, R. T., & Buka, S. L. (2003). Social capital and neighborhood mortality rates in Chicago. Social Science & Medicine, 56(8), 1797-1805.
Marshall, M. L., & Barnett, R. C. (1993). Working family strains and gains among two-earner couples. Journal of Community Psychology, 35(3), 447-479.
McAllister, I. (1998). Civic Education and Political Knowledge in Australia. Australian Journal of Political Science, 33(1), 7-23.
Messner, S. F., Baumer, E. P., & Rosenfeld, R. (2004). Dimensions of social capital and rates of criminal homicide. American Sociological Review, 69(6), 882-903.
Nieminen, T., Martelin, T., Koskinen, S., Simpura, J., Alanen, E., Härkänen, T., et al. (2008). Measurement and socio-demographic variation of social capital in a large population-based survey. Social Indicators Research, 85(3), 405-423.
Osborne, K., Baum, F., & Ziersch, A. (2009). Negative consequences of community group participation for women's mental health and well-being: Implications for gender aware social capital building. Journal of Community & Applied Social Psychology, 19(3), 212-224.
Osborne, K., Ziersch, A., & Baum, F. (2008). Who participates? Socioeconomic factors associated with women's participation in voluntary groups. Australian Journal of Social Issues, 43(1), 103-122.
Portes, A. (1998). Social Capital: Its Origins and Applications in Modern Sociology. Annual Review of Sociology, 24, 1-24.
Putnam, R. D. (1995). Bowling alone: America's declining social capital. Journal of Democracy, 6(65-78).
Putnam, R. D. (2000). Bowling Alone: The Collapse and Revival of American Community. New York: Simon & Schuster.
Rich, P. (1999). American voluntarism, social capital, and political culture. The Annals, 565(1), 15-34.

23
Scheffler, R. M., Brown, T. T., Syme, L., Kawachi, I., Tolstykh, I., & Iribarren, C. (2008). Community-level social capital and recurrence of acute coronary syndrome. Social Science & Medicine, 66(7), 1603-1613.
Schudson, M. (1996). What if civic life didn't die? The American Prospect, 25, 17-20.
Shields, M., & Wooden, M. (2003). Marriage, Children and Subjective Well-being. Paper presented at the Eights Australian Insitute of Family Studies. Available from http://www.aifs.gov.au/institute/afrc8/papers.html.
Smidt, C. (1999). Religion and civic engagement: A comparative analysis. The Annals, 565(1), 176-192.
Subramanian, S. V., Lochner, K. A., & Kawachi, I. (2003). Neighborhood differences in social capital: a compositional artifact or a contextual construct? Health & Place, 9(1), 33-44.
Uslaner, E. M., & Conley, R. S. (2003). Civic engagement and particularized trust: The ties that bind people to their ethnic communities. American Politics Research, 31(4), 331-360.
Ware, J. E., Snow, K. K., Kosinski, M. A., & Gandek, M. S. (1993). SF-36 Health Survey Manual and Interpretation Guide. Boston: The Health Institute, New England Medical Centre.
Wooden, M., Freidin, S., & Watson, N. (2002). The Household, Income and Labour Dynamics in Australia (HILDA) Survey: Wave 1. The Australian Economic Review, 35(3), 339-348.
Woodhouse, A. (2006). Social capital and economic development in regional Australia: A case study. Journal of Rural Studies, 22(1), 83-94.
World Health Organisation. (2005). Promoting Mental Health: Concepts, emerging evidence and practice. Geneva: World Health Organisation.
Yamaoka, K. (2008). Social capital and health and well-being in East Asia: A population-based study. Social Science & Medicine, 66(4), 885-899.
Ziersch, A. M., & Baum, F. E. (2004). Involvement in civil society groups: Is it good for your health? Journal of Epidemiology & Community Health, 58(6), 493-500.

24
Figure 1. Proposed relationship between the two components of social capital and health. Table 1. Means and standard deviations for the satisfaction with life items by sex Male Female Total M SD M SD M SD Mental health a 75.51*** 16.67 73.21 17.50 74.28 17.16 Satisfaction with Life in general 7.88 1.43 7.94* 1.49 7.91 1.46
Home 7.94 1.75 7.97 1.85 7.96 1.80
Employment opportunities 7.23*** 2.22 7.03 2.31 7.12 2.27
Financial situation 6.49** 2.20 6.39 2.30 6.44 2.26
How safe you feel 8.20*** 1.54 8.05 1.65 8.12 1.60
Feeling part of your community 6.71 2.12 6.84*** 2.13 6.78 2.12
Your health 7.35 1.88 7.29 1.94 7.32 1.91
Neighbourhood in which you live 7.82 1.72 7.91** 1.76 7.87 1.74
Amount of free time 6.73* 2.45 6.62 2.58 6.67 2.52
Partner 8.27*** 2.14 8.10 2.21 8.18 2.18
Children 8.22 2.12 8.58*** 1.70 8.42 1.91
Most recent spouse/ partner 5.40 3.58 5.68* 3.60 5.55 3.60 Notes: 1. *** p-value <.001, ** p-value <.01, *p-value <.05
2. Items were scored on an 11-point scale with higher numbers represented higher satisfaction 3. a Scores range from 0-100with higher scores representing better mental health 4. Means are weighted so as to be representative of the Australian population
Community Participation
Personal Social Cohesion Health
Social Capital
25
Table 2. Bivariate associations between mental health and satisfaction with life items. 2. 3. 4. 5. 6. 7. 8. 9. 10. 11 12 13. 1. Mental health .46*** .21*** .27*** .31*** .30*** .26*** .42*** .24*** .18*** .31*** .22*** .17*** 2. Life in general .43*** .34*** .45*** .17*** .39*** .47*** .42*** .37*** .34*** .27*** .15*** 3. Home .21*** .33*** .35*** .31*** .20*** .42*** .28*** .23*** .20*** .11*** 4. Employment .43*** .29*** .22*** .33*** .23*** .06*** .13*** .08*** .07*** 5. Financial situation
.36*** .29*** .32*** .28*** .25*** .20*** .17*** .14***
6. Safety .41*** .37*** .44*** .24*** .19*** .15*** .12*** 7. Community .31*** .53*** .24*** .13*** .17*** .12*** 8. Health .33*** .13*** .15*** .14*** .13*** 9.Neighbourhood .24*** .16*** .18*** .10*** 10. Free time .13*** .13*** .07*** 11. Partner .45*** .29*** 12. Children .26*** 13. Former partner Note: *** p-value <.001.

26
Table 3. Bivariate associations between domains and bread of participation, perceptions about participation, personal social cohesion and mental heath, satisfaction with life and family member items. Mental
health Life in general
Home Employment Financial situation
Safety Community Health Neighbour-hood
Free time
Partner Children Former partner
Participation domains Informal social connectedness
.28*** .23*** .15*** .15*** .15*** .16*** .27*** .16*** .21*** .12*** .16*** .21*** .11***
Civic engagement
.18*** .16*** .12*** .10*** .18*** .09*** .29*** .10*** .16*** .07*** .08*** .11*** .06***
Political participation
.08*** .06*** .04*** .04*** .07*** .04*** .22*** .04*** .08*** .02 .01 .01 .02
Breath of participation
.25*** .19*** .13*** .12*** .16*** .12*** .32*** .13*** .20*** .09*** .10*** .15*** .09***
Perceptions of participation Enjoyment .20*** .17*** .11*** .09*** .07*** .12*** .11*** .15*** .13*** .04*** .22*** .21*** .12***
Personal social Cohesion Sense of belonging
.46*** .35*** .19*** .25*** .20*** .25*** .27*** .29*** .24*** .12*** .33*** .25*** .15***
Tangible support
.42*** .33*** .19*** .24*** .22*** .25*** .23*** .27*** .24*** .14*** .28*** .25*** .14***
Trust .36*** .27*** .18*** .19*** .26*** .27*** .28*** .21*** .28*** .18*** .18*** .21*** .15***
Reciprocity .28*** .22*** .15*** .15*** .20*** .21*** .25*** .16*** .23*** .14*** .12*** .16*** .11***
Note: *** p-value <.001, ** p-value <.01, * p-value <.05

27
Table 4. Multiple hierarchical regression estimates for the prediction of variance in mental health scores by sex, socio-demographic factors, community participation and personal social cohesion. B Std Err B β R² Male Female Male Female Male Female Male FemaleModel 1: Socio-demographic factors .05*** .04***
Age .10 .10 .02 .02 .10*** .10*** Poverty 6.33 5.95 .90 .72 .13*** .14*** Indigenous Status - -4.46 - 1.93 - -.03* Lives alone 2.25 - .74 - .05** - In paid work -4.53 -2.82 .70 .65 - -
Model 2: Health scores .31*** .31***Age .19 .20 .01 .01 .21*** .21*** Poverty 1.95 2.33 .76 .59 .04** .05*** Lives alone 1.44 - .63 - .03* - Physical functioning .05 .03 .01 .02 .06*** .05* General health .43 .43 .01 .01 .53** .53***
Model 3: Community Participation .35*** .36***Age .19 .15 .01 .01 .20*** .16*** Poverty 1.72 1.79 .74 .57 .04* .04** Lives alone 1.42 - .61 - .03* - Physical functioning .04 - .01 - .06** - General health .39 .40 .02 .01 .49*** .50*** Informal social connectedness 3.25 3.47 .31 .37 .15*** .16*** Civic engagement - 1.06 - .26 - .05*** Political participation -.72 - .32 - -.03* - Breadth .61 - .21 - .07** - Perceptions of participation - 1.78 - .33 - .09***
Model 4: Personal Social Cohesion .44*** .41***Age .17 .14 .01 .01 .18*** .15*** Poverty 1.73 - .69 - .04* - Physical functioning .05 - .01 - .07*** - General health .32 .34 .01 .01 .40*** .42*** Informal social connectedness - 1.08 - .40 - .05** Civic engagement - .81 - .25 - .04** Breadth .35 - .11 - .04** - Sense of belonging 4.62 4.55 .39 .36 .24*** .23*** Tangible support 1.74 1.14 .33 .32 .11*** .07*** Trust 1.43 1.45 .27 .29 .08*** .08***
Notes: 1. *** p-value <.001, ** p-value <.01, * p-value <.05 2. All estimates are weighted to be representative of the Australian population
3. All estimates were calculated using robust standard errors

28
Table 5. Multiple hierarchical regression estimates for the prediction of variance in satisfaction with life scores by sex, socio-demographic factors, community participation and personal social cohesion. B Std Err B β R² Male Female Male Female Male Female Male FemaleModel 1: Socio-demographic factors .02*** .03***
Age .01 .01 .00 .00 .09*** .09*** Poverty .35 .51 .08 .07 .09*** .14*** Lives alone .33 .15 .06 .06 .08*** .03** In paid work - .12 - .06 - .04* Education .07 .05 .23 .01 .08*** .06***
Model 2: Health scores .15*** .17***Age .01 .01 .00 .00 .17*** .15*** Poverty - .29 - .06 - .08*** Lives alone .30 .14 .06 .06 .07*** .03* In paid work - .26 - .05 - .08*** Education .09 .07 .01 .01 .10*** .08** Physical Functioning .00 - .00 - -.05* - General health .03 .03 .00 .00 .41*** 39***
Model 3: Community Participation .18*** .21***Age .01 .01 .00 .00 .18*** .12*** Poverty - .23 - .06 - .06*** Lives alone .29 .16 .06 .06 .07*** .03** In paid work - .22 - .05 - .07*** Education .10 .08 .01 .01 .11*** .10*** Physical functioning .00 - .00 - -.06** - General health .03 .02 .00 .00 .37*** .34*** Informal social connectedness .21 .25 .03 .03 .06*** .09*** Civic engagement - .11 - .03 - .04*** Breadth .06 .05 .02 .02 .07** .07** Perceptions of participation - .15 - .03 .09***
Model 4: Personal Social Cohesion .22*** .24 ***Age .01 .01 .00 .00 .15*** .10*** Poverty - .18 - .06 - .05** In paid work - .22 - .05 - .07*** Lives alone .18 - .06 - .04** - Education .09 .08 .06 .01 .04*** .10*** Physical functioning .00 - .00 - -.05** - General health .02 .02 .00 .00 .31*** .28*** Breadth .04 .05 .01 .01 .05**- .07*** Civic engagement - .10 - .03 - .06*** Sense of belonging .27 .24 .04 .04 .16*** .14*** Tangible support .13 .14 .04 .03 .09*** .09*** Trust .11 - .03 - .06** - Reciprocity - .09 - .03 - .05***
Notes: 1. *** p-value <.001, ** p-value <.01, * p-value <.05 2. All estimates are weighted to be representative of the Australian population 3. All estimates were calculated using robust standard errors

29
Table 6. Final model multiple hierarchical regression estimates for the prediction of variance satisfaction with aspects of life for men Home Employment Financial
situation Safety Feeling part
of community
Health Neighbourhood Amount of free time
Socio-demographic factors Age .14*** .14*** .23*** - .13*** - .14*** .05** Poverty 04** .06** .08*** - - .04* - - Living alone .08*** -.32*** - - - - - - Indigenous status - - - - - - - - In paid work .06** - -.07** - - - - .26*** dependents - - - - .05** - .04** -.12*** Education .07*** -.05** -.04** - .09*** - .08*** .07***
Physical health Physical functioning -.06** - - - - .06*** - - General health .09*** .16*** .20*** .16*** .10*** .65*** .16*** .05**
Community participation Informal social connectedness
.05** - - - - - .06* -
Civic engagement - - .05** - .09*** - - - Political participation - - - - - - - - Breadth - - - - .16*** - .06* - Perceptions of participation
- - - - - - - -
Social cohesion Sense of belonging .07** .08** .08*** .06* .10*** .05*** - .05* Tangible support .09*** .07** - .11*** - - .10*** .07** Trust .04* .05* .09*** .16*** .13*** - .14*** .12*** Reciprocity - - - - - - - -
Final R2 .10*** .25*** .15*** .12*** .16*** .51*** .14*** .16*** Notes: *** p-value <.001, ** p-value <.01, * p-value <.05. All estimates are weighted to be representative of the Australian population. All estimates were calculated using robust standard errors.

30
Table 7. Final model multiple hierarchical regression estimates for the prediction of variance satisfaction with aspects of life for women Home Employment Financial
situation Safety Feeling part
of community
Health Neighbourhood Amount of free time
Socio-demographic factors Age .09*** -.13*** .19*** - .13*** .05*** .13*** - Poverty - .07*** .16*** - - - - .05*** Living alone - - .03* - - - - - Indigenous status - - - - - - - - In paid work - -.32***v - .05*** - .05*** - .24*** dependents .07*** - - - .07*** - - -.21*** Education .10*** -.07*** - - - - - .10***
Physical health Physical functioning -.06** - - - - .14*** - -.07** General health .09*** 11*** .14*** .15* .10*** .60*** .13*** .10***
Community participation - Informal social connectedness
.07*** .05* - - - -.05** - -
Civic engagement .06*** .05** .10*** - .09*** .03* - - Political participation -.04* - - - -.09*** - - -.04* Breadth - - - .06*** .14*** .07* .11*** .09*** Perceptions of participation
- - - - - .03*** - -
Social cohesion Sense of belonging .05* .09*** - - .13*** - - - Tangible support .06*** - .07*** .11*** - - .08*** .05** Trust .06*** .09*** .09*** .15*** - - .11*** .08*** Reciprocity - - .05** .05*** .11*** .03*** .07** -
Final R2 .09*** .26*** .17*** .13*** .20*** .50*** .13*** .18*** Notes: *** p-value <.001, ** p-value <.01, * p-value <.05. All estimates are weighted to be representative of the Australian population. All estimates were calculated using robust standard errors.

31
Table 8. Final model multiple hierarchical regression estimates for the prediction of variance in satisfaction with relationships for men and women. Men Women
Partner Children Former partner
Partner Children Former partner
Socio-demographic factors
Age .13*** .14*** - - .19*** - Poverty - - - - - .06* Living alone .24*** .12*** - .15*** - - Indigenous status - - - - - - In paid work - - - .10*** .14*** - dependents -.08*** - - -.12*** .16*** - Education - - - - - -
Physical health Physical functioning
-.05* - - - - -
General health .09*** - .09** .06** .08*** - Community participation
Informal social connectedness
- .08** - - .09* .08**
Civic engagement - - - - - - Political participation
- - - -.05* -.05* -.05*
Breadth - - .09** - - - Perceptions of participation
.12*** .09*** - .06* .10*** -
Social cohesion Sense of belonging .25*** .10** - .20*** - - Tangible support - - - .09** .14*** .10** Trust - .08** .15*** .06* 05* .07* Reciprocity - - -.07* -.05* - -
Final R2 .21*** .11*** .04*** .16*** .13*** .05*** Notes: *** p-value <.001, ** p-value <.01, * p-value <.05. All estimates are weighted to be representative of the Australian population. All estimates were calculated using robust standard errors.