jemena gas networks (nsw) ltd - australian energy … gas networks - aa review... · jemena gas...
TRANSCRIPT

Jemena Gas Networks (NSW) Ltd
2015-20 Access Arrangement Information
Revised in response to the draft decision
Public
27 February 2015

An appropriate citation for this paper is:
Jemena Gas Networks, 2015-20 Access Arrangement
Information (revised), 27 February 2015
Contact Person
Robert McMillan
General Manager Regulation
Ph: (03) 8544 9000
Jemena Gas Networks (NSW) Ltd
ABN 87 003 004 322
321 Ferntree Gully Road
Mount Waverley VIC 3149
Postal Address
Locked Bag 7000
Mount Waverley VIC 3149
Ph: (03) 8544 9000
Fax: (03) 8544 9888

TABLE OF CONTENTS
Public—27 February 2015 © Jemena Gas Networks (NSW) Ltd
2015-20 Access Arrangement Information
iii
TABLE OF CONTENTS
Abbreviations .................................................................................................................................................................. vi
1. Introduction ........................................................................................................................................................... 1
1.1 Purpose ....................................................................................................................................................... 1
1.2 Network overview ........................................................................................................................................ 1
1.3 Interpretation................................................................................................................................................ 3
2. Current period outcomes ..................................................................................................................................... 4
2.1 Capital expenditure by asset class .............................................................................................................. 4
2.2 Operating expenditure ................................................................................................................................. 5
2.3 Pipeline usage ............................................................................................................................................. 5
3. Capital base ........................................................................................................................................................... 7
3.1 Opening capital base for the earlier AA period ............................................................................................ 7
3.2 Closing capital base for the earlier AA period .............................................................................................. 7
3.3 Projected capital base in the AA period ..................................................................................................... 10
3.4 Depreciation............................................................................................................................................... 11
3.5 Capital contributions .................................................................................................................................. 14
3.6 Conforming capital expenditure ................................................................................................................. 14
3.7 Disposals ................................................................................................................................................... 15
4. Demand ................................................................................................................................................................ 16
4.1 JGN’s demand forecasting approach ......................................................................................................... 16
4.2 Demand forecasts ...................................................................................................................................... 17
5. Operating expenditure ........................................................................................................................................ 19
5.1 Forecasting basis ....................................................................................................................................... 19
5.2 Operating expenditure forecast.................................................................................................................. 19
6. Rate of return ...................................................................................................................................................... 21
6.1 Rate of return ............................................................................................................................................. 21
6.2 Departures from the guideline.................................................................................................................... 21
6.3 Formula applied under rule 87(12) ............................................................................................................. 22
7. Corporate income tax ......................................................................................................................................... 23
7.1 Value of imputation credits ........................................................................................................................ 23
7.2 Cost of corporate income tax ..................................................................................................................... 23
8. Incentive Mechanisms ........................................................................................................................................ 24
8.1 2010-15 AA period ..................................................................................................................................... 24
8.2 2015-20 AA period ..................................................................................................................................... 24
9. Reference Tariffs ................................................................................................................................................. 26
9.1 Pricing principles and basis of reference tariffs.......................................................................................... 26
9.2 Cost allocation method .............................................................................................................................. 28
9.3 Relationship between costs and tariffs ...................................................................................................... 28
10. Annual Reference Tariff Variation ..................................................................................................................... 33
10.1 Haulage reference services ....................................................................................................................... 33
10.2 Ancillary charges ....................................................................................................................................... 33
11. Total revenue and KPIs ...................................................................................................................................... 34
11.1 Total revenue requirement ......................................................................................................................... 34
11.2 Key performance indicators ....................................................................................................................... 35
12. Compliance checklist ......................................................................................................................................... 36

TABLE OF CONTENTS
iv Public—27 February 2015 © Jemena Gas Networks (NSW) Ltd 2015-20 Access Arrangement Information
List of tables
Table 2–1: Capital expenditure by asset class ($2015, $millions) ...................................................................................... 4
Table 2–2: Operating expenditure by asset class ($2015, $millions) .................................................................................. 5
Table 2–3: Pipeline daily demand (TJ) ............................................................................................................................... 5
Table 2–4: Customer numbers by tariff class (number) ...................................................................................................... 6
Table 3–1: Adjustment for difference between estimated and actual net capex in 2009-10 ($nominal, $millions).............. 7
Table 3–2: Increase in CPI (per cent) ................................................................................................................................. 8
Table 3–3: Roll forward of combined total capital base over earlier AA period ($nominal, $millions) ................................. 8
Table 3–4: Roll forward of Wilton to Wollongong trunk pipeline capital base over earlier AA period ($nominal,
$millions)............................................................................................................................................................................. 9
Table 3–5: Roll forward of Wilton to Newcastle trunk pipeline capital base over earlier AA period ($nominal,
$millions)............................................................................................................................................................................. 9
Table 3–6: Roll forward of NSW distribution system capital base over earlier AA period ($nominal, $millions).................. 9
Table 3–7: Roll forward of combined total capital base over the AA period ($nominal, $millions) .................................... 10
Table 3–8: Roll forward of Wilton to Wollongong capital base over the AA period ($nominal, $millions) .......................... 10
Table 3–9: Roll forward of Wilton to Newcastle trunk pipeline capital base over the AA period ($nominal, $millions) ...... 10
Table 3–10: Roll forward of NSW distribution system capital base over the AA period ($nominal, $millions) .................. 11
Table 3–11: Forecast depreciation over the AA period ($nominal, $millions) ................................................................... 11
Table 3–12: Economic lives of JGN assets (years) .......................................................................................................... 11
Table 3–13: Remaining asset lives as at 30 June 2015 (years)........................................................................................ 12
Table 3–14: Forecast depreciation over AA period ($nominal, $millions) ......................................................................... 13
Table 3–15: Capital contributions over the earlier AA period ($nominal, $millions) .......................................................... 14
Table 3–16: Capital contributions over the AA period ($nominal, $millions) ..................................................................... 14
Table 3–17: Conforming capital expenditure over the earlier AA period ($nominal, $millions) ......................................... 14
Table 3–18: Conforming capital expenditure over the AA period ($nominal, $millions) .................................................... 15
Table 3–19: Asset disposals over the 2015-20 AA period ($nominal, $millions)............................................................... 15
Table 3–20: Asset disposals over the 2015-20 AA period ($nominal, $millions)............................................................... 15
Table 4–1: Forecast customer numbers by customer type ............................................................................................... 18
Table 4–2: Forecast average daily consumption by customer type and MDQ (TJ)........................................................... 18
Table 4–3: Forecast consumption by customer type (TJ): 2016-20 .................................................................................. 18
Table 4–4: Actual and forecast average consumption by volume market type (GJ) ......................................................... 18
Table 5–1: JGN forecast O&M costs over the AA period ($2015, $millions) .................................................................... 19
Table 6–1: JGN’s WACC .................................................................................................................................................. 21
Table 7–1: Cost of corporate income tax for the AA period ($nominal, $millions) ............................................................. 23
Table 9–1: JGN’s volume reference tariff classes ............................................................................................................. 27
Table 9–2: JGN demand reference tariff classes .............................................................................................................. 27
Table 9–3: LRMC for JGN tariff classes ($nominal/GJ) .................................................................................................... 29
Table 9–4: LRMC for each tariff class by tariff component ............................................................................................... 29
Table 11–1: JGN total revenue ($2015, $millions) ............................................................................................................ 34
Table 11–2: Revenues and X-factors ($real, $millions) .................................................................................................... 34
Table 11–3: Average annual price changes (per cent) ..................................................................................................... 34
Table 11–4: KPIs: Operating cost per metre and cost per customer site ($2015) ............................................................ 35
Table 12–1: Compliance checklist – revised AAI .............................................................................................................. 36

TABLE OF CONTENTS
Public—27 February 2015 © Jemena Gas Networks (NSW) Ltd
2015-20 Access Arrangement Information
v
List of figures
Figure 1–1: JGN network overview map ............................................................................................................................ 2

ABBREVIATIONS
vi Public—27 February 2015 © Jemena Gas Networks (NSW) Ltd 2015-20 Access Arrangement Information
ABBREVIATIONS
AA Access Arrangement
AAI Access Arrangement Information
AEMO Australian Energy Market Operator
AER Australian Energy Regulator
AGLUI AGL Upstream Investments
CPI Consumer Price Index
ECM Efficiency Carryover Mechanism
EDD Effective Degree Days
EGP Eastern Gas Pipeline
HP High Pressure
JGN Jemena Gas Networks (NSW) Ltd
LRMC Long Run Marginal Costs
MP Medium Pressure
MSP Moomba to Sydney Pipeline
Network Users users of the JGN network
NGR National Gas Rules
RAB Regulatory asset base
RY Regulatory Year
STTM Short Term Trading Market
TAB Tax Asset Base
UAG Unaccounted for Gas
WACC Weighted Average Cost of Capital
WAPC Weighted Average Price Cap

INTRODUCTION — 1
Public—27 February 2015 © Jemena Gas Networks (NSW) Ltd
2015-20 Access Arrangement Information
1
1. INTRODUCTION
1.1 PURPOSE
1. This revised Access Arrangement Information (revised AAI) has been prepared by Jemena Gas Networks
(NSW) Ltd (ACN 003 004 322) (JGN). It provides supporting information to the amended access arrangement
(AA) revisions proposal applicable to the NSW natural gas distribution network owned, controlled and operated
by JGN for the period 1 July 2015 to 30 June 2020 (revised AA proposal). It is prepared in accordance with
the requirements of rule 72 of the National Gas Rules (NGR).
2. JGN has also prepared a separate response document (response to the draft decision) which:
a) addresses the Australian Energy Regulator’s (AER) draft decision on the initial access arrangement
revision proposal submitted by JGN on 30 June 2014 (the initial AA proposal)
b) provides further background to this revised AAI and the revised AA proposal.
3. This revised AAI, the revised 2015 AA proposal, and the response to the draft decision, are collectively referred
to as JGN’s revised AA submission.
1.2 NETWORK OVERVIEW
4. JGN provides natural gas transportation and associated services to users of the JGN network (Network Users).
5. The JGN network has its origins in 1837 when The Australian Gas Light Company was formed to light the
streets of Sydney. The network has grown through a combination of extensions, new developments and
acquisitions. It now provides gas to more than 1.2 million customers in Sydney, Newcastle, Wollongong and the
Central Coast, and over 20 country centres including those within the Central Tablelands, Central West,
Southern Tablelands and Riverina regions of NSW.
1.2.1 CURRENT CONFIGURATION AND OPERATION
6. The majority of gas consumed in NSW is sourced from other states.
7. At present, gas is injected into the JGN Wilton network section (which provides gas to customers across
Sydney, Newcastle, Wollongong and the Central Coast) at five receipt points with a sixth currently under
construction. Gas is sourced at these receipt points from:
the Moomba to Sydney Pipeline (MSP), owned by APA Group, which principally transports gas produced in
the Cooper Basin in South Australia to JGN’s Wilton receipt point
the Eastern Gas Pipeline (EGP), owned by Jemena, which transports gas produced in the Gippsland Basin
in Victoria to JGN’s Albion Park, Port Kembla, and Horsley Park receipt points
the Rosalind Park Gas Plant, owned by the AGL Upstream Investments (AGLUI), which injects local coal
seam methane into JGN’s Rosalind Park receipt point
a gas storage facility and pipeline now being built by AGL at Tomago which will interconnect with the
network at a new JGN receipt point at Hexham.

1 — INTRODUCTION
2 Public—27 February 2015 © Jemena Gas Networks (NSW) Ltd 2015-20 Access Arrangement Information
8. There are separate country receipt points (32 in all) for each of the country centres served by the JGN network.
All of those centres are connected to the MSP or the Central West Pipeline, both of which are owned by APA
Group.
Figure 1–1: JGN network overview map
9. Network Users are responsible for injecting natural gas from a transmission pipeline (MSP or EGP) or facility
owner (AGLUI) into JGN’s network through JGN’s receipt points. Once injected into the network, JGN has
contractual obligations with Network Users to transport that gas through the network to the Network Users’
customers’ premises. Custody transfer quality meters are located near each receipt point to measure the
quantity of gas injected into the network.
10. The JGN network currently consists of approximately 267 km of trunk mains, 147 km of primary mains,
1,493 km of secondary mains and 23,470 km of medium and low pressure mains, as well as 55 trunk receiving
stations and packaged off-take stations, 17 primary regulating stations, 619 district regulator sets and 2 bulk
metering stations.
11. The JGN Wilton network section which serves the Sydney, Newcastle and Wollongong areas is the Short Term
Trading Market (STTM) distribution system for the STTM Sydney Hub and gas delivered to receipt points in this
network section is governed by STTM rules and procedures. The STTM is a market-based wholesale gas
balancing mechanism established at defined gas hubs such as the STTM Sydney Hub and allows Network
Users to buy gas directly from the STTM rather than through a shipper or producer. The Australian Energy
Market Operator (AEMO) operates the STTM. While the STTM Sydney Hub is governed by the STTM, JGN’s
country network sections operate solely under a contractual supply chain framework. This means that Network

INTRODUCTION — 1
Public—27 February 2015 © Jemena Gas Networks (NSW) Ltd
2015-20 Access Arrangement Information
3
Users still need to procure gas from a shipper or producer and arrange for that gas to be transported to receipt
points for those network sections.
12. As the JGN network has limited gas storage capacity, to maintain operational gas pressure throughout each
network section and ensure the safe and reliable operation of the network, there are contractual obligations on
Network Users to ensure the total quantity of gas injected and withdrawn from each network section on a day is
equal—or balanced. There are also obligations on Network Users to ensure that the gas that is injected into
JGN’s network meets a defined gas specification and is injected within the minimum and maximum gas
pressure range for the relevant receipt point. For the STTM Sydney Hub, the expectation is that the STTM will
manage gas balancing behaviours through financial incentives and penalties. JGN deems each country
network section to be in balance.
1.3 INTERPRETATION
13. This AAI and the draft decision response adopt the following drafting conventions:
monetary values are reported in real 2014-15 Australian dollars, unless indicated otherwise
annual values are reported on a 1 July to 30 June regulatory year (RY) basis, unless indicated otherwise
numerical values in tables may not tally due to arithmetic rounding
reference to a “rule” is a reference to a rule from the NGR
the document “Access arrangement JGN’s NSW gas distribution networks 1 July 2010 – 30 June 2015,
amended by order of the Australian Competition Tribunal, 30 June 2011, further amended with regard to
mines subsidence expenditure, 26 September 2011, June 2010” is referred to in this 2015 AA submission
as the 2010 AA
the document “Access arrangement information for the access arrangement, JGN’s NSW gas distribution
networks 1 July 2010 – 1 July 2015, amended by the order of the Australian Competition Tribunal, 30 June
2011, further amended with regard to mine subsidence expenditure, 26 September 2011, June 2010” is
referred to in this 2015 AA submission as the 2010 AAI
references to the ‘2010-15 AA period’ or ‘earlier AA period’ refer to the period commencing 1 July 2010 and
ending 30 June 2015
references to the ‘2015-20 AA period’ or ‘AA period’ refer to the period commencing 1 July 2015 and ending
30 June 2020.
14. An abbreviations list is also provided in this revised AAI.
2 — CURRENT PERIOD OUTCOMES
4 Public—27 February 2015 © Jemena Gas Networks (NSW) Ltd 2015-20 Access Arrangement Information
2. CURRENT PERIOD OUTCOMES
2.1 CAPITAL EXPENDITURE BY ASSET CLASS
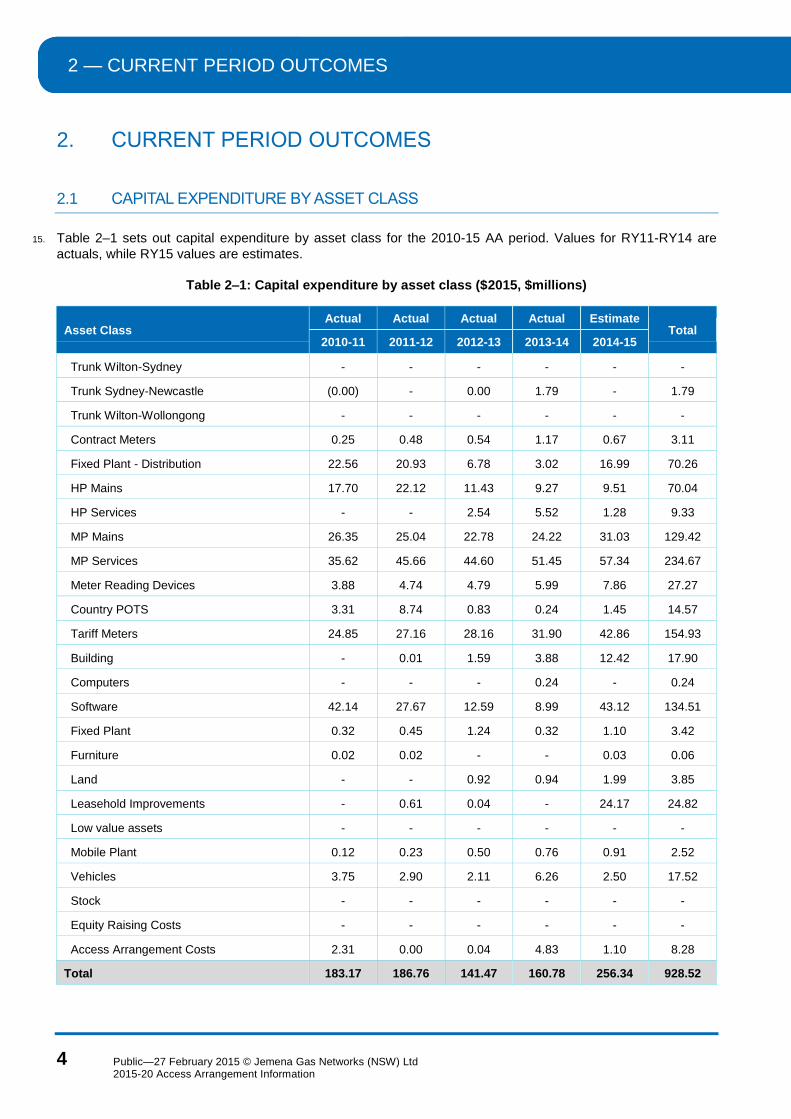
15. Table 2–1 sets out capital expenditure by asset class for the 2010-15 AA period. Values for RY11-RY14 are
actuals, while RY15 values are estimates.
Table 2–1: Capital expenditure by asset class ($2015, $millions)
Asset Class Actual Actual Actual Actual Estimate
Total 2010-11 2011-12 2012-13 2013-14 2014-15
Trunk Wilton-Sydney - - - - - -
Trunk Sydney-Newcastle (0.00) - 0.00 1.79 - 1.79
Trunk Wilton-Wollongong - - - - - -
Contract Meters 0.25 0.48 0.54 1.17 0.67 3.11
Fixed Plant - Distribution 22.56 20.93 6.78 3.02 16.99 70.26
HP Mains 17.70 22.12 11.43 9.27 9.51 70.04
HP Services - - 2.54 5.52 1.28 9.33
MP Mains 26.35 25.04 22.78 24.22 31.03 129.42
MP Services 35.62 45.66 44.60 51.45 57.34 234.67
Meter Reading Devices 3.88 4.74 4.79 5.99 7.86 27.27
Country POTS 3.31 8.74 0.83 0.24 1.45 14.57
Tariff Meters 24.85 27.16 28.16 31.90 42.86 154.93
Building - 0.01 1.59 3.88 12.42 17.90
Computers - - - 0.24 - 0.24
Software 42.14 27.67 12.59 8.99 43.12 134.51
Fixed Plant 0.32 0.45 1.24 0.32 1.10 3.42
Furniture 0.02 0.02 - - 0.03 0.06
Land - - 0.92 0.94 1.99 3.85
Leasehold Improvements - 0.61 0.04 - 24.17 24.82
Low value assets - - - - - -
Mobile Plant 0.12 0.23 0.50 0.76 0.91 2.52
Vehicles 3.75 2.90 2.11 6.26 2.50 17.52
Stock - - - - - -
Equity Raising Costs - - - - - -
Access Arrangement Costs 2.31 0.00 0.04 4.83 1.10 8.28
Total 183.17 186.76 141.47 160.78 256.34 928.52

CURRENT PERIOD OUTCOMES — 2
Public—27 February 2015 © Jemena Gas Networks (NSW) Ltd
2015-20 Access Arrangement Information
5
2.2 OPERATING EXPENDITURE
16. Table 2–2 sets out operating expenditure by category for the 2010-15 AA period. Values for RY11-RY14 are
actuals, while RY15 values are estimates.
Table 2–2: Operating expenditure by asset class ($2015, $millions)
Category Actual Actual Actual Actual Estimate
Total 2010-11 2011-12 2012-13 2013-14 2014-15
Operating and maintenance 102.93 100.29 103.05 114.36 110.46 531.10
Administration and overheads 24.67 26.83 29.72 17.30 14.59 113.11
Marketing 6.45 6.34 5.66 7.65 7.46 33.57
Government levies 3.10 5.29 3.32 3.98 3.98 19.66
UAG 13.14 16.44 14.51 13.74 16.36 74.20
Carbon - - 9.25 7.17 0.04 16.45
Debt raising costs - - - - - -
Total 150.29 155.20 165.52 164.20 152.89 788.10
2.3 PIPELINE USAGE
17. Table 2–3 provides pipeline usage for the 2010-15 AA period. Values for RY11-RY14 are actuals, while RY15
values are estimates.
Table 2–3: Pipeline daily demand (TJ)
Actual Actual Actual Actual Estimate
2010-11 2011-12 2012-13 2013-14 2014-15
Minimum demand 156.08 124.79 157.23 157.08 157.84
Maximum demand 416.20 382.78 385.62 372.18 356.89
Average demand 274.44 248.30 258.49 248.28 231.39

2 — CURRENT PERIOD OUTCOMES
6 Public—27 February 2015 © Jemena Gas Networks (NSW) Ltd 2015-20 Access Arrangement Information
18. Table 2–4 provides customer numbers by tariff class for the 2010-15 AA period. Values for RY11-RY14 are
actuals, while RY15 values are estimates.
Table 2–4: Customer numbers by tariff class (number)
Tariff class Actual Actual Actual Actual Estimate
Total 2010-11 2011-12 2012-13 2013-14 2014-15
Residential 1,096,101 1,124,125 1,158,188 1,194,557 1,230,962 5,803,933
Small business 14,064 15,188 15,933 16,827 17,183 79,195
Total volume customers 1,110,165 1,139,313 1,174,121 1,211,384 1,248,145 5,883,128
Demand customers 401 398 401 409 409 2,018
Total customers 1,110,566 1,139,711 1,174,522 1,211,793 1,248,554 5,885,146
CAPITAL BASE — 3
Public—27 February 2015 © Jemena Gas Networks (NSW) Ltd
2015-20 Access Arrangement Information
7
3. CAPITAL BASE
3.1 OPENING CAPITAL BASE FOR THE EARLIER AA PERIOD
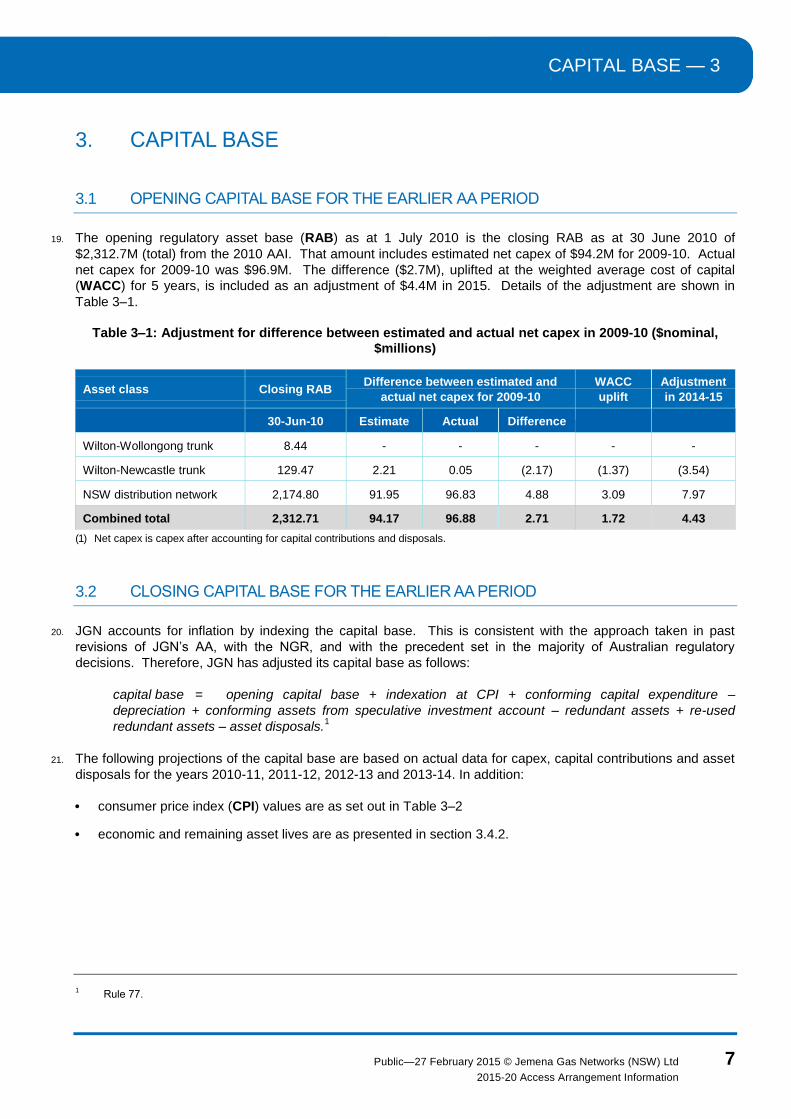
19. The opening regulatory asset base (RAB) as at 1 July 2010 is the closing RAB as at 30 June 2010 of
$2,312.7M (total) from the 2010 AAI. That amount includes estimated net capex of $94.2M for 2009-10. Actual
net capex for 2009-10 was $96.9M. The difference ($2.7M), uplifted at the weighted average cost of capital
(WACC) for 5 years, is included as an adjustment of $4.4M in 2015. Details of the adjustment are shown in
Table 3–1.
Table 3–1: Adjustment for difference between estimated and actual net capex in 2009-10 ($nominal, $millions)
Asset class Closing RAB Difference between estimated and
actual net capex for 2009-10
WACC
uplift
Adjustment
in 2014-15
30-Jun-10 Estimate Actual Difference
Wilton-Wollongong trunk 8.44 - - - - -
Wilton-Newcastle trunk 129.47 2.21 0.05 (2.17) (1.37) (3.54)
NSW distribution network 2,174.80 91.95 96.83 4.88 3.09 7.97
Combined total 2,312.71 94.17 96.88 2.71 1.72 4.43
(1) Net capex is capex after accounting for capital contributions and disposals.
3.2 CLOSING CAPITAL BASE FOR THE EARLIER AA PERIOD
20. JGN accounts for inflation by indexing the capital base. This is consistent with the approach taken in past
revisions of JGN’s AA, with the NGR, and with the precedent set in the majority of Australian regulatory
decisions. Therefore, JGN has adjusted its capital base as follows:
capital base = opening capital base + indexation at CPI + conforming capital expenditure –
depreciation + conforming assets from speculative investment account – redundant assets + re-used
redundant assets – asset disposals.1
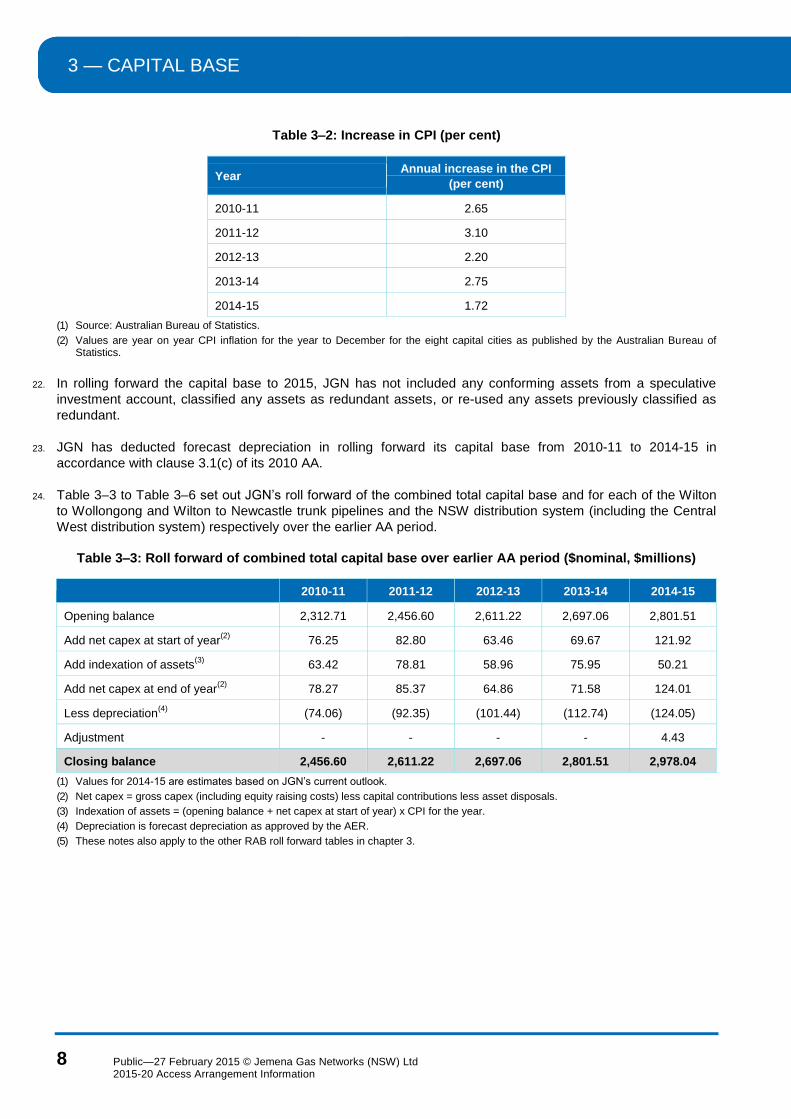
21. The following projections of the capital base are based on actual data for capex, capital contributions and asset
disposals for the years 2010-11, 2011-12, 2012-13 and 2013-14. In addition:
consumer price index (CPI) values are as set out in Table 3–2
economic and remaining asset lives are as presented in section 3.4.2.
1 Rule 77.
3 — CAPITAL BASE
8 Public—27 February 2015 © Jemena Gas Networks (NSW) Ltd 2015-20 Access Arrangement Information
Table 3–2: Increase in CPI (per cent)
Year Annual increase in the CPI
(per cent)
2010-11 2.65
2011-12 3.10
2012-13 2.20
2013-14 2.75
2014-15 1.72
(1) Source: Australian Bureau of Statistics.
(2) Values are year on year CPI inflation for the year to December for the eight capital cities as published by the Australian Bureau of Statistics.
22. In rolling forward the capital base to 2015, JGN has not included any conforming assets from a speculative
investment account, classified any assets as redundant assets, or re-used any assets previously classified as
redundant.
23. JGN has deducted forecast depreciation in rolling forward its capital base from 2010-11 to 2014-15 in
accordance with clause 3.1(c) of its 2010 AA.
24. Table 3–3 to Table 3–6 set out JGN’s roll forward of the combined total capital base and for each of the Wilton
to Wollongong and Wilton to Newcastle trunk pipelines and the NSW distribution system (including the Central
West distribution system) respectively over the earlier AA period.
Table 3–3: Roll forward of combined total capital base over earlier AA period ($nominal, $millions)
2010-11 2011-12 2012-13 2013-14 2014-15
Opening balance 2,312.71 2,456.60 2,611.22 2,697.06 2,801.51
Add net capex at start of year(2)
76.25 82.80 63.46 69.67 121.92
Add indexation of assets(3)
63.42 78.81 58.96 75.95 50.21
Add net capex at end of year(2)
78.27 85.37 64.86 71.58 124.01
Less depreciation(4)
(74.06) (92.35) (101.44) (112.74) (124.05)
Adjustment - - - - 4.43
Closing balance 2,456.60 2,611.22 2,697.06 2,801.51 2,978.04
(1) Values for 2014-15 are estimates based on JGN’s current outlook.
(2) Net capex = gross capex (including equity raising costs) less capital contributions less asset disposals.
(3) Indexation of assets = (opening balance + net capex at start of year) x CPI for the year.
(4) Depreciation is forecast depreciation as approved by the AER.
(5) These notes also apply to the other RAB roll forward tables in chapter 3.

CAPITAL BASE — 3
Public—27 February 2015 © Jemena Gas Networks (NSW) Ltd
2015-20 Access Arrangement Information
9
Table 3–4: Roll forward of Wilton to Wollongong trunk pipeline capital base over earlier AA period ($nominal, $millions)
2010-11 2011-12 2012-13 2013-14 2014-15
Opening balance 8.44 8.46 8.51 8.49 8.50
Add net capex at start of year - - - - -
Add indexation of assets 0.22 0.26 0.19 0.23 0.15
Add net capex at end of year - - - - -
Less depreciation (0.20) (0.21) (0.21) (0.22) (0.22)
Adjustment - - - - -
Closing balance 8.46 8.51 8.49 8.50 8.42
Table 3–5: Roll forward of Wilton to Newcastle trunk pipeline capital base over earlier AA period ($nominal, $millions)
2010-11 2011-12 2012-13 2013-14 2014-15
Opening balance 129.47 130.15 131.34 131.33 133.73
Add net capex at start of year (0.00) - 0.00 0.87 -
Add indexation of assets 3.44 4.04 2.90 3.63 2.30
Add net capex at end of year (0.00) - 0.00 0.89 -
Less depreciation (2.76) (2.85) (2.91) (2.99) (3.05)
Adjustment - - - - (3.54)
Closing balance 130.15 131.34 131.33 133.73 129.43
Table 3–6: Roll forward of NSW distribution system capital base over earlier AA period ($nominal, $millions)
2010-11 2011-12 2012-13 2013-14 2014-15
Opening balance 2,174.80 2,317.99 2,471.37 2,557.25 2,659.28
Add net capex at start of year 76.25 82.80 63.46 68.80 121.92
Add indexation of assets 59.76 74.51 55.88 72.09 47.77
Add net capex at end of year 78.27 85.37 64.86 70.68 124.01
Less depreciation (71.10) (89.30) (98.32) (109.53) (120.77)
Adjustment - - - - 7.97
Closing balance 2,317.99 2,471.37 2,557.25 2,659.28 2,840.18
25. The closing balance values for 2014-15 constitute the opening capital base for the 2015-20 AA period.

3 — CAPITAL BASE
10 Public—27 February 2015 © Jemena Gas Networks (NSW) Ltd 2015-20 Access Arrangement Information
3.3 PROJECTED CAPITAL BASE IN THE AA PERIOD
26. The projected capital base in the AA period is set out in Table 3–7, Table 3–8, Table 3–9 and Table 3–10.
Table 3–7: Roll forward of combined total capital base over the AA period ($nominal, $millions)
2015-16 2016-17 2017-18 2018-19 2019-20
Opening balance 2,978.04 3,153.40 3,311.10 3,473.06 3,608.32
Add net capex at start of year 119.61 117.16 126.01 118.36 105.65
Add indexation of assets 78.93 83.34 87.58 91.51 94.64
Add net capex at end of year 122.66 120.15 129.22 121.38 108.34
Less depreciation (145.84) (162.95) (180.85) (195.99) (184.66)
Adjustment - - - - -
Closing balance 3,153.40 3,311.10 3,473.06 3,608.32 3,732.29
Table 3–8: Roll forward of Wilton to Wollongong capital base over the AA period ($nominal, $millions)
2015-16 2016-17 2017-18 2018-19 2019-20
Opening balance 8.42 8.41 8.39 8.37 8.33
Add net capex at start of year - - - - -
Add indexation of assets 0.21 0.21 0.21 0.21 0.21
Add net capex at end of year - - - - -
Less depreciation (0.23) (0.23) (0.24) (0.25) (0.25)
Adjustment - - - - -
Closing balance 8.41 8.39 8.37 8.33 8.29
Table 3–9: Roll forward of Wilton to Newcastle trunk pipeline capital base over the AA period ($nominal, $millions)
2015-16 2016-17 2017-18 2018-19 2019-20
Opening balance 129.43 129.61 129.71 129.73 129.67
Add net capex at start of year - - - - -
Add indexation of assets 3.30 3.30 3.31 3.31 3.30
Add net capex at end of year - - - - -
Less depreciation (3.12) (3.20) (3.28) (3.37) (3.45)
Adjustment - - - - -
Closing balance 129.61 129.71 129.73 129.67 129.52

CAPITAL BASE — 3
Public—27 February 2015 © Jemena Gas Networks (NSW) Ltd
2015-20 Access Arrangement Information
11
Table 3–10: Roll forward of NSW distribution system capital base over the AA period ($nominal, $millions)
2015-16 2016-17 2017-18 2018-19 2019-20
Opening balance 2,840.18 3,015.38 3,173.00 3,334.97 3,470.32
Add net capex at start of year 119.61 117.16 126.01 118.36 105.65
Add indexation of assets 75.42 79.82 84.06 87.99 91.12
Add net capex at end of year 122.66 120.15 129.22 121.38 108.34
Less depreciation (142.49) (159.51) (177.33) (192.38) (180.96)
Adjustment - - - - -
Closing balance 3,015.38 3,173.00 3,334.97 3,470.32 3,594.47
3.4 DEPRECIATION
3.4.1 SUMMARY
27. JGN has established a depreciation schedule that reflects the economic lives and cash flow needs of the
business consistent with the NGR requirements.
28. Table 3–11 summaries JGN’s forecast deprecation over the 2015-20 AA period, determined by applying the real
straight-line depreciation method.
Table 3–11: Forecast depreciation over the AA period ($nominal, $millions)
Depreciation 2015-16 2016-17 2017-18 2018-19 2019-20 Total
Total 145.84 162.95 180.85 195.99 184.66 870.30
3.4.2 ASSUMPTIONS ON ECONOMIC LIFE OF ASSETS FOR REGULATORY DEPRECIATION
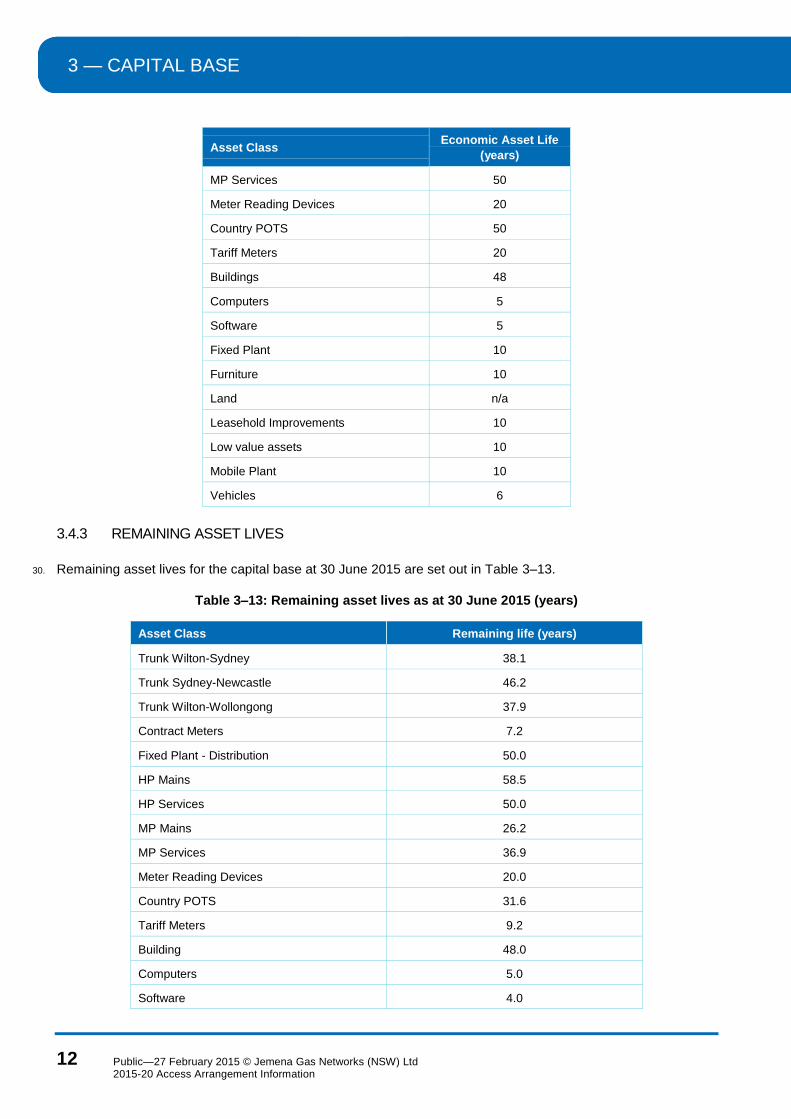
29. The economic lives that JGN has adopted for its assets are set out in Table 3–12.
Table 3–12: Economic lives of JGN assets (years)
Asset Class Economic Asset Life
(years)
Trunk Wilton-Sydney 80
Trunk Sydney-Newcastle 80
Trunk Wilton-Wollongong 80
Contract Meters 20
Fixed Plant - Distribution 50
High Pressure (HP) Mains 80
HP Services 50
Medium Pressure (MP) Mains 50
3 — CAPITAL BASE
12 Public—27 February 2015 © Jemena Gas Networks (NSW) Ltd 2015-20 Access Arrangement Information
Asset Class Economic Asset Life
(years)
MP Services 50
Meter Reading Devices 20
Country POTS 50
Tariff Meters 20
Buildings 48
Computers 5
Software 5
Fixed Plant 10
Furniture 10
Land n/a
Leasehold Improvements 10
Low value assets 10
Mobile Plant 10
Vehicles 6
3.4.3 REMAINING ASSET LIVES
30. Remaining asset lives for the capital base at 30 June 2015 are set out in Table 3–13.
Table 3–13: Remaining asset lives as at 30 June 2015 (years)
Asset Class Remaining life (years)
Trunk Wilton-Sydney 38.1
Trunk Sydney-Newcastle 46.2
Trunk Wilton-Wollongong 37.9
Contract Meters 7.2
Fixed Plant - Distribution 50.0
HP Mains 58.5
HP Services 50.0
MP Mains 26.2
MP Services 36.9
Meter Reading Devices 20.0
Country POTS 31.6
Tariff Meters 9.2
Building 48.0
Computers 5.0
Software 4.0

CAPITAL BASE — 3
Public—27 February 2015 © Jemena Gas Networks (NSW) Ltd
2015-20 Access Arrangement Information
13
Asset Class Remaining life (years)
Fixed Plant 8.6
Furniture 10.0
Land -
Leasehold Improvements 10.0
Low value assets 10.0
Mobile Plant 8.4
Vehicles 3.2
Stock 1.0
Equity Raising Costs 49.9
Weighted average remaining asset life 32.8
3.4.4 FORECAST DEPRECIATION
31. The amount of regulatory depreciation for each asset class is determined for each year of the AA period by
applying the real straight-line depreciation method to the opening regulatory value of each asset class for each
year. Real straight-line depreciation (as distinct from historical cost straight-line) involves deducting the same
real amount of depreciation in each year of an asset’s life.
32. Forecast regulatory depreciation for the AA period is provided in Table 3–14. A demonstration of how the
forecast is derived is included in appendix 10.1 of our response to the draft decision.
Table 3–14: Forecast depreciation over AA period ($nominal, $millions)
2015-16 2016-17 2017-18 2018-19 2019-20 Total
Wilton-Wollongong trunk 0.23 0.23 0.24 0.25 0.25 1.20
Wilton-Newcastle trunk 3.12 3.20 3.28 3.37 3.45 16.43
NSW distribution network 142.49 159.51 177.33 192.38 180.96 852.67
Total 145.84 162.95 180.85 195.99 184.66 870.30
33. Forecast depreciation for the AA period, adjusted for the difference between forecast and actual CPI, will be
used in rolling forward the capital base to the beginning of the AA period beginning on 1 July 2020 (rule 90(2) of
the NGR).

3 — CAPITAL BASE
14 Public—27 February 2015 © Jemena Gas Networks (NSW) Ltd 2015-20 Access Arrangement Information
3.5 CAPITAL CONTRIBUTIONS
34. Table 3–15 and Table 3–16 set out JGN’s capital contributions over the 2010-15 and 2015-20 AA periods,
respectively.
Table 3–15: Capital contributions over the earlier AA period ($nominal, $millions)
2010-11 2011-12 2012-13 2013-14
2014-15
estimate Total
Total contributions received(2)
7.49 3.71 5.34 14.48 10.32 41.34
(1) The value or 2014-15 is an estimate based on JGN’s current outlook.
(2) Capital contributions are assumed to be received 50 per cent at the start of the year, and 50 per cent at the end of the year, and are converted to year-end dollars.
Table 3–16: Capital contributions over the AA period ($nominal, $millions)
Details 2015-16 2016-17 2017-18 2018-19 2019-20 Total
Total contributions received(1)
5.84 5.40 5.25 5.41 5.56 27.46
(1) Capital contributions are assumed to be received 50 per cent at the start of the year, and 50 per cent at the end of the year, and are converted to year-end dollars.
3.6 CONFORMING CAPITAL EXPENDITURE
35. Table 3–17 and Table 3–18 set out JGN’s conforming capital expenditure over the 2010-15 and 2015-20 AA
periods, respectively.
Table 3–17: Conforming capital expenditure over the earlier AA period ($nominal, $millions)
Details 2010-11 2011-12 2012-13 2013-14 2014-15
estimate Total
Market expansion 57.63 65.36 76.20 92.85 101.23 393.27
System reinforcement,
replacement and renewal 64.52 79.63 40.96 39.45 69.74 294.30
Non-system assets 44.18 29.86 18.20 25.77 85.36 203.36
Gross capital expenditure 166.33 174.85 135.37 158.06 256.34 890.94
Less capital contributions (7.49) (3.71) (5.34) (14.48) (10.32) (41.34)
Conforming capital expenditure 158.83 171.13 130.03 143.58 246.02 849.60
(1) Values for 2014-15 are estimates based on JGN’s current outlook.
(2) Capex is assumed to be spent 50 per cent at the start of the year, and 50 per cent at the end of the year, and converted to year-end dollars.

CAPITAL BASE — 3
Public—27 February 2015 © Jemena Gas Networks (NSW) Ltd
2015-20 Access Arrangement Information
15
Table 3–18: Conforming capital expenditure over the AA period ($nominal, $millions)
Details 2015-16 2016-17 2017-18 2018-19 2019-20 Total
Market expansion 95.08 97.55 98.12 99.32 99.10 489.17
System reinforcement,
replacement and renewal 103.80 109.77 122.77 118.19 105.01 559.53
Non-system assets 52.41 38.48 42.95 31.00 18.33 183.17
Gross capital expenditure 251.29 245.80 263.84 248.50 222.43 1,231.87
Less capital contributions (5.84) (5.40) (5.25) (5.41) (5.56) (27.46)
Conforming capital expenditure 245.45 240.40 258.59 243.09 216.87 1,204.41
(1) Capex is assumed to be spent 50 per cent at the start of the year, and 50 per cent at the end of the year, and converted to year-end dollars.
3.7 DISPOSALS
36. Table 3–19 and Table 3–20 set out JGN’s asset disposals over the 2010-15 and 2015-20 AA periods
respectively.
Table 3–19: Asset disposals over the 2015-20 AA period ($nominal, $millions)
2010-11 2011-12 2012-13 2013-14
2014-15
estimate Total
Total asset disposals(1)
6.48 2.98 1.71 2.35 0.09 13.62
(1) The value for 2014-15 is an estimate based on JGN’s current outlook.
(2) Asset disposals are assumed to occur 50 per cent at the start of the year, and 50 per cent at the end of the year, and are converted to year-end dollars.
Table 3–20: Asset disposals over the 2015-20 AA period ($nominal, $millions)
2015-16 2016-17 2017-18 2018-19 2019-20 Total
Total asset disposals(1)
0.13 0.11 0.15 0.34 0.19 0.91
(1) Asset disposals are assumed to occur 50 per cent at the start of the year, and 50 per cent at the end of the year, and are converted to year-end dollars.

4 — DEMAND
16 Public—27 February 2015 © Jemena Gas Networks (NSW) Ltd 2015-20 Access Arrangement Information
4. DEMAND
4.1 JGN’S DEMAND FORECASTING APPROACH
37. JGN engaged Core Energy to prepare the demand forecasts for the AA period. The demand forecasting
approach for the broadly involved forecasting customer numbers and the average consumption per connection
to provide total forecast demand.2
4.1.1 APPROACH TO FORECASTING CUSTOMER NUMBERS
38. The approach to forecasting customer connections involved:
using regression analysis to determine the historical trend in new connections to derive a suitable forecast
for each year
analysing the historical trend in the rate of disconnections to derive a suitable forecast for each year
adjusting connection forecasts for factors which are not present in the historical trend, including forecast
changes in the relative prices of gas and electricity.
4.1.2 APPROACH TO FORECASTING DEMAND PER CONNECTION
39. The approach to forecasting demand per connection involved:
normalise total demand per annum for the effects of weather
divide total demand by number of connections to determine consumption per connection
determine the historical trend in consumption per connection to establish a base for projection
adjust consumption per connection forecasts for factors which are not present in the historical trend,
including the impact of rising wholesale gas prices and increasing appliance substitution.
4.1.2.1 Weather normalisation
40. JGN weather normalised the historical gas consumption data using Effective Degree Days (EDD), where cooler
temperatures (below a given threshold), result in higher gas use for heating purposes. This approach is based
on AEMO guidelines.3 Core Energy’s approach is summarised in Box 4–1.
2 Rule 72(1)(d) provides that the AAI must include to the extent practicable a forecast of pipeline capacity over the 2015-20 AA period
and the basis upon which the forecast has been derived. Capacity information for a distribution network is not available or meaningful for a distribution pipeline. The JGN network is a geographically dispersed network made up of interconnected pipes and there are a number of practical considerations governing why the calculation of capacity is not practicable.
3 AEMO, 2012 review of the weather standards for gas forecasting, April 2012.

DEMAND — 4
Public—27 February 2015 © Jemena Gas Networks (NSW) Ltd
2015-20 Access Arrangement Information
17
Box 4–1 Core Energy forecasting method
Core Energy’s process of weather normalising demand using EDD involves:
specifying the EDD index for calculating EDD. This involves using regression analysis to determine the
coefficients providing the best fit between demand and weather for JGN’s NSW network
using historical temperature data at the Sydney Airport weather station, determine the trend in historical EDD
determining an appropriate ‘normalised’ EDD figure for each year (either a trending series or, if no trend in EDD is
apparent, the average yearly EDD) which represents normal weather conditions. In the case of Sydney Airport no
long-term trend in EDD was evident, thus an average EDD was used
comparing the actual EDD recorded each year to the normalised EDD figure for that year to obtain the ‘abnormal’
EDD
using regression analysis to determine the sensitivity of demand to EDD in each year for each customer class,
multiplying this factor by the abnormal EDD figure to arrive at the total abnormal gas demand due to weather for
each year
subtracting abnormal demand from actual demand to arrive at weather normalised demand for each customer
class.
4.1.2.2 Price elasticity
41. Projected retail gas and electricity prices impact on forecast gas consumption.
42. Over time, higher gas prices result in customers using less gas. We captured this relationship through a long-
term own price elasticity of -0.3 for residential customers, and -0.35 for non-residential customers, consistent
with the AER’s decision for Envestra (Victoria).
43. Over time, decreases in retail electricity prices relative to gas prices will also result in customers using less gas.
Core Energy captured this relationship through a long-term cross price elasticity of -0.1 for residential customers
and non-residential customers. While the AER has not considered this effect previously, Core Energy considers
material relative increases in retail gas prices and increasing fuel choice will impact customers’ decisions in the:
short term—particularly given the high penetration of reverse cycle air-conditioning in NSW that provides
customers with heating choice
longer term—as customers make appliance replacement decisions, such as the choice of hot water supply.
44. Core Energy projected retail gas and electricity prices using a range of publicly available regulatory decisions
and market evidence.
4.2 DEMAND FORECASTS
45. Tables 4–1 to 4–3 set out JGN’s forecast customer numbers, average consumption and total consumption over
the AA period respectively.

4 — DEMAND
18 Public—27 February 2015 © Jemena Gas Networks (NSW) Ltd 2015-20 Access Arrangement Information
Table 4–1: Forecast customer numbers by customer type
2015-16 2016-17 2017-18 2018-19 2019-20
Total Volume Market 1,284,008 1,317,392 1,348,273 1,376,669 1,402,603
Total Demand Market 443 441 441 441 441
Total customers 1,284,451 1,317,833 1,348,714 1,377,110 1,403,044
Table 4–2: Forecast average daily consumption by customer type and MDQ (TJ)
2015-16 2016-17 2017-18 2018-19 2019-20
Volume market 94.84 95.19 94.76 94.30 93.86
Demand market 132.42 130.49 128.62 126.81 124.69
Total average load 227.26 225.68 223.39 221.11 218.55
Demand market MDQ/CD 276.78 272.29 269.31 266.93 266.93
Table 4–3: Forecast consumption by customer type (TJ): 2016-20
2015-16 2016-17 2017-18 2018-19 2019-20
Total volume market 34,710 34,746 34,589 34,419 34,352
Total demand market 48,466 47,627 46,948 46,285 45,638
Total consumption 83,176 82,373 81,537 80,703 79,990
46. Forecast average residential consumption is set out in Table 4–4.
Table 4–4: Actual and forecast average consumption by volume market type (GJ)
Demand per Connection 2013-14 2014-15 2015-16 2016-17 2017-18 2018-19 2019-20
Existing residential 20.08 19.30 18.69 18.35 17.97 17.66 17.38
Electricity to gas (E to G) 11.83 11.34 10.99 10.78 10.56 10.38 10.22
New estates 18.05 17.31 16.76 16.45 16.11 15.83 15.59
New medium density 16.46 15.78 15.29 15.00 14.69 14.44 14.21
Small business 246.36 204.53 193.50 186.24 177.85 168.87 161.73
I&C 455.88 466.65 411.75 403.49 392.08 378.69 369.15

OPERATING EXPENDITURE — 5
Public—27 February 2015 © Jemena Gas Networks (NSW) Ltd
2015-20 Access Arrangement Information
19
5. OPERATING EXPENDITURE
5.1 FORECASTING BASIS
47. JGN has employed two methods for forecasting opex over the 2015-20 AA period:
base, step and trend approach—applied to the adjusted base year opex amount, which excludes opex cost
categories that are subject to specific annual forecasts over the 2015-20 AA period
specific year-by-year forecasts—for items where base year costs are not representative of the future.
48. JGN has adjusted the base year by subtracting costs relating to non-recurrent events and circumstances that
are not expected to endure. JGN has then trended its adjusted base year costs forward, escalating or de-
escalating the forecast by applying a rate of change.
49. Step changes are then added to the trended adjusted base year. Step changes involve increases or decreases
in costs due to new regulatory obligations, changes in good industry practice and JGN’s operating environment.
These costs reflect forecast prudent and efficient opex not captured by the base year expenditure or trend
escalation.
5.2 OPERATING EXPENDITURE FORECAST
50. Table 5–1 summarises JGN’s forecast opex for the AA period.
Table 5–1: JGN forecast O&M costs over the AA period ($2015, $millions)
Level 1
category Level 2 category 2013-14 2014-15 2015-16 2016-17 2017-18 2018-19 2019-20
O&M Maintenance 28.37 27.43 27.77 28.56 28.01 28.16 28.30
Emergency
response 4.50 4.39 4.41 4.44 4.48 4.50 4.53
Management -
O&M 12.66 12.35 12.43 12.50 12.62 12.68 12.75
Network planning 6.52 6.37 6.40 6.44 6.50 6.53 6.57
Network control
and operational
switching
7.05 6.88 6.92 6.96 7.02 7.06 7.10
Project
governance and
related functions
5.08 4.96 4.99 5.02 5.06 5.09 5.12
Quality and
standard
functions
3.51 3.43 3.45 3.47 3.50 3.52 3.54
Other 13.56 13.80 15.43 14.48 14.82 14.71 14.84
Information
technology (IT) 14.32 13.97 15.55 17.14 16.77 16.34 16.41

5 — OPERATING EXPENDITURE
20 Public—27 February 2015 © Jemena Gas Networks (NSW) Ltd 2015-20 Access Arrangement Information
Corporate
overheads - O&M 17.31 16.89 16.99 17.09 17.25 17.34 17.43
Pigging/Integrity
digs, adhoc mains
renewal
1.49 - - - - - -
Non-O&M
(A&O)
Corporate
overheads - A&O 9.36 9.22 9.34 9.39 9.48 9.53 9.54
Management -
A&O 2.41 2.35 2.37 2.38 2.40 2.41 2.43
Other directs 5.53 3.02 3.03 3.05 3.12 7.56 6.40
Non-O&M
(Other)
Government
levies 3.98 3.98 3.98 3.98 3.98 3.98 3.98
Marketing 7.65 7.46 8.81 8.85 8.92 8.96 9.00
Unaccounted for
gas (UAG) 13.74 16.36 15.85 15.86 15.79 15.71 15.68
Carbon costs 7.17 0.04 0.04 0.04 0.04 0.04 0.04
Debt raising costs - - 3.23 3.32 3.40 3.47 3.50
Consolidated Total JGN opex 164.20 152.89 160.96 162.99 163.18 167.60 167.14

RATE OF RETURN — 6
Public—27 February 2015 © Jemena Gas Networks (NSW) Ltd
2015-20 Access Arrangement Information
21
6. RATE OF RETURN
6.1 RATE OF RETURN
51. The allowed rate of return (specified as a nominal vanilla WACC) is 7.15 per cent per annum as set out in Table
6–1. This WACC is updated annually for the trailing average return on debt, using the methods specified in the
AA.
Table 6–1: JGN’s WACC
Parameters JGN proposal (per cent)
Return on equity 9.87
Return on debt 5.33
Inflation 2.55
Leverage 60.00
Gamma 25.00
Corporate tax rate 30.00
Nominal vanilla WACC 7.15
(1) Return on debt, return on equity, and nominal WACC are estimated using data from the sample averaging period of the 20 business days to 30 January 2015 (inclusive).
(2) Gamma is discussed in chapter 10 and appendix 10.1.
(3) Values may not add due to rounding.
6.2 DEPARTURES FROM THE GUIDELINE
52. JGN has departed from the AER’s rate of return guideline to the extent that we do not consider that the
guideline best achieves the allowed rate of return objective. The departures from the rate of return guideline
are:
JGN has adopted a different methodology for estimating the return on equity
JGN has adopted a different credit rating assumption for the purposes of estimating the return on debt
JGN has adopted a different method for transitioning to the trailing average portfolio approach to estimating
the return on debt
JGN has adopted a different method for selection of future averaging periods, for the purposes of estimating
the prevailing return on debt in each year of the AA period
JGN has adopted a different estimate of the value of imputation credits (gamma).
53. In each case the reason for the departure is that we do not consider that the guideline best achieves the allowed
rate of return objective. The reasons for these departures are explained in detail in chapter 7 of JGN’s response
to the draft decision, and associated appendices.4
4 JGN, JGN 2015-20 access arrangement - response to the draft decision, 27 February 2015.
6 — RATE OF RETURN
22 Public—27 February 2015 © Jemena Gas Networks (NSW) Ltd 2015-20 Access Arrangement Information
6.3 FORMULA APPLIED UNDER RULE 87(12)
54. JGN applies a four step process for updating the return on debt each year over the AA period:
steps 1 and 2: estimate a ‘spot rate’ return on debt for the relevant year, where:
– the averaging period for the spot rate is nominated by JGN and either accepted or rejected by the AER
in advance of that period and, if rejected, an alternative period is set by the AER (step 1)
– the spot rate is estimated using the average of available independent third party data sources, or where
the estimates from these sources diverge by more than 60 basis points, the independent third party data
source that best fits the traded bond data over that averaging period, where the fit is measured
statistically (step 2).
JGN gives effect to this step using a process that automatically selects the best fitting independent third
party estimate. This process is codified in clause 5 of our AA. The process is specified in as much detail as
possible, so that it can be applied automatically and within a relatively short timeframe.
The estimate produced by step 2 is not the return on debt that will be used to update total revenue and
tariffs for the relevant year—rather, it is one parameter in the calculation of the updated return on debt (see
step 3 below).
step 3: update the trailing average to derive the updated return on debt figure to apply for the relevant year.
This is the return on debt used to update total revenue and tariffs. The updated trailing average return on
debt is a function of the ‘spot rate’ estimated in step 2 for that year, the spot rates for previous years, and a
transitional value.
– The return on debt is updated using an automatic application of a weighted average formula. The
weighted average formula is set out in clause 5 of the AA.
step 4: update total revenue and tariffs entering the return on debt figure from step 3 into JGN’s revenue
forecast model (draft decision response appendix 10.1) and resolving for the relevant X factors in years
three to four of the AA period. As required by the NGR, the change in total revenue resulting from any
update to the return on debt is given effect by automatic application of a formula that is set out in JGN’s
revised revenue forecast model (draft decision response appendix 10.1). Once the updated return on debt is
entered, this model updates forecast revenues and X factors automatically using the formulae embedded
within it.
55. This process is specified in JGN’s AA.
CORPORATE INCOME TAX — 7
Public—27 February 2015 © Jemena Gas Networks (NSW) Ltd
2015-20 Access Arrangement Information
23
7. CORPORATE INCOME TAX
7.1 VALUE OF IMPUTATION CREDITS
56. The value of imputation credits is 0.25.
7.2 COST OF CORPORATE INCOME TAX
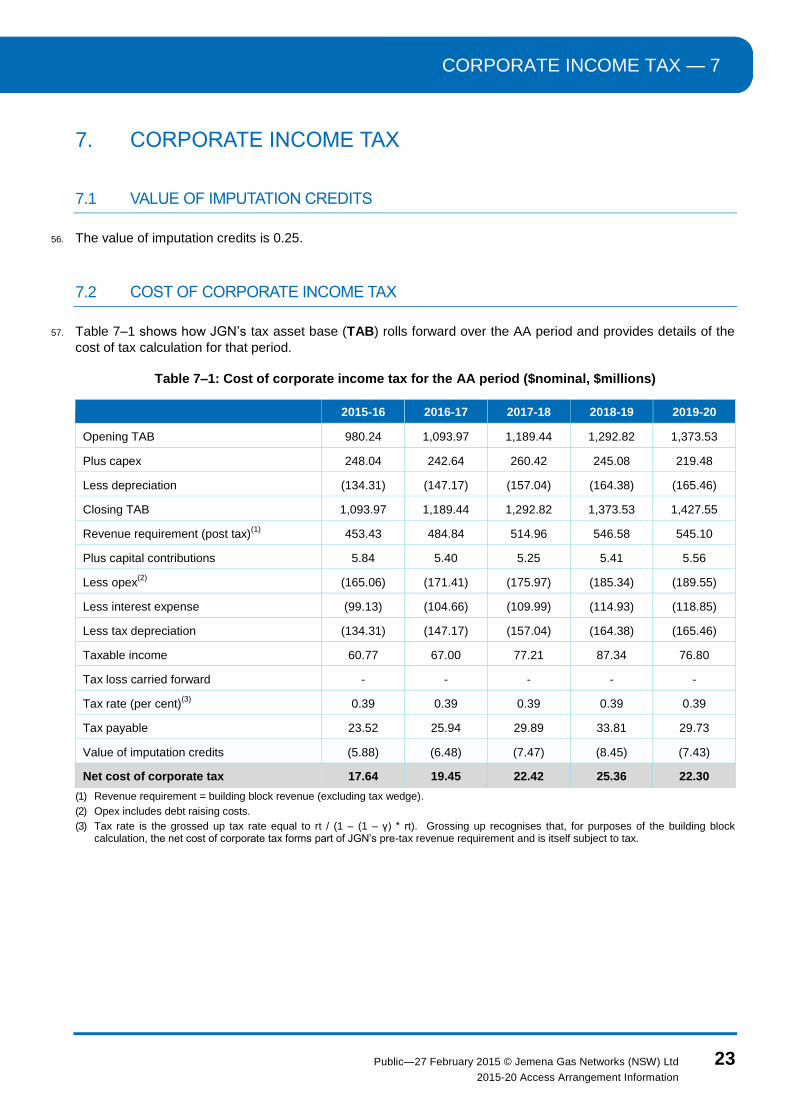
57. Table 7–1 shows how JGN’s tax asset base (TAB) rolls forward over the AA period and provides details of the
cost of tax calculation for that period.
Table 7–1: Cost of corporate income tax for the AA period ($nominal, $millions)
2015-16 2016-17 2017-18 2018-19 2019-20
Opening TAB 980.24 1,093.97 1,189.44 1,292.82 1,373.53
Plus capex 248.04 242.64 260.42 245.08 219.48
Less depreciation (134.31) (147.17) (157.04) (164.38) (165.46)
Closing TAB 1,093.97 1,189.44 1,292.82 1,373.53 1,427.55
Revenue requirement (post tax)(1)
453.43 484.84 514.96 546.58 545.10
Plus capital contributions 5.84 5.40 5.25 5.41 5.56
Less opex(2)
(165.06) (171.41) (175.97) (185.34) (189.55)
Less interest expense (99.13) (104.66) (109.99) (114.93) (118.85)
Less tax depreciation (134.31) (147.17) (157.04) (164.38) (165.46)
Taxable income 60.77 67.00 77.21 87.34 76.80
Tax loss carried forward - - - - -
Tax rate (per cent)(3)
0.39 0.39 0.39 0.39 0.39
Tax payable 23.52 25.94 29.89 33.81 29.73
Value of imputation credits (5.88) (6.48) (7.47) (8.45) (7.43)
Net cost of corporate tax 17.64 19.45 22.42 25.36 22.30
(1) Revenue requirement = building block revenue (excluding tax wedge).
(2) Opex includes debt raising costs.
(3) Tax rate is the grossed up tax rate equal to rt / (1 – (1 – γ) * rt). Grossing up recognises that, for purposes of the building block calculation, the net cost of corporate tax forms part of JGN’s pre-tax revenue requirement and is itself subject to tax.

8 — INCENTIVE MECHANISMS
24 Public—27 February 2015 © Jemena Gas Networks (NSW) Ltd 2015-20 Access Arrangement Information
8. INCENTIVE MECHANISMS
8.1 2010-15 AA PERIOD
58. JGN’s 2010 AA includes an incentive mechanism relating to the rate of unaccounted for gas (UAG). JGN is
provided a fixed allowance for a quantity of UAG based on a target percentage rate of total network receipts. In
the 2010-15 AA period this rate is 2.34 per cent of receipts. If the actual UAG rate is below (above) this rate,
JGN over (under) recovers its actual UAG costs.
59. The 2010 AA stipulates a one year lag for the pass through of the recoverable amount (which captures the
penalty or reward).5 The pass through amounts for RY11-RY14 have been recovered through JGN’s reference
tariffs for RY12-RY15.
60. In accordance with the annual reference tariff variation mechanism the penalty or reward for RY15 UAG
performance will be reflected in reference tariffs for 2016-17.
8.2 2015-20 AA PERIOD
8.2.1 UNACCOUNTED FOR GAS
61. To provide a continuous incentive to manage network leakages, a UAG incentive mechanism applies in the AA
period as follows:
the current UAG incentive scheme applies based on an efficient annual target rate of UAG
JGN is compensated for variation in total market volumes and costs of purchasing UAG (which remain
outside JGN’s control) through an automatic annual adjustment
the efficient level of UAG is represented as two different UAG target rates – one applied to daily metered
customer withdrawals and the other to gas received to supply non-daily metered customers
a two year lag is applied to cost recovery, removing reliance on forecast gas receipts and allowing JGN to
submit its annual TVN as early as 15 March each year.
62. The mechanism is specified in section 2 of schedule 3 to AA.
8.2.2 OPERATING EXPENDITURE
63. JGN applies an efficiency carryover mechanism (ECM) to 2015-20 AA period opex. This provides JGN a
continuous incentive to seek opex efficiencies over the AA period.
64. The operation of the ECM is expressed in a fixed principle set out in clause 12 of the AA. The primary features
of the ECM are:
JGN will keep the benefit (or will incur the cost) of delivering actual opex lower (higher) than forecast opex in
each year of an AA period
the ECM carries forward JGN’s incremental efficiency gains for the length of the carryover period
5 A time value of money (WACC) adjustment is applied to account for this lag.

INCENTIVE MECHANISMS — 8
Public—27 February 2015 © Jemena Gas Networks (NSW) Ltd
2015-20 Access Arrangement Information
25
this carryover period length is five years
the carryover amounts is an additional 'building block' when setting JGN’s reference service revenue for the
AA period commencing 1 July 2020.

9 — REFERENCE TARIFFS
26 Public—27 February 2015 © Jemena Gas Networks (NSW) Ltd 2015-20 Access Arrangement Information
9. REFERENCE TARIFFS
9.1 PRICING PRINCIPLES AND BASIS OF REFERENCE TARIFFS
65. JGN has considered the following pricing principles and objectives when constructing its current tariff classes
and charge components for the 2015-20 AA period:
recover our efficient costs of operation—we need to recover our allowed revenue to continue to provide safe
and reliable natural gas services into the future
keep gas competitive—maintain and enhance the attractiveness and position of natural gas as a value for
money fuel of choice in NSW
price efficiently and equitably—ensure that similar customers are grouped together and that these
customers pay for gas in a way that encourages efficient use of the network
provide stability in our network tariffs and end-retail prices—where possible minimise any sharp change in
end customer bills
provide simplicity and transparency in our tariffs—consider customer preferences, the transaction costs of
providing customised tariffs and ensuring customers and stakeholders can make sense of our charges.
66. To support these objectives, JGN splits its tariff classes between two different customer categories:
volume customers, who include residential and small industrial and commercial end customers
demand customers, who are larger commercial and industrial end customers.
67. Within the volume and demand categories, individual customers are primarily distinguished based on their
location, the characteristics of the end customer, and likelihood of their consumption being more or less than 10
TJ of gas per year. In most cases volume customers have consumption below 10 TJ per annum and demand
customers have consumption above 10 TJ per annum—which is a common delineation across jurisdictions.
68. To accommodate intermediaries, there may be limited instances where it is not appropriate for JGN to apply the
10 TJ delineation and provides necessary changes to the assignment criteria.
69. The volume tariff classes for the haulage reference service are set out in Table 9–1.

REFERENCE TARIFFS — 9
Public—27 February 2015 © Jemena Gas Networks (NSW) Ltd
2015-20 Access Arrangement Information
27
Table 9–1: JGN’s volume reference tariff classes
Tariff category
Number of
tariff
classes
Tariff
classes Types of customers Why included
Volume individual
metered
2 VI-Coastal
VI-Country
(previously
V-Coastal
and
V-Country )
Most of our 1.2 million
existing customers,
including residential and
small and medium
businesses consuming
up to 10 TJ per annum
New customers
consuming up to 10 TJ
per annum with
individual metering by
JGN.
most of JGN’s existing and new
customers.
Volume boundary
metered (new)
2 VB-Coastal
VB-Country
Residential end customers in
higher-density residential
developments and small
business customers in
commercial developments
supplied energy by an
energy intermediary that sits
between the boundary
meters and the end
customers.
Increasing demand for boundary
metered supply to higher-density
developments where energy
intermediaries then on-sell energy
to residential or business end
customers. We want to encourage
innovative, efficient and customer
focused energy services.
Residential
distributed
generation
technology (new)
4 VRT-03,
VRT-04,
VRT-06,
VRT-10
Residential end customers
supplied energy by an
intermediary using a large-
scale generation unit in a
residential precinct
(consuming more than 50 TJ
per annum).
Recent technological, market and
policy developments mean
residential customers in large
precincts may be supplied
electricity, heating or cooling from
a gas fired plant (cogeneration or
trigeneration). We want to
encourage innovative, efficient
and customer focused energy
services, and promote gas usage
to lower average prices for all
customers.
70. The demand tariff classes for the haulage reference service are set out in Table 9–2. The numbers associated
with the tariff classes are ‘identifiers’. These identifiers relate to groups of postcodes and are set out within the
AA. JGN ranks the cost relativities of supplying demand customers in different postcodes using a system of
cost-reflective drivers.
Table 9–2: JGN demand reference tariff classes
Tariff category Number of
tariff classes Tariff class names Types of customers Why included
Capacity country 1 DC Country Most of our large
industrial customers
Maintains existing tariff
classes Capacity coastal 11 DC1 to DC11
Throughput 1 DT
Maintains existing tariff classes for

9 — REFERENCE TARIFFS
28 Public—27 February 2015 © Jemena Gas Networks (NSW) Ltd 2015-20 Access Arrangement Information
Tariff category Number of
tariff classes Tariff class names Types of customers Why included
Major end-user
(throughput)
5 DMT1 to DMT5
First response 2 DCFR-06 &
DMTFR-03
Several large
industrial customers
with flexibility in
operations to reduce
demand as a first
priority response
Grandfathered tariff
classes to maintain
existing benefit these
customers provide
9.2 COST ALLOCATION METHOD
71. JGN offers a single reference service—the haulage reference service—to meet customer preferences. The
NGR require JGN to allocate its total revenues to reference and non-reference services.
72. JGN’s cost allocation method involves taking the required cost of service (building blocks), deducting revenues
associated with non-reference services (including negotiated revenues) and from non-pipeline services and then
allocating the residual costs to the haulage reference service.
73. JGN calculates the revenue for other non-reference services based on the forecast level of activity for those
services and their prices. Revenue not related to pipeline services includes third party hits income, rental
income, property enquiry income and doubtful debts recovered income. JGN does not allocate this revenue to a
reference service as the underlying costs are excluded from JGN’s building block revenues. Deducting these
revenues from the building block revenues ensures costs are not duplicated by allocations to reference
services.
9.3 RELATIONSHIP BETWEEN COSTS AND TARIFFS
JGN demonstrates that its tariffs support allocative efficiency and reflect the costs of its different customer
bases via:
demonstration of efficient prices including JGN’s estimates of:
– stand-alone and avoidable costs
– long run marginal costs (LRMC)
JGN’s consideration of transaction costs
JGN’s consideration of customer’s ability to respond to price signals
a description of how ancillary charges are efficient.
9.3.1 STAND-ALONE AND AVOIDABLE COSTS
74. The expected revenue recovered for each tariff class should lie on or between the stand-alone cost of providing
the reference service and the avoidable cost of not providing the reference service.

REFERENCE TARIFFS — 9
Public—27 February 2015 © Jemena Gas Networks (NSW) Ltd
2015-20 Access Arrangement Information
29
75. JGN’s stand-alone and avoidable cost estimates for each tariff class, and the approach to calculating these, are
set out in the initial proposal.6 This demonstrated that JGN’s expected revenue for each tariff class lies between
the two efficiency measures.
9.3.2 LONG RUN MARGINAL COST
76. JGN has taken into account LRMC in setting its tariffs.
77. JGN has calculated LRMC for each of its volume tariff classes using the average incremental approach. JGN’s
model has produced LRMC values of zero for the demand market as there is no growth in this market during the
forecast horizon. That is, JGN does not expect the demand market to drive incremental growth-related
investment on JGN’s network. This is consistent with the incremental cost to the shared network being specific
to individual demand customers’ characteristics.
78. Table 9–3 details LRMC for JGN’s volume tariff classes.
Table 9–3: LRMC for JGN tariff classes ($nominal/GJ)
Tariff Class LRMC
VI-Coastal 14.93
VI-Country 17.19
VB-Coastal 12.35
VB-Country 12.20
VRT-03 12.63
VRT-04 12.16
VRT-06 12.00
VRT-10 12.00
79. Table 9–4 details our estimated LRMC values for our tariff components in the volume market.
Table 9–4: LRMC for each tariff class by tariff component
Tariff Component
Tariff Class Fixed $/annum Variable $/GJ chargeable
demand Variable $/GJ
VI-Coastal 43.56 - 13.03
VI-Country 93.71 - 13.11
VB-Coastal 6.21 - 12.08
VB-Country 6.21 - 11.93
VRT-03 15.12 11.97 -
VRT-04 5.81 11.90 -
VRT-06 5.81 11.75 -
6 JGN, JGN 2015-20 access arrangement information, Appendix 13.1, 30 June 2014.

9 — REFERENCE TARIFFS
30 Public—27 February 2015 © Jemena Gas Networks (NSW) Ltd 2015-20 Access Arrangement Information
Tariff Component
Tariff Class Fixed $/annum Variable $/GJ chargeable
demand Variable $/GJ
VRT-10 5.81 11.75 -
(1) Note that the values are calculated per end customer. That is, for the boundary metered tariffs, $6.21 is the LRMC for supplying each end customer behind the meter and not the LRMC of each boundary metered customer.
Taking LRMC into account
80. Factors applicable to the consideration of LRMC for gas network pricing, and which explain why LRMC
estimates are not equivalent to JGN’s tariff levels, are:
the NGR permit JGN to recover its building block cost of services, which includes a return on sunk costs (i.e.
our RAB) and fixed opex and can therefore be expected to exceed LRMC—this point is acknowledged by
rule 94(5)
at an aggregate network level, JGN’s capacity requirements are not driven so much by load peaks as by
volume market expansion (i.e. new customers)
customers told us they prefer variable volume-based charges as they see fixed charges as a barrier to gas
connection
LRMC estimates can be subjective and rely on assumptions and quality of input information
ensuring natural gas, as a discretionary fuel, remains competitive—recovering some costs via usage rather
than fixed charges empowers customers to be able to control their bills and increases the attractiveness for
new customers to connect
seeking stability in end-retail prices—LRMC estimates can be volatile when re-made over time. JGN has
considered the relativities between the LRMC estimates between the tariff classes.
81. Gas networks are very different from electricity distribution businesses, which must also take account of LRMC
when setting tariffs. Gas, and in particular in the JGN network, has lower penetration and utilisation than
electricity and faces competition from other fuel sources. In addition, climate is a significant determinant of the
customer mix and utilisation of the network. These factors affect the application of LRMC to signal the impact of
incremental consumption because JGN seeks to increase the efficient utilisation of its network. While the rules
provide that tariffs are to take into account LRMC, since the building blocks revenue is greater than LRMC, not
every tariff class and tariff parameter can be set at LRMC.
82. JGN notes that, although volume customers are largely driving incremental demand, we do not experience
capacity constraints to the extent that electricity networks do. For this reason, JGN is not subject to the same
incentives to price throughput at LRMC. JGN also takes into account customer preferences for low usage-
based charges to encourage energy efficiency.
83. Demand customers have large loads and are considered on an individual basis when they connect to JGN’s
network. Consistent with rule 79(2)(b), these considerations examine the incremental revenues from the
customer relative to the incremental costs. Where the expected costs exceed the revenues, JGN charges a
capital contribution to the connecting customer. The fact that these users pay a contribution for any capacity
development costs not covered by JGN’s existing charges means JGN’s net LRMC can be expected to trend
towards its prices for these customers.
84. Finally, marginal costs are essentially forward-looking since they reflect the expected change in costs that arise
from changes in demand. Because they are forward looking, invariably the estimates are subjective, reliant on
the assumptions made and quality of the input information. JGN has kept this in mind when taking into account
its LRMC estimates.
REFERENCE TARIFFS — 9
Public—27 February 2015 © Jemena Gas Networks (NSW) Ltd
2015-20 Access Arrangement Information
31
9.3.3 TRANSACTION COSTS
85. JGN has considered transaction costs such as metering charges and administrative costs when determining its
tariffs and tariff classes. This includes how to establish an appropriate balance of transaction costs that
supports JGN’s pricing objectives noted in section 9.1.
86. JGN considers its decision to retain a structure for charges based on customer size (volume versus demand) is
economically efficient for a number of reasons. For example, it would be inefficient to charge individually
metered volume customers consuming less than 10 TJ a year on capacity as that would require more
sophisticated daily metering and data handling. Such metering costs are avoided by charging these customers
on throughput using basic metering equipment.
87. Similarly, postage stamping7 tariffs for coastal and country areas avoids transaction costs for VI and VB
customers. It would be considerably more costly to charge these customers based on zonal location for limited
benefit in terms of network savings arising from any demand response. JGN considers the minor additional
administrative burden to offer tariff classes for intermediaries is justifiable to ensure greater cost reflectivity for
these volume tariffs and reflect the demand for these boundary metered tariffs.
88. In comparison to the VI and VB customers, JGN charges demand customers on capacity as they have the
necessary metering equipment for daily reads. In addition, unlike VI and VB, demand and VRT customers are
charged based on location. This is because:
the size of the customers’ usage and associated impact on the network warrant the additional costs of
targeted price signalling (i.e. to manage capacity demands and network location decisions)
this addresses the bypass risk that JGN may otherwise face as it does not have an exclusive franchise area.
89. JGN introduced the existing tariff classes for demand customers in 2010, reducing transaction costs for retailers
and customers at that time. The proposed closure of the first response tariffs to new customers will further
reduce transaction costs as JGN and retailers will not need to maintain those tariff classes for which there has
been no first response uptake.
90. In addition, JGN’s simplified reference services will also avoid transaction costs associated with having multiple
fixed charge components for each tariff class. This will improve customer understanding of our charges and
improve participation in energy markets, including reducing the administrative costs and complexity of retail
comparator websites.
91. JGN considers that its tariffs and tariff classes for the 2015-20 AA period provide the correct balance between
minimising transaction costs and ensuring that customers have incentives to respond to pricing signals.
9.3.4 RESPONSE TO PRICE SIGNALS
92. JGN considers that it has structured its tariffs and charging components to allow customers and end customers
to respond to price signals. It is for this reason that JGN applies a declining block structure and minimises the
fixed charge to empower customers to control their bills.
93. The use of a declining block structure means customers face reduced costs for additional gas usage. JGN
considers that this is an appropriate price signal for customers where the marginal costs of supplying additional
units is materially lower than the average costs, encouraging increased network utilisation.
7 ‘Postage stamping’ refers to the practice of applying the same price or set of prices within a specified location. Note that JGN still
differentiates prices within the coastal or country areas depending on customer or end customer characteristics.

9 — REFERENCE TARIFFS
32 Public—27 February 2015 © Jemena Gas Networks (NSW) Ltd 2015-20 Access Arrangement Information
9.3.5 ANCILLARY CHARGES
94. JGN ancillary charges seek to recover the cost of user-initiated activities. The user-requested ancillary activities,
which attract an ancillary charge, are set out in the JGN’s reference tariff schedule (see schedule 2 or our
revised AA). Ancillary charge levels are also included in the reference tariff schedule.
95. The ancillary charges are set to recover JGN’s costs of providing the relevant activities to volume and demand
customers and ensure other customers are not required to inefficiently cross-subsidise the costs of these user-
initiated activities. They have been determined based on JGN’s incremental costs and are consistent with
benchmarks from other jurisdictions.

ANNUAL REFERENCE TARIFF VARIATION — 10
Public—27 February 2015 © Jemena Gas Networks (NSW) Ltd
2015-20 Access Arrangement Information
33
10. ANNUAL REFERENCE TARIFF VARIATION
10.1 HAULAGE REFERENCE SERVICES
96. For its haulage reference service, JGN maintains a tariff basket annual tariff variation mechanism as permitted
under rule 97(2)(b) in the form of a weighted average price cap (WAPC) formula for the 2015-20 AA period.
97. JGN implements this WAPC using the CPI-X price control formula and annual tariff variation mechanism. The
specification is set out in the AA. The mechanism also includes an automatic adjustment factor to true-up
forecast and actual costs for certain uncontrollable cost categories, and a cost pass through adjustment factor to
allow tariffs to vary for pass through amounts approved in accordance with clause 3 of the AA.
98. A WAPC constrains the overall movement in reference tariffs within the AA period. It provides JGN incentives,
consistent with the long-term interests of customers, to:
increase volumes and network utilisation as it does not constrain the revenue that JGN might recover,
supporting productive and allocative efficiency
price at marginal cost to help ensure that customers susceptible to bypassing the network are retained,
again supporting allocative efficiency.
99. The tariff basket approach is consistent with customers’ long-term interests by always balancing to the weighted
average price. A tariff basket approach allows JGN to respond to market changes and maintain efficient tariff
structures consistent with rule 97(3)(a). Further, a WAPC means JGN, and not its customers, bears the risk
where actual demand is different from the AER allowance. This places the risk with JGN as the party best
placed to manage it. It also motivates JGN to:
encourage growth, therefore increasing asset utilisation to the benefit of its customers
price according to the incidence of its costs.
10.2 ANCILLARY CHARGES
100. JGN maintains its charges for user-requested ancillary activities in real terms over the 2015-20 AA period
unless the underlying costs materially change. This seeks to promote price-stability for these activities.

11 — TOTAL REVENUE AND KPIS
34 Public—27 February 2015 © Jemena Gas Networks (NSW) Ltd 2015-20 Access Arrangement Information
11. TOTAL REVENUE AND KPIS
11.1 TOTAL REVENUE REQUIREMENT
101. JGN’s total required revenues for each year of the AA period are set out in Table 11–1. The smoothed and
unsmoothed revenues and X-factors are set out in Table 11–2. The set of X-factors provides JGN’s price path.
Table 11–3 provides the average annual price changes.
Table 11–1: JGN total revenue ($2015, $millions)
Building block 2015-16 2016-17 2017-18 2018-19 2019-20 Total
Return on capital 215.95 222.34 227.86 232.17 234.13 1,132.45
Return of capital (depreciation) 65.25 75.71 86.49 94.48 79.38 401.30
Opex 160.96 162.99 163.18 167.60 167.14 821.87
Tax 17.20 18.50 20.79 22.93 19.66 99.08
Total revenue 459.37 479.54 498.31 517.17 500.32 2,454.70
(1) There are no increments or decrements for any year resulting from the operation of an incentive mechanism to encourage gains in efficiency
Table 11–2: Revenues and X-factors ($real, $millions)
2015-16 2016-17 2017-18 2018-19 2019-20 NPV
Total building block revenue - unsmoothed 459.37 479.54 498.31 517.17 500.32 2,115.04
Total building block revenue – smoothed 564.81 518.42 473.74 433.60 441.54 2,115.04
X-factor8 6.50% 8.24% 8.24% 8.24% (1.84%) N/A
(1) Total price change (C) for any year equals (1 - A) x (1+ B) – 1
(2) Years are from July to June.
Table 11–3: Average annual price changes (per cent)
2015-16 2016-17 2017-18 2018-19 2019-20 Cumulative
% total
Real price change (6.50%) (8.24%) (8.24%) (8.24%) 1.84% (29.38%)
Inflation forecast 2.55% 2.55% 2.55% 2.55% 2.55% 12.74%
Nominal price change (4.11%) (5.90%) (5.90%) (5.90%) 4.43% (17.39%)
(1) Years are from July to June.
(2) Nominal price change is calculated as (1+ real price change) x (1 + inflation forecast)-1.
8 Under the CPI-X form of control (represented by the formula (1-X)*(1+CPI)), a positive X-factor is a decrease in average prices.
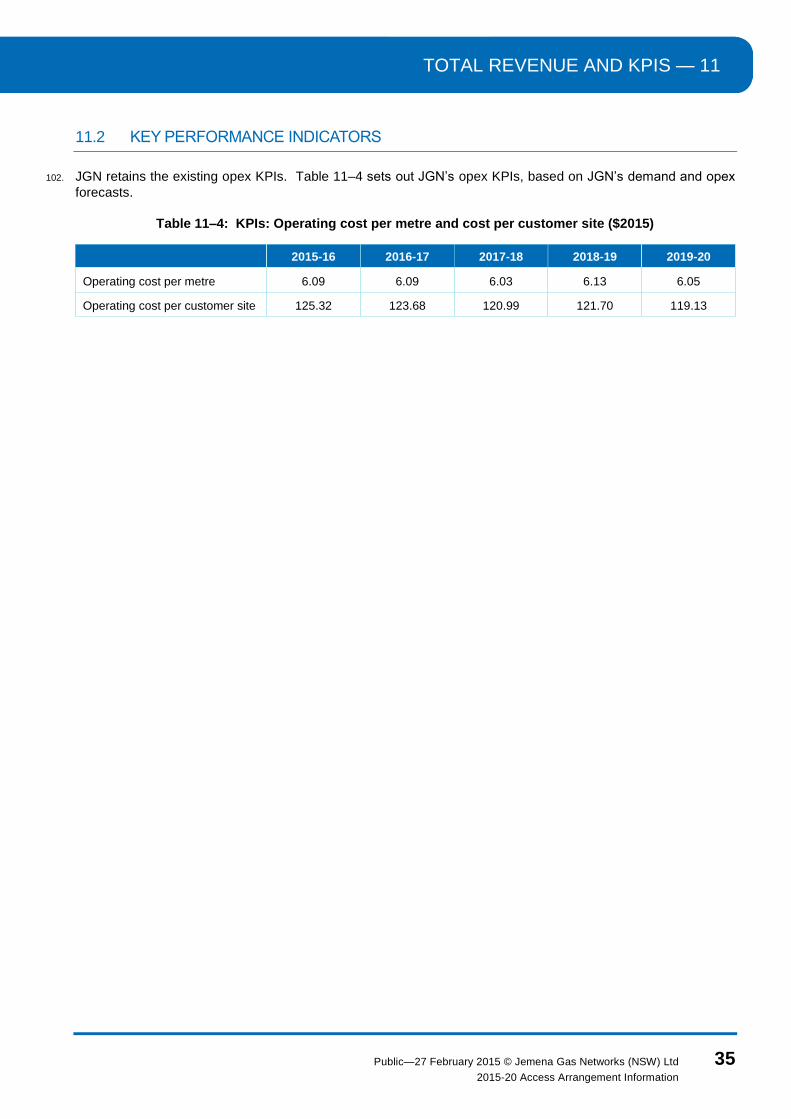
TOTAL REVENUE AND KPIS — 11
Public—27 February 2015 © Jemena Gas Networks (NSW) Ltd
2015-20 Access Arrangement Information
35
11.2 KEY PERFORMANCE INDICATORS
102. JGN retains the existing opex KPIs. Table 11–4 sets out JGN’s opex KPIs, based on JGN’s demand and opex
forecasts.
Table 11–4: KPIs: Operating cost per metre and cost per customer site ($2015)
2015-16 2016-17 2017-18 2018-19 2019-20
Operating cost per metre 6.09 6.09 6.03 6.13 6.05
Operating cost per customer site 125.32 123.68 120.99 121.70 119.13

12 — COMPLIANCE CHECKLIST
36 Public—27 February 2015 © Jemena Gas Networks (NSW) Ltd 2015-20 Access Arrangement Information
12. COMPLIANCE CHECKLIST
Table 12–1: Compliance checklist – revised AAI
Provision Requirement Reference
National Gas Rules
72(1)(a) The access arrangement information must include:
(i) capital expenditure (by asset class) over the earlier access arrangement
period; and
(ii) operating expenditure (by category) over the earlier access arrangement
period; and
(iii) usage of the pipeline over the earlier access arrangement period showing:
(A) for a distribution pipeline, minimum, maximum and average demand...; and
(B) for a distribution pipeline, customer numbers in total and by tariff class...
(i) section 2.1
(ii) section 2.2
(iii) section 2.3
72(1)(b) The access arrangement information must include how the capital base is
arrived at and, if the access arrangement period commences at the end of an
earlier access arrangement period, a demonstration of how the capital base
increased or diminished over the previous access arrangement period.
Chapter 3
72(1)(c) The access arrangement information must include the projected capital base
over the access arrangement period, including:
(i) a forecast of conforming capital expenditure for the period and the basis for
the forecast; and
(ii) a forecast of depreciation for the period including a demonstration of how the
forecast is derived on the basis of the proposed depreciation method.
Section 3.3 and
(i) section 3.6
(ii) section 3.4
72(1)(d) The access arrangement information must include to the extent it is practicable
to forecast pipeline capacity and utilisation of pipeline capacity over the access
arrangement period, a forecast of pipeline capacity and utilisation of pipeline
capacity over that period and the basis on which the forecast has been derived
Chapter 4
72(1)(e) The access arrangement information must include a forecast of operating
expenditure over the access arrangement period and the basis on which the
forecast has been derived
Chapter 5
72(1)(f) The access arrangement information must include the key performance
indicators to be used by the service provider to support expenditure to be
incurred over the access arrangement period
Section 11.2
72(1)(g) The access arrangement information must include:
the proposed return on equity
the return on debt
the allowed rate of return
...for each regulatory year of the access arrangement period, in accordance with
rule 87, including any departure from the methodologies set out in the rate of
return guidelines and the reasons for that departure.
Sections 6.1 and 6.2.
72(1)(ga) The access arrangement information must include the proposed formula (if any)
that is to be applied in accordance with rule 87(12).
Section 6.3
72(h) The access arrangement information must include the estimated cost of
corporate income tax calculated in accordance with rule 87A, including the
proposed value of imputation credits referred to in that rule.
Chapter 7
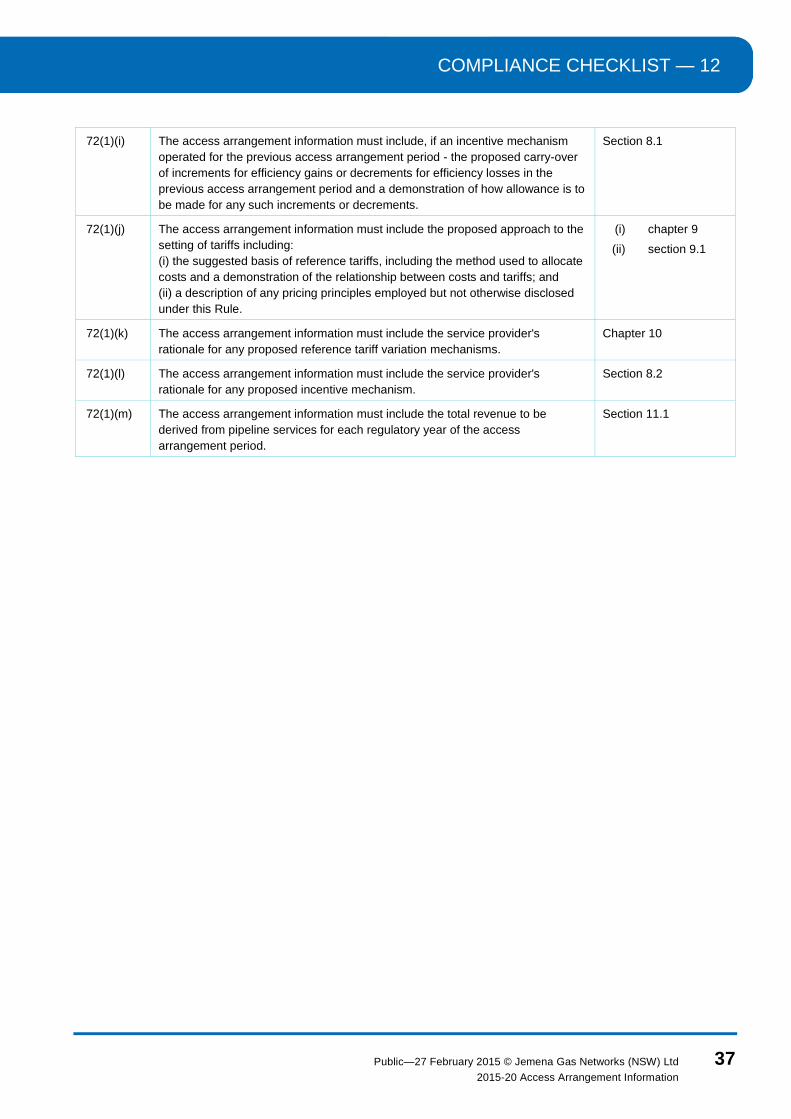
COMPLIANCE CHECKLIST — 12
Public—27 February 2015 © Jemena Gas Networks (NSW) Ltd
2015-20 Access Arrangement Information
37
72(1)(i) The access arrangement information must include, if an incentive mechanism
operated for the previous access arrangement period - the proposed carry-over
of increments for efficiency gains or decrements for efficiency losses in the
previous access arrangement period and a demonstration of how allowance is to
be made for any such increments or decrements.
Section 8.1
72(1)(j) The access arrangement information must include the proposed approach to the
setting of tariffs including:
(i) the suggested basis of reference tariffs, including the method used to allocate
costs and a demonstration of the relationship between costs and tariffs; and
(ii) a description of any pricing principles employed but not otherwise disclosed
under this Rule.
(i) chapter 9
(ii) section 9.1
72(1)(k) The access arrangement information must include the service provider's
rationale for any proposed reference tariff variation mechanisms.
Chapter 10
72(1)(l) The access arrangement information must include the service provider's
rationale for any proposed incentive mechanism.
Section 8.2
72(1)(m) The access arrangement information must include the total revenue to be
derived from pipeline services for each regulatory year of the access
arrangement period.
Section 11.1