jefferies 2012 global industrial and a&d conference 2012 global industrial and a&d...
TRANSCRIPT

Jefferies 2012 Global Industrial and A&D ConferenceAugust 7 – 9, 2012

2
The Private Securities Litigation Reform Act of 1995 provides a “safe harbor” forforward-looking statements. Certain information included in this presentationcontains statements that are forward-looking, such as statements relating toresults of operations and financial conditions and business developmentactivities, as well as capital spending and financing sources. Such forward-looking information involves important risks and uncertainties that couldsignificantly affect anticipated results in the future and, accordingly, such resultsmay differ materially from those expressed in any forward-looking statementsmade by or on behalf of Mercer. For more information regarding these risks anduncertainties, review Mercer’s filings with the United States Securities andExchange Commission. Unless required by law, we do not assume anyobligation to update forward-looking statements based on unanticipated eventsor changed expectations.
Forward Looking Statements

3
Overview of the Company

4
Company Overview Three world-class, large, modern mills that produce
1.51 million tonnes of high-quality northern bleached softwood kraft (“NBSK”) pulp, a premium grade of pulp Strategically located mills in British Columbia and
Germany
Excellent fiber baskets, with ready access to key global markets
Significant and growing revenue from sale of excess renewable, carbon-neutral electricity
Mercer has grown through organic expansion, greenfield development and acquisition, and its financial structure offers very high leverage to the pulp cycle
Company employs approximately 1,500 people and generated over €889 million (US$1.24 billion*) in fiscal 2011
U.S. domiciled corporation listed on both the NASDAQ (MERC) and the TSX (MRI.U)
Management believes the long term supply/demand outlook for NBSK is strong* At the 2011 average EUR/USD fx rate 1.3919

5
Company Overview as at June 30/2012
Equity Structure (3 month averages) WACSO*: 55.6 million shares
Diluted shares outstanding : 55.9 million
Average daily trading volume: 142,000 shares / day **
* WACSO = Weighted Average Common Shares Outstanding
** Source: FactSet, average daily volume traded during Q2’2012
Debt Structure The Celgar and Rosenthal mills – the “Restricted Group” - are reported
separately from Stendal – the “Unrestricted Group” – in accordance with the terms of the indenture governing the Senior Notes due 2017 (Stendal debt is non-recourse to Mercer) Restricted Group: €224.5 ($284.4)*** million senior unsecured notes due
Dec. 2017; €2.2 million Rosenthal equipment loan Note: To date, Mercer repurchased $15.6 million in outstanding 2017 Notes
Unrestricted Group: €467.9 million loan facility due September 2017
*** EUR/USD=1.2668

6
Mercer conducts operations through three subsidiaries; two in Germany and one in British Columbia, Canada Mercer operates the only two NBSK market pulp mills in Germany - Europe’s largest
market for NBSK pulp - and one of the largest, most modern pulp mills in North America
Significant Production Capacitywith Access to Key Global Markets
Rosenthal(Germany)
Celgar(British Columbia)
Stendal (1)
(Germany)
74.9%
Restricted Group
100% 100%
(1) Pursuant to the terms of its 2017 Senior Notes, Mercer reports the Stendal mill separately from Rosenthal, Celgar and Mercer International Inc., (together the “Restricted Group”) as the debt at Stendal is non-recourse to Mercer’s other operations
520,000 ADMT100 MW Capacity
345,000 ADMT57 MW Capacity
645,000 ADMT102 MW Capacity

7
Modern and Competitive Assets Mercer’s operations are some of the largest and most modern in the world
Relative age and production capacity provide a competitive advantage
Source: Pöyry, August 2012
Low production costs Low maintenance capital
requirements High runability / efficiency Strong record of
environmental performance
All facilities are net energy producers
Weighted Average Technical Age: 21.3 years
Weighted Average Capacity:
342,000 t/a

8
Strategic Locations Mercer’s strategic locations in Germany and Western Canada position the company
well to serve customers in Europe, North America and Asia In particular, China – the world’s biggest pulp importer and fastest growing pulp
import market - and Germany – the largest European pulp import market
Celgar(B.C., Canada)520,000 ADMT
●
UnitedStates
Stendal(Germany)645,000 ADMT
Rosenthal(Germany)345,000 ADMT
●●
Indonesia
China
Thailand
MiddleEast
Europe
Japan

9
€ 23€ 31
€ 43 € 44€ 58
€ 0€ 10€ 20€ 30€ 40€ 50€ 60€ 70
2007 2008 2009 2010 2011Ener
gy R
even
ue (
mill
ions
) Green Energy Revenue
- 300 600 900
1,200 1,500
2007 2008 2009 2010 2011Elec
trici
ty (
000s
MW
h)
Electricity Generation
Electricity Production Electricity Exports
Growing Electricity Revenues Mercer has been a leader among
paper and forest products companies in embracing the “carbon economy” and in harnessing significant value from its surplus power generation
Mercer recognized the opportunity to secure a new revenue stream from its operations, as the market place turned to biomass for its carbon neutral power
At the end of September 2010, Celgar’s new 48 MW turbine achieved commercial operating status, bringing Mercer’s total installed generating capacity to 259 MW
The sale of green electricity is a significant and growing part of Mercer’s operations

10
L-T NBSK Supply/Demand Fundamentals are Positive
Management believes that, given the underperforming global economy, the generally flat supply, overall growing demand and positive exposure to the effects
of climate change create an attractive operating environment for Mercer
Management believes that long-term global demand for NBSK remains strong, as global production of tissue and specialty papers grows, emerging markets develop, and standards of living improve
• Chinese production of fine paper and pulp-based tissue are currently forecast to continue growing over the next several years
• NBSK’s strength attributes are needed given the trend by tissue and paper producers towards faster production rates, increased recycled content, and lower basis weights
Global supply of softwood pulp is expected to remain relatively flat • New mills are overwhelmingly hardwood pulp and management believes any increases in
softwood supply should be more than offset by capacity closures Mercer benefits from favorable green energy rates and related government incentives
• Climate change is making the cost curve of pulp and paper steeper, significantly disadvantaging inefficient and environmentally unsound operations and benefitting world class operations, such as Mercer’s
11
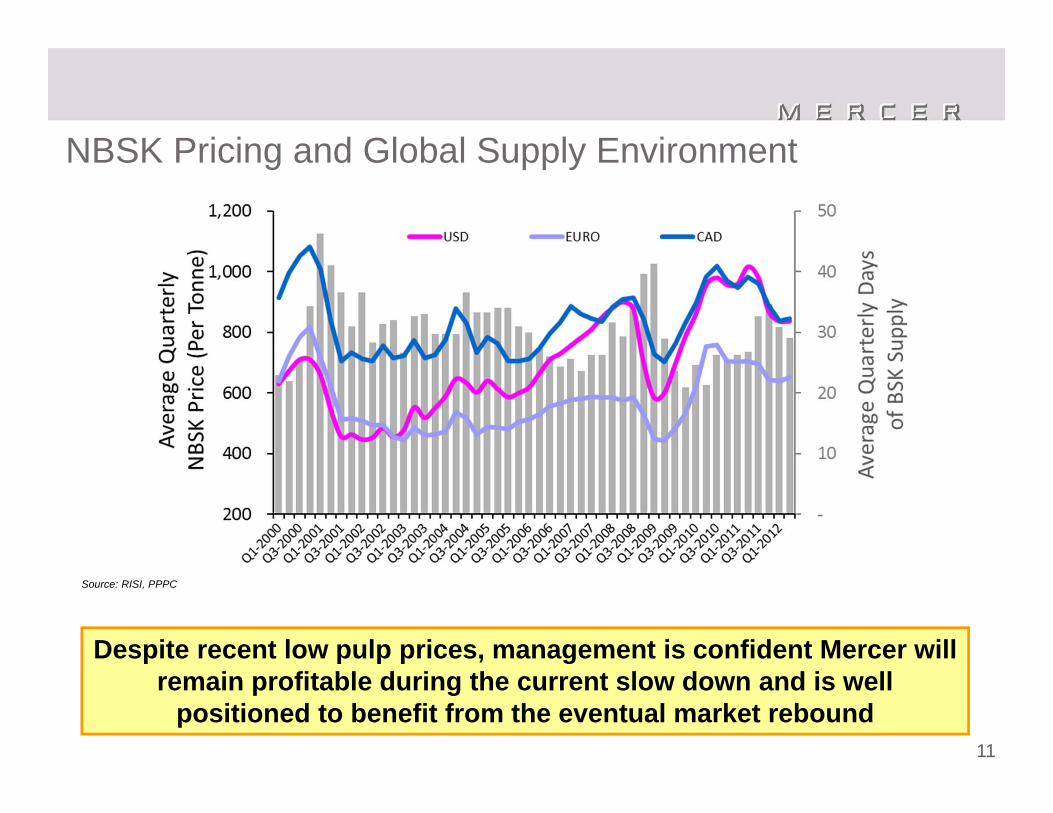
NBSK Pricing and Global Supply Environment
Despite recent low pulp prices, management is confident Mercer will remain profitable during the current slow down and is well
positioned to benefit from the eventual market rebound
Source: RISI, PPPC

12
The Price Gap Between Hardwood and Softwood Pulp is Narrowing
Source: RISI
Management believes the narrowing price gap between hardwood and softwood, particularly in China where NBSK and BEK are
currently similarly priced, is creating opportunities for producers to substitute more softwood pulp into their products

13
Overview of Operations

14
Operating EBITDA margins have improved from Q4-2011 despite weak pulp pricing due to strong mill performance and steady energy and chemical revenues
Improving Financial Performance
We believe that we are approaching the bottom of the pulp pricing cycle and we currently expect pricing to improve
following the typically slower summer season
€ 148 € 126
€ 69 € 41
€ 224
€ 167
23%
17%
10%
7%
25%
19%
0%
5%
10%
15%
20%
25%
€ -
€ 50
€ 100
€ 150
€ 200
€ 250
2006 2007 2008 2009 2010 2011
Mar
gin
(%)
EBIT
DA (
€mm
)
Consolidated Annual Operating EBITDA & Margin
-€ 8
€ 1 € 4 € 13 € 24
€ 32
€ 62 € 65 € 65
€ 51 € 50 € 49
€ 17 € 31 € 33
-4%
1%2%
8%
14%18%
26%28%
26%
22%21%24%
7%
14%16%
-10%
-5%
0%
5%
10%
15%
20%
25%
30%
-€ 10
€ -
€ 10
€ 20
€ 30
€ 40
€ 50
€ 60
€ 70
Mar
gin
(%)
EBIT
DA (
€mm
)
Consolidated Quarterly Operating EBITDA & Margin

15
The continued absence of a recovery in the US housing market and other factors have left lumber production at low levels and have decreased the overall forest harvesting activity in all regions where we operate
Strong production from Celgar’s woodroom is helping keep Celgar’s fiber costs stable at satisfactory levels, and should allow the mill to exert further downward pressure on chip prices
Fiber costs in Germany have stabilized and are currently expected to remain at lower levels going into the fall season
Fiber Costs are Stable

16
N. America, 18.2%
W. Europe, 29.8%
Latin America, 5.3%
China, 26.0%
Japan, 4.8%
Other, 15.9%
2011 Global BSKP Demand by Region*N. America,
8.5%
W. Europe, 37.6%
Latin America, 0.0%
China, 28.6%
Japan, 3.8%
Other, 21.5%
Mercer 2011 Sales by Region
Mercer’s Regional Sales Closely Matches Demand Mercer has a well-diversified and stable sales mix
Sizeable player in European markets, in particular Germany – Europe’s largest NBSK market
Significant exposure to China – the world’s largest importer of pulp and the fastest growing pulp market
Growing exposure to tissue / hygiene end uses, which have a higher growth rate for NBSK than printing and writing papers
*Hawkins Wright – Pulp Demand Outlook, July 2012

17
Financial Review

18
Corporate Structure and Long Term Debt
Rosenthal(Germany)
Celgar(British Columbia)
Stendal(Germany)
74.9%
As at June 30, 2012 €224.5 (US$284.4)* million senior unsecured notes
due December 2017 Note: To date, Mercer repurchased $15.6 million in
outstanding 2017 Notes €2.2 million Rosenthal equipment loan
€467.9 million non-recourse term loan due September 2017 Principal amount of the loan is 80%
guaranteed by the German government
Interest rate of 5.28% until maturity
Restricted Group
100% 100%
The debt at Stendal is non-recourse to Mercer and its other operations * EUR/USD=1.2668

19
Selected Historical Financial Data – Consolidated(€ 000s unless otherwise indicated)
* Includes gains (losses) on Stendal’s interest rate swaps, pulp price swaps, and foreign exchange gains (losses) on Mercer’s US denominated intercompany debt, which are non-cash mark-to-market valuation adjustments occurring every quarter.
2008 2009 2010 Q1 Q2 Q3 Q4 2011 Q1 Q2 YTDPulp Revenue 689,320 577,298 856,311 210,458 217,274 190,426 213,238 831,396 199,439 186,036 385,475
Chemical Revenue 3,387 3,039 5,063 2,195 3,280 2,286 2,345 10,107 2,808 3,179 5,987
Energy Revenue 30,971 42,501 44,225 13,677 13,941 14,352 16,002 57,972 16,111 14,847 30,958 Total Revenues 723,678 622,838 905,599 226,330 234,495 204,778 231,585 899,475 218,358 204,062 422,420
Operating Income (Loss) 13,329 (12,799) 167,743 36,644 36,211 35,307 2,957 111,119 16,243 18,296 34,539
Interest Expense (65,756) (64,770) (67,621) (15,906) (14,883) (14,117) (14,089) (58,995) (14,133) (13,863) (27,996) Investment Income (loss) (1,174) (1,804) 468 327 136 270 768 1,501 (410) (287) (697)
(29,462) (3,068) (4,227) 13,354 (1,997) (10,665) (935) (243) 876 1,343 2,219
Net Income (Loss) (72,465) (62,189) 86,279 29,053 14,383 8,440 (1,801) 50,075 1,173 1,515 2,688
Operating EBITDA (€ 000's) 69,091 41,371 223,974 50,782 50,140 49,200 17,002 167,124 30,593 32,884 63,477 Operating EBITDA (US$ 000's) 101,598 57,646 297,281 69,470 72,224 69,468 21,458 232,620 40,120 42,229 82,349
EPS (Basic) (2.00)€ (1.71)€ 2.24€ 0.66€ 0.32€ 0.15€ (0.03)€ 1.00€ 0.02€ 0.03€ 0.05€
2012
Gain (Loss) on Financial Instruments *
2011

20
Balance SheetAs At June 30, 2012 (in € 000s) Restricted
GroupUnresctricted Subsidiaries Eliminations
Consolidated Group
ASSETSCash and cash equivalents 50,096€ 80,791€ -€ 130,887€ Marketable securities 10,201 - - 10,201 Receivables 55,430 48,493 - 103,923 Inventories 70,562 47,658 - 118,220 Prepaid expenses and other 5,749 2,843 - 8,592 Deferred income tax 4,919 3,352 - 8,271
Total current assets 196,957€ 183,137€ -€ 380,094€
Long-term assetsProperty, plant and equipment 355,633€ 461,259€ -€ 816,892€ Deferred note issuance and other 6,384 6,177 - 12,561 Deferred income tax 8,878 7,270 - 16,148 Due from unrestricted group 97,771 - (97,771) -
TOTAL ASSETS 665,623€ 657,843€ (97,771)€ 1,225,695€
LIABILITIESAccounts payable and other 53,180€ 50,699€ -€ 103,879€ Pension and other post-retirement benefit obligations 773 - - 773 Debt, current portion 1,088 35,000 - 36,088
Total current liabilities 55,041€ 85,699€ -€ 140,740€
Long-term liabilitiesDebt 225,560€ 468,590€ -€ 694,150€ Due to restricted group - 97,771 (97,771) - Unrealized interest rate derivative losses - 51,791 - 51,791 Pension and other post-retirement benefit obligations 31,798 - - 31,798 Capital leases and other 6,460 6,993 - 13,453 Deferred income tax 3,895 - - 3,895
TOTAL LIABILITIES 322,754€ 710,844€ (97,771)€ 935,827€
EQUITYTotal shareholders' equity (deficit) 342,869€ (36,726)€ -€ 306,143€ Noncontrolling interest (deficit) - (16,275) - (16,275)
TOTAL LIABILITIES AND EQUITY 665,623€ 657,843€ (97,771)€ 1,225,695€

21
Capital Structure“Restricted Group” structure was used to protect Mercer from the high leverage of the Stendal project The Restricted Group - created at the time of issuing US$310 million Notes in 2005 - is
supported by the Celgar and Rosenthal operations (replaced by a US$300 million issue in November 2010 due December 2017) Together, the mills provide approximately 865,000 tonnes of pulp production capacity With Celgar’s Green Energy Project online, the Restricted Group generated approximately
€25.5 million in electricity revenues in 2011 Since energy production is a by-product of our pulp production, there are minimal incremental
costs and our energy sales are highly profitable Mercer’s operations have benefitted from the heavy involvement of governments in the form
of non-repayable grants for the construction of its mills in Germany As of June 30, 2012, Mercer has received €431 million in government grants for the
construction of the Rosenthal, Stendal, and Celgar’s Green Transformation Projects These grants reduce the cost basis of the assets purchased and are not reported in our income
The Stendal debt of €467.9 million is guaranteed to 80% by the German government and is non-recourse to the rest of Mercer Stendal’s debt is amortizing and has a sinking fund account to support debt amortization and
interest payments during weaker periods Stendal’s balance sheet is complicated by its deeply subordinated shareholder loans and a
quarterly mark-to-market, non-cash valuation adjustment relating to its fixed interest rate swaps

22
Investment Highlights

23
Key Investment Highlights Operates world-class, large, modern mills that produce high-quality NBSK pulp
which is a premium grade of kraft pulp
Strategically located mills, with excellent fiber baskets, in close proximity to key global markets
Strong, long-term forecast supply/demand outlook for NBSK
Significant and growing revenue from sale of excess renewable, carbon-neutral electricity and bio-chemicals
Financial structure offers very high leverage to the pulp cycle
Experienced, shareholder-focused management team and board of directors
Improved liquidity performance

24
Appendix A

25
Current Industry Environment

26
NBSK is Needed for StrengthDespite the current supply/demand imbalance, management believes demand for NBSK will remain strong over the long term Reinforcing properties needed by modern production technology make NBSK an
essential component in a wide range of paper, tissue and hygiene products Producers have already generally substituted as much lower cost hardwood and
recycled pulp into their products as possible, so any demand growth in their products should translate directly into demand growth for NBSK
Demand for most paper grades in which NBSK is used, such as tissue, is forecasted to continue growing Improving global standards of living in countries such as China, aging populations, and
growing interest in health and cleanliness are increasing demand for tissue and hygiene products For example, in China, tissue production is forecasted to increase by approximately 1.7 million
tonnes to 6.8 million between 2011 and 2015, while total fine paper production is expected to increase by 4.0 million tonnes to 12.8 million during the same period 1
Supply of NBSK is forecasted to remain flat or decrease The vast majority of the new pulp capacity that is coming online is hardwood There have been significant permanent softwood closures in recent years and global
pulp inventories remain lowThe long term supply / demand fundamentals for NBSK pulp currently
remain strong1 Hawkins Wright – Defining the China Market (December 2011)

27
Global NBSK End Uses
*Hawkins Wright – End Use Markets for Bleached Kraft Market Pulp, April 2009 & September 2011
Woodfree26%
Woodfree25%
Other P&W20%
Other P&W15%
Tissue33% Tissue
33%
Specialty15%
Specialty20%
Packaging, 6% Packaging, 7%
0%
20%
40%
60%
80%
100%
2008 2010
Global Market NBSK Demand, by End Use
CAGR = +8%
2008Total NBSK Demand:10.5 million tonnes
2010Total NBSK Demand:12.3 million tonnes
With the exception of the “Other P&W” segment, which includes mechanical and newsprint paper grades, all NBSK end use segments are growing on an absolute basis, particularly in the tissue and specialty grades - the segments where Mercer
focuses its sales

28
N. America, 22%
W. Europe, 43%Latin
America, 1%
China, 18%
Japan, 3% Other, 13%
2010 Global NBSK Demand by Region*
N. America, 27%
W. Europe, 51%
Latin America,
0%
China, 3%
Japan, 8% Other, 10%
2000 Global NBSK Demand by Region*
Developments in Global NBSK Demand
19%
3% 3% ‐1%
‐1%
‐8%
‐10.0%
0.0%
10.0%
20.0%
30.0%
China Latin America Other W. Europe N. America Japan
2000‐2010 Compound Annual Growth Rate in Regional NBSK Demand
*Hawkins Wright – Outlook for Market Pulp, July 2011
CAGR: 0.6%

29Note: As at Q1-2012. Does not include energy revenue netted from cost
Total Cash Cost and Cumulative Production
The steepness of the NBSK production curve implies that when market conditions deteriorate, as it is believed they are currently doing, the high cost
producers in the 4th quartile will be forced to curtail or stop production
NBSK Producers Face a Steep Cost Curve
Cumulative Production, Metric Tonnes per Year (x1,000,000)

30
1 PPPC Flash Report – July 2012
Permanently Shut NBSK Capacity
Softwood pulp markets remain tight due to demand growth and the permanent closure of high cost capacity. Global softwood inventories at the end of June total 29 days of
supply, a level generally indicative of a balanced market1
Source: TerraChoice Markets Services Inc., company press releases
Permanent & Indefinite Closures (Annualized Capacity, 000s tonnes)
Timing Volume Timing VolumeSappi Usutu, Swaziland, Africa BSK, UKP Q3‐2009 230 Boise St. Helens, USA NBSK, BHK Q1‐2009 275 Marathon Pulp Marathon, ON, Canada NBSK Q1‐2009 200 Botnia Kaskinen, Finland NBSK, BHK Q1‐2009 450 Lee & Man (EverGreen Pulp) Samoa, California NBSK Q4‐2008 192 UPM Tervasaari, Finland NBSK, UKP Q4‐2008 204 Stora Enso Norrsundet, Sweden NBSK Q4‐2008 300 Domtar Lebel‐sur‐Quevillon, QC NBSK Q4‐2008 300 Stora Enso Kemijarvi, Finland NBSK Q2‐2008 250 West Fraser Hinton, AB, Canada NBSK Q4‐2006 70 Tembec Smooth Rock Falls, ON, Canada NBSK Q3‐2006 200 Bowater Thunder Bay, ON, Canada NBSK Q2‐2006 100 Korsnas Gavle, Sweden NBSK Q2‐2006 70 Weyerhaeuser Prince Albert, SK, Canada NBSK Q2‐2006 260 Western Forest Products Squamish, BC, Canada NBSK Q1‐2006 275 Catalyst Crofton, BC, Canada NBSK Q1‐2009 375 Q4‐2009 375 Stora Enso Uimaharju, Finland (Enocell) NBSK, BHK Q1‐2009 450 Q4‐2009 450 Harmac Pacific Harmac, BC, Canada NBSK Q3‐2009 120 Q4‐2009 120 Stora Enso Sunila, Finland NBSK Q4‐2008 360 Q2‐2009 360 Sinar Mas Mackenzie, Canada NBSK Q2‐2008 235 Q3‐2010 235 Buchanan Forest Products Terrace Bay, ON NBSK Q4‐2008 350 Q3‐2010 350
Total 5,266 1,890 Net of Restarts Total 3,376
Company Mill Grade Annualized Capacity Restart

31
10 12 14 16 18 20 22 24 26 28 30 32 34
mill
ions
ton
nes
Bleached Softwood Kraft(-0.5% aagr 2008-2014)
Bleached Hardwood Kraft(2.7% aagr 2008-2014)
World Market Pulp Capacity
Global Supply of BSK
Source: TerraChoice Markets Services Inc.
Most of the announced new pulp capacity that is coming online is hardwood pulp. Total global softwood pulp capacity is currently expected to remain flat, as there is only one
sizeable softwood mill capacity expansion expected in the next few years

32
Tissue Furnish is Using Less Recovered FiberTissue is expected to use an increasing percentage of virgin fiber and a decreasing percentage of recovered fiber, going forward
Source: Poyry, Europulp – UTIpulp Seminar, Sept. 2011, “The future development of the European and Global Tissue Industry and its fibre furnish”

33
Tissue Products Require NBSK for QualityNBSK provides the formation and strength that is required to produce tissue on modern machines and contributes to the softness and absorbency that end users demand from their tissue products
Source: Poyry, Europulp – UTIpulp Seminar, Sept. 2011, “The future development of the European and Global Tissue Industry and its fibre furnish
Product Category Fibre FurnishToilet Paper BSKP 30%
BHKP 70%recycled fiber
BHKP content can be as high as 80-90%
Towels(kitchen/hand towels,
wipes)
BSKP 50-70%BHKP 30-50%recycled fiber
Facial / Handkerchief
BSKP 20%BHKP 80%
Up to 100% BHKP can be used
Napkins / Serviettes
BSKP 40%BHKP 60%
recycled fiber
For colored products, higher shares of BSKP
Others (eg. Medical)
BSKP 50%BHKP 50%
Some recycled fiber
Some are 35% BSKP/65% BHKP

34
Annual World Tissue Output(millions of tonnes)
10
14
18
22
26
30
1990
1992
1994
1996
1998
2000
2002
2004
2006
2008
2010
Tissue is the Highest Growth SegmentSince 2000, global tissue output has grown at an average annual rate of 3.9% As populations age, global standards of living improve, and health and hygiene
become larger concerns, demand for tissue – and thus NBSK – should continue to grow
Source: TerraChoice Market Services Inc., FAO, PPI Annual Review
2000 – 2009 Average annual growth rate = 3.9%

35
0%
20%
40%
60%
80%
100%
0.6
2.6
4.6
6.6
8.6
10.6
12.6
14.6
% o
f po
pula
tion
not
poor
mill
ions
of
tonn
es
Consumption
Production
(%) of population
not poor (McKinsey)
Growth in Demand Could AccelerateThe better off the developing world’s populations are financially, the greater their demand for tissue and hygiene products should be
Source: TerraChoice Market Services Inc.
If living standards improve as currently forecasted in markets such as China, management believes demand growth for NBSK in these
markets should also accelerate
China Tissue Production and Consumption

36
Operations

37
Restricted Group - Rosenthal Mill Location: Blankenstein, Germany, approximately 300 km south of Berlin Pulp Production Capacity: 345,000 ADMT / year Electricity Generating Capacity: 57 MW Key Features: Built in 1999, the mill is modern, efficient, and
ISO 9001 and ISO 14001 certified Strategically located in central Europe, offers a
superior value proposition to customers• Allows customers to operate on just in time
inventory, lowering their costs and making Rosenthal the preferred supplier
Produced over 344,000 Admt in 2011, a new annual production record Close proximity to stable fiber supply and
nearby sawmills One of the largest biomass power plants in
Germany • L4Q ending Q2’12, generated €14.6 million
(US$19.5 million) in revenue from electricity sales*
* Q3’11-Q2’12 average EUR:USD fx of 1.3385

38
Restricted Group - Celgar Mill Location: Castlegar, BC, Canada, approximately 600 km east of Vancouver Pulp Production Capacity: 520,000 ADMT / year Electricity Generating Capacity: 100 MW Key Features: A modern and efficient mill that is ISO 9001
and ISO 14001 certified Continued optimization of the wood room is
providing a ceiling on chip costs, helping to eliminate high cost suppliers, which should lower average fiber costs going forward Green Energy Project was completed in
September 2010• L4Q ending Q2’12, Celgar generated €13.8 million (US$18.5 million) in revenue from
the sale of green electricity Secured C$57.7 million in non-repayable capital funding from Government of
Canada for green capital investments• Majority used to fund Green Energy Project
Celgar continues to demonstrate significant upside potential, regularly setting production records and increasing the amount of bio-energy generated
* Q3’11-Q2’12 average EUR:USD fx of 1.3385

39
Unrestricted Group – Stendal Mill Location: Stendal, Germany, approximately 130 km west of Berlin Pulp Production Capacity: 645,000 ADMT / year Electricity Generating Capacity: 102 MW Key Features: Completed in 2004, it’s one of the newest and largest
pulp mills in the world, and continues to set pulp production and energy generation records
• ISO 9001 and ISO 14001 certified ~75% Mercer owned
• Debt is 80% government guaranteed, low interest and non-recourse to Mercer
One of the largest biomass power plants in Germany • L4Q ending Q2’12, Stendal sold €10.6 million in
chemicals, and exported over 356,000 MWh, generating €32.9 million (US$44.0 million) in revenue from electricity sales*
Recently announced “Project Blue Mill” whereby pulp production capacity is expected to increase by 30,000 Admt and saleable generation by 109,000 MWh
• Scheduled completion September 2013* Q3’11-Q2’12 average EUR:USD fx of 1.3385