jdoc clownpants in the classroom? hypnotizing chickens ... · clownpants in the classroom?...
TRANSCRIPT

Clownpants in the classroom?Hypnotizing chickens?
Measurement of structuraldistraction in visual presentation
documentsJodi Kearns
Center for the History of Psychology, The University of Akron,Akron, Ohio, USA, and
Brian C. O’ConnorLibrary and Information Science, University of North Texas,
Denton, Texas, USA
Abstract
Purpose – The purpose of this paper is to consider the structure of entertainment media as a possiblefoundation for measuring aspects of visual presentations that could enhance or interfere with audienceengagement.Design/methodology/approach – Factors that might account for the large number of negativecomments about visual presentations are identified and a method of calculating entropy measurementsfor form attributes of presentations is introduced.Findings – Entropy calculations provide a numerical measure of structural elements that account forengagement or distraction. A set of peer evaluations of educational presentations is used to calibrate adistraction factor algorithm.Research limitations/implications – Distraction as a consequence of document structure mightenable engineering of a balance between document structure and content in document formats not yetexplored by mechanical entropy calculations.Practical implications – Mathematical calculations of structural elements (form attributes) supportwhat multimedia presentation viewers have been observing for years (documented in numerousjournals and newspapers from education to business to military fields): engineering PowerPointpresentations necessarily involves attention to engagement vs distraction in the audience.Originality/value – Exploring aspects of document structures has been demonstrated to calibrateviewer perceptions to calculated measurements in moving image documents, and now in images andmultimedia presentation documents extending Claude Shannon’s early work communication channelsand James Watt and Robert Krull’s work on television programming.
Keywords Entropy, Applied information theory, Document structure, Humour, Visual presentations
Paper type Research paper
Introduction
Anyone who tries to make a distinction between education and entertainment doesn’t knowthe first thing about either (Marshall McLuhan).
A grasshopper walks into a bar and asks for a drink. The bartender says, “You know, wehave a drink named after you.” And the grasshopper replies, “You have a drink named Bob?”
The current issue and full text archive of this journal is available atwww.emeraldinsight.com/0022-0418.htm
Received 28 January 2013Revised 2 April 2013Accepted 4 April 2013
Journal of DocumentationVol. 70 No. 4, 2014pp. 526-543r Emerald Group Publishing Limited0022-0418DOI 10.1108/JD-01-2013-0009
An earlier form of this study appears in O’Connor, Kearns, and Anderson’s “Doing Things withInformation” (2008) by Libraries Unlimited, where this research was presented in brief as anoverview of a work-in-progress.
526
JDOC70,4

It is funny, because it is surprising, unpredicted; it feels risky and causes discomfort;and it sways from established societal grammars. As long as one has some existingknowledge of both a grasshopper (a winged orthopteran insect with hind legs adaptedfor jumping) and a grasshopper (3/4 oz green creme de menthe, 3/4 oz white creme decacao, and 3/4 oz light cream), one understands the joke.
Whether or not one understands the quip, one experiences both the familiar to theunfamiliar in the introductory sentence “A grasshopper walks into a bar and asks fora drink.” Remove grasshopper from the sentence and add x, where x equals anypossible passerby of the said drinking facility. Many North American adults areprobably familiar with the joke lead in “An x walks into a bar [y]” and upon hearingit, prepare themselves to receive a witty statement within the next few minutes.Despite the anticipation of humor, the recipient laughs – or groans, as it is with lesssophisticated humor – and files it in his or her knowledge store for easy retrieval anduse on another unsuspecting recipient. The humor is that one is taken down onepath, then with right timing shown that it is really the other schema that was in play.Messages that cause some type of upset in a personal information system elicitsurprise (Itti and Baldi, 2009; Wilson, 1977).
Many parts of this joke present absurd notions of reality. Grasshoppers do notnormally walk into bars, and if perchance one does – though it would likely be more ofa hop – it would be impossible for it to order a drink, and even if it could order a drink,it would be impossible for it to consume the entire beverage and live. It seems evenmore absurd that a bartender (assumed to be a human creature) would speak to agrasshopper that just wandered into his establishment demanding a drink andentertain the notion that perhaps the grasshopper may already be aware of the factthat there is a drink named after him. To complete the absurdity is the grasshopper’sreply: “You have a drink named Bob?” Not only can this grasshopper speak, but it alsohas a name common among human pub goers. The recipient laughs not only at theabsurdity that has been built in three short sentences, but also at the dramatic ironythe grasshopper has suffered for not possessing the a priori knowledge of the potentlibation, a grasshopper.
So what? Communication, obviously, depends on message structure, willingnessand ability to understand message components, and context. Useful information, orcommunication, is the as yet unknown – but one can be prepared for the unknownwithin the structures of what is known. Good hunting – which Wilson (1968) assertswe must do, because no information retrieval system will be perfectly designed foreach user and each use – hinges on discovering the useful unknown: sometimesdetecting the slight difference from the norm; sometimes knowing the pattern(“an x walks into a bar”) that will put one in the right place. As with hunting, the jokeformat tells us to expect the unexpected. Paul Rezendez, a wildlife photographer,asserts, “If you spend time learning about the animal and its ways, you may be ableto find the next track without looking [y] Tracking an animal [y] brings you closerto it in perception” (Rezendes, 1992, p. 7). Thus, we might say that humor, as astructural method of applying entropy (unpredictability) of a communicated message,could serve as a probe or touchstone for thinking about information seekingenvironments.
In a joke, the punch line is an entropic burst. When one sees a person in a crimsonprosthetic nose and in the pants of a clown, one assumes funny occurrences areimpending. When one sees a person wearing no pants, one preps oneself for surprise.Conversely, when an average looking person – or a common grasshopper – says
527
Clownpants inthe classroom?
something funny or unexpected or unusual, one enjoys an affected jolt or entropicburst that causes the laugh or the groan.
Defining the clownpants continuumNote: The authors understand that the word pants means different things in differentareas of the English-speaking world, so we want to explain that the word is used in thispiece in the same context as trousers in England or daks in Australia (or pantaloons,historically).
What is funnier than a teacher wearing clown pants? Except, perhaps, no pants?“Clownpants” in visual presentation design is the predictability of unpredictableelements; that is to say that by confusing the structure of a message and engagingentropy with hyperbolic structural change or form over structure. That is, in, forexample, by using frequent structural changes such as seemingly randomcombinations of mixing font types, numerous font colors, inserting differenttransition effects between each pair of slides, animating content, combing clipart forphotographs, and so on, and by doing this with regularity causes the viewer to expectentropic elements, thus robbing them of their novelty. “No pants” in visual andmultimedia presentations indicates that, to some degree, the presentation ofinformation is underdressed, or bare, and is predictable as such. Using single font,no illustrations, no audio clips, and having the presenter simply read the text on thescreen presents little novelty to the viewer, little of the surprise that maintainsengagement with the information processing task (Watt, 1979).
Clownpants is not meant to be yet another set of guidelines to follow for effectivePowerPoint presentation construction; many such sets already exist that expressfunctional tips (see Mahin, 2004; Vik, 2004; DuFrene and Lehman, 2004; Barrett, 2012;Bartsch and Cobern, 2003; Bird, 2001; Brown, 2001); rather, measurements ofPowerPoint document structure offer one possibility for quantifying commonlyaccepted (see Parker, 2001; Schwom and Keller, 2003; Byrne, 2003; Norvig, 2003a, b;Keller, 2002; Livraghi; Worley and Dyrud, 2004; Mitchell, 2009; Ellwood, 2005)structural distractions, misuses, and malengineering. Retired Marine Colonel ThomasX. Hammes refers to PowerPoint slides using bulleted points as the main channel ofmessage delivery as “Dumb-Dumb Bullets” and those PowerPoint-“supported”sessions that put viewers to sleep as “hypnotizing chickens” (Bumiller, 2010).Exploring this clownpants continuum seems to be an infinitely repeating task: can oneinformation seeker’s perception of clownpants be quantified? or scaled to fit intoa spectrum? Viewers’ perceptions of information of moving image documents havebeen calibrated to mechanically calculated numerical representations of the samedocuments using the Mathematical Theory of Communication (Kearns and O’Connor,2004). That is to say that some viewers’ perceptions can be represented as numberson a zero to one scale by applying Claude Shannon’s model for determining the rate ofchange of information in any communicated message: entropy.
A multimedia presentation, like any other document, is a binary system in whichstructure and meaning have a relationship that is complementary but not fixed,necessarily universal, nor independent of the recipient (Anderson, 2006). Informationmust not be confused with meaning (O’Connor et al., 2008) – no more than syntaxequals semantics in a communicated message – nor can information and meaning beused interchangeably (Shannon and Weaver, 1949). Moles complies, asserting that“information differs essentially from meaning: information is only a measure ofcomplexity” (1966, p. 196). Information, in this synthesis, is the physical presentation of
528
JDOC70,4

a message; it is a separate attribute of the message. An author seeks to get somenotion embedded into some medium according to a coding system decodable by theintended recipient; so the message does not hold the author’s notion as its content,only a code. When the information transfer itself confuses a recipient, the actualcontent or meaning of the communicated message is compromised. If the recipientdoes not have the decoding ability that was assumed by the author of the message, themessage still exists yet the author’s notion will be less clear, less obvious.
Information is separate from meaning; however, it is the embodiment of the codingsystem. Thus, when the purpose of a multimedia presentation is to deliver content,message structure can get in the way; that is, it can be its own noise. When “bellsand whistles” are added to the message, the extra effort required to decode such amessage can get in the way – little or no meaning extracted at the expense ofsignificant effort can lead the recipient to give up or back off from expending effortat decoding (Blair, 1990). When the structure is more complex than the decodingability, we might call this “clownpants.” When the structure is not sufficiently complex,we might call this “no pants.” That is, very high complexity, clownpants, may resultin low engagement because the predictability of unpredictable elements is high.Similarly, when the structure never changes, is boring, and uniform, and meaning isconveyed through bare syntax, the presentation wears “no-pants,” and engagementis low: boredom by baredom. Much like the anticipation or expectation one feels whenwatching a clown because creating surprises is central to the clown’s job; and muchlike, if one sees a naked man walking on the street, the unexpected becomes expected:he has bared his barest, like the empty PowerPoint presentation, and has left nothingto the proverbial imaginations of viewers. The viewer stops paying attention to whatthe person is saying, in both the clownpants and no-pants presentation because theinformation (not the meaning) is overwhelmingly distracting.
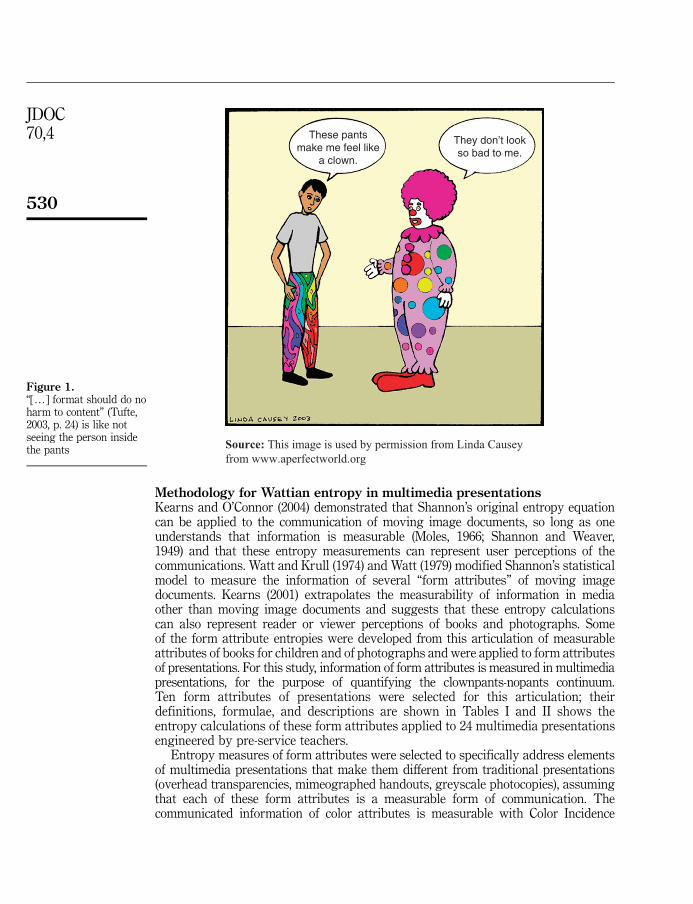
At very least, “presentation format should do no harm to content” (Tufte, 2003,p. 24) (see Figure 1) and the goal – seemingly – should be to use high entropycomponents in multimedia design to create emphasis and to draw-in and hold viewerattention. A teacher wearing clownpants and a teacher wearing no pants are mediawhose formats will distract from the message. The desired communication (content,semantics) seems less important than the method of content delivery.
Entropy measures based on the original model of Shannon and Weaver (1949) andthe interpretations of this model by James Watt (1979) and Kearns (2001) demonstratea means of measuring form attributes of PowerPoint presentations.
Shannon’s original formula:
H ¼ �Xk
i¼1
pi � log2ðpiÞ
Numerical representations of form attributes of presentations indicate some degree ofclownpantsiness in the communicated message. Following, we derive a set of formattributes and present a variation of the approach of Watt and Krull (1974) for makingentropy measures of those attributes. We then calibrate the system of entropymeasurements against an actual set of PowerPoint presentations. These presentationswere made by pre-service teachers as instructional tools. We also make use of theirpeer evaluations to augment our calibration and to have evidence of their reactions(Figure 1).
529
Clownpants inthe classroom?
Methodology for Wattian entropy in multimedia presentationsKearns and O’Connor (2004) demonstrated that Shannon’s original entropy equationcan be applied to the communication of moving image documents, so long as oneunderstands that information is measurable (Moles, 1966; Shannon and Weaver,1949) and that these entropy measurements can represent user perceptions of thecommunications. Watt and Krull (1974) and Watt (1979) modified Shannon’s statisticalmodel to measure the information of several “form attributes” of moving imagedocuments. Kearns (2001) extrapolates the measurability of information in mediaother than moving image documents and suggests that these entropy calculationscan also represent reader or viewer perceptions of books and photographs. Someof the form attribute entropies were developed from this articulation of measurableattributes of books for children and of photographs and were applied to form attributesof presentations. For this study, information of form attributes is measured in multimediapresentations, for the purpose of quantifying the clownpants-nopants continuum.Ten form attributes of presentations were selected for this articulation; theirdefinitions, formulae, and descriptions are shown in Tables I and II shows theentropy calculations of these form attributes applied to 24 multimedia presentationsengineered by pre-service teachers.
Entropy measures of form attributes were selected to specifically address elementsof multimedia presentations that make them different from traditional presentations(overhead transparencies, mimeographed handouts, greyscale photocopies), assumingthat each of these form attributes is a measurable form of communication. Thecommunicated information of color attributes is measurable with Color Incidence
These pantsmake me feel like
a clown.
They don’t lookso bad to me.
Source: This image is used by permission from Linda Causey from www.aperfectworld.org
Figure 1.“[y] format should do noharm to content” (Tufte,2003, p. 24) is like notseeing the person insidethe pants
530
JDOC70,4

En
trop
yty
pe
For
mu
lain
terp
reta
tion
sfo
rP
PT
pre
sen
tati
onat
trib
ute
sD
escr
ipti
on
HC
OC
olor
Inci
den
ceE
ntr
opy
HC
O¼�P
k i¼1
nco
lor
page
npi
xels�log 2
nco
lor
page
npi
xels
nsl
ides
wh
ere
nco
lor
page
isth
eto
tal
nu
mb
erof
colo
rsap
pea
rin
gon
each
pag
en
pix
els
isth
eto
tal
nu
mb
erof
pix
els
per
slid
en
slid
esis
the
tota
ln
um
ber
ofsl
ides
inth
ep
rese
nta
tion
HC
RC
olor
Ran
ge
En
trop
yH
CR¼�
r col
or
npi
xels
�log 2
r col
or
npi
xels
wh
ere
r colo
ris
the
colo
rra
ng
eof
the
tota
lp
rese
nta
tion
npix
els
isth
en
um
ber
ofp
ixel
sp
ersl
ide
HT
IT
ran
siti
onIn
cid
ence
En
trop
yH
TI¼�
ntr
ansi
tion
type
s
nsl
ides
�log 2
ntr
ansi
tion
type
s
nsl
ides
wh
ere
ntr
ansi
tion
types
isth
en
um
ber
ofd
iffe
ren
tsl
ide
tran
siti
onef
fect
su
sed
inth
ep
rese
nta
tion
nsl
ides
isth
eto
tal
nu
mb
erof
slid
esin
the
pre
sen
tati
on
HS
ES
oun
dE
ffec
tsE
ntr
opy
HS
E¼�
nso
unds
nsl
ides
�log 2
nso
unds
nsl
ides
wh
ere
nso
unds
isth
en
um
ber
ofso
un
ds
and
sou
nd
effe
cts
inth
ep
rese
nta
tion
nsl
ides
isth
eto
tal
nu
mb
erof
slid
esin
the
pre
sen
tati
on
HA
DA
nim
atio
nD
istr
ibu
tion
En
trop
yH
AD¼�P
k i¼1
nsl
ide
anim
ati
onev
ents
nto
tala
nim
ati
ons�log 2
nsl
ide
anim
ati
onev
ents
nto
tala
nim
ati
ons
nsl
ides
wh
ere
nsl
ide
anim
ati
on
even
tsis
the
nu
mb
erof
anim
atio
nev
ents
per
slid
en
tota
lanim
ati
ons
isth
eto
tal
nu
mb
erof
anim
atio
nev
ents
inth
ep
rese
nta
tion
nsl
ides
isth
eto
tal
nu
mb
erof
slid
esin
the
pre
sen
tati
on
HW
IW
ord
Inci
den
ceE
ntr
opy
HW
I¼�P
k i¼1
nw
ords
per
slid
e
nsl
ides�log 2
nw
ords
per
slid
e
nsl
ides
nsl
ides
wh
ere
nw
ord
sper
slid
eis
the
nu
mb
erof
wor
ds
app
eari
ng
onin
div
idu
alsl
ides
nsl
ides
isth
eto
tal
nu
mb
erof
slid
esin
the
pre
sen
tati
on
(con
tinu
ed)
Table I.Calculating entropy of
ten PowerPoint formattributes
531
Clownpants inthe classroom?

En
trop
yty
pe
For
mu
lain
terp
reta
tion
sfo
rP
PT
pre
sen
tati
onat
trib
ute
sD
escr
ipti
on
HW
PW
eig
hte
dP
ictu
reE
ntr
opy
HW
P¼�
t anti
cipa
ted
npi
cture
s
�log 2
t anti
cipa
ted
npi
cture
s
wh
ere
t anti
cipate
dis
the
tota
lam
oun
tof
tim
ean
tici
pat
edas
the
goa
lfo
rth
ep
rese
nta
tion
*n
pic
ture
sis
the
tota
ln
um
ber
ofp
ictu
res,
imag
es,
gra
ph
ics
inth
ep
rese
nta
tion
HV
TT
ran
siti
onV
aria
nce
En
trop
yH
VT¼�
ntr
ansi
tion
type
s
ntr
ansi
tion
s
�log 2
ntr
ansi
tion
type
s
ntr
ansi
tion
s
wh
ere
ntr
ansi
tion
types
isth
en
um
ber
ofd
iffe
ren
tsl
ide
tran
siti
onef
fect
su
sed
inth
ep
rese
nta
tion
ntr
ansi
tions
isth
en
um
ber
oftr
ansi
tion
su
sed
inth
ep
rese
nta
tion
HW
TW
eig
hte
dT
ext
En
trop
y
HW
T¼�
t anti
cipa
ted
nw
ords
�log 2
t anti
cipa
ted
nw
ords
wh
ere
t anti
cipate
dis
the
tota
lam
oun
tof
tim
ean
tici
pat
edas
the
goa
lfo
rth
ep
rese
nta
tion
nw
ord
sis
the
tota
ln
um
ber
ofw
ord
sin
the
pre
sen
tati
on
HA
IA
nim
atio
nIn
cid
ence
En
trop
y
HA
I¼�P
k i¼1
nsl
ide
anim
ati
onev
ents
nto
tala
nim
ati
ons�log
2n
slid
eanim
ati
onev
ents
nto
tala
nim
ati
ons
nanim
ate
dsl
ides
wh
ere
nsl
ide
anim
ati
on
even
tsis
the
nu
mb
erof
anim
atio
nev
ents
per
slid
en
tota
lanim
ati
ons
isth
eto
tal
nu
mb
erof
anim
atio
nev
ents
inth
ep
rese
nta
tion
nanim
ate
dsl
ides
isth
en
um
ber
ofsl
ides
con
tain
ing
anim
atio
nef
fect
s
Table I.
532
JDOC70,4

HC
OH
CR
HT
IH
SE
HA
DH
WI
HW
PH
VT
HW
TH
AI
Su
bje
ct1
0.21
2040
0.27
8344
0.13
6803
0.46
4386
0.28
7803
0.30
1378
0.12
7721
0.35
2214
0.29
4357
0.31
3543
Su
bje
ct2
0.12
4237
0.40
7826
0.13
6803
0.46
4386
0.10
2033
0.28
8973
0.47
1466
0.00
0000
0.14
1349
0.45
9148
Su
bje
ct3
0.11
3362
0.10
0435
0.12
5003
0.00
0000
0.15
8496
0.21
5401
0.40
6696
0.33
2193
0.19
6096
0.52
8321
Su
bje
ct4
0.25
7731
0.44
0185
0.25
7542
0.46
4386
0.22
2204
0.26
9334
0.52
6264
0.37
5000
0.22
8350
0.38
1891
Su
bje
ct5
0.17
6343
0.18
1259
0.13
6803
0.36
0201
0.27
3162
0.28
2642
0.37
9933
0.35
2214
0.52
8321
0.35
1208
Su
bje
ct6
0.13
7513
0.15
2921
0.11
5070
0.00
0000
0.30
1993
0.32
6368
0.39
8284
0.31
4494
0.10
2062
0.33
2193
Su
bje
ct7
0.26
0740
0.33
7757
–0.
4421
790.
3257
550.
2694
880.
5301
97–
0.16
2417
0.32
6089
Su
bje
ct8
0.20
2271
0.20
2089
0.11
5070
0.43
0827
0.00
0000
0.30
3270
0.50
9709
0.44
7169
0.20
7830
–S
ub
ject
90.
1817
880.
1789
870.
4643
860.
4643
860.
2935
120.
2917
330.
5243
970.
0000
000.
1867
850.
3773
72S
ub
ject
100.
0808
490.
0816
890.
1250
03–
0.20
0000
0.29
9320
0.38
9975
0.33
2193
0.10
1928
0.50
0000
Su
bje
ct11
0.33
1380
0.40
5602
0.13
6803
0.00
0000
0.32
4255
0.31
6827
0.35
8737
0.35
2214
0.28
5992
0.32
4255
Su
bje
ct12
0.13
0634
0.14
4083
0.13
6803
–0.
3321
930.
3203
980.
4608
820.
3522
140.
1949
470.
3321
93S
ub
ject
130.
2346
870.
3688
420.
3602
010.
4421
790.
2952
960.
2685
480.
3982
840.
4613
460.
1535
250.
3316
92S
ub
ject
140.
0943
100.
1056
340.
1150
700.
4308
270.
0834
810.
3227
870.
4308
270.
5170
470.
1023
310.
4591
48S
ub
ject
150.
1394
850.
1777
510.
1368
030.
4643
860.
1007
290.
3231
420.
4505
480.
3522
140.
1297
480.
4569
84S
ub
ject
160.
1890
330.
1767
440.
2575
420.
4421
790.
3243
270.
2947
580.
4505
480.
3112
780.
2768
780.
3260
83S
ub
ject
170.
1604
680.
2203
550.
1250
030.
5307
020.
1056
640.
3200
820.
5101
420.
5287
710.
1691
590.
5283
21S
ub
ject
180.
1254
650.
2607
69–
0.46
4386
0.33
1190
0.28
5091
0.45
0315
–0.
1330
480.
3311
90S
ub
ject
190.
1370
470.
2534
820.
1250
030.
4471
690.
2903
110.
2768
980.
3799
330.
5000
000.
1538
600.
2903
11S
ub
ject
200.
2877
120.
3683
730.
1368
030.
3321
930.
3330
580.
2930
760.
5068
420.
1510
440.
4822
060.
3221
10S
ub
ject
210.
2230
250.
4120
180.
1150
700.
5262
640.
2761
810.
3047
740.
3459
390.
0000
000.
1774
820.
3126
40S
ub
ject
220.
1792
820.
2377
410.
1250
030.
5112
190.
1676
740.
2751
580.
5101
420.
3321
930.
1594
480.
4191
84S
ub
ject
230.
1576
800.
1735
610.
1150
700.
5283
210.
2732
990.
3056
780.
3678
450.
0000
000.
2615
600.
3208
99S
ub
ject
240.
1482
670.
4171
03–
0.33
2193
0.25
0181
0.00
0000
0.52
1959
–0.
3063
970.
4503
26
Table II.Entropy calculations of
ten PowerPoint formattributes of presentationsdesigned by 24 pre-service
teachers
533
Clownpants inthe classroom?

Entropy (HCO) and Color Range Entropy (HCR); of animation attributes withAnimation Distribution Entropy (HAD) and Animation Incidence Entropy (HAI);of slide transition attributes with Transition Variance Entropy (HVT) andTransition Incidence Entropy (HTI); of sound attributes with Sound Effects Entropy(HSE); of text attributes with Word Incidence Entropy (HWI) and Weighted TextEntropy (HWT); and of image and graphics attributes with Weighted PictureEntropy (HWP).
For calculating HCO (from Kearns, 2001) and HCR, each slide of each of the 24PowerPoint presentations was converted into a JPEG image at the default size of960�720 pixels. Then, using PaintShopTM Pro colors were counted. For HAD andHAI, one animation event was defined in terms of the custom animation windowwithin PowerPoint, since the application lists animation events chronologically and interms of their relation to other animation events. If the purpose of the animation was,for example, to quickly insert ten squares, one after the other, all automated to entersequentially, PowerPoint calls it one animation event. Transition attributes aremeasurable with HTI and HVT, and in presentations that contained no transitioneffects, the number of transition effects equals zero. Measuring sound attributes ispossible with HSE. The number of sounds used in each presentation reflects bothsound effects added to animations and inserted sound clips from the sound clipsgallery. It was counted as one sound effect even when a sound effect was set to repeatuntil the next click of the mouse, or, similarly, to repeat x number of times. Textattributes were calculated with HWI (from Kearns, 2001) and HWT. Text is visualinformation and though it is difficult to separate from the meaning the text gives to thepresentation, this study does not attempt to measure content attributes. Also, studentswere asked to include specific textual information on a title slide. In order not toeliminate the title slide from the HWI, and yet not to give it more undo influence,a simple average was used to normalize the HWI. HWT and HWP are the only twoattributes that measure entropy against a time constraint. These pre-service teacherswere expected to design ten-minute presentations. These entropies measure theirchoices to include text or pictures/graphics weighted against the expected length ofthe presentation. The cells in Table II shown with a “–” had values that produced errorswhen inserted into the formula.
HCO, HCR, HTI, HAD, and HWT measures for Subject 10, for example, are all verylow, and yet HAI is 0.5, which is the highest entropy measurement. This studentused one single animation effect to emphasize the most important semantic point inthe presentation. The effectiveness of this strategy is shown in HAI¼ 0.5 for thispresentation. Similarly, other students opted to employ fewer sound effects (HSE01,HSE02, HSE23, HSE21, for example) which results in high entropy values for this formattribute, and in emphasis drawn to that particular sound effect event, and the contentattached to the event, in the presentation. Whereas HSE06 and HSE11 have valuesof 0 because they each engineered their PowerPoint presentations to include the samesound effect to occur with each slide transition, causing the sound effect to be moreof a distracting than an attractive feature.
Peer evaluations of multimedia presentationsYet the question remains, can these measurements adequately represent an actualviewer’s perception of the physical information of the presentation? Pre-serviceteachers evaluated the PowerPoint presentations of their peers by first composing
534
JDOC70,4
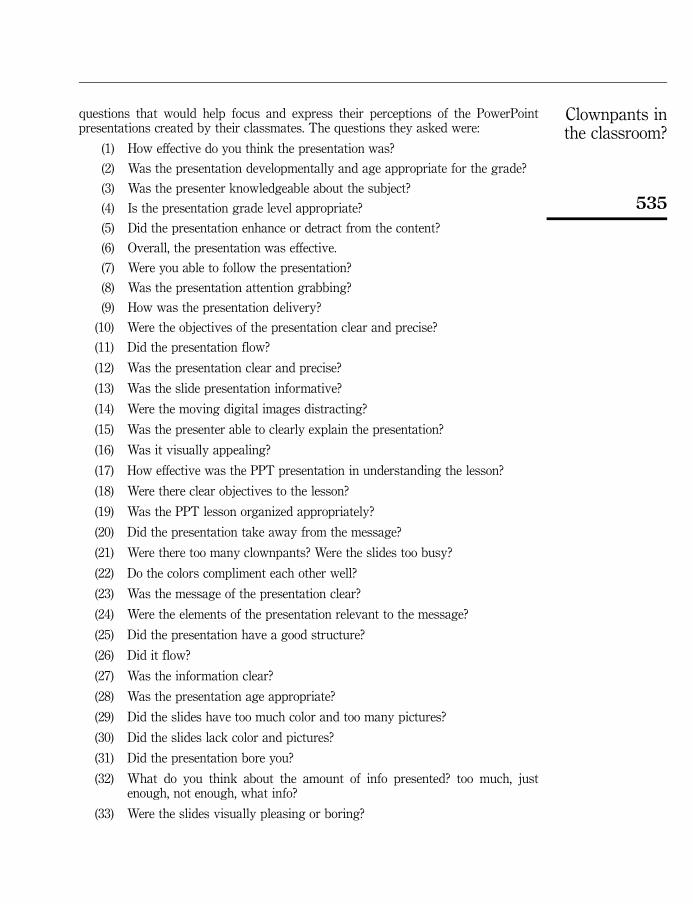
questions that would help focus and express their perceptions of the PowerPointpresentations created by their classmates. The questions they asked were:
(1) How effective do you think the presentation was?
(2) Was the presentation developmentally and age appropriate for the grade?
(3) Was the presenter knowledgeable about the subject?
(4) Is the presentation grade level appropriate?
(5) Did the presentation enhance or detract from the content?
(6) Overall, the presentation was effective.
(7) Were you able to follow the presentation?
(8) Was the presentation attention grabbing?
(9) How was the presentation delivery?
(10) Were the objectives of the presentation clear and precise?
(11) Did the presentation flow?
(12) Was the presentation clear and precise?
(13) Was the slide presentation informative?
(14) Were the moving digital images distracting?
(15) Was the presenter able to clearly explain the presentation?
(16) Was it visually appealing?
(17) How effective was the PPT presentation in understanding the lesson?
(18) Were there clear objectives to the lesson?
(19) Was the PPT lesson organized appropriately?
(20) Did the presentation take away from the message?
(21) Were there too many clownpants? Were the slides too busy?
(22) Do the colors compliment each other well?
(23) Was the message of the presentation clear?
(24) Were the elements of the presentation relevant to the message?
(25) Did the presentation have a good structure?
(26) Did it flow?
(27) Was the information clear?
(28) Was the presentation age appropriate?
(29) Did the slides have too much color and too many pictures?
(30) Did the slides lack color and pictures?
(31) Did the presentation bore you?
(32) What do you think about the amount of info presented? too much, justenough, not enough, what info?
(33) Were the slides visually pleasing or boring?
535
Clownpants inthe classroom?
These questions, perhaps, seem more significant when one considers how someonemight categorize these questions or possibly answer them with emotive descriptorsthat define entropy: “interest[ing], exciting, like[able], funny, boring, and surprising”(Kearns and O’Connor, 2004), Simon’s (2005) “risky”, and the sources from which thelist was contrived from Shannon and Weaver’s (1949) “confusing”; Augst andO’Connor’s (1999) “dull” and “dynamic”; Watt’s (1979) “exciting,” “interest,” and“boring”; Wilson’s (1977) “disequilibrium” and “discomfort”, and Campbell’s (1982)“dull” and “exciting”. Pre-service teachers seem to want exciting PowerPointpresentations, though they have difficulty engineering excitement, or differentiating“excitement” from overuse of special effects.
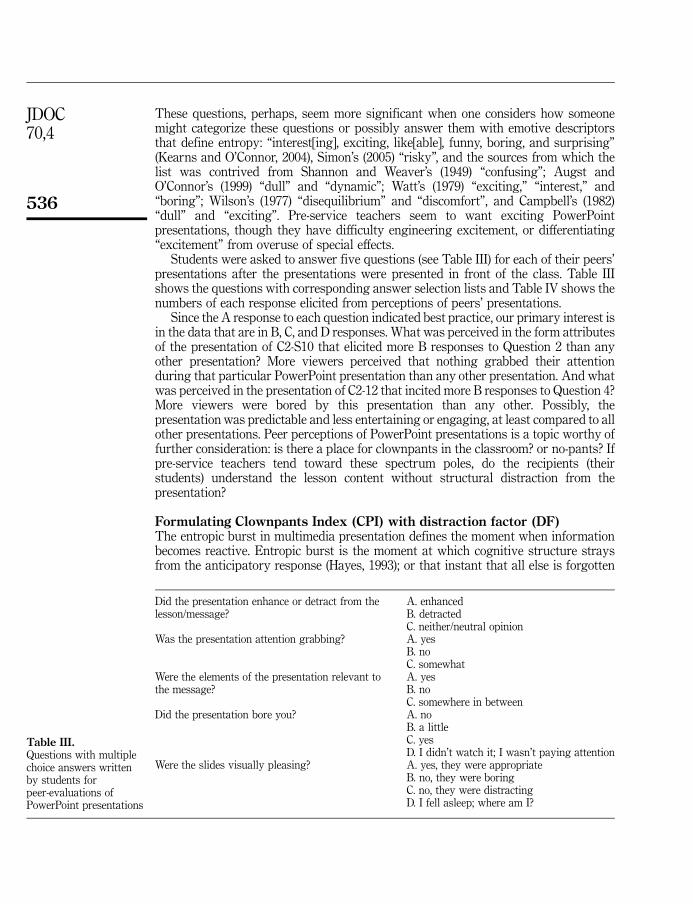
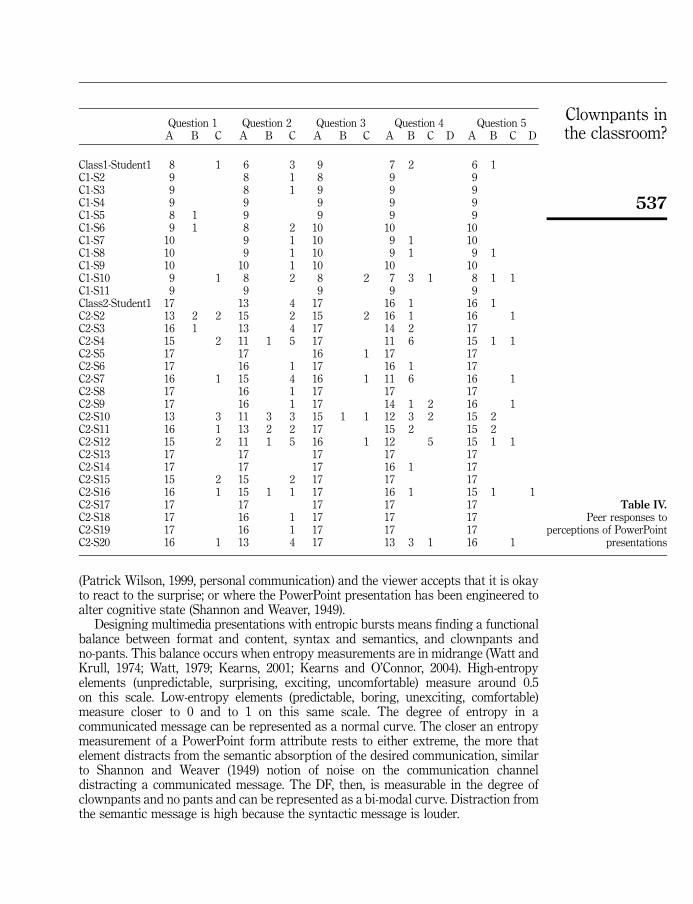
Students were asked to answer five questions (see Table III) for each of their peers’presentations after the presentations were presented in front of the class. Table IIIshows the questions with corresponding answer selection lists and Table IV shows thenumbers of each response elicited from perceptions of peers’ presentations.
Since the A response to each question indicated best practice, our primary interest isin the data that are in B, C, and D responses. What was perceived in the form attributesof the presentation of C2-S10 that elicited more B responses to Question 2 than anyother presentation? More viewers perceived that nothing grabbed their attentionduring that particular PowerPoint presentation than any other presentation. And whatwas perceived in the presentation of C2-12 that incited more B responses to Question 4?More viewers were bored by this presentation than any other. Possibly, thepresentation was predictable and less entertaining or engaging, at least compared to allother presentations. Peer perceptions of PowerPoint presentations is a topic worthy offurther consideration: is there a place for clownpants in the classroom? or no-pants? Ifpre-service teachers tend toward these spectrum poles, do the recipients (theirstudents) understand the lesson content without structural distraction from thepresentation?
Formulating Clownpants Index (CPI) with distraction factor (DF)The entropic burst in multimedia presentation defines the moment when informationbecomes reactive. Entropic burst is the moment at which cognitive structure straysfrom the anticipatory response (Hayes, 1993); or that instant that all else is forgotten
Did the presentation enhance or detract from thelesson/message?
A. enhancedB. detractedC. neither/neutral opinion
Was the presentation attention grabbing? A. yesB. noC. somewhat
Were the elements of the presentation relevant tothe message?
A. yesB. noC. somewhere in between
Did the presentation bore you? A. noB. a littleC. yesD. I didn’t watch it; I wasn’t paying attention
Were the slides visually pleasing? A. yes, they were appropriateB. no, they were boringC. no, they were distractingD. I fell asleep; where am I?
Table III.Questions with multiplechoice answers writtenby students forpeer-evaluations ofPowerPoint presentations
536
JDOC70,4
(Patrick Wilson, 1999, personal communication) and the viewer accepts that it is okayto react to the surprise; or where the PowerPoint presentation has been engineered toalter cognitive state (Shannon and Weaver, 1949).
Designing multimedia presentations with entropic bursts means finding a functionalbalance between format and content, syntax and semantics, and clownpants andno-pants. This balance occurs when entropy measurements are in midrange (Watt andKrull, 1974; Watt, 1979; Kearns, 2001; Kearns and O’Connor, 2004). High-entropyelements (unpredictable, surprising, exciting, uncomfortable) measure around 0.5on this scale. Low-entropy elements (predictable, boring, unexciting, comfortable)measure closer to 0 and to 1 on this same scale. The degree of entropy in acommunicated message can be represented as a normal curve. The closer an entropymeasurement of a PowerPoint form attribute rests to either extreme, the more thatelement distracts from the semantic absorption of the desired communication, similarto Shannon and Weaver (1949) notion of noise on the communication channeldistracting a communicated message. The DF, then, is measurable in the degree ofclownpants and no pants and can be represented as a bi-modal curve. Distraction fromthe semantic message is high because the syntactic message is louder.
Question 1 Question 2 Question 3 Question 4 Question 5A B C A B C A B C A B C D A B C D
Class1-Student1 8 1 6 3 9 7 2 6 1C1-S2 9 8 1 8 9 9C1-S3 9 8 1 9 9 9C1-S4 9 9 9 9 9C1-S5 8 1 9 9 9 9C1-S6 9 1 8 2 10 10 10C1-S7 10 9 1 10 9 1 10C1-S8 10 9 1 10 9 1 9 1C1-S9 10 10 1 10 10 10C1-S10 9 1 8 2 8 2 7 3 1 8 1 1C1-S11 9 9 9 9 9Class2-Student1 17 13 4 17 16 1 16 1C2-S2 13 2 2 15 2 15 2 16 1 16 1C2-S3 16 1 13 4 17 14 2 17C2-S4 15 2 11 1 5 17 11 6 15 1 1C2-S5 17 17 16 1 17 17C2-S6 17 16 1 17 16 1 17C2-S7 16 1 15 4 16 1 11 6 16 1C2-S8 17 16 1 17 17 17C2-S9 17 16 1 17 14 1 2 16 1C2-S10 13 3 11 3 3 15 1 1 12 3 2 15 2C2-S11 16 1 13 2 2 17 15 2 15 2C2-S12 15 2 11 1 5 16 1 12 5 15 1 1C2-S13 17 17 17 17 17C2-S14 17 17 17 16 1 17C2-S15 15 2 15 2 17 17 17C2-S16 16 1 15 1 1 17 16 1 15 1 1C2-S17 17 17 17 17 17C2-S18 17 16 1 17 17 17C2-S19 17 16 1 17 17 17C2-S20 16 1 13 4 17 13 3 1 16 1
Table IV.Peer responses to
perceptions of PowerPointpresentations
537
Clownpants inthe classroom?

This DF, then, in multimedia presentations can be represented numerically with aformula and expressed as a number (Table V) on the familiar scale of 1 and 10, where10 is a high DF.
Calculating the DF of syntactic attributes in multimedia presentations:
DF ¼ 0:5� Hj jð Þ � 20
when:
H ¼ �Xk
i¼1
pi � log2ðpiÞ
The distribution of DFs on the CPI fluctuates for each form attribute just as calculatedentropy measurements for each form attribute vary. For Subject 16, for example, HWPis high (HWP¼ 0.450548, see Table II) so the DF of this form attribute is low(DFWP¼ 0.98904), when other DFs are higher. The visual representation of the DFs ofthe form attributes of Subjects 1, 9, 16, and 23 are shown in Figure 2. Both Subjects 9and 23 had a DF for the form attribute Transition Variance (DFVT) equal to 10,demonstrating that the variance of their selections for transition effects between slideswas distracting by a DF of 10 from the content. When DFs are greater, information hasbecome greater, louder, stronger than content. When DF is high, we call thisclownpants, whether the distraction results from too much or too little physicalinformation, since no-pants can be as distracting as clownpants. Recall those SoundEffect Entropy measurements for Subjects 6 and 11 as 0: the resulting DFs from thislow-entropy component are perfect tens (DFSE¼ 10) on the CPI.
If DFs of all physical attributes are all high, or all low, no emphasis has been made.The PowerPoint engineer has merely delivered content flatly, and likely as effectivelyas reading that content from the text with no vocal inflections. Some distraction is goodbecause it creates emphasis. Building too many distractions or surprises onto everyslide, makes your information predictable, but noticing discontinuities (Augst andO’Connor, 1999) or change in visual fields (Watt, 1979) generates higher viewerattention.
Concluding thoughts
There are more than one hundred elements [to comedy], but the most important is the elementof surprise. Boo! (Idle, 1999, p. 122).
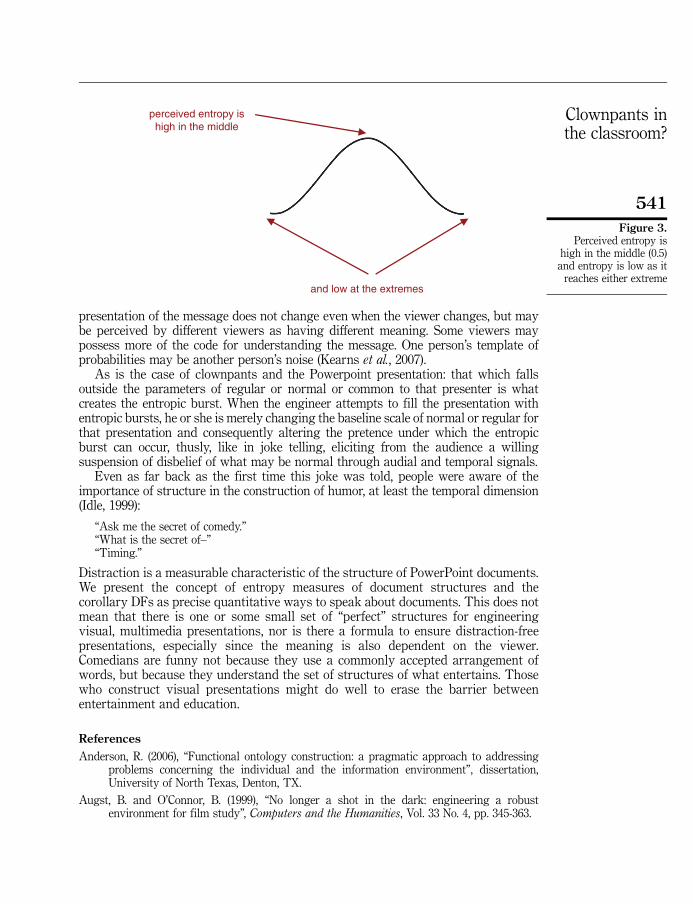
For perception, surprise, as in Figure 3, is associated with the peak of the curve (Kearnsand O’Connor, 2004). Ordinarily, entropy is a measure of structure that rises from 0 tonear complete chaos as it approaches 1. However, another way of expressing the notionof entropy is to say that it is inversely proportional to the likelihood of occurrence, or asClaude Shannon said “information is the negative reciprocal value of probability.” Withletters and words, we have some sense of the likelihood of occurrence (we know “e” willappear much more frequently than “w” and that “the” will appear more frequently than“kayak” in general use, though in a book on boating, “kayak” would be expected). Atzero, the structure of a joke, or a visual presentation, or any message would exhibit nosurprise; while at or near one, surprises would be so frequent as to become ordinary.One might say at the middle of the curve, there is sufficient familiarity for a changeof structure to be surprising. Thus, the calculated DFs are high at either end of thecurve because neither stasis nor constant change presents surprise. The structural
538
JDOC70,4

DF
CO
DF
CR
DF
TI
DF
SE
DF
AD
DF
WI
DF
WP
DF
VT
DF
WT
DF
AI
Su
bje
ct01
5.75
920
4.43
312
7.26
394
0.71
228
4.24
394
3.97
244
7.44
558
2.95
572
4.11
286
3.72
914
Su
bje
ct02
7.51
526
1.84
348
7.26
394
0.71
228
7.95
934
4.22
054
0.57
068
107.
1730
20.
8170
4S
ub
ject
037.
7327
67.
9913
07.
4999
410
6.83
008
5.69
198
1.86
608
3.35
614
6.07
808
0.56
642
Su
bje
ct04
4.84
538
1.19
630
4.84
916
0.71
228
5.55
592
4.61
332
0.52
528
2.5
5.43
300
2.36
218
Su
bje
ct05
6.47
314
6.37
482
7.26
394
2.79
598
4.53
676
4.34
716
2.40
134
2.95
572
0.56
642
2.97
584
Su
bje
ct06
7.24
974
6.94
158
7.69
860
103.
9601
43.
4726
42.
0343
23.
7101
27.
9587
63.
3561
4S
ub
ject
074.
7852
03.
2448
6–
1.15
642
3.48
490
4.61
024
0.60
394
–6.
7516
63.
4782
2S
ub
ject
085.
9545
85.
9582
27.
6986
01.
3834
610
3.93
460.
1941
81.
0566
25.
8434
0–
Su
bje
ct09
6.36
424
6.42
026
0.71
228
0.71
228
4.12
976
4.16
534
0.48
794
106.
2643
02.
4525
6S
ub
ject
108.
3830
28.
3662
27.
4999
4–
64.
0136
02.
2005
03.
3561
47.
9614
40
Su
bje
ct11
3.37
240
1.88
796
7.26
394
103.
5149
03.
6634
62.
8252
62.
9557
24.
2801
63.
5149
0S
ub
ject
127.
3873
27.
1183
47.
2639
4–
3.35
614
3.59
204
0.78
236
2.95
572
6.10
106
3.35
614
Su
bje
ct13
5.30
626
2.62
316
2.79
598
1.15
642
4.09
408
4.62
904
2.03
432
0.77
308
6.92
950
3.36
616
Su
bje
ct14
8.11
380
7.88
732
7.69
860
1.38
346
8.33
038
3.54
426
1.38
346
0.34
094
7.95
338
0.81
704
Su
bje
ct15
7.21
030
6.44
498
7.26
394
0.71
228
7.98
542
3.53
716
0.98
904
2.95
572
7.40
504
0.86
032
Su
bje
ct16
6.21
934
6.46
512
4.84
916
1.15
642
3.51
346
4.10
484
0.98
904
3.77
444
4.46
244
3.47
834
Su
bje
ct17
6.79
064
5.59
290
7.49
994
0.61
404
7.88
672
3.59
836
0.20
284
0.57
542
6.61
682
0.56
642
Su
bje
ct18
7.49
070
4.78
462
–0.
7122
83.
3762
4.29
818
0.99
370
–7.
3390
43.
3762
0S
ub
ject
197.
2590
64.
9303
67.
4999
41.
0566
24.
1937
84.
4620
42.
4013
40
6.92
280
4.19
378
Su
bje
ct20
4.24
576
2.63
254
7.26
394
3.35
614
3.33
884
4.13
848
0.13
684
6.97
912
0.35
588
3.55
780
Su
bje
ct21
5.53
950
1.75
964
7.69
860
0.52
528
4.47
638
3.90
452
3.08
122
106.
4503
63.
7472
0S
ub
ject
226.
4143
65.
2451
87.
4999
40.
2243
86.
6465
24.
4968
40.
2028
43.
3561
46.
8110
41.
6163
2S
ub
ject
236.
8464
06.
5287
87.
6986
00.
5664
24.
5340
23.
8864
42.
6431
010
4.76
880
3.58
202
Su
bje
ct24
7.03
466
1.65
794
–3.
3561
44.
9963
810
0.43
918
–3.
8720
60.
9934
8
Table V.Distraction factors
calculated for ten formattributes of 24
PowerPoint presentations
539
Clownpants inthe classroom?

Figure 2.Visual representationsof distraction factorsfor Subjects 1, 9, 16,and 23
Dis
trac
tion
Fac
tors
for
Sub
ject
1
012345678910
HCO
HCR
HTI
HSE
HAD
HWI
HWP
HVT
HWT
HAI
Ent
ropy
CPI
Dis
trac
tion
Fac
tors
for
Sub
ject
9
012345678910
HCO
HCR
HTI
HSE
HAD
HWI
HWP
HVT
HWT
HAI
Ent
ropy
CPI
Dis
trac
tion
Fac
tor
for
Sub
ject
16
012345678910
HCO
HCR
HTI
HSE
HAD
HWI
HWP
HVT
HWT
HAI
Ent
ropy
CPI
Dis
trac
tion
Fac
tor
for
Sub
ject
23
012345678910
HCO
HCR
HTI
HSE
HAD
HWI
HWP
HVT
HWT
HAI
Ent
ropy
CPI
540
JDOC70,4
presentation of the message does not change even when the viewer changes, but maybe perceived by different viewers as having different meaning. Some viewers maypossess more of the code for understanding the message. One person’s template ofprobabilities may be another person’s noise (Kearns et al., 2007).
As is the case of clownpants and the Powerpoint presentation: that which fallsoutside the parameters of regular or normal or common to that presenter is whatcreates the entropic burst. When the engineer attempts to fill the presentation withentropic bursts, he or she is merely changing the baseline scale of normal or regular forthat presentation and consequently altering the pretence under which the entropicburst can occur, thusly, like in joke telling, eliciting from the audience a willingsuspension of disbelief of what may be normal through audial and temporal signals.
Even as far back as the first time this joke was told, people were aware of theimportance of structure in the construction of humor, at least the temporal dimension(Idle, 1999):
“Ask me the secret of comedy.”“What is the secret of–”“Timing.”
Distraction is a measurable characteristic of the structure of PowerPoint documents.We present the concept of entropy measures of document structures and thecorollary DFs as precise quantitative ways to speak about documents. This does notmean that there is one or some small set of “perfect” structures for engineeringvisual, multimedia presentations, nor is there a formula to ensure distraction-freepresentations, especially since the meaning is also dependent on the viewer.Comedians are funny not because they use a commonly accepted arrangement ofwords, but because they understand the set of structures of what entertains. Thosewho construct visual presentations might do well to erase the barrier betweenentertainment and education.
References
Anderson, R. (2006), “Functional ontology construction: a pragmatic approach to addressingproblems concerning the individual and the information environment”, dissertation,University of North Texas, Denton, TX.
Augst, B. and O’Connor, B. (1999), “No longer a shot in the dark: engineering a robustenvironment for film study”, Computers and the Humanities, Vol. 33 No. 4, pp. 345-363.
perceived entropy ishigh in the middle
and low at the extremes
Figure 3.Perceived entropy is
high in the middle (0.5)and entropy is low as it
reaches either extreme
541
Clownpants inthe classroom?

Barrett, J. (2012), “Simple, powerful & effective presentation slide design”, available at:www.slideshare.net/jonbarrett/simple-powerful-effective--presentation-slide-design(accessed January 27, 2013).
Bartsch, R.A. and Cobern, K.M. (2003), “Effectiveness of PowerPoint presentations in lectures”,Computers and Education, Vol. 41 No. 1, pp. 77-86.
Bird, L. (2001), “Avoid the mistakes of PowerPoint rookies”, Office Computing, Vol. 12 No. 1,pp. 62-65.
Blair, D.C. (1990), Language and Representation in Information Retrieval, Elsevier, New York, NY.
Brown, D.G. (2001), PowerPoint-induced sleep, Syllabus, Vol. 14 No. 6.
Bumiller, E. (2010), “We have met the enemy and he is PowerPoint”, New York Times, April 26, p. A1.
Byrne, D. (2003), “Learning to love PowerPoint”, Wired, Vol. 11 No. 9, available at: http://archive.wired.com/wired/archive/11.09/ppt1.html
Campbell, J. (1982), Grammatical Man, Simon and Schuster, New York, NY.
Dufrene, D.D. and Lehman, C.M. (2004), “Concept, content, construction, and contingencies:getting the horse before the PowerPoint cart”, Business Communication Quarterly, Vol. 67No. 1, pp. 84-88.
Ellwood, J. (2005), “Presence or PowerPoint: why PowerPoint has become a cliche”, Developmentand Learning in Organizations, Vol. 19 No. 3, pp. 12-14.
Hayes, R.M. (1993), “Measurement of information”, Information Processing & Management,Vol. 29 No. 1, pp. 1-11.
Idle, E. (1999), The Road to Mars, Pantheon Books, New York, NY.
Itti, L. and Baldi, P. (2009), “Bayesian surprise attracts human attention”, Vision Research, Vol. 49No. 10, pp. 1295-1306.
Kearns, J. (2001), “A mechanism for richer representation of videos for children: calibratingcalculated entropy to perceived entropy”, dissertation. University of North Texas,Denton, TX.
Kearns, J. and O’Connor, B.C. (2004), “Dancing with entropy: form attributes, children, andrepresentation”, Journal of Documentation, Vol. 60 No. 2, pp. 144-163.
Kearns, J., O’Connor, B.C. and Moore, F.B.-G. (2007), “Provocations on the structure of scholarlywriting in the digital era”, On the Horizon, Vol. 15 No. 4, pp. 222-238.
Keller, J. (2002), “Is PowerPoint the devil?”, The Chicago Tribune, January 22, available at: http://faculty.winthrop.edu/kosterj/WRIT465/management/juliakeller1.htm (accessed January 22, 2003).
Livraghi, G. (2003), “Powerpointitis: glitz over content”, available at: http://visionarymarketing.com/articles/powerpointdisease.htm (accessed July 15, 2007).
Mahin, L. (2004), “Powerpoint pedagogy”, Business Communication Quarterly, Vol. 67 No. 2,pp. 219-222.
Mitchell, O. (2009), “How to make an effective PowerPoint presentation”, Speak about presenting:help with your next presentation from Olivia Mitchell, available at: www.speakingaboutpresenting.com/design/-design-recommended-tips/ (accessed January 20, 2013).
Moles, A. (1966), Information Theory and Esthetic Perception, University of Illinois, Urbana, IL.
Norvig, P. (2003a), “PowerPoint shot with its own bullets”, The Lancet, Vol. 362 No. 9381,pp. 343-344.
Norvig, P. (2003b), “The making of the Gettysburg PowerPoint presentation”, available at:www.norvig.com/Gettysburg/making.html (accessed January 28, 2013).
O’Connor, B.C., Kearns, J. and Anderson, R.L. (2008), Doing Things with Information: BeyondIndexing and Abstracting, Libraries Unlimited, Santa Barbara, CA.
542
JDOC70,4

Parker, I. (2001), “Absolute PowerPoint: can a software package edit our thoughts?”, TheNew Yorker, May 28, No. 76, available at: www.newyorker.com/archive/2001/05/28/010528fa_fact_parker
Rezendes, P. (1992), Tracking and the Art of Seeing: How to Read Animal Tracks and Signs,Camden House, Charlotte, VT.
Schwom, B. and Keller, K. (2003), “The great man has spoken. Now what do I do?: a responseto Edward R. Tufte’s ‘The cognitive style of PowerPoint’”, Communication Partners, Vol. 1No. 1, pp. 1-16.
Shannon, C. and Weaver, W. (1949), The Mathematical Theory of Communication, The Universityof Illinois Press, Urbana, IL.
Simon, S. (2005), “A multi-dimensional entropy measure of jazz improvisation for musicinformation retrieval”, dissertation, University of North Texas, Denton, TX.
Tufte, E. (2003), The Cognitive Style of PowerPoint, Graphic Press, CT.
Vik, G.N. (2004), “Breaking bad habits: teaching effective PowerPoint use to working graduatestudents”, Business Communication Quarterly, Vol. 67 No. 2, pp. 225-228.
Watt, J. (1979), “Television form, content attributes, and viewer behavior”, in Voight, M.J. (Ed.),Progress In Communication, ABLEX Publishing, Norwood, NJ, pp. 51-89.
Watt, J.H. and Krull, R. (1974), “An information theory measure for television programming”,Communication Research, Vol. 1 No. 1, pp. 44-68.
Wilson, P. (1968), Two Kinds of Power, University of California Press, Berkeley, CA.
Wilson, P. (1977), Public Knowledge Private Ignorance, University of California Press,Berkeley, CA.
Worley, R.B. and Dyrud, M.A. (2004), “Presentations and the PowerPoint problem”, BusinessCommunication Quarterly, Vol. 67 No. 1, pp. 78-80.
Corresponding authorDr Jodi Kearns can be contacted at: [email protected]
To purchase reprints of this article please e-mail: [email protected] visit our web site for further details: www.emeraldinsight.com/reprints
543
Clownpants inthe classroom?