j.cugnoni, [email protected] 1 constraining and size effects in lead-free solder joints j....
Post on 21-Dec-2015
214 views
TRANSCRIPT
J.Cugnoni, [email protected] 1
Constraining and size effects in lead-free solder joints
J. Cugnoni1, J. Botsis1, J.Janczak2
1 Lab. Applied Mechanics & Reliability, EPFL, Switzerland2 Füge- und Grenzflächentechnologie, EMPA, Switzerland

J.Cugnoni, [email protected] 2
Outline
Introduction Global project & goals Constraining effects In-situ characterization by inverse numerical methods
Experimental Test setup Results: Constrained stress-strain curves of SnAgCu joints
Numerical Modelling & inverse identification method Identified constitutive laws (unconstrained) Constraining & size effects
Conclusion
J.Cugnoni, [email protected] 3
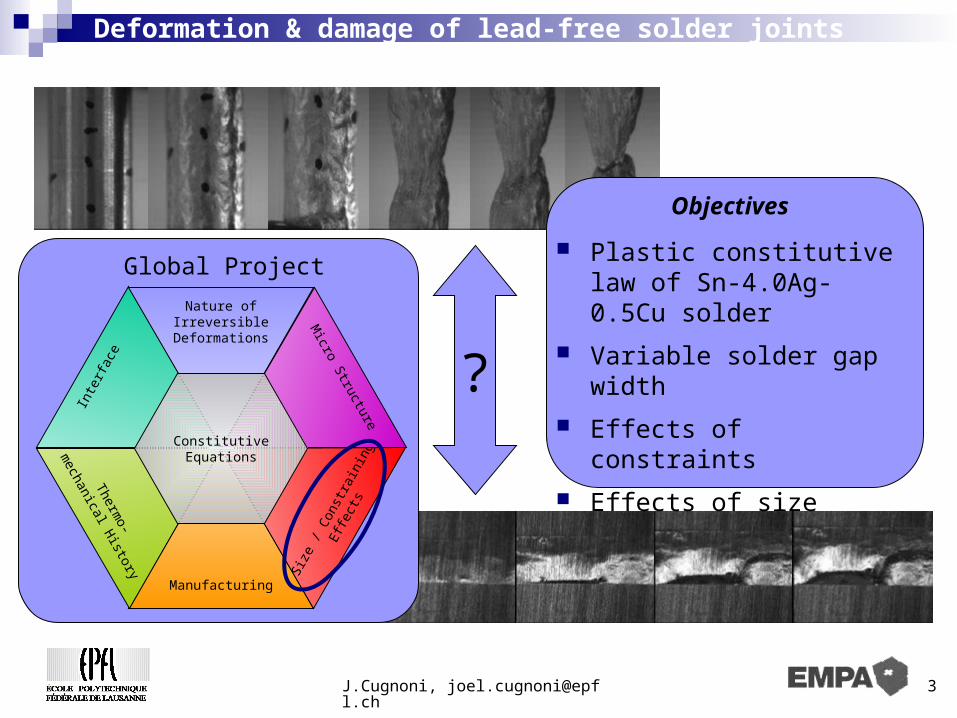
Deformation & damage of lead-free solder joints
Manufacturing
Siz
e / C
onst
rain
ing
Effe
cts
Thermo-
mechanical H
istory
Micro S
tructure
Inte
rface
Nature of Irreversible Deformations
ConstitutiveEquations
Global Project
?
Objectives
Plastic constitutive law of Sn-4.0Ag-0.5Cu solder
Variable solder gap width
Effects of constraints
Effects of size
J.Cugnoni, [email protected] 4
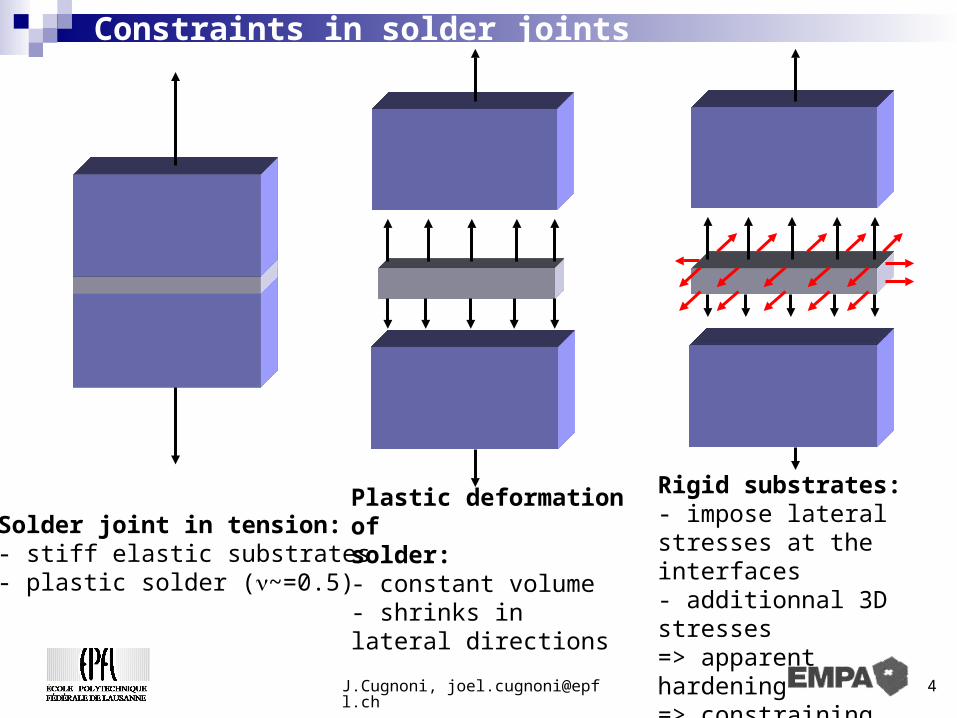
Constraints in solder joints
Solder joint in tension: - stiff elastic substrates- plastic solder (~=0.5)
Plastic deformation ofsolder:- constant volume- shrinks in lateral directions
Rigid substrates:- impose lateral stresses at the interfaces - additionnal 3D stresses=> apparent hardening=> constraining effects

J.Cugnoni, [email protected] 5
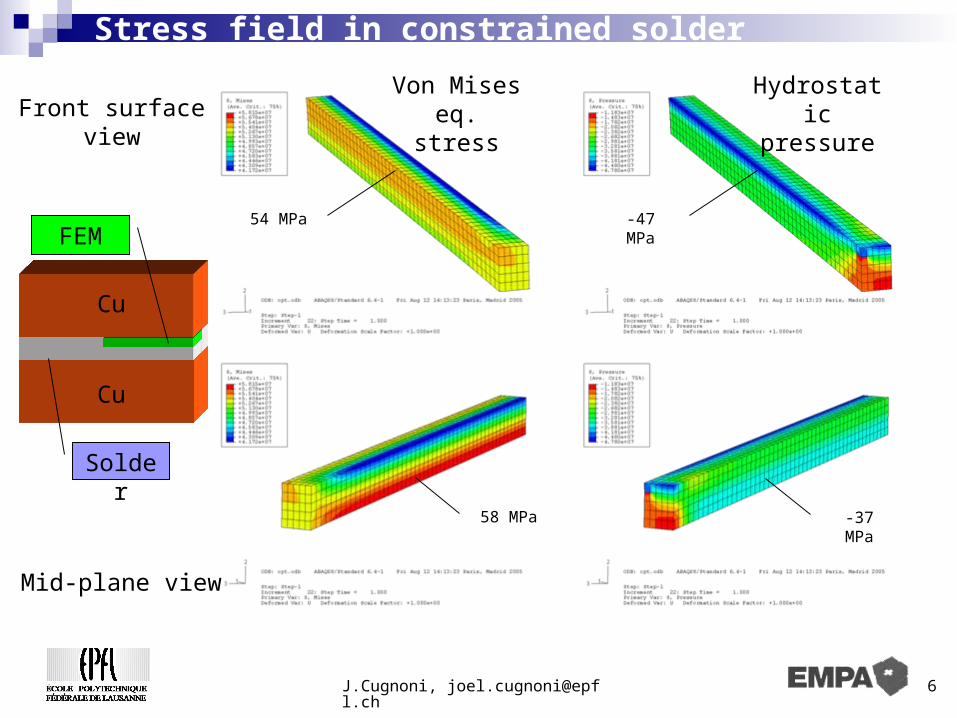
Stress field in constrained solder
11 22Front surface
view
Mid-plane view
Cu
Cu
Solder
FEM47 MPa 76 MPa
70 MPa37 MPa
J.Cugnoni, [email protected] 6
Stress field in constrained solder
Von Miseseq. stress
Hydrostatic pressureFront surface
view
Mid-plane view
Cu
Cu
Solder
FEM54 MPa -47 MPa
58 MPa -37 MPa
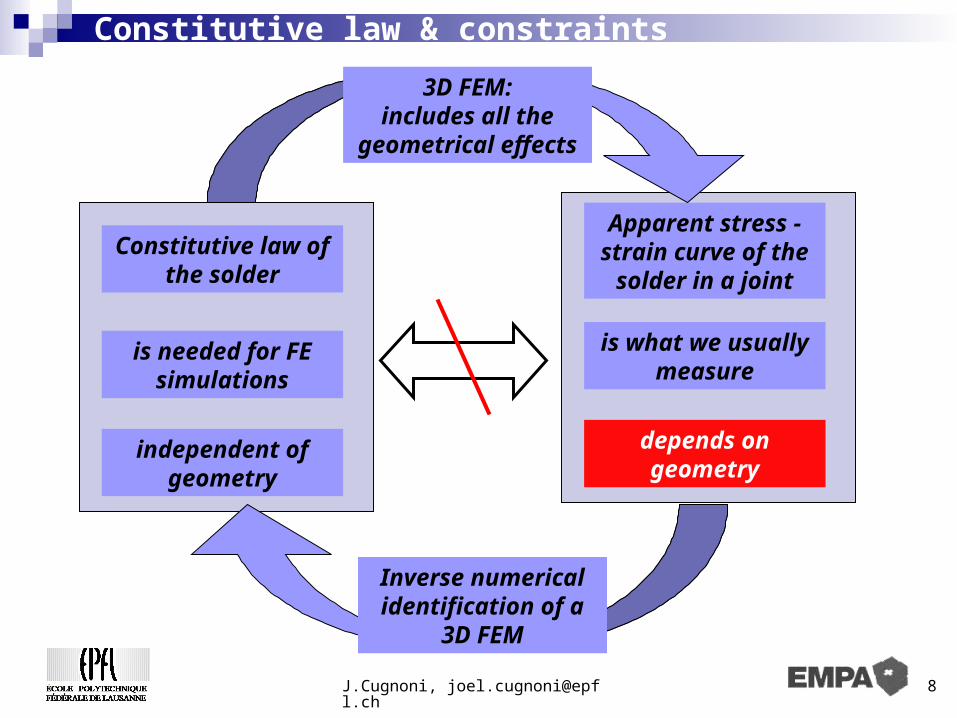
J.Cugnoni, [email protected] 8
Apparent stress - strain curve of the
solder in a joint
is what we usually measure
depends on geometry
Constitutive law & constraints
Constitutive law of the solder
is needed for FE simulations
independent of geometry
3D FEM:includes all the
geometrical effects
???Inverse numerical identification of a
3D FEM
J.Cugnoni, [email protected] 10
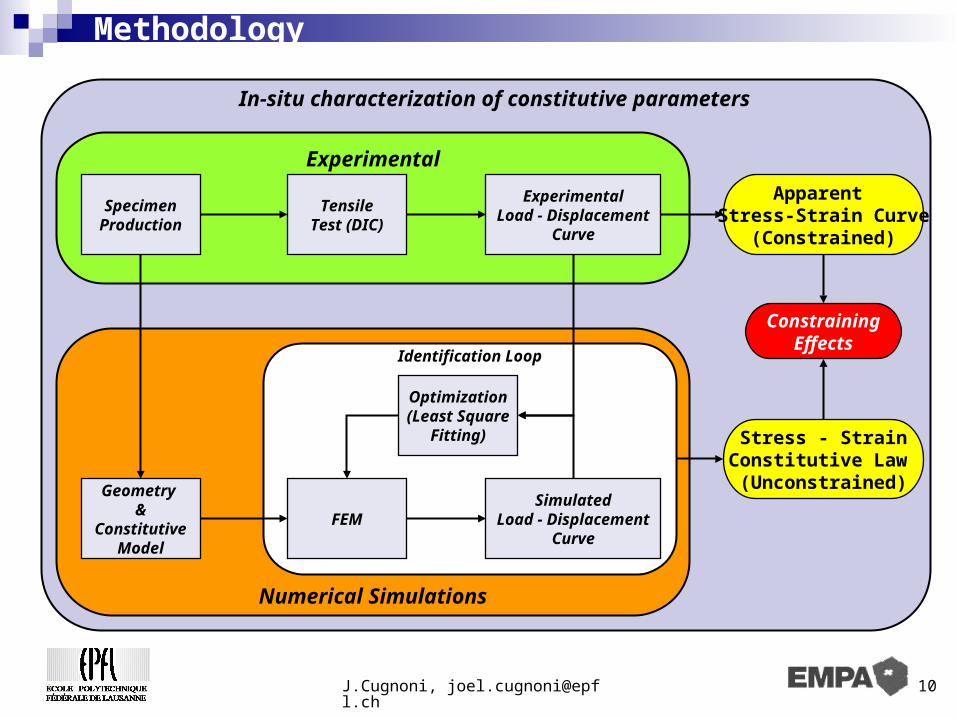
Methodology
SpecimenProduction
TensileTest (DIC)
Geometry &
ConstitutiveModel
FEM
ExperimentalLoad - Displacement
Curve
SimulatedLoad - Displacement
Curve
Apparent Stress-Strain Curve
(Constrained)
Optimization(Least Square
Fitting) Stress - StrainConstitutive Law (Unconstrained)
Identification Loop
ConstrainingEffects
Experimental
In-situ characterization of constitutive parameters
Numerical Simulations
J.Cugnoni, [email protected] 11
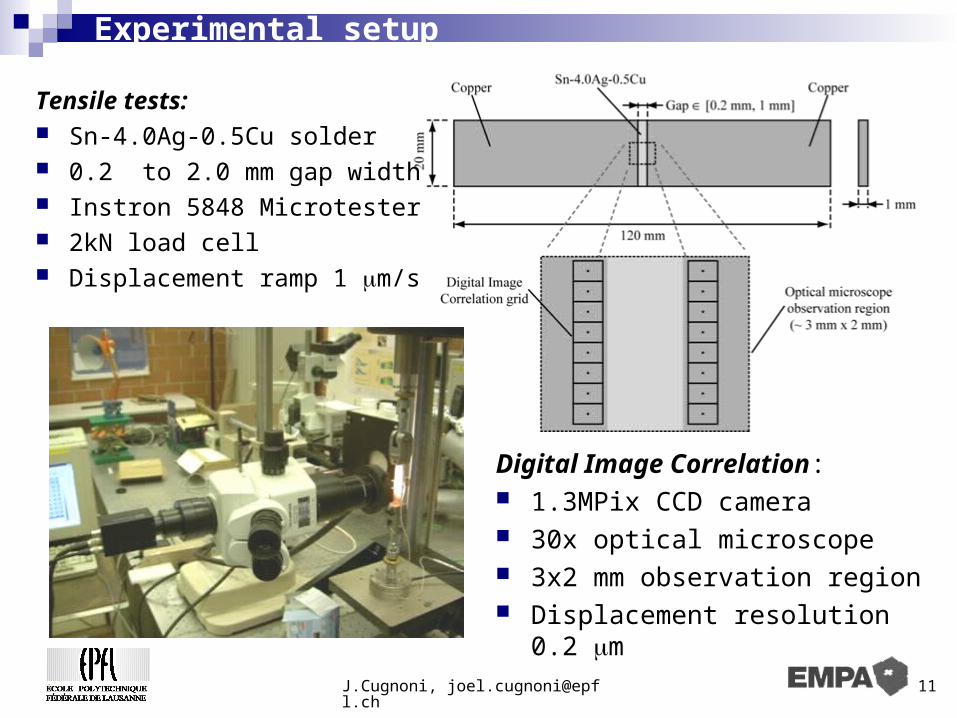
Experimental setup
Tensile tests: Sn-4.0Ag-0.5Cu solder 0.2 to 2.0 mm gap width Instron 5848 Microtester 2kN load cell Displacement ramp 1 m/s
Digital Image Correlation: 1.3MPix CCD camera 30x optical microscope 3x2 mm observation region Displacement resolution 0.2 m
J.Cugnoni, [email protected] 12
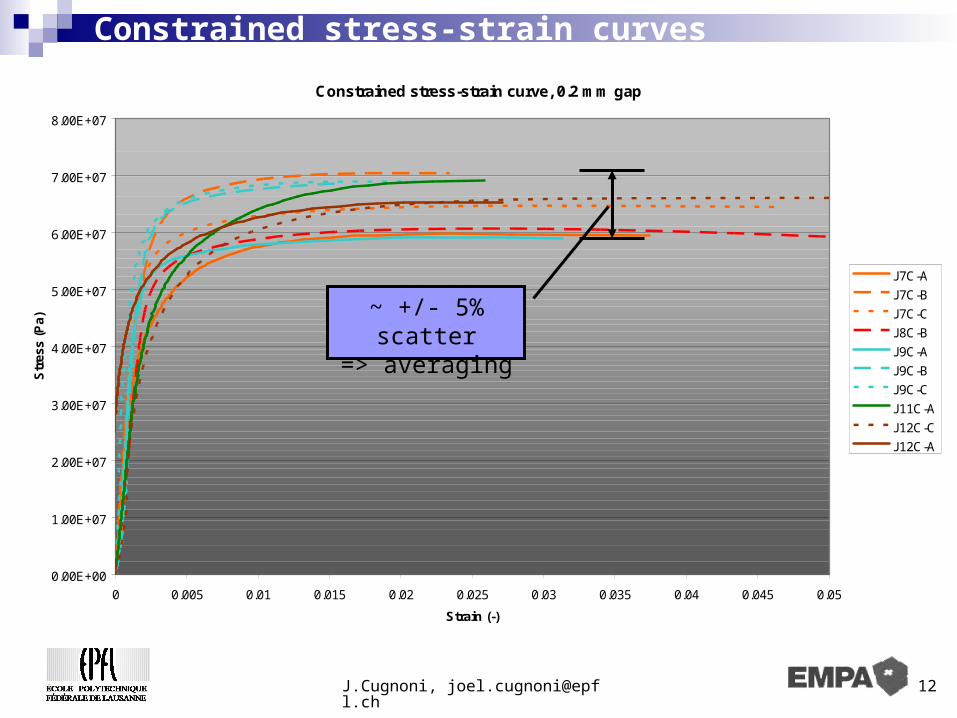
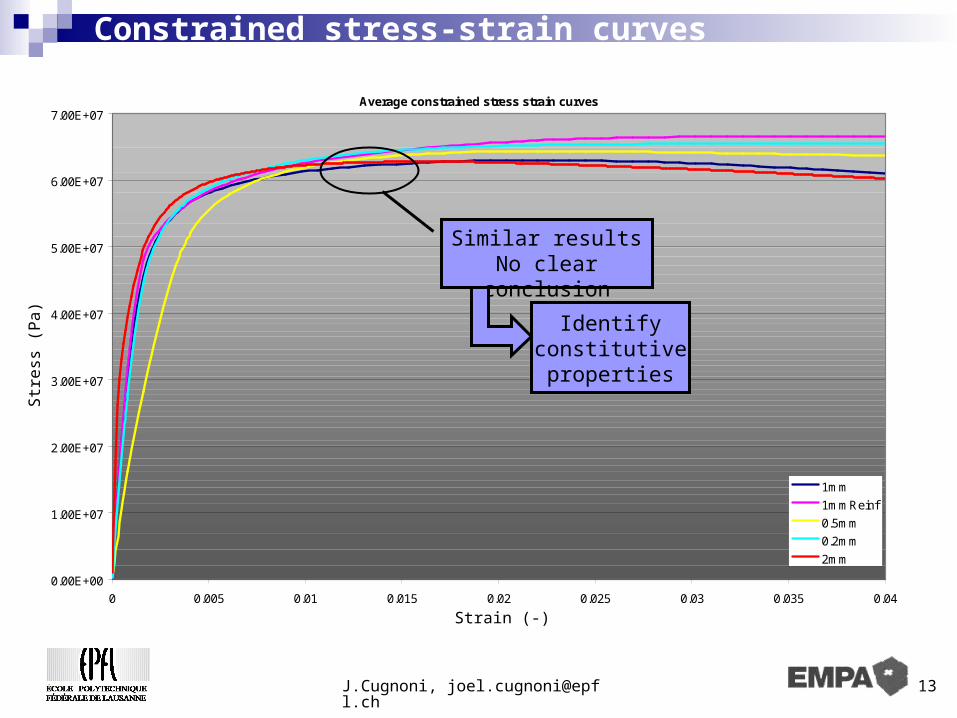
Constrained stress-strain curves
Constrained stress-strain curve, 0.2 mm gap
0.00E+00
1.00E+07
2.00E+07
3.00E+07
4.00E+07
5.00E+07
6.00E+07
7.00E+07
8.00E+07
0 0.005 0.01 0.015 0.02 0.025 0.03 0.035 0.04 0.045 0.05
Strain (-)
Str
ess
(Pa)
J7C-A
J7C-B
J7C-C
J8C-B
J9C-A
J9C-B
J9C-C
J11C-A
J12C-C
J12C-A
~ +/- 5% scatter=> averaging
J.Cugnoni, [email protected] 13
Average constrained stress strain curves
0.00E+00
1.00E+07
2.00E+07
3.00E+07
4.00E+07
5.00E+07
6.00E+07
7.00E+07
0 0.005 0.01 0.015 0.02 0.025 0.03 0.035 0.04
1mm
1mmReinf
0.5mm
0.2mm
2mm
Constrained stress-strain curves
Similar results No clear conclusion
Identifyconstitutiveproperties
Strain (-)
Str
ess
(P
a)
J.Cugnoni, [email protected] 14
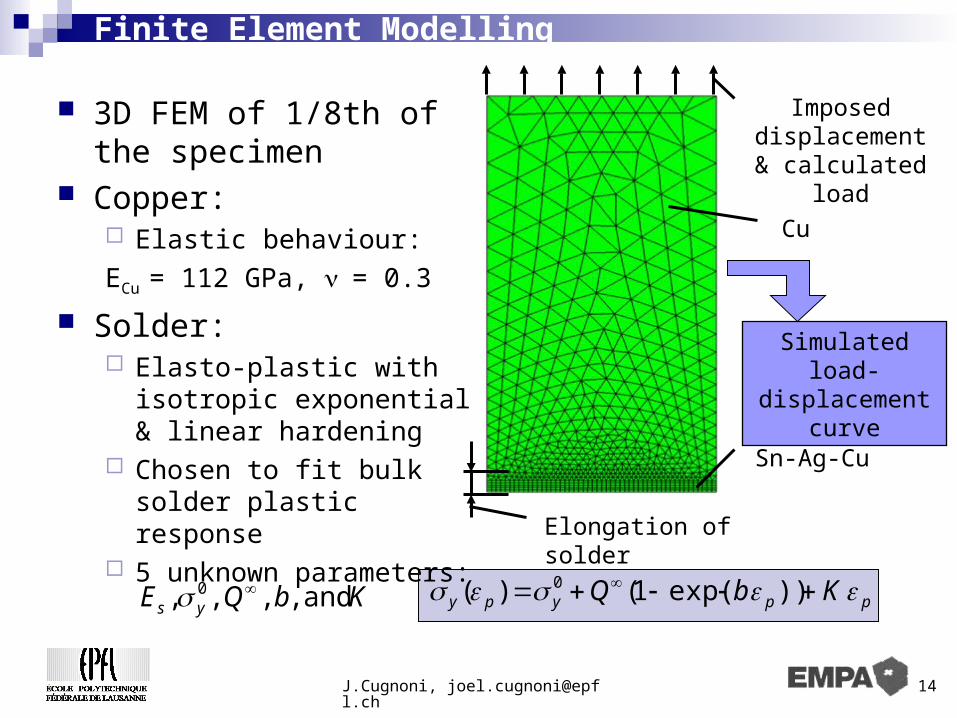
Finite Element Modelling
3D FEM of 1/8th of the specimen
Copper: Elastic behaviour:
ECu = 112 GPa, = 0.3
Solder: Elasto-plastic with isotropic
exponential & linear hardening
Chosen to fit bulk solder plastic response
5 unknown parameters:
ppypy KbQ ))exp(1()( 0
Cu
Sn-Ag-Cu
KbQE ys and,,,, 0
Elongation of solder
Imposed displacement & calculated load
Simulated load-displacement
curve

J.Cugnoni, [email protected] 15
Inverse identification procedure
Identification parameters:
Objective function: relative difference of load-displ. curves
with Pexp = measured load-displacement curve and Pnum() = simulated load-displacement curve
Levenberg-Marquardt non-linear least square optimization algorithm to solve:
Gradients of objective function by Finite Differences
]~
,)~
log()log(,~
,~,~
[ 00 KKbbQQEE yyss α
200,..,2,,1,1
,)(
)(1
nPn
withn
i
expi
expexp
numexp
i PP
αPPαε
2
2)(
2
1)(),(min kkkk FwithFthatsuchFind
kαεααα
α

J.Cugnoni, [email protected] 16
Inverse identification
Convergence Very robust convergence
even with bad initial guess of the parameters
Blue: initial load-displ. curveRed: identified load-displ. curve
Black: measured load-displ. curve
Load - displacement curves
Relative errors
Convergence graph
0.5
0.6
0.7
0.8
0.9
1
1.1
1.2
0 1 2 3 4 5
Iteration
Rel
ativ
e p
aram
ete
r va
lue
0.01
0.1
1
10
Err
or n
orm
alpha1
alpha2
alpha3
alpha4
alpha5
F(alpha)
Solution time: 4 iterations / 50 FE solutions
required to identify the material properties (~1h30)
Accuracy: max error +/-4% on load –
displacement curve
J.Cugnoni, [email protected] 17
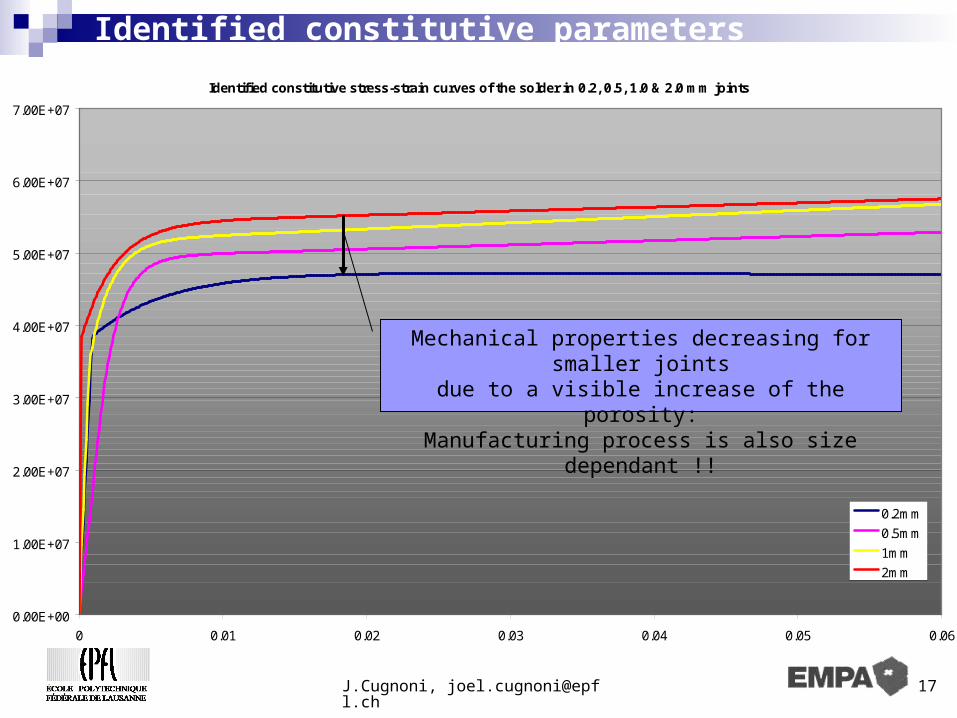
Identified constitutive stress-strain curves of the solder in 0.2, 0.5, 1.0 & 2.0 mm joints
0.00E+00
1.00E+07
2.00E+07
3.00E+07
4.00E+07
5.00E+07
6.00E+07
7.00E+07
0 0.01 0.02 0.03 0.04 0.05 0.06
0.2mm
0.5mm
1mm
2mm
Identified constitutive parameters
Mechanical properties decreasing for smaller jointsdue to a visible increase of the porosity:
Manufacturing process is also size dependant !!
J.Cugnoni, [email protected] 18
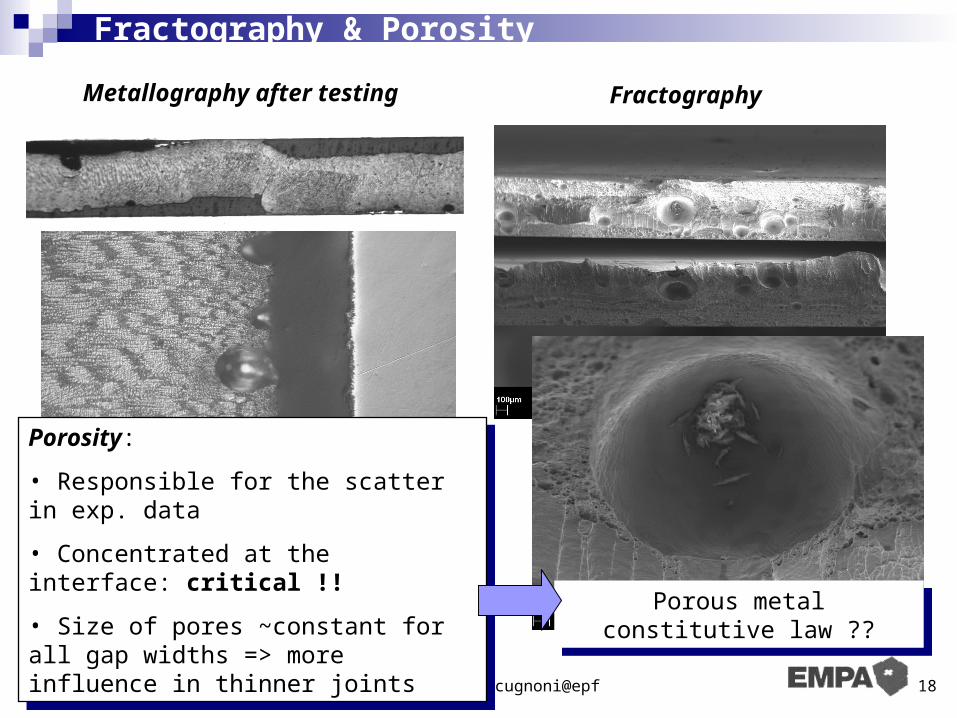
Fractography & Porosity
Metallography after testing Fractography
Porosity:
• Responsible for the scatter in exp. data
• Concentrated at the interface: critical !!
• Size of pores ~constant for all gap widths => more influence in thinner joints
Porosity:
• Responsible for the scatter in exp. data
• Concentrated at the interface: critical !!
• Size of pores ~constant for all gap widths => more influence in thinner joints Porous metal constitutive law ??Porous metal constitutive law ??

J.Cugnoni, [email protected] 19
Constraining effects 2 mm
Constrained & unconstrained stress strain curves
0.00E+00
1.00E+07
2.00E+07
3.00E+07
4.00E+07
5.00E+07
6.00E+07
7.00E+07
0 0.01 0.02 0.03 0.04 0.05 0.06
Strain (-)
Str
ess
(Pa)
Unconstrained 2mm
Constrained 2mm
+ 16 %
J.Cugnoni, [email protected] 20
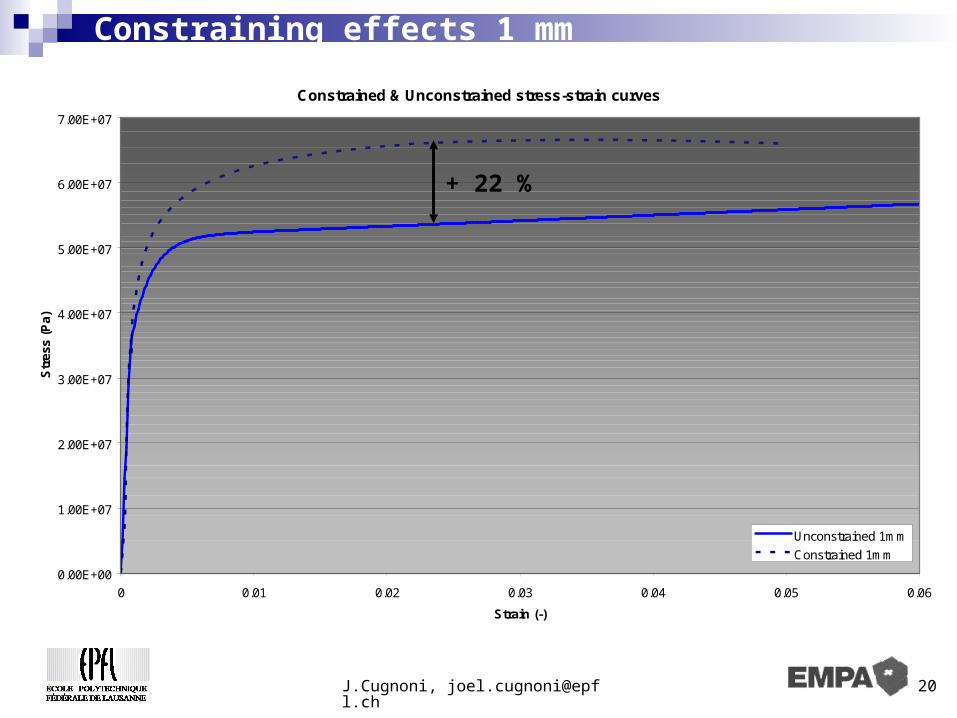
Constraining effects 1 mm
Constrained & Unconstrained stress-strain curves
0.00E+00
1.00E+07
2.00E+07
3.00E+07
4.00E+07
5.00E+07
6.00E+07
7.00E+07
0 0.01 0.02 0.03 0.04 0.05 0.06
Strain (-)
Str
ess
(Pa)
Unconstrained 1mm
Constrained 1mm
+ 22 %

J.Cugnoni, [email protected] 21
Constraining effects 0.5 mm
Constrained & Unconstrained stress-strain curves
0.00E+00
1.00E+07
2.00E+07
3.00E+07
4.00E+07
5.00E+07
6.00E+07
7.00E+07
0 0.01 0.02 0.03 0.04 0.05 0.06
Strain (-)
Str
ess
(Pa)
Unconstrained 0.5mm
Constrained 0.5mm
+ 30 %
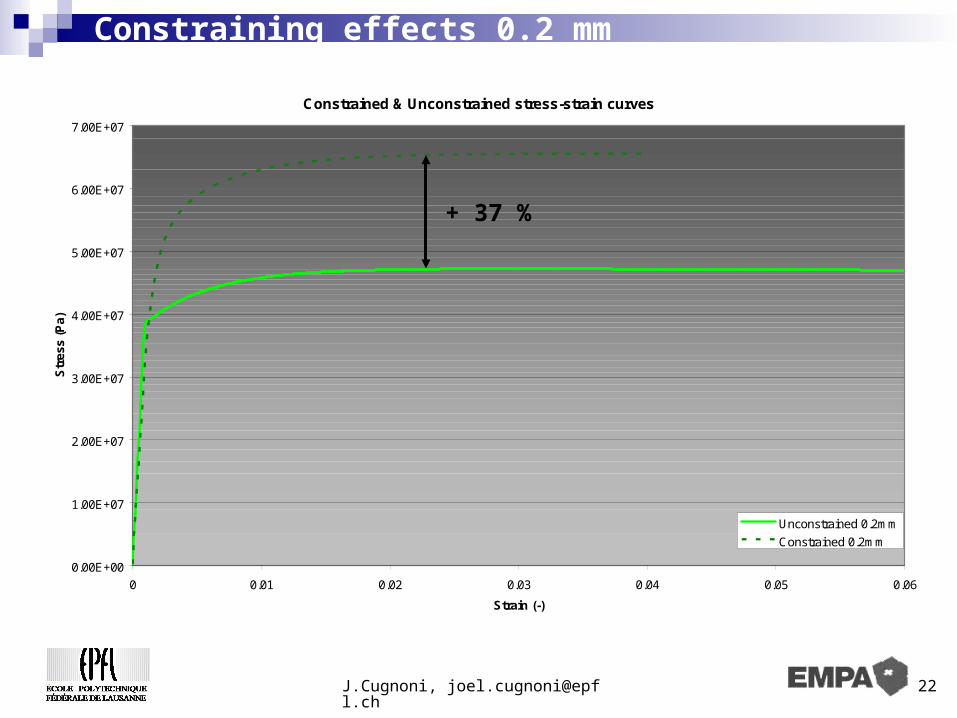
J.Cugnoni, [email protected] 22
Constraining effects 0.2 mm
Constrained & Unconstrained stress-strain curves
0.00E+00
1.00E+07
2.00E+07
3.00E+07
4.00E+07
5.00E+07
6.00E+07
7.00E+07
0 0.01 0.02 0.03 0.04 0.05 0.06
Strain (-)
Str
ess
(Pa)
Unconstrained 0.2mm
Constrained 0.2mm
+ 37 %
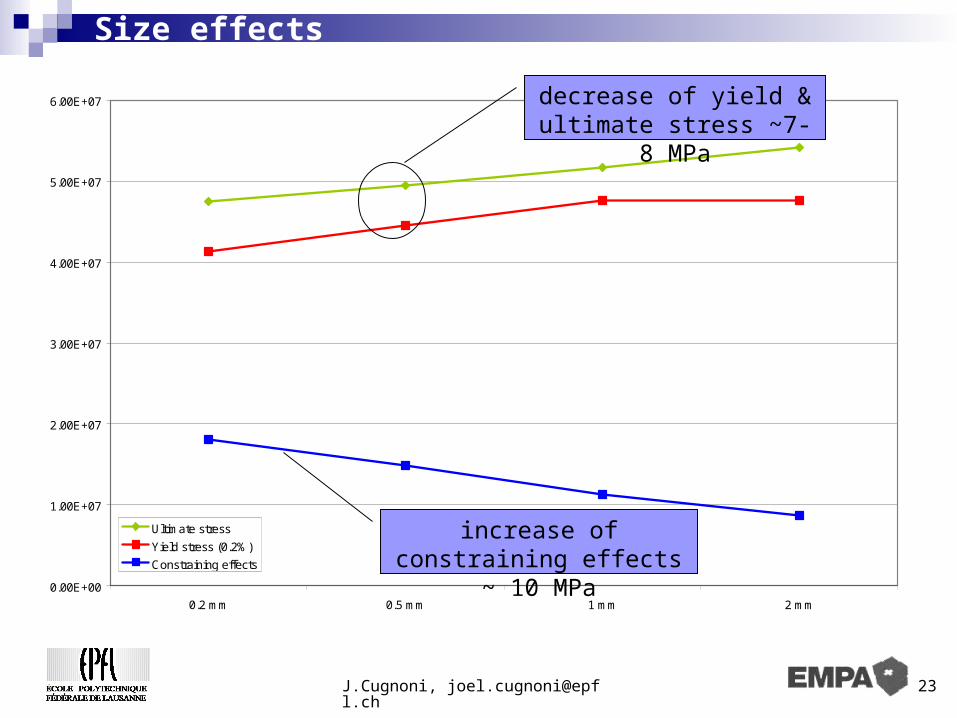
J.Cugnoni, [email protected] 23
0.00E+00
1.00E+07
2.00E+07
3.00E+07
4.00E+07
5.00E+07
6.00E+07
0.2 mm 0.5 mm 1 mm 2 mm
Ultimate stress
Yield stress (0.2%)
Constraining effects
Size effects
decrease of yield & ultimate stress ~7-8 MPa
increase of constraining effects ~ 10 MPa
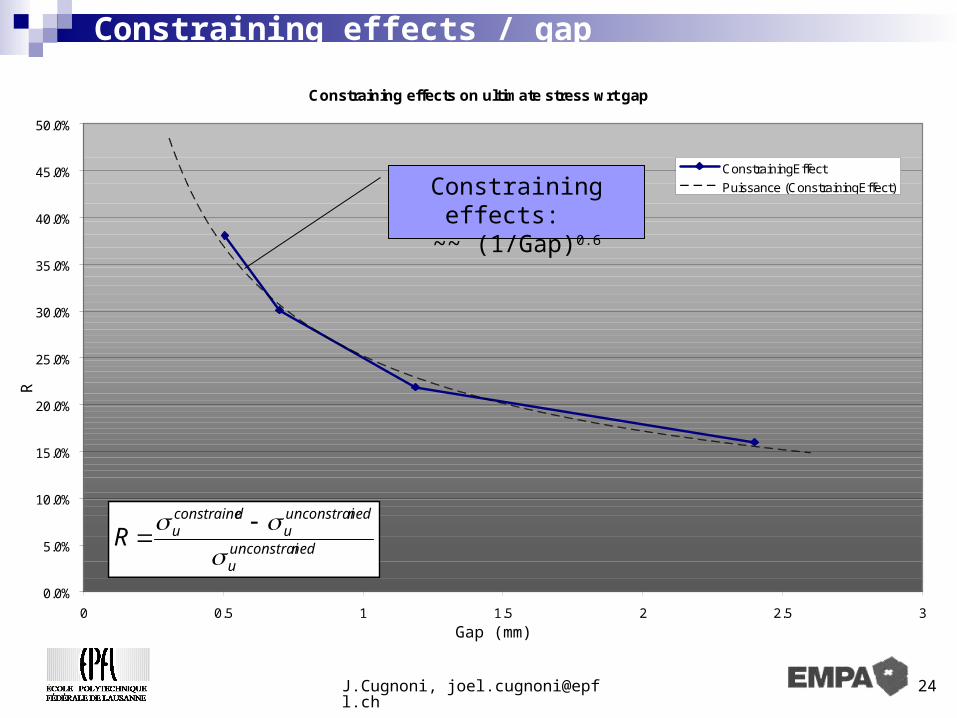
J.Cugnoni, [email protected] 24
Constraining effects on ultimate stress wrt gap
y = 0.2521x-0.5528
R2 = 0.9891
0.0%
5.0%
10.0%
15.0%
20.0%
25.0%
30.0%
35.0%
40.0%
45.0%
50.0%
0 0.5 1 1.5 2 2.5 3
ConstrainingEffect
Puissance (ConstrainingEffect)
Constraining effects / gap
nedunconstraiu
nedunconstraiu
dconstraineuR
Constraining effects: ~~ (1/Gap)0.6
Gap (mm)
R
J.Cugnoni, [email protected] 25
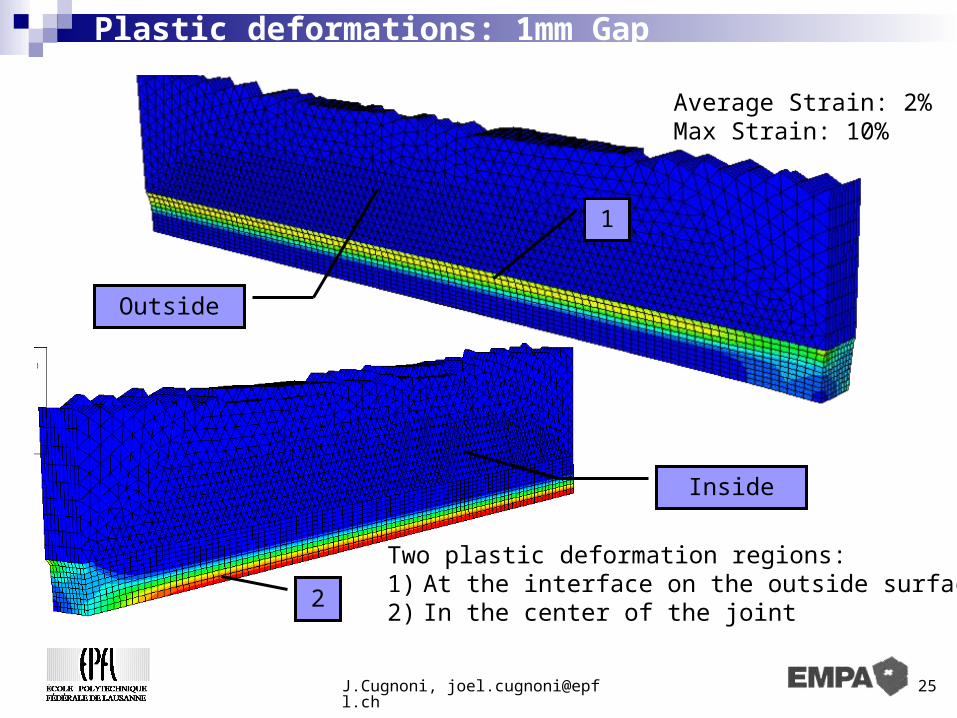
Plastic deformations: 1mm Gap
Inside
Outside
Two plastic deformation regions:1) At the interface on the outside surface2) In the center of the joint
Average Strain: 2%Max Strain: 10%
1
2
J.Cugnoni, [email protected] 26
Conclusions
In-situ characterization by optical measurement & inverse numerical method: Versatile & powerfull:
real joints (geometry & processing) highly heterogeneous stress fields in test specimens
Can determine real constitutive properties from constrained materials:
provide geometry-independant mechanical properties ideal for further modelling & optimization of joints / packages
A general tool for characterization of small size & thin layer materials produced with realistic processing and geometry conditions
J.Cugnoni, [email protected] 27
Conclusions
Size & scale effects in lead-free solders Actual constitutive properties are size dependant:
In the present case, ult. stress decreases by 13% from 2 mm to 0.2 mm joints due to increased porosity in thinner joints.
material scale effects & the "scaling" of the production methods have a combined influence.
Constraining effects: Constraining effects are size dependant ~(1/Gap)0.6
Up to 37% of additionnal hardening due to constraints Constrained & constitutive properties are NOT equivalent Apparent stress-strain curves are geometry dependant !!

J.Cugnoni, [email protected] 28
Future developments
Constraining & size effects: Microstructure analysis /
measure porosity Additionnal test with 0.1mm
and 2mm gap widths Improvement of manufacturing
quality / porosity Industrial aspects:
Apply the in-situ characterization method (DIC / mixed num./exp. Identification) to a real industrial package (for example BGA)
Determination of the mechanical properties of a solder joint under realistic loading conditions (power-cycles)
Realistic Experiment (DIC)
Design / processvalidation
FE Analysis & optimization
Mixed num-expidentification:
realistic properties

J.Cugnoni, [email protected] 29
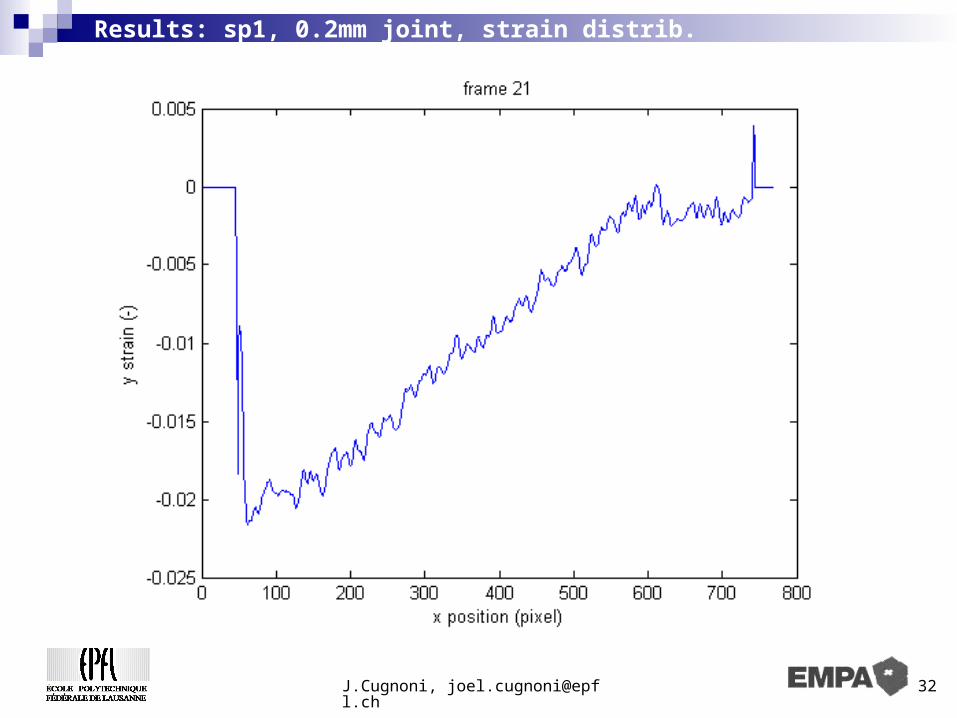
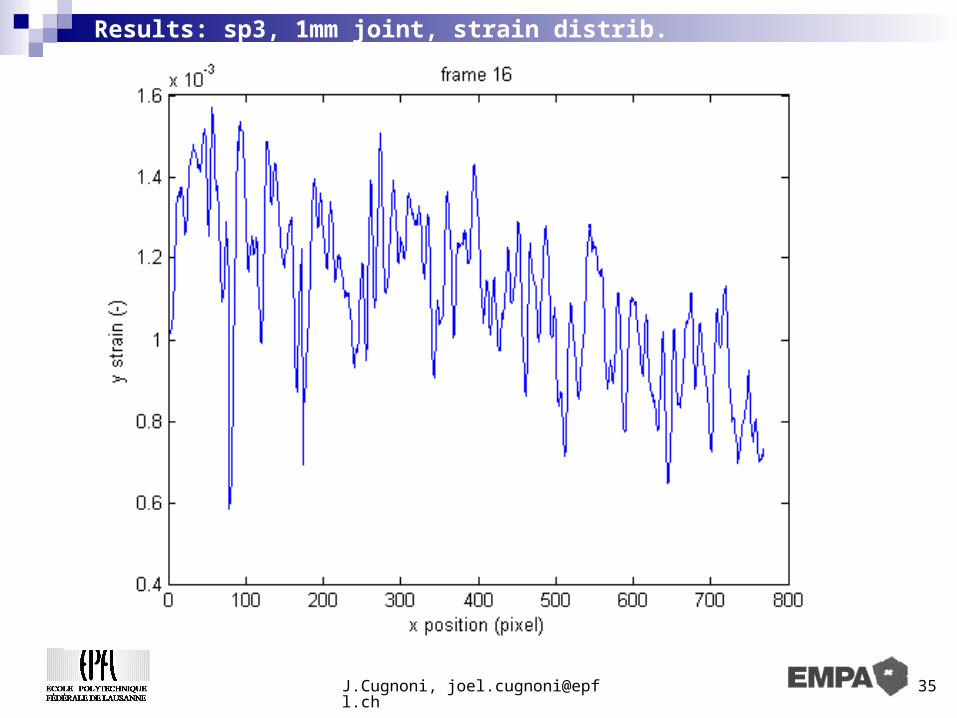
STSM: ESPI measurements
Pr. Karalekas, Univ. Piraeus, Greece, STSM at EPFL
Incremental loading by step of 9 microns
Measurement of global incremental displacement field by phase difference between the n-th & n+1-th load state
Reconstruction of the total displacement field by summation of the increments
Theoretical sensitivity: ~ 0.7 microns


J.Cugnoni, [email protected] 36
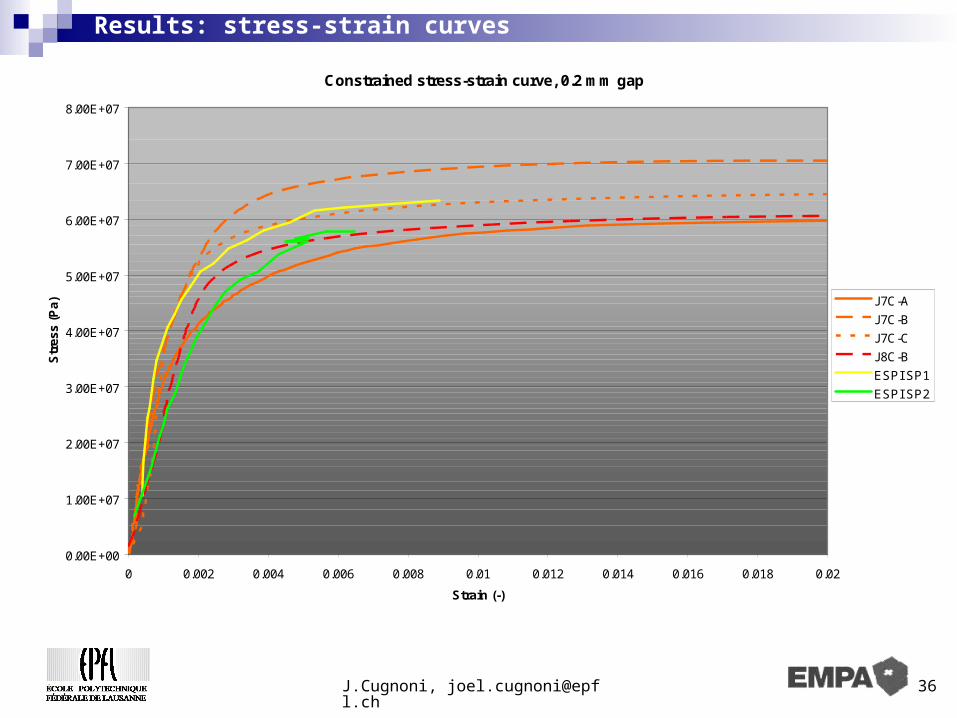
Results: stress-strain curves
Constrained stress-strain curve, 0.2 mm gap
0.00E+00
1.00E+07
2.00E+07
3.00E+07
4.00E+07
5.00E+07
6.00E+07
7.00E+07
8.00E+07
0 0.002 0.004 0.006 0.008 0.01 0.012 0.014 0.016 0.018 0.02
Strain (-)
Str
ess
(Pa) J7C-A
J7C-B
J7C-C
J8C-B
ESPI SP1
ESPI SP2
J.Cugnoni, [email protected] 37
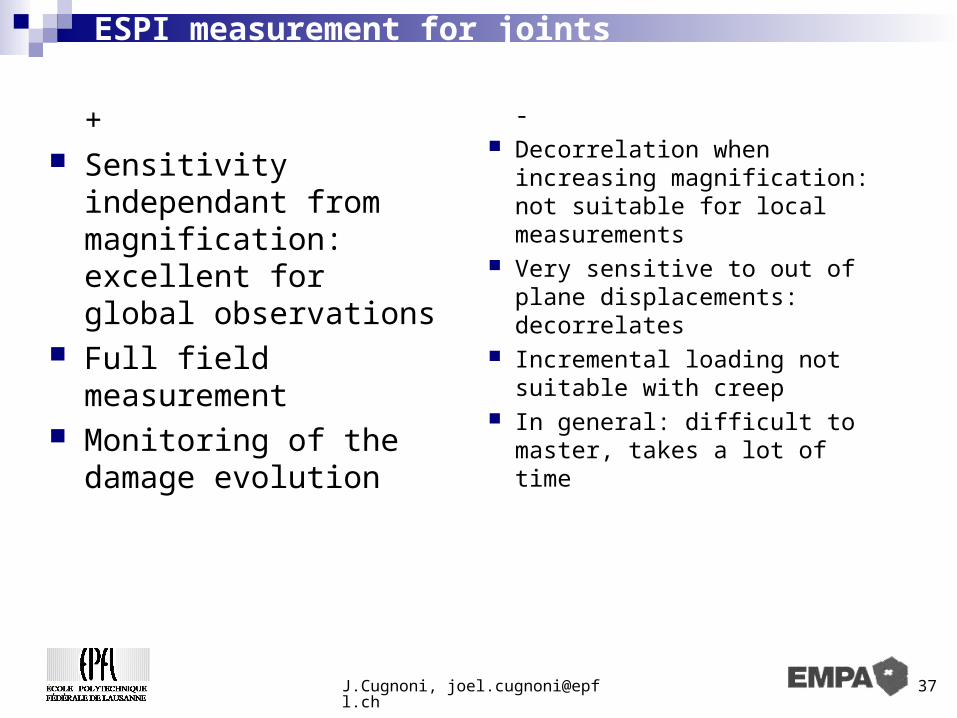
ESPI measurement for joints
+ Sensitivity independant
from magnification: excellent for global observations
Full field measurement Monitoring of the damage
evolution
- Decorrelation when
increasing magnification: not suitable for local measurements
Very sensitive to out of plane displacements: decorrelates
Incremental loading not suitable with creep
In general: difficult to master, takes a lot of time