jbs s.a. - jbs - relações com investidoresjbss.infoinvest.com.br/enu/3864/jbs institutional... ·...
TRANSCRIPT
JBS S.A.
A GLOBAL
FOOD
COMPANY
Institutional Presentation Including 3Q16 Results
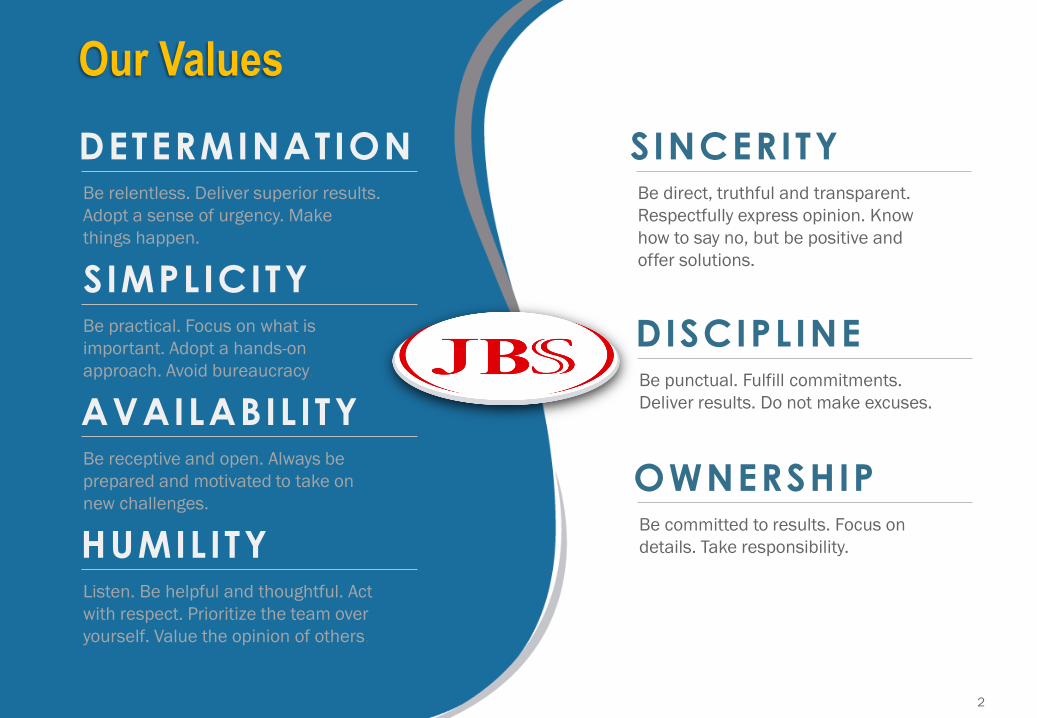
DETERMINATIONBe relentless. Deliver superior results.
Adopt a sense of urgency. Make
things happen.
SIMPLICITYBe practical. Focus on what is
important. Adopt a hands-on
approach. Avoid bureaucracy.
AVAILABIL ITYBe receptive and open. Always be
prepared and motivated to take on
new challenges.
HUMILITYListen. Be helpful and thoughtful. Act
with respect. Prioritize the team over
yourself. Value the opinion of others.
SINCERITYBe direct, truthful and transparent.
Respectfully express opinion. Know
how to say no, but be positive and
offer solutions.
DISCIPLINEBe punctual. Fulfill commitments.
Deliver results. Do not make excuses.
OWNERSHIPBe committed to results. Focus on
details. Take responsibility.
Our Values
2
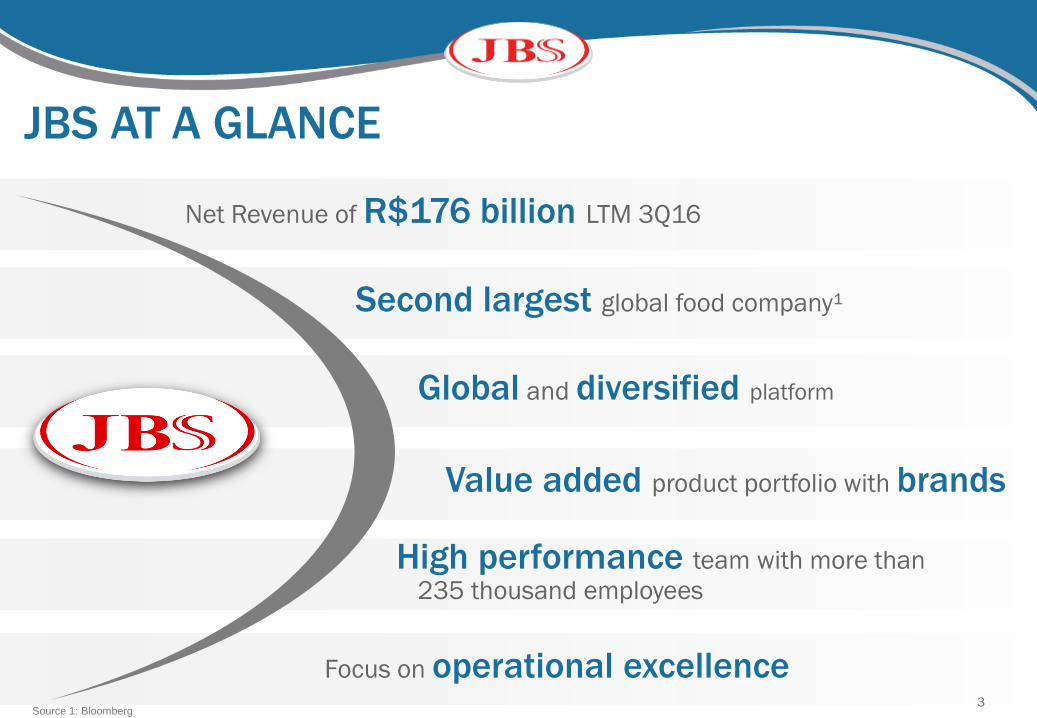
Global and diversified platform
Value added product portfolio with brands
Focus on operational excellence
High performance team with more than
235 thousand employees
Net Revenue of R$176 billion LTM 3Q16
Second largest global food company¹
JBS AT A GLANCE
3Source 1: Bloomberg
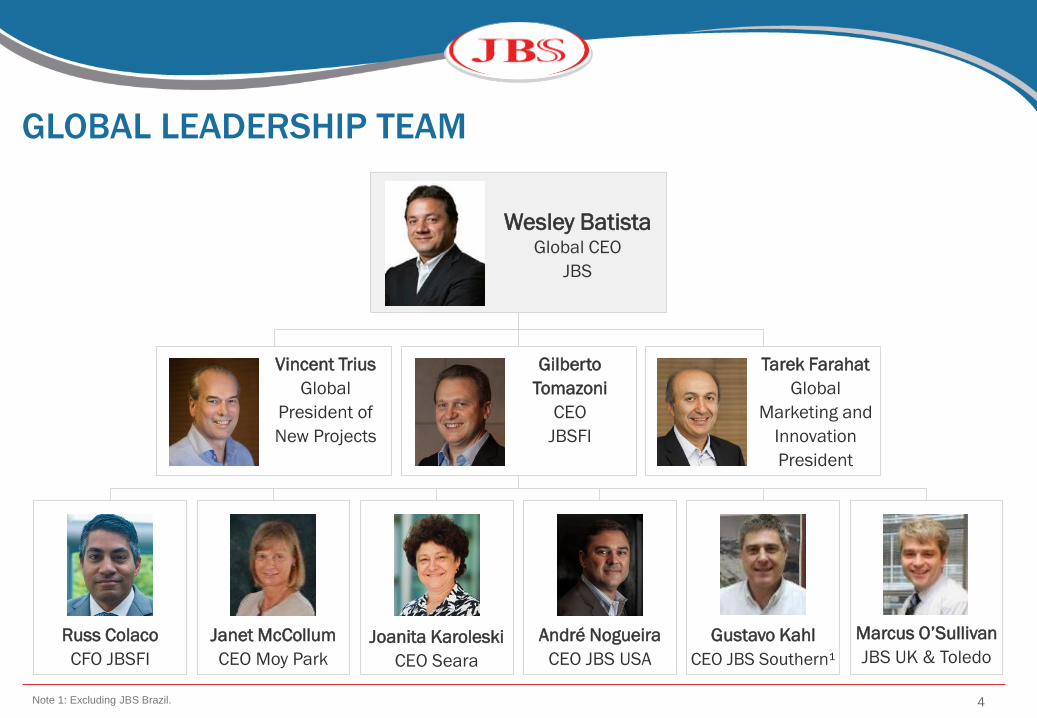
GLOBAL LEADERSHIP TEAM
Wesley BatistaGlobal CEO
JBS
4
Russ Colaco
CFO JBSFI
Janet McCollum
CEO Moy Park
Joanita Karoleski
CEO Seara
André Nogueira
CEO JBS USA
Gustavo Kahl
CEO JBS Southern¹
Marcus O’Sullivan
JBS UK & Toledo
Note 1: Excluding JBS Brazil.
Vincent Trius
Global
President of
New Projects
Gilberto
Tomazoni
CEO
JBSFI
Tarek Farahat
Global
Marketing and
Innovation
President
5
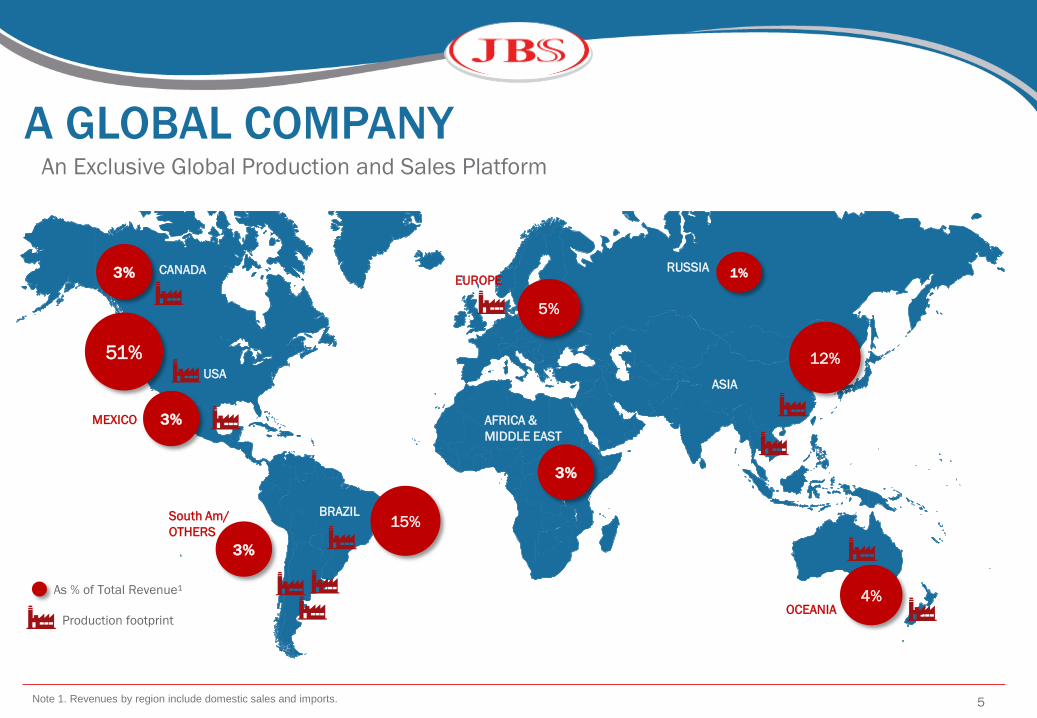
A GLOBAL COMPANYAn Exclusive Global Production and Sales Platform
As % of Total Revenue¹
Production footprint
Note 1. Revenues by region include domestic sales and imports.
CANADA3%
USA
51%
BRAZIL15%South Am/
OTHERS
EUROPERUSSIA
ASIA
AFRICA &
MIDDLE EAST
OCEANIA
5%
1%
MEXICO
12%
4%
3%
3%
3%
6
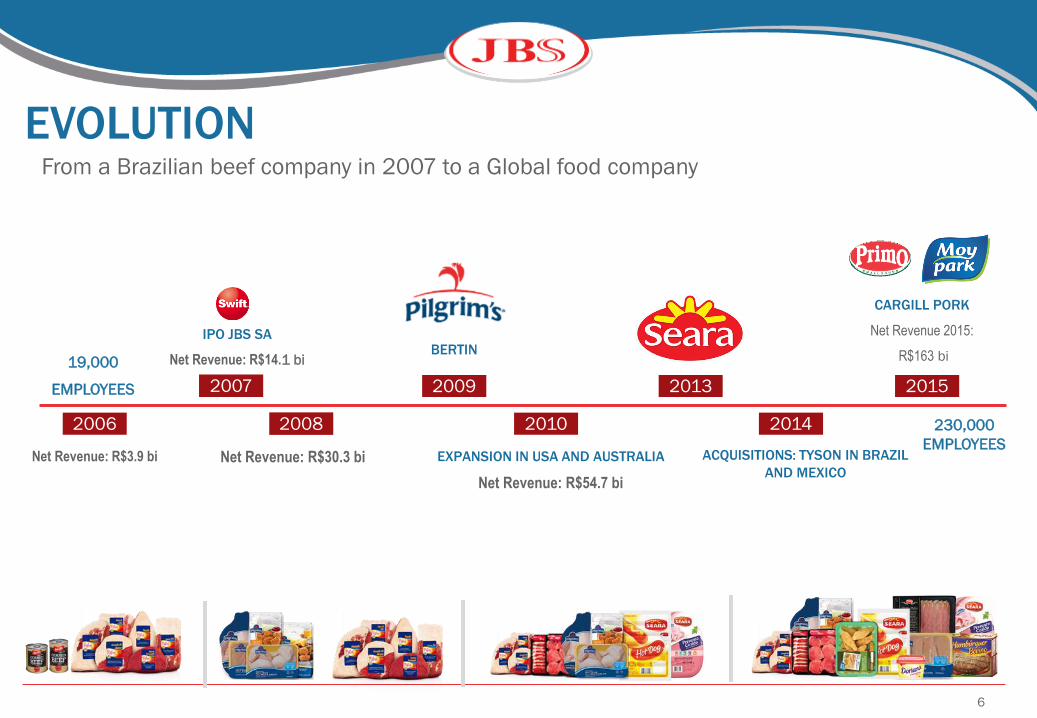
IPO JBS SA
Net Revenue: R$14.1 bi
2007
2008
Net Revenue: R$30.3 bi
2009
BERTIN
2010
EXPANSION IN USA AND AUSTRALIA
Net Revenue: R$54.7 bi
2013
ACQUISITIONS: TYSON IN BRAZIL
AND MEXICO
2014
CARGILL PORK
Net Revenue 2015:
R$163 bi
2015
230,000
EMPLOYEES
From a Brazilian beef company in 2007 to a Global food company
EVOLUTION
2006
19,000
EMPLOYEES
Net Revenue: R$3.9 bi
7
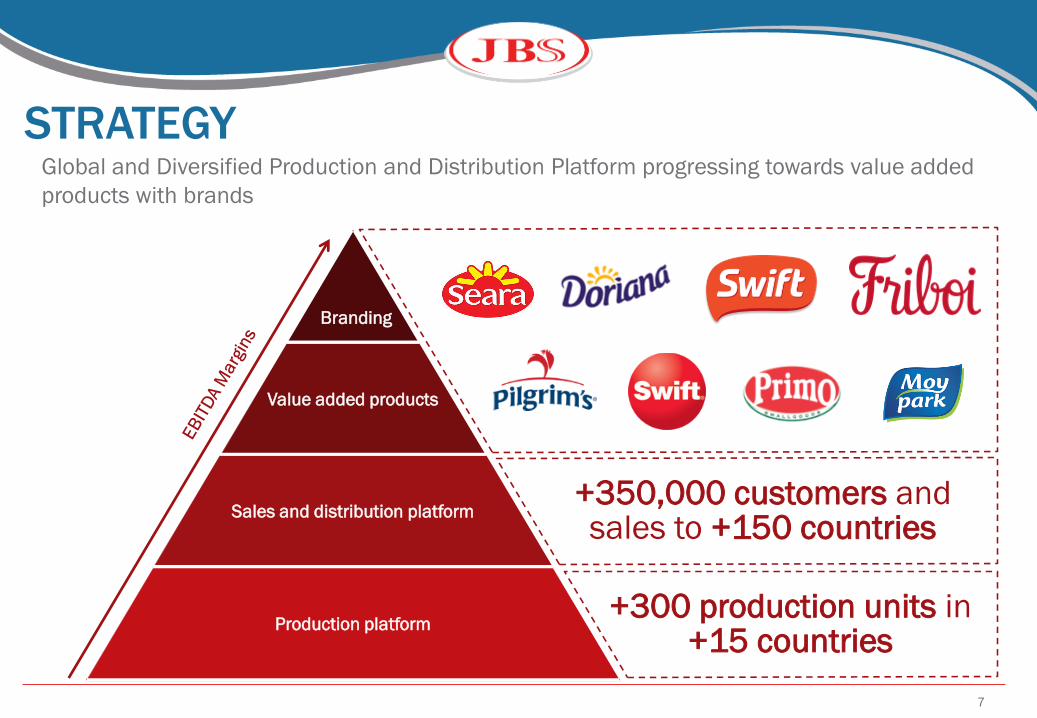
STRATEGYGlobal and Diversified Production and Distribution Platform progressing towards value added
products with brands
Production platform
Branding
Value added products
Sales and distribution platform
\\\\\\\\\\\\
+300 production units in +15 countries
+350,000 customers and sales to +150 countries
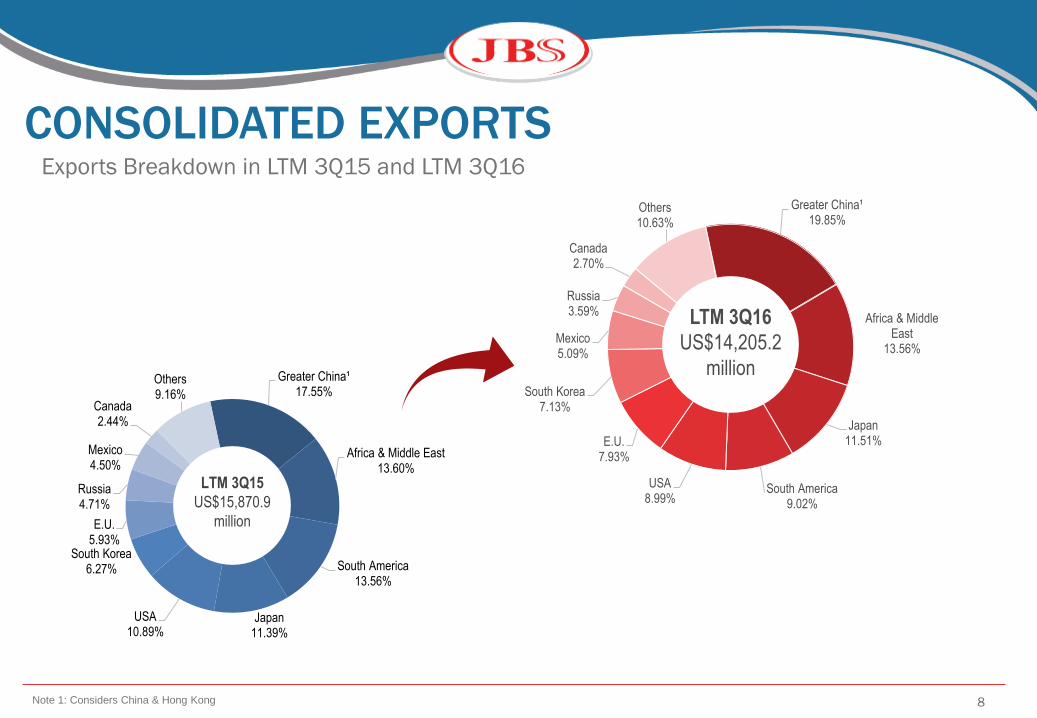
CONSOLIDATED EXPORTSExports Breakdown in LTM 3Q15 and LTM 3Q16
Note 1: Considers China & Hong Kong 8
Greater China¹17.55%
Africa & Middle East13.60%
South America13.56%
Japan11.39%
USA10.89%
South Korea6.27%
E.U.5.93%
Russia4.71%
Mexico4.50%
Canada2.44%
Others9.16%
LTM 3Q15
US$15,870.9
million
Greater China¹19.85%
Africa & Middle East
13.56%
Japan11.51%
South America9.02%
USA8.99%
E.U.7.93%
South Korea7.13%
Mexico5.09%
Russia3.59%
Canada2.70%
Others10.63%
LTM 3Q16
US$14,205.2
million
BUSINESS UNITS
9
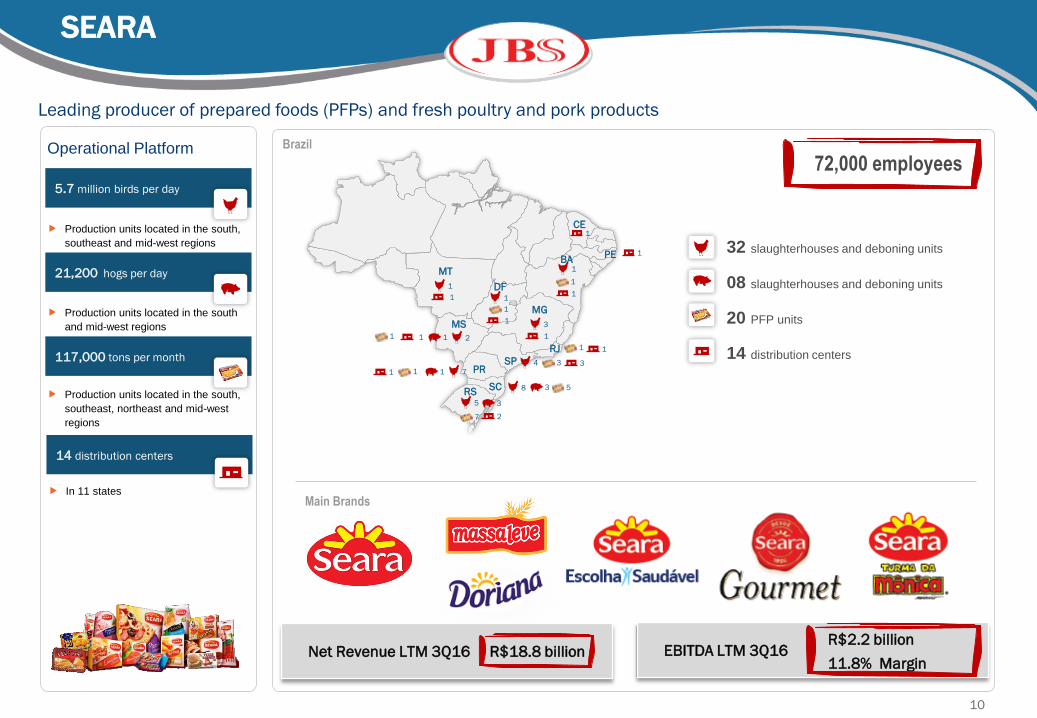
EBITDA LTM 3Q16 Net Revenue LTM 3Q16 R$18.8 billion
Leading producer of prepared foods (PFPs) and fresh poultry and pork products
72,000 employees
R$2.2 billion
11.8% Margin
Brazil
32 slaughterhouses and deboning units
08 slaughterhouses and deboning units
20 PFP units
14 distribution centers
5.7 million birds per day
21,200 hogs per day
117,000 tons per month
Operational Platform
14 distribution centers
Production units located in the south,
southeast and mid-west regions
Production units located in the south
and mid-west regions
Production units located in the south,
southeast, northeast and mid-west
regions
In 11 states
1
MT
BA
MG
RJ
PR
RS
MS
DF
5
7
3
SC 8 3 5
SP 4 3
1
1
711
3
1
1
21
1
1
1
1
CE1
PE 1
1
1
3
1
2
SEARA
1
1
Main Brands
10
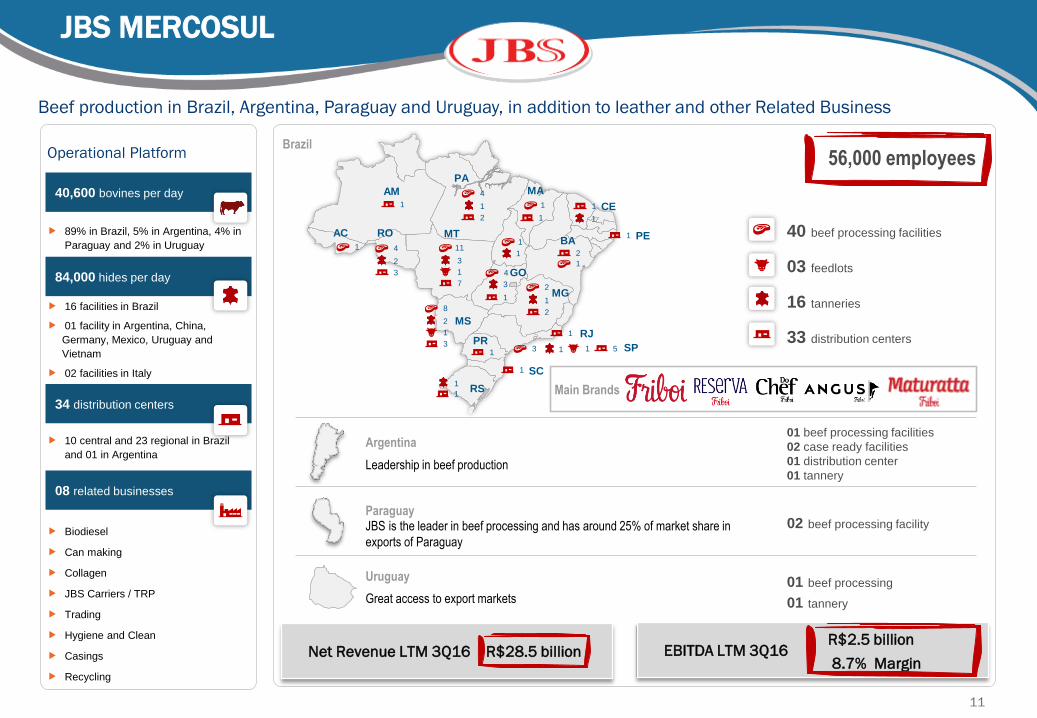
40,600 bovines per day
84,000 hides per day
34 distribution centers
08 related businesses
89% in Brazil, 5% in Argentina, 4% in
Paraguay and 2% in Uruguay
10 central and 23 regional in Brazil
and 01 in Argentina
Biodiesel
Can making
Collagen
JBS Carriers / TRP
Trading
Hygiene and Clean
Casings
Recycling
Beef production in Brazil, Argentina, Paraguay and Uruguay, in addition to leather and other Related Business
Operational Platform 56,000 employees
Argentina
Leadership in beef production
01 beef processing facilities
02 case ready facilities
01 distribution center
01 tannery
ParaguayJBS is the leader in beef processing and has around 25% of market share in
exports of Paraguay
02 beef processing facility
Uruguay
Great access to export markets
01 beef processing
01 tannery
Brazil
40 beef processing facilities
03 feedlots
16 tanneries
33 distribution centers
1
11
7
3
1
1 4
3
2
4
2
1
1
2
1
1
4
1
3
1
8
3
2
2
2
1
1
1
1
1
1 13 51
PA
AM
AC RO MT
MA
PEBA
MG
RJ
SP
SC
PR
RS
MS
1
GO
1 CE
JBS MERCOSUL
EBITDA LTM 3Q16 Net Revenue LTM 3Q16 R$28.5 billionR$2.5 billion
8.7% Margin
1
1
1
Main Brands
11
16 facilities in Brazil
01 facility in Argentina, China,
Germany, Mexico, Uruguay and
Vietnam
02 facilities in Italy
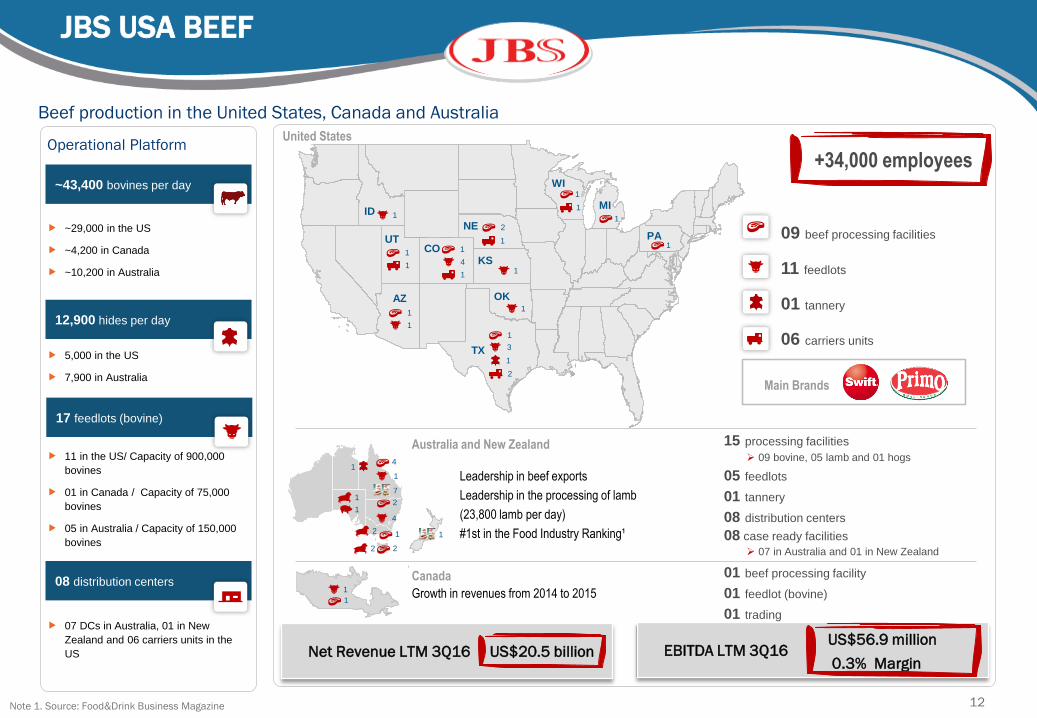
Australia and New Zealand
Leadership in beef exports
Leadership in the processing of lamb
(23,800 lamb per day)
#1st in the Food Industry Ranking¹
01 beef processing facility
01 feedlot (bovine)
01 trading
15 processing facilities
09 bovine, 05 lamb and 01 hogs
05 feedlots
01 tannery
08 distribution centers
08 case ready facilities
07 in Australia and 01 in New Zealand
~43,400 bovines per day
12,900 hides per day
08 distribution centers
09 beef processing facilities
11 feedlots
01 tannery
06 carriers units
~29,000 in the US
~4,200 in Canada
~10,200 in Australia
5,000 in the US
7,900 in Australia
07 DCs in Australia, 01 in New
Zealand and 06 carriers units in the
US
Beef production in the United States, Canada and Australia
Operational PlatformUnited States
Canada
Growth in revenues from 2014 to 2015
17 feedlots (bovine)
11 in the US/ Capacity of 900,000
bovines
01 in Canada / Capacity of 75,000
bovines
05 in Australia / Capacity of 150,000
bovines
Note 1. Source: Food&Drink Business Magazine
+34,000 employees
1
NE 2
1CO 1
4
1
UT1
1
TX
1
3
1
2
WI1
1 MI
1
PA1
AZ
1
ID 1
KS1
OK1
4
2
1
2
2
2
1
1
1
41
JBS USA BEEF
EBITDA LTM 3Q16 Net Revenue LTM 3Q16 US$20.5 billionUS$56.9 million
0.3% Margin
1
1
Main Brands
12
7
1
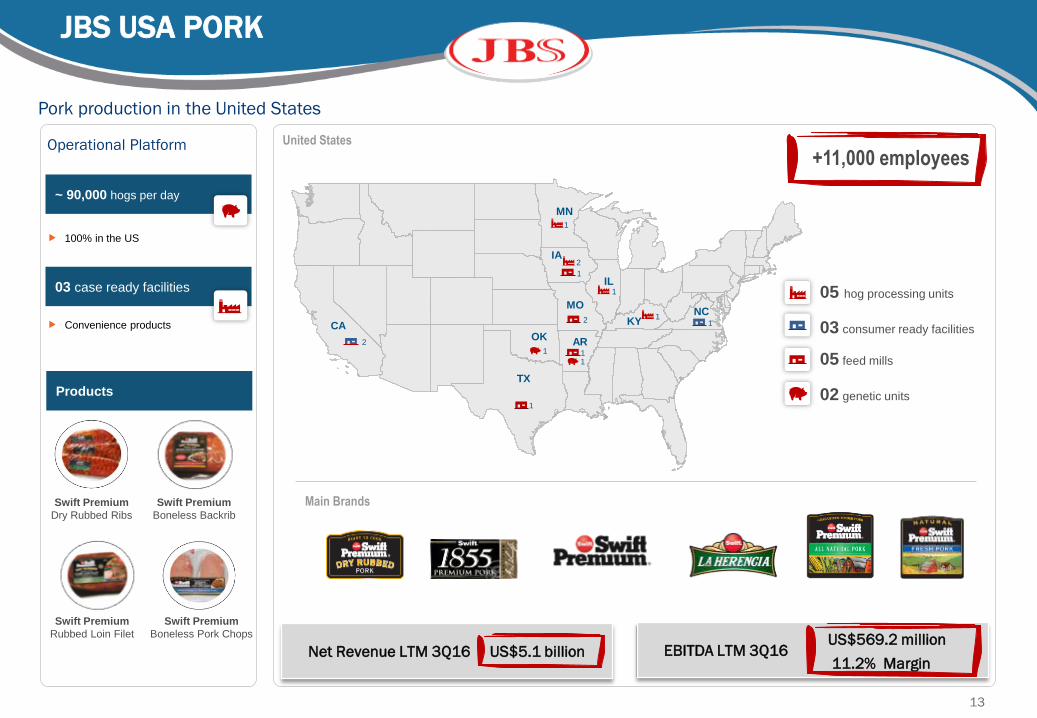
~ 90,000 hogs per day
100% in the US
Pork production in the United States
United States
03 case ready facilities
Main BrandsSwift Premium
Dry Rubbed Ribs
Swift Premium
Rubbed Loin Filet
Products
Swift Premium
Boneless Backrib
Swift Premium
Boneless Pork Chops
Operational Platform+11,000 employees
Convenience products CA
2
TX
1
AR
1
1
OK
MO
2
IA2
1
1
MN
IL1
KY1
NC1
05 hog processing units
03 consumer ready facilities
05 feed mills
02 genetic units
JBS USA PORK
EBITDA LTM 3Q16 Net Revenue LTM 3Q16 US$5.1 billionUS$569.2 million
11.2% Margin
1
13
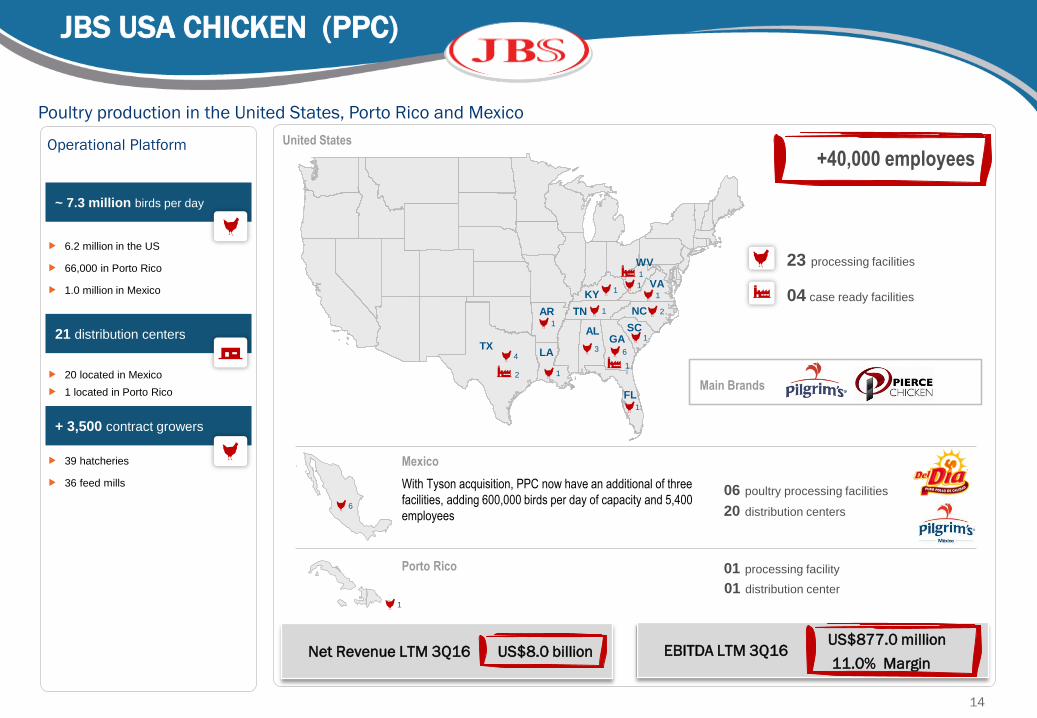
United StatesOperational Platform
~ 7.3 million birds per day
6.2 million in the US
66,000 in Porto Rico
1.0 million in Mexico
Poultry production in the United States, Porto Rico and Mexico
TX21 distribution centers
20 located in Mexico
Mexico
With Tyson acquisition, PPC now have an additional of three
facilities, adding 600,000 birds per day of capacity and 5,400
employees
06 poultry processing facilities
20 distribution centers
4
1
3
AL
AR1
NC 2
FL1
GA6
KY1
LA
Porto Rico
SC1
TN 1
VA1
WV
1
01 processing facility
+ 3,500 contract growers
39 hatcheries
36 feed mills
+40,000 employees
23 processing facilities
04 case ready facilities
12
6
1
JBS USA CHICKEN (PPC)
EBITDA LTM 3Q16 Net Revenue LTM 3Q16 US$8.0 billionUS$877.0 million
11.0% Margin
1
Main Brands
14
01 distribution center
1 located in Porto Rico
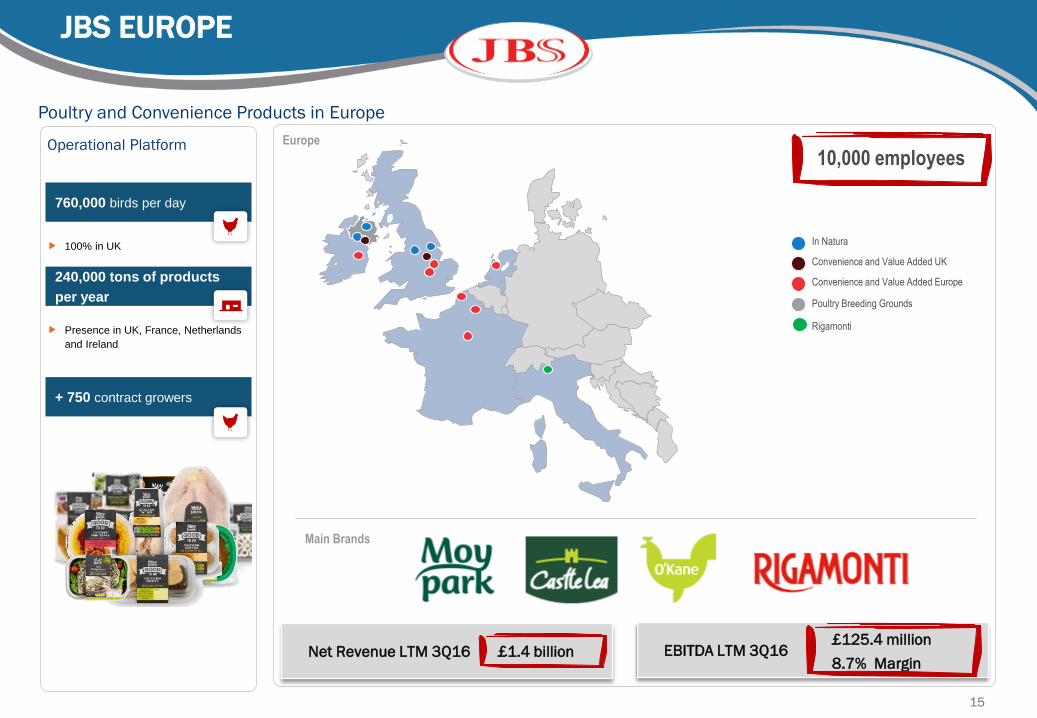
EuropeOperational Platform
760,000 birds per day
Poultry and Convenience Products in Europe
240,000 tons of products
per year
10,000 employees
In Natura
Convenience and Value Added UK
Convenience and Value Added Europe
Poultry Breeding Grounds
Rigamonti
100% in UK
Presence in UK, France, Netherlands
and Ireland
+ 750 contract growers
JBS EUROPE
Main Brands
15
EBITDA LTM 3Q16 Net Revenue LTM 3Q16 £1.4 billion£125.4 million
8.7% Margin
CONSOLIDATED RESULTS3Q16
16
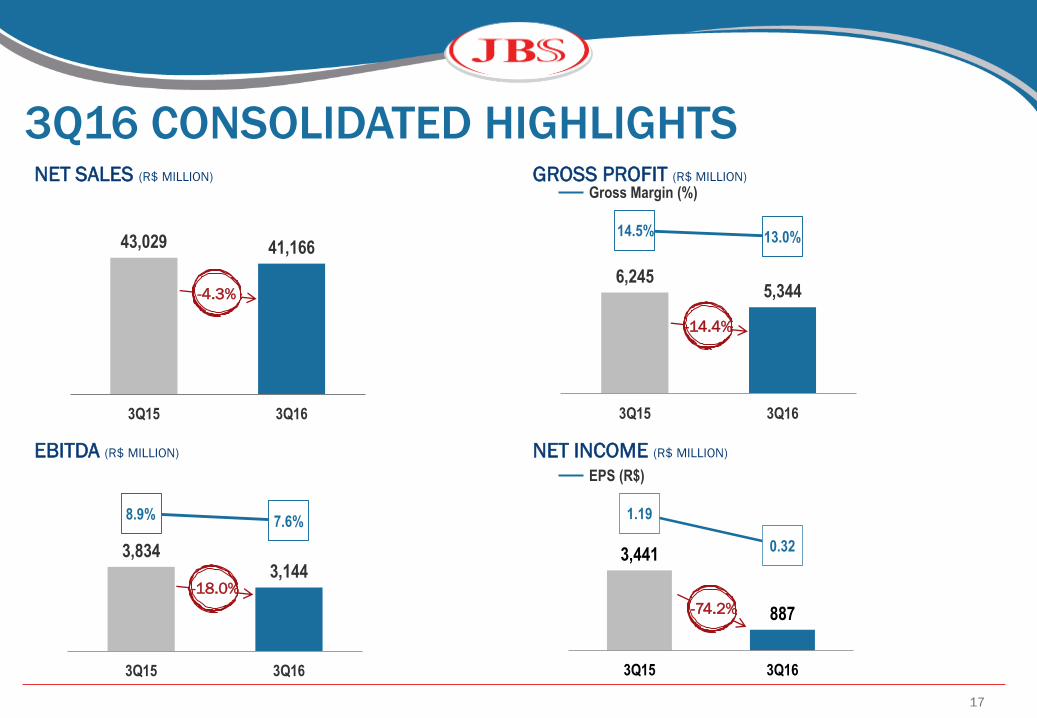
3,441
887
1.19
0.32
3Q15 3Q16
3,8343,144
8.9% 7.6%
3Q15 3Q16
6,2455,344
14.5% 13.0%
3Q15 3Q16
43,029 41,166
3Q15 3Q16
17
3Q16 CONSOLIDATED HIGHLIGHTSNET SALES (R$ MILLION) GROSS PROFIT (R$ MILLION)
-4.3%
EBITDA (R$ MILLION) NET INCOME (R$ MILLION)
-74.2%
-18.0%
-14.4%
Gross Margin (%)
EPS (R$)
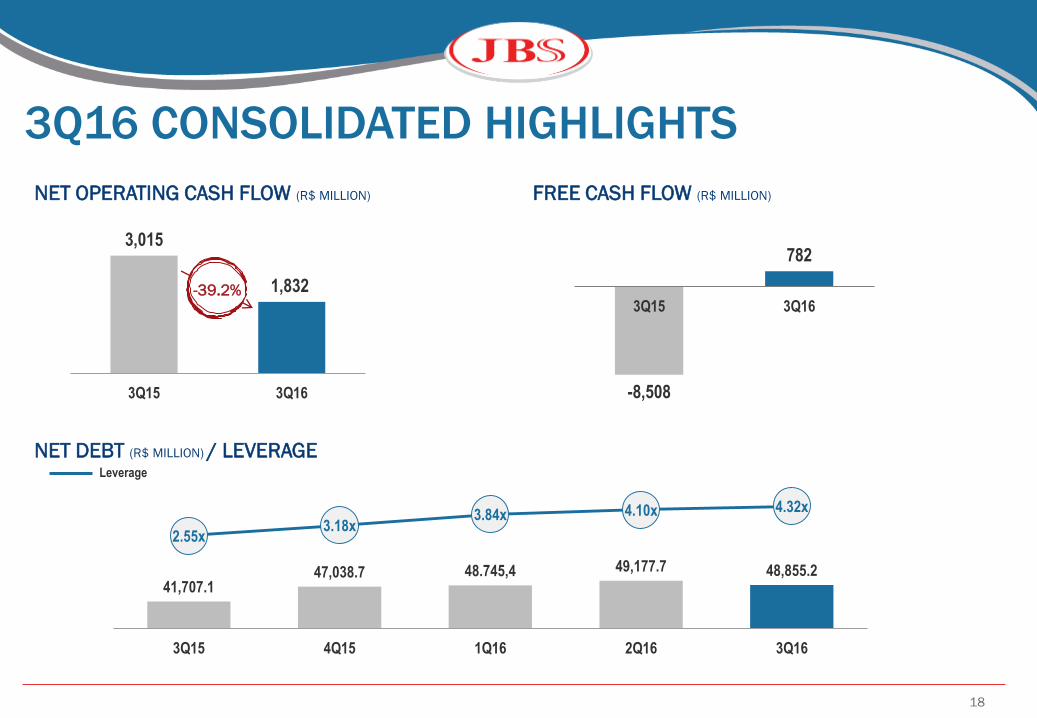
3,015
1,832
3Q15 3Q16
18
NET OPERATING CASH FLOW (R$ MILLION) FREE CASH FLOW (R$ MILLION)
3Q16 CONSOLIDATED HIGHLIGHTS
NET DEBT (R$ MILLION) / LEVERAGE
-39.2%
Leverage
-8,508
782
3Q15 3Q16
41,707.147,038.7 48.745,4 49,177.7 48,855.2
2.55x3.18x
3.84x 4.10x 4.32x
3Q15 4Q15 1Q16 2Q16 3Q16
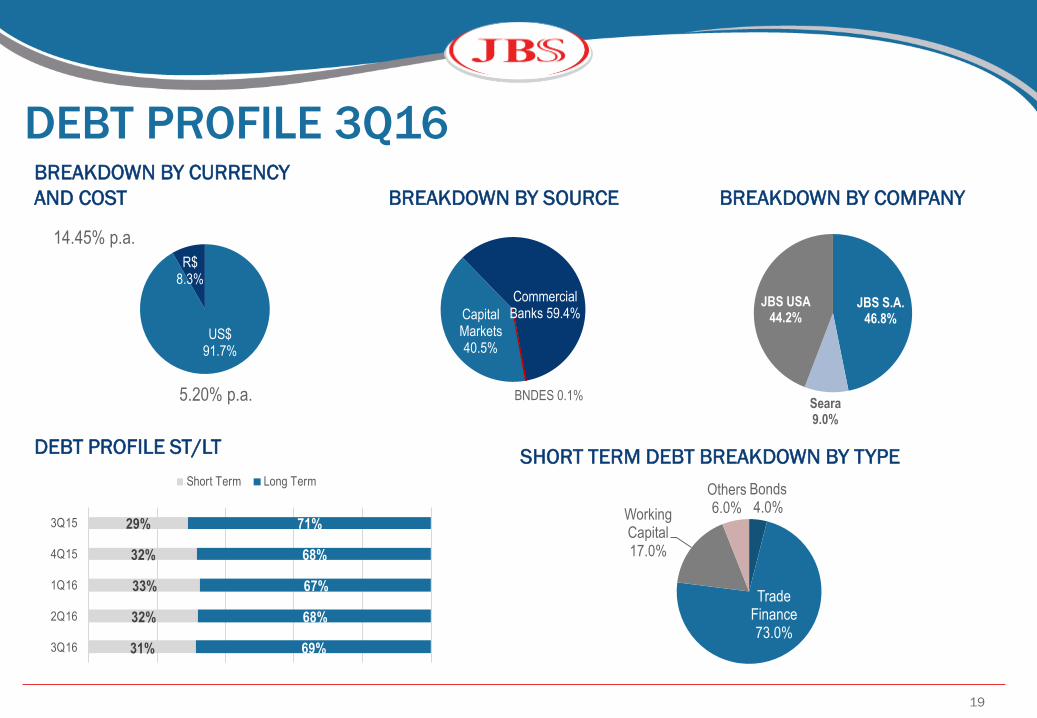
Bonds4.0%
Trade Finance73.0%
Working Capital17.0%
Others6.0%
29%
32%
33%
32%
31%
71%
68%
67%
68%
69%
3Q15
4Q15
1Q16
2Q16
3Q16
Short Term Long Term
19
BREAKDOWN BY CURRENCY
AND COST BREAKDOWN BY COMPANY
DEBT PROFILE 3Q16
BREAKDOWN BY SOURCE
Capital Markets40.5%
Commercial Banks 59.4%
BNDES 0.1%
14.45% p.a.
5.20% p.a.
DEBT PROFILE ST/LTSHORT TERM DEBT BREAKDOWN BY TYPE
US$91.7%
R$8.3%
JBS S.A.46.8%
Seara9.0%
JBS USA44.2%
EVOLUTION BY BUSINESS UNIT
20
21
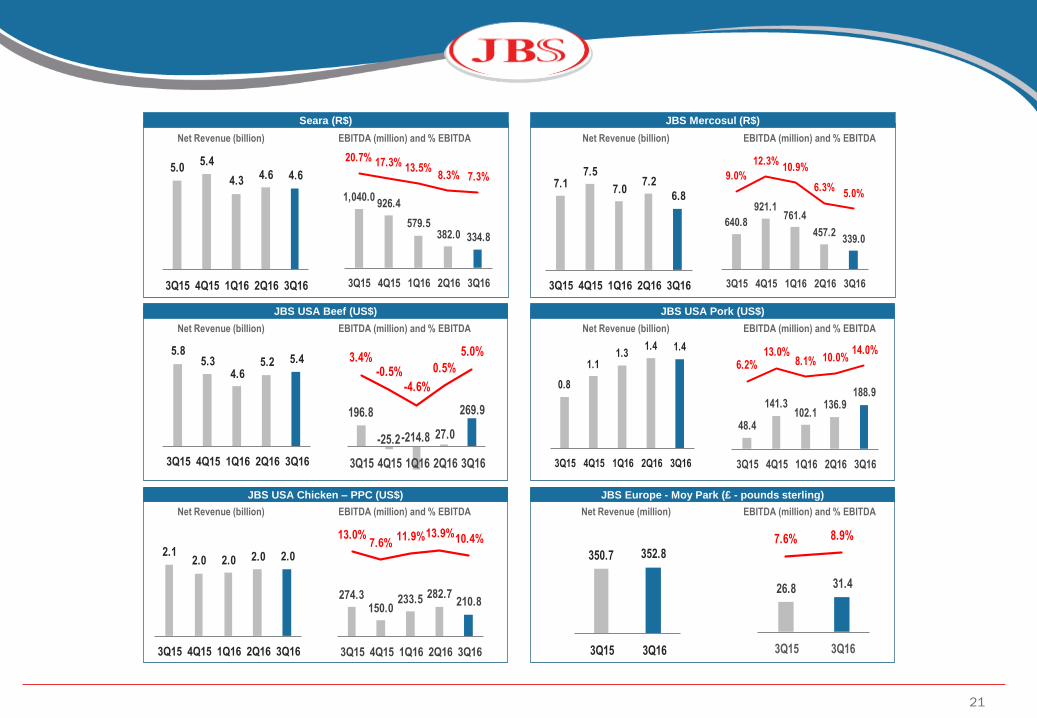
Net Revenue (billion) EBITDA (million) and % EBITDA Net Revenue (billion) EBITDA (million) and % EBITDA
Net Revenue (billion) EBITDA (million) and % EBITDA Net Revenue (billion) EBITDA (million) and % EBITDA
Net Revenue (billion) EBITDA (million) and % EBITDA Net Revenue (million) EBITDA (million) and % EBITDA
Seara (R$) JBS Mercosul (R$)
JBS USA Pork (US$)JBS USA Beef (US$)
JBS USA Chicken – PPC (US$) JBS Europe - Moy Park (£ - pounds sterling)
5.05.4
4.3 4.6 4.6
3Q15 4Q15 1Q16 2Q16 3Q16
1,040.0926.4
579.5382.0 334.8
20.7% 17.3% 13.5%8.3% 7.3%
3Q15 4Q15 1Q16 2Q16 3Q16
7.17.5
7.07.2
6.8
3Q15 4Q15 1Q16 2Q16 3Q16
640.8
921.1761.4
457.2339.0
9.0%
12.3%10.9%
6.3%5.0%
3Q15 4Q15 1Q16 2Q16 3Q16
5.85.3
4.65.2 5.4
3Q15 4Q15 1Q16 2Q16 3Q16
196.8
-25.2-214.8 27.0
269.9
3.4%-0.5%
-4.6%
0.5%
5.0%
3Q15 4Q15 1Q16 2Q16 3Q16
0.8
1.11.3
1.4 1.4
3Q15 4Q15 1Q16 2Q16 3Q16
48.4
141.3102.1
136.9188.9
6.2%13.0%
8.1% 10.0%14.0%
3Q15 4Q15 1Q16 2Q16 3Q16
2.12.0 2.0 2.0 2.0
3Q15 4Q15 1Q16 2Q16 3Q16
274.3150.0
233.5 282.7210.8
13.0%7.6%
11.9%13.9%10.4%
3Q15 4Q15 1Q16 2Q16 3Q16
350.7 352.8
3Q15 3Q16
26.8 31.4
7.6% 8.9%
3Q15 3Q16
22
Mission
“To be the best in what we set out to do,
completely focused on our business, ensuring the
best products and services for our
customers, consistency for our suppliers,
profitability for our shareholders and the
opportunity of a better future for all our team
members.