java debugging - ibm · * java run-time features, such as threads and monitors, should be fully...
TRANSCRIPT
Java debugging
Presented by developerWorks, your source for great tutorials
ibm.com/developerWorks
Table of ContentsIf you're viewing this document online, you can click any of the topics below to link directly to that section.
1. Tutorial tips 2
2. Introducing debugging in Java applications 4
3. Overview of the basics 6
4. Lessons in client-side debugging 11
5. Lessons in server-side debugging 15
6. Multithread debugging 18
7. Jikes overview 20
8. Case study: Debugging using Jikes 22
9. Java Debugger (JDB) overview 28
10. Case study: Debugging using JDB 30
11. Hints and tips 33
12. Wrapup 34
13. Appendix 36
Java debugging Page 1

Section 1. Tutorial tips
Should I take this tutorial?This tutorial introduces Java debugging. We will cover traditional program and server-sidedebugging.
Many developers don't realize how much getting rid of software bugs can cost. If you are aJava developer, this tutorial is a must-read. With the tools that are available today, it is vitalthat developers become just as good debuggers as they are programmers.
This tutorial assumes you have basic knowledge of Java programming. If you have trainingand experience in Java programming, take this course to add to your knowledge. If you do nothave Java programming experience, we suggest you take Introduction to Java for COBOLProgrammers , Java for C/C++ Programmers , or another introductory Java course.
If you have used debuggers with other programming languages, you can skip Section 3,"Overview of the Basics," which is geared for developers new to using debuggers.
What does this tutorial cover?Even the simplest application developed by the most advanced developer can contain a bug.You don't have to be a great detective to be a good debugger. You simply have to understandthe concepts and become familiar with the right tools. In this tutorial, we provide details aboutbasic Java debugging concepts as well as more advanced types of debugging.
We will explore different techniques and offer tidbits of advice to help avoid, trace, andultimately fix your programming errors.
This tutorial will conclude by taking you through an exercise in debugging. We will showserver-side and client-side debugging examples using the open-source tools Jikes and JDB.
To compile and run the sample code, first download the Java Development Kit (JDK) from SunMicrosystems. You may use either the JDK 1.1 or Java 2, found at java.sun.com . Refer to thecase study sections if you want to download the Jikes or JDB debuggers to follow along withthe exercises.
NavigationNavigating through the tutorial is easy:
* Select Next and Previous to move forward and backward through the tutorial.* When you're finished with a section, select the next section. You can also use the Main
and Section Menus to navigate the tutorial.
Presented by developerWorks, your source for great tutorials ibm.com/developerWorks
Java debugging Page 2

* If you'd like to tell us what you think, or if you have a question for the author about thecontent of the tutorial, use the Feedback button.
Getting helpFor questions about the content of this tutorial, contact the author, Laura Bennett, [email protected] .
Laura Bennett is a Senior Programmer at IBM. She holds a Bachelors Degree in ComputerScience from Pace University add a Masters Degree in Computer Science from ColumbiaUniversity. Laura is developerWorks' evangelist for Java as well as one of the site's architects.In her spare time, she enjoys playing with her Lego MindStorm Robot and building objects withher four-year old's TinkerToys.
Presented by developerWorks, your source for great tutorials ibm.com/developerWorks
Java debugging Page 3

Section 2. Introducing debugging in Java applications
In the beginning....In the early days of Java programming, a typical developer used a very archaic method ofdebugging with the Java System.out.println() method. Code traces were printed to theconsole, a file, or a socket.
It is a rare developer who creates perfect code the first time around. Consequently, the marketrecognized the need for the types of debuggers that are available for C++ programmers. Javadevelopers now have at their fingertips a vast array of debugging tools. Which tool you chooseto use depends on your level of expertise. Typically, beginners use GUI-oriented debuggers,while more experienced programmers tend to avoid the WYSIWYG techniques in favor ofhaving more control.
No developer should be without a debugger or debugging tools. Debuggers allows you to stepthrough code, freeze output, and inspect variables. Debugging tools help more experienceddevelopers locate more rapidly where problems are occurring.
Types of Java debuggersThere are several types of Java debugging techniques available:
* IDEs contain their own debuggers (such as IBM VisualAge for Java, Symantec VisualCafe, and Borland JBuilder)
* Stand-alone GUIs (such as Jikes, Java Platform Debugger Architecture javadt, andJProbe)
* Text-based and command-line driven (such as Sun JDB)* Brute force using an editor (such as Notepad or VI) and eyeballing stack traces
The versions of JDK, JSDI, JSP, and HTML you are using all have an impact on your choice.
IDE and stand-alone GUI debuggers are the easiest for the novice programmer and prove tobe the most time efficient. The debuggers will lead you to where your program crashed.Execute your program in the debugger, using a mouse to set breakpoints and step through thesource code. The downside of using these debuggers is that not all IDE debuggers support thelatest Java APIs and technologies (such as servlets and EJB components).
Text-based and the brute-force techniques offer more control but will probably take longer forthe less-experienced Java programmer to actually find bugs. We call them the "poor man's"debugger methods.
If any of the above still do not meet your needs, the Java platform has introduced the JavaDebugging APIs, which you may use to create a debugger that specifically meets your needs.
Presented by developerWorks, your source for great tutorials ibm.com/developerWorks
Java debugging Page 4
Types of debugging sessionsThere are many approaches to debugging, both on the client and on the server. We will coverthe following ways in this tutorial:
* Basic Java bytecode (that is, using System.out.println())* Using comments* Attaching to a running program* Remote debugging* Debugging on demand* Optimized code debugging* Servlet, JSP files, and EJB components debugging
We will cover each of these in detail as we progess through the tutorial.
Common bug typesTo give you a hint of what you are in for, we have listed below some common bugs thatdevelopers have run into and squashed time and time again:
* Compilation or syntactical errors are the first that you will encounter and the easiest todebug. They are usually the result of typing errors.
* Logic errors are different from run-time errors because there are no exceptions thrown,but the output still does not appear as it should. These errors can range from bufferoverflows to memory leaks.
* Run-time errors occur during the execution of the program and typically generate Javaexceptions.
* Threading errors are the most difficult to replicate and track down.
Java debugging APIsSun has defined a debugging architecture, called JBUG, in response to requirements for a trueJava debugger. These APIs help programmers build debuggers that meet these requirements:
* The interface should be object-oriented in the same manner as the language.* Java run-time features, such as threads and monitors, should be fully supported.* Remote debugging should be possible.* Security should not be compromised under normal operation.
The revised Java Debugger (JDB) serves as both a proof of concept for the Java DebuggingAPI, and as a useful debugging tool. It was rewritten to use the Java Debug Interface (JDI) andis part of the JDK. JDB is discussed in Section 9.
Presented by developerWorks, your source for great tutorials ibm.com/developerWorks
Java debugging Page 5

Section 3. Overview of the basics
Preparing a program for debuggingThe Java platform provides language support for the debugging process.
You can compile your program with certain compiler options that instruct the compiler togenerate symbolic information in the object file. If you use something other than javac, referto your compiler documentation for how to compile your program with debug information.
If you use the javac compiler to build your code for debugging, use the -g compiler option.This option lets you examine local, class instance, and static variables when debugging. Youcan still set breakpoints and step through your code if you do not compile your classes with the-g option; however, you will not be able to inspect variables. (Breakpoints are manuallyspecified positions in the code where you want to stop program execution.)
Local debugging values are not available in the core Java platform system classes even if youcompile your application with the -g option. If you need to list the list local variables for someof the system classes, you need to compile those classes with the -g option. Recompile theclasses in the rt.jar or src.zip files with the -g option. Point your classpath to the correctclass file to run your application with the newly compiled dialog class(es). In Java 2, use theboot classpath option so that the new classes are picked up first.
Keep in mind that if you compile with the -O option that optimizes your code, you will not beable to debug your classes. Optimization will remove all debugging information from the class.
Note: Verify that your CLASSPATH environment variable is set correctly so that the debuggerand the Java application know where to find your class libraries. You should also check thetool you are using to see if there are any other required or optional environment variables.
Setting breakpointsThe first step in debugging is to find out where your coding went wrong. Setting breakpointshelps you accomplish this.
Breakpoints are temporary markers you place in your program to tell the debugger where tostop your program execution. For example, if a particular statement in your program is causingproblems, you could set a breakpoint on the line containing the statement, then run yourprogram. Execution stops at the breakpoint before the statement is executed. You can thencheck the contents of variables, registers, storage and the stack, then step over (or execute)the statement to see how the problem arises.
Presented by developerWorks, your source for great tutorials ibm.com/developerWorks
Java debugging Page 6

Various debuggers support several types of breakpoints. Some of the most common are:
* Line breakpoints are triggered before the code at a particular line in a program isexecuted.
* Method breakpoints are triggered when a method that has been set as a breakpoint isreached.
* Counter breakpoints are triggered when a counter assumes or goes beyond a particularvalue.
* Exception breakpoints are triggered when code throws a particular type of exception.* Storage change breakpoints are triggered when the storage within a particular storage
address range is changed.* Address breakpoints are triggered when the address a breakpoint is set for has been
reached.
Note: Some debuggers only support certain types of breakpoints in compiled versions of Javacode (using a just-in-time compiler) and not within interpreted code (code that is compiled bythe javac tool). An example is the Address breakpoint. Each tool may be slightly different inthe way you can set breakpoints. Check your tool's documentation.
You might ask, how do I know where to place the breakpoints?* If you are completely in the fog as to where the problem is, then you can set a breakpoint
at the beginning of your program in the main() method.* If your code generates a stack trace, set breakpoints at the area where it died in the stack
trace. You will see line numbers for the source code within the stack trace.* If a particular part of your output or graphical display is not presenting information
correctly (for example, a text field is displaying the wrong text), you can set a breakpointwhere the component is created. Then you can step through your code and display thevalues that are assigned to the GUI object.
Experience will teach you to set your breakpoints in the most appropriate places. You can setmore than one breakpoint within a single class or program.
Typically, you will disable or enable breakpoints, or add or delete breakpoints as you aredebugging code. Tools should allow you to see where all of your breakpoints are and give you
Presented by developerWorks, your source for great tutorials ibm.com/developerWorks
Java debugging Page 7

the option of deleting them all in one single step.
Stepping through a programStepping through a program is how you will ultimately solve those tricky debugging problems.It allows you to follow a method that is called through the body of a class. Note that you canstop a graphical user interface (GUI) program without a breakpoint.
After you have set your breakpoints, begin executing code in the debugger. When the firstbreakpoint is hit, you can step over statements, step into other methods or classes, continuerunning until the next breakpoint is reached, or continue running until you reach the end of theprogram.
Common terms you will see when it comes to stepping in a debugger are:
* Stepping into executes the current line. If the current line contains a call to a method, theexecution traverses to the first line in the called method. If the method is in a class thatwas not compiled with debug information (that is, with the -g option), you will see a NoSource Available message.
* Stepping over executes the current line without stopping in any functions or routinescalled within the line.
* Step return executes from the current execution point up to the line immediately followingthe line that called the current method.
Inspecting variablesTypically a program is core dumping because a value of a variable is not set correctly. Themost common scenario is trying to compute or compare operations against variables with nullvalues or dividing by zero. The easiest way to find out if that is the case is by inspecting thevalues where the error occurs. More likely than not, a variable did not get assigned a value atthe point you expected it to.
Visual debuggers usually have a monitoring window where they display the values of all thevariables local to the current class that you are currently in. Some debuggers even display theaddress of the variable and may even let you dynamically change the value to see if theprogram will continue to execute as you originally expected it to. Command-line debuggerstypically offer commands to handle the same feature. Using the command line feature, you caneven investigate the entire contents of an array by displaying every row and column's contents.
While most debuggers only show local variables that are in the scope of the class in amonitoring window, some allow you to continue to monitor a variable after it falls out of scope.
Some debuggers support the viewing of registers. Note there are cases where registers canonly be viewed in compiled Java programs and not interpreted programs.
Presented by developerWorks, your source for great tutorials ibm.com/developerWorks
Java debugging Page 8
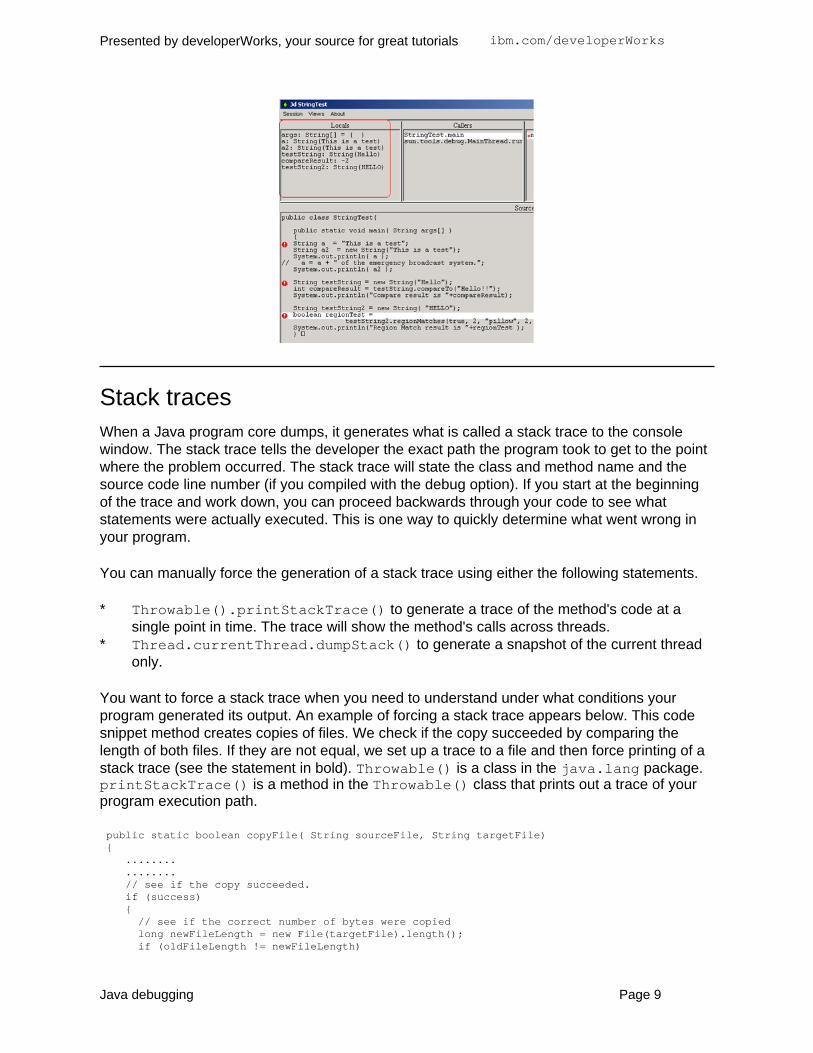
Stack tracesWhen a Java program core dumps, it generates what is called a stack trace to the consolewindow. The stack trace tells the developer the exact path the program took to get to the pointwhere the problem occurred. The stack trace will state the class and method name and thesource code line number (if you compiled with the debug option). If you start at the beginningof the trace and work down, you can proceed backwards through your code to see whatstatements were actually executed. This is one way to quickly determine what went wrong inyour program.
You can manually force the generation of a stack trace using either the following statements.
* Throwable().printStackTrace() to generate a trace of the method's code at asingle point in time. The trace will show the method's calls across threads.
* Thread.currentThread.dumpStack() to generate a snapshot of the current threadonly.
You want to force a stack trace when you need to understand under what conditions yourprogram generated its output. An example of forcing a stack trace appears below. This codesnippet method creates copies of files. We check if the copy succeeded by comparing thelength of both files. If they are not equal, we set up a trace to a file and then force printing of astack trace (see the statement in bold). Throwable() is a class in the java.lang package.printStackTrace() is a method in the Throwable() class that prints out a trace of yourprogram execution path.
public static boolean copyFile( String sourceFile, String targetFile){
........
........// see if the copy succeeded.if (success){
// see if the correct number of bytes were copiedlong newFileLength = new File(targetFile).length();if (oldFileLength != newFileLength)
Presented by developerWorks, your source for great tutorials ibm.com/developerWorks
Java debugging Page 9
{Debug.trace(1, sourceFile + Constants.BLANK_STRING + Long.toString(oldFileLength));Debug.trace(1, targetFile + Constants.BLANK_STRING + Long.toString(newFileLength));Throwable().printStackTrace();return false;
}}else
{Debug.trace(1, sourceFile);Debug.trace(1, targetFile);return false;
}................return true;
}
You may find that line numbers are not printed with your stack trace. It will simply say"compiled code." To get line numbers, disable the JIT compiler with either the nojit option orwith the command-line argument Djava.compiler=NONE. However, it is not as important toget the line numbers if you get the name of the method and the class it belongs to.
Diagnostic methodsThe Java language provides methods from the Runtime() class to trace the calls you maketo the Java virtual machine. These traces will produce a list of every method call your programmakes to the JVM bytecodes. Note that this list can produce a large amount of output, so use itfor small sections of your code at a time.
Turn on tracing by adding the following line to your source code:
traceMethodCalls(true)
Turn off tracing by adding the following line to your source code:
traceMethodCalls(false)
Start the JVM and watch the output as it is sent to standard output.
Presented by developerWorks, your source for great tutorials ibm.com/developerWorks
Java debugging Page 10

Section 4. Lessons in client-side debugging
Introducing client-side debugging techniquesYou have a multitude of debugging techniques to choose from. Be sure to check your tool'sdocumentation to see if it supports these techniques. Knowing the different debuggingtechniques will help you select a debugger that meets all of your needs.
Debugging with system.out.println()There is something to be said for using a simplistic form of debugging. When you have a smallpiece of code, it makes sense to use System.out.println() and not waste time loadingand stepping through your code using a full-fledged debugger. System.out.println()displays messages, variables, and state information on the console or where ever you redirectyour output during run time. All objects inherit the toString() method. It is a good idea, asyou develop new objects, to override this method and produce your own string representationof your object.
Java Pitfalls by Michael C. Daconta (see Resources on page 34) shares a useful technique forapplying the println() method. Daconta suggests creating a DebugManager() class thatallows you to set a debug flag based on certain classes or applications. TheDebugManager() class is an alternative to having tons of if(debug) wrappers in your code.You still have the option of turning on debugging for the entire system.
An example scenario is a mapping system that allows you to plot units and displaybackgrounds. In some cases, you want to see debugging statements only for the Plot Unitsapplication and in other cases you want to see debugging for the entire application. You wouldcreate a DebugManager() class that looks like this:
public class DebugManager{public static final String SYSTEM_DEBUG_KEY = "system.Debug";public static final boolean debug;static{debug = toBoolean(SYSTEM_DEBUG_KEY);
}private static boolean toBoolean(String key){String sDebug = System.getProperty(key);if (sDebug != null && sDebug.equalsIgnoreCase("true"))debug = true;
elsedebug = false;
}public static boolean getSystemDebug(){return debug;
}public static boolean getSystemDebug(String applicationKey){if (debug || debugToBoolean(applicationkey))return true;
else
Presented by developerWorks, your source for great tutorials ibm.com/developerWorks
Java debugging Page 11
return false;}
}
An exercise in debugging using system.out.println()Using the code from the previous panel, an application queries the debug mode (on or off) bymaking a call such as:
boolean debug = DebugManager.getSystem.Debug(applicationkey);
Set the debug for the plot tool or the background or for the entire system by entering thefollowing command line:
java -DplotTool.Debug=true -DbackgroundLoader.Debug=true -Dsystem.Debug=false MapSystem
The statement above states that debugging is turned on for the plotTool application and thebackground display application but turned off for the entire system. The application keys foreach of the applications are:
* The plotTool application key is plotTool.Debug.* The background displayer application key is backgroundLoader.Debug.* The entire system application key is system.Debug.
Your actual code would be wrappered with the statement if(debug). If debug is true then thecode that is wrappered would execute, thus printing out the results of theSystem.out.println() methods.
To summarize, using if(debug) is recommended only if you are debugging a small amountof code. Create the DebugManager() as a separate compiled class that you can use on thefly when you need to.
Debugging using commentsUsing comments is another way of debugging. Using a binary search algorithmic approach,comment large parts of code initially and then begin narrowing your debugging scope. Little bylittle, uncomment parts of your code until the error reappears. At this point, you will havelocated your error. Again, the binary search algorithmic approach is not recommended forlarge scale projects.
Attaching to a running processMany programmers use the technique of attaching to a running process as an alternative
Presented by developerWorks, your source for great tutorials ibm.com/developerWorks
Java debugging Page 12

technique to remote debugging to test cross-platform compatibilities. You can verify that anapplication runs correctly with different JVMs. This technique also lets you ensure that all ofthe required system resources are available on another machine.
Some debuggers allow you to attach to multiple JVMs and doing so becomes invaluable whenyou are debugging a multitiered system. As a tier becomes active, the debugger attaches to itsJVM and begins examining it thoroughly.
Attach the debugger to an already running program or a running JVM where an error or failureoccurred. There are two main reasons for using this method of debugging:
* You anticipate a problem at a particular point in your program, and you do not want tostep through the program or set breakpoints.
* You are developing or maintaining a program that hangs sporadically, and you want tofind out why it is hanging. In this situation, you can attach the debugger, and look forinfinite loops or other problems that might be causing your program to hang.
The JVM you are attaching to must be running in debug mode. It can either be on a remote orlocal system. The source files can be on either system.
Remote debuggingImagine that a program running on another user's system is behaving differently than when itruns on your own system. From your system, use the remote debug feature to debug theremote program on the other system.
Remote debugging entails running an application on one computer and debugging it onanother computer. Remote debugging becomes very useful when debugging complex GUIapplications. The debugging facility itself is used exactly as if you were debugging coderunning locally. However, setup and monitoring the debugging session are a little morecomplex. Refer to your debugger's documentation to see if it supports remote debugging andto see how to set up the environment.
The main requirement for remote debugging is access to networked machines. The class filesyou are debugging must reside on the remote machine and should have been compiled fordebugging. With a GUI debugger, the client user interface is running on one system while thedebug engine is running on another system.
There are two types of remote debugging: homogeneous and heterogeneous. Homogeneousremote debugging occurs when both the local and remote systems use the same operatingsystem. Heterogeneous remote debugging is when the local and remote systems use differentoperating systems.
Why would you use remote debugging?
* It is easier to debug an application that uses graphics or has a graphical user interface
Presented by developerWorks, your source for great tutorials ibm.com/developerWorks
Java debugging Page 13
when you keep the debugger user interface separate from that of the application. Yourinteraction with the application occurs on the remote system, while your interaction withthe debugger occurs on the local system.
* The program you are debugging was compiled for a platform that the debugger userinterface does not run on. You can use the remote debug feature to take advantage of thedebugger user interface while debugging the remote application.
Debugging on demandDebug on demand enables you to open a debugging session whenever an unhandledexception or other unrecoverable error occurs in your program. The debugger starts andattaches to your program at the point of fault. Doing so can save you time in two ways: you donot have to re-create errors, and your program can run at full speed without interference fromthe debugger until the fault is encountered.
With debug on demand, you can find and fix a problem in your application and let theapplication continue running.
Optimized code debuggingDebugging optimized code is a little tricky because you can't optimize and debug code at thesame time. Sometimes, problems will only surface during optimization, thus indicating theexistence of logic errors.
The best way to hunt down these type of bugs is to use a binary search technique, asdescribed here:
* Start by optimizing only a portion of your code and see if the error persists.* After each change in the number of optimized modules, if the error persists, optimize
fewer modules; if the error goes away, optimize more modules. Eventually you will havenarrowed the error down to a single module or a small number of modules.
* Look for problems such as reading from a variable before it has been written to, or arrayindices exceeding the bounds of storage.
Presented by developerWorks, your source for great tutorials ibm.com/developerWorks
Java debugging Page 14
Section 5. Lessons in server-side debugging
Getting down to basicsServer-side debugging (on servlets, JSP files, and EJB components) is extremely difficult. Thepossibility of multiple users executing the code simultaneously introduces thread concurrencybugs.
By default, most servers output an event and error log. Most servers buffer these logs toimprove performance, so you may need to temporarily stop the buffering while you aredebugging. Also, some servlet engines start a JVM without displaying a console window.Therefore, you may not see output in a window. In some cases, you may be able to configurethe settings of your engine to display a console.
If there is no clear indication of the error in the server logs, then there are two somewhatprimitive approaches to debugging server code:
* The log() method. The Servlet API defines a method in the GenericServlet classthat allows you to output textual information to a main log file used by the Web server.Place log() in the catch clause of exceptions to capture information about errors thatare occurring.
* The out.println() method. You can add a debug parameter (debug=true) to theend of the URL requesting a JSP file or servlet. Then you check the parameter in yourcode when errors occur. When set to true, print out debugging information.
Debugging servletsWhen servlets were introduced, many debuggers did not know how to handle them becausethey cannot be run outside of a Web server. It was not practical to load the entire server intothe debugger environment. But debugger support for servlet technology has changed. Todebug a servlet, you would run sun.servlet.http.HTTPServer(), then watch asHTTPServer() executes servlets in response to user requests.
Note that when debugging servlets, one instance of the servlet is instantiated; however, a newthread is created for each request of a servlet. This is a breeding ground for threading errors.
You can use these tools to debug servlets:
* Servletrunner is a free debugging tool from Sun that comes with the JSDK.* JDB is another free command-line debugger that ships with the JDK.
Alan R. Williamson presents an alternative in his book Java Servlets By Example (seeResources on page 34). His technique requires you to create your own Debug() class withonly static methods. Call these methods in your code only when you need to debug. Hesuggests that using the Debug() class process:
Presented by developerWorks, your source for great tutorials ibm.com/developerWorks
Java debugging Page 15
* Allows you to print the stack trace when it is needed.* Dumps variables of a specific bean by using introspection. The context given to a bean
supports the toString() method, so the contents of the bean can be printed out to getan idea of the transactional state of a bean instance.
* Uses a threshold level to use different debug levels and show which class or method thedebugging information came from.
* Uses System.out.println(), which is the least intrusive in terms of how it affectsscheduling. IDEs slow the debugging process down too much to seriously debugconcurrency bugs.
As previously mentioned, servlets are instantiated once and then a separate thread is createdfor each execution request. This process leads into multithreading issues and complicatesfurther the debugging process. Refer to Section 6, "Multithreaded debugging," for moreinformation on debugging servlets.
Debugging JavaServer Pages (JSP) filesDebugging JSP files is slightly trickier because a JSP compilation phase occurs just before runtime. Therefore, you will miss out on the strong type checking and syntax checking thatnormally occurs with typical Java programming. Also, you are dealing with multiple layers ofcoding (a JSP is converted into a servlet, which is compiled into a .class file, whichgenerates Javascript or HTML code) so the "code-type" mixing adds more complexity to thedebugging process.
Each layer can present different types of errors:
* The first layer transforms the JSP file into a servlet. The errors that can occur in thisphase are usually attributed to syntactical errors in the original JSP code located in anHTML file. Most times, you can locate these errors just by eyeballing the JSP code.Check for misspelled words or missing key characters such as matching quotes. The JSPengine is reporting the errors in this stage.
* The next layer compiles the servlet into a .class file. The Java compiler reports anyerrors during this phase. The error message Error: 500 indicates a syntactical error.The sample shown here indicates a return statement was left out:
Error: 500Internal Servlet Error:
org.apache.jasper.JasperException:Unable to compile class forJSPwork\8080%2Fjspbook\_0005cretrieveParam_0002ejspretrieveParam_jsp_1.java:19:
Return required at end of java.lang.String myMethod(java.lang.String).public String retrieveParam(String someParameter)
If you notice that a .java file exists without a companion .class file in the directorywhere JSP stores its files, then check the .java file for errors.
* The last layer actually runs the servlet. Because the JSP engine places your servlet codein one large try/catch block, you may get an exception error. The drawback is that all
Presented by developerWorks, your source for great tutorials ibm.com/developerWorks
Java debugging Page 16

exceptions are caught under a general RuntimeException() superclass; therefore,you can't determine the specific exceptions that were generated. To get around thisproblem, insert out.flush() in your code to send output to the browser. Other run-timeerrors can produce unexpected results, which may be due to incorrect input data orincorrect formatting.
When you make any changes to your JSP code after a successful run of the original code, youshould delete the .java and .class file in the JSP engine work directory to ensure that youare running the latest code when you test your changes.
Because JSP files are compiled into servlets, you will run into the issues of multithreading. JSPfiles offer an alternative to using the synchronize() keyword: the SingleThreadModel.Simply enter on the page directive:
<%@pageisThreadSafe="false"%>.
Debugging Enterprise JavaBeans (EJB) componentsEJB components are the newest entry into the server space. They introduce even morecomplexity to server-side debugging. As you might guess, the tools have not kept pace withthe technology but the news is not all bad; they are catching up.
What makes EJB components hard to debug is that they run in containers, forcing you to loadthe container into the debugger as well. The catch is that not all containers are written in Javacode, thus making it impossible to load the container.
Some problems you may run into are:
* The classes generated from your EJB container are not at the same level as the EJBspecification. This can happen if the classes have not been compiled against the latestclasses. Run compliance checkers to solve this problem.
* User errors. Make sure you are using the correct commands to access your back-endsystems.
* EJB containers must comply with the J2EE source code and should have beensuite-tested prior to shipping. This may not always be true.
Here are some tips:
* Some EJB containers have debugging environments that you can use to step throughyour code in real time.
* Use a database's log file to help trace problems.* Take a look at the generated Java files. Some container tools allow you to keep them
around even after compiling them into binary classes.* If all else fails, using System.out.println() is the least intrusive way to debug EJB
concurrency problems.
Presented by developerWorks, your source for great tutorials ibm.com/developerWorks
Java debugging Page 17
Section 6. Multithread debugging
Multithread debugging basicsThe most valuable tools for debugging are thread-centric. A large percentage of Java bugscenter around thread interactions. Multithread debugging allows developers to see what isgoing on in each thread running in an application.
It is significantly harder to locate bugs in a multithreaded application than a non-threadedsituation because of the variability of the execution order. If we could always have theinstructions execute in the same predictable order, debugging these applications would beeasy. Of course, that would defeat the purpose of multithreading. As a result, many IDEdebuggers are not much help here because stepping through code tends to slow down thedebugging process and prohibits re-creating the erroneous event.
Types of multithread bugsHere are some common types of multithreading coding problems to watch out for:
* Access violations. These occur when two or more threads attempt to access the samememory location.
* Deadlock. Let's say Thread1 locks ResourceA, while Thread2 locks ResourceB.Then Thread1 attempts to lock ResourceB and waits for ResourceB to becomeavailable. Meanwhile, Thread2 attempts to lock ResourceA and waits for ResourceA tobecome available. The result: deadlock. One way to prevent deadlocks is to not let aprocess sleep while it has locks set. You can also use synchronization() to ensurethat a critical piece of code is accessed by only one thread at a time.
* Data race bugs. A data race condition locks up an application and can occur withsomething as simple as a double-click of the left mouse button. Data is usually corruptedin a data race situation. To prevent this type of error, protect variables that can beaccessed by more than one thread. There are tools that analyze this very problem andflag variables that may be prone to data race bugs.
* Synchronization errors. These can occur while garbage collection is taking place. Javahandles garbage collection automatically. During this time, all threads are suspendedfrom running.
Using the synchronized() methodDifferent versions of the JVM may implement thread priorities differently, affecting yoursynchronization of threads. We urge you to test your threaded code on multiple operatingsystems to verify that it truly is cross-platform.
The synchronized() method creates the code block that simulates a lock. The code that isdelineated with the synchronized method will allow only one process to run it at a time. But
Presented by developerWorks, your source for great tutorials ibm.com/developerWorks
Java debugging Page 18

don't use too many synchronized calls, because they directly affect code performance.Synchronizing actually stops multithreading.
A code example of using the synchronized method appears below. This code fragment addsan element to a table, resetting the maximum column size of the table in instance variables.You can see the potential for corruption with multiple threads updating the same variablevalues. Using the synchronized method helps to alleviate this problem.
/** Synchronized method to add an element to a table **/public void addElement( Patient newPatient ){synchronized ( lock ){Log query = incomingPatient.getLog();results = query.getAllSearchResults();for ( int k = 0; k < results.length; k++){
.... // add to tablesetMaxColSize(MyTable);tableContents.add(MyTable);
}}
}
Avoiding multithread errorsThere are some ways to avoid the dreaded threaded bug:
* If you rely on thread priority to keep things synchronized, it is important to test on variousclasses of JVMs.
* Beware of the possibility that two threads can simultaneously assign long and doublevariables. The undesirable result is that one thread's changes can change some bits,while a second thread can further alter the same variable. Consider synchronizingassignments to those variables types.
* Never use the stop() method. It has actually been deprecated in Java 2. It immediatelystops processes without cleaning up, causing a multitude of problems including deadlocksand memory locks.
* A thread should always terminate by returning from the run() method.* Don't restart a stopped thread. The run() method is not called and the isAlive()
method reports false indicating that the thread is actually dead.* Don't be a CPU hog. If a portion of your program turns out to hog the CPU, it should run
the yield() method, which gives other threads a chance to run. See this trivial example:
double answer = 0;for (int i=0; i<10000; i++) {for (int j = 0; i<10000; j++) {
answer = ((answer * i) + j) / j;}Thread.yield(); // Now other threads may run while this runs in the background
}
Presented by developerWorks, your source for great tutorials ibm.com/developerWorks
Java debugging Page 19
Section 7. Jikes overview
What is Jikes?Jikes is part of an open-source project that originated at IBM and is now maintained bydevelopers from several companies including IBM.
Jikes has several key advantages over the traditional javac command:
* It is open-sourced, so anyone can update and redistribute the source code.* It strictly abides by the Java language specification and the Java virtual machine
specification.* The compiler has proven to be a high-performer.* It can perform dependency analysis on your code, and it supports incremental builds and
makefile generation.
The Jikes project has been ported to the Windows, Linux, UNIX, and Macintosh platforms.
Jikes toolsetJikes contains a Java source-to-bytecode compiler and GUI debugger.
* The compiler is invoked by the jikes command* The debugger is invoked by the jd command
We will focus on the debugger in this tutorial.
Introducing the Jikes debugger (JD)JD is the Jikes graphical debugger completely written in Java code. It should run on anyplatform that supports the Java platform.
In its latest form, JD has been tested with JDK 1.1.6; however, you can point to later JDKs byissuing the -nocheckversion option on the jd command.
The Jikes debugger is currently available for free from IBM's alphaWorks site (see Resourceson page 34). It is a graphical user interface for the command-line Java Debugger (JDB) fromSun. We will explore JDB in more detail in Section 9.
Jikes is easy and quick to use; it requires a minimal amount of setup and doesn't requireproject or makefile setups. You just have to identify the class in your application that containsthe main() method. For classes that do have debug info, Jikes can display individualattributes and local variables. It is compatible with any JVM supporting Sun's Java debugginginterface. Compile your classes with -g -debug to see your local variables within the
Presented by developerWorks, your source for great tutorials ibm.com/developerWorks
Java debugging Page 20

debugger.
Unfortunately, Jikes' user interface is limited. It doesn't remember breakpoints and othersettings between sessions, and all actions are mouse-driven. Because it is open-source code,users are encouraged to add enhancements and share them with the developer community.
JD's features and functionsJD is a multipaneled debugger. Each panel holds a "snapshot" (an image of the state of theprogram at a particular instant in time) of some aspect of the executing program. We will studyeach in more detail in Section 8.
The panels are organized as follows:* Locals displays the variables local to the current stack trace.* Callers displays the stack trace or the path the executable code has taken.* Threads displays the threads that are currently running or waiting to execute.* Classes displays the classes within your program.* Inspector displays the values of the local variables.* Console displays any I/O or error streams. This is where you would enter input or read
output.* Source editor displays the source code for the class currently executed. This panel is
where you will spend most of your time.
Presented by developerWorks, your source for great tutorials ibm.com/developerWorks
Java debugging Page 21
Section 8. Case study: Debugging using Jikes
Starting JDIn this exercise, we will debug the program LinkTree.java program. There is really nothingwrong with the code; however we will work through the debugging process just for the fun of it.
The code for this exercise is in Section 13.
To begin debugging1. First compile your program using:
javac -g LinkTree.java
2. This command will execute the following:e:\jdk1.1.6\bin\java -verbose -nojit
-classpath %JD%;%JDK% jd.Main-classpath %JD%;%JDK%;%CLASSPATH%-sourcepath e:\jikes\ %1 %2 %3 %4 %5 %6 %7 %8 %9
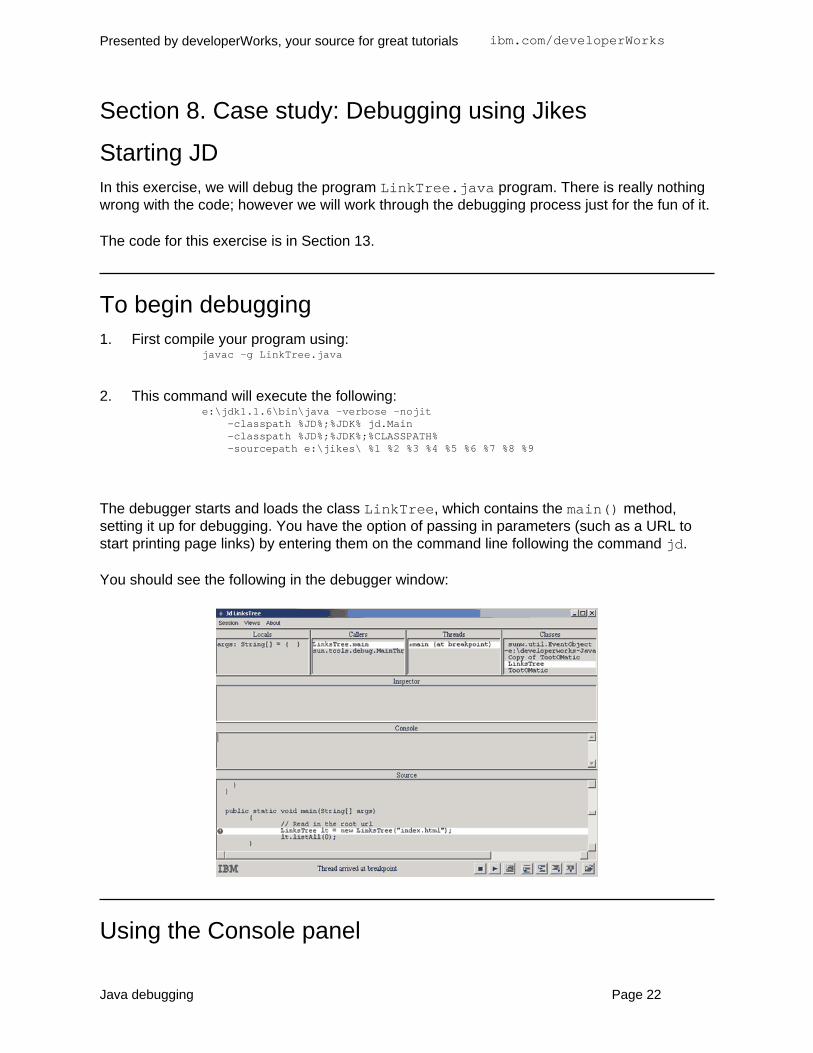
The debugger starts and loads the class LinkTree, which contains the main() method,setting it up for debugging. You have the option of passing in parameters (such as a URL tostart printing page links) by entering them on the command line following the command jd.
You should see the following in the debugger window:
Using the Console panel
Presented by developerWorks, your source for great tutorials ibm.com/developerWorks
Java debugging Page 22
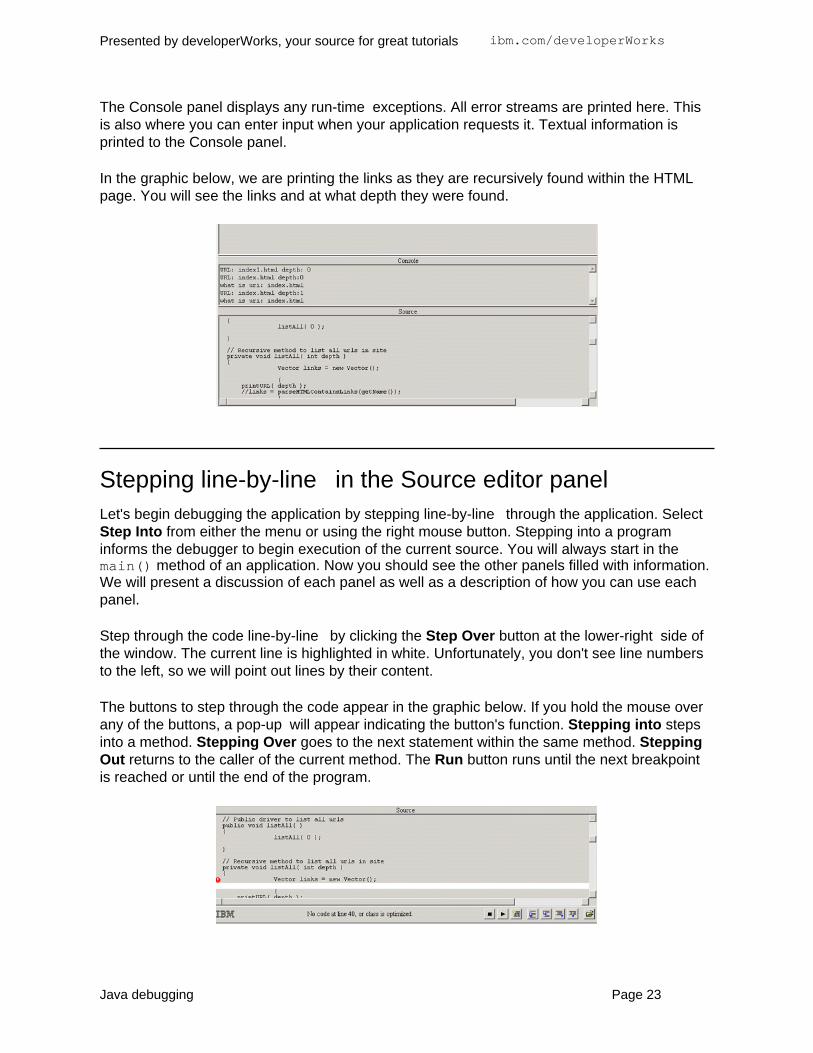
The Console panel displays any run-time exceptions. All error streams are printed here. Thisis also where you can enter input when your application requests it. Textual information isprinted to the Console panel.
In the graphic below, we are printing the links as they are recursively found within the HTMLpage. You will see the links and at what depth they were found.
Stepping line-by-line in the Source editor panelLet's begin debugging the application by stepping line-by-line through the application. SelectStep Into from either the menu or using the right mouse button. Stepping into a programinforms the debugger to begin execution of the current source. You will always start in themain() method of an application. Now you should see the other panels filled with information.We will present a discussion of each panel as well as a description of how you can use eachpanel.
Step through the code line-by-line by clicking the Step Over button at the lower-right side ofthe window. The current line is highlighted in white. Unfortunately, you don't see line numbersto the left, so we will point out lines by their content.
The buttons to step through the code appear in the graphic below. If you hold the mouse overany of the buttons, a pop-up will appear indicating the button's function. Stepping into stepsinto a method. Stepping Over goes to the next statement within the same method. SteppingOut returns to the caller of the current method. The Run button runs until the next breakpointis reached or until the end of the program.
Presented by developerWorks, your source for great tutorials ibm.com/developerWorks
Java debugging Page 23

Setting breakpoints in the Source editor panelSet breakpoints by clicking the left mouse button on a line of code. You will see a red circlewith an exclamation point inside appear to the left of the line you selected. When you set abreakpoint, the code will run until it gets to the line marked with the breakpoint symbol. Let'sassume you are trying to look into a particular piece of code but it is so deep that steppingline-by-line would take too long. The solution is to set a breakpoint at the position where youwant the program to stop.
In this example, let's set a breakpoint to monitor the value of links. If the application isrunning right now in the debugger, click the Stop button to terminate the execution. After theapplication has terminated, go to the application's source code and left-click on the statementVector links = new Vector(); (bold in the following code sample).
// Recursive method to list all urls in siteprivate void listAll( int depth ){
Vector links = new Vector();
{printURL( depth );
//links = parseHTMLContainsLinks(getName());}
if( !((links = parseHTMLContainsLinks(getName())).isEmpty())){//links = parseHTMLContainsLinks(getName());for( int i = 0; i < links.size(); i++ ){
if (!(excludedURLS.contains((String)links.elementAt(i)))){
LinksTree child = new LinksTree((String)links.elementAt(i));child.listAll( depth + 1 );}
}}
}
Your Source editor window should display the code with the following breakpoint. See thegraphic below.
Run the application and watch it stop right at the line containing the breakpoint. You canperform more in-depth analysis of what the code is doing. We will look at examining variablesin the next panel. Note that after examining your variables,you can step line-by-line or
Presented by developerWorks, your source for great tutorials ibm.com/developerWorks
Java debugging Page 24
continue full, uninterrupted execution by using the Run or Step Into buttons.
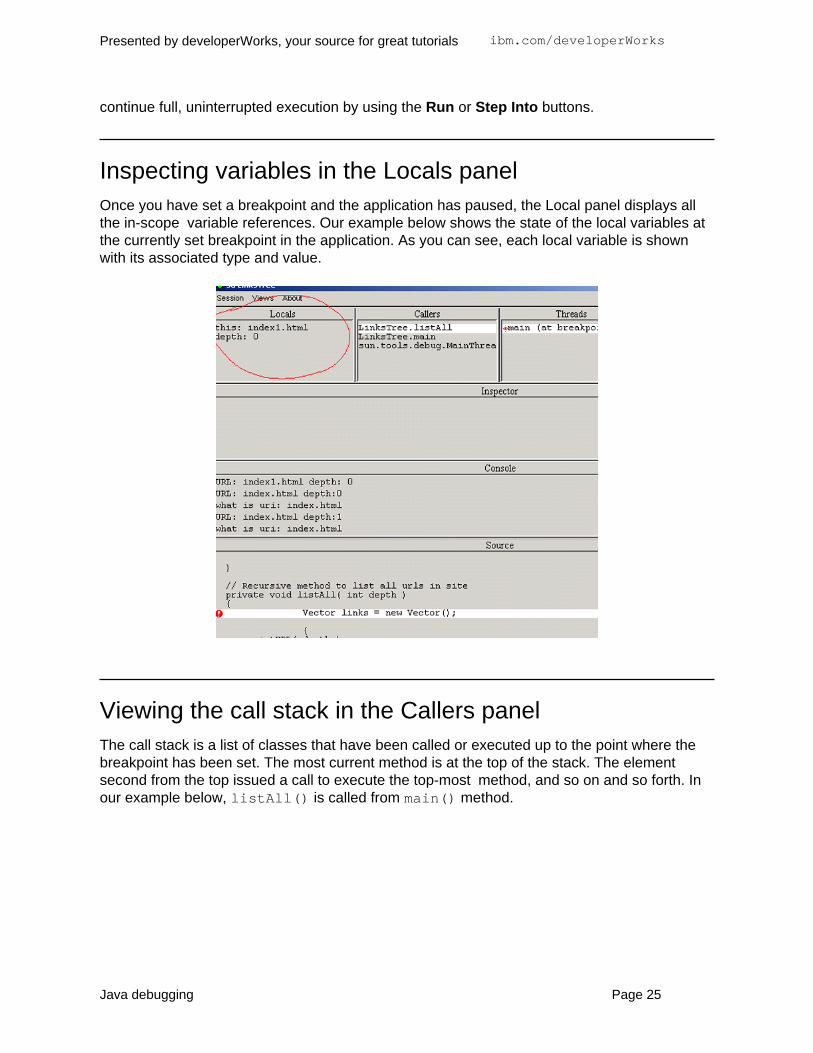
Inspecting variables in the Locals panelOnce you have set a breakpoint and the application has paused, the Local panel displays allthe in-scope variable references. Our example below shows the state of the local variables atthe currently set breakpoint in the application. As you can see, each local variable is shownwith its associated type and value.
Viewing the call stack in the Callers panelThe call stack is a list of classes that have been called or executed up to the point where thebreakpoint has been set. The most current method is at the top of the stack. The elementsecond from the top issued a call to execute the top-most method, and so on and so forth. Inour example below, listAll() is called from main() method.
Presented by developerWorks, your source for great tutorials ibm.com/developerWorks
Java debugging Page 25
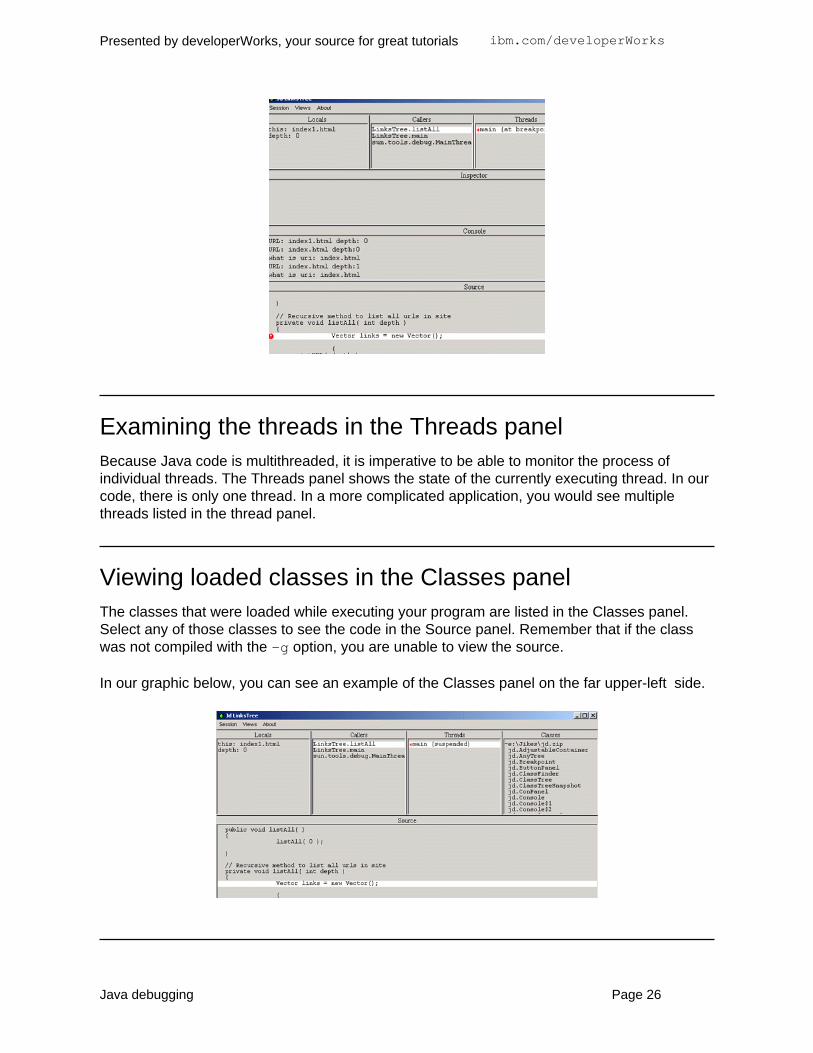
Examining the threads in the Threads panelBecause Java code is multithreaded, it is imperative to be able to monitor the process ofindividual threads. The Threads panel shows the state of the currently executing thread. In ourcode, there is only one thread. In a more complicated application, you would see multiplethreads listed in the thread panel.
Viewing loaded classes in the Classes panelThe classes that were loaded while executing your program are listed in the Classes panel.Select any of those classes to see the code in the Source panel. Remember that if the classwas not compiled with the -g option, you are unable to view the source.
In our graphic below, you can see an example of the Classes panel on the far upper-left side.
Presented by developerWorks, your source for great tutorials ibm.com/developerWorks
Java debugging Page 26

Completing our case studyYou have seen how to effectively use the Jikes debugging facilities to track down and pinpointbugs. We demonstrated the debugger using a fairly simple example. We suggest building upyour experience with the debugger using more complicated applets or applications.
Remember that Jikes is an open-source debugger so we encourage you to update it andenhance it. Last, but not least, share your changes with the developer community.
Presented by developerWorks, your source for great tutorials ibm.com/developerWorks
Java debugging Page 27

Section 9. Java Debugger (JDB) overview
What is JDB?Although there are some very good debugging tools available, the Java Debugger (JDB) offerssome advantages. The most important is that JDB is freely available and is platformindependent. The downside is that it only comes in a command-line format, which somedevelopers find very primitive and difficult to use. Several IDEs have built GUI interfaces to theJDB debugging APIs (such as Jikes).
JDB comes as part of the JDK installation. It has been enhanced in the Java 2 platform. Referto the section on the Java Debugging APIs for more information.
More on JDBJDB can be configured for debugging multiple projects. JDB looks for a jdb.ini configurationfile in the user.home directory. Therefore, you should set the user.home property to point toa different .ini file in another directory for each project. You can do this by entering thecommand:
jdb -J-Duser.home=. //Will look in the current directory for the jdb.ini file
The jdb.ini file can start a JDB session, pass in parameters, and display information aboutthe system. Below is an example of a jdb.ini file. It includes the Java platform sources onthe source path list and passes in the parameter 34 to the program. It then runs and stops atline 2 and displays the free memory and waits for further input.
load MyTeststop at MyTest:20use c:/java;c:/jdk/srcrun MyTest 34memory
You can record your debugging sessions with JDB. Enable logging by creating a file called.agentLog in the directory where you are running JDB. In the .agentLog file, put thefilename that you want the session information to be written to on the first line. When you runthe jdb command, you will see jdb session information. The log file could contain the following:
-------- debug agent message log --------[debug agent: adding Debugger agent to system thread list][debug agent: adding Breakpoint handler to system thread list][debug agent: no such class: MyApplication.main]
Debugging servlets using JDB and ServletrunnerIn the next section we will go through an exercise debugging a servlet using JDB and a servlet
Presented by developerWorks, your source for great tutorials ibm.com/developerWorks
Java debugging Page 28

engine. Tomcat is a JSP/servlet engine that interfaces well with JDB. Other servlet enginesthat are Window application .exe files can't run in debug mode. However, Tomcat has astartup script that allows you to configure it for debugging. You need to configure theTOMCAT_OPTS environment variable.
Running an engine in debug mode also affects the CLASSPATH. Set the boot classpath with-Xbootclasspath with the path for the rt.jar and the tools.jar files found in JDK2.0.
Alternatively, you can debug using Servletrunner. Servletrunner is an application that comeswith the JSDK. It lets you run a servlet without a Web browser. Servletrunner runs as a JavaWeb server that is lighter than the Java Web server. It handles HTTP requests for servlets.Servletrunner runs the command: java sun.servlet.http.HttpServer. You should runthe jdb session with the HttpServer() class. When you are debugging servlets, keep inmind that the Java Web server and Servletrunner do not load and unload servlets by includingthe servlets directory on the CLASSPATH. Instead, they use a custom classloader and not thedefault system classloader.
Presented by developerWorks, your source for great tutorials ibm.com/developerWorks
Java debugging Page 29

Section 10. Case study: Debugging using JDB
Getting startedWe are going to debug the following code:
import javax.servlet.*;import javax.servlet.http.*;
import java.io.*;
public class MyHelloWorld extends HttpServlet{public void doGet(HttpServletRequest req, HttpServletResponse res)throws ServletException, IOException
{res.setContentType("text/html");PrintWriter out = res.getWriter();out.println("");out.println("");out.println("");out.println("Hello World Sample Servlet");out.println("");out.println("");out.println("");
//out.close();}
}
First you make preparations for running a servlet engine. You can use Tomcat orServletrunner.
To prepare to run the servlet engine, configure the CLASSPATH. The CLASSPATH needs tofind sun.servlet.http.HttpServer and its associated classes. Also, the CLASSPATHneeds to find the servlet file tools.jar in the /lib directory.
You won't see any GUI with this exercise because JDB is a command-line interface.
Starting the debuggerStart the servlet engine. You can use Tomcat or Servletrunner.
1. Configure the JVM to use the special boot classpath -Xbootclasspath. The bootclasspath must include the rt.jar file and the tools.jar file. You can set thisenvironment variable on the command line.
2. Let's start the servlet engine to debug the MyHelloWorld servlet. Start up either Tomcator Servletrunner.
3. Now you need to start the debugger against the HttpServlet class. Enter:jdb sun.servlet.http.HttpServlet
You should now see the response:
Presented by developerWorks, your source for great tutorials ibm.com/developerWorks
Java debugging Page 30

Initializing jdb...
4. The HTTPServer class contains the main() method that listens for incoming requestsfor servlets.
Again, there is nothing wrong with the code, we simply chose to use it in our case study.
Setting breakpointsNext, set a breakpoint in the doGet() method of MyHelloWorld.
> stop in MyHelloWorld.doGetBreakpoint set in MyHelloWorld.doGet> runrun sun.servlet.http.HttpServerrunning ...
Stepping through the codeNow run the servlet in debug mode. Enter in a browser:
http://yourmachine:8080/servlet/MyHelloWorld
The debugger will stop at the breakpoint at the beginning of the method doGet(). You will seethis in the DOS window where you started the debugger. You can use the list command tosee where in the servlet the debugger has stopped.
Other JDB commandsThere are many other commands that you can use within the JDB session to debug your code.Below is a sampling in JDK 2.0:
* Step steps you line by line.* Print prints the value of an expression.* Locals prints the variables local to the current method.* Threads lists all of the threads.* Help offers help with the JDB command, listing all of the command options and their
definitions.
Completing our case study
Presented by developerWorks, your source for great tutorials ibm.com/developerWorks
Java debugging Page 31

This simple exercise ran JDB against a servlet. After you become familiar with the commandsthat JDB uses to debug code, you will better understand what GUI debug tools that interface toJDB are doing under the hood.
JDB is also great when you need to debug very small pieces of code. It is a quick and dirtyway to get right to the source of an application's problem.
Presented by developerWorks, your source for great tutorials ibm.com/developerWorks
Java debugging Page 32

Section 11. Hints and tips
General debugging hints and tips* When you create your own beans, add a public static void main(String[]
args) method to it. This allows easy debugging of each component separately.* If you ever find yourself building a debugger or even a simple class to handle debugging,
keep in mind that its performance is also a key issue. You don't want to ship productioncode with a debugger that is a performance hog.
* Modularizing your code into individual classes, beans, and EJB components makesdebugging easier. You could potentially test code separately.
* You can use Reflection classes to debug JavaBean components via introspection.* Format your code by lining up your braces and lining up your if/then/else clauses. This
helps in the debugging process.* Do not tune your code for performance until you completely debug it.* Do not put multiple statements on the same line because some debugger features
operate on a line-by-line basis. For example, you cannot step over or set linebreakpoints on more than one statement on a line.
* Assign intermediate expression values to temporary variables to make it easier to verifyintermediate results.
* Because some bugs hide other bugs, start debugging at the top of your program and workyour way down.
* Use try/catch blocks frequently to catch and report errors and exceptions.
Server debugging hints and tips* The method in the GenericServlet class is not only reserved for debugging in a servlet
environment. Use it in any Java environment.* You should be intimately familiar with debugging servlets if you are debugging JSP files.
Because JSP files are compiled into servlets, you will have a hard time tracking down JSPbugs without that experience.
* To fix a multithreaded bug, you need to replicate the environment that is causing theerror. So for example, you need to set up your servlet environment while debuggingexactly as you would have it running in a production environment.
Presented by developerWorks, your source for great tutorials ibm.com/developerWorks
Java debugging Page 33

Section 12. Wrapup
What does the future hold?Vendors have made some strides forward with Java debugging. There are a variety of toolsavailable at your fingertips. Looking down the road, there is room for more advances in thistechnology. Let's mention a couple.
One such area with room for new developments is 3D visualization of data. IBM is leading theway in this arena with a research project called Jinsight. (See Resources on page 34.)
Another area to keep watching is the wireless market. The number of wireless products thatinteract with the Internet is growing at a rapid pace. To keep up with that pace, many vendorsare looking for opportunities to provide real-time debugging tools for embedded applications inwireless devices. The automotive, telecommunications, and network appliance industries areamong the industries that have formed a consortium to define requirements and develop toolsfor this market. (See Resources on page 34.)
In summary, debugging is vital to the development process. You should never consider it aminor task. It can consume many hours, and we advise you to take advantage of thetechniques and tools presented in this tutorial to help reduce those hours.
Resources* "Bug patterns," by Eric Allen, is the first in a series of articles that helps you diagnose and
correct recurring bug types in your Java programs.* See "Techniques for adding trace statements to your Java application," by Andrei
Malacinski, for a way to squash bugs during development as well as after deployment.* "Java Pitfalls," by Michael Daconta, offers suggestions on techniques for debugging, as
does "Java Servlets by Example," by Alan R. Williamson.* Debugging Java by Will David Mitchell offers more trouble-shooting techniques.* Visit the Jikes Home page where you can learn more about the Jikes Project and
download the code.* Download the Jikes debugger (JD) from IBM alphaWorks .* Get more information on Jinsight and download the code from IBM alphaWorks .* The March 2001 issue of "Dr. Dobb's Journal" focuses on testing and debugging.* Check out the poll results on the developerWorks Java technology zone that show how
developers debug code and whether they had formal training in debugging .* Find everything you want to know about Java servlet technology , including links to the
Servletrunner and Tomcat engines.* Learn more about what is happening in the wireless arena at the Global Embedded
Processor Debug Interface Forum Web site.
Your feedback
Presented by developerWorks, your source for great tutorials ibm.com/developerWorks
Java debugging Page 34

Please let us know whether this tutorial was helpful to you and how we could make it better.We'd also like to hear about other tutorial topics you'd like to see covered. Thanks!
For questions about the content of this tutorial, contact the author, Laura Bennett, [email protected] .
Presented by developerWorks, your source for great tutorials ibm.com/developerWorks
Java debugging Page 35

Section 13. Appendix
Code sample for Section 8 exercise// This parses a single HTML file and generates all of the URL linksimport java.io.*;import java.net.*;import java.util.*;import javax.swing.text.*;import javax.swing.text.html.*;
class LinksTree extends File {//String urlLink;Vector htmlElements = new Vector();public static Vector excludedURLS = new Vector();
// Constructorpublic LinksTree( String urlName ){super( urlName );
}// Print the name of the URLprivate void printURL(int depth){
System.out.println("URL: " + getName() + " depth: " + depth);}
// Public driver to list all urlspublic void listAll( ){listAll( 0 );
}
// Recursive method to list all urls in siteprivate void listAll( int depth ){Vector links = new Vector();
{printURL( depth );//links = parseHTMLContainsLinks(getName());
}
if( !((links = parseHTMLContainsLinks(getName())).isEmpty())){//links = parseHTMLContainsLinks(getName());for( int i = 0; i > links.size(); i++ ){
if (!(excludedURLS.contains((String)links.elementAt(i)))){
LinksTree child = new LinksTree((String)links.elementAt(i));child.listAll( depth + 1 );
}}
}}
public static void main(String[] args){// Read in the root urlLinksTree lt = new LinksTree("index.html");lt.listAll(0);
}
Presented by developerWorks, your source for great tutorials ibm.com/developerWorks
Java debugging Page 36

private Vector parseHTMLContainsLinks(String urlLink){EditorKit kit = new HTMLEditorKit();Document doc = (HTMLDocument)kit.createDefaultDocument();
// clear out the vectorhtmlElements.removeAllElements();
// The Document class does not yet// handle charset's properly.doc.putProperty("IgnoreCharsetDirective", Boolean.TRUE);try {// Create a reader on the HTML content.Reader rd = getReader(getName());
// Parse the HTML.kit.read(rd, doc, 0);// Iterate through the elements// of the HTML document.ElementIterator it = new ElementIterator(doc);javax.swing.text.Element elem;while ((elem = it.next()) != null){
SimpleAttributeSet s = (SimpleAttributeSet) elem.getAttributes().getAttribute(HTML.Tag.A);if (s != null){
if ((s.getAttribute(HTML.Attribute.HREF)).toString().startsWith("/")){
String relativeURL = (s.getAttribute(HTML.Attribute.HREF)).toString();if (getName().endsWith("/"))htmlElements.addElement(getName() + relativeURL.substring(1));
elsehtmlElements.addElement(getName() + relativeURL.substring(0));
}else{
htmlElements.addElement((s.getAttribute(HTML.Attribute.HREF)).toString());}
}}
}catch (Exception e){
e.printStackTrace();System.exit(1);
}return htmlElements;//System.exit(1);
} // end of main
// Returns a reader on the HTML data. If 'uri' begins// with "http:", it's treated as a URL; otherwise,// it's assumed to be a local filename.static Reader getReader(String uri) throws IOException{if (uri.startsWith("http:")){// Retrieve from Internet.URLConnection conn = new URL(uri).openConnection();return new InputStreamReader(conn.getInputStream());
}else{// Retrieve from file.return new FileReader(uri);
}} // end of getReader
}
Presented by developerWorks, your source for great tutorials ibm.com/developerWorks
Java debugging Page 37
Colophon
This tutorial was written entirely in XML, using the developerWorks Toot-O-Matic tutorialgenerator. The Toot-O-Matic tool is a short Java program that uses XSLT stylesheets toconvert the XML source into a number of HTML pages, a zip file, JPEG heading graphics, andtwo PDF files. Our ability to generate multiple text and binary formats from a single source fileillustrates the power and flexibility of XML.
Presented by developerWorks, your source for great tutorials ibm.com/developerWorks
Java debugging Page 38