java-based internet biometric authentication system
TRANSCRIPT

Java-Based Internet BiometricAuthentication System
Ross A.J. Everitt and Peter W. McOwan
Abstract—An online biometric verification system for use over the Internet and
requiring no specialist equipment is presented. Combining two distinct tests to
ensure authenticity, a typing style test and a mouse-based signature test, achieves
a fraudulent access rate of� 4.4 percent, while authentic users access with a rate of
� 99 percent.
Index Terms—Authentication, biometric, Internet, Java, keyboard dynamics,
signature, verification.
�
1 INTRODUCTION
WITH the increasing use of the Internet as a business and social tool,it is becoming more important that secure access to sensitive andpersonal information can be provided. Biometrics, the application ofstatistical analysis to identify individuals through their biological orphysiological characteristics, is emerging as a key aspect in newsecurity systems. Using biometrics, it is possible to avoid pitfallsencountered with traditional security systems where users arerequired to keep information, such as passwords, safe [1].
Biometric data can be classified as physiological or behavioral[2]. Physiological data remains stable over time (barring injury),examples include fingerprints [3], iris and retinal scans [4], [5], andhand geometry measurements [6]. Behavioral data may changeover time, typical examples include signatures [7], [8], [9], [10],voice prints [11], [12], and typing styles [13], [14]. Among thesemethods signatures are most likely to be subject to active forgeries.
In this paper, we present an online behavioral biometricverification system that is used in addition to the standardpassword match. The biometric system improves upon the securitylevel provided by password matching while greatly reducing therisk of dictionary-based attacks. The system can be customized tomultiple Internet-based applications requiring secure authentica-tion. The system uses no specialized equipment, requiring only anInternet capable computer with a keyboard, a mouse, and a Javacompliant browser; other systems require specialist equipmentsuch as scanners (e.g., fingerprint, iris, retinal) and microphones.
2 SYSTEM OVERVIEW
The system introduced in this paper uses a hybrid approach toverification, requiring an authenticity confirmation from both atyping style test and a signature match. The first stage of oursystem uses a neural network to verify authenticity based uponkeyboard dynamics of password input [15], [16]; the pattern ofbutton presses as the user enters a password. Using the passwordinput as the source of biometric data means the security benefits ofstandard password verification are enhanced, while placing noincrease upon the user’s cognitive load.
The second stage of the system uses additional neural networksthat verify authenticity based upon an online signature match usingboth temporal and spatial information. Unlike other systems [17],[7], [8], [18], [19], [20], [21], [22], [23], we use the mouse as the inputdevice. Two existing user skills are therefore built upon; mouse use
and signature writing. Although a pen-based system could be moredesirable for ease-of-use this would negate the possibility ofaccessing the system via the Internet using no specialized hardware;a key advantage of the system presented here. Fig. 1a shows thatcomplex signatures may be drawn using the mouse.
By using passwords and signatures to gather biometric data, weavoid negative social stigmas, unlike, for example, fingerprintsystems. In a questionnaire-based study conducted with 35 partici-pants, we determined that 83 percent of people are happy to providesignatures as ameansofverificationandof these 97percentwouldbehappy to provide a signature for use on the Internet.
2.1 System Function
The neural network-based system functions in three distinct modes:registration, training, and verification. During the registrationphase, new users are required to select a username and input achosen password and signature multiple times (40 in our experi-ments). The gathered biometric data is processed to extract salientinformation. The details of the salient information, specifically, thefeature points used for the authentic user are then stored in atemplate file. During the training phase, a novel technique is used togenerate forged samples automatically fromauthentic user samples.These forged samples, together with the authentic user samples, areprovided to a back-propagation neural network, which is trainedand stored upon the server. During verification, the user logs intothe system via an applet that accepts a username, password, andsignature. The user template file, retrieved from the server, containsdetails of the authentic user’s salient features; these features are thenextracted from the input biometric data and sent to the server forneural network verification. Because the template only containsdetails of which features to use, and not the values that they shouldproduce, no clue, neither explicit nor implicit, as to signature shapeis provided. The template may therefore be communicated safelybetween client and server.
2.2 Data Acquisition
Initial data was gathered from an experiment involving 41 parti-cipants between the ages of 20 and 30, with each participantregistering with the system via a Web-based applet from various(uncontrolled) locations. Each of the 41 participants was requestedto register using their own details and also asked to provide a testset of forged samples for a random selection of other users. Thisallowed an assessment of the authentic user consistency levels andthe degree of variation between authentic and impostor samples,to determine uniqueness.
To be truly portable, this system makes minimal assumptionsabout the available technology at the point of use. The main issuesencountered during data analysis relate to the direct reliance uponthe local Java VM (Virtual Machine) to accurately sample informa-tion. At present, the Java VM technology produces inconsistent andnonuniform sampling rates due to its reliance upon the underlyinghardware and software of the client machine. This inconsistencymeans that noise is introduced into any sampled data. This systemhas therefore been designed to be tolerant of this noise by usingneural networks trained with noisy genuine data and appropriatelynoisy automatically generated forged data samples.
2.3 Preprocessing
No two signatures are identical, even when signed by the sameperson. The lengths of the signature trace (in terms of the totalnumber of sampled points N), the spatial size and temporalinformation will all vary. The input signature trace therefore needsto be preprocessed to reduce the effect of these differences and toconvert it into a standard format. Signature traces are preprocessedto normalize the total arc length (disjoint segments are joined toproduce a single continuous arc). Next, the total time taken toproduce the trace is normalized. Finally, the traces are linearly timewarped so that the N points contained in the signature trace arereplaced by N0 temporally equidistant points using the process
1166 IEEE TRANSACTIONS ON PATTERN ANALYSIS AND MACHINE INTELLIGENCE, VOL. 25, NO. 9, SEPTEMBER 2003
. The authors are with the Department of Computer Science, Queen MaryUniversity of London, Mile End Road, London E1 4NS, UK.E-mail: [email protected].
Manuscript received 14 Feb. 2002; revised 5 Aug. 2002; accepted 9 Aug. 2003.Recommended for acceptance by M. Pietikainen.For information on obtaining reprints of this article, please send e-mail to:[email protected], and reference IEEECS Log Number 115896.
0162-8828/03/$17.00 � 2003 IEEE Published by the IEEE Computer Society

described by Lee [18]. This step is necessary because the Java VM is
unable to sample at a constant rate, thus adding excess noise to theinput signature and exaggerating differences in input.
3 INFORMATION EXTRACTION
From the keyboard dynamics of password input, we extract two
complete sets of biometric data; latency times and hold times. Holdtimes represent the length of time each key is held down, whilelatency times indicate the time from releasing one key until pressing
the next. Because these values are to be fed into a neural network fortraining they are normalized by the total time (to type the password)
to prevent network weight saturation during training.It is possible to represent a signature using all information
obtainable from the raw signature trace. This is, however, undesir-
able becausemuchof the datawill not provide a significant degree ofuniqueness or consistency. The usage of such information could,
therefore, prove to be counterproductive. Storing all of the informa-tion is also costly (in terms of space) and has implications for
processing overheads when training networks and verifying
signatures.A signature may be represented by a set of extracted features
rather than all of the raw data. This system adapts a technique usedby Ozcan and Mohan [24], [25] to perform partial spatial shapematching. Using this technique, angle and distance relationshipsbetween internal points, as defined by (3.1), (3.2), and (3.3) andillustrated by Figs. 2a, 2b, 2c, and 2d, are used for representation.
The Euclidean distance, dij, is between two points Si ¼ ðxi; yiÞand Sj ¼ ðxj; yjÞ. N 0 is the number of temporally equidistant pointscontained in the signature after performing linear time warping.
dij ¼ffiffiffiffiffiffiffiffiffiffiffiffiffiffiffiffiffiffiffiffiffiffiffiffiffiffiffiffiffiffiffiffiffiffiffiffiffiffiffiffiffiffiffiffiffixj � xi� �2þ yj � yi
� �2q;
where 0 � i < j � N 0ð Þ _ i ¼ N 0; j ¼ 0ð Þ½ �N 0 ¼ 100:ð3:1Þ
The vector associated with a point, Si, is obtained by thefunction V ðSiÞ, which returns either a vector from the previouspoint to the current, or from the last point to the first in thetrace.
IEEE TRANSACTIONS ON PATTERN ANALYSIS AND MACHINE INTELLIGENCE, VOL. 25, NO. 9, SEPTEMBER 2003 1167
Fig. 1. Typical signatures used in the system. The images above represent typical signatures supplied by the users of our system and manually constructed schematicsshowing stroke sequences used in later testing of the system with forged signatures. The images show that remarkably complex signatures may be input with a mouse.(a) The images show single stroke signatures (first four), multistroke signatures (next three), and picture signatures (remaining two). (b) These images show thesequence of strokes as input by the authentic user.

V ðSiÞ ¼ Si � Si�1; if i > 0V ðSiÞ ¼ Si � SN 0�1; otherwise where S indicates
vector normalization:
ð3:2Þ
The angle, aij, from Sito Sj,where 0 � i; j � N 0 is obtained from the
function A, which returns the clockwise angle between the two
vectors (see Fig. 2d):
aij ¼ AðV ðSiÞ; V ðSjÞÞ where VðSxÞ is defined by ð3:2Þ: ð3:3Þ
Touse the extracted angle anddistance information to characterize a
signature trace, a techniquemust be implemented to obtain both the
salient angle and distance relationships from any input signature.
The techniquemust obtain two sets of signature points (one angle set
and one distance set) from which relationships can be extracted.
This is performed with the intention of minimizing within-class
variance and maximizing between-class variance, where within-
class variance is the degree to which patterns belonging to the same
class differ and between-class variance is the degree to which
patterns belonging to different classes differ. Two approaches used
to extract this information are now presented.
3.1 Ranking Approach
Initial tests used a simple ranking algorithm to extract the most
consistent relationships within the data. The fitness for a relation-
ship between two points Si and Sj is given using the standard
deviation equation defined by (3.4).
fitnessðSi; SjÞ ¼
ffiffiffiffiffiffiffiffiffiffiffiffiffiffiffiffiffiffiffiffiffiffiffiffiffiffiffiffiffiffiffiffiffiffiffiffiffiffiffiffiffiffiffiffiffiffiffiffiffiffiffiffiffiffiffiffiffiffiffiffiffiffiffiffiffiffiffiffiffiffiffiffiffiffiffiffiffiffiffiffiffiffiffiffiffiffiffiffiffiffiffiffinXnk¼0
fðxkÞ2 �Xnk¼0
f xkð Þ !2
0@
1A,nðn� 1Þ;
vuuut ð3:4Þ
where n is the number of signatures input by a specific user duringregistration and fðxkÞ is a function that calculates either thedistance dij (3.1) or angle aij (3.3) between the points Si and Sj (asdefined by (3.1), (3.2), and (3.3) for signature k.
Relationships are ranked in order of fitness and the 10 fittestangle and 10 fittest distance relationships used for signaturerepresentation. Using this technique, the relationships all containtwo points that are too close together, in a temporal sense, toprovide an acceptable level of between-class variance. This occursbecause verification relies too heavily upon spatial matches, whichproved less reliable in tests than spatio-temporal matches.
In order to increase the amount of between-class variance whenobtaining relationships, the fitness function defined by (3.4) wasredefined by (3.5) so that a bias is applied toward points that arefurther apart temporally.
fitnessðSi; SjÞ ¼
ffiffiffiffiffiffiffiffiffiffiffiffiffiffiffiffiffiffiffiffiffiffiffiffiffiffiffiffiffiffiffiffiffiffiffiffiffiffiffiffiffiffiffiffiffiffiffiffiffiffiffiffiffiffiffiffiffiffiffiffiffiffiffiffiffiffiffiffiffiffiffiffiffiffiffiffiffiffiffiffiffiffiffiffiffiffiffiffiffiffinXnk¼0
fðxkÞ2 �Xnk¼0
fðxkÞ !2
0@
1A,nðn� 1Þ
vuuut� ð j� ij j
�N 0Þ;
ð3:5Þ
where jj� ij is the modulus of j� i. N 0 is defined by (3.1) and fðxÞand n are defined by (3.4).
The result of redefining (3.4) is that the identified relationshipsprovide a higher amount of between-class variance, as illustrated
1168 IEEE TRANSACTIONS ON PATTERN ANALYSIS AND MACHINE INTELLIGENCE, VOL. 25, NO. 9, SEPTEMBER 2003
Fig. 2. Extracting relationships from signatures. The above images show how relationships are extracted from an input signature. (a) The input signature as seen by the
user. (b) The input signature trace represented as sampled points; the circles indicate the two points from which an angle is to be extracted, while the squares indicate the
points from which distance information is to be extracted. (c) An expanded view of the region information is to be extracted from. D1 indicates the Euclidean distance vector
between the two points. The two vectors V1 and V2 show the vectors that represent the two points. (d) The clockwise angle between the vectors V1 and V2 is determined.
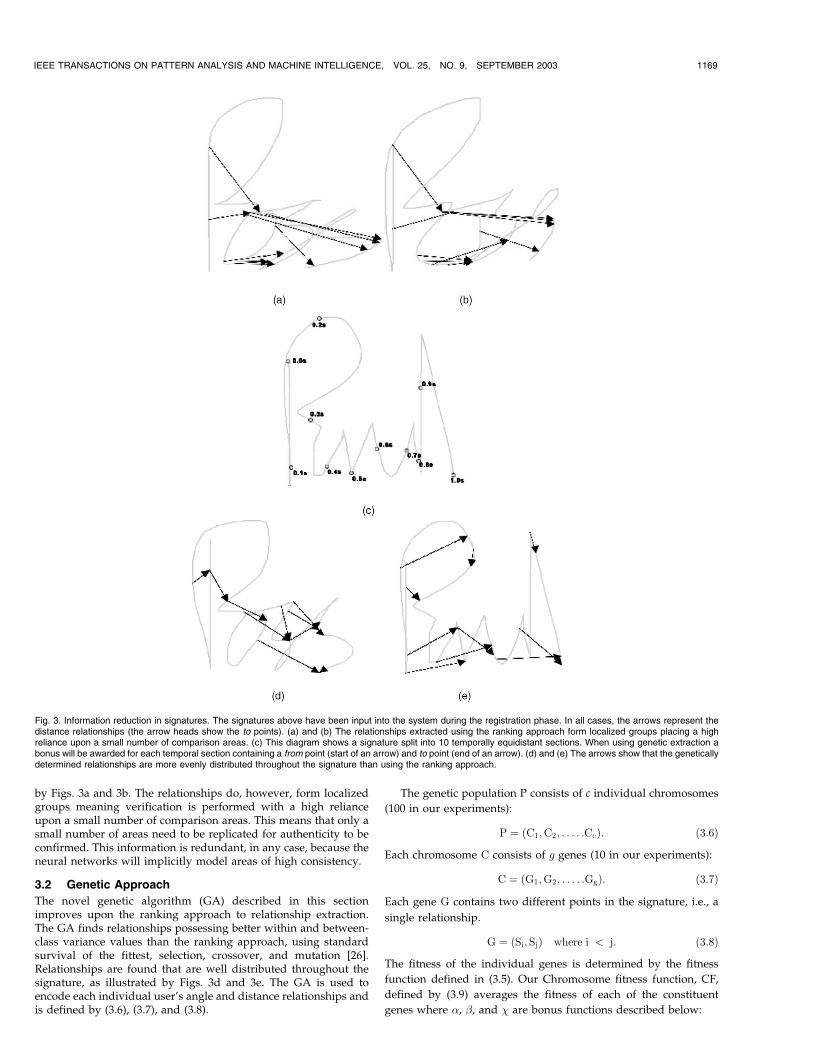
by Figs. 3a and 3b. The relationships do, however, form localizedgroups meaning verification is performed with a high relianceupon a small number of comparison areas. This means that only asmall number of areas need to be replicated for authenticity to beconfirmed. This information is redundant, in any case, because theneural networks will implicitly model areas of high consistency.
3.2 Genetic Approach
The novel genetic algorithm (GA) described in this sectionimproves upon the ranking approach to relationship extraction.The GA finds relationships possessing better within and between-class variance values than the ranking approach, using standardsurvival of the fittest, selection, crossover, and mutation [26].Relationships are found that are well distributed throughout thesignature, as illustrated by Figs. 3d and 3e. The GA is used toencode each individual user’s angle and distance relationships andis defined by (3.6), (3.7), and (3.8).
The genetic population P consists of c individual chromosomes
(100 in our experiments):
P ¼ ðC1;C2; . . . : :CcÞ: ð3:6Þ
Each chromosome C consists of g genes (10 in our experiments):
C ¼ ðG1;G2; . . . : :GgÞ: ð3:7Þ
Each gene G contains two different points in the signature, i.e., a
single relationship.
G ¼ ðSi;SjÞ where i < j: ð3:8Þ
The fitness of the individual genes is determined by the fitness
function defined in (3.5). Our Chromosome fitness function, CF,
defined by (3.9) averages the fitness of each of the constituent
genes where �, �, and � are bonus functions described below:
IEEE TRANSACTIONS ON PATTERN ANALYSIS AND MACHINE INTELLIGENCE, VOL. 25, NO. 9, SEPTEMBER 2003 1169
Fig. 3. Information reduction in signatures. The signatures above have been input into the system during the registration phase. In all cases, the arrows represent thedistance relationships (the arrow heads show the to points). (a) and (b) The relationships extracted using the ranking approach form localized groups placing a highreliance upon a small number of comparison areas. (c) This diagram shows a signature split into 10 temporally equidistant sections. When using genetic extraction abonus will be awarded for each temporal section containing a from point (start of an arrow) and to point (end of an arrow). (d) and (e) The arrows show that the geneticallydetermined relationships are more evenly distributed throughout the signature than using the ranking approach.

CF ¼Xgi¼1
fitnessðGiÞ,
gþ �þ � þ �;where CF g is defined by
ð3:7Þ and fitnessðGiÞ is defined by ð3:5Þ and ð3:8Þ:ð3:9Þ
To determine the bonus values, the signature must first be dividedinto g sections. The bonus functions may then be used to satisfy a setof conditions. Described below are the conditions necessary toextract salient features and the bonus functions used to achieve this.
1. Extracted relationships provide low levels of within-classvariance, as they capture the salient features of the usersignature. The low level of within class variance isprovided by the use of the formula fitnessðGiÞ, whichdetermines the fitness of individual relationships withinthe preprocessed signature trace.
2. The relationships are well-distributed throughout thesignature, maximizing the likelihood of high between-classvariance. This is achieved using functions � and �, whichboth lie in the range {0..1}. Function � returns a bonus of1=g for each section containing a from point (Si inG ¼ ðSi;SjÞ). Function � returns a bonus of 1=g for eachsection containing a to point (Sj in G ¼ ðSi; SjÞ).
3. The chromosome contains consistently fit genes, rather thansome fit and some unfit. This prevents authenticity beingverified based upon inconsistent (unfit) relationships.Function � achieves this goal by penalizing chromosomefitness in proportion to the fitness of the worst gene, usingthe function ðMinð1:0� standard deviationðG0::iÞÞÞ.
4 LEARNING
Any neural network-based verification system requires sufficienttraining data to enable generalization [27]. The authentic user mayprovide positive samples at the registration phase. There are,however, two main problems associated with obtaining false datafrom real people; the authentic user’s password and signaturemust be made available to others and people willing to provide asufficient number of good quality forged samples must be found.
4.1 Profile Space, Boundary Space, and False PatternGeneration
The biometric data obtained from a specific user input resides in asmall sub-space of the entire signature space. It is possible toauthenticate an individual based upon whether their input datafalls within this profile space region; the difficulty for any system,therefore, is determining the size and shape of the authentic user’sprofile space. In this system, the means and standard deviationsextracted from the data supplied at the time of registration (hold/latency times or angle/distance relationships) are used to providean approximate model of the profile space. In each dimensionalplane, we assume a circular distribution; the mean values providethe profile space center, while standard deviation values providethe radius.
The most difficult forgeries to recognize are those that are verysimilar to authentic samples, lying close to the authentic user’sprofile space. Forgeries which reside further from the profile spacecan more easily be rejected by a verification system and need fewertraining examples. In training a high proportion of false sampleslying close to the profile space boundaries, within a boundary spaceregion were used along with a few outlying samples to ensure acorrect modeling of the problem domain. The boundary spaceregion is an enclosing subspace (around the profile space region)whose radius is the same as the profile space radius (in eachdimension) and extends a further distance of 0.25 times therelevant radius. False samples are generated within the boundaryspace using pseudorandom values for each axis, based upon theauthentic user’s characteristic patterns (additional true samples aresimilarly generated within the profile space using the same
technique). Difficult forgeries are generated because they oftenlie outside the profile space in only one dimension.
4.2 Network Training
To perform user verification, this system uses three neuralnetworks each trained using the back-propagation algorithm [27].The first network uses hold and latency times to test typing style,the second and third networks use angle and distance information,respectively, to test the input signature. Separate angle and distancenetworks are used because a combined network could not betrained to correctly model the problem. In order for authenticity tobe verified as genuine, the user input data must pass all three tests.
When performing gradient descent on the networks, it ispossible to overfit a problem such that the network remembersthe input patterns rather than establishing an ability to generalize.The global minima of the training data error surface may provide abad solution here because the input patterns are remembered. Inorder to combat this problem, this system uses a validation setduring training to test for an ability to generalize; gradient descent isperformedwith respect to the training set but the previously unseenvalidation set is used to test for generalization ability. To create thetraining, validation, and testing sets the authentic user data (andautogenerated true data) is split between the three sets. False data isgenerated for each using boundary space generation, with thevalidation and testing sets using a boundary space slightly closer tothe profile space than the training set so that performance andability to generalize is assessed based upon more difficult samples.The proportion of data in the training, validation, and testing sets,respectively, is (3 percent, 27 percent, 70 percent), (15 percent,0 percent, 85 percent), and (4 percent, 0 percent, 96 percent) in theformat (true, true (autogenerated), false (autogenerated)).
The input layer node size for the angle network and the distancenetwork is set at 10 and for the keyboard dynamics’ network is set at((numberof letters inpassword*2) – 1). Theoutput size for eachof thenetworks is 1 (accept or reject supplied credentials). Todetermine thehidden layer size and structure for the networks, we used a geneticalgorithm employing an adaptive multipoint crossover strategycombined with a survival of the fittest mechanism, roulette wheelselection, andmutation operator [26]. TheGA indicated that a singlehidden 20-node layer should be used for the password network. Forthe angle and distance networks, the GA indicated two hiddenlayers, of 30-nodes each, should be used. The network threshold isset to provide a good balance between FAR and FRR (with respectto the testing set). We select the i value that maximizesð1� FAR2
i þ FRR2i Þ, where FARi and FRRi are the FAR and
FRR values obtained when the network is run with threshold i.
5 RESULTS
In this section, the results obtained from this system are presented interms of FAR (False Accept Rate) and FRR (False Reject Rate). FAR isthe rate at which forged samples are accepted as genuine and FRR isthe rate at which genuine samples are rejected as forgeries.
5.1 Experimental Methods
To obtain FRR information users were asked to log into the systemtwice a day for two weeks; at each login session, the users wereallowed five attempts to access the system, if after five attempts theirlogin was unsuccessful, the sessionwas classed as a false reject. Thismethodology is the same as that used by Zwiesele et al. [28].
FAR information was obtained from a group of 41 participants,each of whom was given a copy of the authentic user’s login,password, signature, and stroke sequence (the details of how thesignature was written—see Fig. 1b). None of these would beavailable to genuine forgers. The participants were asked toattempt to fraudulently access the authentic user’s account usingthese details, and if successful, a false accept was recorded. Theexperiment provided a total of 1,500 fraudulent attempts to accessthe 41 genuine accounts.
1170 IEEE TRANSACTIONS ON PATTERN ANALYSIS AND MACHINE INTELLIGENCE, VOL. 25, NO. 9, SEPTEMBER 2003
5.2 System Performance
The FAR results obtained using this system are hereby presented;values for 95 percent confidence intervals are provided in brackets.The system has an overall FAR of 8.5 percent (�4.2 percent) whensignature stroke sequences are supplied (see Fig. 1b) and 7.0 percent(�3.9 percent) if they are not. Using a familiar password and a singleor multistroke signature (which users can fairly easily generate),users can expect an FAR of 4.9 percent (�4.1 percent) if strokesequences are supplied to forgers and 4.4 percent (�3.8 percent) ifthey are not. Using picture signatures (which authentic users foundhard to produce consistently) the FAR increases to 16.3 percent(�11.4 percent) if signature stroke sequences are supplied and12.1 percent (�10.9 percent) if they are not.
A FRRwas recorded for the 41 users who logged into the system20 times over two weeks. This rate varies little irrespective ofsignature type. The overall FRR produced by this system degradesas follows: FRR(5) = 0.2 percent, FRR(4) = 2.4 percent, FRR(3) =7.8 percent, FRR(2) = 21.2 percent, and FRR(1) = 38.6 percent, whereFRR(1) means FRR given one attempt at each login.
6 CONCLUSIONS
This paper has introduced a new approach for providing secureaccess over the Internet using biometric verification. The systemusesa hybrid test to ensure that the set of credentials supplied to thesystem at the login stage are genuine. The system is novel because itis, to the best of the authors’ knowledge, the only mouse-basedInternet signature verification system to bedeveloped at this point intime. The system is specifically designed for use in a potentiallyhostile real world environment with uncontrolled and nonstandardequipment.
The FAR of 4.4 percent produced by this system is extremelyencouraging and compareswellwith figures cited by other specialisttechnology pen-based systems including Higashino (0.61 percent)[10], Martens (1.5 percent) [15], and Hesketh (3.6 percent) [9]. Thekeystroke-based system developed by Robinson [10] quotes an FARof 9 percent. In our system, the FAR for an average user is largelydetermined by the type of the password and signature chosen, agood addition to this systemmay therefore be a complexitymeasureof the input signature that provides an estimation of security levelfed back to the user at the time of registration. This would assist theuser in choosing an appropriate form of their signature for thedesired level of security.
The FAR provided by this system is affected by the type ofpassword chosen by the authentic user (familiar versus randomlyselected). The use of a familiar password provides higher between-class variance and lower within-class variance because users havedeveloped a style and level of consistency of input; however, whenusing a randomly assigned word the input is less fluid and wellpracticed and therefore less unique. This observation highlights theimportance of providing a system that may adapt over time tomodel the improvements in user consistency. Adaptation can beprovided by performing periodic retraining of the entire systemusing data accumulated from successful logins. Alternatively datacould be presented to the trained networks at each successful loginfromwhich an output error is calculated. A single back-propagationpass is then performed, allowing gradual evolution of the networks.
The FRR(5), where FRR(5)means FRR given five attempts at eachlogin, of 0.2 percent provided by this system compares well with thesystems tested by Zwiesele et al. [28] where rates of 65.4 percent and14.5 percent are cited. This system also compares favorably whenfewer than five attempts are allowed at each login.
It is anticipated that the FAR and FRR will decrease as betterhardware (improving sampling consistency) becomes available. Webelieve that by producing forged samples based upon the genera-tion of signature traces rather than relationship values the ratescould be reduced even further. This technique could providesignatures that look like the authentic signatures and so relation-ships could then be extracted based upon within and between-class
variance rather than using empirical values. We also note that this
system allows the threshold to be changed so that greater security or
reduced verification levels are required to allow users into the
system, this is useful as different applications will provide different
security requirements.The results produced by this system are extremely encouraging
and suggest that widespread implementation of the system over
heterogeneous networks should be further investigated. The
system produces good FAR and FRR values even when genuine
passwords, signatures, and stroke sequences are provided to
forgers. Forgers cannot obtain these details from the final system
because only relationships and not the entire signature trace are
stored. The system is likely to benefit from lower skepticism levels
than other biometric systems because familiar tasks are built upon,
thus meaning that a faster deployment time should be possible.
ACKNOWLEDGMENTS
The authors would like to thank the Engineering and Physical
Sciences Research Council (EPSRC) whose funding made this
project possible. Thanks should go to Dr. Janak Sodha for the
information provided upon training neural networks with the use
of a validation set. The authors would also like to thank Andrew
Anderson for the invaluable insight he provided while proof
reading draft copies of this paper and to Christopher Bush for
editing the images published in this paper. The system described
in this paper is the subject of patent protection.
REFERENCES
[1] R. Clarke, “Human Identification in Information Systems: ManagementChallenges and Public Policy Issues,” Information Technology and People,vol. 7, no. 4, pp. 6-37, Dec. 1994.
[2] B. Miller, “Vital Signs of Identity,” IEEE Spectrum, vol. 31, no. 2, pp. 22-30,Feb. 1994.
[3] A. Roddy and J. Stosz, “Fingerprint Features—Statistical Analysis andSystem Performance Estimates,” Proc. IEEE, vol. 85, no. 9, pp. 1390-1422,Sept. 1997.
[4] S. Gordon, “Ocular Biometrics: For Your Eyes Only,” Opto & Laser Europe,no. 84, May 2001.
[5] Y. Zhu, T. Tan, and Y. Wang, “Biometric Personal Identification Based onIris Patterns,” Proc. Int’l Conf. Pattern Recognition, vol. 2, pp. 805-808, 2000.
[6] R. Sanchez-Reillo, C. Sanchez-Avila, and A. Gonzalez-Marcos, “BiometricIdentification through Hand Geometry Measurements,” IEEE Trans. PatternAnalysis and Machine Intelligence, vol. 22, no. 10, pp. 1168-1171, Oct. 2000.
[7] S. Hangai, S. Yamanaka, and T. Hamamoto, “On-Line Signature Verifica-tion Based on Altitude and Direction of Pen Movement,” Proc. IEEE Int’lConf. Multimedia and Expo, vol. 1, pp. 489-492, 2000.
[8] B. Herbst and D. Richards, “On an Automated Signature VerificationSystem,” Proc.IEEE Int’l Symp. Industrial Electronics, vol. 2, pp. 600-604, July1998.
[9] G.B. Hesketh, “Countermatch: A Neural Network Approach to AutomaticSignature Verification,” Proc. IEE Colloquium on Neural Networks forIndustrial Applications, pp. 2/1-2/2, Feb. 1997.
[10] J. Higashino, “Signature Verification System on Neuro-Computer,” Proc.11th IAPR Int’l Conf. Pattern Recognition, vol. III-C, pp. 517-521, 1992.
[11] T. Clarkson et al., “Speaker Identification for Security Systems UsingReinforcement-Trained pRAM,” IEEE Trans. Systems, Man, and CyberneticsPart C: Applications and Reviews, vol. 31, no. 1, pp. 65-76, Feb. 2001.
[12] M. George and R. King, “A Robust Speaker Verification Biometric,” Proc.IEEE 29th Ann. Int’l Carnahan Conf. Security Technology, pp. 41-46, 1995.
[13] S. Haider, A. Abbas, and A. Zaidi, “A Multi-Technique Approach for UserIdentification through Keystroke Dynamics,” Proc. IEEE Int’l Conf. Systems,Man, and Cybernetics, vol. 2, pp. 1336-1341, 2000.
[14] Z. Changshui and S. Yanhua, “AR Model for Keystroker Dynamics,” Proc.IEEE Int’l Conf. Systems, Man, and Cybernetics, vol. 4, pp. 2887-2890, 2000.
[15] J.A. Robinson, “Computer User Verification Using Login String KeystrokeDynamics,” IEEE Trans. Systems, Man, and Cybernetics, Part A: Systems andHumans, vol. 28, no. 2, pp. 236-241, Mar. 1998.
[16] S.A. Bleha and M.S. Obaidat, “Dimensionality Reduction and FeatureExtraction Applications in Identifying Computer Users,” IEEE Trans.Sys-tems, Man, and Cybernetics, vol. 21, no. 2, pp. 452-456, Mar./Apr. 1991.
[17] J. Brault and R. Plamondon, “Segmenting Handwritten Signatures at TheirPerceptually Important Points,” IEEE Trans. Pattern Analysis and MachineIntelligence, vol. 15, no. 9, pp. 953-957, Sept. 1993.
[18] L. Lee, “Neural Approaches for Human Signature Verification,” Proc. ThirdInt’l Conf. Document Analysis and Recognition, vol. 2 pp. 1055-1058, 1995.
IEEE TRANSACTIONS ON PATTERN ANALYSIS AND MACHINE INTELLIGENCE, VOL. 25, NO. 9, SEPTEMBER 2003 1171

[19] R. Martens and L. Claesen, “Automatic On-Line Signature Verification:Discrimination Emphasised,” Proc. Fourth Int’l Conf. Document Analysis andRecognition, pp. 657-660, 1997.
[20] M. Mingming and W. Wijesoma, “On-Line Signature Verification Based onMultiple Models,” Proc. IEEE/IAFE/INFORMS Conf. Computational Intelli-gence for Financial Eng., pp. 30-33, Mar. 2000.
[21] T. Wessels and C. Omlin, “A Hybrid System for Signature Verification,”Proc. South African Telecommunications Networks and Applications Conf.,pp. 5509-5514, 2000.
[22] Y. Xuhua et al., “A Study on Signature Verification Using a New Approachto Genetic Based Machine Learning,” Proc. IEEE Int’l Conf. IntelligentSystems for the 21st Century, vol. 5, pp. 4383-4386, Oct. 1995.
[23] K. Yue and W. Wijesome, “Improved Segmentation and SegmentAssociation for On-Line Signature Verification,” Proc. IEEE Int’l Conf.Systems, Man, and Cybernetics, vol. 4, pp. 2752-2756, Oct. 2000.
[24] E. Ozcan and C. Mohan, “Shape Recognition Using Genetic Algorithms,”Proc. IEEE Int’l Conf. Evolutionary Computation, pp. 414-420, May 1996.
[25] E. Ozcan and C. Mohan, “Steady State Memetic Algorithm for Partial ShapeMatching,” Proc. IEEE Seventh Ann. Conf. Evolutionary Programming, pp. 527-536, Mar. 1998.
[26] D. Goldberg, Genetic Algorithms in Search: Optimisation and Machine Learning.Reading, Mass.: Addison Wesley, 1989.
[27] C.M. Bishop, Neural Networks for Pattern Recognition, New York: OxfordUniv. Press, pp. 332-340, 1995.
[28] A. Zwieseleet, A. Munde, C. Busch, and H. Daum, “Comparative Study ofBiometric Identification Systems,” Proc. 34th Ann. IEEE Int’l Carnahan Conf.Security Technology, pp. 60-63, 2000.
. For more information on this or any other computing topic, please visit ourDigital Library at http://computer.org/publications/dlib.
1172 IEEE TRANSACTIONS ON PATTERN ANALYSIS AND MACHINE INTELLIGENCE, VOL. 25, NO. 9, SEPTEMBER 2003