jardine cycle & carriage limited 2018 first … fileastra’s contribution of us$177 million to...
TRANSCRIPT

- more -
26th April 2018 JARDINE CYCLE & CARRIAGE LIMITED 2018 FIRST QUARTER FINANCIAL STATEMENTS AND DIVIDEND ANNOUNCEMENT Highlights
Underlying earnings per share up 8%
Astra’s contribution slightly down year-on-year
Higher results from Direct Motor Interests and Other Strategic Interests
“Astra is continuing to benefit from stable coal prices, although the car market is increasingly competitive. While the Group’s Direct Motor Interests are also likely to continue to face challenges, its Other Strategic Interests are expected to produce growth. Overall, the current outlook for the full year is for a satisfactory performance.” Ben Keswick, Chairman 26th April 2018
Group Results
Three months ended 31st March
2018 US$m
Restated(1) 2017
US$m
Change
%
2018 S$m
Revenue 4,643 4,149 12 6,112
Profit after tax (2) 412 472 -13 542
Underlying profit attributable to
shareholders 219 202 8 288
Profit attributable to shareholders(2) 135 212 -36 178
US¢ US¢ S¢
Underlying earnings per share 55 51 8 73
Earnings per share 34 54 -36 45
At
31.3.2018
At
31.12.2017
At
31.3.2018
US$m US$m S$m
Shareholders’ funds 6,545 6,408 2 8,588
US$ US$ S$
Net asset value per share 16.56 16.21 2 21.7 The exchange rate of US$1=S$1.31 (31st December 2017: US$1=S$1.34) was used for translating assets and liabilities at the balance sheet date and US$1=S$1.32 (31st March 2017: US$1=S$1.41) was used for translating the results for the period. The financial results for the three months ended 31st March 2018 and 31st March 2017 have been prepared in accordance with International Financial Reporting Standards. These results have not been audited or reviewed by the auditors. (1) The accounts have been restated due to the adoption of IFRS 9 “Financial Instruments” and IFRS 15
“Revenue Contracts with Customers”, as set out in note 1 to the financial statements. (2) Includes changes in fair value of the Group’s investments in equity instruments under IFRS 9
Jardine Cycle & Carriage Limited
239 Alexandra Road
Singapore 159930
Tel (65) 6473 3122 Fax (65) 6475 7088
www.jcclgroup.com

- more -
Page 2 CHAIRMAN’S STATEMENT Overview The Group reported improved results in the first quarter of 2018 as a lower contribution from Astra was offset by higher contributions from the Group’s Direct Motor Interests and Other Strategic Interests. Performance The Group’s revenue for the three months ended 31st March was 12% higher at US$4.6 billion. Underlying profit attributable to shareholders grew 8% to US$219 million, and underlying profit per share was 8% higher at US¢55 per share. Profit attributable to shareholders was US$135 million, compared to US$212 million in the equivalent period last year, following the recognition of fair value losses on the adoption of new accounting standards. Astra’s contribution of US$177 million to the Group’s underlying profit was 4% down. Underlying profit from the Group’s Direct Motor Interests was 23% higher at US$28 million, while the Group’s Other Strategic Interests made a contribution of US$10 million. The Group’s consolidated net debt, excluding Astra’s financial services subsidiaries, was US$1.4 billion at the end of March 2018, compared to US$819 million at the prior year end. The increase was primarily due to Astra’s toll road and GO-JEK investments and capital expenditure in its mining contracting business, together with the investments by the Group in Toyota Motor Corporation and other associates and joint ventures. The net debt of the Company increased to US$1.3 billion, from US$1.2 billion at the end of 2017. Net debt within Astra’s financial services subsidiaries of US$3.3 billion was slightly down from the prior year end. The Board has not declared a dividend for the three months ended 31st March 2018 (31st March 2017: Nil). Astra Astra reported a net profit equivalent to US$365 million, under Indonesian accounting standards, 2% lower in its local currency terms, as lower results were experienced in some of its business segments, particularly in automotive and agribusiness, which more than offset the improved performance from its heavy equipment, mining, construction and energy business. Automotive
Net income from the group’s automotive division was down by 8% at US$155 million, mainly due to increased competition in the car segment. The wholesale market for cars grew by 3% to 292,000 units. Astra’s car sales were, however, 12% lower at 142,000 units due to the impact of intense competition which resulted in a decline in market share from 57% to 49%. The group launched seven new models and two revamped models during the period. The wholesale market for motorcycles increased by 4% to 1.5 million units. Astra Honda Motor’s domestic sales were flat at 1.1 million units, mainly due to inventory management ahead of several key model launches, which resulted in its market share decreasing from 77% to 73%. The group launched one new model and five revamped models during the period.

- more -
Page 3 Astra Otoparts, the group’s components business, reported net income which was 1% lower at US$11 million, despite an 11% increase in revenue. The decline in net income was mainly due to reduced contributions from its joint venture and associate companies, which were impacted by forex translation losses. Financial Services
Net income from the group’s financial services division decreased by 6% to US$78 million, due to a lower contribution from Permata Bank.
The group’s consumer finance businesses saw a 5% decrease in the amount financed. The contribution from the group’s car-focused finance companies decreased by 17% to US$17 million mainly due to increased loan loss provisions in the low cost car segment. Motorcycle-focused Federal International Finance’s net income was up 22% at US$40 million, mainly due to a larger loan portfolio.
The amount financed through the group’s heavy equipment-focused finance operations decreased by 35% to US$62 million, mainly due to reduced lending to small and medium-sized borrowers.
Permata Bank, in which Astra holds a 44.6% interest, reported net income of US$12 million, compared to US$34 million recorded in the first quarter of last year. The results benefited from a one-off gain on the sale of non-performing loans. Excluding this one-off gain, the bank’s net income would have increased mainly driven by lower loan impairment costs which fell from US$50 million in the first quarter last year to US$34 million in this first quarter. The bank’s gross and net non-performing loan ratios at the end of March 2018 were relatively stable at 4.6% and 1.7%, respectively.
Asuransi Astra Buana, the group’s general insurance company, reported net income 15% higher at US$18 million, due to increased investment income. During the period, the group’s life insurance joint venture, Astra Aviva Life, acquired more than 78,000 new individual life customers and 411,000 new participants for its corporate employee benefits programmes.
Heavy Equipment, Mining, Construction and Energy
Net income from the group’s heavy equipment, mining, construction and energy division increased by 68% to US$111 million.
United Tractors, which is 59.5%-owned, reported net income 69% higher at US$186 million. The increase was mainly due to improved performances in its construction machinery and mining contracting businesses, as well as its mining operations, as a result of increased coal prices.
In its construction machinery business, Komatsu heavy equipment sales were up 38% at 1,171 units, while parts and service revenues were also higher. The mining contracting operations of Pamapersada Nusantara recorded a 6% higher coal production at 26.5 million tonnes and 22% higher overburden removal at 207 million bank cubic metres. United Tractors’ mining subsidiaries reported 36% higher coal sales at 2.6 million tonnes.
In the first quarter of 2018, Suprabari Mapanindo Mineral, United Tractors’ 80.1%-owned coking coal company which became operational in late 2017, achieved coal sales at 111,000 tonnes. General contractor Acset Indonusa, a 50.1% subsidiary of United Tractors, reported net income up 27% at US$3 million due to higher revenue mainly from its infrastructure construction projects.

- more -
Page 4 Agribusiness Net income from the group’s agribusiness division was down by 55% at US$21 million. Astra Agro Lestari, which is 79.7%-owned, reported net income 55% lower at US$26 million, primarily due to lower crude palm oil prices. Achieved average crude palm oil prices were 12% lower at Rp7,855/kg, while sales of crude palm oil and its derivatives were 17% higher at 480,000 tonnes. Infrastructure and Logistics The group’s infrastructure and logistics division reported a net loss of US$2 million, compared with a net profit of US$5 million in the first quarter of 2017, as results were affected by initial losses on the Cikopo-Palimanan toll road acquired in the first half of 2017. The group’s portfolio of toll road interests totals 353km, of which 269km is operational. At the mature 72.5km Tangerang-Merak toll road, operated by 79.3%-owned Marga Mandalasakti, toll revenue increased by 14% to US$19 million. At the wholly-owned 40.5km Jombang-Mojokerto toll road, 39.6km became fully operational in September 2017 and recorded US$3 million of toll revenue during the first quarter of 2018. Toll revenue at the 45%-owned 116.8km Cikopo-Palimanan increased by 4% to US$22 million. At the 40%-owned 72.6km Semarang-Solo toll road, of which 40.1km is now in operation, toll revenue was US$4 million, 36% higher than the comparable period last year. The group also has a 40% stake in the 11.2km Kunciran-Serpong toll road and a 25% stake in the 39.8km Serpong-Balaraja toll road, both of which are under development. Serasi Autoraya’s net income increased by 47% to US$4 million, due to higher net margins in its car leasing and rental businesses, despite a 4% decline in vehicles under contract. Information Technology Net income from the group’s information technology division was 4% higher at US$2 million. Astra Graphia, which is 76.9%-owned, reported net income higher at US$3 million due to higher revenues across all its business segments. Property The group’s property division reported a marginal net income compared to a net income of US$3 million in the prior year, primarily due to lower development earnings recognised from its Anandamaya Residences project. Arumaya, the group’s 60%-held residential development project located in South Jakarta, commenced marketing in March 2018 and is scheduled for completion in 2022. 50%-owned Astra Land which owns 67% of Astra Modern Land, is in the process of developing a 67-hectare site in East Jakarta and started marketing activities for its first two clusters of landed houses during the first quarter of 2018. Direct Motor Interests The Group’s Direct Motor Interests contributed an underlying profit of US$28 million, 23% above the previous year.

- more -
Page 5 Cycle & Carriage Singapore’s profit rose as margins improved on passenger cars as well as increased contributions from used cars and parts trading. In Malaysia, Cycle & Carriage Bintang recorded a loss despite higher unit sales, mainly due to higher operating expenses and financing costs. In Indonesia, Tunas Ridean’s contribution was higher following stronger performances from its motor vehicle and motorcycle sales operations and from Mandiri Tunas Finance, partly offset by a lower profit from its rental business. In Vietnam, Truong Hai Auto Corporation’s (“Thaco”) contribution increased year-on-year, as the comparable results were negatively affected by stock provisions. Thaco’s sales were higher in the first three months of 2018, as the full impact of the removal of CBU import tariffs in January 2018 has yet to be felt, and margins remained stable. In March 2018, the Group increased its shareholding in Tunas Ridean from 44.37% to 45.12%. Other Strategic Interests As in the previous year, the Group did not recognise any contribution in the first quarter from its 25.54% holding in Siam City Cement Public Company in Thailand and its 24.65% holding in Refrigeration Electrical Engineering Corporation (“REE Corp”) in Vietnam, as both companies have yet to announce their first quarter results. Together these results are not expected to have a material impact on the Group, and will be accounted for in the second quarter. The Group recognised dividend income of US$9 million in the first quarter from its 10% interest in Vinamilk, which was acquired in November 2017. Since the beginning of the year, the Group has increased its shareholding in REE Corp from 23.91% to 24.65%. The Group also invested US$200 million in shares of Toyota Motor Corporation, which is an important long-standing business partner of Astra. Outlook Astra is continuing to benefit from stable coal prices, although the car market is increasingly competitive. The Group’s Direct Motor Interests are likely to continue to face challenges, while its Other Strategic Interests are expected to produce growth. Overall, the current outlook for the full year is for a satisfactory performance. Ben Keswick, Chairman 26th April 2018

- more -
Page 6 Statement pursuant to Rule 705(5) of the Listing Manual The directors confirm that, to the best of their knowledge, nothing has come to the attention of the Board of Directors which may render the accompanying unaudited interim financial results for the three months ended 31st March 2018 to be false or misleading in any material respect. On behalf of the Directors Ben Keswick Director Hassan Abas Director 26th April 2018

- more -
Page 7
Jardine Cycle & Carriage Limited Consolidated Profit and Loss Account for the three months ended 31st March 2018
Restated
2018 2017 Change
Note US$m US$m %
Revenue 4,643.2 4,148.7 12
Net operating costs 2 (4,211.6) (3,723.2) 13
Operating profit 2 431.6 425.5 1
Financing income 22.4 27.9 -20
Financing charges (47.6) (38.4) 24
Net financing charges (25.2) (10.5) 140
Share of associates’ and joint
ventures’ results after tax 126.2 155.8 -19
Profit before tax 532.6 570.8 -7
Tax 3 (120.8) (99.0) 22
Profit after tax 411.8 471.8 -13
Profit attributable to:
Shareholders of the Company 135.4 211.7 -36
Non-controlling interests 276.4 260.1 6
411.8 471.8 -13
US¢ US¢
Earnings per share 4 34 54 -36

- more -
Page 8
Jardine Cycle & Carriage Limited Consolidated Statement of Comprehensive Income for the three months ended 31st March 2018
Restated 2018 2017 US$m US$m Profit for the period 411.8 471.8 Items that will not be reclassified to profit or loss:
Remeasurements of defined benefit pension plans (1.0) 0.9 Tax on items that will not be reclassified 0.2 (0.2) Share of other comprehensive income/(expense) of associates
and joint ventures, net of tax 0.6 (0.7)
(0.2) - Items that may be reclassified subsequently to profit or loss:
Translation difference - gain/(loss) arising during the period (134.7) 123.6 Financial assets at FVOCI
1
- gain/(loss) arising during the period (3.3) 6.7 - transfer to profit and loss (1.4) - Cash flow hedges - loss arising during the period (0.1) (21.3) - transfer to profit and loss 0.3 4.3 Tax relating to items that may be reclassified 0.1 4.1 Share of other comprehensive income/(expense) of associates
and joint ventures, net of tax 27.8 (1.2) (111.3) 116.2
Other comprehensive income/(expense) for the period (111.5) 116.2
Total comprehensive income for the period 300.3 588.0
Attributable to: Shareholders of the Company 107.4 278.8 Non-controlling interests 192.9 309.2
300.3 588.0
(1)
Fair value through other comprehensive income (“FVOCI”)

- more -
Page 9 Jardine Cycle & Carriage Limited Consolidated Balance Sheet at 31st March 2018
Restated Restated At At At Note 31.3.2018 31.12.2017 1.1.2017 US$m US$m US$m
Non-current assets Intangible assets 1,068.7 1,079.5 972.3 Leasehold land use rights 608.0 625.0 620.4 Property, plant and equipment 3,484.4 3,410.2 2,978.5 Investment properties 619.4 618.6 460.2 Bearer plants 493.6 498.0 496.8 Interests in associates and joint ventures 4,286.5 4,274.3 3,738.5 Non-current investments 2,342.9 1,973.3 487.8 Non-current debtors 2,759.0 2,827.1 2,691.6 Deferred tax assets 327.7 322.2 291.7
15,990.2 15,628.2 12,737.8
Current assets Current investments 18.6 22.7 65.2 Properties for sale 251.7 254.0 - Stocks 1,619.6 1,723.8 1,578.6 Current debtors 5,491.4 5,072.8 4,604.1 Current tax assets 129.6 120.5 136.9 Bank balances and other liquid funds
- non-financial services companies 2,321.7 2,398.7 2,237.2 - financial services companies 231.5 241.1 228.5
2,553.2 2,639.8 2,465.7
10,064.1 9,833.6 8,850.5
Total assets 26,054.3 25,461.8 21,588.3
Non-current liabilities Non-current creditors 167.9 170.8 156.7 Provisions 117.3 113.7 97.6 Long-term borrowings 5
- non-financial services companies 1,249.3 845.8 349.9 - financial services companies 1,600.7 1,486.7 1,517.5
2,850.0 2,332.5 1,867.4 Deferred tax liabilities 211.9 212.9 188.0
Pension liabilities 265.9 262.2 215.9
3,613.0 3,092.1 2,525.6
Current liabilities Current creditors 4,077.8 4,223.5 3,363.6 Provisions 90.9 87.2 85.7 Current borrowings 5
- non-financial services companies 2,445.0 2,371.7 1,178.6 - financial services companies 1,885.7 2,154.1 2,264.6
4,330.7 4,525.8 3,443.2 Current tax liabilities 180.7 135.4 95.7
8,680.1 8,971.9 6,988.2
Total liabilities 12,293.1 12,064.0 9,513.8
Net assets 13,761.2 13,397.8 12,074.5
Equity Share capital 6 1,381.0 1,381.0 1,381.0 Revenue reserve 7 6,312.4 6,147.2 5,515.6 Other reserves 8 (1,148.4) (1,120.1) (1,142.5)
Shareholders' funds 6,545.0 6,408.1 5,754.1 Non-controlling interests 9 7,216.2 6,989.7 6,320.4
Total equity 13,761.2 13,397.8 12,074.5

- more -
Page10
Jardine Cycle & Carriage Limited Consolidated Statement of Changes in Equity for the three months ended 31st March 2018
Attributable to shareholders of the Company
Attributable Asset Fair value to non- Share Revenue revaluation Translation and other controlling Total capital reserve reserve reserve reserves Total interests equity US$m US$m US$m US$m US$m US$m US$m US$m 2018
Balance at 1st January 1,381.0 6,012.8 402.4 (1,521.7) 152.4 6,426.9 7,014.1 13,441.0
Effect of adoption of IFRS 9 and IFRS 15 - 160.9 - - (153.4) 7.5 14.3 21.8
Balance as at 1st January as restated 1,381.0 6,173.7 402.4 (1,521.7) (1.0) 6,434.4 7,028.4 13,462.8
Total comprehensive income - 135.5 - (33.7) 5.6 107.4 192.9 300.3
Dividends paid to non-controlling interests - - - - - - (25.3) (25.3)
Capital contribution by non-controlling interests - - - - - - 17.3 17.3
Change in shareholding - - - - - - 2.9 2.9
Other - 3.2 - - - 3.2 - 3.2
Balance at 31st March 1,381.0 6,312.4 402.4 (1,555.4) 4.6 6,545.0 7,216.2 13,761.2
2017
Balance at 1st January 1,381.0 5,508.7 400.4 (1,546.7) 11.2 5,754.6 6,321.8 12,076.4 Effect of adoption of IFRS 9 and IFRS 15 - 6.9 - - (7.4) (0.5) (1.4) (1.9)
Balance as at 1st January as restated 1,381.0 5,515.6 400.4 (1,546.7) 3.8 5,754.1 6,320.4 12,074.5 Total comprehensive income - 211.6 - 70.5 (3.3) 278.8 309.2 588.0 Dividends paid to non-controlling interests - - - - - - (7.0) (7.0) Acquisition of subsidiary - - - - - - 6.6 6.6 Other - - - - - - (0.8) (0.8)
Balance at 31st March 1,381.0 5,727.2 400.4 (1,476.2) 0.5 6,032.9 6,628.4 12,661.3

- more -
Page 11
Jardine Cycle & Carriage Limited Company Balance Sheet at 31st March 2018
Restated At At At Note 31.3.2018 31.12.2017 1.1.2017 US$m US$m US$m Non-current assets Property, plant and equipment 35.1 34.6 32.0 Interests in subsidiaries 1,413.9 1,325.6 1,226.6 Interests in associates and joint ventures 1,006.5 983.9 776.7 Non-current investment 185.1 - 11.0
2,640.6 2,344.1 2,046.3
Current assets Current debtors 1,226.7 1,403.6 42.8 Bank balances and other liquid funds 96.6 96.5 154.1
1,323.3 1,500.1 196.9
Total assets 3,963.9 3,844.2 2,243.2
Non-current liabilities Deferred tax liabilities 6.3 6.2 5.6
6.3 6.2 5.6
Current liabilities Current creditors 78.1 80.8 20.5 Current borrowings 1,347.1 1,262.8 - Current tax liabilities 1.8 1.7 1.7
1,427.0 1,345.3 22.2
Total liabilities 1,433.3 1,351.5 27.8
Net assets 2,530.6 2,492.7 2,215.4
Equity Share capital 6 1,381.0 1,381.0 1,381.0 Revenue reserve 7 745.4 754.6 658.9 Other reserves 8 404.2 357.1 175.5
Total equity 2,530.6 2,492.7 2,215.4
Net asset value per share US$6.40 US$6.31 US$5.61

- more -
Page 12 Jardine Cycle & Carriage Limited Company Statement of Comprehensive Income for the three months ended 31st March 2018
2018 2017 US$m US$m Loss for the period (9.2) (0.3)
Items that may be reclassified subsequently to profit or loss:
Translation difference
- gain arising during the period 47.1 74.1
Other comprehensive income for the period 47.1 74.1
Total comprehensive income for the period 37.9 73.8

- more -
Page 13 Jardine Cycle & Carriage Limited Company Statement of Changes in Equity for the three months ended 31st March 2018
Share capital
Revenue reserve
Translation reserve
Fair value reserve
Total equity
US$m US$m US$m US$m US$m
2018
Balance at 1st January 1,381.0 754.6 357.1 - 2,492.7
Total comprehensive income - (9.2) 47.1 - 37.9
Balance at 31st March 1,381.0 745.4 404.2 - 2,530.6
2017
Balance at 1st January 1,381.0 654.2 175.5 4.7 2,215.4 Effect of adoption of IFRS 9
-
4.7
-
(4.7)
-
Balance as at 1st January as restated
1,381.0 658.9 175.5 - 2,215.4
Total comprehensive income - (0.3) 74.1 - 73.8
Balance at 31st March 1,381.0 658.6 249.6 - 2,289.2

- more -
Page 14
Jardine Cycle & Carriage Limited Consolidated Statement of Cash Flows for the three months ended 31st March 2018
Restated
2018 2017
Note US$m US$m
Cash flows from operating activities
Cash generated from operations 10 513.3 405.4
Interest paid (31.2) (29.1)
Interest received 22.9 25.4
Other finance costs paid (14.8) (18.4)
Income tax paid (93.9) (63.1)
(117.0) (85.2)
Net cash flows from operating activities 396.3 320.2
Cash flows from investing activities
Sale of property, plant and equipment 3.4 2.6
Sale of investments 77.3 6.0
Sale of leasehold land use rights 12.0 1.5
Sale of subsidiaries, net of cash disposed 0.2 -
Purchase of intangible assets (18.8) (17.7)
Purchase of leasehold land use rights (1.3) (13.6)
Purchase of property, plant and equipment (238.5) (176.2)
Purchase of investment properties (17.9) (25.7)
Additions to bearer plants (9.7) (9.6)
Purchase of subsidiaries, net of cash acquired (85.5) (8.4)
Purchase of shares in associates and joint ventures (99.8) (411.0)
Purchase of investments (456.0) (14.0)
Dividends received from associates and joint ventures (net) 5.2 7.3
Net cash flows used in investing activities (829.4) (658.8)
Cash flows from financing activities
Drawdown of loans 1,155.3 1,163.1
Repayment of loans (780.8) (725.1)
Changes in controlling interests in subsidiaries 2.9 -
Investment by/(payment to) non-controlling interests 17.3 (0.8)
Dividends paid to non-controlling interests (25.3) -
Net cash flows from financing activities 369.4 437.2
Net change in cash and cash equivalents (63.7) 98.6
Cash and cash equivalents at the beginning of the period 2,639.8 2,465.7
Effect of exchange rate changes (22.9) 25.9 Cash and cash equivalents at the end of the period 2,553.2 2,590.2

- more -
Page 15
Jardine Cycle & Carriage Limited Notes to the financial statements for the three months ended 31st March 2018
1 Basis of preparation
The financial statements are consistent with those set out in the 2017 audited accounts which have been prepared in accordance with International Financial Reporting Standards (“IFRS”). There have been no changes to the accounting policies described in the 2017 audited accounts except for the adoption of the following new standards, which are effective from 1st January 2018.
IFRS 9 Financial Instruments IFRS 15 Revenue from Contracts with Customers
Under IFRS 9, the gains and losses arising from changes in fair value of the Group’s investments in equity instruments, previously classified as available-for-sale, will be recognised in profit and loss, instead of through other comprehensive income. Such fair value gains or losses on revaluation of these investments will be classified as non-trading items, and hence will not have any impact on the Group’s underlying profit attributable to shareholders. The forward-looking expected credit loss model will affect mainly the loan impairment provisions of the Group’s financial services companies in Indonesia. The new hedge accounting rules will align the accounting for hedging instruments closely with the Group’s risk management practices, but have no significant impact on the Group’s results. The adoption of IFRS 9 has been accounted for retrospectively and the comparative financial statements have been restated. The adoption has resulted in an increase in the profit attributable to shareholders for the financial period 3 months ended 31st March 2017 by US$1.3 million and a decrease in shareholders’ funds as at 31st December 2017 by US$16.4 million. IFRS 15 establishes a comprehensive 5-step framework for the recognition of revenue which replaces IAS 11 “Construction Contracts” and IAS 18 “Revenue” which covers contracts for goods and services. The core principle in the framework is that revenue is recognised when control of a good or service transfers to a customer. It provides clarification on recognition criteria for certain revenue elements, resulting in restatements to revenue and net operating costs, respectively. The adoption of IFRS 15 has been accounted for retrospectively and the comparative financial statements have been restated. The adoption has no significant impact on the Group’s profit or underlying profit attributable to shareholders, but resulted in a decrease in shareholders’ funds as at 31st December 2017 by US$2.4 million.
The preparation of financial statements in conformity with IFRS requires the use of certain critical accounting estimates. It also requires management to exercise its judgment in the process of applying the Group’s accounting policies. Estimates and judgments used in preparing the financial statements are regularly evaluated and are based on historical experience and other factors, including expectations of future events that are believed to be reasonable under the circumstances. The resulting accounting estimates will, by definition, seldom equal the related actual results. The exchange rates used for translating assets and liabilities at the balance sheet date are US$1= S$1.3122 (2017: US$1=S$1.337), US$1= RM3.8663 (2017: US$1= RM4.065), US$1= IDR13,756 (2017: US$1=IDR13,548), US$1= VND22,808 (2017: US$1= VND22,704) and US$1= THB31.2640 (2017: US$1=THB32.6890). The exchange rates used for translating the results for the period are US$1= S$1.3164 (2017: US$1=S$1.4098), US$1= RM3.8968 (2017: US$1= RM4.4334), US$1= IDR13,625 (2017: US$1= IDR13,342), US$1=VND22,758 (2017: US$1= VND22,705) and US$1= THB31.3743 (2017: US$1= THB34.8873).

- more -
Page 16 2 Net operating costs and operating profit
Group
Restated
Three months ended 31st March 2018 2017 Change
US$m US$m %
Cost of sales (3,740.9) (3,337.2) 12
Other operating income 85.9 54.6 57
Selling and distribution expenses (207.3) (196.2) 6
Administrative expenses (252.8) (231.0) 9
Other operating expenses (96.5) (13.4) 620
Net operating costs (4,211.6) (3,723.2) 13
Operating profit is determined after including:
Depreciation of property, plant and equipment (139.5) (122.5) 14
Depreciation of bearer plants (6.3) (5.8) 9
Amortisation of leasehold land use rights and intangible assets (26.0) (24.7) 5
Fair value changes of :
- agricultural produce 0.1 - nm
- other investments (1)
(83.3) 2.8 nm
Profit/(loss) on disposal of:
- property, plant and equipment 0.7 0.7 -
- leasehold land use rights 0.2 1.2 -83
- other investments 1.4 - nm
Loss on disposal/write-down of repossessed assets (14.2) (14.0) 1
Dividend and interest income from investments (2)
19.8 9.7 104
Write-down of stocks (4.2) (1.1) 282
Impairment of debtors (36.0) (36.9) -2
Net exchange gain/loss (3)
23.4 (3.6) nm
nm – not meaningful (1)
Fair value loss in 2018 relates mainly to equity investment in Vinamilk and Toyota Motor Corporation (2)
Increase due to dividend from the Vinamilk which was only acquired in 4Q 2017 (3)
Net exchange gain in 2018 relates mainly to the impact of stronger Singapore dollars on monetary liabilities denominated in USD

- more -
Page 17
3 Tax
The provision for income tax is based on the statutory tax rates of the respective countries in which the companies operate after taking into account non-deductible expenses and group tax relief.
4 Earnings per share Group
Restated Three months ended 31st March 2018 2017 US$m US$m Basic and diluted earnings per share Profit attributable to shareholders 135.4 211.7 Weighted average number of ordinary shares in issue (millions) 395.2 395.2
Basic earnings per share US¢34 US¢54
Diluted earnings per share US¢34 US¢54
Basic and diluted underlying earnings per share Underlying profit attributable to shareholders 219.0 202.0 Weighted average number of ordinary shares in issue (millions) 395.2 395.2
Basic earnings per share US¢55 US¢51
Diluted earnings per share US¢55 US¢51 As at 31st March 2017 and 2018, there were no dilutive potential ordinary shares in issue. A reconciliation of the profit attributable to shareholders and underlying profit attributable to shareholders is as follows:
Group Restated Three months ended 31st March 2018 2017 US$m US$m Profit attributable to shareholders 135.4 211.7 Less: Non-trading item (net of tax and non-controlling interests)
Gain on valuation at fair value of an investment held by an associate - 8.4 Fair value changes of agriculture produce 0.1 - Fair value changes of other investments (83.7) 1.3
(83.6) 9.7
Underlying profit attributable to shareholders 219.0 202.0
5 Borrowings
Group At At 31.3.2018 31.12.2017
US$m US$m Long-term borrowings: - secured 1,564.6 1,509.7 - unsecured 1,285.4 822.8
2,850.0 2,332.5
Current borrowings: - secured 1,658.0 1,640.9 - unsecured 2,672.7 2,884.9
4,330.7 4,525.8
Total borrowings 7,180.7 6,858.3
Certain subsidiaries of the Group have pledged their assets in order to obtain bank facilities from financial institutions. The value of assets pledged was US$1,798.8 million (31st December 2017: US$1,783.8 million).

- more -
Page 18 6 Share capital
Group 2018 2017
US$m US$m Three months ended 31st March Issued and fully paid: Balance at 1st January and 31st March - 395,236,288 (2017: 395,236,288) ordinary shares 1,381.0 1,381.0
There were no rights, bonus or equity issues during the period between 1st January 2018 and 31st March 2018. The Company did not hold any treasury shares as at 31st March 2018 (31st March 2017: Nil) and did not have any unissued shares under convertibles as at 31st March 2018 (31st March 2017: Nil). There were no subsidiary holdings (as defined in the Listing Manual of the SGX-ST) as at 31st March 2018 (31st March 2017: Nil).
7 Revenue reserve
Group Company
2018 2017 2018 2017 US$m US$m US$m US$m Movements: Balance at 1st January 6,012.8 5,508.7 754.6 654.2 Effect of adoption of IFRS 9 and IFRS 15 160.9 6.9 - 4.7
Balance at 1st January as restated 6,173.7 5,515.6 754.6 658.9 Defined benefit pension plans - remeasurements (0.2) 0.3 - - - deferred tax - (0.1) - - Share of associates’ and joint ventures’ remeasurements
of defined benefit pension plans, net of tax 0.3 (0.3) - -
Profit attributable to shareholders 135.4 211.7 (9.2) (0.3) Others 3.2 - - -
Balance at 31st March 6,312.4 5,727.2 745.4 658.6
8 Other reserves
Group Company
2018 2017 2018 2017
US$m US$m US$m US$m Composition: Asset revaluation reserve 402.4 400.4 - -
Translation reserve (1,555.4) (1,476.2) 404.2 249.6
Fair value reserve 12.2 9.8 - -
Hedging reserve (10.9) (12.6) - -
Other reserve 3.3 3.3 - -
Balance at 31st March (1,148.4) (1,075.3) 404.2 249.6
Movements: Asset revaluation reserve Balance at 1st January and 31st March 402.4 400.4 - -
Translation reserve Balance at 1st January (1,521.7) (1,546.7) 357.1 175.5 Effect of adoption of IFRS 9 and IFRS 15 - - - -
Balance at 1st January as restated (1,521.3) (1,546.7) 357.1 175.5 Translation difference (33.7) 70.5 47.1 74.1
Balance at 31st March (1,555.4) (1,476.2) 404.2 249.6

- more -
Page 19 8 Other reserves (continued)
Group Company
2018 2017 2018 2017 US$m US$m US$m US$m Fair value reserve Balance at 1st January 168.5 13.0 - 4.7 Effect of adoption of IFRS 9 and IFRS 15 (153.4) (7.4) - (4.7)
Balance at 1st January as restated 15.1 5.6 - - Financial assets at FVOCI - fair value changes (1.6) 3.2 - - - deferred tax 0.1 (0.1) - - - transfer to profit and loss (0.7) - - - Share of associates’ and joint ventures’ fair
value changes of financial assets at FVOCI, net of tax (0.7) 1.1 - -
Balance at 31st March 12.2 9.8 - -
Hedging reserve Balance at 1st January (19.4) (5.1) - - Cash flow hedges - fair value changes (0.2) (10.0) - - - deferred tax - 2.0 - - - transfer to profit and loss 0.2 2.2 - - Share of associates’ and joint ventures’ fair
value changes of cash flow hedges, net of tax 8.5 (1.7) - -
Balance at 31st March (10.9) (12.6) - -
Other reserve Balance at 1st January and 31st March 3.3 3.3 - -
9 Non-controlling interests
Group
2018 2017 US$m US$m Balance at 1st January 7,014.1 6,321.8 Effect of adoption of IFRS 9 and IFRS 15 14.3 (1.4)
Balance at 1st January as restated 7,028.4 6,320.4 Financial assets at FVOCI - fair value changes (1.7) 3.5 - deferred tax 0.1 (0.1) - transfer to profit and loss (0.7) - Share of associates’ and joint ventures’ fair value changes of
Financial assets at FVOCI, net of tax (0.8) 1.0 Cash flow hedges - fair value changes 0.1 (11.3) - deferred tax (0.1) 2.3 - transfer to profit and loss 0.1 2.1 Share of associates’ and joint ventures’ fair value changes of cash
flow hedges, net of tax 20.8 (1.6) Defined benefit pension plans - remeasurements (0.8) 0.6 - deferred tax 0.2 (0.1) Share of associates’ and joint ventures’ remeasurements
of defined benefit pension plans, net of tax 0.3 (0.4) Translation difference (101.0) 53.1 Profit for the period 276.4 260.1 Dividends paid (25.3) (7.0) Capital contribution by non-controlling interests 17.3 - Change in shareholding 2.9 - Acquisition of subsidiary - 6.6 Other - (0.8)
Balance at 31st March 7,216.2 6,628.4
- more -
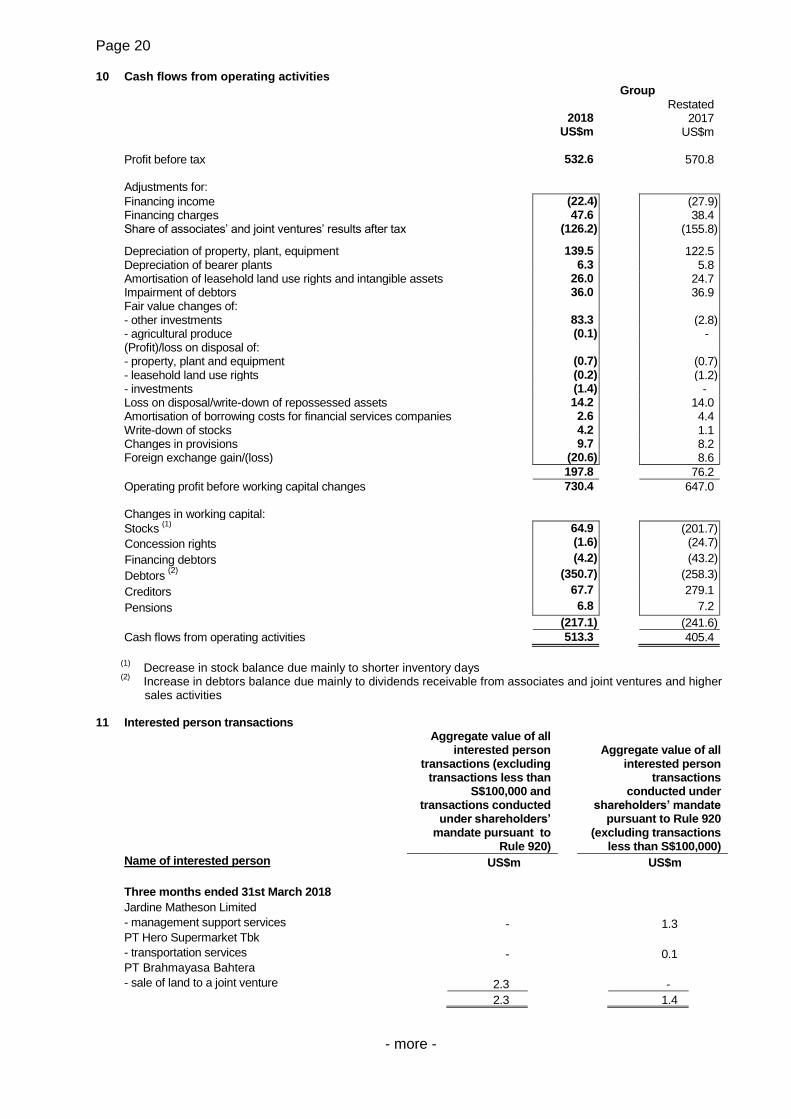
Page 20 10 Cash flows from operating activities
Group
Restated 2018 2017 US$m US$m
Profit before tax 532.6 570.8
Adjustments for:
Financing income (22.4) (27.9) Financing charges 47.6 38.4 Share of associates’ and joint ventures’ results after tax (126.2) (155.8)
Depreciation of property, plant, equipment 139.5 122.5 Depreciation of bearer plants 6.3 5.8 Amortisation of leasehold land use rights and intangible assets 26.0 24.7 Impairment of debtors 36.0 36.9 Fair value changes of: - other investments 83.3 (2.8) - agricultural produce (0.1) - (Profit)/loss on disposal of: - property, plant and equipment (0.7) (0.7) - leasehold land use rights (0.2) (1.2) - investments (1.4) - Loss on disposal/write-down of repossessed assets 14.2 14.0 Amortisation of borrowing costs for financial services companies 2.6 4.4 Write-down of stocks 4.2 1.1 Changes in provisions 9.7 8.2 Foreign exchange gain/(loss) (20.6) 8.6
197.8 76.2
Operating profit before working capital changes 730.4 647.0
Changes in working capital:
Stocks (1)
64.9 (201.7)
Concession rights (1.6) (24.7)
Financing debtors (4.2) (43.2)
Debtors (2)
(350.7) (258.3)
Creditors 67.7 279.1
Pensions 6.8 7.2
(217.1) (241.6)
Cash flows from operating activities 513.3 405.4
(1)
Decrease in stock balance due mainly to shorter inventory days (2)
Increase in debtors balance due mainly to dividends receivable from associates and joint ventures and higher sales activities
11 Interested person transactions
Aggregate value of all interested person
transactions (excluding transactions less than
S$100,000 and transactions conducted
under shareholders’ mandate pursuant to
Rule 920)
Aggregate value of all
interested person transactions
conducted under shareholders’ mandate
pursuant to Rule 920 (excluding transactions
less than S$100,000)
Name of interested person US$m US$m
Three months ended 31st March 2018
Jardine Matheson Limited
- management support services -
1.3
PT Hero Supermarket Tbk
- transportation services PT
- 0.1
PT Brahmayasa Bahtera
- sale of land to a joint venture PT
2.3 -
2.3 1.4

Page 21 12 Additional information
Group
Three months ended 31st March 2018 2017 Change
US$m US$m %
Astra International
Automotive 72.0 80.7 -11
Financial services 39.0 42.2 -8
Heavy equipment, mining, construction & energy 55.8 33.9 65
Agribusiness 10.4 24.0 -57
Infrastructure & logistics (0.8) 2.5 nm
Information technology 1.0 1.0 -
Property - 0.2 -100
177.4 184.5 -4
Direct Motor Interests
Singapore 12.9 11.9 8
Malaysia (1.8) - nm
Indonesia (Tunas Ridean) 4.9 3.4 44
Myanmar (0.6) (0.2) 200
Vietnam 12.2 7.4 65
27.6 22.5 23
Other Strategic Interests
Vinamilk 9.6 - nm
9.6 - nm
Corporate costs 4.4 (5.0) nm
Underlying profit attributable to shareholders 219.0 202.0 8
13 Others
The results do not include any pre-acquisition profits and have not been affected by any item, transaction or event of a material or unusual nature.
No significant event or transaction other than as contained in this report has occurred between 1st April 2018 and the date of this report. The Company confirms that it has procured undertakings from all its directors and executive officers under Rule 720(1) of the Listing Manual.
- end -

Page 22
For further information, please contact:
Jardine Cycle & Carriage Limited
Jeffery Tan Eng Heong
Tel: 65 64708111
The full text of the Financial Statements and Dividend Announcement for the first quarter ended 31st March 2018 can
be accessed through the internet at www.jcclgroup.com.
Corporate Profile
Jardine Cycle & Carriage (“JC&C”) is a leading Singapore-listed company and a member of the Jardine Matheson Group. It has an interest of just over 50% in Astra International (“Astra”), a premier listed Indonesian conglomerate, as well as Direct Motor Interests and Other Strategic Interests in Southeast Asia. Together with its subsidiaries and associates, JC&C employs over 250,000 people across Indonesia, Vietnam, Singapore, Thailand, Malaysia and Myanmar. Astra is the largest independent automotive group in Southeast Asia, with further interests in financial services, heavy equipment, mining, construction and energy, agribusiness, infrastructure and logistics, information technology and property. JC&C's Direct Motor Interests operate in Singapore, Malaysia and Myanmar under the Cycle & Carriage banner, and through Tunas Ridean in Indonesia and Truong Hai Auto Corporation in Vietnam. JC&C's Other Strategic Interests comprise interests in market leading businesses in the region through which JC&C gains exposure to key economies by supporting the long-term growth of these companies. JC&C is 75% owned by the Jardine Matheson Group, a diversified business group focused principally on markets in Greater China and Southeast Asia.