japan’s insurance market 2012 - toare.co.jp · pdf fileyuki katayama nli research ......
TRANSCRIPT

The Toa Reinsurance Company, Limited
The Toa Reinsurance Company, Limited
Japan’s Insurance Market 2012

To Our Clients Tomoatsu Noguchi
President and Chief Executive, The Toa Reinsurance Company, Limited 1
1. The Framework and Future of Japan’s Earthquake Insurance System:
The Great East Japan Earthquake in Retrospect Yasushi Kuriyama
Managing Director, The General Insurance Association of Japan 2
2. The Catastrophe Losses of 2011 and Japan’s Non-Life Market:
A Modeler’s Perspective Patricia Grossi, Robert Muir-Wood, and Craig Van Anne
Risk Management Solutions, Inc. 11
3. China’s Life Insurance Market: Current Conditions and Future Direction Yuki Katayama
NLI Research Institute 19
4. Japan’s Insurance and Reinsurance Market 2011-2012 – Resilience in Adversity Dominic Christian
Co-CEO, Aon Benfield 28
5. Trends in Japan’s Non-life Insurance Industry Underwriting & Planning Department
The Toa Reinsurance Company, Limited 34
6. Trends in Japan’s Life Insurance Industry Life Underwriting & Planning Department
The Toa Reinsurance Company, Limited 40
Supplemental Data: Results of Japanese major non-life insurance groups (company)
for fiscal 2011, ended March 31, 2012 (Non-Consolidated Basis) 48
Japan’s Insurance Market 2012
Contents Page
©2012 The Toa Reinsurance Company, Limited. All rights reserved. The contents may be reproduced only with the written permission of The Toa Reinsurance Company, Limited.

1
It gives me great pleasure to have the opportunity to welcome you to our brochure, “Japan’s
Insurance Market 2012.” It is encouraging to know that over the years our brochures have been well
received even beyond our own industry’s boundaries as a source of useful, up-to-date information about
Japan’s insurance market, as well as contributing to a wider interest in and understanding of our
domestic market.
During fiscal 2011, the year ended March 31, 2012, the Japanese economy continued to
encounter a generally challenging set of circumstances, although it regained momentum to some
extent, supported by a modest recovery of economic activity and the beneficial impacts of government
policies. In addition to a slowdown of industry owing to the constraints on the supply of electricity as a
result of the Great East Japan Earthquake and the nuclear accident, other factors adversely affecting the
Japanese economy included a slowdown of overseas economies brought about by the European
sovereign debt crisis and rising oil prices, as well as fluctuation of exchange rates, deflationary pressure,
and concerns about the deterioration of the labor market in Japan.
The non-life insurance industry in Japan saw an increase in premium income because the number
of purchasers of earthquake insurance increased after the Great East Japan Earthquake and the
government’s scheme to provide subsidies to people purchasing environmentally friendly automobiles
boosted sales of automotive insurance. However, the financial foundation of non-life insurance
companies in Japan suffered from heavy losses incurred because of the flooding in Thailand and other
major natural disasters. The life insurance industry in Japan also continued to operate in a challenging
business environment. Although the number of new policies trended upward, the total number of
policies in force has been flat and fund management performance remained lackluster.
The reinsurance market hardened centering on the property field, reflecting the frequency of
major natural disasters continuing from the previous year. In addition, the turmoil in international
financial markets owing to the European sovereign debt crisis made the outlook even more unclear.
In order to respond swiftly and precisely to these changes in the operating environment and to
further enhance corporate value, the Toa Re Group established a new vision and launched a new
medium-term management plan, Forward 2014, in April 2012.
By endeavoring to act as an exemplary reinsurance company, we are resolved to fulfill our mission:
“Providing Peace of Mind.”
In conclusion, I hope that our brochure will provide a greater insight into the Japanese insurance
market and I would like to express my gratitude to all who kindly contributed so much time and effort
towards its making.
Tomoatsu NoguchiPresident and Chief Executive
The Toa Reinsurance Company, Limited
To Our Clients

Actual figures for damage from the Great East Japan Earthquake were announced
one year after the disaster: a total of 19,009 people dead or missing, and 383,246
buildings completely or partially destroyed.
After the Great East Japan Earthquake occurred on March 11, 2011, all
employees of Japan’s non-life insurance companies sympathized deeply with those who
had suffered so greatly, and pressed forward with the payment of earthquake insurance
claims as quickly as possible so that those affected by the disaster could rebuild their
lives.
As of March 12, 2012, approximately one year after the earthquake, victims of
the disaster had received payment on 764,938 claims totaling 1,218.5 billion yen.
This set a record for payment of claims by Japan’s non-life insurance companies for a
single incident, and survey results indicate that it had a multiplier effect on the overall
economy exceeding 3 trillion yen.
(1) Organizational Framework
When the earthquake occurred on March 11, 2011, the General Insurance
Association of Japan (GIAJ) decided for the first time in its history to apply a
framework for processing large-scale damages in accordance with its predetermined
Master Plan for Processing Earthquake Insurance Damages. Incidentally, the
framework for processing small- and medium-scale damage was applied to the Great
Hanshin-Awaji Earthquake.
The key feature of the framework for processing large-scale damages was the
Earthquake Insurance Central Command that the GIAJ established at its headquarters
in Tokyo. The Earthquake Insurance Central Command was responsible for 1)
centrally organizing the various initiatives of the non-life insurance industry and 2)
unifying the response to key related government bodies, administrators and mass
media. The Earthquake Insurance Central Command then worked together with the
Earthquake Insurance Local Headquarters in Sendai in implementing various
coordinated responses.
(2) Claims Paid
According to aggregate GIAJ data one year after the earthquake as of March 12,
2012, earthquake insurance claims associated with the Great East Japan Earthquake
totaled 764,938, claims paid totaled 1,218.5 billion yen, and 99.0 percent of reported
claims had been either settled or investigated. The number of buildings destroyed was
similar to the Great Hanshin-Awaji Earthquake, for which earthquake insurance
claims paid totaled 78.3 billion yen, the previous record. This underscores the scale of
the earthquake insurance claims paid to the many victims of the Great East Japan
Earthquake. The main reason for the difference is the expansion of earthquake
insurance coverage since the Great Hanshin-Awaji Earthquake.
1. Yasushi Kuriyama Managing Director, The General Insurance Association of Japan
The Framework and Future of Japan’s Earthquake Insurance System:The Great East Japan Earthquake in Retrospect
Introduction
The Non-Life Insurance Industry’s Response to the Great East Japan Earthquake
2

3
(3) Non-Life Insurance Industry Response
The non-life insurance industry’s response to the Great East Japan Earthquake
can be broadly categorized as consultation, damage investigation, and provision of
information.
A. Consultation
Immediately following the earthquake, non-life insurance companies and the
GIAJ both consulted with a huge number of people, primarily regarding claims by
earthquake insurance policyholders and requests from people throughout Japan for
immediate earthquake insurance coverage. Courteous, respectful responses formed the
core of these consultations.
Non-life insurance companies and the GIAJ expanded their call centers in
preparation for a substantially larger number of consultations than usual. However,
the volume was so large that callers regularly had to wait on hold. The most important
of these consultations was responding to questions from earthquake insurance
policyholders in the affected area regarding the procedure for filing insurance claims.
Concurrently, another key issue was preparing the framework for encouraging claims
among policyholders who were unable to file claims because of the chaos caused by
the disaster and among the many policyholders who did not realize they could file a
claim.
The GIAJ printed 80,000 posters and 546,000 leaflets, and cooperated with
non-life insurance companies and insurance agencies to display or distribute them,
primarily at evacuation centers. It also encouraged claims using mass media such as
newspapers and radio. This publicity made policyholders affected by the disaster aware
of how to handle earthquake insurance claims despite the serious ambient chaos.
The next requirement that emerged was creating a system for smoothly handling
earthquake insurance claims even in cases where, for reasons including loss of the
insurance policy due to the tsunami or the death of the policyholder, it was not clear
which company had underwritten the earthquake insurance. Shortly after the
earthquake on March 19, 2011, the GIAJ collaborated with non-life insurance
companies to establish the System for Searching for Earthquake Insurance Contracts
on Dwelling Risks, an internal insurance industry system for cross-referencing
earthquake insurance policies and companies to create a framework for answering
inquiries from policyholders, regardless of which company they called. Next, on
March 28, 2011 the GIAJ established a dedicated call center and enabled handling of
inquiries via its website.
The Toa Reinsurance Company, Limited — Japan’s Insurance Market 2012
3

B. Damage Investigation
Damage investigation was the second core component of the non-life insurance
industry’s response. The GIAJ introduced a number of new approaches, including the
use of aerial and satellite photographs to approve total loss areas for payment of claims.
Although rules for approving total loss areas with aerial photographs in order to
process earthquake insurance losses were already in place, this approach was actually
used for the first time following the Great East Japan Earthquake. The process
involved three main steps. First, 23,000 satellite and aerial photographs were used in
transposing photos of tsunami damage to maps. Next, addresses and lot numbers were
then added to the maps, and then finally correlated with the dwellings covered by
earthquake insurance. While this process was fraught with unforeseen difficulties, it
dramatically accelerated payment of claims by enabling all payments in total loss areas
without building-by-building damage approval.
In addition, clarification of standards for tsunami, flooding and liquefaction
damage; introduction of written investigations based on self-submitted reports by
policyholders; implementation of a scheme for agencies to provide support for damage
investigation; and written investigations based on self-submitted reports for areas such
as the exclusion zone related to the accident at the Fukushima Daiichi Nuclear Power
Plant were all policies introduced for the first time following the Great East Japan
Earthquake. The rapid progress of claims between late April and early May 2011 was
due to the introduction of these new policies.
C. Provision of Information
Information was the third core component of the non-life insurance industry’s
response. In dealing with the mass media in the initial period of the response to the
earthquake, the industry realized that people were focusing on earthquake insurance,
and that they were uncomfortable with and mistrustful of the insurance industry. In
other words, the people of Japan held a critical view of the industry, wondering if the
domestic non-life insurance industry was sufficiently solvent to pay the claims from
the major earthquake, if it could deploy the people needed to respond to the
earthquake, and if it would repeat its past failures to pay insurance claims. The people
of Japan expected the entire non-life industry to be accountable for its response.
Given these conditions, the industry set three basic principles for providing
information. One, it would by all means agree to all interviews. Two, it would respond
as quickly as possible. Three, it absolutely would not cover up unpleasant information.
With fast, open and unflinching responsiveness as a base, the industry issued a large
volume of news releases, including releases that communicated information overseas.
The mass media did not quite become an ally because of the information the non-life
insurance industry provided, but it did demonstrate a definite understanding of the
non-life insurance industry’s actions without mistrust. This became an important
element smoothing the response to the earthquake.
1. The Framework and Future of Japan’s Earthquake Insurance System: The Great East Japan Earthquake in Retrospect
4

The Toa Reinsurance Company, Limited — Japan’s Insurance Market 2012
Three key points emerge from the above discussion of the industry’s response.
One, cooperation between the Earthquake Insurance Central Command and the
Earthquake Insurance Local Headquarters enabled rapid, unhesitating support when
managers on the ground called out for help. Two, companies in the industry
collaborated in setting standards rather than causing confusion by setting standards
individually, and competed to pay claims quickly and courteously. Three, the industry
appropriately communicated information about its responsiveness to the public. These
three points were key reasons for the definitely positive assessment of the industry’s
response from the world at large.
(1) Overview and History of the Earthquake Insurance System
Following the Niigata Earthquake of 1964, household earthquake insurance
became available on June 1, 1966. Initially, maximum insured amounts were 900,000
yen for dwellings and 600,000 yen for household contents. Coverage was limited to
30% of the fire insurance coverage for the dwelling, with compensation only in the
event of total loss.
Subsequent revisions included several increases in policy limits. A major revision
in 1980 made earthquake insurance a rider that was automatically attached to a fire
insurance policy in principle, unless deleted at the option of the policyholder; it also
raised the 30% dwelling coverage limit to 50% of the fire insurance coverage,
broadened compensation to a “half loss” event, and substantially increased maximum
insured amounts to 10 million yen for dwellings and 5 million yen for household
contents. In 1991, partial loss was covered, and in 1996 the maximum insured
amount increased to the current 50 million yen for dwellings and 10 million yen for
household contents. No revisions have been made since 1996, aside from minor
changes. Rates have changed, but the underlying basic two classes for dwelling
structures and four classes for location (prefecture) have remained in place since the
program began.
The Structure of Japan’s Earthquake Insurance System
5

(2) Features of the Earthquake Insurance System
A. Government Reinsurance Underwriting
Earthquake insurance in Japan operates under a self-help principle in which
individual citizens take steps to protect their own assets. Therefore, premiums paid by
policyholders ultimately fund insurance claims. However, the unique characteristics of
earthquake risk gave rise to the establishment of a system in which the government
underwrites reinsurance. The point here is that the government is responsible as a
reinsurer to pay reinsurance claims in the event of an earthquake based on reinsurance
premiums ultimately funded by earthquake insurance premiums, but must not make
the mistake of confusing this role with its responsibility to provide a social safety net
funded by taxes. In sum, the system is structured so that all earthquake insurance
premiums paid by policyholders are entirely separate from other types of insurance,
and private-sector non-life insurance companies, including those specializing in
reinsuring earthquake risk such as the Japan Earthquake Reinsurance Co., Ltd. (JER),
and the government reinsurance with the “special account for earthquake insurance” as
its reserve, pay claims from their reserves in the event of an earthquake.
However, the system has one problem. Earthquake risk is unique in that it
materializes infrequently, but can cause massive losses when it does materialize. The
resulting problem is that reserves will not have the resources for payment of claims if
they are not sufficiently funded prior to the occurrence of an earthquake. A simple
description of the earthquake insurance system that prepares against this eventuality
follows. The scope of private sector responsibility for insurance is based on its reserves.
The government serves as the reinsurer responsible for paying amounts in excess of
private sector reserves from the special account. If the special account is insufficient,
the government temporarily borrows from general account tax revenue and repays the
borrowed funds using subsequent earthquake insurance premiums. This structure is
central to the system. While the government may temporarily draw on tax revenue,
the system maintains the institutional self-help framework by requiring repayment
from earthquake insurance premiums.
B. Earthquake Insurance Cash Flow Structure
Long periods of time are the key to the earthquake insurance system. The GIAJ
and JER jointly prepared study materials for a September 8, 2011 working group on
the government’s earthquake special account. The following model of changes over
time in earthquake insurance reserves draws on these materials for certain
assumptions, such as continued annual payment of premiums into the reserves at the
level of 100 billion yen per year, the same as in the year prior to the Great East Japan
Earthquake.
1. The Framework and Future of Japan’s Earthquake Insurance System: The Great East Japan Earthquake in Retrospect
6

The Toa Reinsurance Company, Limited — Japan’s Insurance Market 2012
As a result of the Great East Japan Earthquake, government and private sector
reserves decreased to a combined 1.2 trillion yen in 2011. According to the model, the
reserves will subsequently recover to 3.9 trillion yen in 2041 with the addition of
earthquake insurance premiums. However, an earthquake in the interlinked Tokai,
Tonankai or Nankai areas will cause a deficit of 300 billion yen. Subsequently, the
reserves will recover to 1.5 trillion yen in 2061, but then fall back into a 1.5 trillion
yen deficit due to an earthquake with its epicenter in Tokyo. Thereafter, the reserves
will recover to 5.9 trillion yen in 2143, but then a major earthquake in the Kanto area
will cause them to decrease to 400 billion yen. The graph below covering the period
through 2491 indicates substantial decreases in reserves due to major earthquakes
followed by recovery. Needless to say, this graph is only a representation based on
numerous estimates and guesses. However, it does show that the earthquake insurance
system relies in principle on premium payments from policyholders, making it a
system that operates over very long periods under the self-help principle.
The law of large numbers does not apply to earthquake risk. The only choice in
creating an earthquake insurance system is building a framework based on balanced
cash flow over the long term with the crucial assumption that the government will
serve as reinsurance underwriter.
C. Setting Maximum Payment Limits
Japan’s earthquake insurance sets a maximum limit for payment of claims from a
single earthquake, and allocates payment obligations between the private sector and
government. This payment limit was determined based on estimated payment of
claims resulting from the projected maximum loss should a single earthquake as
powerful as the Great Kanto Earthquake occur again. The maximum payment limit
when the earthquake insurance system was created in 1966 was 300 billion yen, with
the private sector responsible for 30 billion yen and the government (reinsurance)
responsible for 270 billion yen. The maximum payment limit increased steadily in
tandem with expanded coverage and indemnity. It was 5,500 billion yen immediately
prior to the Great East Japan Earthquake, with the private sector responsible for
1,198.75 billion yen and the government responsible for 4,301.25 billion yen.
The maximum payment limit increased to 6,200 billion yen from April 6, 2012
because of the substantial increase in the number of new policies as a result of the
Great East Japan Earthquake. Also, private sector reserves decreased significantly
because of recent payments. The allocation of responsibility changed as a result, with
private-sector responsibility decreasing substantially to 488 billion yen and
government responsibility increasing to 5,712 billion yen based on the notion that
private-sector responsibility should correspond to its reserves.
7
D. Calculation of Earthquake Insurance Premiums
The Non-Life Insurance Rating Organization of Japan uses the following process
for calculating premium rates. First, the government predicts earthquakes by creating a
model encompassing 730,000 earthquakes based on the probabilistic seismic hazard
map published by the Headquarters for Earthquake Research Promotion, a special
government organization for earthquake prediction. Next, the land area of Japan is
divided into a grid of square kilometers in which insured building risk is quantified.
These two components are then used together to quantify Japan’s total earthquake
risk. Finally, insurance premium rates are calculated according to eight risk classes
derived from the four regions and the two types of building structures.
The major reason necessitating this detailed calculation of premiums is that while
the system certainly requires government reinsurance underwriting, it is ultimately a
self-help system predicated on maintaining the government’s core reinsurance
underwriting role based on the economic rationality of this responsibility. Human
limitations notwithstanding, premium calculation must be free of any sense of futility
in employing the greatest possible rigor and detail.
I would like to share my opinions on availability and affordability, which are two
major issues in considering the future of the earthquake insurance system.
A. Unavailability
Insurance is not necessarily available for purchase. The phenomenon of insurance
unavailability occurs when insurance companies no longer have the financial base to
underwrite insurance. For example, an insurance crisis occurred in the United States
in the 1980s and created major social problems.
Insurance unavailability has not been a problem in Japan. Theoretically, however,
it could well occur due to the solvency margin regime or insurance risk management
at particular companies. The point is that insurance underwriting cannot take place
without a financial base that can accommodate the risks involved.
Conventionally, the earthquake insurance system for earthquake risk in Japan’s
household sector has been predicated on government reinsurance because no non-life
insurance company would be able to prepare the financial base including reinsurance.
However, the reinsurance that mutual insurance federations such as the National
Mutual Insurance Federation of Agricultural Cooperatives obtained in overseas
markets, and new financial techniques such as earthquake bonds, functioned
effectively for the Great East Japan Earthquake. As a result, future studies may once
again debate the need for government reinsurance.
1. The Framework and Future of Japan’s Earthquake Insurance System: The Great East Japan Earthquake in Retrospect
The Future of the Earthquake Insurance System
8

The Toa Reinsurance Company, Limited — Japan’s Insurance Market 2012
My conclusion, however, is that the institution of household sector earthquake
insurance could not exist without government reinsurance, for the following three
reasons.
First, the earthquake insurance system is different from a mutual insurance
federation because it is available to all Japanese citizens. It must underwrite earthquake
insurance even if 100% of households want it, which is a fundamental difference in
scale compared with the limited markets that mutual insurance federations serve.
Second, premiums must remain stable. Premium calculation based on
considerations including overseas reinsurance markets and earthquake bonds would
give rise to large annual fluctuations in premiums, creating the potential for confusion
among the policyholders who pay the premiums.
Third, no entity besides the government can serve as the risk underwriter of last
resort in order to maintain the current system in which insurance companies are
responsible for payments within the scope of their reserves. Does any entity besides
the government have the ability to fully indemnify the probable maximum loss if the
Great Kanto Earthquake were to recur?
Moreover, the Great East Japan Earthquake caused a tsunami that was larger than
expected. Earthquake predictions must therefore incorporate earthquake archaeology,
which was not reflected in past predictions. One result could be a significant revision
of the earthquake periodicity and scale assumed in conventional prediction, which
could significantly increase the probable maximum loss for earthquake insurance.
Furthermore, coverage has expanded substantially because of the Great East Japan
Earthquake, which could also have the same effect. Undeniably, these issues create the
potential for debate on the sustainability of the earthquake insurance system,
including its government underwriting component. Even the government should have
a limit on its maximum reinsurance capacity. All of these considerations must be part
of the overall understanding of the issue of unavailability.
B. Unaffordability
Insurance unaffordability refers to premium affordability, or the extent of the
ability of policyholders to pay their premiums.
Revisions to the earthquake insurance system since it was established have
consistently increased indemnity. Expanded earthquake insurance coverage has
therefore become a significant issue. The Great East Japan Earthquake has opened
discussion of various demands. These include increasing the coverage limit from 50%
of the attached fire insurance policy, creating a new category between half loss and
partial loss, adding automobile coverage, and adding commercial properties. A major
issue for earthquake insurance is the extent to which indemnity reflects these kinds of
demands, which are linked to increased premiums.
9

Currently, earthquake insurance is not full replacement insurance for dwellings
and household contents. However, even though it is not sufficient to fully replace
assets accumulated over time, it has great value for disaster victims by giving them the
means to start building their new life in the future, whether that means allowing a
disaster victim to bury family members who have died, or move from an evacuation
shelter to an apartment, or buy a small used car, or provide simple entertainment that
makes an emotionally traumatized child smile. This approach keeps earthquake
insurance from becoming full indemnity property insurance with high premiums that
only the wealthy can afford. It involves close attention to the cost and benefits of
earthquake insurance to keep premiums at a level that as many people as possible can
afford by narrowly limiting the scope of indemnity.
Also, the tsunami damage from the Great East Japan Earthquake has given rise to
the opinion that rate classes should be segmented to reflect tsunami risk. The
discussion of increasing premium discounts for earthquake proofing shares this view.
However, a logical outcome of classifying risk is that lower premiums for some groups
will correspond to higher premiums for others, which is an issue that requires prudent
study. Whether studying increased indemnity or risk segmentation, Japan should
remain patient and remember that earthquake insurance involves mutual assistance
and the public good.
The Great East Japan Earthquake has been called a major quake that occurs only
once in a thousand years. If so, earthquake insurance has given Japan’s non-life
insurance industry an experience it can only have once in a millennium. We learned
much from it.
Victims of the disaster demonstrated the great ability of insurance to contribute
to the public good through their words of gratitude. The earthquake also provided an
opportunity to reconsider insurance industry cooperation and competition, as well as
an opportunity to find a new way of providing information. In addition, future
discussion of changes to earthquake insurance will be a chance to consider the essence
of insurance.
The Great East Japan Earthquake entailed great sacrifice. We must now move
forward.
1. The Framework and Future of Japan’s Earthquake Insurance System: The Great East Japan Earthquake in Retrospect
Conclusion
10

This article discusses two catastrophic events of 2011, which were significant
insured losses to the Japanese non-life insurance market: the Tohoku Event (the Great
East Japan Earthquake and Tsunami) of March 11, 2011, and the Thailand Floods,
which persisted in the final half of 2011. Both events — ranking in the top 3 insured
events of the year by all accounts — highlight the need for better catastrophe risk
modeling and management practices. The authors discuss how catastrophe models are
being reviewed following these events and the improvements needed in the
management of property exposures at risk from natural hazards.
The natural disasters of 2011 included not only the historic Tohoku Event but
also a series of deadly tornadoes across the United States, an earthquake that destroyed
the fabric of Christchurch, New Zealand, and major flooding across Southeast Asia
(Table 1). Hurricane Irene made landfall along the Eastern U.S. seaboard – the first
hurricane since the release of RMS v11 North Atlantic hurricane model. Each of these
events provides an opportunity for re-evaluation of catastrophe models for these
regions of the world, as well as improved methodologies for peril modeling (e.g.,
earthquake, severe convective storm, hurricane, and flood).
Following significant natural catastrophes, it takes time for relevant data to be
collected and distilled into actionable insights. Every natural catastrophe event is
unique – in its occurrence, size, hazard footprint, secondary perils, and overall
impacts. For significant events impacting insured exposures, it can take a significant
amount of time for the scientific community to adequately evaluate and come to a
consensus, particularly for non-typical observations. For example, the
uncharacteristically high ground motions in New Zealand (due to high stress drops)
and the extent of rupture along the Japan Trench will be studied for years (e.g., there
are currently more than a dozen competing slip models for the Tohoku event).
Event (Date) Event Location Number of Deaths Insured Loss Estimate (USD)
Earthquake (March 11) Japan 15,844 35.00 billion
Earthquake (February 22) New Zealand 182 13.50 billion
Flooding (July 25-November 30) Thailand 790 10.78 billion
Severe Weather (April 22-28) U.S. (Southeast, Plains, Midwest) 344 7.30 billion
Severe Weather (May 21-27) U.S. (Plains, Midwest, Southeast) 181 6.75 billion
Hurricane Irene (August 22-30) U.S., Bahamas, Caribbean Islands 46 5.00 billion
Flooding (December 21-January 14) Australia (Queensland) 36 2.42 billion
Severe Weather (April 3-5) U.S. (Midwest, Southeast, Plains) 9 2.00 billion
Earthquake (June 13) New Zealand 1 1.80 billion
Severe Weather (April 14-16) U.S. (Plains, Southeast, Midwest) 48 1.70 billion
2. Patricia Grossi, Robert Muir-Wood, and Craig Van Anne Risk Management Solutions, Inc.
The Catastrophe Losses of 2011 and Japan’s Non-Life Market: A Modeler’s Perspective
Summary
Introduction
Table 1. Top 10 Insured Losses in 2011
Source: Aon Benfield
11

Moreover, the view of the scientific institutions of each country must be taken
into consideration for changes in a hazard perspective — and thus, there is some
dependency on their timelines for research. For example, for earthquake hazards, this
includes the U.S. Geological Survey (USGS) in the United States, the Headquarters
for Earthquake Research Promotion (HERP) in Japan, and the China Earthquake
Administration (CEA) in China, among others. Finally, systematic damage
assessments — to estimate mean damage to structures and their contents — take time
to perform, as do claims acquisition and analysis. Some insurance claims from the
Tohoku Event are still on-going over a full year later and cannot be fully processed to
garner modeling insights for some time.
While time must be taken to incorporate appropriate changes to catastrophe
models, insights from events emerge more rapidly.
The 2011 Great East Japan Earthquake and Tsunami was an unprecedented
event, from which many lessons can be learned for catastrophe modeling and disaster
research. Future earthquake hazard assessments in Japan will reflect the possibility of
higher magnitude events along the subduction zones situated off the coastline, ground
motion prediction equations will be updated utilizing the thousands of ground
motion recordings from the event, and new approaches to modeling comprehensive
business interruption (BI) impacts will be developed. Flood defenses will be evaluated,
as will nuclear power safety. Of the many insights into modeling, two key areas are
elaborated upon in this paper: the changes in seismic hazard as a result of the 2011
Tohoku Event and the impacts of the tsunami waves along the Japanese coastline.
Probabilistic Seismic Hazard
Since March 2011, the seismic hazard research community has endeavored to
understand whether other related damaging earthquakes can now be expected around
Japan and how this event may have affected the timing (advance or delay) of other
earthquakes in the region. In early 2012, RMS published the results of a study
exploring microseismicity patterns and static stress changes across the seismic sources
in the area from northern Tohoku to the Tokyo region (See http://www.rms.com/
Publications/2011_Tohoku_Seismic_Risk.pdf ).
The RMS study outlined potential changes in short-term risk due to static stress
changes in the tectonic environment in conjunction with short-term elevated
seismicity as a result of the 2011 earthquake. Significant variability exists among the
proposed finite fault slip solutions for the event, which leads to a wide range of
proposed static stress changes and consequently, varied occurrence rate changes for the
seismic sources across the impacted region. Subduction sources, and some crustal
sources, near the edge of the Tohoku Event’s rupture area show stress increases, while
all sources within the rupture area itself exhibit stress decreases. From this analysis, it
2. The Catastrophe Losses of 2011 and Japan’s Non-Life Market: A Modeler’s Perspective
2011 Great East Japan Earthquake and Tsunami
12

The Toa Reinsurance Company, Limited — Japan’s Insurance Market 2012
became clear that occurrence rate changes cannot be resolved exclusively by analyzing
static stress changes on known seismic sources. The presence of many unknown
seismic sources makes this a limiting approach to understanding short-term changes in
hazard and risk (Figure 1).
Across the Northeast Honshu region, sensitivity testing of occurrence rate
changes due to a combination of static stress and microseismicity rate changes is
recommended to explore the range of changes in short-term risk estimates. Estimated
occurrence rate changes, based only on the calculated static stress changes, indicate
that short-term earthquake risk (i.e., within two years of the event’s occurrence) to the
Tokyo region, where approximately 10% of Japan’s population resides, has remained
relatively unchanged following the 2011 Tohoku Event. Considering increased
patterns of post-event seismic activity, however, risk estimates can potentially increase.
Figure 1. Changes in risk due to static stress changes as a result of the 2011 Great East Japan Earthquake, showing changes in ground up average annual loss (AAL), with solid colors indicating areas of decreased risk and hashed patterns indicating areas of increased risk; changes within ±5% are not shown.
13

This uncertainty in potential hazard poses a challenge to accurately assess hazard
within the next few years, as post-event seismic activity decreases with each passing
month. RMS is utilizing the results of this short-term risk analysis, the decay rate of
seismic activity since the 2011 event, and preliminary changes in seismic source
characterization by Japan’s Headquarters for Earthquake Research Promotion (HERP)
for a late 2012 update to its Japan Earthquake Model.
While the 2011 earthquake has reshaped the hazard landscape of Northeast
Japan, the event also highlighted that in the largest of earthquakes, tsunami peril can
be the principal driver of casualties, damage, and insured loss. In Japan, tsunami was
the principal cause of damage to ports, boats, cargo and the coastal railway system
(Figure 2). The waves were generated by the sudden vertical displacement of the sea
floor from the 40 meters (or more) movement on the Japan Trench, the underlying
shallow subduction fault zone that marks the boundary between the Pacific and
Okhotsk plates and that dips down beneath the coast of northeast Japan.
As the seafloor above the upper end of the fault was raised several meters, the
overlying water was lifted and then this mass of water spilled sideways and became the
tsunami advancing west towards the coast of Japan and east across the Pacific Ocean.
In deep water, the wave moved at speeds of more than 600 km per hour but slowed
and increased in height as it reached shallower water in low lying coastlines.
Along Japan’s coastline, water moved on average 1 km inland and to elevations in
excess of 30 meters in some coastal inlets. In many coastal settlements with tsunami
walls, predicated on repeats of tsunamis no larger than those witnessed over the past
two centuries, these walls were overtopped or destroyed.
Around 1.2 million properties were identified as being damaged by the earthquake
and tsunami. The best breakdown of damages suggests that 104,000 buildings were
completely destroyed by the tsunami, while 111,000 were partly destroyed and 67,000
partially damaged. This compares with the shaking damage in which 25,500 buildings
were totally destroyed, 143,000 were partially destroyed and 635,000 partially damaged.
By these estimates, the earthquake caused approximately 42% of the damage to
buildings, the tsunami 39% of the building damage, and the loss of buildings in the exclusion
zone around the Fukushima
power plants reflects 19% of
the total direct damage.
However, given that the
nuclear incident was
attributable to the tsunami,
in total 58% of the impact
was related to the tsunami.
Tsunami
Figure 2. Devastation in Onagawa, showing heavy, mid-rise concrete structures toppled due to the tsunami waves following the 2011 Great East Japan Earthquake (Source: RMS)
2. The Catastrophe Losses of 2011 and Japan’s Non-Life Market: A Modeler’s Perspective
14

The Toa Reinsurance Company, Limited — Japan’s Insurance Market 2012
This degree of devastation stresses the need for detailed (i.e., high resolution) modeling
of tsunami risk. There are challenges, however, to calculating tsunami risk at a location. It is
necessary to understand the speed and extent of a tsunami wave’s propagation inland, as well
as the elevations of buildings and their vulnerability to inundation. As with all flooding, risk
depends on site-specific elevations, construction characteristics, and the existence of local
and network defenses. While aggregate information can be a valid approach to assessing a
portfolio at risk from earthquake ground shaking, high-resolution information is needed to
differentiate tsunami risk (Figure 3). For a fully probabilistic tsunami model, one must
understand the recurrence associated with tsunami-generated events — notably, large
subduction zone earthquakes off the coastlines of the world. In Japan, a M9.0 earthquake
will not now recur off the Tohoku coastline of Northeast Japan for hundreds of years. More
than 1100 years had elapsed since the previous equivalent version of the 2011 earthquake in
869AD. However, similar earthquakes and megatsunamis are expected along the coast of
Hokkaido. There is also the potential for major tsunamigenic earthquakes along the Nankai
Trough subduction zone of southern Japan, as well as on the Ryukyu subduction zone to
the southwest of Japan running all the way to Taiwan.
Figure 3: The impact zone of the 2011 Great East Japan Earthquake and Tsunami, illustrating the wide area of ground shaking (from under III to over VIII) felt across Honshu, and the concentrated northeastern coastal areas affected by the tsunami (Tsunami Inundation)
15

The most significant aspect of the 2011 Thailand Floods was that it was a
surprise catastrophic loss to the global insurance industry, impacting concentrations of
industrial exposures within the Chao Phraya River basin. Flooding began in late July
2011 and by the end of November 2011, waters began to recede. Throughout this
time, major flooding affected much of northern and central Thailand, most severely in
the Chao Phraya River basin, but also in the Mekong River basin (Figure 4).
The river systems of central Thailand are very slow draining, with low gradients.
Much of the central part of the country is a large delta, where rivers come together
270 km from the coast to form the Chao Phraya River that then flows slowly through
the swampy delta towards the sea. The capital city of Bangkok, close to the mouth of
this river, is only 2 m above sea level.
Over the past twenty years, the Government of Thailand had encouraged the
creation of a number of industrial parks to the north of Bangkok. When finding
suitable sites, the government required undeveloped, flat land (readily extended as
needs arose). Inevitably, such land was within floodplains. The industrial parks each
specialized in high technology and auto manufacturing sectors, with components
companies and major manufacturers situated in the same site. Major Japanese
companies with large manufacturing facilities in these industrial parks include Toyota,
Honda, Hitachi and Canon.
The 2011 Thailand Floods
Figure 4: Thailand’s river network, along with flooded area in the 2011 Thailand Floods
2. The Catastrophe Losses of 2011 and Japan’s Non-Life Market: A Modeler’s Perspective
16

The Toa Reinsurance Company, Limited — Japan’s Insurance Market 2012
European Solvency II Coming to Japan
While this concentration ensured companies could reduce the costs and time for
transportation, it created major concentrations of risk — the opposite of the principle
of diversification that underlies insurance. Even though the values of plant and
equipment at these sites were substantial (e.g. in at least one case, in excess of $10
billion), the risk mitigation measures proved insufficient.
During the 2011 flooding event, water inundated seven major industrial parks in
the main flood zone (Figure 5), which were closed for between 35 and 85 days. As a
consequence, the insured losses have been estimated to be US$11 billion – both on
commercial policies written in Thailand and on the corporate policies written in
Japan. Although there was an enormous amount of primary and secondary contingent
business interruption, it appears the majority of these losses were not insured.
The 2011 Thailand Floods have alerted the international insurance industry to
the inherent problems associated with large concentrations of exposure developed in
locations where the level of protection is not appropriate to the values at risk. The
culture of risk management must keep pace with development.
Though the timing is coincidental, with the occurrence of the 2011 Great East
Japan Earthquake and Tsunami, it is now understood that the Japan Financial Services
Authority (JFSA) is contemplating the adoption of a form of solvency oversight that is
expected to be similar to the experience of the European market. The primary objective
of European solvency oversight is the protection of policy holders — by ensuring the
financial soundness of insurance undertakings and company operations is driven by a
measurement-based risk management system. For such a risk management oversight to
be successful, it requires three elements: the accountability of senior management, the
Figure 5: Industrial estates flooded during the 2011 Thailand Floods (left); damage at an industrial facility in early December 2011 (right)
17

on-going ability to dynamically assess portfolio risk at all levels of the underwriting
process (to manage exposure accumulation), and the implementation of JFSA oversight
across the Japanese market in an efficient, timely, and consistent manner.
The reality of catastrophe modeling — for the insurance industry — is that all
models (across perils and across geographical areas) are not created equal: in terms of
methodology rigor and accuracy, or in terms of the robustness of the underlying
exposure data. Indeed, it may be that a certain peril in a certain geographical area may
not be modeled until market demand supports the financial investment required to
develop a robust and realistic probabilistic model – even when the scientific and
engineering knowledge is sufficient to do so. Does this mean that the goals of solvency
oversight will not be met? Not at all!
A 2011 survey of insurers by the Institute of Risk Management (IRM) indicates
that only approximately 20% of insurers are ‘highly confident’ of the efficacy and
completeness of their exposure data. Recent catastrophic events affecting the Japanese
insurers may provide some insight into the benefits of dynamic risk management that
adheres to the solvency oversight goal of measurement-based risk management
practices. In both the 2011 Thailand Floods and the 2011 Great East Japan
Earthquake and Tsunami, fully robust modeling was not available to the industry to
assess common risk metrics such as Average Annual Loss (AAL) or return period loss
estimates. If one accepts the definition of risk being the vulnerability of exposure to a
certain peril coupled with the likelihood (probability) of that peril occurring, then it
can be argued that the risk management system in place at the time of these events fell
short of the goal of solvency oversight.
However, the industry has the ability to make great strides towards a robust
measurement-based risk management system by rigorously capturing exposure
accumulations at the highest resolution possible. While this is far from a probabilistic risk
analysis of ground up, gross and net loss at location, account and portfolio levels, it is an
imperative start towards a real-time understanding of exposure accumulation by senior
management. Had exposures in Thailand and Japan been captured and dynamically
tracked at the location level in a way the data could have been easily manipulated, such a
high resolution understanding may have yielded great insight in mitigating a future loss
event. Such a state of knowledge of portfolio exposure will advance significantly the
implementation towards a measurement-based risk management system, even in the
absence of a fully robust probabilistic catastrophe model.
Both the 2011 Great East Japan Earthquake and the 2011 Thailand Floods
highlighted areas of improvement for catastrophe models, along with ways to more
vigorously manage catastrophe risk. Prudent catastrophe risk management should involve
the re-examination of exposure accumulations across the most catastrophic loss scenarios
(as in the case of the 2011 Thailand Floods) and the consideration of a range of scenarios
for concentrations of risk, such as the Tokyo region or other megacities, such as Mexico
City. Further, there is a need for more detailed data to be captured and utilized when
transferring risk for high resolution perils, such as tsunami or flood, as well as a need to
strive for measurement-based risk management systems within insurer’s operations.
Conclusions
2. The Catastrophe Losses of 2011 and Japan’s Non-Life Market: A Modeler’s Perspective
18

19
China’s insurance market has grown substantially in tandem with economic
development since China adopted its reform and opening policy and became a
member of the World Trade Organization (WTO). Since China gained WTO
membership in 2001, China’s insurance market has grown in importance over the
decade from 2002 to December 31, 2011, as it has risen to the number two position
in Asia after Japan while domestic premium income has increased by a factor of five.
Premiums per capita are small because China’s population is large, but potential
for growth is strong because GDP per capita is expected to increase to USD 10
thousand from USD 5 thousand in the five years ending December 31, 2015.
In contrast, domestic insurance underwriting in China was at a standstill for
nearly two decades from 1958 to the end of the Cultural Revolution in 1976,
excluding the minimum necessary business outside of China. Essentially, China’s
domestic insurance market has only a 30-year history after underwriting of all types of
insurance began again in 1982. More time is required and issues must be resolved
before China’s insurance market matures and achieves stable growth. I would therefore
like to consider those issues and the market’s current direction based on the current
market situation.
3. Yuki Katayama NLI Research Institute
China’s Life Insurance Market: Current Conditions and Future Direction
Strong Growth in China’s Insurance Market
Source: Created by complementing publicly available data on the China Insurance Regulatory Commission website with publicly available data from the National Bureau of Statistics of China website
Figure 1: Premium Income in China’s Insurance Market
19

China’s insurance market has grown by a factor of five since 2002. A key feature of
this growth is that premium income has continued to increase by more than 10 percent
annually excluding 2011, and as Figure 1 shows, had phases of pronounced growth in
2002, 2008 and 2010 due to the impact of the economy and financial markets.
Three peaks of strong year-on-year growth in premium income basically
overlapped a period of five consecutive years from 2003 with real GDP growth over
10 percent. With national income increasing strongly, capital flowed into financial
assets such as stock investments and insurance during this time.
Originally, savings-type insurance such as dividend-paying endowment insurance
accounted for a large proportion of China’s life insurance market. However,
investment-type insurance also made a significant contribution to the peaks in
premium income growth in 2002 and 2008. Around 2000 a number of insurance
companies in China began selling unit-linked insurance. At that time, insurance
companies were worried about negative spreads from repeated decreases in interest
rates on deposits, which led them to aggressively sell unit-linked insurance. While sales
subsequently subsided, against a backdrop of the strong fundamental need among the
populace for asset formation and investment, unit-linked insurance’s market share
increased to 8.0 percent from the former 1.5 percent in 2007 (Figure 2), when
economic growth and stock prices peaked with real GDP growth of 14.2 percent and
the Shanghai Stock Exchange Composite Index at the 6,000 level.
However, following the global financial crisis in the second half of 2008, the
government agency China Insurance Regulatory Commission (CIRC) enacted
bancassurance regulations for sales of investment-type insurance. Accordingly,
insurance companies took steps such as revising their product portfolios, causing
investment-type insurance sales to decrease. In 2010, therefore, endowment insurance
3. China’s Life Insurance Market: Current Conditions and Future Direction
Sales Trends: External Factors Easily Affect Life Insurance Product Sales
Source: Annual Report of China Insurance Market 2007 and 2010-2011, edited by the China Insurance Regulatory Commission and published by China Financial Publishing House
Figure 2: Life Insurance Market Share by Product (Premium Income Basis)
2007 2010
20

The Toa Reinsurance Company, Limited — Japan’s Insurance Market 2012
and other types of dividend-paying insurance came to account for a large proportion
of the life insurance market totaling about 70 percent (Figure 2).
Thus people in China exhibit a pronounced tendency to view insurance products
as a tool for financial asset formation rather than just security in the event of a
calamity such as death or disability, with capital frequently flowing from bank
accounts to insurance products according to fluctuations in the interest rates on
deposits. Similarly, economic and financial conditions make certain products popular
at certain times, and the influence of government agency regulation and initiatives
drives product sales more than the initiative of users or insurance companies. In other
words, external factors easily affect China’s insurance market.
The social insurance system encompassing medical and pension insurance is now
in an adjustment phase. The insurance industry and government agencies must
emphasize the importance of and the need for the essential security function of
insurance, such as medical, casualty and death insurance.
The foreign-capital insurance company AIA Group Limited was the first to enter
China’s individual agent channel in 1992. Since then, this channel has become
important in China’s life insurance market. Today, the three major insurance market
channels are individual agents, bancassurance sales, and direct sales by insurance
company employees. Internet sales and telemarketing are new sales channels that are
gaining popularity, especially for non-life insurance, but still only account for about 1
percent of the life insurance market (Figure 3).
Expansion of the Bank Sales Channel and the Addition of Insurance Companies to Bank Groups
Source: Annual Report of China Insurance Market 2007 and 2010-2011, edited by the China Insurance Regulatory Commission and published by China Financial Publishing House
Figure 3: Life Insurance Sales Channels (Premium Income Basis)
2007 2010
21

Originally, the household savings rate was high in China, and banks had long
been the intermediary in financial asset formation. The strong social credibility of
banks as financial institutions has engendered familiarity with the insurance market’s
bancassurance channel among users, especially for savings-type products. Of particular
note, insurance companies used banks to sell the investment-type insurance products
mentioned earlier. As a result, bancassurance generated growth in insurance sales from
around 2007, and became a key channel that has driven the insurance market from
2008. Exemplifying its increasing significance and importance, the bancassurance
channel accounted for half of the overall market in 2010 (Figure 3).
Against this background, bancassurance benefited both banks and insurance
companies. For example, banks were able to generate stable fee income without the
use of capital at a time when equity capital regulations were becoming more rigorous,
while insurance companies gained access to the enormous customer base of banks.
Banks have submitted a steady succession of applications to invest in insurance
companies since receiving permission for this investment in January 2008. Of note, banks
have taken over insurance company investments from which large Chinese companies and
major foreign-capital firms have withdrawn since the global financial crisis. Approximately
one bank per year has received approval to invest in an insurance company since around
the end of 2009, with three banks – Bank of Communications, Bank of Beijing and China
Construction Bank – receiving approval for their applications. Moreover, approval is
pending for three other banks – Industrial and Commercial Bank of China, Agricultural
Bank of China and China Merchants Bank. Thus banks are likely to continue forming
groups that include insurance companies in the future.
3. China’s Life Insurance Market: Current Conditions and Future Direction
Source: Created by complementing publicly available authorized disclosure of the before and after investment data from the China Insurance Regulatory Commission website with company press releases
Figure 4: Investment by Major Chinese Banks in Insurance Companies
22

The Toa Reinsurance Company, Limited — Japan’s Insurance Market 2012
On the other hand, CIRC has been enacting bancassurance regulations since
2009. CIRC temporarily halted previously brisk bancassurance sales of investment-
type insurance in Beijing and Shanghai at the end of 2008, then introduced various
rules in 2009. These included a requirement that banks establish dedicated in-branch
bancassurance counters staffed by qualified experts who had taken specified training
courses.
In 2010, the China Banking Regulatory Commission (CBRC) added several
mandates to the previously mentioned rules. These included a rule basically limiting
banks to agency agreements with a maximum of three insurance companies to address
sharply rising fees and unauthorized transfers by banks, and a rule requiring qualified
employees to handle bancassurance.
These moves limited bancassurance agency agreements and encouraged banks to
favor their group insurance companies or affiliates in strengthening ties with insurance
companies.
Under China’s 12th Five-Year Plan running through 2015, CIRC has added the
goal of increasing security-type insurance product sales to its existing emphasis on
savings-type product sales, while aiming for a market structured to emphasize essential
insurance functions. Similarly, in sales channels insurance companies may need to
emphasize sales of medical, critical illness and level-premium whole life insurance
through individual agents in addition to relatively simple savings-type products
through bancassurance mechanisms. Individual agent market share has fallen to about
40 percent because of problems with deceptive practices at the time of sale and the
entrenched position of bancassurance. However, this share may well increase in the
future as a result of changes in insurance market product mix.
Having covered products and channels in China’s insurance market in the
previous section, I would like to discuss actual levels of insurance penetration in
China.
Dividing China into the eastern, central and western regions, the eastern region
with its economically developed coastal areas accounts for about 50 to 60 percent of
premium income for China as a whole. The advance of insurance penetration in the
eastern region is intimately connected with China’s history. For example, China’s first
insurance company was founded in Guangzhou in 1805. Shortly after, insurance
companies were established in the coastal areas of Shanghai and Tianjin after these
ports opened up as a result of the Opium War with the United Kingdom. Today, these
areas feature advanced insurance penetration as well as economic growth.
Looking at insurance company head offices, branches and sales offices by region
underscores their significant impact on regional disparities in insurance share. About
85 percent of all insurance companies in China have their head office in the
economically developed coastal areas of the eastern region, where about 50 percent of
all branches and sales offices for both life and non-life insurance are located. Basically,
the location of insurance sales infrastructure alone accounts for almost all of the
regional disparities in premium income.
Regional Variations in Insurance Penetration
23

Moreover, premium income per capita for China was 1,083 yuan in 2010, but
varied significantly by region (Figure 5). For example, premium income per capita was
6,310 yuan in Shanghai, 5,407 yuan in Beijing and 4,000 yuan in Shenzen,
demonstrating higher penetration in these economically developed eastern cities than
in other cities and regions. While gross regional domestic product varies between
Shanghai, with the highest premium income per capital of 6,310 yuan, and the Xizang
(Tibet) Autonomous Region, with the lowest per capital premium income of 172.6
yuan, the difference of about 37 times for per capita premium income is pronounced.
Additionally, the highest share of premium income in gross regional domestic
product was 7 percent in Beijing, which is on par with developed countries, while the
lowest was a paltry 1 percent in the Xizang (Tibet) Autonomous Region.
3. China’s Life Insurance Market: Current Conditions and Future Direction
Source: Created by complementing data for each region from People’s Bank of China, China Regional Financial Operation Report (2010), with publicly available data from the China Insurance Regulatory Commission website
Figure 5: Insurance Penetration by Region (2010)
24

The Toa Reinsurance Company, Limited — Japan’s Insurance Market 2012
The target of sustained growth in China’s insurance market will require further
gains in existing markets where insurance penetration is advanced, and new business
development in untapped markets where insurance penetration is not advanced.
However, the great disparities between these two market types suggest that products
sold will vary significantly according to region, income and customer.
Besides the existing market of Tianjin, several regions have high rates of
economic and premium income expansion that indicate potential for growth. Hainan
Province, Qinghai Province and Hubei Province are regions that are promoting resort
and energy development as well as infrastructure investment. Premium income growth
was particularly strong in Hainan Province and Qinghai Province at more than 40
percent year on year. While the current insurance markets are small in these regions,
they are expected to have strong potential for growth.
On the other hand, the Xinjiang Uygur Autonomous Region, the Tibet
Autonomous Region and Gansu Province are not on the insurance industry’s second
avenue for growth as discussed above, and the gap between these and other areas is
widening. Insurance penetration in these areas will not center on standard insurance
products. Rather, it may come from small-amount insurance, or microinsurance,
similar to postal life insurance in Japan, which provides a certain measure of security at
a low premium. Post offices throughout the country and large Chinese life insurance
companies that are familiar to people in regional areas will be the channels enabling
penetration, particularly for small-amount insurance in low-income demographics and
regions where the purchase of standard insurance products is difficult.
Thus, while the insurance industry has work to do in each region, the overall
Chinese insurance market is growing strongly. How has CIRC defined the future
direction for the development of the market?
Since 2006, CIRC has formulated and executed five-year plans for the
development of the insurance industry. In 2011, it announced the five-year plan
through 2015, which has the following five major objectives.
The 12th Five-Year Plan for the Insurance Industry and Future Direction
25

CIRC’s numerical targets for 2015 include a 100 percent increase in market scale
compared to actual 2010 market scale (Figure 6), which would be the same growth
rate targeted during the five-year plan launched in 2006. Specific targets for 2015 are
total life and non-life premium income of 3 trillion yuan, compared with 1.45 trillion
yuan for 2010; total insurance industry assets of 10 trillion yuan, compared with 5.05
trillion yuan for 2010; and per-capita premiums of 2,100 yuan, compared with 1,083
yuan for 2010.
In addition, the plan envisions a future market in which insurance companies
switch their priority from their former focus on expanding scale to enhancing their
presence in the financial industry, thus aiming to improve and strengthen their social
standing. In this regard, the Great Sichuan Earthquake of 2008 reaffirmed the role of
the insurance business in supplementing national systems for handling situations such
as catastrophes. China’s response to the global financial crisis provides further
background, as measures to expand internal demand through means such as
infrastructure investment highlighted the important role of institutional investors.
Moreover, the CIRC anticipates the shift of its powerful market and policy leadership
to insurance companies and users in stages with progress in doubling national income
and increasing insurance penetration over the coming five years.
3. China’s Life Insurance Market: Current Conditions and Future Direction
Source: Outline of 12th Five-Year Plan for the Chinese Insurance Industry’s Development (China Insurance Regulatory Commission, 2011)
Figure 6: The Five Major Objectives of the 12th Five-Year Plan for the Insurance Industry
26

The Toa Reinsurance Company, Limited — Japan’s Insurance Market 2012
CIRC’s objectives for life insurance products include encouraging expansion in
long-term savings products such as endowment insurance and medical insurance as
well as in security-type products, accompanied by stable, moderate growth in
investment-type insurance. Concerned that a drop in stock prices will cause a wave of
policy cancellations and unsettle the market, CIRC is aiming for a market structured
to emphasize even greater stability for the essential security function of insurance.
With China overhauling the medical insurance and pension systems that make up its
social insurance and the one-child policy accelerating the onset of an aging society,
expanding the penetration of supplemental savings-type and security-type products
has become a critical task. CIRC has also targeted more diverse sales systems,
encouraging insurance companies to use channels suited to their sales models. This
involves increasing sales via bancassurance and individual agents and incorporating the
relatively new channels of telemarketing and the Internet.
On the other hand, the regulations for investing in insurance companies have
eased as part of deregulation, resulting in easing of restrictions on the size of equity
stakes when appropriate. This is adding breadth and diversity to the capital base of
insurance companies by supporting government, private and foreign investment.
Previously, CIRC restricted the equity stake of a single investor to less than 20 percent
in principle, but eased this restriction when relevant conditions were met. Foreign
investment is subject to separate regulations. However, CIRC may significantly ease
investment limits in light of the level of bank investment in insurance companies.
Foreign life insurance companies are limited by law to 50 percent or less equity
ownership of life insurance companies established jointly with a Chinese firm. They
also receive treatment that is unofficially quite different from their Chinese
counterparts, such as longer wait times for approval of applications in each jurisdiction
to establish operations and begin sales. While restrictions on foreign investment are
likely to ease over the medium and long term, this may well take time considering the
degree of maturity of the market.
The Chinese insurance market of the future will have a stronger presence both
domestically and internationally. A SwissRe Sigma report forecasts that China will rise
to second in the world in terms of premium income from life insurance in 2021.
While China has many issues to refine and resolve in becoming a truly major player in
global insurance, its potential for growth is enormous. Expectations are great for
China to fulfill this potential as Asia’s premier growth market.
27

Figure 1: Insured Catastrophe Losses
28
An unprecedented combination of catastrophe events in the last two years have
tested the insurance and reinsurance industry in Japan as never before, focussing
global attention on risk assessment and risk management in Japan and in the Asia
Pacific region. The magnitude and destruction of the March 11, 2011 Great East
Japan Earthquake and Tsunami, and the extent of the human tragedy, captured the
world’s attention, while the response of the Japanese people commanded the respect
and admiration of all. By contrast, the widespread damage to property and to balance
sheets from the floods in Thailand last year was not immediately recognized and it is
still, even now, being evaluated. The losses incurred by our industry have been
exceptional not only in their sheer size and financial impact, but also in their nature,
highlighting the need to improve not only the understanding of known risks, but also
the need to capture exposures that were previously either unrecognized or
insufficiently provided for.
Yet, in the face of these adverse events, the insurance and reinsurance industry
has continued to demonstrate its qualities of resilience. While 2011 ranked as the
second largest year in terms of the size of insured catastrophe losses, it ranked first for
reinsured catastrophe losses. Nonetheless reinsurance capacity, measured by capital,
returned to its previous record high of 470 billion U.S. dollars at the end of the first
quarter of 2012. Insurers’ capital too continued to grow to new records. There
continues to be an excess of supply over demand for reinsurance globally.
4. Dominic Christian Co-CEO, Aon Benfield
Japan’s Insurance and Reinsurance Market 2011-2012 – Resilience in Adversity
Introduction
Source: Aon Benfield Analytics
2929
Japan Treaty Renewals 2012
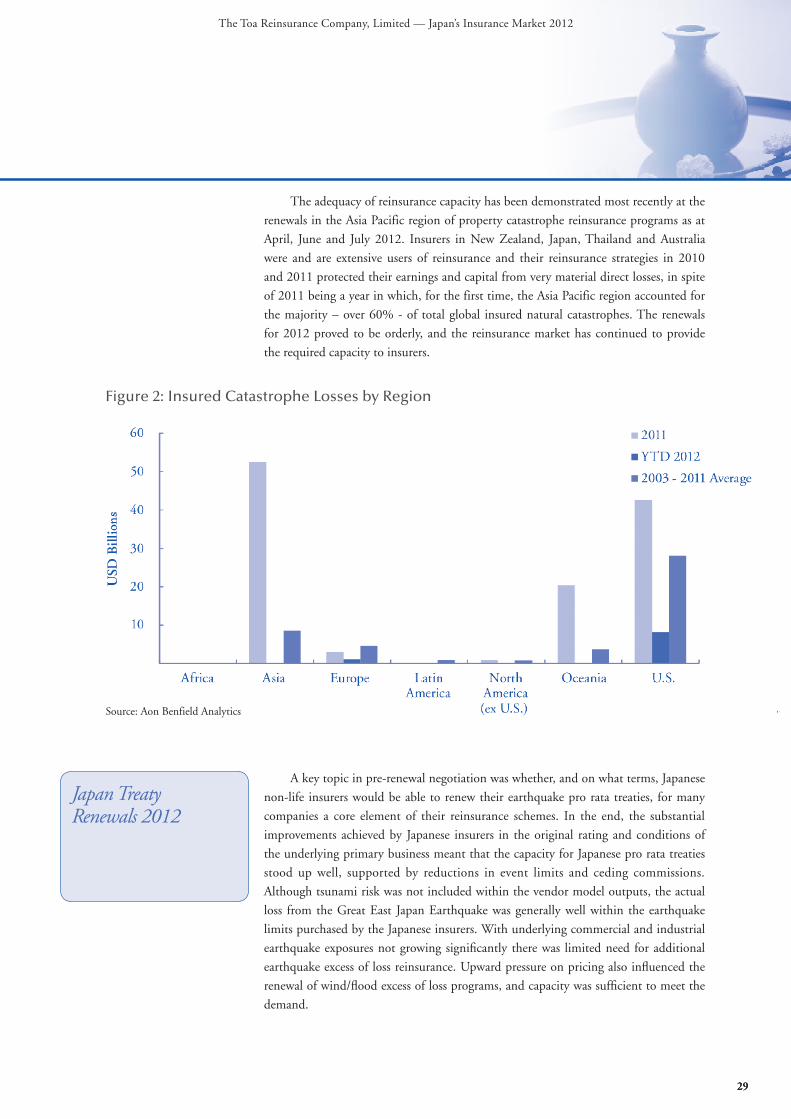
The adequacy of reinsurance capacity has been demonstrated most recently at the
renewals in the Asia Pacific region of property catastrophe reinsurance programs as at
April, June and July 2012. Insurers in New Zealand, Japan, Thailand and Australia
were and are extensive users of reinsurance and their reinsurance strategies in 2010
and 2011 protected their earnings and capital from very material direct losses, in spite
of 2011 being a year in which, for the first time, the Asia Pacific region accounted for
the majority – over 60% - of total global insured natural catastrophes. The renewals
for 2012 proved to be orderly, and the reinsurance market has continued to provide
the required capacity to insurers.
A key topic in pre-renewal negotiation was whether, and on what terms, Japanese
non-life insurers would be able to renew their earthquake pro rata treaties, for many
companies a core element of their reinsurance schemes. In the end, the substantial
improvements achieved by Japanese insurers in the original rating and conditions of
the underlying primary business meant that the capacity for Japanese pro rata treaties
stood up well, supported by reductions in event limits and ceding commissions.
Although tsunami risk was not included within the vendor model outputs, the actual
loss from the Great East Japan Earthquake was generally well within the earthquake
limits purchased by the Japanese insurers. With underlying commercial and industrial
earthquake exposures not growing significantly there was limited need for additional
earthquake excess of loss reinsurance. Upward pressure on pricing also influenced the
renewal of wind/flood excess of loss programs, and capacity was sufficient to meet the
demand.
The Toa Reinsurance Company, Limited — Japan’s Insurance Market 2012
Figure 2: Insured Catastrophe Losses by Region
Source: Aon Benfield Analytics

4. Japan’s Insurance and Reinsurance Market 2011-2012 – Resilience in Adversity
30
The impact of the 2011 flooding in Thailand led to very significant losses to the
major Japanese non-life companies, resulting in substantial reinsurance recoveries. The
scale of the Thailand losses was unexpected not only for insurers, but also for
reinsurers who had previously not considered flood in Thailand as a peril that would
give rise to a loss of this scale. The response of reinsurers at renewal included requiring
amendments in treaty terms and conditions, and a requirement for higher granularity
of information to ensure that all exposures are properly understood and priced for.
Reinsurers required details of improvements in primary underwriting and
accumulation control of natural perils and business interruption (including contingent
business interruption), along with a well-articulated strategy as to how clients will
achieve this. Without detailed exposure data, capacity was limited or pricing was
loaded for uncertainty. Even with it, there were substantial rate increases for loss-
affected contracts, as well as tighter reinstatement conditions and a restriction on the
cover available for natural perils.
The combination of two such major loss events, in less than a year, reinforced the
value of the reinsurance product, as well as the need for a robust process to ensure a
clearer understanding of the potential for global catastrophe losses. There were
substantial variations in the response and the renewal appetite of individual reinsurers,
with some reducing their level of commitment in Japan while others found that
increased pricing and improved transparency allowed them to step up their support
for the Japanese market at renewal. Substantial reinsurance capacity continued to be
available for Japanese programs and the market remained in balance. The successful
completion of renewal was facilitated by appropriate adjustments to treaty terms and
conditions, but it also owed much to the strength of the relationships built up over
many years between Japanese non-life insurers and their leading reinsurers. The supply
of capacity was sufficient to meet Japanese insurer demand and an orderly renewal was
achieved, albeit at increased prices.
This is not to say that significant challenges do not lie ahead. The size of the
region’s losses in 2011 has caused many reinsurers fundamentally to re-evaluate their
strategies in Japan and the Asia Pacific region. The combined ratio of the group of
reinsurers monitored by Aon Benfield (in our Aon Benfield Aggregate analysis)
increased to 108.2 percent in 2011, an increase of 13.5 percentage points compared to
2010, with a 14.1 percentage point increase in natural catastrophe losses. Reinsurer
returns on equity in 2011 dropped to 3 percent due to catastrophe losses and lower
investment yields; although analyst consensus earnings for public reinsurers show
returns on equity recovering to the 10 percent range for 2012 and 2013.

31
Evaluation of risk, and more comprehensive risk management, to include
formerly “non-modelled” perils, will be a major area of focus in the near term, and
with revised vendor models expected to be released in 2013 we expect that significant
resources will need to be dedicated to this subject. It is apparent that the enhancement
of their risk management function has already been made a priority by insurers. The
importance which we place on understanding risk ourselves is underlined by our own
preparedness to make a significantly increased investment in our analytics capabilities
in the Asia Pacific region. We shall continue to develop catastrophe models proactively
as well as in response to major industry events: for instance, following the Thailand
floods in 2011, we are creating a Thai flood model, which will assist insurers better to
understand their exposures, while assisting analysis of the appropriate pricing for the
transfer of risk through reinsurance.
In the last decade and more, market consolidation and merger and acquisition
activity in the Japanese market has led to the creation of major insurance groups with
global interests, and substantial reinsurance programs, in some cases among the largest
catastrophe programs in the world. In future, the expectation is that further market
consolidation will ensure that Japanese demand for capacity continues to grow, even
before allowing for potential growth in the demand for protection against natural
perils in the primary market, or for changes in original policies which may be
introduced in the future to expand the cover given.
In spite of these challenges, there is I believe good reason to be positive about the
prospects for the insurance and reinsurance industry in Japan.
The Toa Reinsurance Company, Limited — Japan’s Insurance Market 2012
Figure 3: Aon Benfield Aggregate Combined Ratio Comparison
Source: Individual Company Reports, Aon Benfield Analytics

4. Japan’s Insurance and Reinsurance Market 2011-2012 – Resilience in Adversity
32
Our industry has once again demonstrated its ability to regenerate capital quickly
following significant market events. Reinsurance capacity increased to 470 billion U.S.
dollars by the end of the first quarter of 2012—back to 2010 peak levels. Lower than
average global catastrophe losses through the first quarter of 2012, and increased
premiums at 2012 renewals have also assisted reinsurers in increasing capital. At the
time of writing, low catastrophe loss activity in the second quarter is expected to result
in further increases of capital for the first half of 2012.
This essentially stable capital position underlines the point that, despite the
exceptional number of large global natural catastrophes in 2011, losses to reinsurers
were substantially contained within earnings, rather than eating too far into capital
bases. Nonetheless, it can clearly be seen that reinsurers are being driven by the losses
towards a greater determination to understand the breadth of coverage provided under
treaties, raising concerns about issues including data transparency, event limits,
catastrophe cover under per risk XL treaties, and exposure to CBI risks.
Traditional reinsurance providers have indeed been severely tested but, as the
robustness of their capital position demonstrates, it is clear that they have responded well
to the challenges. At the same time, we have seen significant development of the
Insurance-Linked Securities (ILS) market in the first half of 2012. Catastrophe bonds
continue to enjoy an expanding market position and continue to influence the market
by adding a meaningful alternative to traditional reinsurance. The issuance in recent
quarters has been very strong, and growing interest from investors has provided insurers
better price visibility and multiple year commitments. Both features are important to
insurers and new demand continues to flow to this market. Following a record 1.493
million U.S. dollars in catastrophe bond issuance in the first quarter of 2012, the second
quarter saw seven catastrophe bonds successfully closed, providing 2.095 million U.S.
dollars of new capital to repeat and new sponsors. As of June 30, 2011, there was 14.9
Figure 4: Change in Reinsurer Capital
Source: Individual Company Reports, Aon Benfield Analytics
Capital Markets
Capital Strength

33
Conclusions
billion U.S. dollars of catastrophe bonds on risk, up 3.4 billion U.S. dollars compared to
the same period in 2011. Following such strong activity in the first half of the year,
annual issuance for 2012 is anticipated to reach 6 billion U.S. dollars. Sidecar issuance
also continued to gain momentum in the second quarter of 2012, with New Point Re V,
AlphaCat Re 2012, Upsilon Re and Timicuan Re III all successfully raising capital, and
existing facilities, such as Accordion Re, also raising additional capital.
The rapid response and quick settlement of dwelling earthquake related claims by
the General Insurance Association was widely reported, and the extent of the payments
made continues to be well documented. This is an immense credit to the Japanese non-
life insurance industry.
In the aftermath of the major events of the past year and a half, billions of dollars of
claims have been collected – at least 10 billion U.S. dollars by our company alone - and
been paid on to primary insurers, helping them in turn to meet their own obligations to
pay policyholders.
The insurance and reinsurance industry has shown itself, taken as a whole, to be
sufficiently robust to weather the storm of recent events, and to be able to maintain or
even increase the level of capital deployed even after such a sequence of major loss events.
Global financial markets as a whole have experienced a turbulent period over the
last 4 or 5 years and, looking ahead, it is possible to foresee a difficult period for the
economy and for financial services for a few years more. And yet, the insurance and
reinsurance industry, in Japan and globally, has demonstrated its power of resilience and
its durability to good effect, even in the most adverse circumstances. The fact that
reinsurance capital is at an historic high provides a reason to believe that the industry is
on the right track: it indicates a belief in the industry, and in its core investors, that a
sustainable return can be achieved through good management and improved
understanding of risk. Not only has our industry performed strongly in surmounting the
difficulties of the recent past; it is also robust and resilient enough to face future
challenges with confidence.
Figure 5: Catastrophe Bond Issuance by Quarter (USD Millions)
Source: Aon Benfield Securities, Inc.
The Toa Reinsurance Company, Limited — Japan’s Insurance Market 2012
Figure 4: Change in Reinsurer Capital
Source: Individual Company Reports, Aon Benfield Analytics
The twenty-six non-life insurers comprising the members of the General
Insurance Association of Japan recorded the fiscal 2011 business results described
below.
Net premium income in all lines of business increased to 7,116.1 billion yen, up
145.1 billion yen from the previous fiscal year, as changes in premium rates increased
premium income from Compulsory Automobile Liability Insurance and automobile
insurance and a rise in earthquake insurance contracts following the Great East Japan
Earthquake led to growth in premium income from earthquake insurance.
Net claims paid increased to 5,505.8 billion yen, up 1,187.1 billion yen from the
previous fiscal year, due to payments related to the Thailand floods and the Great East
Japan Earthquake, as well as to typhoons and other natural disasters that occurred in
Japan. The loss ratio increased by 15.9 % to 83.4%.
Operating and general administrative expenses related to insurance underwriting
declined to 1,162.7 billion yen, down 29.5 billion yen from the previous fiscal year,
due to reductions in both non-personnel expenses and personnel expenses. As a result,
the net expense ratio decreased by 0.8% to 33.8%.
Net underwriting profit declined by 155.9 billion yen from the previous fiscal
year to 339.1 billion yen in the red, the largest loss to date, mainly due to additions to
loss reserves for the Thailand floods. Claims paid for the Great East Japan Earthquake
had a limited effect on net underwriting profit for fiscal 2011, because the associated
loss reserves were recorded in the previous fiscal year.
Ordinary profit including return on asset investments was 80.1 billion yen, down
154.2 billion yen from the previous year, and the net loss was 262.1 billion yen.
(1) The Great East Japan Earthquake
The magnitude 9.0 earthquake that occurred on March 11, 2011, the largest in
recorded history in Japan, and the accompanying large tsunami caused unprecedented
damage to a widespread area of the Pacific coast in eastern Japan.
In Japan, insurance policies against earthquake risk generally consist of two types:
earthquake insurance policies for personal dwellings (earthquake insurance policies
subject to the “Act on Earthquake Insurance”) and earthquake insurance policies for
companies (earthquake coverage endorsements).
A. Earthquake Insurance Policies for personal dwellings (Earthquake Insurance
Policies Subject to the “Act on Earthquake Insurance”)
An earthquake insurance policy is a contract attached to a fire insurance policy. It
is entered into for between 30% and 50% of the insured amount of the fire insurance
policy with the aim of stabilizing the living conditions of people whose homes are
damaged. In addition, private insurers and the central government jointly run a
reinsurance system. Private insurers and the central government share responsibility
for earthquake insurance policies. The system requires the central government to bear
a higher percentage of the loss caused by an earthquake when the loss exceeds a certain
5. Trends in Japan’s Non-life Insurance Industry
Overview of Business Results of Non-Life Insurance Companies
Effects of a Series of Natural Catastrophe Losses Including the Great East Japan Earthquake and Thailand Floods
Underwriting & Planning Department The Toa Reinsurance Company, Limited
34
amount. After the Great East Japan Earthquake, the reinsurance scheme implemented
in May 2011 raised the amount borne by the central government and reduced the
amount borne by private insurers. The amount borne by the central government
was increased again in April 2012. The number of consumers holding earthquake
insurance policies has increased, mainly in regions that suffered the most damage in
the Great East Japan Earthquake.
According to an announcement made by the General Insurance Association of
Japan, almost all insurance claims for earthquake insurance policies had been paid as
of April 2, 2012. Claim payments amounted to more than 1.2 trillion yen, about 16
times as much as those made for the Great Hanshin Earthquake, the largest payment
event before the Great East Japan Earthquake occurred. To evaluate losses and pay out
on insurance claims as soon as possible in areas that suffered the greatest damage, the
non-life insurance industry took prompt actions such as certifying the total loss areas
utilizing aerial and satellite photos.
B. Earthquake Insurance Policies for Companies
Most earthquake insurance policies for companies are fire insurance policies, and
are secured by the endorsement of indemnifications for losses caused by earthquakes
and tsunami. According to an announcement made by the Financial Services Agency
(FSA), the amount of claims payments related to the Great East Japan Earthquake
(across all 5 major non-life insurers), other than those made under earthquake
insurance policies for consumers described in A. above, is estimated at approximately
600 billion yen (net claims paid: about 200 billion yen).
Given the scale of insurance claims and the rise in reinsurance premiums
following the Great East Japan Earthquake, non-life insurers increased their primary
premium rates for earthquake insurance policies for companies. The amount of the
rise depended on the conditions of individual policies, such as the policyholder’s
location and the number of years since construction; however, in some cases involving
insurance policies on the Pacific coast side of the Tohoku area, which was damaged
by the Great East Japan Earthquake, the premium rate increased to about double its
previous level. This is one of the largest rises ever recorded.
(2) Thailand Floods
Floods gradually spread from Northern Thailand to Southern Thailand between
July and October 2011 to submerge 8 industrial parks near the Chao Phraya River,
an area where major Japanese company plants are concentrated, and forced many
companies to halt operations for long periods. In relation to direct damage caused
to buildings, production facilities and stock, etc., it is estimated that profits lost due
to long-term shutdowns and contingent business interruption losses resulting from
shutdowns among suppliers and others will result in payouts for a large number of
insurance claims. According to results for the year ended March 2012, three mega
groups are expected to pay total net insurance claims of more than 500 billion yen for
the Thailand floods.
Underwriting & Planning Department The Toa Reinsurance Company, Limited
35
The Toa Reinsurance Company, Limited — Japan’s Insurance Market 2012

The Thai government, as well as insurers and reinsurers, had traditionally
regarded the risk of natural disasters in Thailand as low. Such extensive, long-
term floods had not been foreseen. Given the damage caused by the floods, the
Thai government is conducting projects to build infrastructure including drainage
facilities, and is considering establishing a publicly and privately funded reinsurance
scheme covering floods, wind disasters and earthquakes. The terms and conditions of
insurance policies had traditionally been to cover all risks including those of natural
disasters. However after the flood loss, terms and conditions for underwriting such
risks are being tightened by measures including setting up sub-limits and deductibles
and increasing insurance premiums. Furthermore, insurers and reinsurers are taking
actions including improving their data to enhance concentrated risk management.
(3) Renewal of Japanese Reinsurance Treaties
During the April 2012 round of Japanese reinsurance treaty renewals, we saw
a large rise in reinsurance premium rates for non-proportional treaties due to the
effects of the Great East Japan Earthquake and the Thailand floods, a reduction in
reinsurance ceding commissions for pro-rata treaties, the introduction of/reductions
in event limits for natural disasters, limits on overseas natural disaster risk, etc. In
addition, premium rates for excess of loss cover (ELC) for wind and flood, etc. have
been increased because of the hardening market. Given the Thailand floods, treaties
covering overseas risks must disclose detailed exposure information to enhance their
transparency.
It was reported in March 2012 that a merger between NIPPONKOA Insurance
Company, Limited and Sompo Japan Insurance Inc., which fall under the umbrella
of NKSJ Holdings, Inc., one of three mega groups in the Japanese non-life insurance
industry, was scheduled for the first half of fiscal 2014 to establish Sompo Japan
Nipponkoa Insurance Inc.
The following shows non-life insurers that will fall under the umbrella of the
three mega groups after the merger.
Industrial Reorganization
Tokio Marine HD
Tokio Marine & Nichido Fire Insurance Co., Ltd.
Nisshin Fire & Marine Insurance Co., Ltd.
Mitsui Sumitomo InsuranceCompany, Limited
Aioi Nissay Dowa InsuranceCo., Ltd.
Sompo Japan Nipponkoa Insurance Inc.
(After the merger scheduled for fiscal 2014)
MS & AD Insurance Group HD NKSJ HD
Main Non-life Insurers under the Umbrella of the Three Mega Groups
5. Trends in Japan’s Non-life Insurance Industry
36
The Toa Reinsurance Company, Limited — Japan’s Insurance Market 2012
Given the mature state of the non-life insurance market in Japan, non-life
insurers have been expanding their overseas businesses around the world, mainly
in Asian emerging countries where growth rates are remarkably high. Major recent
overseas initiatives are summarized as follows.
(1) Automobile Insurance
The Non-Life Insurance Rating Organization of Japan, which determines
loss cost for automobile insurance, has revised the classified rating system for non-
fleet automobile insurance. The new system defines 20 policyholder classes and
extra/discounted rate coefficients applicable to policyholders to reflect in rates risks
corresponding to their accident history. It was introduced in April 2012 with a
communication period of a year, and contracts will be entered into from April 2013
based on the new classes/coefficients.1
Business Expansion into Overseas Markets
Product Trends
Date Company Name Recent Overseas Initiatives
May 2011 Tokio Marine Holdings, Inc. Announced establishment of Tokio Marine North America, a holding company managing insurance business in the U.S.
June 2011 Tokio Marine Holdings, Inc. Made an equity investment in U.S.-based agency WNC through group company Kiln Ltd., a U.K.-based Lloyd’s insurance company
June 2011 Sompo Japan Insurance Inc. Completed acquisition of additional shares in Malaysia-based Berjaya Sompo Insurance
July 2011 Aioi Nissay Dowa Insurance Co., Ltd. Opened a Zhejiang branch of Chinese subsidiary
August 2011 Tokio Marine Holdings, Inc. Opened a Jiangsu branch of Chinese subsidiary
August 2011 Tokio Marine & Nichido Fire Insurance Co., Ltd. Reached a basic agreement on acquisition of shares in U.S.-based First Insurance Company of Hawaii, Ltd.
November 2011
Tokio Marine Holdings, Inc. Gained approval to prepare for the establishment of a Beijing branch of Chinese subsidiary
May 2012 Tokio Marine Holdings, Inc. Completed procedures for acquiring Delphi Financial Group, Inc., the U.S.-based life and non-life insurance group
June 2012 NIPPONKOA Insurance Co., Ltd. Opened a representative office in Cambodia
1. New classes and coefficients are applicable to renewed contracts when an accident occurs within the term of a contract entered into after April 2012 and the contract is renewed during the communication period.
37

Regulation Topics
The revision is designed to apportion the burden of rate payment more fairly
between policyholders. More specifically, there is a large difference in actual risk
status between policyholders involved in no accidents during the term of the previous
contract and those involved in accidents, even when they are classified into the same
class. The class coefficients are divided into those for policyholders with no accidents
(accident-free coefficient) and those for policyholders with accidents (accident
coefficient), then all the class coefficients are reviewed given the recent actual risk
status. Coincidentally, after the revision, the rule whereby the policyholder’s class
remains unchanged in the following fiscal year in cases where their accidents satisfy
certain conditions has been abolished.
(1) Trends in Solvency Regulation
As a result of the revision of the regulations implementing the Insurance Business
Law, new calculation standards have been applied to the solvency margin ratio — an
indicator of the financial health of insurers — since the fiscal year ended March 2012.
The new standards include a limit on items included in margin, an increase in the
risk coefficient confidence level for general insurance risk, price fluctuation risk, and
subsidiary risk, and a requirement that earthquake disaster risk for fire insurance be
calculated through a risk model. In addition, the solvency margin ratio, which had
previously been calculated for non-consolidated insurance companies, has also been
calculated for all insurance groups on a consolidated basis from the fiscal year ended
March 2012.
Furthermore, the FSA is considering introducing an economic value-based
solvency margin ratio.
(2) Trends in Regulations on Co-operatives
As a result of revisions made to the Insurance Business Law in 2005, it was
decided that from a policyholder protection perspective, legal regulations would apply
to co-operatives, which had previously been beyond their scope (so-called “unregulated
co-operatives”) and for which there was no legal basis for their regulation, and mutual
aid associations were deemed to fall into the “insurance company”, “small amount
and short-term insurance provider” or other categories. Pursuant to the revisions, a
maximum amount of sum insured was imposed on small amount and short-term
insurance providers for insurance policies that could be underwritten2 through the
transitional measure taken up to March 2013. However, the Insurance Business Law
was revised in March 2012, and after a partial amendment, the transitional measure
was extended by 5 years to March 2018.
5. Trends in Japan’s Non-life Insurance Industry
2. Providers to underwrite only small amount and short-term insurance policies within a certain scale of business.
38
The Toa Reinsurance Company, Limited — Japan’s Insurance Market 2012
Many associations are having difficulties satisfying the regulations immediately.
In November 2010, the Insurance Business Law was revised as a temporary measure to
relieve these associations so they can maintain their activities on an exceptional basis as
“authorized specific insurance organizations” under certain conditions.3
(3) Introduction of System for Evaluating Insurance Inspections
The FSA has announced the introduction of a system for evaluating insurance
inspections.
The system’s introduction is designed to promote insurers’ efforts to make
voluntary and continuous improvements in management and reciprocal discussions
between inspectors and insurers by evaluating the results of inspections in stages in
accordance with the Insurance Inspection Manual, as well as to make inspections more
efficient by relating evaluation results to optional administrative actions to improve the
transparency of financial administration.
Life and non-life insurers subject to FSA supervision will be evaluated and
graded A-D on eight items: “business management (governance) system and basic
factors”, “compliance system”, “insurance solicitation management system”, “customer
protection management system”, “integrated risk management system”, “insurance
underwriting risk management system”, “asset investment risk management system”
and “operational risk management system”.
3. It has already been decided that the temporary measure will be revised in 5 years.39

(1) One Year after the Great East Japan Earthquake
One year has passed since the Great East Japan Earthquake resulted in 15,858
deaths and 3,021 missing people (as of May 16, 2012), as well as tens of trillions of
Japanese yen in economic losses. We are now beginning to recover step by step from
the earthquake and to look to the future.
Looking back over the last one year, almost all the topics that have occupied our
attention are linked to the earthquake.
Even if largely motivated by daily news reports, a huge amount of donations,
exceeding 340 billion yen from domestic sources alone, was sent to the damaged area,
and a mood of support for the recovery became dominant across the country, although
culpability for the nuclear accident in Fukushima was consistently pursued, with
criticism focusing on the central government’s risk management system and its over-
dependence on nuclear power for the supply of electricity.
Amid such an environment, the insurance industry was under close scrutiny by
society, because of the important role it plays in supporting the earthquake victims.
As a matter of fact, I believe we can say that the industry did not attract criticism at all
for its actions after the earthquake.
The Life Insurance Association of Japan initiated a number of actions
immediately after the earthquake.
The association established a disaster countermeasures office on March 11, 2011,
the day of the earthquake. On the following day, it announced an extension of the
grace period for premium payments and that some documents would not be required
in order to obtain claims payments on victims’ policies. Three days later, on March 15,
the association announced non-application of the earthquake exclusion.
At the beginning of April, the association launched a Damaged Area Life
Insurance Policy Check System and engaged vigorously in confirming the safety of
policyholders. This was done so that insurance companies could be proactive in paying
out insurance benefits without waiting for policyholders to demand claims payment,
given the victim’s situation. This was realized through the life insurance industry
voluntarily asking administrative authorities and the police to cooperate. According to
the association, as of March 14, 2012, one year after the earthquake occurred, the
safety of 99.97% of the 2.93 million policyholders in the three prefectures of the
Tohoku region that suffered the most serious damage had been confirmed. The
industry clearly demonstrated its mission to society and how to fulfill it through these
actions.
In addition to these actions taken by the whole industry, employees of life
insurance companies who themselves suffered damage in the earthquake visited the
homes and shelters of policyholders throughout the damaged areas, providing victims
with various forms of support and services beyond their firms’ contractual liability,
and their actions also enhanced the industry’s reputation. This was not only
appreciated by many people, but is also likely to provide many people engaged in the
industry with a chance to review their work.
6. Life Underwriting & Planning Department The Toa Reinsurance Company, Limited
Trends in Japan’s Life Insurance Industry
Main Topics in the Market
40
Life Underwriting & Planning Department The Toa Reinsurance Company, Limited
The association reported that the industry had paid 154.3 billion yen of
insurance benefits and estimated total payments of 167.0 billion yen in 20,256 cases
related to the earthquake as of April 30, 2012. Given that the industry usually pays
approximately 19 trillion yen of insurance benefits and approximately 3 trillion yen of
death benefits (including accidental death benefits) per annum in Japan, it can be said
that claims payments related to the earthquake had a limited effect on the financial
bases of insurance companies.
Even now, Japan faces a number of onerous issues, such as supporting victims
and ensuring electricity supply. On the other hand, a central government report
estimates the economy will grow 2.2% in fiscal year 2012 on an actual GDP basis,
rebounding from negative growth of 0.1% in the last year, ironically backed by
demand due to reconstruction from the earthquake, etc. So the Japanese economy is
beginning to enjoy a gradual revival.
Amid such circumstances, the industry performance also remains solid. As for
actions related to the earthquake, the Chairman of the Life Insurance Association of
Japan has stated that the “objectives of emergency actions have almost been achieved,”
adding that “under the ordinary system, the industry will make payments of insurance
benefits and provide follow-up services for policyholders, will continuously improve
the crisis management system taking large-scale disasters into account, and will
enlighten society on the meaning of life insurance.” The industry is turning its
attention towards the next stage following its actions in response to the earthquake.
(2) Impact of the European Debt Crisis
As the European debt crisis triggered by the Greek financial troubles has become
more severe, there have been concerns that Japanese life insurance companies, which
are known as large, globally active institutional investors, could also be affected by the
debt crisis. However, it seems that losses caused by the European debt crisis are,
somewhat surprisingly, limited to small amounts.
According to interim results reported by eight major life insurance companies for
the half year ending September 2011, their outstanding investments in and loans to
the PIIGS (five heavily indebted countries in Europe: Portugal, Italy, Ireland, Greece
and Spain) totaled 876.4 billion yen, including government bonds and public and
corporate bonds. Given that the total assets of these companies amounted to about
160 trillion yen for the same period, the direct effect of the PIIGS’ debt problems is
estimated at less than 0.5% of total assets in the whole industry.
By company, Nippon Life Insurance Company posted the largest balance in the
industry at 489.9 billion yen, followed by The Dai-ichi Life Insurance Company,
Limited with 160.3 billion yen, Meiji Yasuda Life Insurance Company with 120.8
billion yen, T&D (consisting of Taiyo Life Insurance Company & Daido Life
Insurance Co.) with 37.1 billion yen, Mitsui Life Insurance Company Limited with
27.4 billion yen, Fukoku Mutual Life Insurance Co. with 21.4 billion yen, Sumitomo
Life Insurance Co. with 19.5 billion yen and Asahi Mutual Life Insurance Co. with a
zero balance. After announcing their interim results, the companies have accelerated
plans to reduce outstanding investments and loans following an expansion of the
The Toa Reinsurance Company, Limited — Japan’s Insurance Market 2012
41

crisis; as a result, the eventual effect will probably amount to less than 1% of total
assets, even for each of these companies.
However, some sources have expressed concerns that the European debt crisis
may not be resolved at the PIIGS level and may spread to Germany and France, both
of which have a large amount invested in and loaned to the PIIGS. There are also
concerns among Europe-based life insurers entering Japan that some foreign life
insurers may be affected by the financial crisis of their parent companies, though no
specific news has yet been reported.
(1) Overseas Initiatives of Major Japanese Life Insurers
In recent years, we have seen a rapid increase in the overseas business expansion-
related activities of major Japanese life insurers. The following outlines activities
undertaken in the last six months:
Overseas Business Expansion among Major Japanese Insurers
November 2011: Dai-ichi Life announced it would form a joint venture with China
Huadian Corporation in fiscal year 2012, with an investment of 12.0
billion yen and a 50% investment ratio.
November 2011: Meiji Yasuda Life announced it would acquire Poland-based Europa
Group with its Germany-based business alliance partner, Talanx AG.
January 2012: Tokio Marine Holdings, Inc. announced it would acquire U.S.-based
Delphi Financial Group, Inc. for a total acquisition cost of 205.0
billion yen.
January 2012: Meiji Yasuda Life announced it would acquire Poland-based Warta
Group with its Germany-based business alliance partner, Talanx AG
with an investment of 22.0 billion yen and a 30% investment ratio.
February 2012: Nippon Life announced an investment in India-based Reliance
Capital Asset Management Limited with and investment of 22.0
billion yen and a 26% investment ratio.
N.B. In 2011, Nippon Life invested 58.0 billion yen in Reliance
Life Insurance Company Limited, a member of the same group as
Reliance Capital Asset Management Limited.
March 2012: Nippon Life entered into a business cooperation memorandum with
AIA Group Limited, which conducts business in 15 countries and
regions in Asia and Oceania. Nippon Life is also a 1% stockholder of
this group.
April 2012: Mitsui Sumitomo Insurance Company, Limited announced an
investment in India-based Max New York Life Insurance Company
Limited with an investment of 45.0 billion yen and a 26%
investment ratio. After the investment was made, the investee was
renamed Max Life Insurance Company Limited.
Trends among Life Insurers
6. Trends in Japan’s Life Insurance Industry
42

The Toa Reinsurance Company, Limited — Japan’s Insurance Market 2012
May 2012: Meiji Yasuda Life announced an increased investment in PT Avrist
Assurance, its Indonesian capital tie-up partner, taking the investment
ratio from 5% to 23%.
It goes without saying that these activities are designed to make up for the trend
toward a diminishing equilibrium in the domestic market. On the other hand, many
of these deals also seemed to be long-term prior investments or test cases, and they are
unlikely to be deemed dynamic acquisitions that will determine the fate of the insurers
concerned.
We expect the pattern of active overseas expansion among Japanese life insurers
to continue increasing, partly due to the recent trend of yen appreciation; however, in
our view, it will take some time before these acquisitions become indispensable to
Japanese life insurers.
(2) Unavoidable Reform of the Sales System
In recent years, the sales results of Japanese life insurers have shown a more
noticeable trend of depending on bancassurance.
Among the 8 major life insurers during the first half of fiscal year 2011, Meiji
Yasuda Life and Nippon Life grew annualized premiums due to an increase in sales of
whole life insurance with single payment, while Sumitomo Life and Fukoku Mutual
Life, which were unwilling to sell the above products and maintained a lower level of
bancassurance sales at the earlier stage, posted insurance premium results below those
for the same period of the previous year. As a result, this first-half performance was
dependent on each company’s attitude towards bancassurance.
However, there is some doubt about how to understand and evaluate the above
results as they stand.
Whole life insurance with single payment is not a protection type of insurance
product expected to be highly profitable, the traditional core product of major life
insurers, but is a savings type of insurance product with the motto “small profits and
quick return.” In selling the product, incentives work better at banks than at life
insurers.
Furthermore, it is doubtful whether it is possible to achieve investment
performance exceeding the assumed interest rate during a prolonged period of low
interest rates. In fact, Meiji Yasuda Life subsequently cut its assumed interest rate for
the product, and has maintained its bancassurance sales at an almost constant low
level. All life insurers are taking a passive stance toward sales of this type of product.
On the other hand, in the salesperson channel, the core channel for life insurers
in all products excluding bancassurance, the total number of sales representatives
employed by the eight major life insurers was 203,671 at the end of the first half,
slightly down from 204,265 at the end of the previous fiscal year. Sales from this
channel remain almost flat.
Life insurers have the same issues of improving the efficiency and productivity of
the existing sales representative channel, and are focusing on increasing over-the-
counter outlets, while being forced to keep bancassurance sales low.
43

Specifically, among major life insurers, Nippon Life increased its number of over-
the-counter “Nissay Life Plaza” outlets to about 100. Similarly, Dai-ichi Life also
increased its number of over-the-counter “Shogai Sekkei Park” outlets and extended its
business hours. Sumitomo Life increased the number of over-the-counter outlets
operated by a multi-company agency that is a wholly owned subsidiary of Sumitomo
Life, while Meiji Yasuda Life is increasing both its company-operated outlets and
multi-company outlets.
On the other hand, we are seeing a rapid increase in the number of outlets
operated by major independent over-the-counter agencies. “Hoken Ichiba,” which
means The Insurance Marketplace, operated by market leader Advance Create Co.,
Ltd., has about 270 outlets, and “Hoken no Madoguchi” and 3 other brands operated
by market follower Hoken no Madoguchi Group Inc. have about 250 outlets or more
in total. This trend is currently unstoppable.
In the past, theory has supported us in saying that it is difficult to make a success
of over-the-counter outlets in Japan. The time may come when actions taken to
develop over-the-counter outlets and the online channel, in which achieving success
has been deemed to be as difficult as in over-the-counter outlets, will largely determine
the results of life insurers.
The fiscal year 2011 business results for 43 life insurance companies in Japan were as
follows:
• Total Amount of New Business
During fiscal year 2011 the total insured amount of new business for individual
life increased to 64.2 trillion yen, up 1.9% from the previous fiscal year due to an
increase in whole life insurance in foreign and major life insurance companies.
Regarding individual annuity, the total insured amount of new business increased to
7.6 trillion yen, up 11.5% from the previous fiscal year, a rise attributable to a growth
in policies in major life insurance companies due to increased interest in individual
annuity driven by an aging society with a declining birthrate and the national financial
problems.
• Total Amount of In-force Contracts
As of the end of fiscal year 2011, the total insured amount of in-force business
for individual life declined to 865.3 trillion yen, down 1.6% from the previous fiscal
year, a fall attributable to weak growth in major life insurance companies in spite of a
continued trend of solid growth in subsidiaries of non-life insurance companies. On
the other hand, the total insured amount of in-force business for individual annuity
increased for the ninth consecutive year to 98.9 trillion yen, up 3.3% from the
previous fiscal year, mainly due to steady growth in major life insurance companies.
Overview of Business Results for Fiscal Year 2011
6. Trends in Japan’s Life Insurance Industry
44

The Toa Reinsurance Company, Limited — Japan’s Insurance Market 2012
• Annualized Premiums
The total of annualized premiums from new business increased to 2.8 trillion
yen, up 5.1% from the previous fiscal year, as a result of the increase in both
individual life and individual annuity. As for in-force business, annualized premiums
totaled 22.7 trillion yen, up 4.6% from the previous fiscal year, due to the increase in
both individual life and individual annuity.
• Premium Revenues / Total Assets
Total premium revenues increased to 36.6 trillion yen, up 4.4% from the
previous fiscal year, due to strong sales of savings-type products in major life insurance
companies. Total assets rose to 326.9 trillion yen, up 2.0% from the previous fiscal
year, as a rise in unrealized capital gains increased the value of investment assets.
(1) Medical Insurance Difficult to Differentiate
It is not an exaggeration to say that most of the products developed/launched
domestically in fiscal year 2011 were dominated by medical insurance products.
However, companies seem to have difficulty in giving their products distinctive
features and identification to enable successful marketing.
As for the details of medical insurance, it has been noticeable recently that
“advanced medical treatment” benefits are becoming standardized. These benefits were
developed based on the concept of preparing for the high medical costs incurred under
some circumstances in the treatment of cancer, the leading cause of death in Japan.
Some companies offer benefits for “irradiation therapy” and “anti-cancer drug
therapy”, which are similar to “advanced medical treatment” benefit.
Companies are making efforts to differentiate their medical care protection
benefits from those of others through the scope of protection and maximum benefit
payments. However, they also appear to have been put in a situation where it is
difficult to differentiate between products more efficiently through marketing.
With companies seeking new ideas on benefits, Tokio Marine & Nichido Life
Insurance Co., Ltd. launched a “Medical Kit”, with a “disability benefit rider for five
injuries and diseases” attached, in January 2012. This is the first product in Japan to
pay benefits when policyholders are prevented from working for more than 30 days as
a result of injuries or diseases. It will be worth noting whether such differentiation
enables the product to create a stir in the inactive new product development space in
the future.
Product Trends
45

(1) TPP Talk Makes Passage of a Bill to Revise the Postal Service Privatization Law More Uncertain
Progress on the bill to revise the Postal Service Privatization Law includes
expansion of the maximum amount of benefits per life insurance policy and the
business scope of Japan Post Insurance Co., Ltd. remains static pending for the start of
the Diet session.
Japan Post Insurance, which is well placed to provide universal services, has been
invested in by the central government since it was a public corporation. At the same
time, to prevent it from putting pressure on private businesses, it has been subject to
regulations on the scope of its business and on the maximum amount of benefits per
life insurance policy.
Now that 4 years has passed since its privatization, the central government is
making an attempt to lift these regulations to encourage Japan Post Insurance to
become independent, while the life insurance industry has often repeated its opinion
that it could not approve the bill unless the government withdrew its investment and
ensured a “level playing field” for Japan Post Insurance and private life insurers. In
addition, the TPP talks with the U.S. have also begun to affect the case in recent
times.
Despite the divergence of opinions between the central government and private
life insurers, both sets of views fundamentally point in the same direction towards
creating a level playing field. However, the U.S. has taken a stance opposed to the
intention described above.
Clearly, the U.S. objects to the bill, with the intention of preventing Japan Post
Insurance from decisively entering the so-called “third sector,” in other words, the
medical field where U.S. life insurers now have a dominant market share. It is also
clear that this is an additional problem for the central government, which has been
displaying a positive stance towards the TPP talks. Whether the bill will be passed by
the Diet after negotiations to revise it, or will instead be abandoned, seems to be quite
uncertain.
(2) New Regulation of Tax Deductions for Life Insurance Premiums to Be Applied
The regulation of “the tax deduction of life insurance premium” was revised in
January 2012. Under this regulation, a certain amount of premium paid by a
policyholder during a year is deducted from his/her taxable income.
The first point of this revision is the establishment of a new “nursing-care
insurance premium deduction” in addition to the “general life insurance premium”
and “individual annuity insurance premium deduction” already available. The new
deduction consists of an income tax deduction capped at 40,000 yen and a resident
tax deduction capped at 28,000 yen.
Regulatory Trends
6. Trends in Japan’s Life Insurance Industry
46

The Toa Reinsurance Company, Limited — Japan’s Insurance Market 2012
The second point is to leave the limits of the “general life insurance premium”
and “individual annuity insurance premium deduction” for existing policies
unchanged, and to reduce those for new policies from 50,000 yen for income tax
deduction and 35,000 yen for resident tax deduction for existing policies, respectively
to 40,000 yen and 28,000 yen.
The third point is to increase the income tax deduction limit from the current
100,000 yen to 120,000 yen, including the newly established nursing care insurance
premium deduction, as a result of expanding the size of income tax deductions at the
system-wide level. However, for resident tax, the maximum deduction remains 70,000
yen, even when the three deductions are combined.
The revision against the background of an aging society is likely to be designed to
promote self-reliance in people, preparing for an expected increase in demand for both
nursing care insurance for the elderly and medical care insurance. Therefore, at the
next stage, it will draw attention to how the life insurance industry takes advantage of
this favorable wind and utilizes the business opportunities presented.
(3) Regulations on Asset Investment Ratios to Be Lifted
In February 2012, the Financial Services Agency published a bill for a Cabinet
Office ordinance revising part of the ordinance enforcing the Insurance Business Act.
The bill was issued and came into force on April 18, 2012.
The asset investment ratio regulations, which are designed to maintain healthy
assets among life insurers, limit excessively speculative asset investment by setting a
maximum amount for each type of holding assets calculated by multiplying total assets
by a certain ratio. Because the regulations set asset ratios of 30% for domestic stocks,
30% for foreign currency-dominated assets, and 20% for real estate, they have
commonly been referred to as the “3-3-2” regulations.
The regulations were recently lifted by bringing the bill into force with the aim
of responding to indications that regulations limiting holdings of foreign currency-
denominated assets hinders the globalization of domestic financial institutions and
reduces their global competitiveness against U.S. and European financial institutions
despite the global trend of financial globalization.
Enforcement of the bill will enable domestic life insurers to invest flexibly in
overseas assets and benefit from extending their core business overseas. However, the
specific issue domestic life insurers face in their core business is to reduce the gap in
global business experience between themselves and their U.S. and European life
counterparts.
47

48
Sup
ple
men
tal D
ata:
Res
ults
of J
apan
ese
maj
or n
on-l
ife in
sura
nce
grou
ps (
com
pany
) fo
r fis
cal 2
011,
end
ed M
arch
31,
201
2 (
Non
-Con
solid
ated
Bas
is)
MS
& A
D H
oldi
ngs
Toki
o M
arin
e H
oldi
ngs
NK
SJ H
oldi
ngs
Fuji
Toa
ReM
itsui
Sum
itom
oAi
oi N
issay
Dow
aTo
kio
Mar
ine
& N
ichi
doN
isshi
nSO
MPO
JAPA
NN
IPPO
NK
OA
Net
Pre
miu
ms W
ritte
nFY
201
11,
265,
997
1,07
4,63
1 1,
783,
009
136,
602
1,28
1,15
5 63
0,60
5 26
4,87
0 13
4,07
9
FY 2
010
1,23
2,94
5 1,
097,
341
1,74
2,74
6 13
4,06
3 1,
256,
639
620,
615
265,
451
125,
354
Net
Cla
ims P
aid
FY 2
011
1,00
0,73
7 80
5,02
6 1,
370,
750
95,2
60
939,
541
493,
011
199,
109
130,
682
FY 2
010
765,
938
692,
854
1,09
4,25
9 81
,582
81
7,96
1 39
7,44
4 15
9,43
9 74
,212
Und
erw
ritin
g Pr
ofit
(Los
s)FY
201
1(1
70,0
26)
(20,
008)
(1,1
53)
(3,0
48)
(24,
994)
(41,
188)
(9,3
17)
(38,
076)
FY 2
010
(50,
399)
(33,
369)
(31,
118)
(5,8
68)
(9,7
16)
(24,
991)
(9,6
09)
(2,8
77)
Ord
inar
y Pr
ofit (
Loss
)FY
201
1(1
30,1
77)
9,23
3 21
2,12
0 4,
211
3,96
4 (7
,737
)3,
384
(7,0
60)
FY 2
010
31,7
70
16,0
79
145,
754
2,51
7 20
,541
(3
19)
14,8
33
4,64
7
Net
Pro
fit (Lo
ss)
for t
he Y
ear
FY 2
011
(130
,607
)(4
3,54
9)23
,206
(4
,759
)(3
7,51
8)(2
2,58
4)(1
5,74
1)(1
5,52
2)
FY 2
010
22,8
81
(11,
417)
100,
713
1,52
0 12
,124
(6
,437
)7,
735
3,80
7
Tota
l Ass
ets
FY 2
011
5,64
6,81
6 3,
141,
142
8,36
8,00
9 40
8,95
9 4,
600,
592
2,33
7,63
1 85
8,00
1 49
7,91
0
FY 2
010
5,79
9,00
5 3,
364,
309
8,67
0,00
8 42
8,50
9 4,
786,
371
2,45
9,19
0 91
8,36
1 48
2,19
4
Rat
io 1
Loss
Rat
io (%
)
FY 2
011
85.1
79
.7
81.6
76
.4
80.6
84
.7
79.6
97
.5
FY 2
010
68.3
68
.2
67.5
66
.2
72.5
69
.6
64.8
59
.2
Rat
io 2
Expe
nse
Rat
io (%
)
FY 2
011
33.4
35
.1
32.0
34
.9
33.0
35
.0
34.4
29
.4
FY 2
010
33.9
35
.6
33.5
37
.3
33.7
35
.8
35.0
30
.2
Rat
io 3
Yiel
d on
Inve
stmen
ts (I
ncom
e) (%
)
FY 2
011
2.22
2.
16
2.21
1.
32
2.13
2.
12
1.56
3.
35
FY 2
010
2.37
2.
36
2.00
1.
53
2.21
2.
08
1.87
2.
56
Rat
io 4
Yiel
d on
Inve
stmen
ts (R
ealis
ed G
ains
/ Lo
sses
) (%
)
FY 2
011
1.99
1.
85
4.39
2.
49
1.86
2.
59
2.55
9.
50
FY 2
010
3.05
2.
97
3.93
3.
14
2.07
2.
40
4.72
2.
66
Rat
io 5
Solv
ency
Mar
gin
Rat
io (%
)FY
201
148
6.8
442.
6 62
9.7
570.
4 50
2.5
470.
8 53
5.4
638.
3
FY 2
010
534.
7 50
8.7
603.
4 63
3.1
562.
5 52
1.8
587.
7 70
0.4
(Uni
t: M
illio
ns o
f yen
, %)
Sour
ces:
Eac
h co
mpa
ny’s
Fina
ncia
l Sta
tem
ents
of F
Y201
1N
ote.
Sol
venc
y M
argi
n R
atio
bot
h in
FY
2010
and
FY
2011
cal
cula
ted
unde
r the
revi
sed
stan
dard
app
lied
from
Mar
ch 3
1, 2
012
48

The Toa Reinsurance Company, Limited
h t t p : / / w w w . t o a r e . c o . j p
6, Kanda-Surugadai 3-chome, Chiyoda-ku, Tokyo 101-8703, Japan
Printed in Japan