january 2015 • vol. 36, no. 1 · ebri.org notes • january 2015 • vol. 36, no. 1 3...
TRANSCRIPT

A monthly newsletter from the EBRI Education and Research Fund © 2015 Employee Benefit Research Institute
January 2015 • Vol. 36, No. 1
Debt of the Elderly and Near Elderly, 1992–2013, p. 2
A T A G L A N C E
Debt of the Elderly and Near Elderly, 1992–2013, by Craig Copeland, Ph.D., EBRI
More older American families have debt: The percentage of American families with heads ages 55 or older that had debt increased from 63.4 percent in 2010 to 65.4 percent in 2013. Furthermore, the percentage of these families with debt payments greater than 40 percent of income—a traditional threshold measure of debt load trouble—increased in 2013 to 9.2 percent from 8.5 percent in 2010.
However, other debt measures were down: Total debt payments as a percentage of income decreased from 11.4 percent in 2010 to 10.0 percent in 2013, and average debt decreased from $80,465 in 2010 to $73,211, while debt as a percentage of assets decreased from 8.5 percent in 2010 to 8.1 percent in 2013.
Housing debt drove the change in the level of debt payments in 2013, while the nonhousing (consumer) debt-payment share of income held stable from 2010. Housing debt was the major component of debt for families headed by individuals ages 55 or older.
The debt levels among those with housing debt have obvious and serious implications for the future retirement security of these Americans, perhaps most significantly that these families are potentially at risk of losing what is typically their most important asset—their home.

ebri.org Notes • January 2015 • Vol. 36, No. 1 2
Debt of the Elderly and Near Elderly, 1992–2013 By Craig Copeland, Ph.D., Employee Benefit Research Institute
Introduction Debt is often overlooked when discussing the future income security of retirees. However, any debt that a near-elderly or elderly family has accrued entering or living in retirement is likely to offset any asset accumulations, resulting in a lower level of retirement income security.1
This article focuses on the trends in debt levels among those ages 55 or older (near-elderly are defined as those ages 55–64 and the elderly are defined as those ages 65 and older), as financial liabilities are a vital but often ignored component of retirement income security.2 The Federal Reserve Board’s Survey of Consumer Finances (SCF) is used in this article to determine the level of debt.3 Debt is examined in two ways:
Debt payments relative to income.
Debt relative to assets.
Each measure provides insight regarding the financial abilities of these families to cover their debt before or during retirement. For example, higher debt-to-income ratios may be acceptable for younger families with long working careers ahead of them, because their incomes are likely to rise, and their debt (related to housing or children) is likely to fall in the future. On the other hand, higher debt-to-income ratios may represent more serious concerns for older families, which could be forced to reduce their accumulated assets to service the debt at points where their active earning years are ending. However, if these older families with high debt-to-income ratios have low debt-to-asset ratios, the effect of paying off the debt may not be as financially difficult as it might be for those with high debt-to-income and high debt-to-asset ratios.
As described in more detail below, debt levels of the current elderly and near-elderly increased in 2013. However, the average debt held and debt payments as a percentage of income decreased. While holding debt is not necessarily a sign of financial danger for all elderly or near-elderly families (especially if they are also high-income), housing debt (typically the major asset elderly families have) is of particular concern, because leveraging it at this point in their lives may leave them without a major resource to finance an adequate retirement.
Percentage With Debt The share of older American families that had debt in 2013 increased from 2010. The percentage of American families headed by individuals ages 55 or older with some level of debt was 65.4 percent in 2013, up from the 2010 level of 63.4 percent (Figure 1). The 2013 level was up over 10 percentage points from the 1992 level of 53.8 percent.
The percentage with debt decreased significantly as the family heads aged; i.e., in 2013, 78.5 percent of families with heads ages 55–64 held debt, compared with 41.3 percent of those with heads ages 75 or older. Furthermore, the percentage with debt increased from 2010 to 2013 for families headed by individuals in each age group studied. For those families with heads ages 55–64, the percentage with debt increased from 77.6 percent in 2010 to 78.5 percent in 2013. Among those families with heads ages 65–74, the percentage with debt increased from 65.0 percent to 66.4 percent and for those families with heads ages 75 or older, the increase was from 38.5 percent to 41.3 percent. In addition, each age group in 2013 had a higher percentage with debt than at any survey year during 1992–2013 study period except for families with heads ages 55–64, which peaked in 2007 at 81.7 percent.
The percentage with debt also was also higher for those with higher family incomes across each survey year, except in 2013 when the percentage decreased at the highest-income quartile. In 2013, 44.8 percent of families in the

ebri.org Notes • January 2015 • Vol. 36, No. 1 3
lowest-income quartile had debt, compared with 77.2 percent of those in the third income quartile (Figure 2). Of those in the highest-income quartile, 76.4 percent had debt in 2013, an amount lower than the third income quartile, and also lower than in 2010, when 77.7 percent of those in the highest-income quartile had debt. The 2013 percentage of elderly and near elderly families with debt was the highest during the study period for those families in the third income quartile, while the percentage with debt for families in the highest-income quartile has trended down since 2007 and for families in the lowest-income quartile has leveled off at just above 44 percent since 2007.
Debt Levels As the percentage of families with heads ages 55 or older with any debt increased from 1992–2013, the average total debt level also increased: from $36,144 (2013 dollars) in 1992 to $73,211 in 2013. At the same time, the median debt level (half above, half below) of those with debt increased from $17,879 to $47,900 (Figure 3). This was a real increase in the average and median debt levels of 102.6 percent and 167.9 percent, respectively, from 1992.4 However, while the percentage with debt increased from 2010 to 2013, the average debt level and the median debt level of those families having debt decreased during this time from $80,465 to $73,211 for the average and from $59,372 to $47,900 for the median.
These debt levels differed significantly across various family characteristics. Families with younger or more educated heads, higher incomes, and higher net worth had significantly higher average and median debt levels. Significantly higher average levels of debt were also seen in families headed by individuals who were working for someone else, white or married. For example, in 2013, among those with debt, families with heads ages 55–64 had a median debt of $63,300, compared with $20,000 for those headed by people ages 75 or older. Similarly to the overall decline in the median debt, the median debt level across each category break decreased from 2010 to 2013, except for families with a head without a high school diploma and families with a nonworking head that wasn’t retired.
While the increases in debt levels from 1992–2013 can be construed as a negative result for these families, debt levels may not tell the full story of their financial well-being. If income and assets grow at a pace faster than these debt levels, these families might actually be in an improving financial position despite the increased debt levels.5 The next two sections of this article examine debt levels relative to income and assets:
For income, the amount of debt service is examined by using required debt payments relative to family income.
In contrast, for assets, outstanding debt is measured relative to total assets.
Debt Payments The first measure of the indebtedness of the near elderly (ages 55–64) and elderly (ages 65 and over) is the percentage of family income that debt payments represent. From 1992 to 2001, debt payments were approximately 9 percent of family income, at which point they began trending upward; from 10.3 percent in 2004 to 11.4 percent in 2010 before decreasing to 10.0 percent in 2013 (Figure 4). As the age of the family heads increased, the debt payment percentages decreased, declining from 11.3 percent for families with heads ages 55–64 in 2013 to 6.5 per-cent for those headed by individuals ages 75 or older. In 2013, the debt payments as a percentage of income declined for each age category from those seen in 2010.
Across the three lowest-income quartiles of these families, the percentages of income that debt payments represented in 2013 were just over 15 percent (Figure 5). There was a significant drop-off for those in the highest-income quartile to 7.7 percent. Debt payments as a percentage of income for the middle two income quartiles were unchanged from 2010 to 2013. In contrast, debt payments as a percentage of income for the lowest- and the highest-income quartiles decreased from 2010 to 2013.

53
.8%
54
.0%
53
.0% 56
.0%
60
.6%
63
.0%
63
.4%
65
.4%
71.4%
74.0%76.3% 76.2% 76.3%
81.7%
77.6% 78.5%
51.5%
54.1%
51.9%
57.0%58.5%
65.2% 65.0%66.4%
31.9
%
28.4
%
25.0
% 29.0
%
40.3
%
31.2
%
38.5
% 41.3
%
20%
30%
40%
50%
60%
70%
80%
90%
1992 1995 1998 2001 2004 2007 2010 2013
Figure 1Percentage of American Families With Heads Ages 55 or Older With Debt, by Age of Family Head, 1992–2013
All 55–64 65–74 75+
Source: Employee Benefit Research Institute estimates from the 1992, 1995, 1998, 2001, 2004, 2007, 2010, and 2013 Survey of Consumer Finances.
53.8% 54.0% 53.0%
56.0%
60.6%63.0% 63.4%
65.4%
36.0
% 38.6
%
31.2
%
38.1
%
46.6
%
44.2
%
44.6
%
44.8
%
51.8
%
45.6
% 48.9
% 52.1
%
65.7
%
54.6
% 58.3
% 63.5
%
59.4
%
61.4
%
59.7
% 62.5
%
67.8
%
75.4
%
73.3
% 77.2
%
68.6%71.0%
72.9% 72.4%
75.3%
78.5%77.7%
76.4
%
0%
10%
20%
30%
40%
50%
60%
70%
80%
90%
1992 1995 1998 2001 2004 2007 2010 2013
Figure 2Percentage of American Families With Heads Ages 55
or Older With Debt, by Family Income Quartile, 1992–2013
All Lowest 25% 26%–50% 51%–75% Highest 25%
Source: Employee Benefit Research Institute estimates from the 1992, 1995, 1998, 2001, 2004, 2007, 2010, and 2013 Survey of Consumer Finances.
ebri.org Notes • January 2015 • Vol. 36, No. 1 4

Med
ian
Med
ian
Med
ian
Med
ian
Med
ian
Med
ian
Cat
egor
yA
vera
geW
ith D
ebt
Ave
rage
With
Deb
tA
vera
geW
ith D
ebt
Ave
rage
With
Deb
tA
vera
geW
ith D
ebt
Ave
rage
With
Deb
t
All
$36,
144
$17,
879
$49,
616
$31,
767
$50,
925
$30,
210
$79,
013
$48,
281
$80,
465
$59,
372
$73,
211
$47,
900
Age
of F
amily
Hea
d 5
5–64
62,8
2432
,507
88,5
9150
,180
85,5
8945
,972
120,
111
67,4
1411
4,73
682
,092
103,
187
63,3
00 6
5–74
27,4
878,
127
39,9
8017
,156
45,8
5917
,206
78,1
5045
,059
75,9
5747
,798
70,7
8943
,500
75
or o
lder
9,58
15,
201
11,1
7011
,551
11,7
756,
567
14,6
4516
,618
29,3
7432
,151
23,6
8020
,000
Rac
e of
Fam
ily H
ead
Whi
te, n
onH
ispa
nic
36,2
2919
,504
51,0
3433
,454
51,4
2128
,634
80,7
2953
,446
86,0
6864
,302
78,4
1154
,000
Oth
er35
,763
9,67
141
,803
22,1
5948
,327
32,8
3771
,712
31,4
3961
,592
47,7
9856
,726
27,7
00F
amily
Inco
me
(201
3 $s
) L
ess
than
$10
,000
8,50
22,
438
5,05
62,
859
4,47
81,
274
28,8
627,
119
53,4
8719
,291
47,3
7517
,000
$10
,000
–$24
,999
7,88
83,
251
13,3
675,
719
10,2
618,
511
14,8
9311
,677
19,2
9813
,160
16,1
3810
,000
$25
,000
–$49
,999
17,3
0512
,353
22,6
6819
,014
24,0
7917
,798
30,6
9924
,590
42,6
8132
,151
42,2
3431
,000
$50
,000
–$99
,999
31,9
2129
,256
51,4
9948
,608
41,9
9235
,464
87,8
0675
,229
86,8
5675
,341
80,9
4570
,000
$10
0,00
0 or
mor
e15
6,64
591
,995
163,
263
94,3
5617
4,46
012
8,72
022
6,39
419
7,95
321
0,90
215
9,46
919
5,09
961
,000
Fam
ily S
tatu
s M
arrie
d54
,273
27,0
1371
,296
43,4
6169
,468
36,7
7712
0,93
283
,089
113,
767
78,2
3410
4,02
674
,690
Sin
gle
mal
e32
,962
16,5
7954
,890
44,3
1944
,124
34,1
5051
,037
22,7
0347
,471
37,5
1061
,994
34,0
00 S
ingl
e fe
mal
e12
,378
5,54
218
,194
12,4
3820
,230
11,8
2130
,642
20,2
1142
,434
34,2
9433
,154
24,0
00
Edu
catio
n of
Fam
ily H
ead
Bel
ow H
S d
iplo
ma
13,9
526,
745
12,8
1611
,580
14,7
7011
,322
21,9
1122
,456
27,1
8618
,219
24,8
1923
,000
HS
dip
lom
a22
,788
12,1
0927
,781
27,1
6325
,599
21,0
2944
,697
22,5
6947
,636
40,7
2541
,617
28,6
80 S
ome
colle
ge39
,323
25,0
7954
,297
43,4
6146
,885
27,5
8382
,361
61,7
5577
,875
64,3
0265
,204
43,0
00 C
olle
ge d
egre
e83
,363
48,7
6010
7,85
660
,388
110,
130
78,8
0814
5,17
911
2,28
213
3,45
310
0,74
012
6,11
510
0,40
0
Net
Wor
th P
erce
ntile
a
Low
est 2
5%7,
227
3,81
916
,401
9,15
018
,780
8,51
128
,369
14,5
9740
,765
21,4
3445
,983
17,8
50 2
5%–4
9%14
,521
10,4
1835
,095
29,4
5123
,708
19,5
3157
,240
44,9
1360
,291
58,4
0849
,772
40,0
00 5
0%–7
5%24
,692
24,6
5627
,687
35,7
4141
,703
45,8
4066
,400
51,6
5049
,580
47,1
2357
,054
47,0
00 7
5%–9
0%41
,729
44,8
6046
,195
52,8
9757
,463
40,6
7888
,059
101,
054
117,
197
110,
921
91,7
5199
,400
Top
10%
182,
837
65,9
8922
8,73
312
0,09
021
2,50
815
7,61
727
8,29
224
1,40
625
2,32
824
6,49
121
2,50
921
1,00
0
Wor
king
Sta
tus
of F
amily
Hea
d W
orks
for
som
eone
els
e52
,330
29,0
2973
,705
47,1
7870
,870
42,4
7811
9,33
485
,952
106,
149
75,5
5510
5,01
167
,940
Sel
f-em
ploy
ed15
6,91
265
,176
152,
400
45,7
4915
1,80
680
,122
203,
688
110,
036
201,
423
120,
566
178,
667
20,0
00 R
etire
d16
,592
9,75
222
,720
14,4
3921
,242
13,1
3534
,218
22,4
5638
,955
35,4
7337
,130
27,5
00 O
ther
non
wor
k11
,746
2,43
833
,117
21,4
4522
,348
6,56
713
9,37
655
,130
87,7
6656
,082
88,4
7261
,000
Sou
rce:
Em
ploy
ee B
enef
it R
esea
rch
Inst
itute
est
imat
es fr
om th
e 19
92, 1
998,
200
1, 2
007,
201
0, a
nd 2
013
Sur
vey
of C
onsu
mer
Fin
ance
s.a
Net
wor
th p
erce
ntile
s ar
e fo
r th
e fa
mili
es w
ith a
hea
d ag
e 55
or
olde
r, n
ot fo
r al
l fam
ilies
.
Not
e: A
ll do
llar
amou
nts
are
in 2
013
dolla
rs.
1998
1992
Fig
ure
3
A
vera
ge
To
tal D
ebt
and
Med
ian
To
tal D
ebt
for
Th
ose
Wit
h D
ebt
Fo
r F
amili
es
Wit
h H
ead
s A
ges
55
or
Old
er, b
y V
ario
us
Ch
arac
teri
stic
s, 1
992–
2013
2013
2010
2007
2001
ebri.org Notes • January 2015 • Vol. 36, No. 1 5

9.2%
8.5%
10.0%
8.8%
10.3%
10.8%
11.4%
10.0%
11.8% 11.9%
13.0%
10.5%
11.6%
12.7%12.4%
11.3%
7.9%
7.0%
8.5%8.8% 8.9%
10.0%
11.7%
9.3%
3.7%
2.5%
3.8%3.6%
7.7%
4.5%
7.1%
6.5%
0%
2%
4%
6%
8%
10%
12%
14%
1992 1995 1998 2001 2004 2007 2010 2013
Figure 4Total Debt Payments as Percentage of Income Among Families
With Heads Ages 55 or Older, by Age of Family Head, 1992–2013
All 55–64 65–74 75+
Source: Employee Benefit Research Institute estimates from the 1992, 1995, 1998, 2001, 2004, 2007, 2010, and 2013 Survey of Consumer Finances.
9.2%
8.5%
10.0
%
8.8%
10.3
%
10.8
% 11.4
%
10.0
%
11.7
%
13.0
%
12.0
%
11.1
%
13.2
%
16.0
%
18.0
%
15.3
%
11.9
%
11.8
% 12.7
%
12.7
% 13.6
%
13.3
%
15.2
%
15.2
%
10.7
%
11.0
%
12.8
%
11.1
%
13.7
%
18.3
%
15.8
%
15.5
%
8.1%
7.1%
8.8%
7.6%
8.4% 8.6%
9.3%
7.7%
0%
2%
4%
6%
8%
10%
12%
14%
16%
18%
20%
1992 1995 1998 2001 2004 2007 2010 2013
Figure 5Total Debt Payments as a Percentage of Income for Families With
Heads Ages 55 or Older, by Family Income Quartile, 1992–2013
All Lowest 25% 26%–50% 51%–75% Highest 25%
Source: Employee Benefit Research Institute estimates from the 1992, 1995, 1998, 2001, 2004, 2007, 2010, and 2013 Survey of Consumer Finances.
ebri.org Notes • January 2015 • Vol. 36, No. 1 6

ebri.org Notes • January 2015 • Vol. 36, No. 1 7
Housing: The Driver of Debt The level of housing debt drove the change in the level of debt payments in 2013, while the nonhousing (consumer) debt-payment share held stable from 2010. The share of income that went to housing debt payments increased from 6.7 percent in 2004 to 8.3 percent in 2010 before declining to 7.0 percent in 2013. Among the age groups, the share of income that housing debt payments represented among families with heads ages 65–74 decreased from 8.6 per-cent in 2010 to 6.7 percent in 2013, and for families with heads ages 75 or older, it decreased from 4.7 percent in 2010 to 3.8 percent in 2013 (Figure 6).
Excessive Debt Levels Looking at the average debt payment as a percentage of income does not generally reveal how many people are in difficult situations with debt, because the average can mask a wide distribution of individual circumstances. A threshold commonly used for determining a problem with excessive debt is when family debt payments exceed 40 percent of income. By that standard, the percentage of families with excessive debt increased in 2013, but it remained below its 2007 level. The proportion of near elderly and elderly families surpassing this threshold increased from 8.5 percent in 2010 to 9.2 percent in 2013, while the 2007 level was 9.9 percent (Figure 7).
The increase from 2004–2007 was a result of the surge in families with heads ages 55–74 whose debt payments were above the 40-percent threshold, while families with heads ages 75 or older experienced a decline in the percentage with debt payments above this threshold. In contrast, the change from 2007–2010 was the result of declines in the proportion above the 40-percent threshold among those with heads ages 55–74, while the percentage with these high debt payments increased for the families with heads ages 75 or older, rising to 4.9 percent in 2010 from 4.3 percent in 2007. However, in 2013, the percentage with debt payments above the 40-percent threshold increased across each age group.
The share of families with debt payments above 40 percent of income was lowest for those families in the highest-income quartile in 2013, as it was in all prior years in the study (Figure 8). The proportion of families above the 40-percent threshold was highest for families in the second income quartile (13.7 percent). Families in the second quartile not only had an increased likelihood of having debt payments above this threshold in 2013, but their percentage overtook the lowest-income quartile to rank in the highest position. While the percentage above the 40-percent threshold declined for the two highest-income quartiles in 2013, the increases in the lowest two quartiles pushed the overall level in 2013 above that of the 2010 level.
Overall debt levels, percentage with debt, debt payments as a percentage of income, and percentage of families with debt payments greater than 40 percent of their income all increased from 1992 to 2013. Furthermore, housing debt increased across all age groups, representing more than 70 percent of all debt. However, many of these measures of debt improved in 2013 except in some measures where they worsened for those families with the least-educated family heads and with the lowest incomes.
Debt as a Percentage of Assets Debt as a percentage of total assets for near elderly and elderly families was virtually unchanged at approximately 7.0 percent from 1992–1998 but decreased in 2001 to less than 6.0 percent before increasing to just above 7 percent (at 7.4 percent) in 2007 (Figure 9). In 2010, the percentage jumped to 8.5 percent—the highest percentage (by more than 1 percentage point) during the study period. This percentage declined in 2013 to 8.1 percent. Nearly all of the decrease from 1998–2001 was due to a lower percentage of nonhousing debt relative to assets; nonhousing debt decreased from 3.2 percent in 1998 to 2.3 percent of assets in 2001. After a relatively steady level of housing debt relative to assets from 1992–2001, housing debt increased from 3.5 percent in 2001 to 5.3 percent in 2007 and reached 6.1 percent in 2010. In 2013, the majority of the decrease was from nonhousing debt, while housing debt

4.0
% 5.2
%
3.5
%
1.4
%
3.2
% 4.3
%
2.8
%
1.2
%
4.2
% 5.5
%
3.8
%
1.2
%
3.3
% 4.0
%
3.1
%
1.5
%
3.6
%
3.5
%
3.3
% 4.1
%
3.1
%
3.6
%
2.9
%
1.3
%
3.1
%
3.3
%
3.1
%
2.4
%
3.0
%
3.3
%
2.6
%
2.8
%
5.2
%
6.6
%
4.4
%
2.4
%
5.3
%
7.5
%
4.2
%
1.3
%
5.8
%
7.5
%
4.7
%
2.6
%
5.5
%
6.5
%
5.7
%
2.1
%
6.7
% 8.1
%
5.6
%
3.6
%
7.7
%
9.1
%
7.1
%
3.2
%
8.3
% 9.1
%
8.6
%
4.7
%
7.0
%
8.0
%
6.7
%
3.8
%
0%
2%
4%
6%
8%
10%
12%
14%
All 55–64
65–74
75+ All 55–64
65–74
75+ All 55–64
65–74
75+ All 55–64
65–74
75+ All 55–64
65–74
75+ All 55–64
65–74
75+ All 55–64
65–74
75+ All 55–64
65–74
75+
1992 1995 1998 2001 2004 2007 2010 2013
Nonhousing Debt Housing Debt
Source: Employee Benefit Research Institute estimates from the 1992, 1995, 1998, 2001, 2004, 2007, 2010, and 2013 Survey of Consumer Finances.
Figure 6Total Housing and Nonhousing Debt Payments as Percentage of Income
Among Families With Heads Ages 55 Or Older, by Age of Head, 1992–2013
5.8
%
5.6
%
7.6
%
7.2
%
7.3
%
9.9
%
8.5
%
9.2
%
10.0%
10.6%
9.5% 9.4%
7.9%
12.5%
10.8%
11.9%
4.0%
3.5%
8.4%
7.5%7.9%
11.2%
8.3%8.7%
2.3
%
1.8
%
4.3
%
4.1
%
5.9
%
4.3
% 4.9
%
5.1
%
0%
2%
4%
6%
8%
10%
12%
14%
1992 1995 1998 2001 2004 2007 2010 2013
All 55–64 65–74 75+
Source: Employee Benefit Research Institute estimates from the 1992, 1995, 1998, 2001, 2004, 2007, 2010, and 2013 Survey of Consumer Finances.
Figure 7Percentage of American Families With Heads Ages 55 or Older Who Have Debt Payments of Greater Than Forty Percent of Income, by Age of Head, 1992–2013
ebri.org Notes • January 2015 • Vol. 36, No. 1 8

5.8%
5.6%
7.6%
7.2% 7.3%
9.9%
8.5%
9.2%
7.4%
6.5%
9.1%
8.6%
10.2%
13.2%
11.9%
12.4
%
7.7% 7.7%
7.9%
9.8%
7.9%
9.5%
9.9%
13.7%
5.0%4.8%
9.3%
7.5%
6.4%
11.7%
8.5%
7.4%
3.1%3.4%
4.2%
2.9%
2.1%
5.1%
3.6% 3.3%
0%
2%
4%
6%
8%
10%
12%
14%
16%
1992 1995 1998 2001 2004 2007 2010 2013
All Lowest 25% 26%–50% 51%–75% Highest 25%
Source: Employee Benefit Research Institute estimates from the 1992, 1995, 1998, 2001, 2004, 2007, 2010, and 2013 Survey of Consumer Finances.
Figure 8Percentage of American Families With Heads Ages 55 or Older With Debt Payments
Greater Than Forty Percent of Their Income, by Income Quartile, 1992–2013
7.1%6.9%
7.2%
5.8%
6.8%
7.4%
8.5%
8.1%
3.9
%
3.4
%
3.2
%
2.3
%
2.1
%
2.1
% 2.4
%
2.1
%
3.3%
3.6%
4.0%
3.5%
4.7%
5.3%
6.1% 6.0%
0%
1%
2%
3%
4%
5%
6%
7%
8%
9%
1992 1995 1998 2001 2004 2007 2010 2013
Figure 9Total, Nonhousing, and Housing Debt as a Percentage of Assets for
American Families With Heads Ages 55 or Older, 1992–2013
Total Nonhousing Housing
Source: Employee Benefit Research Institute estimates from the 1992, 1995, 1998, 2001, 2004, 2007, 2010, and 2013 Survey of Consumer Finances.
ebri.org Notes • January 2015 • Vol. 36, No. 1 9

ebri.org Notes • January 2015 • Vol. 36, No. 1 10
barely budged. Consequently, while nonhousing debt as a share of assets has remained relatively low recently, housing debt as a share of assets has increased markedly during the same period.
As with the debt level, the share of family assets that debt represents varied significantly across various characteristics of family heads (Figure 10): Overall, it decreased significantly as both the family heads’ age and the family’s net worth increased. By age of the family head, the debt-to-asset ratio decreased in 2013 from 11.5 percent for those ages 55–64 to 3.7 percent for those ages 75 or older. The lowest-net-worth families stood out as having, by far, the highest debt-to-asset ratio: 93.8 percent in 2013. Other groups of families with high relative debt-to-asset levels were:
The second-lowest-net-worth quartile of families.
Families with heads who “work for someone else” or were in the “other nonwork” category.
Families that did not have white, nonHispanic heads; i.e., minority families.
The overall debt-to-asset ratio for those ages 55 or older decreased to 8.1 percent in 2013, down from 8.4 percent in 2010. Furthermore, the median debt-to-asset ratio for those with debt was unchanged at 19.6 percent in 2013. Consequently, in 2013, both the total debt as a percentage of total assets and the percentage of debt for those with debt remained at or were just below their highest levels of the study period.
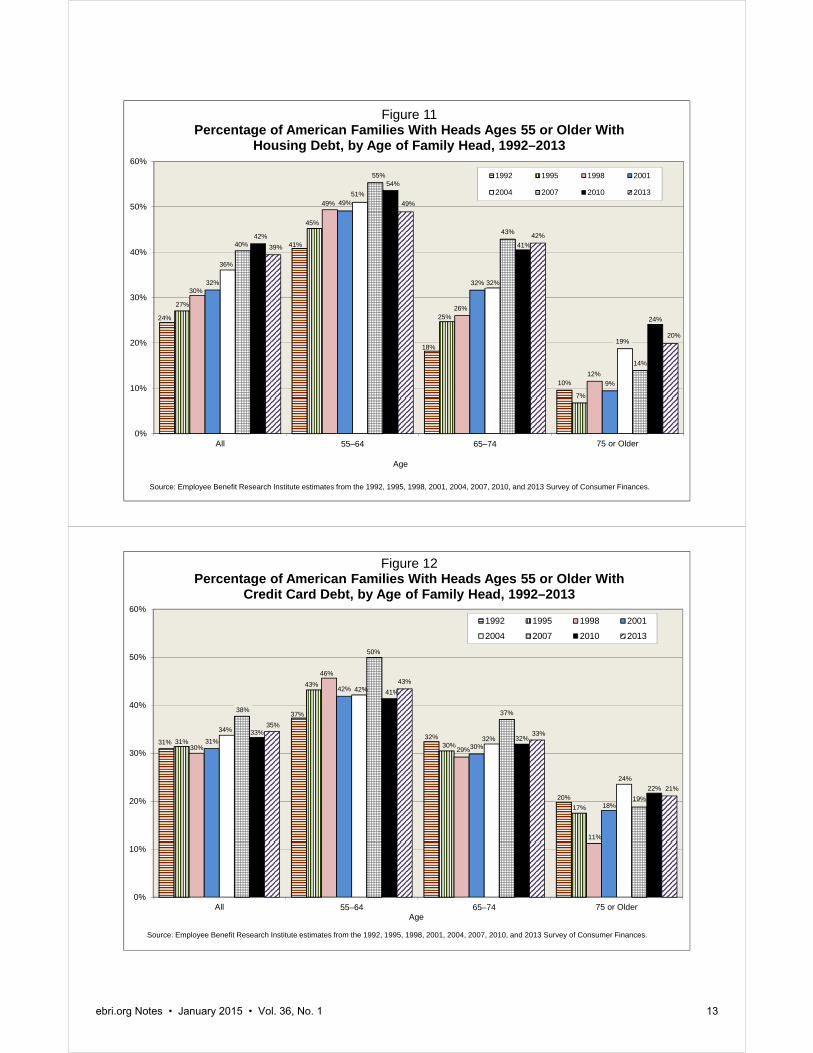
Credit-Card and Housing Debt During the study period, the proportion of families with heads ages 55 or older with housing debt increased steadily, from 24 percent in 1992 to 42 percent in 2010, before retreating in 2013 to 39 percent (Figure 11). In contrast, the percentage with credit-card debt held steady at the low-30 percent range through 2004, before reaching 38 percent in 2007. In 2010 and 2013, the percentage fell back into the low-30 percent range (Figure 12). The percentages of families with credit-card debt in 2013 were similar to their 1992 levels across each age group despite some jumps in the intervening years, with family heads ages 55–64 having the largest increase, increasing from 37 percent in 1992 to 43 percent in 2013. However, the percentages of families with housing debt increased significantly across all age groups. In particular, for families with heads ages 65–74, this debt increased from 18 percent in 1992 to 42 percent by 2013, and for families with heads ages 75 or older, from 10 percent to 20 percent.
While there was a small increase in the percentage of families with credit-card debt, the median amount owed by those having this debt decreased slightly, to $2,500 in 2013 from $2,604 (2013 dollars) in 2010 (Figure 13). While the overall median slightly declined in 2013, the median credit-card debt for those families carrying it was virtually unchanged among each age group of family heads studied.
Median housing debt, among those having housing debt, ticked upward from 2010 to 2013 ($87,879 in 2010 (2013 dollars) to $93,000 in 2013). Furthermore, these amounts were significantly higher than the 1992 level of $45,510 (Figure 14). While the overall level moved upward between 2010 and 2013, the medians for the age groups 55–64 and 75 or older decreased, while the median increased for those ages 65–74.
Conclusion The percentage of American families with heads ages 55 or older that have debt increased from 2010 to 2013 (63.4 percent in 2010 to 65.4 percent in 2013). Furthermore, the percentage of these families with debt payments greater than 40 percent of income—a traditional threshold measure of debt-load trouble—increased in 2013 to 9.2 percent from 8.5 percent in 2010. However, total debt payments as a percentage of income decreased from 11.4 percent in 2010 to 10.0 percent in 2013, and average debt decreased from $80,465 in 2010 to $73,211 in 2013, while debt as a percentage of assets decreased from 8.5 percent in 2010 to 8.1 percent in 2013.

ebri.org Notes • January 2015 • Vol. 36, No. 1 11
The data indicate that housing debt was the major component of debt for families with heads ages 55 or older. Among families with housing debt, the median debt amount increased from 2010–2013, while credit-card debt of those having this debt decreased. Despite some ups and downs among the various measures from 2010 to 2013, the overall debt situation among those ages 55 or older remained at the same general level.
The debt levels among those with housing debt have obvious and serious implications for the future retirement security of these Americans. Perhaps most significantly, elderly or near elderly families with housing debt are potentially at risk of losing what is typically their most important asset—their home. Consequently, older families that take on higher housing debt may well have difficulty avoiding a major lifestyle change in living arrangements for the remainder of their retirement, certainly if they plan to rely on their home as an asset.
These debt results are troubling as far as retirement preparedness is concerned, in that the data indicate that American families just reaching retirement or those newly retired are more likely to have debt—and higher levels of debt—than past generations. Furthermore, the percentages of families whose debt payments are excessive relative to their incomes are at or near their highest levels since 1992. Consequently, even more near elderly and elderly families are likely to find themselves at risk for severe changes in lifestyle after retirement than past generations.
In other work by the Employee Benefit Research Institute,6 many workers were found to be at risk of running short of money in retirement. This level of debt among families with heads ages 55 or older, along with asset values still recovering from the 2008 recession, will add to the difficulty for many people of this age to save for a retirement that will not run short of money. Moreover, the amount of debt backed by primary residences among these families could lead to either a forced sale or limited ability to use any housing equity for funding retirement.
Endnotes 1 See Craig Copeland “Individual Account Retirement Plans: An Analysis of the 2013 Survey of Consumer Finances.” EBRI Issue Brief, no. 406 (Employee Benefit Research Institute, November 2014) for a discussion of asset accumulation estimates from the 2013 Survey of Consumer Finances.
2 See Craig Copeland, “Debt of the Elderly and Near Elderly, 1992–2010,” EBRI Notes, no. 2 (Employee Benefit Research Institute, February 2013): 2–15; Craig Copeland, “Debt of the Elderly and Near Elderly, 1992–2007,” EBRI Notes, no. 10 (Employee Benefit Research Institute, October 2009): 2–14; Craig Copeland, “Debt of the Elderly and Near Elderly, 1992–2004,” EBRI Notes, no. 9 (Employee Benefit Research Institute, September 2006): 2–13; and Craig Copeland, “Debt of the Elderly and Near Elderly, 1992–2001,” EBRI Notes, no. 4 (Employee Benefit Research Institute, April 2004): 1–13 for prior examinations of debt among this age group.
3 See Bricker, Jesse, et al. “Changes in U.S. Family Finances from 2010 to 2013: Evidence from the Survey of Consumer Finances.” Federal Reserve Bulletin. vol. 100, no. 4 (September 2014): 1–40, www.federalreserve.gov/pubs/bulletin/2014/pdf/scf14.pdf (last reviewed November 2014) for more information on the Survey of Consumer Finances.
4 All dollar amounts in this report are in 2013 dollars.
5 Although the families may be in a better financial position, this does not mean that they are in an “ideal” financial position.
6 See Jack VanDerhei “What Causes EBRI Retirement Readiness Ratings™ to Vary: Results from the 2014 Retirement Security Projection Model.®” EBRI Issue Brief, no. 396 (Employee Benefit Research Institute, February 2014).

Deb
tM
edia
nD
ebt
Med
ian
Deb
tM
edia
nD
ebt
Med
ian
Deb
tM
edia
nD
ebt
Med
ian
as a
Per
cent
Deb
t to
as a
Per
cent
Deb
t to
as a
Per
cent
Deb
t to
as a
Per
cent
Deb
t to
as a
Per
cent
Deb
t to
as a
Per
cent
Deb
t to
Per
cent
With
Ass
et
Per
cent
With
Ass
et
Per
cent
With
Ass
et
Per
cent
With
Ass
et
Per
cent
With
Ass
et
Per
cent
With
Ass
et
Cat
egor
yO
f Ass
ets
Deb
tR
atio
aO
f Ass
ets
Deb
tR
atio
aO
f Ass
ets
Deb
tR
atio
aO
f Ass
ets
Deb
tR
atio
aO
f Ass
ets
Deb
tR
atio
aO
f Ass
ets
Deb
tR
atio
a
All
7.1%
53.8
%10
.1%
7.2%
53.0
%12
.8%
5.8%
56.0
%12
.1%
7.4%
63.0
%16
.0%
8.4%
63.4
%19
.6%
8.1%
65.4
%19
.6%
Age
of F
amily
Hea
d 5
5–64
10.2
71.4
15.6
10.4
76.3
17.6
8.2
76.2
14.9
10.3
81.7
18.8
10.7
77.6
22.8
11.5
78.5
24.3
65–
745.
651
.55.
35.
651
.98.
84.
957
.09.
36.
465
.214
.97.
765
.015
.96.
366
.414
.3 7
5 or
old
er2.
631
.95.
22.
425
.05.
51.
929
.04.
72.
031
.28.
34.
038
.514
.63.
741
.313
.9R
ace
of F
amily
Hea
d W
hite
, non
His
pani
c6.
451
.69.
16.
751
.712
.15.
255
.010
.46.
860
.714
.67.
762
.317
.97.
264
.716
.5 O
ther
15.7
64.0
13.5
14.7
60.3
20.2
15.0
61.3
20.8
14.4
72.9
23.4
15.6
67.1
27.6
18.9
67.7
34.6
Fam
ily In
com
e (2
013
$s)
Les
s th
an $
10,0
0010
.538
.311
.14.
631
.913
.55.
330
.38.
78.
940
.29.
18.
333
.644
.510
.438
.128
.5 $
10,0
00–$
24,9
996.
943
.28.
88.
637
.610
.07.
341
.715
.37.
844
.115
.012
.646
.428
.910
.148
.829
.4 $
25,0
00–$
49,9
996.
556
.48.
87.
451
.113
.47.
255
.413
.68.
061
.116
.410
.862
.223
.514
.566
.422
.7 $
50,0
00–$
99,9
996.
558
.88.
69.
863
.517
.16.
265
.712
.011
.876
.321
.413
.174
.621
.012
.978
.519
.7 $
100,
000
or m
ore
7.5
74.5
12.5
6.4
74.1
11.7
5.4
73.5
10.3
6.3
78.8
14.2
6.5
77.1
13.2
5.9
76.0
12.4
Fam
ily S
tatu
s M
arrie
d7.
462
.810
.57.
262
.612
.55.
563
.710
.87.
572
.415
.98.
271
.317
.77.
573
.817
.8 S
ingl
e m
ale
7.8
43.6
12.9
8.2
46.8
17.5
6.8
54.9
17.5
6.8
54.6
15.4
7.4
52.9
19.8
9.7
57.4
21.2
Sin
gle
fem
ale
5.5
45.1
7.5
6.6
42.0
13.1
6.4
42.4
11.1
7.7
53.1
16.7
11.1
55.7
26.4
10.5
57.0
24.4
Edu
catio
n of
Fam
ily H
ead
Bel
ow H
S d
iplo
ma
8.0
45.0
10.9
7.2
41.0
12.0
6.8
46.1
14.4
8.4
44.8
22.9
12.4
52.4
27.6
13.9
51.0
30.2
HS
dip
lom
a6.
555
.87.
46.
847
.613
.55.
953
.613
.99.
663
.614
.611
.159
.521
.812
.262
.024
.2 S
ome
colle
ge6.
549
.312
.47.
062
.115
.76.
560
.010
.29.
867
.922
.111
.768
.727
.49.
971
.922
.6 C
olle
ge d
egre
e7.
467
.211
.27.
466
.112
.25.
564
.911
.46.
569
.614
.97.
269
.015
.76.
971
.114
.7N
et W
orth
Per
cent
ileb
Low
est 2
5%32
.248
.324
.045
.248
.640
.645
.356
.042
.757
.457
.559
.385
.359
.576
.093
.864
.180
.4 2
5%–4
9%12
.353
.19.
921
.559
.919
.414
.856
.413
.925
.466
.922
.532
.571
.132
.430
.769
.627
.6 5
0%–7
5%9.
056
.39.
18.
345
.710
.89.
954
.111
.413
.364
.211
.411
.960
.112
.015
.064
.412
.8 7
5%–9
0%7.
054
.47.
36.
552
.17.
05.
854
.84.
88.
260
.29.
110
.362
.310
.69.
366
.69.
2 T
op 1
0%5.
862
.53.
45.
166
.54.
13.
761
.34.
83.
968
.65.
24.
163
.85.
93.
559
.05.
7W
orki
ng S
tatu
s of
Fam
ily H
ead
Wor
ks fo
r s
omeo
ne e
lse
10.1
78.5
13.0
13.5
80.5
17.9
10.9
79.2
15.8
12.9
80.9
22.6
12.6
81.9
24.6
13.6
80.9
22.8
Sel
f-em
ploy
ed8.
871
.111
.36.
674
.210
.86.
273
.510
.45.
679
.59.
26.
977
.712
.95.
378
.912
.8 R
etire
d4.
744
.98.
24.
538
.79.
03.
242
.88.
64.
849
.611
.76.
449
.218
.16.
453
.818
.3 O
ther
non
wor
k5.
035
.45.
39.
937
.716
.54.
022
.74.
013
.084
.126
.022
.878
.540
.625
.280
.448
.9S
ourc
e: E
mpl
oyee
Ben
efit
Res
earc
h In
stitu
te e
stim
ates
from
the
1992
, 199
8, 2
001,
200
7, 2
010,
and
201
3 S
urve
y of
Con
sum
er F
inan
ces.
a T
his
incl
udes
onl
y th
ose
who
hav
e de
bt.
b N
et w
orth
per
cent
iles
are
for
the
fam
ilies
with
a h
ead
age
55 o
r ol
der,
not
for
all f
amili
es.
2010
2013
Fig
ure
10T
ota
l Deb
t as
a P
erce
nta
ge
of
Ass
ets,
Per
cen
tag
e W
ith
Deb
t, a
nd
Med
ian
To
tal D
ebt
to A
sset
Rat
io F
or
Th
ose
Wit
h D
ebt,
Fo
r F
amili
es W
ith
Hea
ds
Ag
es 5
5 o
r O
lder
, by
Var
iou
s C
har
acte
rist
ics,
199
2–20
13
1992
1998
2001
2007
ebri.org Notes • January 2015 • Vol. 36, No. 1 12
24%
41%
18%
10%
27%
45%
25%
7%
30%
49%
26%
12%
32%
49%
32%
9%
36%
51%
32%
19%
40%
55%
43%
14%
42%
54%
41%
24%
39%
49%
42%
20%
0%
10%
20%
30%
40%
50%
60%
All 55–64 65–74 75 or Older
Age
Figure 11Percentage of American Families With Heads Ages 55 or Older With
Housing Debt, by Age of Family Head, 1992–2013
1992 1995 1998 2001
2004 2007 2010 2013
Source: Employee Benefit Research Institute estimates from the 1992, 1995, 1998, 2001, 2004, 2007, 2010, and 2013 Survey of Consumer Finances.
31%
37%
32%
20%
31%
43%
30%
17%
30%
46%
29%
11%
31%
42%
30%
18%
34%
42%
32%
24%
38%
50%
37%
19%
33%
41%
32%
22%
35%
43%
33%
21%
0%
10%
20%
30%
40%
50%
60%
All 55–64 65–74 75 or OlderAge
Figure 12Percentage of American Families With Heads Ages 55 or Older With
Credit Card Debt, by Age of Family Head, 1992–2013
1992 1995 1998 2001
2004 2007 2010 2013
Source: Employee Benefit Research Institute estimates from the 1992, 1995, 1998, 2001, 2004, 2007, 2010, and 2013 Survey of Consumer Finances.
ebri.org Notes • January 2015 • Vol. 36, No. 1 13

$1,4
14 $1,6
25
$1,1
38
$813
$1,5
18
$1,9
73
$1,2
15
$532
$2,0
01
$2,8
60
$1,5
72
$1,0
01
$1,6
69
$2,4
96
$1,2
48
$1,0
51
$2,4
66
$2,7
13
$2,7
13
$1,2
33
$3,3
68
$4,0
42
$3,3
68
$898
$2,6
04
$3,0
01
$2,3
04
$1,9
29
$2,5
00
$3,0
00
$2,3
00
$1,9
00
$0
$500
$1,000
$1,500
$2,000
$2,500
$3,000
$3,500
$4,000
$4,500
All 55–64 65–74 75 or OlderAge
Figure 13Median Credit Card Debt for Those Families With Heads Ages 55 or
Older With Credit Card Debt, by Age of Family Head, 1992–2013
1992 1995 1998 2001
2004 2007 2010 2013
Source: Employee Benefit Research Institute estimates from the 1992, 1995, 1998, 2001, 2004, 2007, 2010, and 2013 Survey of Consumer Finances.Note: All dollar figures are in 2013 dollars.
$45,
510
$48,
760
$27,
631
$45,
510
$42,
509
$56,
173
$28,
846
$18,
218
$57,
186
$70,
053
$41,
460
$30,
022
$65,
674 $7
2,24
2
$51,
226 $5
9,10
7
$73,
992
$102
,355
$62,
893
$36,
996
$88,
703
$95,
440
$77,
475
$44,
913
$87,
879
$103
,955
$75,
019
$55,
728
$93,
000 $1
02,0
00
$81,
000
$54,
000
$0
$20,000
$40,000
$60,000
$80,000
$100,000
$120,000
All 55–64 65–74 75 or OlderAge
Figure 14Median Housing Debt for Families With Heads Ages 55 or Older
Who Have Housing Debt, by Age of Family Head, 1992–2013
1992 1995 1998 2001
2004 2007 2010 2013
Source: Employee Benefit Research Institute estimates from the 1992, 1995, 1998, 2001, 2004, 2007, 2010, and 2013 Survey of Consumer Finances.Note: All dollar figures are in 2103 dollars.
ebri.org Notes • January 2015 • Vol. 36, No. 1 14

EBRI Employee Benefit Research Institute Notes (ISSN 10854452) is published monthly by the Employee Benefit Research Institute, 1100 13th St. NW, Suite 878, Washington, DC 20005-4051, at $300 per year or is included as part of a membership subscription. Periodicals postage rate paid in Washington, DC, and additional mailing offices. POSTMASTER: Send address changes to: EBRI Notes, 1100 13th St. NW, Suite 878, Washington, DC 20005-4051. Copyright 2015 by Employee Benefit Research Institute. All rights reserved, Vol. 36, no. 1.
The Employee Benefit Research Institute (EBRI) was founded in 1978. Its mission is to contribute to, to encourage, and to enhance the development of sound employee benefit programs and sound public policy through objective research and education. EBRI is the only private, nonprofit, nonpartisan, Washington, DC-based organization committed exclusively to public policy research and education on economic security and employee benefit issues. EBRI’s membership includes a cross-section of pension funds; businesses; trade associations; labor unions; health care providers and insurers; government organizations; and service firms.
EBRI’s work advances knowledge and understanding of employee benefits and their importance to the nation’s economy among policymakers, the news media, and the public. It does this by conducting and publishing policy research, analysis, and special reports on employee benefits issues; holding educational briefings for EBRI members, congressional and federal agency staff, and the news media; and sponsoring public opinion surveys on employee benefit issues. EBRI’s Education and Research Fund (EBRI-ERF) performs the charitable, educational, and scientific functions of the Institute. EBRI-ERF is a tax-exempt organization supported by contributions and grants.
EBRI Issue Briefs are periodicals providing expert evaluations of employee benefit issues and trends, as well as critical analyses of employee benefit policies and proposals. EBRI Notes is a monthly periodical providing current information on a variety of employee benefit topics. EBRIef is a weekly roundup of EBRI research and insights, as well as updates on surveys, studies, litigation, legislation and regulation affecting employee benefit plans, while EBRI’s Blog supplements our regular publications, offering commentary on questions received from news reporters, policymakers, and others. The EBRI Databook on Employee Benefits is a statistical reference work on employee benefit programs and work force-related issues.
Contact EBRI Publications, (202) 659-0670; fax publication orders to (202) 775-6312. Subscriptions to EBRI Issue Briefs are included as part of EBRI membership, or as part of a $199 annual subscription to EBRI Notes and EBRI Issue Briefs. Change of Address: EBRI, 1100 13th St. NW, Suite 878, Washington, DC, 20005-4051, (202) 659-0670; fax number, (202) 775-6312; e-mail: [email protected] Membership Information: Inquiries regarding EBRI membership and/or contributions to EBRI-ERF should be directed to EBRI President Dallas Salisbury at the above address, (202) 659-0670; e-mail: [email protected]
Editorial Board: Dallas L. Salisbury, publisher; Stephen Blakely, editor. Any views expressed in this publication and those of the authors should not be ascribed to the officers, trustees, members, or other sponsors of the Employee Benefit Research Institute, the EBRI Education and Research Fund, or their staffs. Nothing herein is to be construed as an attempt to aid or hinder the adoption of any pending legislation, regulation, or interpretative rule, or as legal, accounting, actuarial, or other such professional advice.
EBRI Notes is registered in the U.S. Patent and Trademark Office. ISSN: 10854452 10854452/90 $ .50+.50
© 2015, Employee Benefit Research InstituteEducation and Research Fund. All rights reserved.
Who we are
What we do
Our publications
Orders/ Subscriptions