jan svejnar university of michigan november 2006 economic development: overview
Post on 21-Dec-2015
214 views
TRANSCRIPT

Jan SvejnarUniversity of Michigan
November 2006
Economic Development:Overview

Introduction Development = a post WWII phenomenon World Bank (WB), IMF, GATT, UN = key institutions IMF – surveillance, macro-lending and tech. assistance WB – sectoral, project and program financing,
technical assistance WB and IMF established at Bretton Woods in 1944
Original goal – postwar reconstruction => economic development
Considerable resources Emphasis on “professionalism” Approach to development (make-up of staff) varies over time Official capital flows (complement bilateral and private flows) Critiques

What do we mean by development?
“By the problem of economic development I mean simply the problem of accounting for the observed pattern, across countries and across time, in levels and rates of growth of per capita income. This may seem too narrow a definition, and perhaps it is, but thinking about income patterns will necessarily involve us in thinking about many other aspects of societies too, so I would suggest that we withhold judgment on the scope of this definition until we have a clear idea of where it leads us.”
Robert E. Lucas (1988)“[W]e should never lose sight of the ultimate purpose of the exercise, to treat men and women as ends, to improve the human condition, to enlarge people’s choices… A unity of interest would exist if there were rigid links between economic production (as measured by income per head) and human development (reflected by human indictors such as life expectancy or literacy or achievements such as self-respect, no easily measured). But these two sets of indicators are not very closely related.
Paul P. Streeton [1994]

Social Indicators as Measures of Development:
Physical Quality of Life Index (PQLI)Developed by M. D. Morris. Based on an unweighted average of each of the following indices going from 1 to 100 (with 100 being “best”):
Life Expectancy at Age 1 Index =1 for lowest value (35 in Guinea-Bissau) Index = 100 for highest value (79 in Sweden)
Infant mortality Scaled to: 1 - 100; upper limit of 9/1000 achieved in
Sweden Literacy (Actual percent)

Social Indicators as Alternative Measures of Development:
Human Development Index (HDI)Undertaken by the UNDP and found in the Human Development Report (annual series, begun in 1990). Ranks countries on a scale of 0 (worst) to 1 (highest level of human development) based on 3 goals: Longevity (life expectancy at birth) Knowledge (weighted average of adult literacy
(66%) and mean years of schooling (33%)) Standard of Living (real per capita income in PPP)
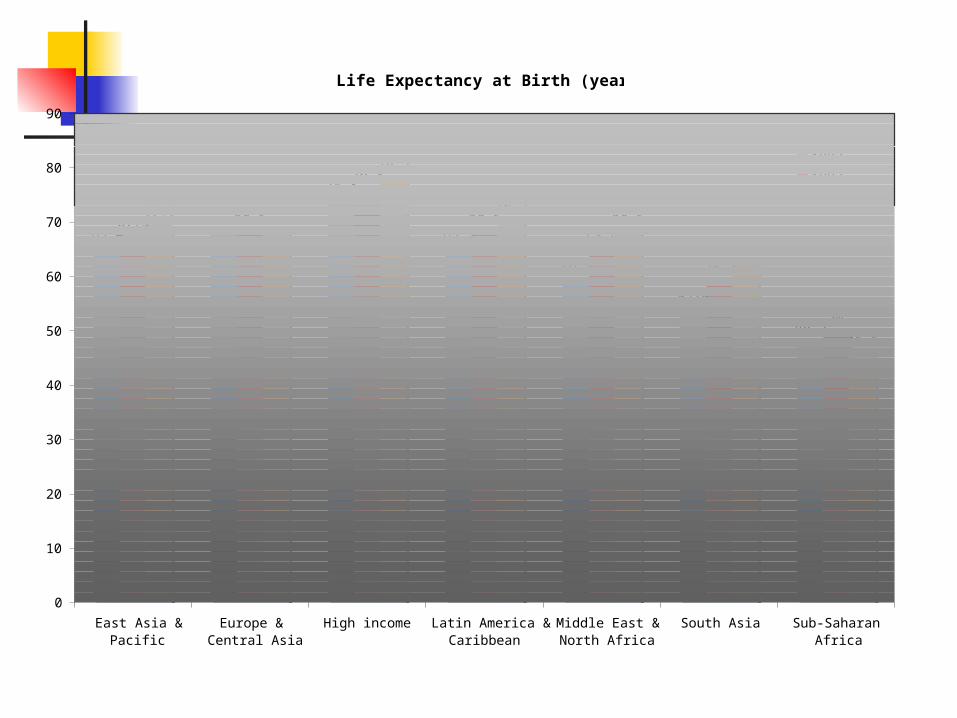
Life Expectancy at Birth (years)
65.4
74.3
65.3
59.1
54.5
48.3
67.5 68.5
76.3
68.5
64.6
59.5
50
69.6
78.3
70.968.5
63.5
45.6
68.2 68.5
0
10
20
30
40
50
60
70
80
90
East Asia &Pacific
Europe &Central Asia
High income Latin America &Caribbean
Middle East &North Africa
South Asia Sub-SaharanAfrica
1982
1992
2003

Infant Mortality Rate (per 1,000 live births)
43.6
38.6
9.3
42.6
59.7
88.5
109.8
32.229.2
5.4
27.7
45.1
66
101
0
20
40
60
80
100
120
East Asia &Pacific
Europe &Central Asia
High income Latin America& Caribbean
Middle East &North Africa
South Asia Sub-SaharanAfrica
1990
2003


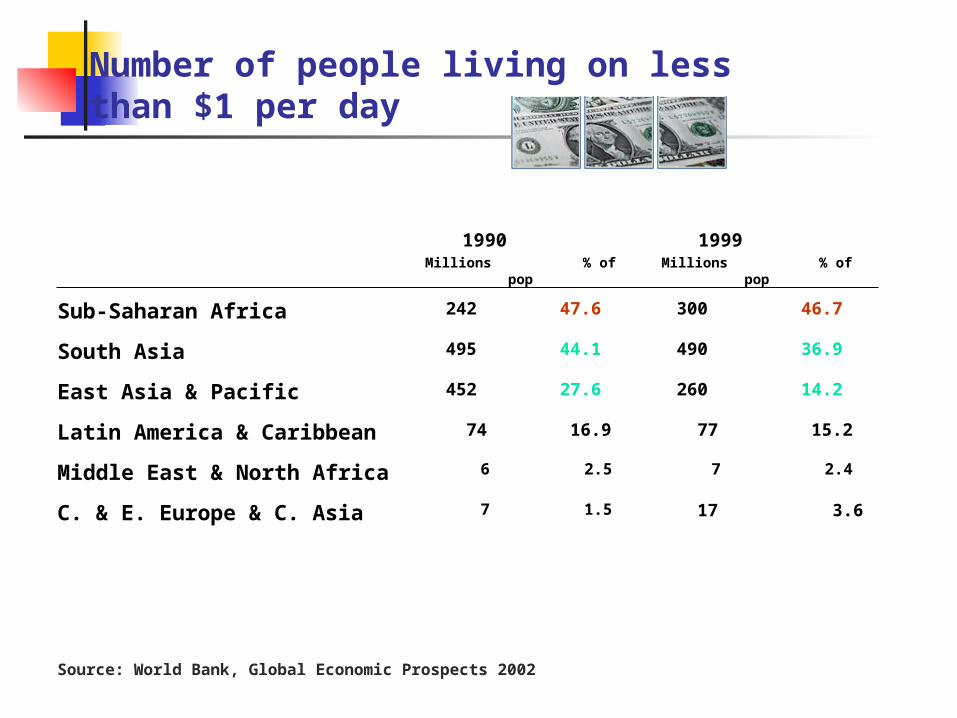
Number of people living on less than $1 per day
Source: World Bank, Global Economic Prospects 2002
7 2.4 6 2.5Middle East & North Africa
77 15.2 74 16.9Latin America & Caribbean
260 14.2 452 27.6East Asia & Pacific
490 36.9 495 44.1South Asia
300 46.7 242 47.6Sub-Saharan Africa
17 3.6 7 1.5C. & E. Europe & C. Asia
1999Millions % of pop
1990
Millions % of pop
What other measures might we have of poverty?
As suggested by Sen, Easterly and Meier? Freedom
Economic: Debt bondage Political: ability to make public decisions Social: Violence against ethnic minorities;
women(example of Kader Mia a Muslim daily laborer)

-4.38
2.32
0.80
0.11
3.30
6.31
4.02
1.751.30
2.27
4.04
1.38
-0.89
7.33
-6.00
-4.00
-2.00
0.00
2.00
4.00
6.00
8.00
East Asia &Pacific
Europe &Central Asia
High income Latin America &Caribbean
Middle East &North Africa
South Asia Sub-SaharanAfrica
1986-1995 1996-2005
Note: For Europe & Central Asia the average is from 1990 – 1995
Source: World Bank World Development Indicators
Average GDP per Capita Growth (annual %)

0
50
100
150
200
250
300
350
400
450
Official flows
Private flows
Source: World Bank – Global Development Finance 2006
Net Resource Flows to Developing Countries(Billion USD)

3.1 2.1 1.7 2.5 1.9
33.9
23.521.4 20.6 24.1 23.2
18.0
0.8 0.60.0
5.0
10.0
15.0
20.0
25.0
30.0
35.0
40.0
East Asia &Pacific
Europe &Central Asia
High income Latin America &Caribbean
Middle East &North Africa
South Asia Sub-SaharanAfrica
Gross FDI (% of GDP) Gross capital formation (% of GDP)
Source: World Bank World Development Indicators
Average Annual Investment 1990 – 2004
(% of GDP)

FDI inflows and Investment as % of GDP
Source: EIU
FDI inflows and total gross investmentAverage 1998 - 2006
0
5
10
15
20
25
30
Poland Ireland Portugal Hungary Spain Czech Republic SlovakRepublic
% o
f G
DP
FDI Total investment

Energy Use (kg of oil equivalent per capita)
727
3390
4934
10691187
408
674904
2697
5395
1156
1504
468667
0
1000
2000
3000
4000
5000
6000
East Asia &Pacific
Europe &Central Asia
High income Latin America &Caribbean
Middle East &North Africa
South Asia Sub-SaharanAfrica
1992
2002

GDP per unit of energy use (constant 2000 USD per kg of oil equivalent)
0.740.57
4.61
3.23
1.21
0.83 0.80
1.10
0.80
5.05
3.25
1.11 1.010.85
0.00
1.00
2.00
3.00
4.00
5.00
6.00
East Asia &Pacific
Europe &Central Asia
High income Latin America& Caribbean
Middle East &North Africa
South Asia Sub-SaharanAfrica
1992
2002

Internet Users (per 1,000 people)
0.5 3.6
24.8
2.1 0.2 0.1 0.4
68.2
161.0
366.5
106.1
46.1
10.519.7
0
50
100
150
200
250
300
350
400
East Asia &Pacific
Europe &Central Asia
High income Latin America &Caribbean
Middle East &North Africa
South Asia Sub-SaharanAfrica
1995
2003

Personal Computers (per 1,000 people)
7.528.1
255.8
29.416.1
2.1 7.626.3
73.4
459
67.4
31.1
6.8 11.9
0
50
100
150
200
250
300
350
400
450
500
East Asia &Pacific
Europe &Central Asia
High income Latin America &Caribbean
Middle East &North Africa
South Asia Sub-SaharanAfrica
1997
2002

Telephone Mainlines (per 1,000 people)
4
79
360
4521
3 715
149
485
76
46
161
228
550
170
133
39
11810
0
100
200
300
400
500
600
East Asia &Pacific
Europe &Central Asia
High income Latin America &Caribbean
Middle East &North Africa
South Asia Sub-SaharanAfrica
1983
1993
2003
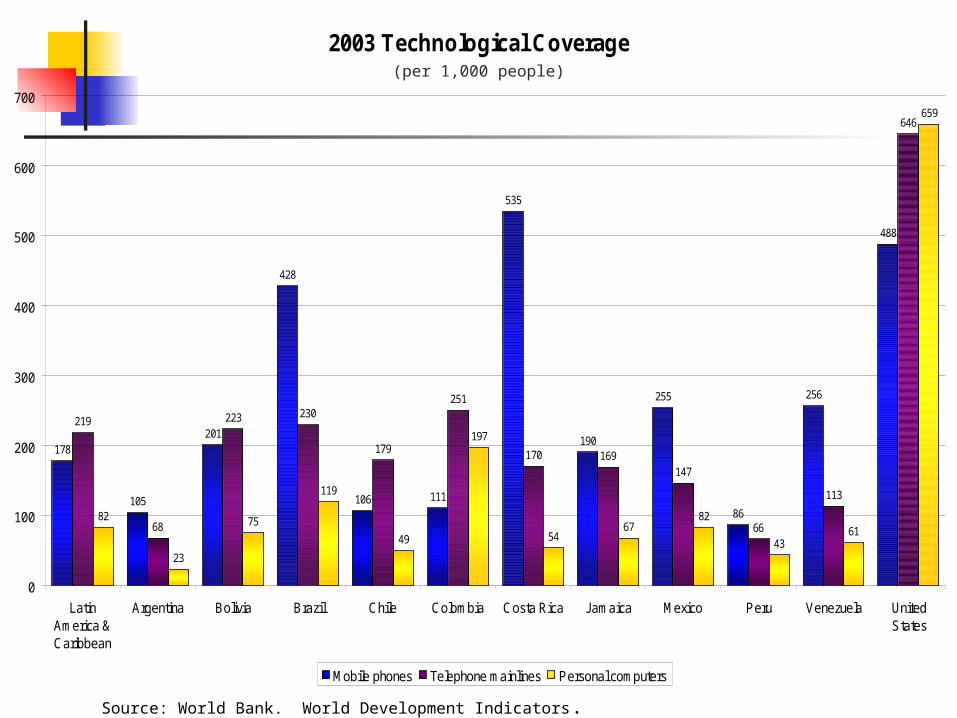
Source: World Bank. World Development Indicators.
(per 1,000 people)
2003 Technological Coverage
178
105
201
428
106 111
535
190
255
86
256
488
219
68
223 230
179
251
170 169147
66
113
646
82
23
75
119
49
197
5467
82
4361
659
0
100
200
300
400
500
600
700
LatinAmerica &Caribbean
Argentina Bolivia Brazil Chile Colombia Costa Rica Jamaica Mexico Peru Venezuela UnitedStates
Mobile phones Telephone mainlines Personal computers

Source: World Bank – Global Development Finance 2003; and William Davidson Institute calculations
Illiteracy Rate(% of people ages 15 and above)
4.6
15.6
21.7
47
51.2
2.7
10.8
13.2
35.5
37.7
44.753.8
0 10 20 30 40 50 60
C. & E. Europe & C.Asia
Latin America &Carribbean
East Asia & Pacific
Middle East & NorthAfrica
Sub-Saharan Africa
South Asia
2001
1989
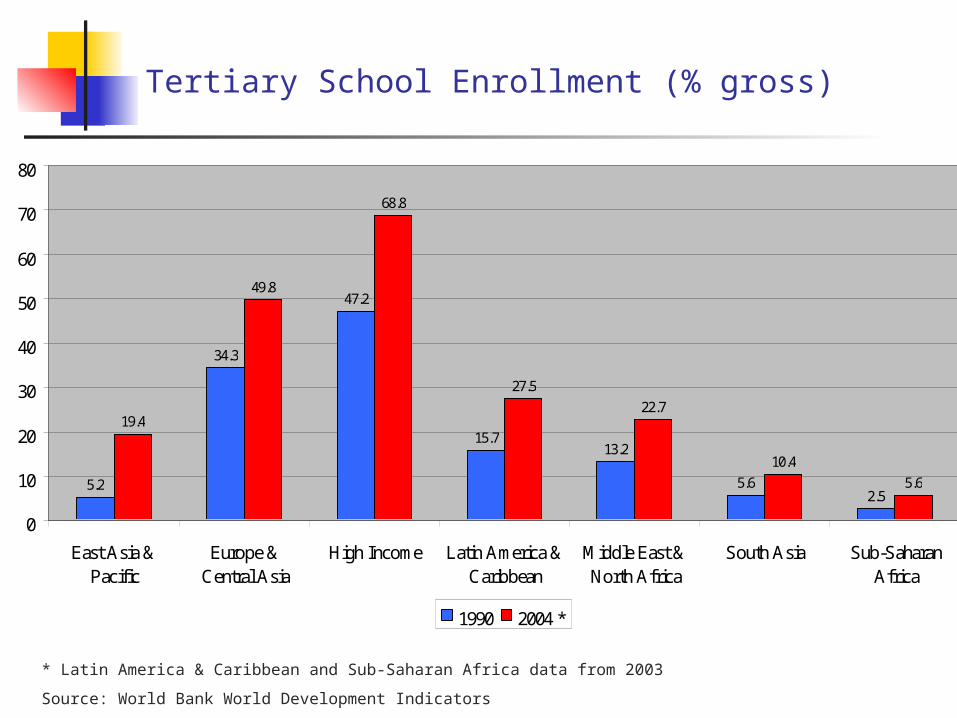
Tertiary School Enrollment (% gross)
5.2
34.3
47.2
15.713.2
5.62.5
19.4
49.8
68.8
27.5
22.7
10.4
5.6
0
10
20
30
40
50
60
70
80
East Asia &Pacific
Europe &Central Asia
High Income Latin America &Caribbean
Middle East &North Africa
South Asia Sub-SaharanAfrica
1990 2004 *
* Latin America & Caribbean and Sub-Saharan Africa data from 2003
Source: World Bank World Development Indicators

Concluding observations Development = a long term process Various measures and degrees of success Globalization increases wealth but uneven
distribution Many countries, groups and individuals left behind Role of institutions – IMF and World Bank Question of how best to organize and focus
institutions