jal group's q1 account settlement for fy2004 · pdf filejal group’s q1 account...
TRANSCRIPT

0 ©JAL 20040 ©JAL 2004
JAL Group’s Q1 Account Settlement
for FY2004- Analyst Briefing -
August 2, 2004
Japan Airlines Corporation

1 ©JAL 20041 ©JAL 2004
Table of Contents
Table of Contents P1
Part I Part IIQ1 Account Settlement for FY2004 P2 Measures for the Rest of the Term P12
Outline of the Consolidated Financial Statements P3 Demand Trend for Q1 P13
Operating Revenue & Income by Segment P4 Revenue Increase Measures (DP) P14
Outline of the Results of Air Transportation Segment P5 Revenue Increase Measures (IP) P15
Demand & Supply of IP by Route (vs. FY03) P6 Rising Fuel Price P16
Results of International Passenger P7 Measures to cope with soaring Fuel Price P17
Results of Domestic Passenger P8 APPENDIX P18
Results of International Cargo P9 Demand & Supply of IP by Route (vs.FY02) P19
Outline of the Breakdown of Operating Costs P10 Results of International Passenger (vs. FY02) P20
Fuel & FOREX (Air Transportation Segment) P11 Consolidated Traffic Statistics P21

2 ©JAL 20042 ©JAL 2004
Q1 Account Settlement for FY2004
Part I

3 ©JAL 20043 ©JAL 2004
Outline of the Consolidated Financial StatementsI. Q1 Account Settlement for FY2004I. Q1 Account Settlement for FY2004
FY03/1Q FY04/1Q Difference
OperatingRevenue
398.8 479.3 +80.4
OperatingIncome
(76.9) (30.2) +46.7
OrdinaryIncome
(76.7) (35.7) +40.9
Net Income (77.2) (40.7) +36.5
(Billions of yen)
4 ©JAL 20044 ©JAL 2004
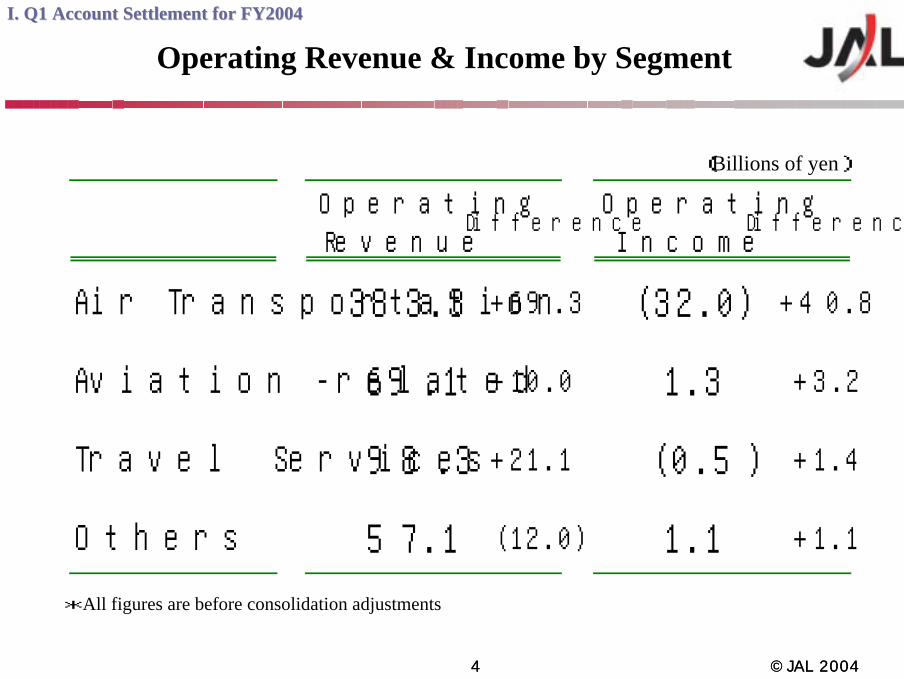
OperatingRevenue
DifferenceOperatingIncome
Difference
Air Transportation 383.3 +69.3 (32.0) +40.8
Aviation -related 69.1 +10.0 1.3 +3.2
Travel Services 98.3 +21.1 (0.5) +1.4
Others 57.1 (12.0) 1.1 +1.1
(Billions of yen)
*All figures are before consolidation adjustments
Operating Revenue & Income by SegmentI. Q1 Account Settlement for FY2004I. Q1 Account Settlement for FY2004

5 ©JAL 20045 ©JAL 2004
Operating Revenue 313.9 383.3 +69.3 122.1%
International Passenger 93.8 150.0 +56.2 159.9%
Domestic Passenger 145.7 150.0 +4.2 102.9%
International Cargo 35.6 40.4 +4.7 113.4%
Domestic Cargo 7.1 7.4 +0.3 104.6%
Others 31.4 35.2 +3.8 112.1%
Operating Expenses 386.8 415.3 +28.5 107.4%
Operating Income (728.0) (320.0) +40.8 -
(Billions of yen)
Difference y.o.y (%)FY03/1Q FY04/1Q
I. Q1 Account Settlement for FY2004 I. Q1 Account Settlement for FY2004
Outline of the Results of Air Transportation Segment

6 ©JAL 20046 ©JAL 2004
Demand & Supply of International Passengers by Route(vs.FY03)
22.9
57.6 56.2
80.7
20.7
128.2
45.7
22.034.3 34.0
8.1
56.5
4.8
76.5
269.0
▲ 1.1
▲ 20.0
30.0
80.0
130.0
180.0
230.0
280.0
Continental/USAHawaii
Europe
Southeast AsiaOceania
Guam/Saipan
Korea
China
RPK ASK
L/F FY04 66.0 % FY03 53.2%L/F FY04 66.0 % FY03 53.2%y.o.y.(%)
I. Q1 Account Settlement for FY2004 I. Q1 Account Settlement for FY2004
7 ©JAL 20047 ©JAL 2004
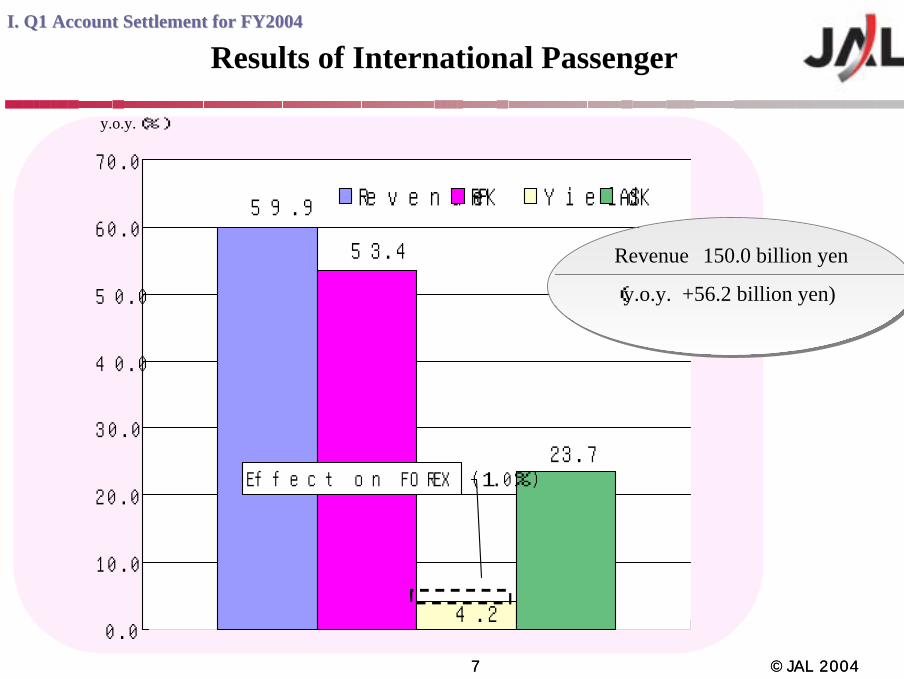
Results of International Passenger
59.9
53.4
4.2
23.7
0.0
10.0
20.0
30.0
40.0
50.0
60.0
70.0
Revenue RPK Yield ASK
Effect on FOREX (1.0%)
y.o.y.(%)
Revenue 150.0 billion yen
(y.o.y. +56.2 billion yen)
Revenue 150.0 billion yen
(y.o.y. +56.2 billion yen)
I. Q1 Account Settlement for FY2004 I. Q1 Account Settlement for FY2004
8 ©JAL 20048 ©JAL 2004
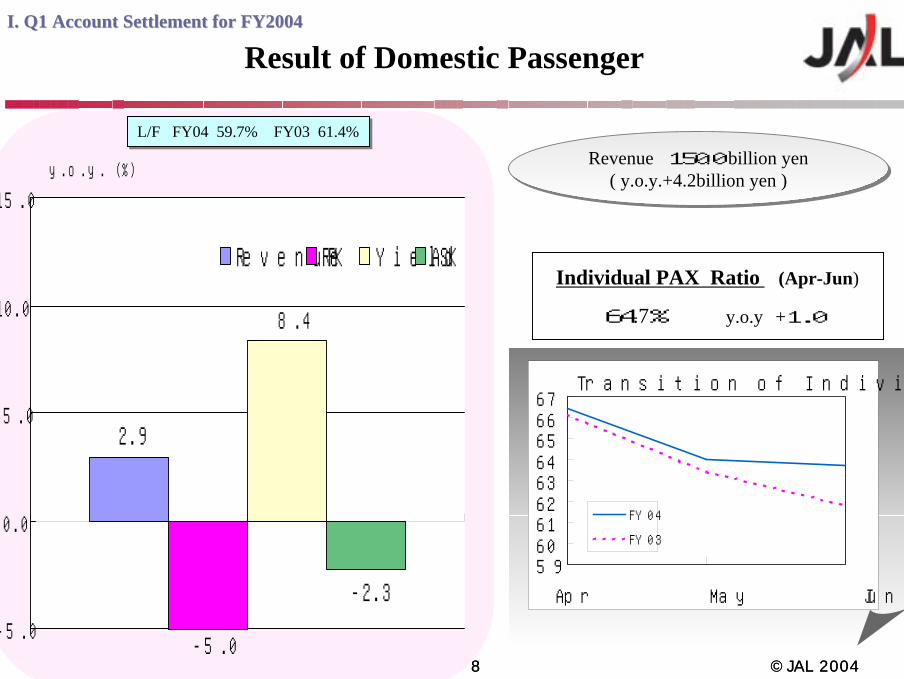
Result of Domestic Passenger
2.9
8.4
-5.0
-2.3
-5.0
0.0
5.0
10.0
15.0
Revenue RPK Yield ASK
y.o.y. (%) Revenue 150.0 billion yen ( y.o.y.+4.2billion yen )
Revenue 150.0 billion yen ( y.o.y.+4.2billion yen )
596061626364656667
Apr May Jun
FY04
FY03
Transition of Individual PAX Ratio
L/F FY04 59.7% FY03 61.4%L/F FY04 59.7% FY03 61.4%
Individual PAX Ratio (Apr-Jun)
64.7% y.o.y +1.0
I. Q1 Account Settlement for FY2004 I. Q1 Account Settlement for FY2004
9 ©JAL 20049 ©JAL 2004
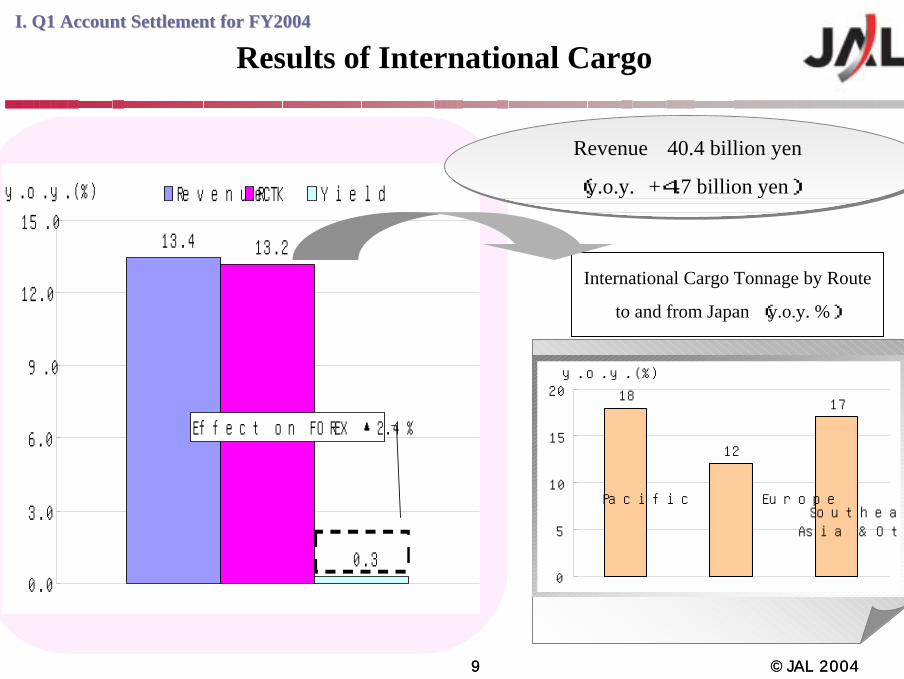
Results of International Cargo
International Cargo Tonnage by Route
to and from Japan (y.o.y. %)
13.4 13.2
0.30.0
3.0
6.0
9.0
12.0
15.0Revenue RCTK Yieldy.o.y.(%)
Effect on FOREX ▲2.4%12
1718
0
5
10
15
20y.o.y.(%)
Pacific EuropeSoutheast
Asia & Others
Revenue 40.4 billion yen
(y.o.y. +4.7 billion yen)
Revenue 40.4 billion yen
(y.o.y. +4.7 billion yen)
I. Q1 Account Settlement for FY2004 I. Q1 Account Settlement for FY2004
10 ©JAL 200410 ©JAL 2004
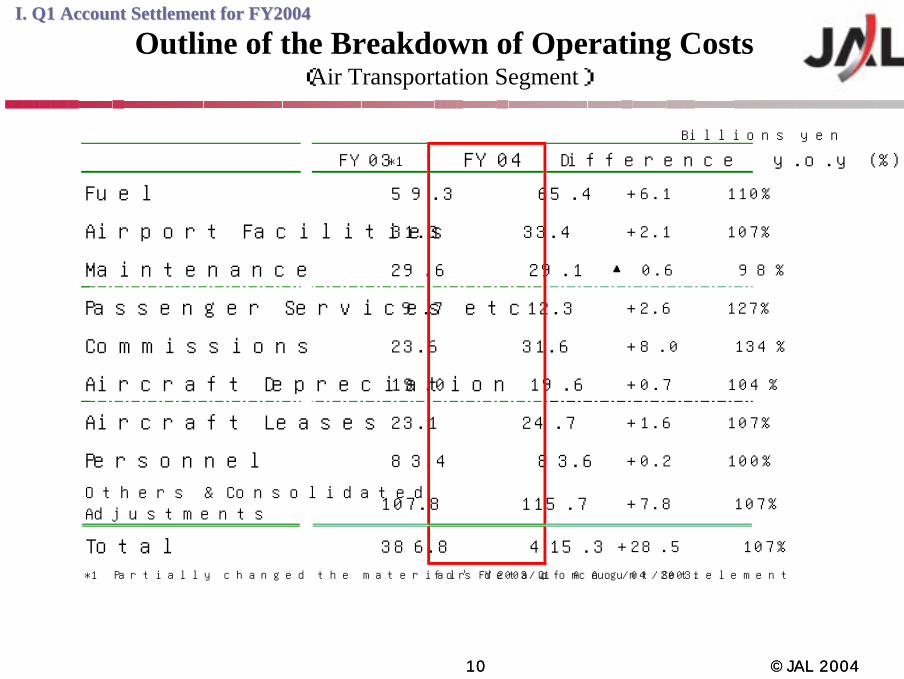
Outline of the Breakdown of Operating Costs(Air Transportation Segment)
Billions yen
FY03 *1 FY04 Difference y.o.y (%)
Fuel 59.3 65.4 +6.1 110%
Airport Facilities 31.3 33.4 +2.1 107%
Maintenance 29.6 29.1 ▲ 0.6 98%
Passenger Services etc 9.7 12.3 +2.6 127%
Commissions 23.6 31.6 +8.0 134%
Aircraft Depreciation 19.0 19.6 +0.7 104%
Aircraft Leases 23.1 24.7 +1.6 107%
Personnel 83.4 83.6 +0.2 100%
Others & ConsolidatedAdjustments
107.8 115.7 +7.8 107%
Total 386.8 415.3 +28.5 107%
*1 Partially changed the material's deta of Account Settelement for FY2003/Q1 on Aug/04/2003.
I. Q1 Account Settlement for FY2004 I. Q1 Account Settlement for FY2004

11 ©JAL 200411 ©JAL 2004
Fuel & FOREX(Air Transportation Segment)
◆Fuel (Average of Apr-Jun)
◆FOREX
Averaged Fuel Price (Singapore Kerosene)
FY04 $41/bbl
(FY03 $30.5/bbl)
Averaged Fuel Price (Singapore Kerosene)
FY04 $41/bbl
(FY03 $30.5/bbl)
Hedge Ratio of FY04
About 40%
(Budget of FY04 $34/bbl)
Hedge Ratio of FY04
About 40%
(Budget of FY04 $34/bbl)
FY03/1Q FY04/1Q Operating Revenue billions yen
Operating Costs
Operating Income
▲ 7.6
+4.8EUR ¥131.3 ¥132.6
USD ¥119.0 ¥110.0▲ 2.8
I. Q1 Account Settlement for FY2004 I. Q1 Account Settlement for FY2004

12 ©JAL 200412 ©JAL 2004
Measures for the Rest of the Term
Part II
13 ©JAL 200413 ©JAL 2004
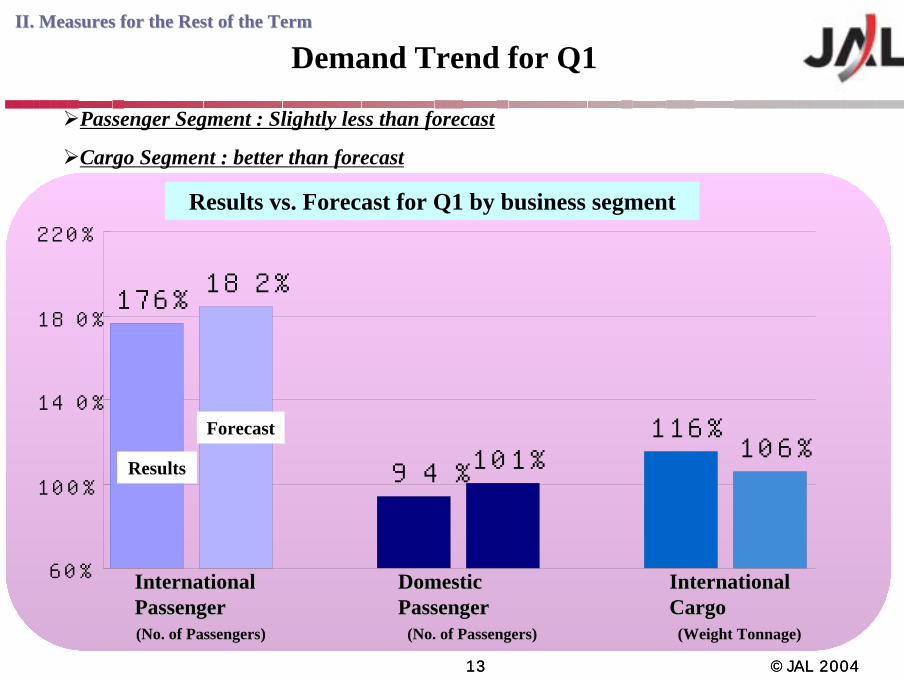
Demand Trend for Q1
Passenger Segment : Slightly less than forecast
Cargo Segment : better than forecast
176%
94% 101%116%
106%
182%
60%
100%
140%
180%
220%
International International PassengerPassenger
Domestic Domestic PassengerPassenger
International International CargoCargo
Results vs. Forecast for Q1 by business segment
Results
Forecast
(No. of Passengers) (No. of Passengers) (Weight Tonnage)
II. Measures for the Rest of the TermII. Measures for the Rest of the Term

14 ©JAL 200414 ©JAL 2004
Revenue Increase Measures (Domestic Passenger)
Sales for Individual Passenger
Sales for Sales for Individual PassengerIndividual Passenger
1.Special campaign to promote FFP (8/30-10/31)
2.Airfare for the LH
3.Careful matching of Airfares in response to Demand Fluctuation
Sales for Group PassengerSales for Group PassengerSales for Group Passenger1. Campaign targeting by destination
2. Beef-up of sales of Group Tour Products
Sales PromotionSales PromotionSales Promotion1.Promotion of “class-J”2.Summer vacation campaign to spur demand targeting families
Promotion of Revenue ManagementOthersOthersOthers
①“Bargain Fair”②“Birthday Discount”③“e-ticketless Discount” (from Dec.)
II. Measures for the Rest of the TermII. Measures for the Rest of the Term
15 ©JAL 200415 ©JAL 2004
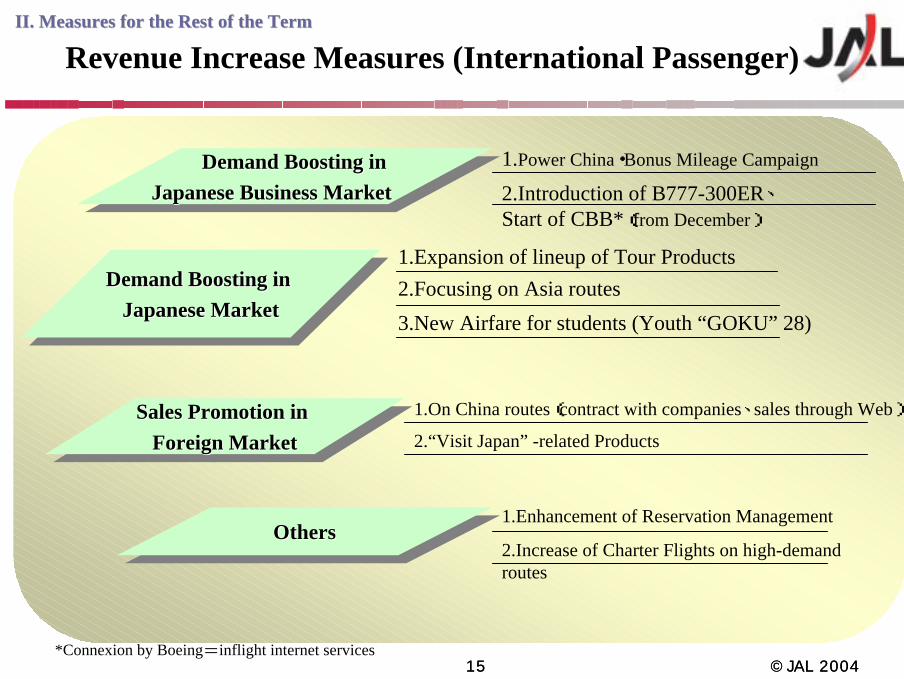
Revenue Increase Measures (International Passenger)
Demand Boosting in Japanese Business Market
Demand Boosting in Demand Boosting in Japanese Business MarketJapanese Business Market
1.Power China・Bonus Mileage Campaign
2.Introduction of B777-300ER、Start of CBB*(from December)
Sales Promotion in Foreign Market
Sales Promotion in Sales Promotion in Foreign MarketForeign Market
1.On China routes(contract with companies、sales through Web)
2.“Visit Japan” -related Products
OthersOthersOthers1.Enhancement of Reservation Management
2.Increase of Charter Flights on high-demand routes
*Connexion by Boeing=inflight internet services
Demand Boosting in Japanese Market
Demand Boosting in Demand Boosting in Japanese MarketJapanese Market
1.Expansion of lineup of Tour Products
3.New Airfare for students (Youth “GOKU” 28)2.Focusing on Asia routes
II. Measures for the Rest of the TermII. Measures for the Rest of the Term

16 ©JAL 200416 ©JAL 2004
Rising Fuel Price
Singapore Kerosene($/bbl.)
$26.0
$34.0
$42.0
$50.0
April May June
2003/Q1
2004/Q1
Fuel Price remains high. Assumptions for FY2004$34/bbl
II. Measures for the Rest of the TermII. Measures for the Rest of the Term

17 ©JAL 200417 ©JAL 2004
Measures to cope with soaring Fuel Price
Impact of Fuel Price Hike on Profits⇒assumed more than
¥30 bln*
<<Additional remedial MeasuresAdditional remedial Measures> >
e.g.e.g.
・Revision of Airfare in IP & Raise of
Fuel Surcharge in IC
⇒ ¥9bln
・Cost Reduction Measures
⇒ ¥17bln
・Revision of Flight & Route Plan
in LH for FY2004
⇒ ¥4bln
Total Total ¥¥3030 blnbln
*{$44/bbl(Market)-$34/bbl(Budget)}×¥5bln(sensitivity)
×60%(non-hedged ratio)
II. Measures for the Rest of the TermII. Measures for the Rest of the Term

18 ©JAL 200418 ©JAL 2004
APPENDIX

19 ©JAL 200419 ©JAL 2004
Demand & Supply of International Passengers by Route(vs.FY02)
-10.9 -12.3-8.5
12.6
▲ 14.9
4.0
11.4
50.2
-2.3
11.7
-9.0
-2.4
8.3
▲ 10.1
1.4▲ 0.2
-20.0
0.0
20.0
40.0
60.0
Contine
ntal/USA
Haw
aii
Euro
pe
South
east A
sia
Oce
ania
Guam
/Saipan
Korea
China
RPK ASK
FY04/FY02 Difference (%)
FY04/FY02
L/F FY04 66.0 % FY02 71.2%L/F FY04 66.0 % FY02 71.2%
ASK: Available Seat-km
RPK:Revenue Passenger-km
APPENDIX

20 ©JAL 200420 ©JAL 2004
Results of International Passenger
FY04/FY02
1.3
-3.1
-6.2
3.3
-10.0
0.0
10.0
20.0Revenue RPK Yield ASKFY04/FY02 Difference(%)
International Passenger Revenue 150 Billion yen
(FY04/FY02 ▲4.8Billion yen)
International Passenger Revenue 150 Billion yen
(FY04/FY02 ▲4.8Billion yen)
ASK: Available Seat-km
RPK:Revenue Passenger-km
APPENDIX
21 ©JAL 200421 ©JAL 2004
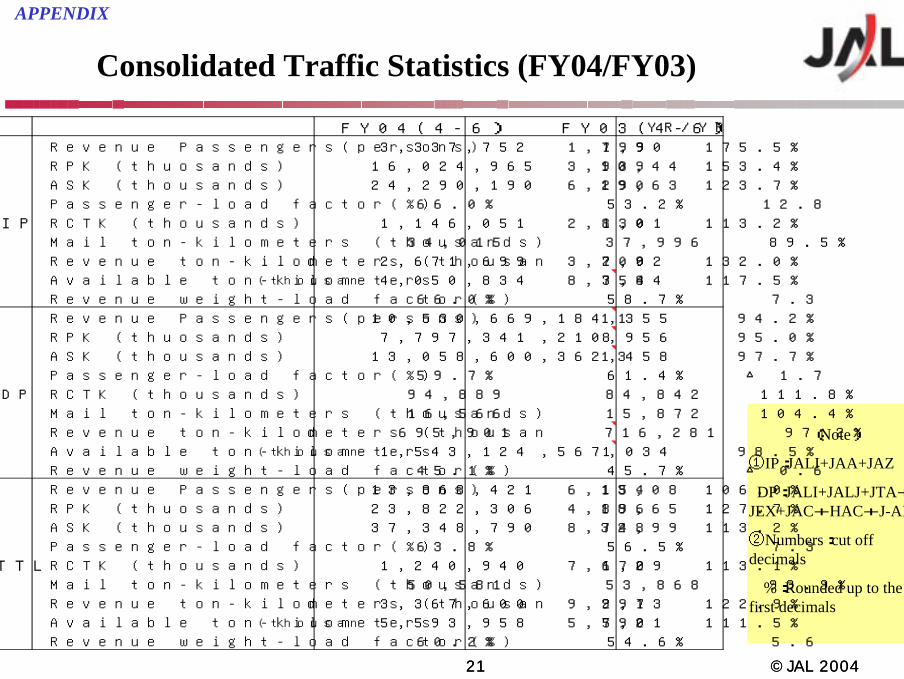
Consolidated Traffic Statistics (FY04/FY03)
APPENDIX
FY04(4-6) FY03(4-6) YR/YR
Revenue Passengers(persons) 3,337,752 1,901,799 175.5%
RPK (thuosands) 16,024,965 10,443,939 153.4%
ASK (thousands) 24,290,190 19,636,290 123.7%
Passenger-load factor(%) 66.0% 53.2% 12.8
IP RCTK (thousands) 1,146,051 1,012,830 113.2%
Mail ton-kilometers (thousands) 34,015 37,996 89.5%
Revenue ton-kilometers (thousand 2,671,699 2,023,709 132.0%
Available ton-kilometers (thousand 4,050,834 3,448,758 117.5%
Revenue weight-load factor(%) 66.0% 58.7% 7.3
Revenue Passengers(persons) 10,530,669 11,184,355 94.2%
RPK (thuosands) 7,797,341 8,210,956 95.0%
ASK (thousands) 13,058,600 13,362,458 97.7%
Passenger-load factor(%) 59.7% 61.4% △ 1.7
DP RCTK (thousands) 94,889 84,842 111.8%
Mail ton-kilometers (thousands) 16,566 15,872 104.4%
Revenue ton-kilometers (thousand 695,901 716,281 97.2%
Available ton-kilometers (thousand 1,543,124 1,567,034 98.5%
Revenue weight-load factor(%) 45.1% 45.7% △ 0.6
Revenue Passengers(persons) 13,868,421 13,086,154 106.0%
RPK (thuosands) 23,822,306 18,654,896 127.7%
ASK (thousands) 37,348,790 32,998,748 113.2%
Passenger-load factor(%) 63.8% 56.5% 7.3
TTL RCTK (thousands) 1,240,940 1,097,672 113.1%
Mail ton-kilometers (thousands) 50,581 53,868 93.9%
Revenue ton-kilometers (thousand 3,367,600 2,739,991 122.9%
Available ton-kilometers (thousand 5,593,958 5,015,792 111.5%
Revenue weight-load factor(%) 60.2% 54.6% 5.6
(Note)
①IP:JALI+JAA+JAZ
DP:JALI+JALJ+JTA+JEX+JAC+HAC+J-AIR
②Numbers:cut off decimals
%:Rounded up to the first decimals

22 ©JAL 200422 ©JAL 2004
<Contact Address>
Japan Airlines Corporation, IR Desk TEL: (03)5769-6097 FAX: (03)5769-6492
Office Hour: Weekday: 9:30-12:00,13:00-17:00
Address: JAL Bldg. 2-4-11, Higashi-Shinagawa Shinagawa-ku, Tokyo 140-8605
(N.B.)
Please refer to the Financial Information (“Gyoseki no Gaikyo” ) for the precise figures on the account settlement. Any statements in this document, other than those of historical facts, are forward-looking statements about future performance, which are based on management’s assumptions and beliefs in light of information currently available, and involve risks and uncertainties. Actual results may differ materially from these forecasts. This document is published as supplemental materials for the Briefing on JAL Group’s Financial Statements for Q1 in FY2004. The copyright of this document belongs Japan Airlines System Corporation.
You can watch this presentation on our Homepage (Sorry! Only in Japanese). Please refer to the following URL: http://www.jal.co.jp/broadband/
<Notice>