jakarta's green economy model (jak-gem)
TRANSCRIPT
Pavan Sukhdev, Kaavya Varma, Andrea M. Bassi,Verania Andria, Johan Kieft, Sonny Mumbunan and Puspa Kartika
Jakarta’s Green Economy Model (JAK-GEM)
LECB INDONESIAFINAL REPORT
Jakarta’s Green Economy Model (JAK-GEM)Final Report
LECB Indonesia Final Report
Pavan Sukhdev
Kaavya Varma
Andrea M. Bassi
Verania Andria
Johan Kieft
Sonny Mumbunan
Puspa Kartika
LECB Indonesia Policy Note
© 2014 Low Emission Capacity Building (LECB)
All rights reserved
Suggested citation:
Ministry of National Development Planning/National Development Planning Agency (BAPPENAS) and Presidential Working Unit
for Development Monitoring and Oversight (UKP-PPP) of the Republic of Indonesia. 2014. I-GEM: Mea-suring Indonesia’s Transi-
tion Towards a Green Economy. Jakarta: LECB Indonesia Policy Note.
Cover photo credit: Ayunda Swacita Manggiasih
UNDP Indonesia
Menara Thamrin 8-9th floor
Jl. M.H. Thamrin Kav. 3
Jakarta 10250
This policy note is intended to communicate initial findings or methods used in projects related to LECB Programme in Indonesia to
promote further policy discussions. Any views expressed in this policy note do not necessarily represent the views of the institutions
or the sponsors of this publication.
Abbreviations ii
Executive Summary 1
1. I-GEM and its applicability for Provinces 2
2. Green Economy Indicators for Jakarta 3
3. Jakarta Green Economy Model (JAK-GEM) 7
4. Business as Usual 10
5. Green Economy Scenarios 18
6. Policy Implications based on Scenario Analysis 26
References 29
Table of Contents
Acknowledgement
We thank the following persons for their valuable cooperation and insightful inputs for the development of the Kalimantan Tengah
Green Economy Model and this report;
The Governor and Vice Governor of Kalimantan Tengah, Head of BAPPEDA and Assistant to the Governor on Economic and De-
velopment of Kalimantan Tengah.
The provincial officials; Warismun, Domingus Neves, Akhmad Elfiansah, Retno Nurhayati Utaminingsih, Jani Dwipriambodo, Fir-
manto, Indah Susanti Rosga, Edwin Adi Pratama.
The University of Palangkaraya; Yusurum Jagau, Jhon Wardi, Tri Yuliana.
Dr. Medrilzam, Dr. Muh. Tasrif, Akhmad Taufik and Hani Irwan.
iJakarta’s Green Economy Model (JAK-GEM)
Figure 1: Population trends of Jakarta 4
Figure 2: JAK-GEM user interface 7
Figure 3: Total population and GDP of the poor (riverside village) 10
Figure 4: Real GDP (also by industry and services, and agriculture) and its growth rate 11
Figure 5: Government revenue and expenditure, and total capital formation (public and private) 13
Figure 6: Simulation results, electricity demand and total electricity bil 14
Figure 7: Simulation results, private vehicle stock and road network 15
Figure 8: Simulation results, total vehicles and transport emissions 16
Figure 9: Simulation results, GDP and its growth rate: comparison of (1) BAU,
(2) subsidy removal and (3) removal, reallocation, energy efficiency and transport 19
Figure 10: Simulation results, electricity demand and total electricity bill (all sectors): Comparison
of (1) BAU, (2) subsidy removal and (3) removal, reallocation, energy efficiency and transport 21
Figure 11: Simulation results, per capita electricity bill (residential sector) and electricity productivity:
comparison of (1) BAU, (2) subsidy removal and (3) removal, reallocation,
energy efficiency and transport 22
Figure 12: Simulation results, total electricity generation: comparison of (1) BAU, (2) subsidy removal
and (3) removal, reallocation, energy efficiency and transpor 23
Figure 13: Simulation results, waste landfilling and waste to energy electricity generation:
comparison of (1) BAU, (2) subsidy removal and (3) removal, reallocation,
energy efficiency and transport 23
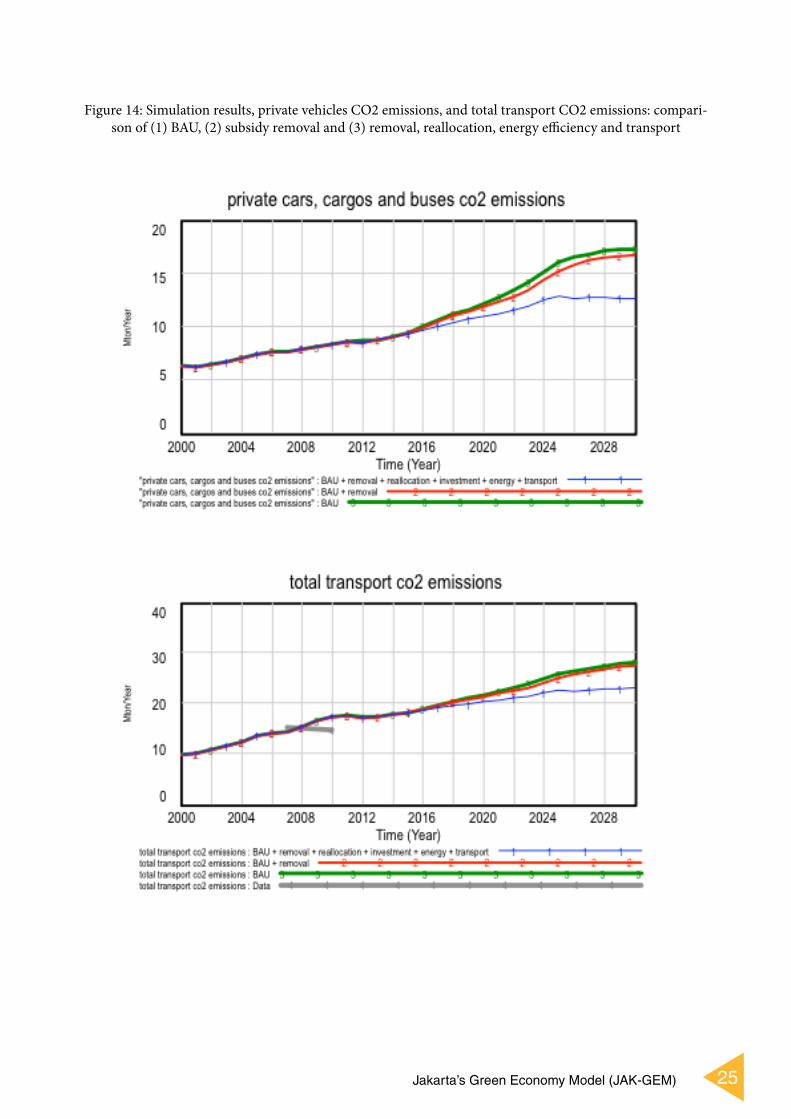
Figure 14: Simulation results, private vehicles CO2 emissions, and total transport CO2 emissions:
comparison of (1) BAU, (2) subsidy removal and (3) removal, reallocation, energy efficiency
and transport 25
Table 1: List of (1) assumptions and (2) policies that can be simulated with JAK-GEM 8
Text Box 1: Development of JAK-GEM 26
List of Figures
List of Tables
List of Textboxes
ii LECB Indonesia Final Report
List of AbbreviationsI-GEM :Indonesia’s Green Economy Model
BAPPEDA : Badan Perencana Pembangunan Daerah (Regional body for Planning and Development)
BAU : Business as Usual
GDP : Gross Domestic Product
GE : Green Economy
ILO : International Labour Organisation
JAK-GEM : Jakarta Green Economy Model
KT-GEM : Kalteng Green Economy Model
LECB : Low Emissions Capacity Building
MW : Mega Watt
1Jakarta’s Green Economy Model (JAK-GEM)
Transitions towards a ‘Green Economy’ are being sought actively by many nations, and Indonesia is
a leader among them. “I-GEM” (Indonesia Green Economy Model) is a flexible and easy-to-learn
national level System Dynamics Model that has been developed as a part of a United Nations sup-
ported capacity building project, to evaluate trade-offs and test the sustainability dimensions of policy
interventions in provincial economies. The first such urban provincial level application of I-GEM has
been undertaken for Jakarta (JAK-GEM), which is tailored to incorporate an additional set of three
‘Green Economy’ outcome indicators. The implementation of this type of model at a provincial level
has significant value added for officials who are seeking to assess the impacts of policy interventions
that they are planning, to improve resilience to climate change, reduce the urban poor’s vulnerability
to environmental factors and ensure equitable economic growth in the long-term.
Executive Summary
2 LECB Indonesia Final Report
1. I-GEM and its applicability for Provinces
I-GEM is a national level “demo” model that has specifically
been designed to support policy formulation and evaluation,
for a variety of goals, including green economy and sustain-
able development in Indonesia. I-GEM seeks to provide policy-
makers with the ability to compare how policy interventions
that they make under business as usual and green economy sce-
narios can have differing impacts on urban poverty, green GDP
and on emissions. Policy-makers are able to view these impacts
over horizons (1 year, 5 years and 10 years), so that they are able
to assess whether they want to go ahead with a particular policy
intervention or not and, thereby, make more informed deci-
sions. I-GEM can assess impacts on several variables (depend-
ing on what the policy-maker inputs into the model), however,
three critical “outcome indicators” such as “GDP of the Rural
Poor”, “Green GDP” and “Decent Green Jobs” are utilized by
the model to display what the effect of selected or intended
policies is on the incomes of the poor, the green GDP and the
availability of decent green jobs in a province. These indicators,
applied in an urban context, can help local planners improve a
city’s preparedness to withstand climate change impacts, un-
derstand better the vulnerability amongst its poor to environ-
mental factors, identify sectors with the greatest potential for
emissions reductions and review existing development policies
with a green economy lens.
The ability of policymakers to undertake such assessments
empowers them and other local government officials to de-
cide how to chart a path towards a green economy within their
provinces, as I-GEM is able to demonstrate whether the poli-
cies they select will indeed result in a more resilient overall
economy, reduce poverty and lessen the degradation of natural
resources in their administrative zones – all criteria for achiev-
ing a green economy. The first pilot urban implementation of
I-GEM has been conducted in Jakarta, referred to as JAK-GEM
that demonstrates how local officials in Jakarta can utilise the
results that JAK-GEM is presenting to shift towards a green
economy. JAK-GEM is uniquely customised to the context of
Jakarta making it very different from the rural green economy
model piloted in Central Kalimantan as KT-GEM. The sections
below briefly describe the three indicators and what they mean,
outline the findings of JAK-GEM and discuss how policy-mak-
ers can use these findings to move towards a green economy in
Jakarta.
If other urban Indonesian provinces also utilize such a model as
a complementary addition to their existing policy implemen-
tation processes, it would facilitate the national achievement
of a green economy for Indonesia. Moreover, a rural example
of I-GEM already exists in the form of KT-GEM (see supple-
mentary report on the development of KT-GEM for Central
Kalimantan), so that Indonesia has representative models for
diverse economies and landscapes. Finally, this report ends
with a summary of the JAK-GEM model parameters and lists
the agencies engaged in the stakeholder consultations to allow
other provinces to be informed about who the key stakeholders
should be when they are developing their own provincial mod-
els. This summary in Text Box 3 can be treated as a separate
insert for quick reference on model construction.
3Jakarta’s Green Economy Model (JAK-GEM)
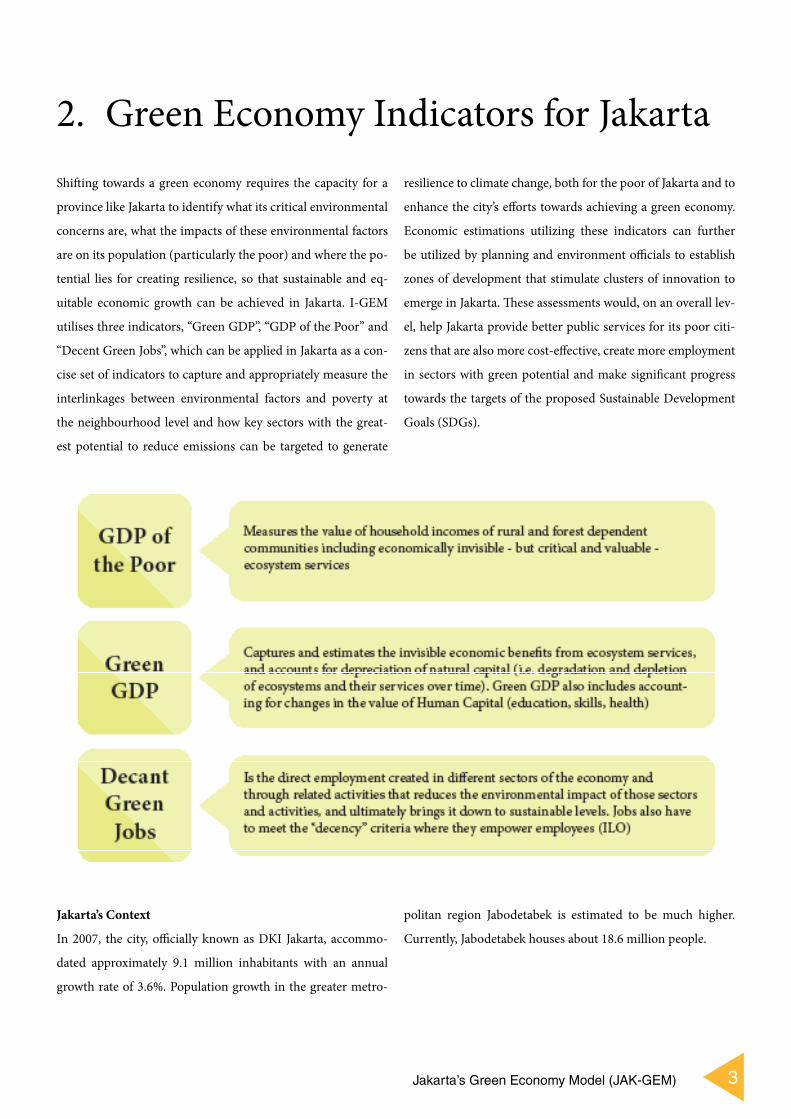
2. Green Economy Indicators for JakartaShifting towards a green economy requires the capacity for a
province like Jakarta to identify what its critical environmental
concerns are, what the impacts of these environmental factors
are on its population (particularly the poor) and where the po-
tential lies for creating resilience, so that sustainable and eq-
uitable economic growth can be achieved in Jakarta. I-GEM
utilises three indicators, “Green GDP”, “GDP of the Poor” and
“Decent Green Jobs”, which can be applied in Jakarta as a con-
cise set of indicators to capture and appropriately measure the
interlinkages between environmental factors and poverty at
the neighbourhood level and how key sectors with the great-
est potential to reduce emissions can be targeted to generate
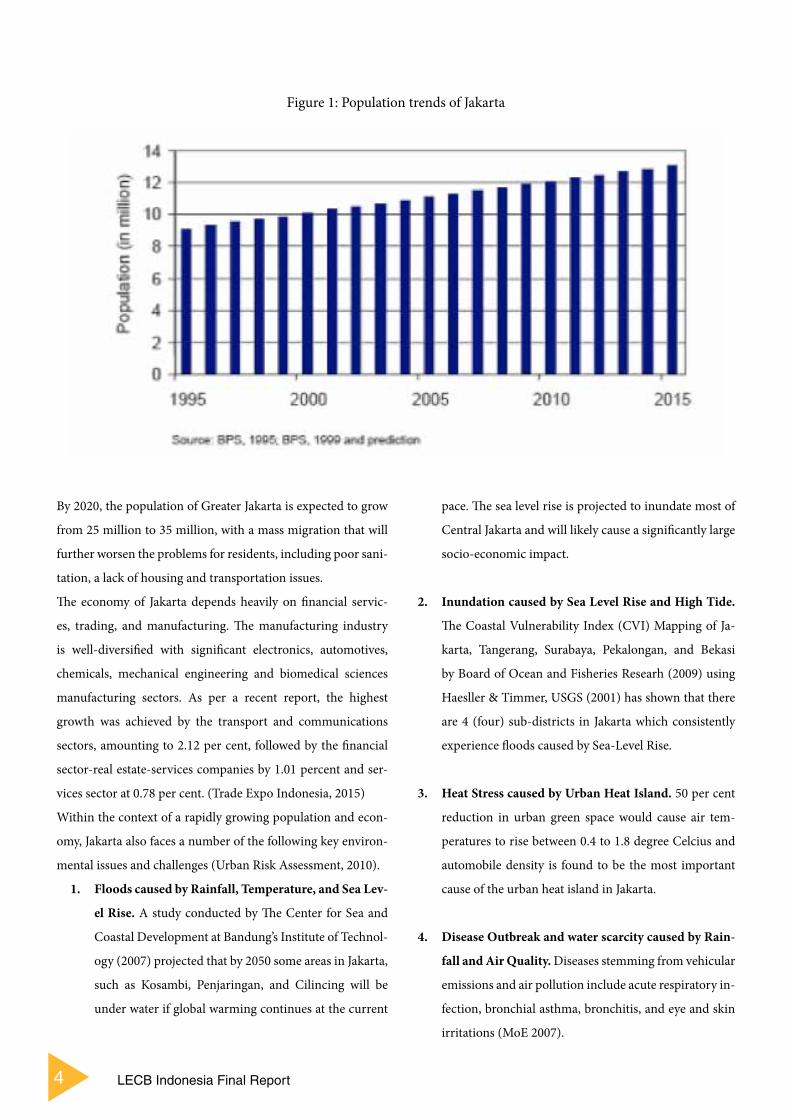
Jakarta’s ContextIn 2007, the city, officially known as DKI Jakarta, accommo-
dated approximately 9.1 million inhabitants with an annual
growth rate of 3.6%. Population growth in the greater metro-
resilience to climate change, both for the poor of Jakarta and to
enhance the city’s efforts towards achieving a green economy.
Economic estimations utilizing these indicators can further
be utilized by planning and environment officials to establish
zones of development that stimulate clusters of innovation to
emerge in Jakarta. These assessments would, on an overall lev-
el, help Jakarta provide better public services for its poor citi-
zens that are also more cost-effective, create more employment
in sectors with green potential and make significant progress
towards the targets of the proposed Sustainable Development
Goals (SDGs).
politan region Jabodetabek is estimated to be much higher.
Currently, Jabodetabek houses about 18.6 million people.
4 LECB Indonesia Final Report
Figure 1: Population trends of Jakarta
By 2020, the population of Greater Jakarta is expected to grow
from 25 million to 35 million, with a mass migration that will
further worsen the problems for residents, including poor sani-
tation, a lack of housing and transportation issues.
The economy of Jakarta depends heavily on financial servic-
es, trading, and manufacturing. The manufacturing industry
is well-diversified with significant electronics, automotives,
chemicals, mechanical engineering and biomedical sciences
manufacturing sectors. As per a recent report, the highest
growth was achieved by the transport and communications
sectors, amounting to 2.12 per cent, followed by the financial
sector-real estate-services companies by 1.01 percent and ser-
vices sector at 0.78 per cent. (Trade Expo Indonesia, 2015)
Within the context of a rapidly growing population and econ-
omy, Jakarta also faces a number of the following key environ-
mental issues and challenges (Urban Risk Assessment, 2010).
1. Floods caused by Rainfall, Temperature, and Sea Lev-el Rise. A study conducted by The Center for Sea and
Coastal Development at Bandung’s Institute of Technol-
ogy (2007) projected that by 2050 some areas in Jakarta,
such as Kosambi, Penjaringan, and Cilincing will be
under water if global warming continues at the current
pace. The sea level rise is projected to inundate most of
Central Jakarta and will likely cause a significantly large
socio-economic impact.
2. Inundation caused by Sea Level Rise and High Tide. The Coastal Vulnerability Index (CVI) Mapping of Ja-
karta, Tangerang, Surabaya, Pekalongan, and Bekasi
by Board of Ocean and Fisheries Researh (2009) using
Haesller & Timmer, USGS (2001) has shown that there
are 4 (four) sub-districts in Jakarta which consistently
experience floods caused by Sea-Level Rise.
3. Heat Stress caused by Urban Heat Island. 50 per cent
reduction in urban green space would cause air tem-
peratures to rise between 0.4 to 1.8 degree Celcius and
automobile density is found to be the most important
cause of the urban heat island in Jakarta.
4. Disease Outbreak and water scarcity caused by Rain-fall and Air Quality. Diseases stemming from vehicular
emissions and air pollution include acute respiratory in-
fection, bronchial asthma, bronchitis, and eye and skin
irritations (MoE 2007).

5Jakarta’s Green Economy Model (JAK-GEM)
Jakarta clearly faces a number of challenges due to significant
environmental issues that already affect the city with cascading
negative impacts on labour productivity, health, economic rev-
enue and public services. As climate change worsens the occur-
rence of extreme events, planners need the ability to determine
how they can continue to meet the demands of Jakarta’s citizens
and its economic growth while reducing the harmful impacts
on its key development sectors. One way they can do this is
to identify what are the environmental services that are being
provided to Jakarta by its natural resources and how improving
their management and protection can alleviate the damaging
effects of environmental hazards. JAK-GEM provides planners
with the capacity to assess the condition of Jakarta’s natural re-
sources and visually see what happens to selected sectors and
incomes of the poor when policy interventions are made so
that officials can decide whether they want to continue under a
BAU trajectory or follow a GE path.
This means that through JAK-GEM policy makers can
strengthen the ability of Jakarta’s industrial sectors for long-
5. Water Scarcity, Air Pollution, and GHG Emissions. Water scarcity is an additional issue as a result of global
and regional climate change. Between 2010 and 2015
the country is predicted to experience a major clean wa-
ter shortage. Air pollution is proven to be a major envi-
ronmental hazard to residents in Jakarta, regardless of
their socio-economic status.
Hazard Effects Losses
River flow
Disruption of business, damage to property, power outage, groundwater pollution, distri-bution of solid waste through high and fast water flow
Property damage, business dam-age, tainting of ground water, loss of life, spread of disease and refuse.
Floods, Inundation
Depending on severity can affect traffic circulation, business activity, damage to property, power outages, displacement, and spread of disease.
Loss of property and businesses, spread of illness and loss of life, lack of access to clean water.
Storm surge
Extreme tidal floods from the sea have become more serious in the past few years in the coastal areas of the city. Seawater intru-sion into aquifers.
Seawater intrusion into drinking water, damage to property, halt of industry and mobility.
Extreme temperatureAs a result of both urbanization and loss of green space, increases in ground tempera-ture and resulting instances of dengue.
Loss of life due to dengue, usually in very poor communities.
6. Climate Change Risks and other Hazards in Jakarta:

6 LECB Indonesia Final Report
term growth by improving the preservation of natural assets
that these sectors depend on. They can, furthermore, capture
the expenditures of the poor and help free incomes by pro-
viding lower cost or free healthcare, cheaper and sustainable
construction material, better access to public transport and
improved livelihoods through targeted initiatives that clean
rivers and waterways, which support incomes through fisher-
ies, etc. Such interventions in Jakarta will go on to lessen the
adverse impacts of climate change because the poor will have the
capacity to recover quickly from environmental hazards and the
negative externalities of industries on the environment will be
addressed.
7Jakarta’s Green Economy Model (JAK-GEM)
3. Jakarta’s Green Economy Model (JAK-GEM)
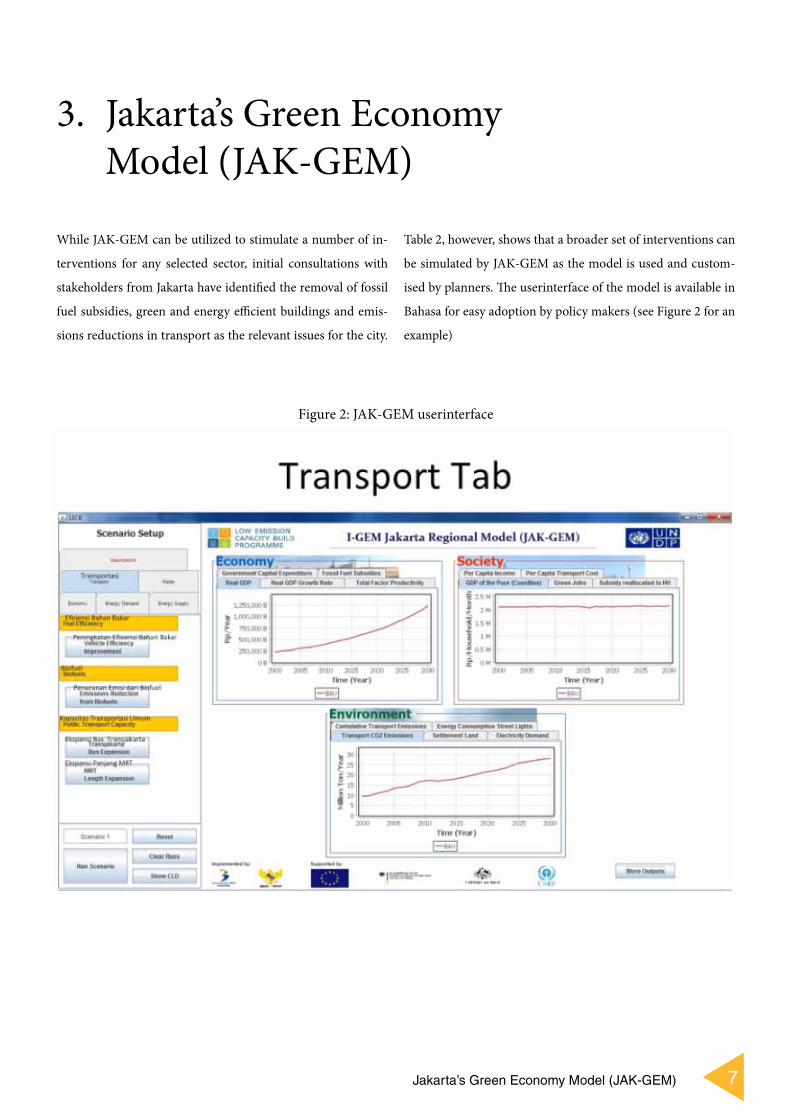
While JAK-GEM can be utilized to stimulate a number of in-
terventions for any selected sector, initial consultations with
stakeholders from Jakarta have identified the removal of fossil
fuel subsidies, green and energy efficient buildings and emis-
sions reductions in transport as the relevant issues for the city.
Table 2, however, shows that a broader set of interventions can
be simulated by JAK-GEM as the model is used and custom-
ised by planners. The userinterface of the model is available in
Bahasa for easy adoption by policy makers (see Figure 2 for an
example)
Figure 2: JAK-GEM userinterface
8 LECB Indonesia Final Report
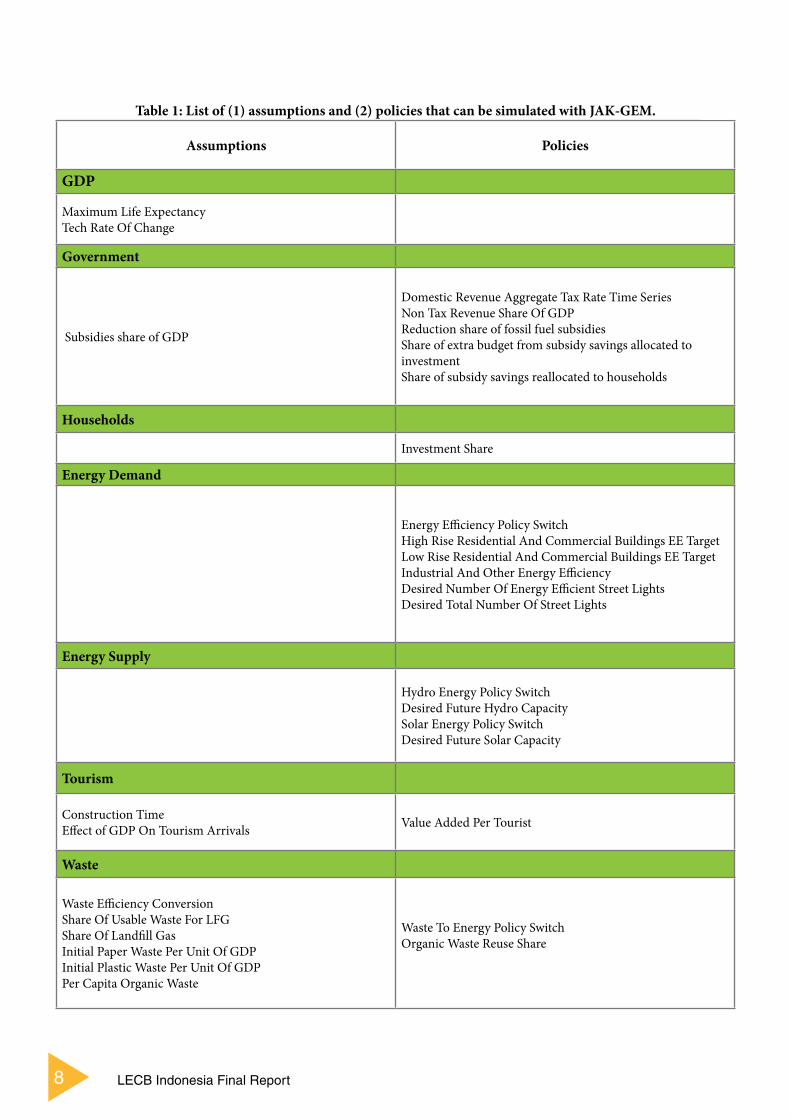
Table 1: List of (1) assumptions and (2) policies that can be simulated with JAK-GEM.
Assumptions Policies
GDP
Maximum Life ExpectancyTech Rate Of Change
Government
Subsidies share of GDP
Domestic Revenue Aggregate Tax Rate Time SeriesNon Tax Revenue Share Of GDPReduction share of fossil fuel subsidiesShare of extra budget from subsidy savings allocated to investmentShare of subsidy savings reallocated to households
Households
Investment Share
Energy Demand
Energy Efficiency Policy SwitchHigh Rise Residential And Commercial Buildings EE TargetLow Rise Residential And Commercial Buildings EE Target Industrial And Other Energy EfficiencyDesired Number Of Energy Efficient Street LightsDesired Total Number Of Street Lights
Energy Supply
Hydro Energy Policy SwitchDesired Future Hydro CapacitySolar Energy Policy SwitchDesired Future Solar Capacity
Tourism
Construction TimeEffect of GDP On Tourism Arrivals Value Added Per Tourist
Waste
Waste Efficiency ConversionShare Of Usable Waste For LFGShare Of Landfill GasInitial Paper Waste Per Unit Of GDPInitial Plastic Waste Per Unit Of GDPPer Capita Organic Waste
Waste To Energy Policy SwitchOrganic Waste Reuse Share
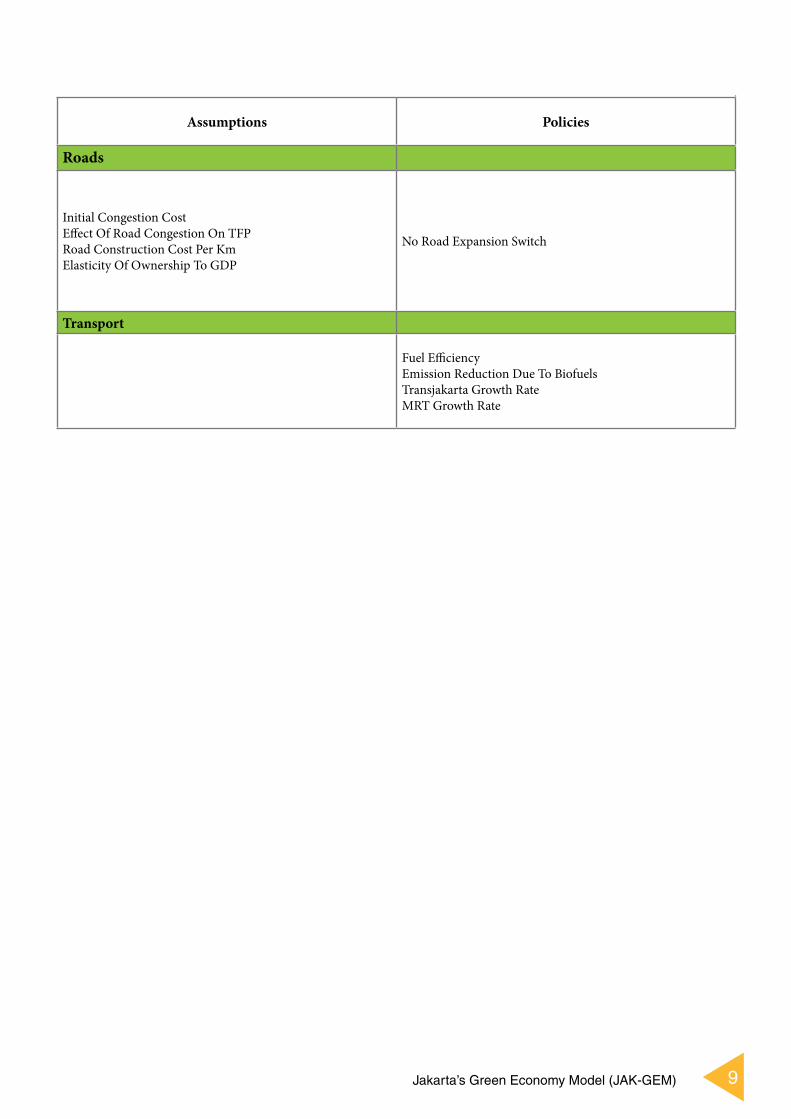
9Jakarta’s Green Economy Model (JAK-GEM)
Assumptions Policies
Roads
Initial Congestion CostEffect Of Road Congestion On TFPRoad Construction Cost Per KmElasticity Of Ownership To GDP
No Road Expansion Switch
Transport
Fuel EfficiencyEmission Reduction Due To BiofuelsTransjakarta Growth RateMRT Growth Rate
10 LECB Indonesia Final Report
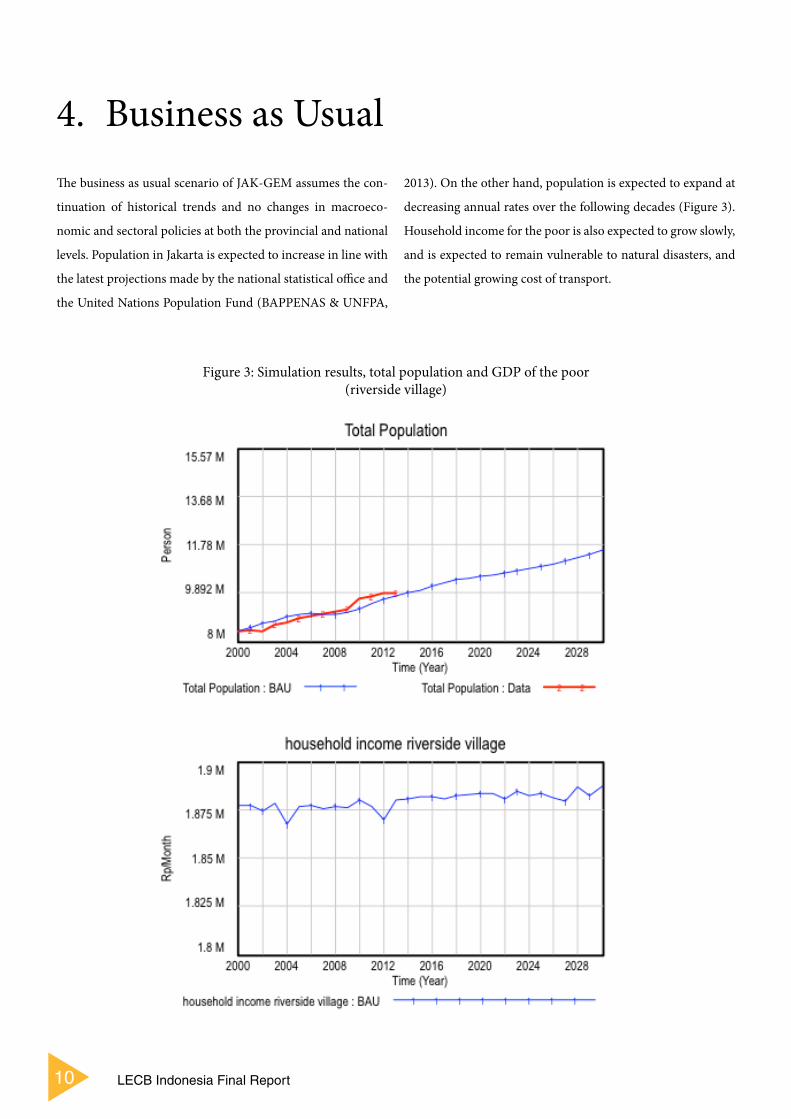
4. Business as Usual The business as usual scenario of JAK-GEM assumes the con-
tinuation of historical trends and no changes in macroeco-
nomic and sectoral policies at both the provincial and national
levels. Population in Jakarta is expected to increase in line with
the latest projections made by the national statistical office and
the United Nations Population Fund (BAPPENAS & UNFPA,
2013). On the other hand, population is expected to expand at
decreasing annual rates over the following decades (Figure 3).
Household income for the poor is also expected to grow slowly,
and is expected to remain vulnerable to natural disasters, and
the potential growing cost of transport.
Figure 3: Simulation results, total population and GDP of the poor (riverside village)
11Jakarta’s Green Economy Model (JAK-GEM)
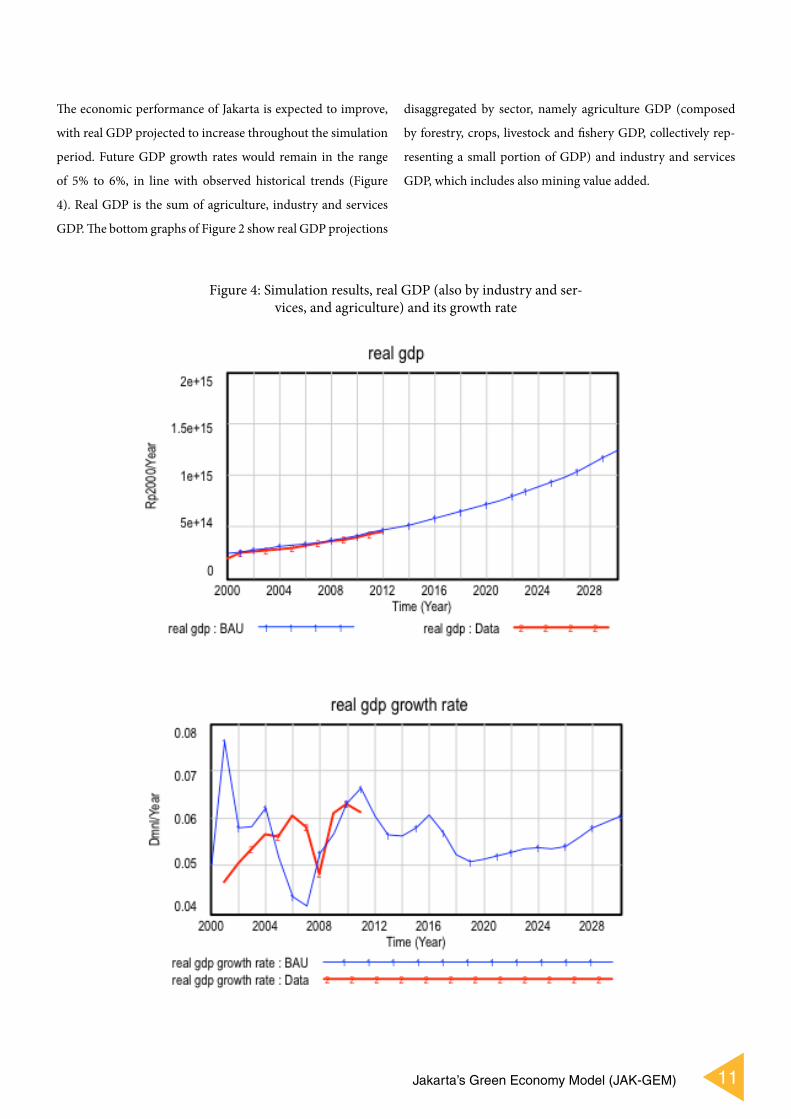
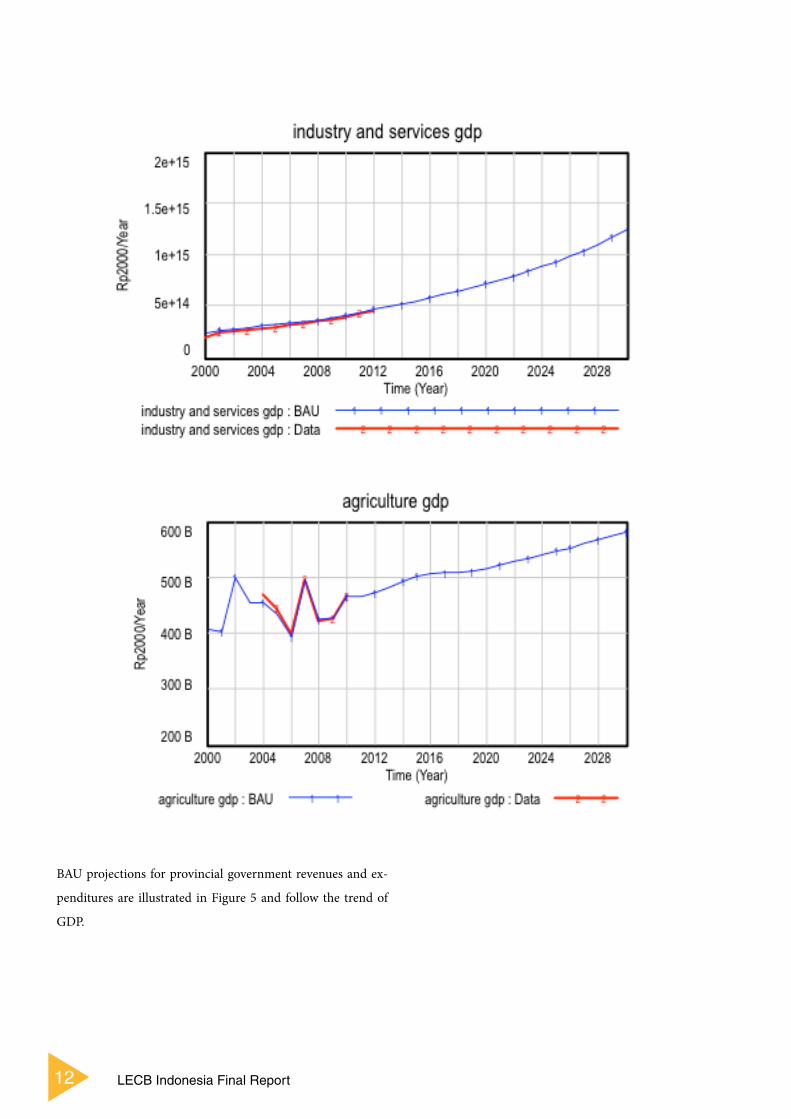
The economic performance of Jakarta is expected to improve,
with real GDP projected to increase throughout the simulation
period. Future GDP growth rates would remain in the range
of 5% to 6%, in line with observed historical trends (Figure
4). Real GDP is the sum of agriculture, industry and services
GDP. The bottom graphs of Figure 2 show real GDP projections
disaggregated by sector, namely agriculture GDP (composed
by forestry, crops, livestock and fishery GDP, collectively rep-
resenting a small portion of GDP) and industry and services
GDP, which includes also mining value added.
Figure 4: Simulation results, real GDP (also by industry and ser-vices, and agriculture) and its growth rate
12 LECB Indonesia Final Report
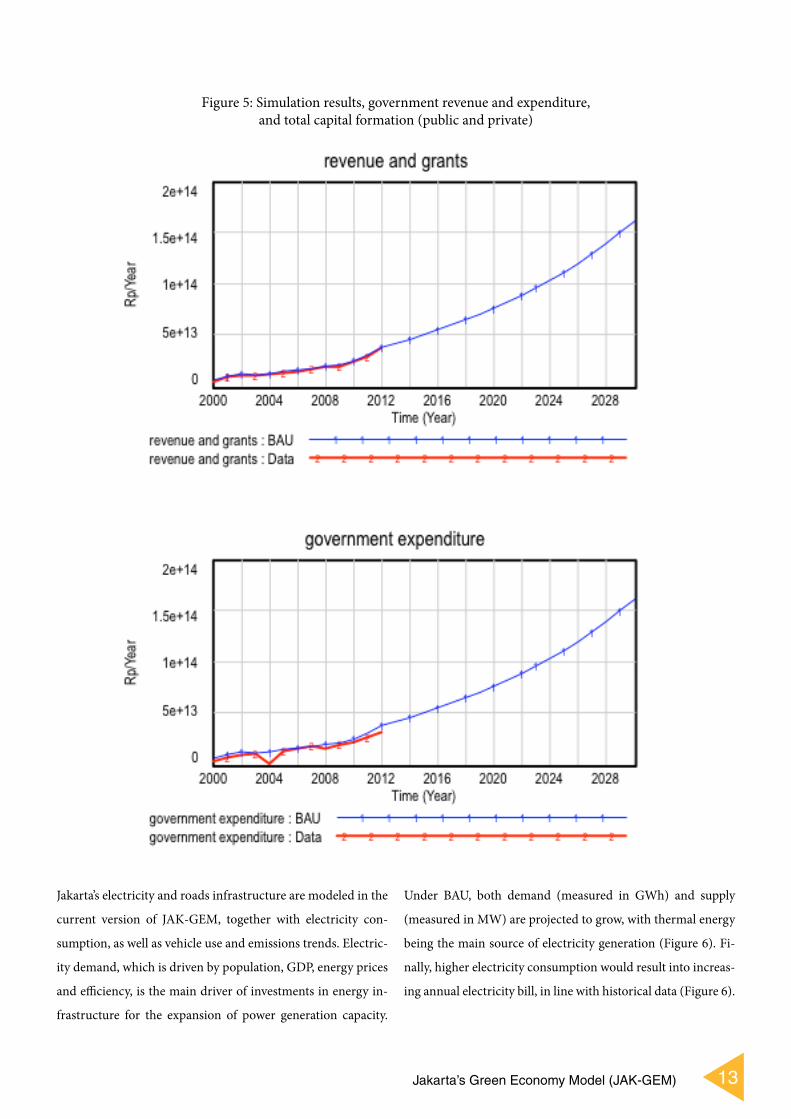
BAU projections for provincial government revenues and ex-
penditures are illustrated in Figure 5 and follow the trend of
GDP.
13Jakarta’s Green Economy Model (JAK-GEM)
Jakarta’s electricity and roads infrastructure are modeled in the
current version of JAK-GEM, together with electricity con-
sumption, as well as vehicle use and emissions trends. Electric-
ity demand, which is driven by population, GDP, energy prices
and efficiency, is the main driver of investments in energy in-
frastructure for the expansion of power generation capacity.
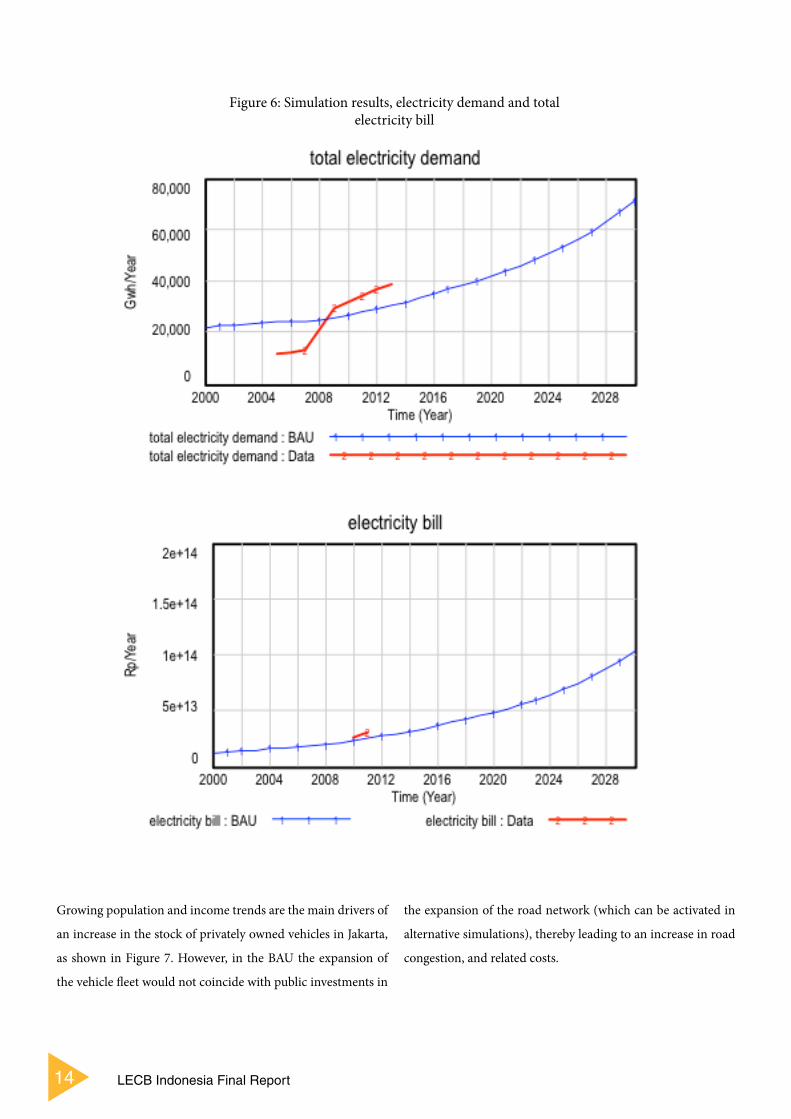
Under BAU, both demand (measured in GWh) and supply
(measured in MW) are projected to grow, with thermal energy
being the main source of electricity generation (Figure 6). Fi-
nally, higher electricity consumption would result into increas-
ing annual electricity bill, in line with historical data (Figure 6).
Figure 5: Simulation results, government revenue and expenditure, and total capital formation (public and private)
14 LECB Indonesia Final Report
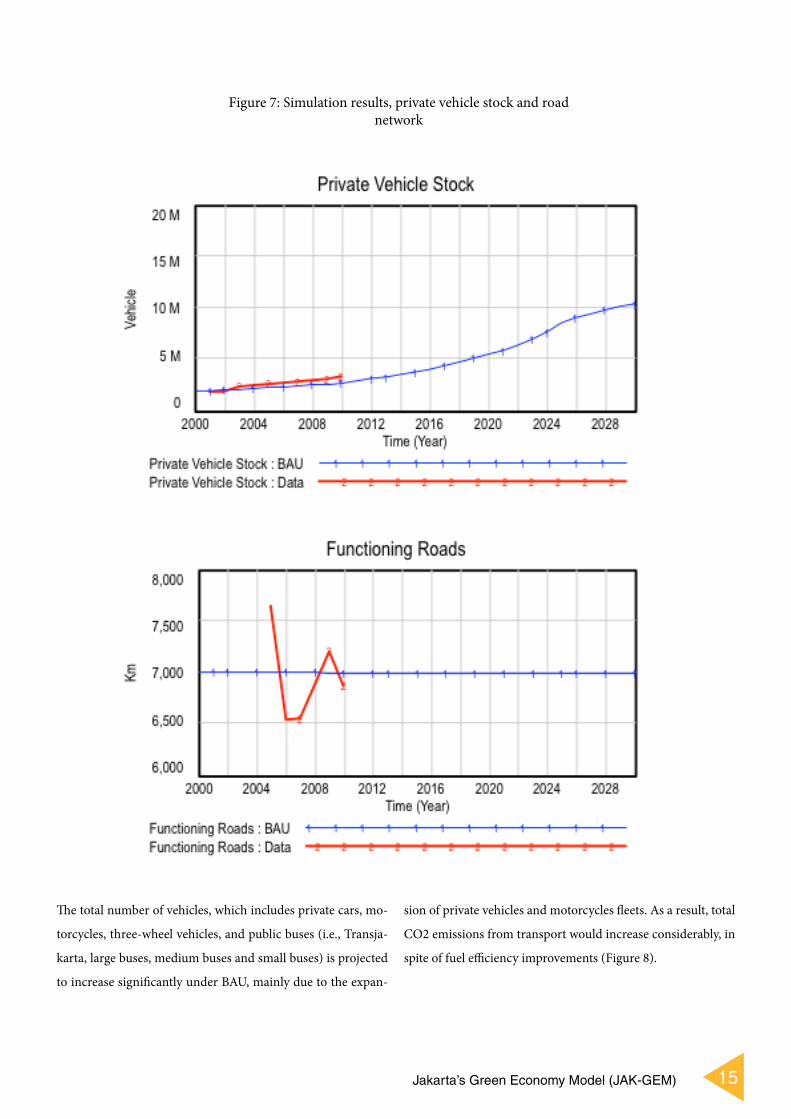
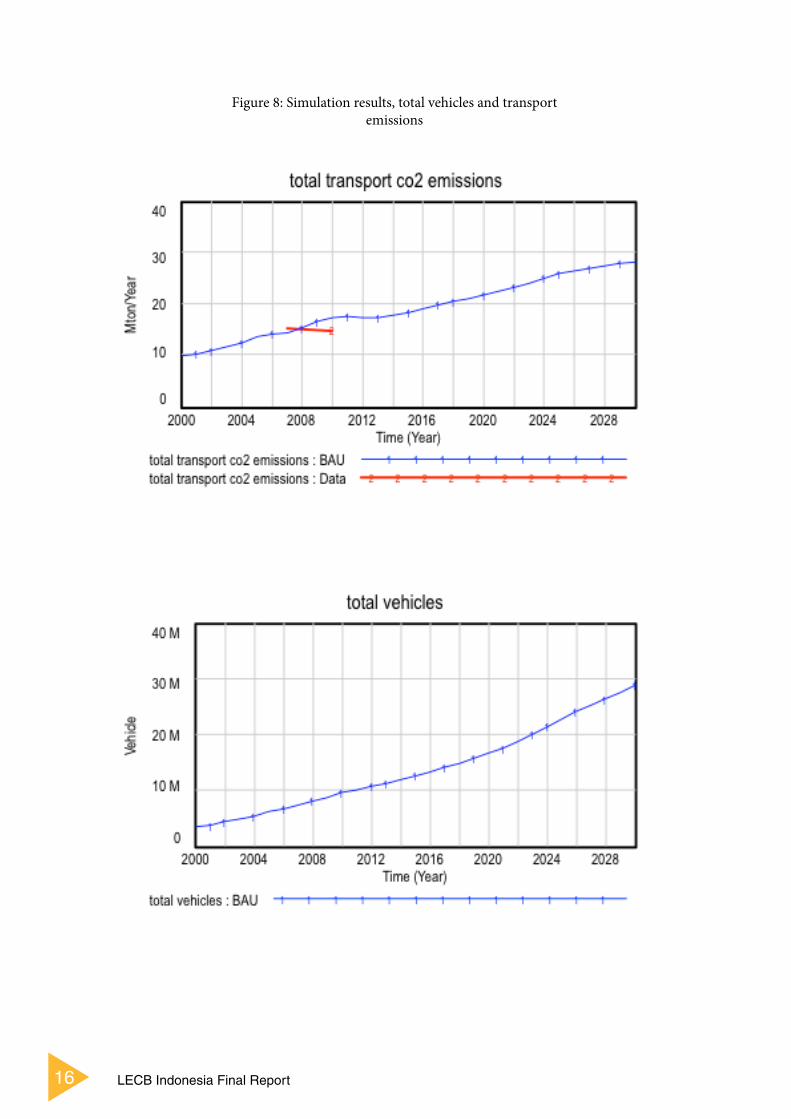
Growing population and income trends are the main drivers of
an increase in the stock of privately owned vehicles in Jakarta,
as shown in Figure 7. However, in the BAU the expansion of
the vehicle fleet would not coincide with public investments in
the expansion of the road network (which can be activated in
alternative simulations), thereby leading to an increase in road
congestion, and related costs.
Figure 6: Simulation results, electricity demand and total electricity bill
15Jakarta’s Green Economy Model (JAK-GEM)
The total number of vehicles, which includes private cars, mo-
torcycles, three-wheel vehicles, and public buses (i.e., Transja-
karta, large buses, medium buses and small buses) is projected
to increase significantly under BAU, mainly due to the expan-
sion of private vehicles and motorcycles fleets. As a result, total
CO2 emissions from transport would increase considerably, in
spite of fuel efficiency improvements (Figure 8).
Figure 7: Simulation results, private vehicle stock and road network
16 LECB Indonesia Final Report
Figure 8: Simulation results, total vehicles and transport emissions
17Jakarta’s Green Economy Model (JAK-GEM)
Policy ImplicationsUnder BAU, Jakarta is expected to exacerbate the environ-
mental issues that it is currently facing. Under conventional
development aspirations GDP shows a growth along with the
transport, industry and agriculture sectors. Government ex-
penditure also increases consistently. Each of these aspects
taken together portray a picture of economic growth and over-
all increasing revenues for Jakarta, which could be seen as de-
velopment and prosperity for the region. However, when the
impacts on emissions and the effects of an increase in private
vehicles are looked at from the perspective of sustainability and
equity then it becomes evident that prosperity will not generate
benefits for all the citizens of Jakarta, but rather for a select few
in the private sector. Therefore, it is important for planners to
see how they can achieve the desired fiscal growth and econom-
ic competitiveness and through policies that do not deplete all
of Jakarta’s natural assets and in doing so, the well-being of its
poor. The GE scenarios simulated in JAK-GEM provide some
policy options that are realistic and practical for the planners
in Jakarta to consider implementing based on the effects on the
environment, poverty and economy of the city.

18 LECB Indonesia Final Report
5. Green Economy ScenariosThe GE scenario simulates interventions in three main sec-
tors that are particularly relevant for Jakarta, namely (1) the
economy, for fossil fuel subsidy removal; (2) green building,
with specific focus on energy efficiency improvements, and (3)
transport, focusing on emission reduction interventions. More
precisely, the following policies are simulated in the three sec-
tors:
Fossil fuels subsidy removal: this scenario implies the
gradual and full removal of fossil fuel subsidies by 2020,
the possibility to reallocate part of the savings (40% in
this specific scenario) to households and to use the re-
mainder for development expenditure (i.e. capital in-
vestments).
Buildings: incentive and disincentive policies are simu-
lated with aim at (1) reducing the number of equipment
purchased; (2) encourage the purchase of new more ef-
ficient equipment; and (3) encourage energy savings in
existing equipment. The goal under this scenario is to
achieve 20% energy efficiency improvement in high rise
buildings and 10% in low rise buildings, in line with the
governor’s regulation on green building (regulation no
38/2012).
Transport: an emission reduction scenario under which
a set of measures are implemented in order to encour-
age emissions reduction from the private vehicle fleet.
Measures include (1) regulations (e.g., fuel economy;
hybrid transport) to increase fuel efficiency in private
cars; (2) train service improvement by building double-
track line, expansion of MRT and Transjakarta; and
(3) mixing 20% bioethanol and 15% biodiesel in fuel
by 2025, as mandated in Energy and Mineral Resource
Ministerial Decree no 32 in 2008. This scenario results
in a 10% increase in fuel efficiency, and expanded use of
public transport.
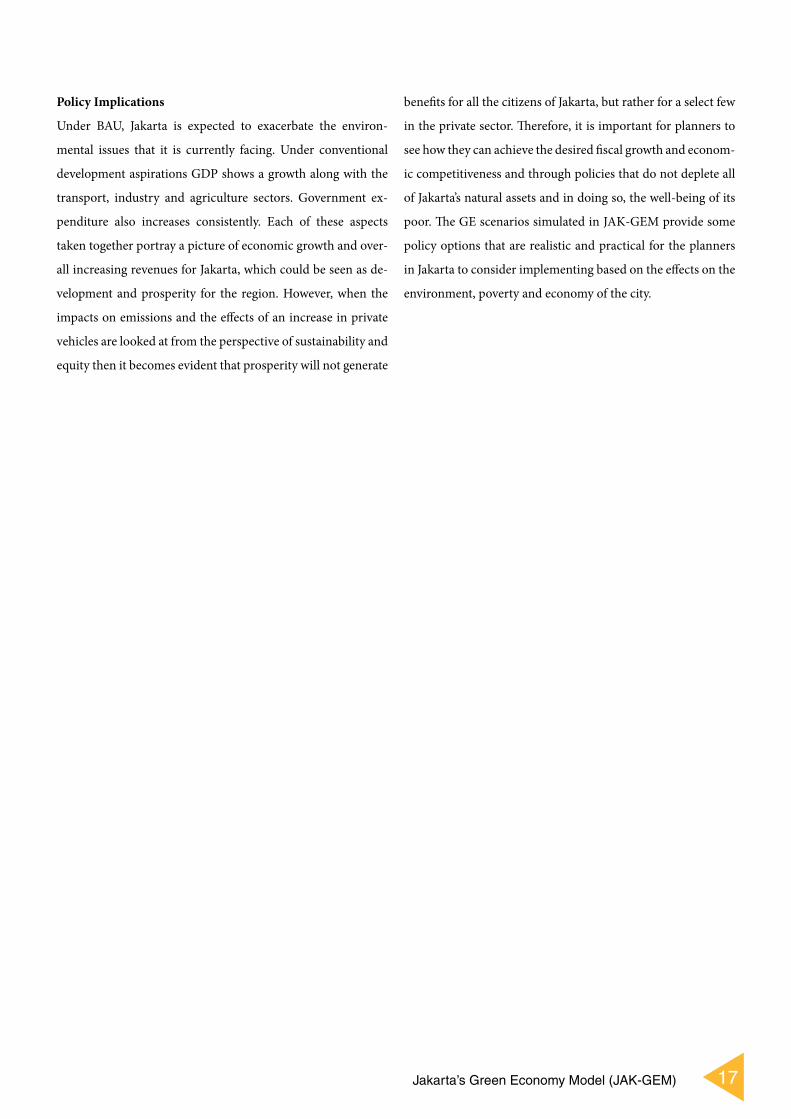
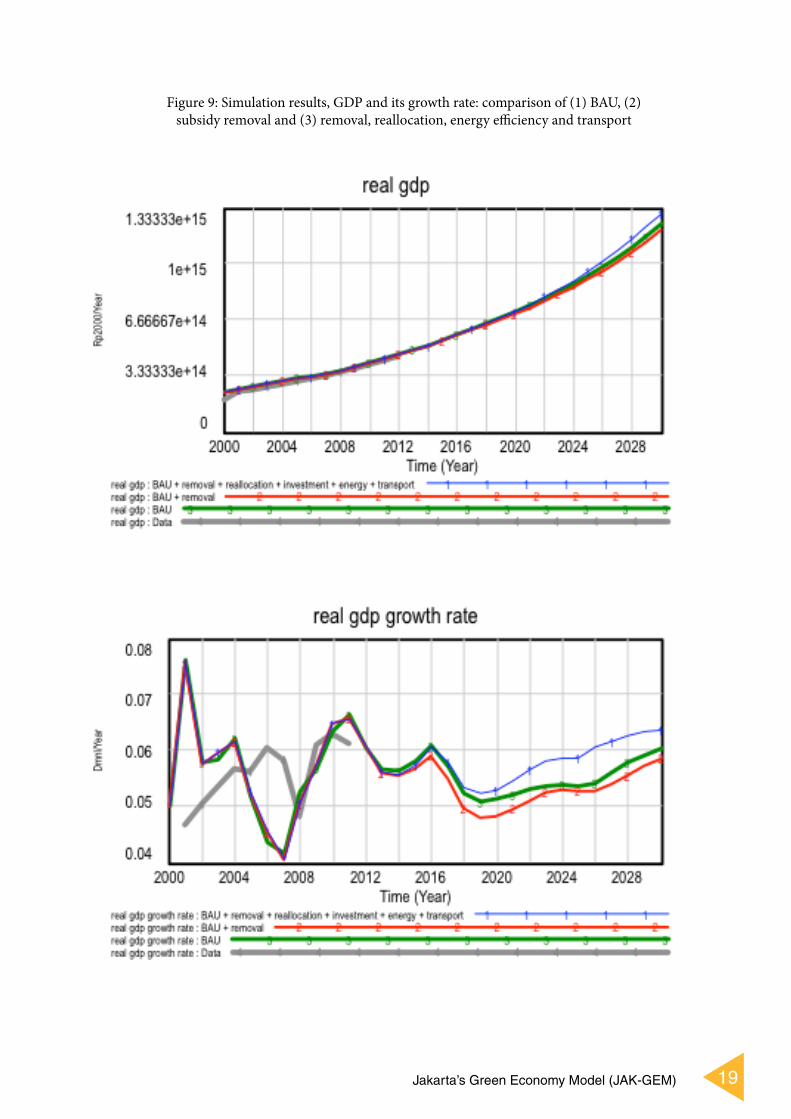
It can be noted that both GDP and Green GDP are expected
to be higher under the GE scenarios, with respect to the BAU
case. In particular, the best performance is obtained when all
the GE policies are simulated, when coupling fossil fuel subsidy
removal with a reallocation to the poor and to capital invest-
ments, in conjunction with transport (i.e., fuel efficiency, bus
lanes expansion, and MRT development) and the buildings
sector (i.e., energy efficiency improvements).
In fact, the removal of fossil fuel subsidies alone (without any
additional intervention) is projected to reduce disposable in-
come, consumption and investment, and hence GDP, while
improving government accounts. The reallocation of subsidy
savings, on the other hand, compensates the negative impacts
of the removal of subsidies, leading to faster economic growth,
especially when the savings are reallocated to investments. Still,
the combination of reallocation to the poor (e.g. 40% of subsidy
savings, as compensation for the removal, and resulting direct
increase in fuel prices), and investments in infrastructure (or
more generally, development expenditure for the remaining
60% of subsidy savings), is sufficient to offset entirely the mac-
roeconomic impacts of subsidy removal.
If, in addition to reallocating subsidy savings, interventions are
implemented to reduce energy consumption and its cost (di-
rectly offsetting the increase in energy prices generated by the
removal of subsidies), GDP would grow even faster (Figure 9).
This is due to an increased productivity in the use of energy,
which, despite being more expensive, has a smaller impact on
productive activities and household consumption.
19Jakarta’s Green Economy Model (JAK-GEM)
Figure 9: Simulation results, GDP and its growth rate: comparison of (1) BAU, (2) subsidy removal and (3) removal, reallocation, energy efficiency and transport
20 LECB Indonesia Final Report
Of the many interventions simulated, the reallocation of sub-
sidy savings to the poor is not expected to contribute to eco-
nomic growth as much as investment (development expendi-
ture). On the other hand, interventions on energy efficiency are
projected to impact all sectors, due to a mitigation of energy
expenditure.
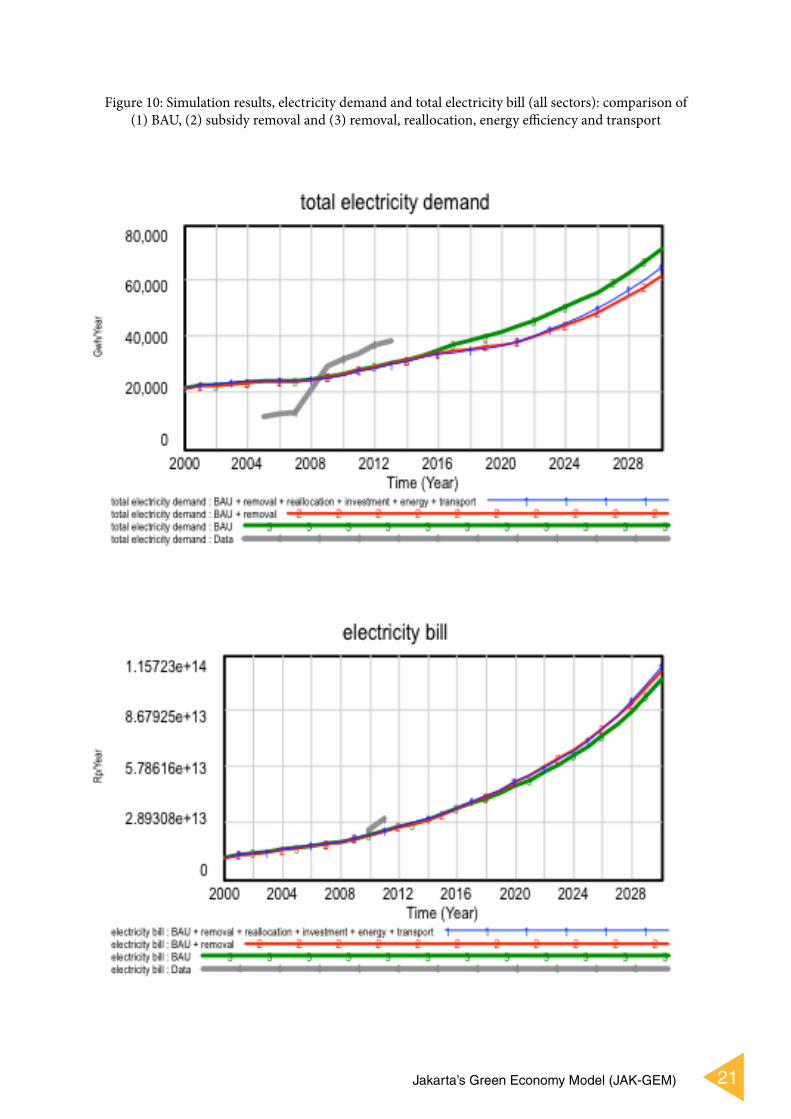
In particular, energy efficiency improvements in buildings,
simulated under the GE scenario, are expected to reduce to-
tal electricity demand in Jakarta, but in a different way than
the removal of subsidies. In fact, while most of the reduction
in electricity demand is projected to be the result of subsidy
removal (which also increases the electricity bill), energy ef-
ficiency makes it so that demand decreases enough to fully
compensate for the increase in energy prices. Figure 10 and
Figure 11 show that the electricity bill is comparable and at
similar levels in both scenarios, indicating that despite the re-
moval of subsidies, electricity use will be more effective and
productive.
21Jakarta’s Green Economy Model (JAK-GEM)
Figure 10: Simulation results, electricity demand and total electricity bill (all sectors): comparison of (1) BAU, (2) subsidy removal and (3) removal, reallocation, energy efficiency and transport
22 LECB Indonesia Final Report
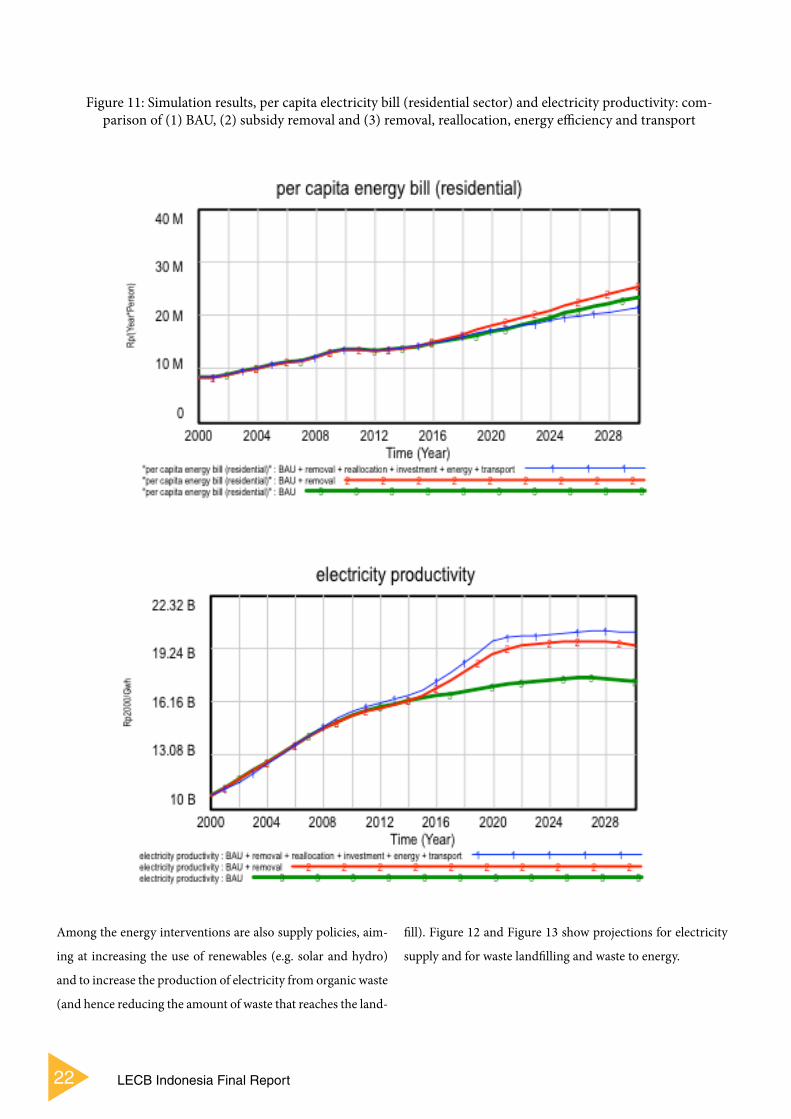
Figure 11: Simulation results, per capita electricity bill (residential sector) and electricity productivity: com-parison of (1) BAU, (2) subsidy removal and (3) removal, reallocation, energy efficiency and transport
Among the energy interventions are also supply policies, aim-
ing at increasing the use of renewables (e.g. solar and hydro)
and to increase the production of electricity from organic waste
(and hence reducing the amount of waste that reaches the land-
fill). Figure 12 and Figure 13 show projections for electricity
supply and for waste landfilling and waste to energy.
23Jakarta’s Green Economy Model (JAK-GEM)
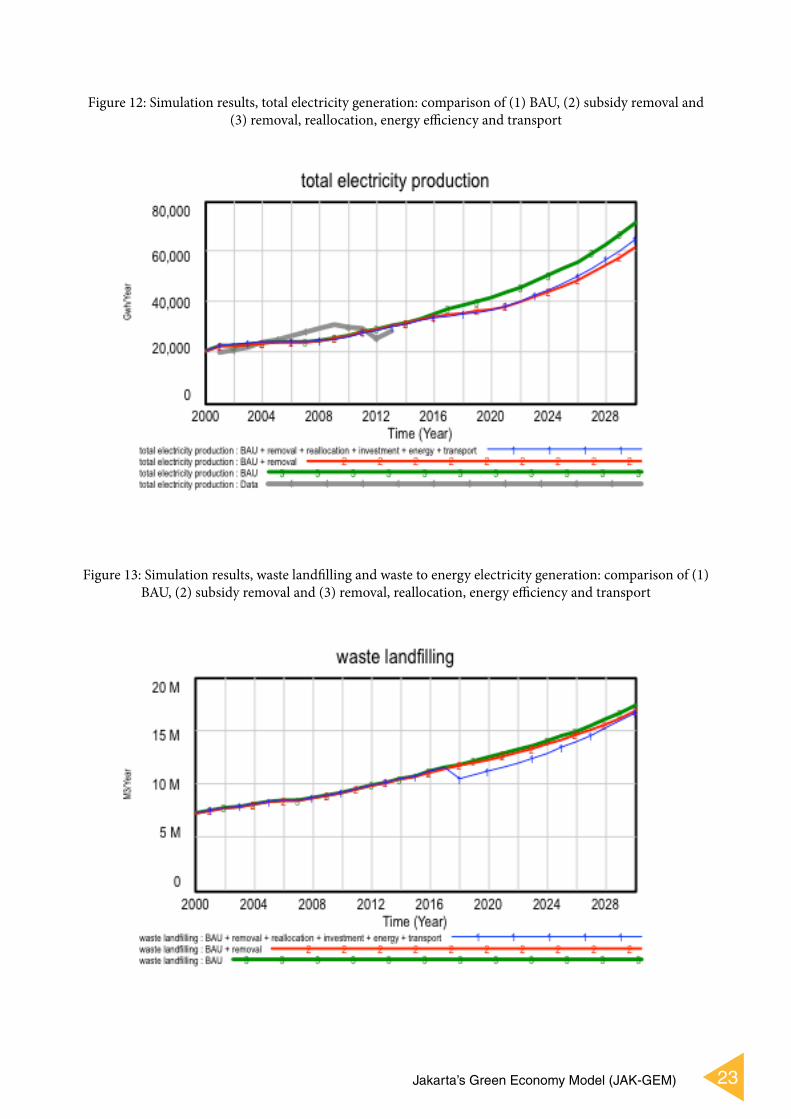
Figure 12: Simulation results, total electricity generation: comparison of (1) BAU, (2) subsidy removal and (3) removal, reallocation, energy efficiency and transport
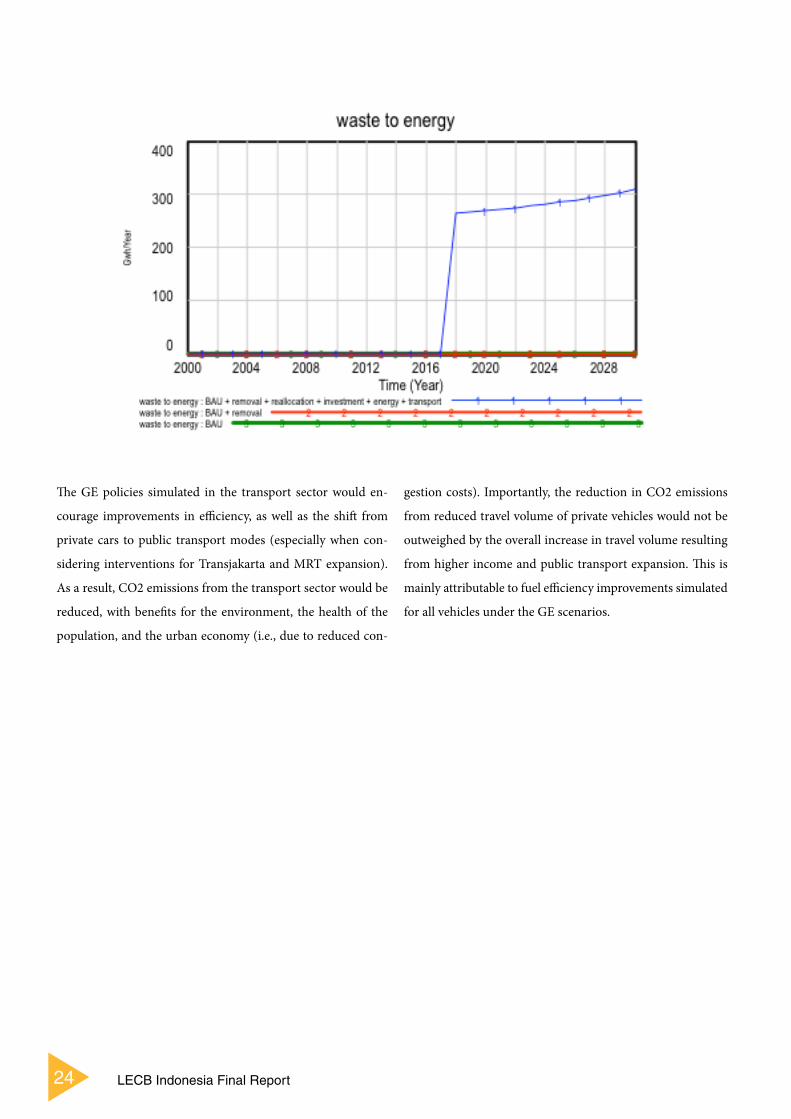
Figure 13: Simulation results, waste landfilling and waste to energy electricity generation: comparison of (1) BAU, (2) subsidy removal and (3) removal, reallocation, energy efficiency and transport
24 LECB Indonesia Final Report
The GE policies simulated in the transport sector would en-
courage improvements in efficiency, as well as the shift from
private cars to public transport modes (especially when con-
sidering interventions for Transjakarta and MRT expansion).
As a result, CO2 emissions from the transport sector would be
reduced, with benefits for the environment, the health of the
population, and the urban economy (i.e., due to reduced con-
gestion costs). Importantly, the reduction in CO2 emissions
from reduced travel volume of private vehicles would not be
outweighed by the overall increase in travel volume resulting
from higher income and public transport expansion. This is
mainly attributable to fuel efficiency improvements simulated
for all vehicles under the GE scenarios.
25Jakarta’s Green Economy Model (JAK-GEM)
Figure 14: Simulation results, private vehicles CO2 emissions, and total transport CO2 emissions: compari-son of (1) BAU, (2) subsidy removal and (3) removal, reallocation, energy efficiency and transport
26 LECB Indonesia Final Report
6. Policy Implications based on Scenario Analysis
In the GE scenario the most realistic and relevant policies were
simulated based on the needs identified by stakeholders in Ja-
karta during the consultations that were conducted. Energy
efficiency and investments in renewables for sufficient energy
production are particularly effective interventions for plan-
ners to consider because they have positive impacts across all
sectors. When it comes to transport, it is important that while
public transport is being expanded through mediums like the
mass rapid transport system in Jakarta, it is important to simul-
taneously ensure that these systems run on renewable fuels as
otherwise the emissions do not decrease in the transport sec-
tor even though the increase in the number of private vehicles
might become less. Therefore, from a preliminary look at the
scope for GE interventions to improve the energy and trans-
port sectors in JAK-GEM it is clear that there is potential for
further initiatives to be implemented and JAK-GEM shows
what these initiatives should be.
From the perspective of the impacts on the poor and the natu-
ral resources of the city, reducing the negative externalities of
the energy and transport sectors will help alleviate air pollu-
tion, water pollution and the spread of diseases amongst the
residents of Jakarta. Moreover, a decrease in the quantity of
emissions could significantly help Indonesia meets its national
emissions reduction targets. Furthermore, the opportunity for
NAMAs in transport and energy has already been identified by
Indonesia and looking at the impacts across equity and envi-
ronment would mean that more effective activities under NA-
MAs could be selected. Thus, it is recommended that impacts
on incomes, prices, natural resources and health are taken into
account when NAMA activities are chosen, which JAK-GEM
can facilitate. This would ensure that budgets are allocated
towards those initiatives with the greatest potential for wide-
spread benefits for the economy, environment and poverty in
Jakarta.
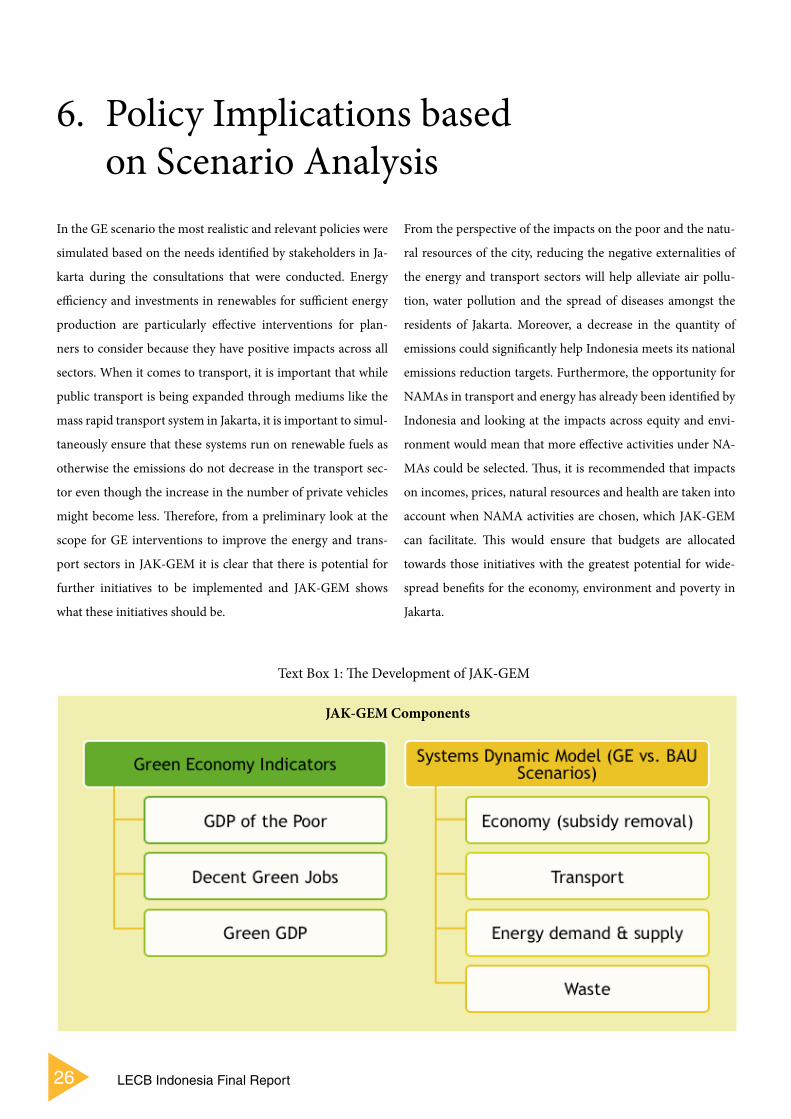
JAK-GEM Components
Text Box 1: The Development of JAK-GEM

27Jakarta’s Green Economy Model (JAK-GEM)
Model CustomizationAfter holding meetings and training sessions with officials
from Jakarta the following modifications were made to
the model, to ensure that it is different from KT-GEM and
completely customized to the local context of Jakarta. JAK-
GEM can accommodate the simulation of 25 policies and
several assumptions.
Sectors that were eliminated include peat land, mining and
forest, as they are not relevant for Jakarta.
The emphasis in JAK-GEM is on: – Fossil fuel subsidy rationalization (5 policies are spe-
cifically on subsidy removal, the real l o -
cation of savings to households and public
budget)
– Energy efficiency (e.g. buildings, street lights and
transport)
The specific sectors added in JAK-GEM are:– Transport (including energy consumption and emis-
sions)
– Energy demand (disaggregated to include efficiency
interventions, such as street lights) and electricity sup-
ply
– Waste generation and landfilling / use
– Natural disasters
– Industrial and non-industrial waste which includes
organic, non-organic and toxic and dangerous waste
Assumptions:
– Correct percentage level of energy saving potential in
the assumptions used is critical
– Assumptions to be used for the MRT include taking
into account:
– Calculation of increase in gross floor space in each sta-
tion’s influence areas.
– Land use under business, public and residential cat-
egories.
– Calculation of increase in passenger using MRT based
on gross floor space increase.
– Passenger increase in business and public area.
– Increase in passengers for Park and Ride facilities.
– Recommendations for the sectors where fuel subsidy
savings could be directed to help reduce emissions
Inception meeting on low emission development and Jakarta Green Economy Model (JAK GEM)
8 October 2014
Energy-saving street Lighting 22 October 2014
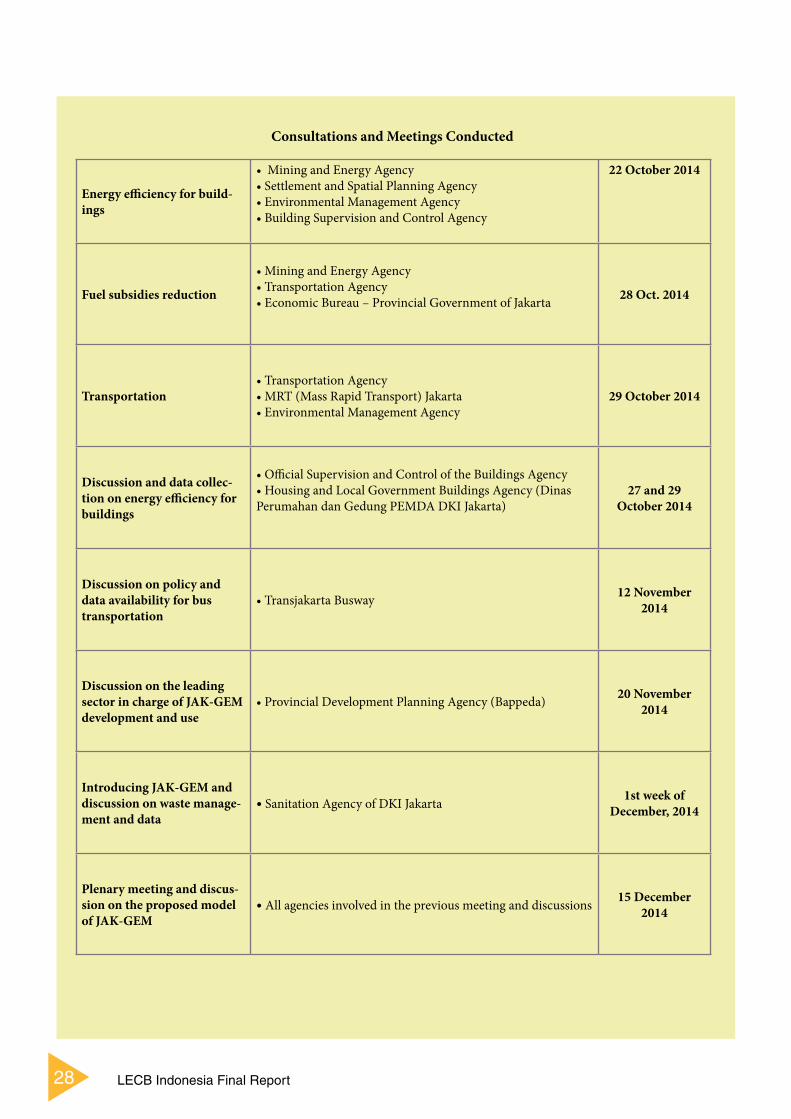
Consultations and Meetings Conducted
28 LECB Indonesia Final Report
Energy efficiency for build-ings
22 October 2014
Fuel subsidies reduction 28 Oct. 2014
Transportation 29 October 2014
Discussion and data collec-tion on energy efficiency for buildings Perumahan dan Gedung PEMDA DKI Jakarta)
27 and 29October 2014
Discussion on policy and data availability for bus transportation
12 November 2014
Discussion on the leading sector in charge of JAK-GEM development and use
20 November 2014
Introducing JAK-GEM and discussion on waste manage-ment and data
• Sanitation Agency of DKI Jakarta 1st week ofDecember, 2014
Plenary meeting and discus-sion on the proposed model of JAK-GEM
• All agencies involved in the previous meeting and discussions 15 December 2014
Consultations and Meetings Conducted
29Jakarta’s Green Economy Model (JAK-GEM)
MoE (2007) Indonesia Country Report: Climate Variability and Climate Change, and their Implication. Ministry of Environ-
ment, Republic of Indonesia, Jakarta.
Floods caused by Rainfall, Temperature, and Sea Level Rise (2007), The Center for Sea and Coastal Development at Bandung’s
Institute of Technology.
Sukhdev P., Bassi A., Varma K. and Mumbunan S., (2014), Indonesia Green Economy Model (I-GEM), Full Project report, Pre-
pared under Low Emission Capacity Building Programme (LECB), United Nations Development Programme (UNDP), Jakarta,
Indonesia.
United Nations Development Programme (UNDP), (2014) LECB Indonesia Policy Note, I-GEM: Measuring Indonesia’s Transi-
tion towards a Green Economy, Indonesia.
RAD GRK, Kalteng (2012), Indonesia. http://www.unorcid.org/upload/doc_lib/20130207132847_RAD%20GRK%20grey.pdf
ICE Case Studies: Climate Change and Social Problems – A case study on Jakarta (n.d.)
References

Implemented by: Supported by: