jackson park revitalization traffic impact study final report · the future traffic volume...
TRANSCRIPT

Submitted to:
February 2018
JACKSON PARK REVITALIZATION TRAFFIC IMPACT STUDY
FINAL REPORT
Prepared by:

Jackson Park Revitalization Traffic Impact Study Final Report – February 2018 ii
EXECUTIVE SUMMARY The City of Chicago and Chicago Park District are considering a large-scale revitalization plan for Jackson Park updating the South Lakefront Framework Plan that would increase green space, improve pedestrian connectivity, and create new and upgraded facilities. Part of that plan is the construction of the future Obama Presidential Center (OPC), which would be located on a site between Stony Island Avenue and Cornell Drive, just south of the Midway Plaisance, and is anticipated to be operational in late 2021. A second planned project would merge the Jackson Park and South Shore golf courses located south of Hayes Drive as part of a plan to redesign and upgrade those public golf facilities.
As part of the updated South Lakefront Framework Plan, the following roadway segments within Jackson Park would be closed and converted into open space:
Cornell Drive between North Midway Plaisance and Hayes Drive South Midway Plaisance between Stony Island Avenue and Cornell Drive Marquette Drive between Stony Island Avenue and Richards Drive Northbound Cornell Drive from 68th Street to where Cornell Drive becomes two-way
(approximately midway between 64th Street and 65th Street)
A traffic impact analysis was performed to identify potential traffic impacts associated with the proposed project. The future traffic volume projections to the 2040 horizon year accounted for the reassignment of traffic due to the proposed roadway closure, background traffic growth, and trips generated by the OPC development. The Chicago Metropolitan Agency for Planning (CMAP) assisted with the development of future traffic volumes based on their in-house travel demand model, which provided projections for the reassignment of Cornell Drive traffic volumes to alternate routes as well as general background growth associated with the expected economic growth of nearby neighborhoods and other known development projects between 2016 and 2040.
Traffic Impact Analysis
The study area is generally bounded by Lake Shore Drive (US 41) to the east, Stony Island Avenue to the west, 57th Drive to the north, and 67th Street to the south and includes 36 intersections where traffic data was collected in October 2016.
Traffic analyses were performed using the Synchro/SimTraffic software package for the weekday AM and PM peak hours, and the capacity analysis results were compared for the following conditions:
2016 Existing Condition (baseline conditions for the current year) 2040 No Build Condition (future conditions without the proposed OPC and roadway
closures) 2040 Build Condition (future conditions with the proposed OPC and roadway closures)

Jackson Park Revitalization Traffic Impact Study Final Report – February 2018 iii
Mitigation
Traffic mitigation in the form of signal timing and phasing changes, parking regulation changes, and capital improvements along key roadways and at key intersections to increase capacity would be implemented along with the roadway closures to accommodate the changes in traffic patterns. The recommended mitigation measures that would successfully offset any potential traffic impacts are summarized in the table on the next page. By providing acceptable levels of service for traffic flow, bus transit demand can also be accommodated through the future horizon year. The 2040 Build Condition includes proposed mitigation measures and is compared to the 2040 No Build Condition to identify potential traffic impacts. The traffic analysis results show that the proposed improvements would successfully mitigate any potential traffic impacts in the 2040 horizon year and there would be no significant traffic impacts as a result of the proposed project.
Parking Analysis
A parking analysis was performed that shows the proposed on-site parking would be sufficient to accommodate the projected peak parking demand for the OPC site. Due to the proposed roadway changes, there would be a net loss in on-street parking supply of 236 spaces within the study area, leaving a total on-street parking supply of 569 spaces, which can still accommodate the surveyed peak demand of 270 parked cars. There is additional parking availability for a fee in the public parking lots within Jackson Park.

Jackson Park Revitalization Traffic Impact Study Final Report – February 2018 iv
Location Proposed Mitigation/Improvements
Lake Shore Dr between 57th Dr and Hayes Dr
‐ Increase from two to three southbound travel lanes
‐ Widen travel way on 59th St Harbor Bridge to provide six lanes
‐ Widen pedestrian underpass structure north of Hayes Dr
Lake Shore Dr & 57th Dr intersection
‐ Geometric modifications within existing curb‐to‐curb width
‐ Lane configuration changes
‐ Modify signal timing
Lake Shore Dr & Science Dr intersection‐ Geometric and lane modifications within existing curb‐to‐curb width
‐ Modify signal timing and phasing
Lake Shore Dr & Hayes Dr intersection
‐ Intersection widening to accommodate continuous flow right‐turn lane from SB Lake Shore Drive
‐ Intersection widening of Hayes approach to provide 3 left‐turn lanes
‐ Add new crosswalk across south leg
‐ Modify signal timing and phasing
‐ Provide a N‐S pedestrian underpass on west leg of Hayes Dr.
Hayes Dr between Richards Dr and Cornell Dr‐ Restripe section with 2 travel lanes in each direction with a physical median.
‐ Prohibit on‐street parking along both curbs lengths
Hayes Dr & Richards Dr intersection
‐ Consolidate 3 separate intersections into a single T‐intersection
‐ Install new traffic signal
‐ Widen Hayes Dr slightly to north at intersection
Hayes Dr & Cornell Dr intersection
‐ Remove north leg of intersection
‐ Modify intersection geometry to facilitate WB‐SB leg alignment
‐ Remove at‐grade crosswalks and replace with two pedestrian underpasses across west and
south legs
‐ Modify signal timing and phasing
Stony Island Ave between 59th St & 60th St
‐ Widen Stony Island Ave to east to provide new NB right‐turn lane
‐ Restripe Stony Island Ave between North Midway Plaisance and South Midway Plaisance to
accommodate 5 travel lanes
‐ Remove traffic signals at 59th and 60th Streets and geometrically restrict intersection to Right‐
In / Right‐Out operation
‐ Remove east leg of South Midway Plaisance/Stony Island Avenue intersection
‐ Modify traffic signals equipment at Stony Island Ave / South Midway Plaisance and Stony Island
Ave / North Midway Plaisance intersections
‐ Modify traffic signal timing and phasing
Stony Island Ave between 60th St & 65th St
‐ Widen Stony Island Ave to east to allow for upgraded cross section
‐ New cross section will provide 2 travel lanes and a parking lane in each direction with a
landscaped median/left‐turn lane
‐ Provide pedestrian bump outs and refuge islands at intersections.
‐ Add a NB LTL on Stony Island Avenue with 65th Place
Stony Island Ave & 63rd St/Hayes Dr intersection
‐ Modify signal timing
‐ Provide NB/SB left‐turn arrows
‐ Extend SB left‐turn lane
Stony Island Ave & 64th St intersection ‐ Install traffic signal
Stony Island Ave & Southbound Cornell Drive
‐ Convert WB Cornell Dr approach to two‐way and widen approach for two lanes in each direction
‐ Provide two NB Right‐Turn lanes
‐ Modify signal timing
Stony Island Ave & Marquette Dr intersection‐ Remove east leg of intersection
‐ Modify Signal Timing
67th St & Stony Island Ave intersection
‐ Remove segment of NB Cornell Dr and Intersection with 67th St
‐ Widen NB Stony Island with an additional travel lane.
‐ Modify signal timing
‐ Restripe EB/WB approaches to provide exclusive LTLs, Extend NB and SB LTLs
‐ Add WB RTL on 67th Street
57th Dr & Hyde Park Blvd/Museum Dr intersection ‐ Modify signal timing
North Midway Plaisance & 57th Dr/MSI Garage Driveway
intersection‐ Modify signal timing
67th St & Jeffery Ave intersection‐ Modify signal timing
‐ Provide a pedestrian underpass along Jeffery Avenue between 67th and Marquette Dr
Lake Shore Dr/Jeffery Ave & Marquette Dr intersection ‐ Modify signal timing
67th St & South Shore Drive‐ Provide a pedestrian underpass on the north leg of intersection
‐ Modify signal timing

Jackson Park Revitalization Traffic Impact Study Final Report – February 2018 v
TABLE OF CONTENTS
EXECUTIVE SUMMARY .............................................................................................................. ii
1.0 INTRODUCTION ............................................................................................................ 1-1
1.1 South Lakefront Framework Plan (1999) ....................................................................... 1-1
1.2 Obama Presidential Center Site ..................................................................................... 1-3
1.3 Study Area and Study Locations .................................................................................... 1-5
2.0 EXISTING TRANSPORTATION SYSTEM .................................................................... 2-1
2.1 Roadway System Characteristics .................................................................................. 2-1
2.2 Public Transit ................................................................................................................. 2-4
2.3 Pedestrian/Bicycle Facilities ........................................................................................... 2-6
3.0 TRAFFIC VOLUMES ..................................................................................................... 3-1
3.1 Existing Traffic Volumes ................................................................................................. 3-1
3.2 Future Traffic Volumes ................................................................................................... 3-4
4.0 TRAFFIC IMPACT ANALYSIS ...................................................................................... 4-1
4.1 Capacity Analysis Methodology ..................................................................................... 4-1
4.2 Existing Conditions ......................................................................................................... 4-2
4.3 2040 No Build Conditions ............................................................................................... 4-7
4.4 Recommended Mitigation ............................................................................................ 4-12
4.5 2040 Build Conditions (with Mitigation) ........................................................................ 4-35
5.0 PARKING ANALYSIS ................................................................................................... 5-1
5.1 Existing Parking Conditions ........................................................................................... 5-1
5.2 On-Site Parking Analysis ............................................................................................... 5-2
5.3 Off-Site Parking Analysis ............................................................................................... 5-4
6.0 OPC SITE AND CURBSIDE CHARACTERISTICS....................................................... 6-1
6.1 Service Access and Loading Docks ............................................................................... 6-1
6.2 Garage Access ............................................................................................................... 6-1
6.3 Pedestrian Access ......................................................................................................... 6-1
6.4 Bike Facilities ................................................................................................................. 6-2
6.5 Curbside Operations ...................................................................................................... 6-2
7.0 CONCLUSION ............................................................................................................... 7-1

Jackson Park Revitalization Traffic Impact Study Final Report – February 2018 vi
LIST OF FIGURES Figure 1-1: Location of Proposed Developments and Roadway Closures ................................ 1-2 Figure 1-2: Obama Presidential Center (OPC) Preliminary Site Plan ........................................ 1-4 Figure 1-3: Study Intersection Locations ................................................................................... 1-6
Figure 2-1: Existing Street Characteristics ................................................................................. 2-3 Figure 2-2: Existing Transit Network .......................................................................................... 2-5 Figure 2-3: Existing and Planned Bicycle Route/Trail Network .................................................. 2-7 Figure 3-1:Average Daily Traffic Volumes ................................................................................. 3-2 Figure 3-2: Cornell Drive Hourly Traffic Volumes ...................................................................... 3-3 Figure 3-3: Existing Volumes AM ............................................................................................... 3-5 Figure 3-4: Existing Volumes PM ............................................................................................... 3-6 Figure 3-5: Existing Pedestrian and Bicycle Volumes ............................................................... 3-7 Figure 3-6: OPC Site Generated Traffic AM ............................................................................ 3-12 Figure 3-7: OPC Site Generated Traffic PM ............................................................................ 3-13 Figure 3-8:2040 No-Build Traffic Volumes AM ........................................................................ 3-15 Figure 3-9:2040 No-Build Traffic Volumes PM ........................................................................ 3-16 Figure 3-10: 2040 Build Traffic Volumes AM ........................................................................... 3-17 Figure 3-11:2040 Build Traffic Volumes PM ............................................................................ 3-18 Figure 4-1: Proposed Mitigation Measures .............................................................................. 4-13 Figure 4-2: Lake Shore Drive at 57th Drive, Third SB Lane ...................................................... 4-15 Figure 4-3: Lake Shore Drive at Science Drive, Third SB Lane ............................................... 4-17 Figure 4-4: Lake Shore Drive at 59th Street Harbor Bridge, Third SB Lane ............................. 4-18 Figure 4-5: Lake Shore Drive at Hayes Drive, Third SB Lane ................................................. 4-20 Figure 4-6: Hayes Drive and Richards Drive Mitigation ........................................................... 4-22 Figure 4-7: Hayes Drive and Cornell Drive Mitigation .............................................................. 4-25 Figure 4-8: Stony Island Avenue at Midway Plaisance / 59th Street / 60th Street Mitigation..... 4-27 Figure 4-9: Stony Island Avenue between 68th Street and 65th Place/SB Cornell Mitigation ... 4-31 Figure 4-10: Cornell Drive Road Diet Concept ........................................................................ 4-33 Figure 5-1: Existing Public Parking Locations ............................................................................ 5-1 Figure 5-2: Parking Demand Calculator ..................................................................................... 5-3 Figure 5-3: OPC Hourly Parking Demand .................................................................................. 5-3 Figure 6-1: OPC Curbside Loading and Access Plan ................................................................ 6-3

Jackson Park Revitalization Traffic Impact Study Final Report – February 2018 vii
LIST OF TABLES Table 2-1: Study Area CTA Bus Routes .................................................................................... 2-4
Table 3-1: Cornell Drive Peak Hour Volumes from Intersection Counts .................................... 3-4 Table 3-2: Cornell Drive Traffic Reassignment .......................................................................... 3-9 Table 3-3: Reassignment of Traffic to Alternate North/South Routes (Source: CMAP) ............. 3-9 Table 3-4: Average Growth Rates by Corridor (2016-2040) .................................................... 3-10 Table 3-5: Vehicle Trip Generation for 30th Design Day .......................................................... 3-11
Table 4-1: LOS Criteria for Signalized Intersections .................................................................. 4-1 Table 4-2: LOS Criteria for Unsignalized Intersections .............................................................. 4-2 Table 4-3:Existing Condition Signalized LOS ............................................................................ 4-3 Table 4-4: Existing Condition Unsignalized LOS ....................................................................... 4-6 Table 4-5: 2040 No-Build Condition Signalized LOS ................................................................. 4-8 Table 4-6: 2040 No-Build Condition Unsignalized LOS ........................................................... 4-11 Table 4-7: Hayes Drive and Richard Drive Warrant Analysis .................................................. 4-23 Table 4-8: Stony Island Avenue and 64th Street Warrant Analysis .......................................... 4-29 Table 4-9: 2040 Build Condition Signalized LOS ..................................................................... 4-37 Table 4-10: 2040 Build Condition Unsignalized LOS ............................................................... 4-41
Table 5-1: On-Street Parking Supply ......................................................................................... 5-5 Table 5-2: Parking Utilization .................................................................................................... 5-6
LIST OF APPENDICES (to be provided electronically)
APPENDIX A: Raw Traffic Data
APPENDIX B: CMAP Memorandum
APPENDIX C: OPC Trip Generation and Parking Demand Details
APPENDIX D: Detailed Traffic Volume Increments
APPENDIX E: Traffic Signal Timings and Pavement Striping Plans (from CDOT)
APPENDIX F: Synchro/SimTraffic Files
APPENDIX G: Travel Time Comparisons

Jackson Park Revitalization Traffic Impact Study Final Report – February 2018 1‐1
1.0 INTRODUCTION The City of Chicago and Chicago Park District are considering a large-scale revitalization plan for Jackson Park that would increase green space, improve pedestrian connectivity, and create new and upgraded facilities. Part of that plan is the construction of the future Obama Presidential Center (OPC), which would be located on a site between Stony Island Avenue and Cornell Drive, just south of the Midway Plaisance, and is anticipated to be operational in late 2021. A second potential large-scale project would merge the Jackson Park and South Shore golf courses located south of Hayes Drive as part of a plan to redesign and upgrade those public golf facilities.
The approximate locations of the OPC and golf course projects as well as the proposed roadway closures are shown on Figure 1-1. As shown in the figure, Cornell Drive would be closed and vacated between North Midway Plaisance and Hayes Drive, and South Midway Plaisance would be closed and vacated between Stony Island Avenue and Cornell Drive (Segment A on the figure). In addition, Marquette Drive between Stony Island Avenue and Richards Drive and Cornell Drive Northbound between 68th Street and approximately midway between 64th Street and 65th Street would be closed and vacated (Segments B and C on the figure, respectively). Traffic mitigation in the form of signal timing and phasing changes, parking regulation changes, and capital improvements along key roadways and at key intersections would be implemented along with the roadway closures to accommodate the changes in traffic patterns. By providing acceptable levels of service for traffic flow, bus transit demand can also be accommodated through the future horizon year.
The purpose of this report is to perform a traffic impact analysis of the proposed roadway closure plan, identify potential traffic impacts, and recommend mitigation measures and other improvements to offset impacts.
1.1 South Lakefront Framework Plan (1999)
The South Lakefront Framework Plan was completed in 1999 and outlined a number of transportation related improvements for future consideration. Relevant transportation-related improvements or recommendations from the plan include the following:
Consider enhancing Cornell Drive south of 60th Street as a park road by reducing pavement widths based on future traffic studies and community input.
Consider eliminating Northbound Cornell Drive between 65th and 67th Streets and reconfiguring lanes on Stony Island between 65th and 67th Streets with a different connection to Hayes.
Consider creating improvements to the roundabout at the Golden Lady.
Create well-marked and signaled pedestrian crossings at key selected intersections, especially along Stony Island at 59th, 63rd, and 67th Streets.
Consider removing Marquette Drive between Richards Drive and Stony Island Avenue and replacing with a pedestrian/bicycle path.

Jackson Park Revitalization Traffic Impact Study Final Report – February 2018 1-2
Figure 1-1: Location of Proposed Developments and Roadway Closures

Jackson Park Revitalization Traffic Impact Study Final Report – February 2018 1-3
1.2 Obama Presidential Center Site
As shown in Figure 1-2, the proposed OPC would be located within Jackson Park along the east side of Stony Island Avenue between the Midway Plaisance to the north and 62ndStreet to the south.
The OPC development would also include the construction of a maximum 450-space underground parking garage to be located on site with access to the garage provided opposite 61st Street. The access drive will provide one inbound lane and two outbound lanes, with outbound movements under stop-sign control. On-street parking would be prohibited along the east curb of Stony Island Avenue between 60th Street to just south of 62nd Street to provide curbside space for visitor and bus pick-up and drop-off activity.
Delivery/loading access to and from the OPC center would be provided via an underground loading dock within the OPC site, east of Stony Island Avenue. The loading access drive would provide one inbound lane and one outbound lane with outbound movements under stop-sign control.

Jackson Park Revitalization Traffic Impact Study Final Report – February 2018 1‐4
Figure 1-2: Obama Presidential Center Preliminary Site Plan

Jackson Park Revitalization Traffic Impact Study Final Report – February 2018 1‐5
1.3 Study Area and Study Locations
The study area is generally bounded by Lake Shore Drive (US 41) to the east, Stony Island Avenue to the west, 57th Drive to the north, and 67th Street to the south. This area includes all of the key intersections within and near Jackson Park, as well as the surrounding intersections that would experience changes in traffic volumes as part of the proposed closure of a segment of Cornell Drive.
As shown on Figure 1-3, the study locations selected for detailed traffic analyses are as follows:
1. 68th Street with Stony Island Avenue and Northbound (NB) Cornell Drive 2. 57th Drive with Hyde Park Boulevard and Museum Drive 3. 57th Drive with Everett Avenue and Museum Drive 4. 57th Drive with Lake Shore Drive 5. 57th Street with Stony Island Avenue 6. 57th Street with Cornell Drive and Museum of Science and Industry (MSI) Parking Garage 7. Science Drive with Lake Shore Drive 8. 59th Street with Stony Island Avenue 9. North Midway Plaisance with Stony Island Avenue 10. North Midway Plaisance with Cornell Drive 11. South Midway Plaisance with Stony Island Avenue 12. 60th Street with Stony Island Avenue 13. South Midway Plaisance with Cornell Drive 14. 63rd Street and Hayes Drive with Stony Island Avenue 15. Hayes Drive with Cornell Drive 16. Hayes Drive with Richards Drive (East Intersection) 17. Hayes Drive with Richards Drive (West Intersection) 18. Hayes Drive with Richards Drive (South Intersection) 19. Hayes Drive with Lake Shore Drive 20. 64th Street with Stony Island Avenue 21. 65th Street with Stony Island Avenue 22. Southbound (SB) Cornell Drive and 65th Place with Stony Island Avenue 23. Marquette Drive with Stony Island Avenue 24. Marquette Drive with Northbound Cornell Drive 25. Marquette Drive with Richards Drive (East Intersection) 26. Marquette Drive with Richards Drive (West Intersection) 27. Marquette Drive with Richards Drive (North Intersection) 28. Marquette Drive with Lakeshore Drive and Jeffery Avenue 29. 67th Street with Stony Island Avenue 30. 67th Street with Northbound Cornell Drive 31. 67th Street with Cornell Avenue 32. 67th Street with East End Avenue 33. 67th Street with Cregier Avenue 34. 67th Street with Bennett Avenue 35. 67th Street with Jeffery Avenue 36. 67th Street with South Shore Drive

Jackson Park Revitalization Traffic Impact Study Final Report – February 2018 1-6
Figure 1-3: Study Intersection Locations

Jackson Park Revitalization Traffic Impact Study Final Report – February 2018 2‐1
2.0 EXISTING TRANSPORTATION SYSTEM This section describes the existing transportation system, including the roadway network, transit connections, and bicycle and pedestrian facilities.
2.1 Roadway System Characteristics
The physical and operational characteristics of the major roadways in the study area are shown in Figure 2-1 and described as follows:
Cornell Drive is a six-lane, median-divided principal arterial roadway. At its signalized intersection with North Midway Plaisance, Cornell Drive provides two through lanes in the northbound direction and three through lanes in the southbound direction. Cornell Drive becomes 57th Drive north of 57th Street, approximately 1/3-mile west of Lake Shore Drive. At its signalized intersection with Lake Shore Drive, 57th Drive provides three left-turn lanes and a right-turn lane in the eastbound (EB) direction. Cornell Drive/57th Drive is under the jurisdiction of the Illinois Department of Transportation (IDOT) and is designated as a strategic regional arterial (SRA). The SRA designation controls roadway access and signal installation to facilitate efficient and safe transportation.
Lake Shore Drive (US 41) is a six-lane, divided principal arterial roadway, designated as a SRA to the north of 57th Drive. South of 57th Drive, Lake Shore Drive provides three through lanes in the northbound direction and two through lanes in the southbound direction and is classified as a minor arterial. On-street parking is prohibited along Lake Shore Drive within the study area. At its signalized intersection with 57th Drive, Lake Shore Drive provides a left-turn lane and three through lanes in the northbound direction and two through lanes and a right-turn lane in the southbound direction. Left-turn movements are prohibited from northbound Lake Shore Drive onto westbound (WB) 57th Street from 3 to 7 PM, Monday through Friday. Lake Shore Drive is under the jurisdiction of IDOT.
Stony Island Avenue is a two-lane, minor arterial roadway, with on-street, unregulated parking provided on both sides of the street south of 60th Street and north of 59th Street. At its signalized intersection with 63rd Street, Stony Island Avenue provides one left-turn, one through, and one shared through/right-turn lane in both directions. At its signalized intersection with Cornell Avenue/65th Place, Stony Island Avenue provides three through lanes and a shared through/right-turn lane in the southbound direction and a shared through/left-turn lane and a through lane in the northbound direction. Stony Island Avenue is under the jurisdiction of CDOT north of 67thStreet and under IDOT jurisdiction to the south. It is designated as an SRA.
Midway Plaisance is a linear park with one-way couplets (North Midway Plaisance is one-way westbound and South Midway Plaisance is one-way eastbound) running along the perimeter of the park and serves as a green connection between Lake Michigan and Jackson Park to the east and Washington Park to the west. Midway Plaisance is a principal arterial roadway, providing two travel lanes in each direction and on-street parking on both sides of the street.

Jackson Park Revitalization Traffic Impact Study Final Report – February 2018 2-2
63rd Street is an east-west, two-lane, minor arterial roadway, with on-street parking provided on both sides of the road near the study area. As 63rd Street enters Jackson Park (east of Stony Island Avenue), it becomes Hayes Drive, which generally carries one travel lane in each direction with on-street parking and terminates to the east at the intersection with Lake Shore Drive where it provides vehicular access to 63rd Street Beach Park. East of Richards Drive, on-street parking is prohibited, and Hayes Drive operates with two travel lanes in each direction.
The 63rd Street eastbound and Hayes Drive westbound approaches at its signalized intersection with Stony Island Avenue each provide one left-turn, one through, and one right-turn lane.
67th Street is an east-west two-lane major collector roadway adjacent to the south edge of Jackson Park and the north edge of the Jackson Park Highlands neighborhood. Within the study area, on-street parking is provided on both sides of the street. The majority of the intersections along this segment are unsignalized, with all-way STOP control provided where northbound streets intersect 67th Street. 67th Street is under traffic-signal control at its intersections with Stony Island Avenue and Cornell Drive, Jeffery Avenue, and South Shore Drive, which are spaced approximately every half-mile.

SITE
Stony Island Ave
56th St
EverettA
ve
Hyde
Park Blvd
57th St
59th St
N Plaisance
60th St
S Plaisance
63rd St
Hayes Dr
Stony Island Ave
67th St
South Shore Dr
Lake Shore Dr
Jeffery Ave
Cornell Dr
Richards Dr
Marquette Dr
Cornell Dr
68th St
64th St
65th St
East End Ave
Cregier Ave
Bennett Ave
Lake Shore Dr
Lake Shore Dr
Science Dr
Cornell Ave
Museum DrMSIParking
Figure 2-1
Existing Roadway Characteristics
= Existing Traffic Signal
= Existing Travel Lane= Existing Stop Sign
NNot to Scale
one way
= Continental Style Crosswalk= Standard Crosswalk= Sheltered Bus Stop= Bus Stop
one way
one way
one way
one way
one way
one way
one way

Jackson Park Revitalization Traffic Impact Study Final Report – February 2018 2-4
2.2 Public Transit
The project area is served by both the Chicago Transit Authority (CTA) Green Line and the Metra-Electric commuter rail line. The nearest Green Line Station at 63rd/Cottage Grove is approximately one mile west of the proposed site, while the nearest Metra-Electric station is the 59th/60th Street Station approximately 500 feet west of the proposed OPC site.
In addition to the rail service, numerous CTA bus routes run through the study area. These bus routes include both local service routes, as well as express routes to and from the downtown Loop. Service is summarized below in Table 2-1 and illustrated in Figure 2-2.
Table 2-1: Study Area CTA Bus Routes
Route # Route Name From To Service TimesDistance to
Nearest StopMetra/CTA Rail Connections
Average Weekday
Ridership
2Hyde Park
Express
60th/Cottage
GroveNavy Pier
Peak Periods
Monday thru Friday Adjacent None 3,222
N5South Shore
Night Bus
95th Red Line
Station
69th Red Line
Station
Overnight (Midnight
to 4:00 AM)3/4 Mile CTA Red Line 439
6Jackson Park
Express
79th/ South
Shore
Wacker/
Columbus
Daily (Weekends
and Holidays)Adjacent None 9,430
10 MSI MSI CampusMichigan/
Chestnut
Daily (Weekends
and Holidays)1/4 Mile None 691
J14 Jeffery Jump103rd/ Stony
Island
Washington/
Jefferson
Daily (Weekends
and Holidays)1 Mile Ogilvie Metra Station (1) 10,963
15 Jeffery Local103rd/ Stony
Island
47th Street Red
Line Station
Daily (Weekends
and Holidays)Adjacent CTA Red and Green Lines 7,168
26South Shore
Express
103rd/ Stony
Island
Chicago/
Fairbanks Monday thru Friday 1 Mile None 3,609
28 Stony Island103rd/ Stony
Island
47th/ Lake Park
Ave
Daily (Weekends
and Holidays)Adjacent None 6,414
55 GarfieldMidway Orange
Line StationMSI Campus
Daily (Weekends
and Holidays)1/4 Mile CTA Red, Green, and Orange Lines 10,565
59 59th/61stMidway Orange
Line Station
60th/ Stony
Island
Weekdays and
SaturdayAdjacent
CTA Orange Line and 59th Street Metra‐
Electric Station3,380
63 63rd StreetMidway Orange
Line Station
63rd/ Stony
Island
Daily (Including
Night Owl 24‐Hr)1/8 Mile CTA Red, Green, and Orange Lines 16,053
67 67th/69th/71st Ford City Mall67th/ South
Shore Drive
Daily (Including
Night Owl 24‐Hr)1 Mile CTA Red Line 11,397
171U.O.C/Hyde
Park
54th/ South
Shore60th/ University
Daily (Weekends
and Holidays)1/4 Mile None 1,172
192U.O.C Hospital
Express
Clinton/
Madison
Cottage Grove/
57th
Peak Periods
Monday thru Friday Adjacent
Oglivie Station (1), Union Station (2), and
CTA Red, Green, and Orange Lines842
(1) Ogilvie Station provides connections to the Union Pacific (UP) ‐ North, UP ‐ Northwest, and UP ‐ West Metra Lines
(2) Union Station provides connec ons to the Burlington Northern‐ Santa Fe (BNSF), Milwaukee District (MD) ‐ North, MD ‐ West, SouthWest Service, North Central Service, and Heritage
Cooridor Metra Lines as well as 18 Amtrak Service Lines

Jackson Park Revitalization Traffic Impact Study Final Report – February 2018 2‐5
Figure 2-2: Existing Transit Network

Jackson Park Revitalization Traffic Impact Study Final Report – February 2018 2‐6
2.3 Pedestrian/Bicycle Facilities
Sidewalks are provided along all study roadways on both sides of the street, except for the roadways traversing Jackson Park where multi-purpose off-street paths are provided. Generally, high-visibility crosswalks are provided at all study area intersections with the exception of pedestrian crossings at minor, unsignalized intersections along 67th Street, which have edge lines but no ladder striping. Additionally, pedestrian countdown signals are provided at most signalized intersections within the study area. As part of any future roadway improvements at these intersections, it is recommended that any affected signals be upgraded to include countdown signals. The primary pedestrian/bicycle facility within the study area is the 18-mile Lakefront Trail, which is an off-street pedestrian and bicycle path that runs along the east side of Lake Shore Drive and South Shore Drive. From the Lakefront Trail, additional off-street trails extend into Jackson Park, as shown in Figure 2-3. On-street bicycle facilities are also provided within the study area. These include a buffered bicycle lane on Marquette Drive, west of Stony Island Avenue, and a shared bike lane on 55th Street, just north of the study area. Additionally, the City of Chicago Streets for Cycling Plan 2020 designates the following segments within the study are as bicycle routes that should be prioritized for improvements in the future:
Crosstown Bike Routes o Stony Island Avenue o 63rd Street o North Midway Plaisance o South Midway Plaisance
Neighborhood Bike Routes o 57th Street o 56th Street and Harper Avenue between 55th Street and Stony Island Avenue.
Docking stations associated with Divvy, Chicago’s bikeshare system, are provided at the following locations within the study area:
The 55th/56th/57th Street Metra Station (18 docks, ½ mile north of the site) The 59th Street Metra Station (13 docks, 500 feet west of the site) The 63rd Street Metra Station (14 docks, ½ mile southwest of the site) 64th Street and Stony Island Avenue (14 docks, ½ mile south of the site) The Museum of Science and Industry (26 docks, ¼ mile north of the site) 63rd Street Beach (22 docks, ½ mile east of the site) 67th Street and Stony Island Avenue (11 docks) 67th Street and Jeffery Boulevard (15 docks) 67th Street and South Shore Drive (19 docks)
Figure 2-3 also illustrates the existing and planned bicycle network within the study area, as well as the location of nearby Divvy bikeshare stations.

Jackson Park Revitalization Traffic Impact Study Final Report – February 2018 2-7
Figure 2-3: Existing and Planned Bicycle Route/Trail Network

Jackson Park Revitalization Traffic Impact Study Final Report – February 2018 3‐1
3.0 TRAFFIC VOLUMES This section describes the methodology for developing existing and future traffic volume networks and establishes the peak hour volume networks used in the traffic impact analysis. Traffic volumes were developed for the 2016 Existing Condition and then projected to the 2040 No Build (without the proposed project) and 2040 Build (with the proposed project) conditions.
3.1 Existing Traffic Volumes
Intersection turning movement counts were performed in early October 2016 during the following four peak periods at each of the 36study locations:
Weekday morning (AM): 7:00 AM to 9:00 AM Weekday midday (MD): 11:00 AM to 1:00 PM Weekday evening (PM): 3:30 PM to 6:30 PM Saturday MD: 11:00 AM to 3:00 PM
In addition, Automatic Traffic Recorders (ATRs) were installed at the following 11 locations to collect mid-week (Tuesday, Wednesday, and Thursday) 72-hour traffic volumes for a continuous three-day period:
Lake Shore Drive NB and SB, between 57th Drive and Science Drive Lake Shore Drive NB and SB, between Science Drive and Hayes Drive Jeffery Avenue NB and SB, between Marquette Drive and 67th Street Cornell Drive NB and SB, between Hayes Drive and Marquette Drive Cornell Drive NB and SB, between Hayes Drive and South Midway Plaisance Cornell Drive NB and SB, between North Midway Plaisance and 57th Street Stony Island Avenue NB and SB, between 67th Street and 68th Street Stony Island Avenue NB and SB, between 63rd Street and South Midway Plaisance Stony Island Avenue NB and SB, between North Midway Plaisance and 57th Street. South Shore Drive/Marquette Drive EB and WB, between Lake Shore Drive and La
Rabida Drive Marquette Drive EB and WB, between Richards Drive and Cornell Drive
The ATR counts collected vehicle speed data as well as vehicle classification data, and the average daily traffic values from the ATR counts are presented in Figure 3-1. All raw traffic data is included in Appendix A.

Hyde Park Everett Lake Shore
Boulevard Avenue Drive (US 41)56th
Street
57th Drive
57th MSI Street Driveway Museum Drive
Cornell
59th Drive Science
Street Drive
North
Plaisance N. Plaisance
Lake Shore
Drive (US 41)
South S. Plaisance Plaisance
60th
Street
63rd Hayes Hayes Beach
Street Drive Drive Access
64th
Street
65th
Street Richards Lake Shore
Cornell Drive Drive (US 41)
Drive
Cornell
Drive
65th
Place
Marquette Marquette Marquette
Drive Drive Drive
67th
Street
Cornell East End Cregier Bennett Jeffery South Shore
Avenue Avenue Avenue Avenue Avenue Drive (US 41)
68th
Street
LEGENDStony Island
Avenue
Average Daily TrafficOne‐way streetSignalized intersection
Obama Presidential Center Figure 3‐1Traffic Impact Study 2016 Two‐Way ADT VolumesJackson Park, Chicago October 11th to 14th, 2016
32,058
48,846
3,321
30,711
12,473
11,918
31,284
23,438
27,043
XXX
21,166
46,418
N

Jackson Park Revitalization Traffic Impact Study Final Report – February 2018 3-3
Based on the traffic data collected, the weekday AM, MD, and PM peak hours were identified as 7:30 to 8:30 AM, 12:00 to 1:00 PM, and 4:00 to 5:00 PM, respectively, while the Saturday MD peak hour was identified as 2:00 to 3:00 PM.
The proposed closure of Cornell Drive is the critical element of the revitalization of Jackson Park that would change traffic patterns and thus require a detailed traffic impact analysis. Hourly traffic volumes on Cornell Drive are shown in Figure 3-2, where the weekday traffic volumes are sourced from the ATR counts to show the full weekday temporal variations, while the Saturday traffic volumes are sourced from the peak period intersection counts. The peak hour volumes from the intersection counts are summarized in Table 3-1, which show that Cornell Drive NB peaks during the AM peak hour at 1490 vehicles per hour (vph), while Cornell Drive SB peaks during the PM peak hour at 2165 vph. The table also shows that the peak hour volumes during the weekday MD and Saturday MD peak hours are less than half of the highest peak commuter period direction volumes on Cornell Drive. As such, after consultation with CDOT, detailed traffic impact analyses were performed for the weekday AM and PM peak hours only.
Marquette Drive, which is the other proposed roadway closure, carries significantly lower traffic volumes, with no more than 200 vph in either direction during the AM and PM peak hours.
Figure 3-2: Cornell Drive Hourly Traffic Volumes (October 2016)
0
500
1000
1500
2000
2500
12:00 AM
1:00 AM
2:00 AM
3:00 AM
4:00 AM
5:00 AM
6:00 AM
7:00 AM
8:00 AM
9:00 AM
10:00 AM
11:00 AM
12:00 PM
1:00 PM
2:00 PM
3:00 PM
4:00 PM
5:00 PM
6:00 PM
7:00 PM
8:00 PM
9:00 PM
10:00 PM
11:00 PM
Traffic Volume (vehicles per hour)
Time of Day (Hour Start)
Source: Weekday from ATRs (Oct 2016)Saturday from Intersection Counts (Oct 2016)
Cornell Drive NB ‐ Weekday
Cornell Drive SB ‐ Weekday
Cornell Drive NB ‐ Saturday
Cornell Drive SB ‐ Saturday

Jackson Park Revitalization Traffic Impact Study Final Report – February 2018 3-4
Table 3-1: Cornell Drive Peak Hour Volumes from Intersection Counts
Peak Hour NB (vph) SB (vph)
Weekday AM 1490 630
Weekday MD 541 549
Weekday PM 665 2165
Saturday 666 768
The 2016 Existing Condition traffic volume diagrams for the weekday AM and PM peak hours are shown in Figure 3-3 and Figure 3-4, respectively. Pedestrian and bicycle volumes were also collected at the study locations and are presented in Figure 3-5. 3.2 Future Traffic Volumes
The proposed closure of a portion of Cornell Drive through Jackson Park would need to occur by the end of 2019 in order for the OPC to be constructed in time for its projected opening year of 2021. While the OPC site is expected to be open and operational by 2021, it was determined through coordination with CDOT and IDOT that a future horizon year of 2040 should be considered for the purposes of identifying traffic impacts.
The future traffic volume projections for the 2040 No Build Condition accounted for future traffic growth, including site-specific traffic growth associated with near-term University of Chicago development projects. The 2040 Build Condition traffic volumes build upon the 2040 No Build traffic volumes by incorporating the reassignment of traffic due to the proposed roadway closures and the trips generated by the OPC development. Since details regarding the proposed golf course redevelopment are not yet available and because golf courses already exist on the site where the new golf course would be constructed, it was assumed that any new project-generated trips by the proposed golf course redevelopment would be negligible during the weekday AM and PM peak hours.
3.2.1 Traffic Volume Reassignment The Chicago Metropolitan Agency for Planning (CMAP) assisted with the development of future traffic volumes based on their in-house travel demand model. The CMAP model provided projections on the reassignment of Cornell Drive traffic volumes to alternate routes as well as general background growth associated with the expected economic growth of nearby neighborhoods and other known development and transportation infrastructure projects. CMAP manipulated the 2016 and 2040 models to remove the roadway links that would be closed and then used the model to reassign that traffic. Since preliminary traffic analyses showed that the southbound through movement for Lake Shore Drive at 57th Drive would be over capacity during the PM peak hour, the CMAP model was re-run with the assumption that a third southbound lane would be provided on Lake Shore Drive. The model output provided existing and future daily traffic volumes for links within the study, and an east-west screenline north of Hayes Drive was established to determine where the existing traffic using Cornell Drive would be diverted.

Hyde Park Everett Lake Shore
30 Boulevard Avenue Drive (US 41)
56th 15 80
Street 20 180 10 185 1405 110 1475 1055
285 525 50 57th Drive 20 1490 220 20 1465
5 1360 1525 15 5 10 70 125 2575
245 55 120 230 1300 55 0 5 57th 235 5 MSI
Street 10 155 Driveway Museum Drive
130 445 50 5 125 1425 60
145 75
140 485 Cornell 5 1120
59th Drive Science Street 10 Drive 5
15 130 485 5 5 2695
110
105 395 845 850 530
North 80 Plaisance N. Plaisance
150 505 185 1610
Lake Shore
390 85 530 Drive (US 41)
South S. Plaisance Plaisance 40 305
295 615 25 100 1490
50
115 325
60th Street 20 630
35 75 620 1490
50 130 0
65 245 50 240 110 425 95 180 145 100 1020 5 5
63rd 45 25 Hayes 145 15 Hayes 0 Beach
Street 85 120 Drive 400 400 Drive 410 Access
230 155 560 35 190 45 1240 265 150 190 35 10 55 2290 5
115 5 15 20 150
50 355 64th
Street 45 190 35
70 150 705
5 420
65th Street 5 Richards Lake Shore
10 15 850 Cornell Drive Drive (US 41)
Drive
5
450 Cornell
5 420 Drive
65th 10 155
Place 0 860 190
15 35 1285
45 815 20 40 20 10 150 190 15 460 565 165
Marquette 30 75 Marquette 85 85 Marquette 0
Drive 40 80 Drive 35 150 Drive 80 155 145 805 5 100 10 1450 85 150 150 95 985 15
65 75
85 185
45 815 50 180 45 380 50 430 55 155 20 615
67th 70 335 20 335 285 275 35 Street 25 85 200 200 210 235 140 30
175 65 845 140 1415 80 20 65 20 50 30 20 70 130 70 770 10 65 105 1505
80 35
Cornell East End Cregier Bennett Jeffery South Shore
40 925 Avenue Avenue Avenue Avenue Avenue Drive (US 41)
68th Street
50 910 1495
LEGEND
Stony Island
Avenue XXX Vehicles per hour
One‐way street
Signalized intersection
Obama Presidential Center Figure 3‐3Traffic Impact Study 2016 Existing Condition Traffic VolumesJackson Park, Chicago AM Peak Hour
N

Hyde Park Everett Lake Shore
45 Boulevard Avenue Drive (US 41)
56th 45 20
Street 90 260 15 250 1530 15 1545 1860
475 385 55 57th Drive 5 1540 170 5 1185
90 1040 1285 15 5 45 145 10 1260
410 110 80 80 1710 0 10 30 57th 70 50 MSI
Street 30 220 Driveway Museum Drive
245 330 85 5 60 930 5
165 215
55 590 Cornell 10 1995
59th Drive Science Street 25 Drive 25
15 30 390 20 5 1245
45
25 580 260 220 1755
North 35 Plaisance N. Plaisance
75 375 120 995
Lake Shore
555 60 1755 Drive (US 41)
South S. Plaisance Plaisance 40 450
740 410 60 410 665
125
20 660
60th Street 70 2165
65 40 400 665
30 140 10
85 580 60 170 95 1665 405 120 130 80 1925 10 10
63rd 40 30 Hayes 130 25 Hayes 5 Beach
Street 50 45 Drive 205 205 Drive 160 Access
235 70 360 30 250 25 480 65 515 160 25 20 65 1080 25
200 30 25 55 515
50 770 64th
Street 25 160 25
100 45 435
5 865
65th Street 10 Richards Lake Shore
5 15 470 Cornell Drive Drive (US 41)
Drive
5
1720 Cornell
0 870 Drive
65th 35 500
Place 0 480 170
10 15 685
85 2470 35 50 5 35 500 170 30 720 1235 160
Marquette 70 125 Marquette 95 95 Marquette 20
Drive 25 30 Drive 15 150 Drive 35 100 80 445 15 120 5 535 45 150 395 75 450 10
115 220
50 70
90 2470 95 185 20 365 130 680 150 130 40 1490
67th 110 345 25 335 330 360 25 Street 20 50 300 300 275 265 60 20
215 155 470 260 515 85 45 55 10 55 20 20 25 180 100 405 25 105 80 830
165 50
Cornell East End Cregier Bennett Jeffery South Shore
95 2650 Avenue Avenue Avenue Avenue Avenue Drive (US 41)
68th Street
55 625 600
LEGENDStony Island
Avenue XXX Vehicles per hourOne‐way streetSignalized intersection
Obama Presidential Center Figure 3‐4Traffic Impact Study 2016 Existing Condition Traffic Volumes
Jackson Park, Chicago PM Peak Hour
N

57th Dr
Stony Island Ave
56th St
Everett Ave
Hyde Park
Blvd
57th St
59th St
N Plaisance
60th St
S Plaisance
63rd St Hayes Dr
Cornell Dr
64th St
Lake Shore Dr
Lake Shore Dr
Science Dr
Museum DrMSIParking
NNot to Scale
Figure 3 - 5a
Existing Pedestrian and Bike Volume= Weekday Morning Peak Hourxx= Weekday Evening Peak Hour(xx)= Existing Traffic Signal= Existing Stop Sign
= Pedestrian Volume
= Bike Volume
= Unserviced Crossing
xx(xx)
xx(xx)
xx(xx)
xx(xx)
48 (2
7)
105
(5)
2(0)4 (8)
21 (7)
1(4)
51 (54) 33 (45)
1 (1)
48 (2
7)
7 (1
3)
0 (1
7)
105
(5)
2 (0)
6 (23)
5 (9
)
3 (4
)
11 (31)
1 (1)
3 (0)
0(3)
1(1)
6(1)
0(2)
1 (0)0 (1)
2 (38)
0 (2
)
0 (2
)
0 (6)
1 (1)
1 (0)
11 (19)
31 (8
0)
9 (1
2)
6 (14)1 (0)
1 (0
)32
(18)
9 (2
7)
7 (3)
0 (1
)
1 (1)
2 (8)
58 (2
0)
10 (2
4)
3 (3)
1 (0)
1 (0
)
0 (1)
0 (5)
1 (0)
0 (3)
14 (28)
1 (0)
0 (1
)
1 (1)
1 (0)0 (2)
1 (0
)1 (0)
1 (0)
51 (4
4)
27 (29)
66 (2
7)
14 (23)0 (1)
21 (7)
1(1)
7(1)
0 (2
)51
(29)
20 (17)
0 (1)2 (1)0 (2)
0 (1)

NN
ot to
Sca
le
63rd
St
Hay
es D
r
Stony Island Ave
67th
St
South Shore D
r
Lake Shore Dr
Jeffery Ave
Richards Dr
Mar
quet
te D
r
Cornell Dr
68th
St
64th
St
65th
St
East End Ave
Cregier Ave
Bennett Ave
Cornell Ave
65th
Pl
14 (7)
8 (12)
0 (1
)
12 (1
9)
38 (111)
9 (23)
6 (2
0)
1 (1)
0 (2
)
18 (1)
19 (0
)
0 (1)
1 (0
)
6 (0)
6 (1
4)
1 (0
)
0 (1)
0 (1
0)
0 (2)
14 (12)
1 (1
)
1 (0
)
11 (1
9)31 (80)
9 (12)6
(14)
1 (0
)
1 (0)
50 (1
04)
29 (20)
39 (22)
35 (1
0)
1 (0)
2 (3
8)
0 (2)
0 (2)
0 (6
)
1 (1
)
35 (6
9)
3 (6)
24 (31)
45 (2
8)
0 (1
)
0 (1
)
0 (1)
3 (0
)
1 (0
)
0 (3) 5 (0)
21 (0
)0
(1)
20 (6
7)
18 (67) 2 (7
)
0 (1)
1 (1
1)
22 (32)
5 (2
7)
1(4)
2 (0
)
50 (108)
5 (0
)
40 (79)
11 (19)
4 (8
)
0 (3
)
Figu
re 3
- 5b
Exis
ting
Pede
stria
n an
d Bi
ke V
olum
e=
Wee
kday
Mor
ning
Pea
k H
our
xx=
Wee
kday
Eve
ning
Pea
k H
our
(xx)
= Ex
istin
g Tr
affic
Sign
al=
Exis
ting
Stop
Sig
n
= Pe
dest
rian
Volu
me
= Bi
ke V
olum
e
= U
nser
vice
d Cr
ossi
ng
xx(x
x)
xx(x
x)
2 (5)
4 (7)
1 (0
)
4 (0)
3 (4)
11 (0)
1 (0
)

Jackson Park Revitalization Traffic Impact Study Final Report – February 2018 3-9
The CMAP reassignment of Cornell Drive traffic to the parallel roadways of Lake Shore Drive to the east and Stony Island Avenue to the west is shown in Table 3-2. As shown in the table, the CMAP model predicted that the majority of Cornell Drive traffic (51% to 57%) would be diverted to Lake Shore Drive, 19% to 21% would be diverted to Stony Island Avenue, and the remaining 24% to 28% would be assigned to alternate routes outside of the study area.
Table 3-2: Cornell Drive Traffic Reassignment
Corridor Cornell Drive NB
Diversion
Cornell Drive SB
Diversion
Cornell Drive ‐100% ‐100%
Lake Shore Drive +51% +57%
Stony Island Avenue +21% +19%
Other roadways to the west +28% +24%
Source: CMAP model output
Of the 24% to 28% assigned to alternate north/south routes west of Stony Island Avenue, CMAP’s projections showed that approximately half would divert to the Dan Ryan Expressway with the remainder distributed over other north-south collectors and arterials to the west of Stony Island Avenue. The general traffic increases due to these diversions, as provided by CMAP in terms of Average Annual Daily Traffic (AADT), is presented in Table 3-3 The CMAP model results are summarized in a memorandum prepared by CMAP that is included in Appendix B.
Table 3-3: Reassignment of Traffic to Alternate North/South Routes(Source: CMAP)
While these traffic reassignment assumptions were used as an initial baseline, some adjustments were made to balance travel times across alternate routes under the expectation that drivers would find alternate routes that would minimize their delay through the study area.
3.2.2 Background Traffic Growth Background traffic growth between 2016 and 2040 was estimated for each of the three north/south corridors within the study area based on the CMAP output by comparing the CMAP volumes for the 2016 and 2040 reassigned networks, as summarized in Table 3-4.
PhaseDan Ryan
ExpresswayState Street
Dr. Martin
Luther King Jr.
Drive
Cottage Grove
Avenue
Woodlawn
Avenue
Stony Island
AvenueCornell Drive
Lake Shore
Drive
2016 Existing AADT 314,600 4,300 11,100 18,400 3,500 13,800 27,000 46,300
Projected
Reassignment318,100 4,800 11,800 19,600 4,200 19,200 0 60,900
Maximum Projected
Capacity‐ 18,000 12,400 25,000 10,000 30,000 ‐ 65,000
Note ‐ 10% was assumed to travel via North/South Col lectors such as Dorchester Avenue or El l i s Avenue

Jackson Park Revitalization Traffic Impact Study Final Report – February 2018 3-10
Table 3-4: Average Growth Rates by Corridor (2016-2040)
Corridor Background Growth
(2016‐2040)
Cornell Drive 2.37%
Lake Shore Drive ‐1.67%
Stony Island Avenue ‐0.33%
Source: CMAP model output
The results show that on average, Cornell Drive is projected to experience an overall background traffic growth of 2.37% between 2016 and 2040, while Lake Shore Drive and Stony Island Avenue would experience slight decreases in growth over the same time period. To be conservative, existing traffic was projected to 2040 using the highest of the three growth rates (2.37%), which was applied to all traffic volumes within the study area.
3.2.3 University of Chicago Traffic Increment The University of Chicago provided information on the development of several ongoing projects to be located just west of the study area. These projects include a 180-key hotel and an approximately 90,000 square foot forum/meeting complex. Both developments are to be developed on the south side of 60th Street between Dorchester Avenue and Woodlawn Avenue, 1/4 to 1/2 mile west of Stony Island Avenue.
Traffic volumes for the proposed University developments were obtained from CDOT and were based on a traffic study prepared by KLOA, Inc., for the University (relevant pages provided in Appendix D) and carried through the OPC study area based on likely travel paths to and from the site.
3.2.4 Obama Presidential Center Site Traffic Increment The OPC will include a museum dedicated to the presidency of Barack Obama, the 44th President of the United States, as well as hosting programs of the Obama Foundation and community. Certain amenity elements, such as an athletic center, food service, and a bookstore, will also be included on site. The main campus buildings are estimated to total approximately 285,000 square feet, while the athletic center is estimated to be approximately 40,000 square feet. It is anticipated the typical hours of operation will be between 9:00 AM and 5:00 PM and the OPC will be open nearly year-round. Estimates of expected annual OPC museum attendance to be approximately 600,000. As much as 50% of those visitors are preliminarily expected to originate from outside the Chicagoland area. In addition, approximately 160,000 visitors are expected for community programing or special events at the center.
Trip generation for the OPC site was estimated for the AM and PM peak hours based on assumptions provided by the Barack Obama Foundation and supplemented with data from other presidential libraries and centers as well as other similar facilities in Chicago.

Jackson Park Revitalization Traffic Impact Study Final Report – February 2018 3-11
The following assumptions were used to develop the trip generation for the OPC site for the 30th design day (i.e., the 30th highest attendance day of the year):
Annual center attendance of 760,000 visitors, including 600,000 visitors to the museum and 160,000 non-museum visitors for programs, special events, and community access
Based on data from other presidential centers, 0.7% of the annual museum attendance would be present on the design day, or approximately 4,200 museum visitors
An hourly distribution of arrivals based on data from other presidential centers 50% of the visitors would travel by car 18% of the visitors would arrive by taxi, Uber, Lyft, etc. 12% of the visitors would arrive via a tour/school bus 20% of the visitors would arrive via transit, walk, or bike An estimated average “visit time” of 3 hours Estimated staff size of approximately 150 persons An average vehicle occupancy of:
o Visitor: 2.5 persons per vehicle o Employee: 1.2 persons per vehicle o Bus: 48.5 persons per bus
Additional information is provided in the trip generation and parking calculator in Appendix C.
Table 3-5 presents the estimated trip generation for the OPC during the peak AM and PM hours of the adjacent street network, and the assignment of these trips to the surrounding roadway network are shown in Figure 3-6 and Figure 3-7 for the AM and PM peak hours, respectively. These trips were included in the 2040 Build volumes.
Table 3-5: Vehicle Trip Generation for 30th Design Day
Weekday AM Peak of
Street
Weekday PM Peak of
Street
In Out Total In Out Total
Employees 62 0 62 5 30 35
Visitors who park 2 0 2 16 48 64
Drop‐off/pick‐up 12 12 24 26 26 52
Bus 1 1 2 1 2 3
Total 77 13 90 48 106 154
Note: This estimate is based on an annual center attendance of 820,000, including 600,000 museum visitors and 220,000 non-museum visitors. Current attendance estimates are lower (760,000 total, including 600,000 museum visitors and 160,000 non-museum visitors); therefore, the trip generation used in the traffic analysis is conservative.

Hyde Park Everett Lake Shore
Boulevard Avenue Drive (US 41)
56th
Street 26 26
2 0 57th Drive 26
1 1 1
2 26 57th MSI
Street Driveway Museum Drive
0 1
2 Cornell
59th Drive Science
Street Drive 0
0 2 0 26
North 26
Plaisance 0 1
Lake Shore
28 Drive (US 41)
South ObamaPlaisance Presidential
13 1 CenterProject IN: 63
1 1 Site OPC Parking
41 Drop‐Off/Pick‐Up 1 40 OUT: 060th IN: 1 OPC Site Access
Street OUT: 1 1 1 23
3 0 1 0 3
63rd Hayes Hayes Beach
Street 8 Drive Drive Access
13 0 3 0
1
64th
Street 3
13
1
65th
Street Richards Lake Shore
13 Cornell Drive Drive (US 41)
Drive
Cornell
1 Drive
65th 0
Place 13 3
1 3 3
Marquette Marquette
Drive Drive 13 0
1 0
67th
Street 13 3
Cornell East End Cregier Bennett Jeffery South Shore
1 Avenue Avenue Avenue Avenue Avenue Drive (US 41)
68th
Street 13
LEGENDStony Island
Avenue XXX Vehicles per hourOne‐way streetSignalized intersection
Curbside pick‐up/drop‐off
Obama Presidential Center Figure 3‐6Traffic Impact Study OPC Site Generated TrafficJackson Park, Chicago AM Peak Hour
Avenue
Stony Island
N

Hyde Park Everett Lake Shore
Boulevard Avenue Drive (US 41)
56th
Street 25 25
2 4 57th Drive 25 58
58 58 2 25
57th MSI
Street Driveway Museum Drive
4 58
2 Cornell
59th Drive Science Street Drive
4
North 0 2 0 25
Plaisance 25 8 58
8 4 58
Lake Shore
27 Drive (US 41)
South ObamaPlaisance Presidential
13 70 CenterProject IN: 31
20 11 Site OPC Parking40 20 20 59 OUT: 115
60th IN: 31 56 OPC Site Access
Street OUT: 31 70 11 11
3 32 37 7 3
63rd Hayes Hayes Beach
Street 8 Drive Drive Access
12 7 7 3
37
64th Street
12
37
65th
Street Richards Lake Shore
12 Cornell Drive Drive (US 41)
Drive
Cornell
37 Drive
65th 7
Place 12 3
37 3 3
Marquette Marquette Drive Drive
12 7
37 7
67th Street
12 3
Cornell East End Cregier Bennett Jeffery South Shore
37 Avenue Avenue Avenue Avenue Avenue Drive (US 41)
68th Street
12
LEGENDStony Island
Avenue XXX Vehicles per hourOne‐way streetSignalized intersection
Curbside pick‐up/drop‐off
Obama Presidential Center Figure 3‐7Traffic Impact Study OPC Site Generated TrafficJackson Park, Chicago PM Peak Hour
(Drop Off)
Avenue
Stony Island
N

Jackson Park Revitalization Traffic Impact Study Final Report – February 2018 3-14
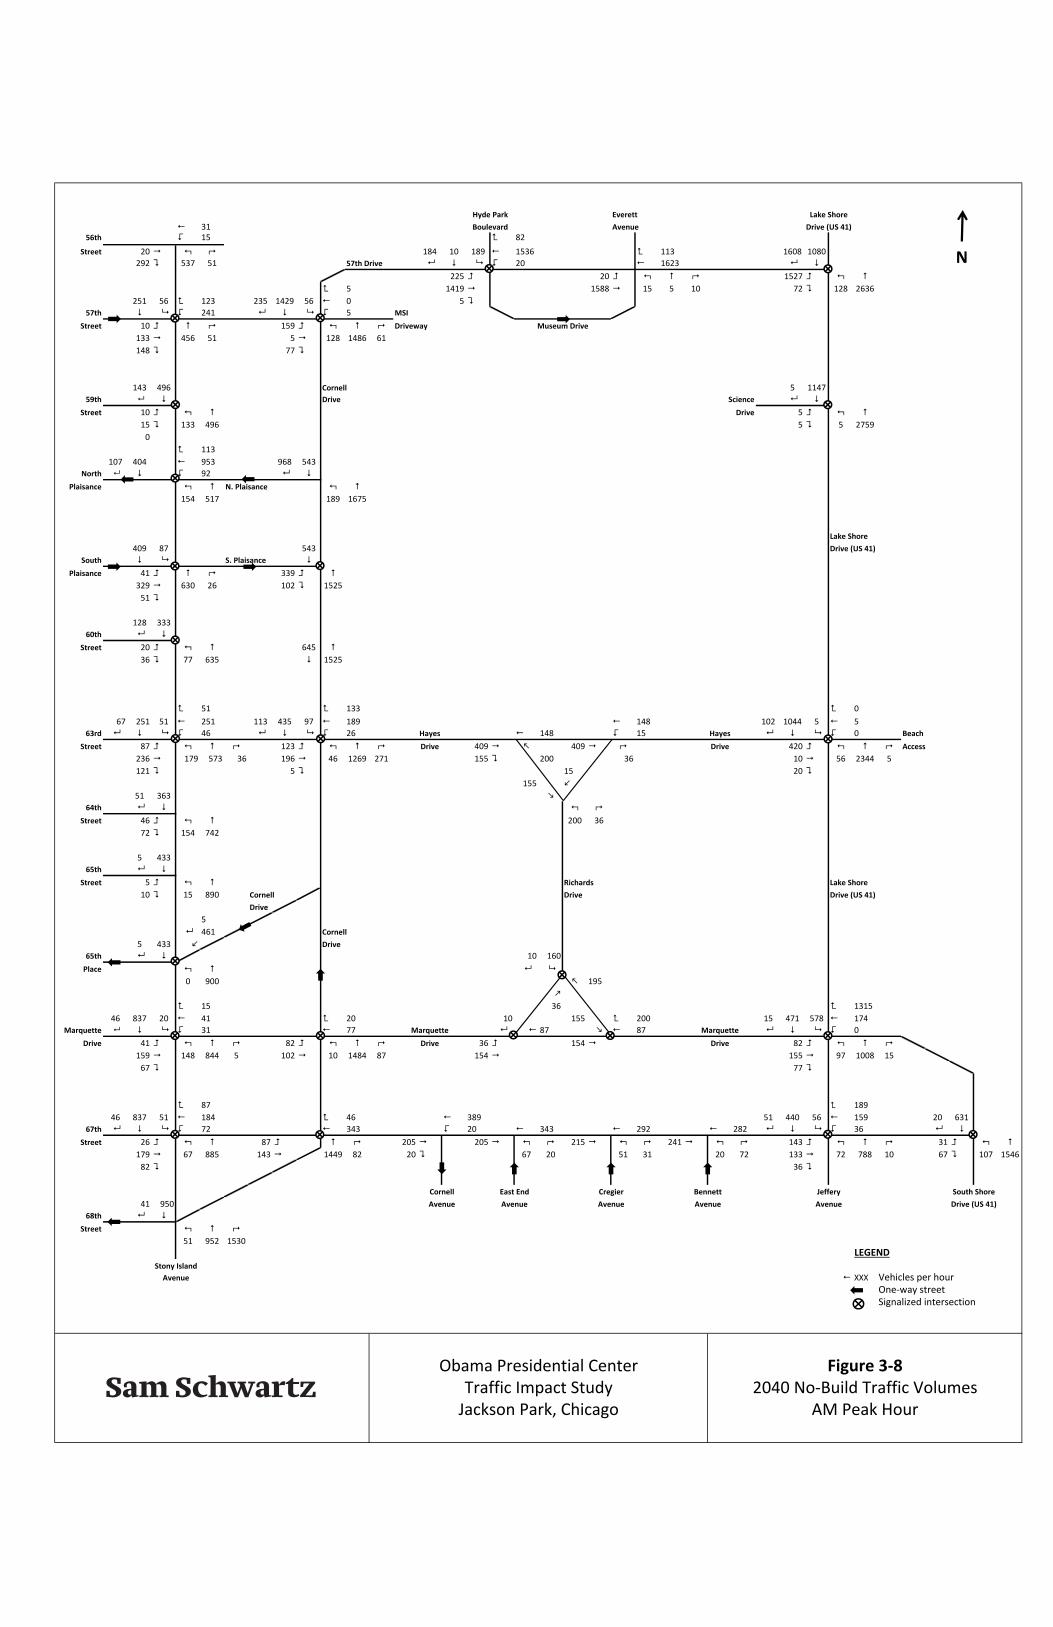
3.2.5 2040 No Build Traffic Volumes The background growth rate and University of Chicago development increment were applied to the 2016 Existing Condition traffic volumes to develop the 2040 No Build Condition traffic volumes, which are shown in Figure 3-8 and Figure 3-9.
3.2.6 2040 Build Traffic Volumes To calculate the 2040 Build Condition traffic volumes, the reassignment increment and OPC traffic increment were added to the 2040 No Build Condition traffic volumes, and the resulting 2040 Build Condition traffic volumes are shown in Figures 3-10 through 3-11.
Additionally, to capture the increased pedestrian activity along Stony Island Avenue near the proposed OPC site, pedestrian volumes were increased at intersections near the project site using assumptions developed in coordination with CDOT. These updated pedestrian volumes analyzed during Build Condition analysis were developed by using the following methodology:
All pedestrian volumes within the study area were doubled (i.e., +100% growth) Bicycle and pedestrian volumes during the PM peak hour at the six intersections closest
to the proposed OPC Site were tripled. These intersections include: o Stony Island Avenue and 59th Street o Stony Island Avenue and North Midway Plaisance/Cornell Drive o Stony Island Avenue and South Midway Plaisance o Stony Island Avenue and 60th Street o Stony Island Avenue and Hayes Drive/63rd Street o Cornell Drive and Hayes Drive
Finally, the north-side crosswalk at the intersection of Stony Island Avenue and South Midway Plaisance was assumed to be the primary pedestrian path that would connect the OPC Site to the University of Chicago Campus and the Midway Plaisance. In coordination with CDOT, this crosswalk volume was raised to 100 pedestrians for the AM and PM peak hours to be conservative.
The detailed diversion, growth, and site traffic increments are included in Appendix D.
Hyde Park Everett Lake Shore
31 Boulevard Avenue Drive (US 41)
56th 15 82
Street 20 184 10 189 1536 113 1608 1080
292 537 51 57th Drive 20 1623
225 20 1527 5 1419 1588 15 5 10 72 128 2636
251 56 123 235 1429 56 0 5 57th 241 5 MSI
Street 10 159 Driveway Museum Drive
133 456 51 5 128 1486 61
148 77
143 496 Cornell 5 1147
59th Drive Science
Street 10 Drive 5 15 133 496 5 5 2759
0
113
107 404 953 968 543
North 92
Plaisance N. Plaisance 154 517 189 1675
Lake Shore
409 87 543 Drive (US 41)
South S. Plaisance
Plaisance 41 339 329 630 26 102 1525
51
128 333
60th
Street 20 645 36 77 635 1525
51 133 0
67 251 51 251 113 435 97 189 148 102 1044 5 5
63rd 46 26 Hayes 148 15 Hayes 0 Beach
Street 87 123 Drive 409 409 Drive 420 Access
236 179 573 36 196 46 1269 271 155 200 36 10 56 2344 5
121 5 15 20 155
51 363 64th
Street 46 200 36
72 154 742
5 433
65th
Street 5 Richards Lake Shore
10 15 890 Cornell Drive Drive (US 41)
Drive
5
461 Cornell
5 433 Drive
65th 10 160
Place 0 900 195
15 36 1315
46 837 20 41 20 10 155 200 15 471 578 174
Marquette 31 77 Marquette 87 87 Marquette 0
Drive 41 82 Drive 36 154 Drive 82 159 148 844 5 102 10 1484 87 154 155 97 1008 15
67 77
87 189
46 837 51 184 46 389 51 440 56 159 20 631
67th 72 343 20 343 292 282 36
Street 26 87 205 205 215 241 143 31 179 67 885 143 1449 82 20 67 20 51 31 20 72 133 72 788 10 67 107 1546
82 36
Cornell East End Cregier Bennett Jeffery South Shore
41 950 Avenue Avenue Avenue Avenue Avenue Drive (US 41)
68th
Street 51 952 1530
LEGENDStony Island
Avenue XXX Vehicles per hourOne‐way streetSignalized intersection
Obama Presidential Center Figure 3‐8Traffic Impact Study 2040 No‐Build Traffic VolumesJackson Park, Chicago AM Peak Hour
N

Hyde Park Everett Lake Shore
46 Boulevard Avenue Drive (US 41)
56th 46 20
Street 92 266 15 256 1589 15 1605 1904
486 394 56 57th Drive 5 1599 174 5 1311
92 1163 1413 15 5 46 148 10 1290
420 113 82 82 1774 0 10 31 57th 72 51 MSI
Street 31 225 Driveway Museum Drive
251 338 87 5 61 1050 5
169 220
56 604 Cornell 10 2042
59th Drive Science Street 26 Drive 26
15 31 399 20 5 1275
0
46
26 594 287 248 1797
North 38 Plaisance N. Plaisance
77 384 123 1117
Lake Shore
570 61 1797 Drive (US 41)
South S. Plaisance Plaisance 41 559
856 420 61 420 681
128
23 676
60th Street 72 2216
67 41 409 681
31 143 10
87 594 61 175 97 1704 415 124 133 82 1971 10 10
63rd 41 31 Hayes 133 26 Hayes 5 Beach
Street 51 46 Drive 210 210 Drive 164 Access
246 76 369 31 261 26 491 67 532 165 26 20 67 1106 26
225 31 26 56 532
51 808 64th
Street 26 165 26
102 46 450
5 906
65th Street 10 Richards Lake Shore
5 15 486 Cornell Drive Drive (US 41)
Drive
5
1761 Cornell
0 911 Drive
65th 36 517
Place 0 496 174
10 15 701
87 2549 36 51 5 36 517 175 31 737 1264 165
Marquette 72 128 Marquette 97 97 Marquette 20
Drive 26 31 Drive 15 154 Drive 36 102 82 460 15 123 5 548 46 154 409 77 461 10
118 225
51 72
92 2549 97 189 20 374 133 696 154 133 41 1530
67th 113 353 26 343 338 369 26 Street 20 51 307 307 282 271 61 20
220 159 486 266 527 87 46 56 10 56 20 20 26 184 102 415 26 107 82 851
169 51
Cornell East End Cregier Bennett Jeffery South Shore
97 2733 Avenue Avenue Avenue Avenue Avenue Drive (US 41)
68th Street
56 645 614
LEGENDStony Island
Avenue XXX Vehicles per hourOne‐way streetSignalized intersection
Obama Presidential Center Figure 3‐9Traffic Impact Study 2040 No‐Build Traffic VolumesJackson Park, Chicago PM Peak Hour
N

Hyde Park Everett Lake Shore
31 Boulevard Avenue Drive (US 41)
56th 15 82
Street 20 184 10 189 1110 113 1182 1351
294 537 51 57th Drive 20 1197
225 20 478 5 371 540 15 5 10 72 128 3258
274 35 0 235 1003 56 0 5 57th 241 5 MSI
Street 10 159 Driveway Museum Drive
82 578 51 5 5 437 61
200 4
143 571 Cornell 5 1418
59th Drive Science
Street 0 Drive 5 (RIRO) 15 0 630 5 5 3381
113
107 479 0 764 914
North 135
Plaisance 399 517 504
Lake Shore
615 Drive (US 41)
South
Plaisance 385 80 1035 Obama
PresidentialCenter
128 567 Project 562 40 0
60th Site 0 OPC Site Access
Street 0 (RIRO) 36 0 1035 1035 23
259 0
67 347 148 287 435 446 389 1029 5 5
63rd 23 Hayes 233 Hayes 5 Hayes 0 Beach
Street 218 Drive 431 Drive 1068 Drive 1042 Access
114 296 581 174 5 175 223 0 10 56 2344 5
121 20
51 437 133 812
64th
Street 67 Cornell
51 154 985 Drive
5 486
65th
Street 5 Richards Lake Shore
10 15 1133 Cornell Drive Drive (US 41)
Drive
5
233
5 486 65th 180
Place 0 1144 945 218
1315
72 658 223 0 471 578 126
Marquette Marquette 51
Drive 159 Drive 82 107 164 1930 21 97 1008 15
77
154 189
46 627 92 184 440 102 440 56 159 20 497
67th 102 20 394 343 333 36
Street 113 338 338 348 374 143 31 92 67 1827 174 20 67 20 51 31 20 72 266 72 788 10 200 107 1549
82 36
Cornell East End Cregier Bennett Jeffery South Shore
41 770 Avenue Avenue Avenue Avenue Avenue Drive (US 41)
68th
Street 51 2068
LEGENDStony Island
Avenue XXX Vehicles per hourOne‐way streetSignalized intersectionRemoved roadway
Obama Presidential Center Figure 3‐10Traffic Impact Study 2040 Build Traffic Volumes
Jackson Park, Chicago AM Peak Hour
Avenue
Stony Island
N

Hyde Park Everett Lake Shore
46 Boulevard Avenue Drive (US 41)56th 46 20
Street 92 266 15 256 89 15 104 2786
488 398 56 57th Drive 5 99 174 5 798
92 649 900 15 5 46 148 10 1573
487 48 20 82 273 0 10 31 57th 72 51 MSI
Street 31 225 Driveway Museum Drive
107 403 87 5 0 537 5
313 11
56 815 Cornell 10 2924
59th Drive Science Street 0 Drive 26 (RIRO) 15 0 490 20 5 1557
46
26 805 0 143 335
North 146 Plaisance 542
279 444 542
Lake Shore
951 Drive (US 41)
South Plaisance 537
397 728 Obama Stony Island
Presidential Avenue
Center20 1327 Project 1374 20 59
60th Site 56 OPC Site Access
Street 0 (RIRO) 67 0 728 670 11
157 10
119 930 381 179 451 1058 995 1940 10 10
63rd 120 Hayes 779 Hayes 14 Hayes 5 Beach
Street 82 Drive 782 Drive 532 Drive 447 Access
320 43 442 113 31 546 172 10 20 67 1106 26
205 80
51 1204 5 296
64th Street 61 Cornell
67 46 536 Drive
5 1265
65th
Street 10 Richards Lake Shore
5 15 572 Cornell Drive Drive (US 41)
Drive
5
804
0 1270 65th 555
Place 0 582 301 182
701
130 1945 182 0 761 1264 105
Marquette Marquette 82
Drive 72 Drive 36 174 91 811 294 77 461 10
225
61 72
92 1873 154 189 435 195 720 154 133 41 1415
67th 184 26 404 399 430 26 Street 72 425 425 399 389 61 20
169 159 768 148 46 56 10 56 20 20 26 302 102 415 26 225 82 853
169 51
Cornell East End Cregier Bennett Jeffery South Shore
97 2129 Avenue Avenue Avenue Avenue Avenue Drive (US 41)
68th Street
56 1075
LEGENDStony Island
Avenue XXX Vehicles per hourOne‐way streetSignalized intersectionRemoved roadway
Obama Presidential Center Figure 3‐11Traffic Impact Study 2040 Build Traffic VolumesJackson Park, Chicago PM Peak Hour
N

Jackson Park Revitalization Traffic Impact Study Final Report – February 2018 4‐1
4.0 TRAFFIC IMPACT ANALYSIS A traffic impact analysis was performed to identify potential traffic impacts associated with the proposed revitalization of Jackson Park, which includes multiple roadway closures and the proposed OPC and golf course projects. Traffic analyses were performed for the weekday AM and PM peak hours, and capacity analysis results were developed for the following conditions:
2016 Existing Condition, which establishes baseline conditions for the current year 2040 No Build Condition, which represents future conditions without the proposed OPC
or the proposed roadway closures 2040 Build Condition, which represents future conditions with the proposed OPC and the
proposed roadway closures.
The 2040 Build Condition includes proposed mitigation measures and is compared to the 2040 No Build Condition to identify potential traffic impacts.
4.1 Capacity Analysis Methodology
The Synchro (version 10) traffic analysis software was used to analyze traffic operations for the Existing Condition as well as for each scenario in the 2040 horizon year. The capacity analysis results from Synchro provide volume-to-capacity (v/c) ratios, average vehicle delays, levels of service (LOS), and queue lengths (95th-percentile) for each study intersection. SimTraffic, the traffic simulation module of the Synchro software package, was also used to develop traffic simulations for each scenario and peak hour to further inform traffic operations and to assist in determining the effectiveness of the proposed mitigation measures. Pavement striping and traffic signal timings for signalized intersections were obtained from CDOT (see Appendix E) and verified in the field.
The LOS of a signalized intersection is defined in terms of control delay per vehicle (seconds per vehicle), and control delay is the portion of total delay experienced by a motorist that is attributed to the traffic signal. For signalized intersections, LOS A describes operations with minimal delays (up to 10 seconds per vehicle), while LOS F describes operations with delays in excess of 80 seconds per vehicle. In general, delays experienced at LOS D or better are generally considered “acceptable” operating conditions, while LOS E and F are generally considered “unacceptable” operating conditions. The LOS criteria for signalized intersections, as defined in the 2010 Highway Capacity Manual (HCM 2010), are provided in Table 4-1.
Table 4-1: LOS Criteria for Signalized Intersections
Level of Service (LOS) Average Delay
A ≤ 10.0 seconds B > 10.0 and ≤ 20.0 seconds C > 20.0 and ≤ 35.0 seconds D > 35.0 and ≤ 55.0 seconds E > 55.0 and ≤ 80.0 seconds F > 80.0 seconds
Transportation Research Board. Highway Capacity Manual, 2010.

Jackson Park Revitalization Traffic Impact Study Final Report – February 2018 4-2
For unsignalized intersections, the total delay is defined as the total elapsed time from which a vehicle stops at the back of the queue until the vehicle departs from the stop line. This includes the time required for the vehicle to travel from the last-in-queue to the first-in-queue position. The LOS thresholds for unsignalized intersections are different from those for signalized intersections and are summarized in Table 4-2.
Table 4-2: LOS Criteria for Unsignalized Intersections
Level of Service (LOS) Average Delay
A ≤ 10.0 seconds B > 10.0 and ≤ 15.0 seconds C > 15.0 and ≤ 25.0 seconds D > 25.0 and ≤ 35.0 seconds E > 35.0 and ≤ 50.0 seconds F > 50.0 seconds
Transportation Research Board. Highway Capacity Manual, 2010.
4.2 Existing Conditions
The intersection capacity analysis results for the Existing Condition for signalized and unsignalized intersections are shown in Table 4-3 and Table 4-4, respectively. The majority of the analyzed intersection approaches and lane groups operate at LOS D or better during both peak hours. The Synchro files for all conditions and peak hours are provided in Appendix F.
Signalized intersections with lane groups that currently operate at LOS E or LOS F include the following:
Stony Island Avenue and 67th Street
The NB left-turn movement operates at LOS E during the AM and PM peak hours. The SB left-turn movement operates at LOS F during the PM peak hour.
Jeffery Avenue and 67th Street
The EB left-turn movement operates at LOS F during the AM peak hour.
57th Drive and Hyde Park Blvd/Museum Drive
The EB left-turn movement operates at LOS F during the AM peak hour.
Stony Island Avenue and N. Midway Plaisance
The WB approach operates at LOS E during the AM peak hour.
Stony Island Avenue and 57th Street
The EB approach operates at LOS F during the PM peak hour.

Lane Group
v/c Ratio
Delay (sec)
LOSQueue Length
(ft)
Lane Group
v/c Ratio
Delay (sec)
LOSQueue Length
(ft)
Lake Shore Dr & 57th Drive
Eastbound L 0.81 28.9 C 328 L 0.82 33.3 C 268R 0.09 3.5 A 8 R 0.31 23.7 C 86
Northbound L 0.49 46.6 D 129 L 0.14 10.3 B 8T 0.98 31.2 C 787 T 0.40 7.5 A 169
Southbound T 0.80 32.4 C 441 T 0.85 18.5 B 597R 0.96 16.7 B 170 R 0.96 17.3 B 178
27.7 C 18.9 B
Lake Shore Dr & Science Dr
Eastbound L 0.03 43.6 D 15 L 0.16 45.6 D 43R 0.02 20.2 C 10 R 0.09 28.1 C 29
Northbound L 0.04 45.4 D 15 L 0.04 45.4 D 15T 0.60 2.5 A 248 T 0.28 1.8 A 73
Southbound T 0.37 3.5 A 171 T 0.70 6.8 A 338R 0.00 0.0 A 0 R 0.01 0.9 A 1
2.9 A 5.4 A
Stony Island Ave & 67th St
Eastbound LTR 0.36 24.9 C 108 LTR 0.58 26.6 C 129Westbound LTR 0.46 2.7 A 13 LTR 0.42 2.9 A 24Northbound L 0.63 72.7 E 112 L 0.75 68.3 E 203
TR 0.65 26.8 C 326 TR 0.30 19.7 B 142Southbound L 0.41 42.3 D 80 L 0.69 728.4 F 94
TR 0.35 7.9 A 35 TR 0.99 39.3 D 61118.1 B 50.0 D
South Shore Dr & 67th St
Eastbound L 0.08 39.2 D 51 L 0.05 38.8 D 38R 0.21 41.6 D 92 R 0.29 43.1 D 135
Northbound L 0.26 7.9 A 48 L 0.51 18.6 A 48T 0.67 13.6 B 458 T 0.36 9.1 A 186
Southbound TR 0.32 12.9 B 177 TR 0.74 20.4 C 57714.3 B 17.8 B
Jeffery Ave/Lake Shore Dr & Marquette Dr
Eastbound LT 0.55 48.5 D 124 LT 0.53 31.2 C 177R 0.28 43.8 D 96 R 0.56 34.7 C 201
Westbound LT 0.50 48.3 D 144 LT 0.42 45.0 D 196R 0.88 15.5 B 125 R 0.34 5.9 A 105
Northbound L 0.49 50.2 D 105 L 0.46 52.5 D 91TR 0.85 33.2 C 462 TR 0.51 30.4 C 196
Southbound L 0.47 14.3 B 81 L 0.81 30.0 C 462TR 0.22 7.7 A 37 TR 0.33 9.8 A 164
23.7 C 23.7 C
Stony Island Ave & 63rd Street/Hayes Dr
Eastbound L 0.43 37.0 D 101 L 0.17 29.2 C 58T 0.47 33.7 C 213 T 0.43 32.8 C 208R 0.28 8.0 A 46 R 0.35 6.0 A 55
Westbound L 0.22 24.6 C 38 L 0.16 21.4 C 34T 0.50 26.8 C 138 T 0.31 22.0 C 109R 0.12 5.6 A 4 R 0.07 5.3 A 11
Northbound L 0.32 11.9 B 91 L 0.19 10.7 B 44TR 0.35 10.6 B 136 TR 0.20 9.0 A 80
Southbound L 0.15 8.6 A 38 L 0.11 6.0 A 25TR 0.19 5.9 A 64 TR 0.34 7.3 A 134
16.0 B 12.9 B
20
Intersection Intersection
15
Intersection Intersection
19
Intersection Intersection
3
Intersection Intersection
Table 3-3: 2016 Existing ConditionsCapacity Analysis Results - Signalized Intersections
Syn
chro
N
od
e #
Intersection & Approach
Weekday AM Peak Hour Weekday PM Peak Hour
6
Intersection Intersection
13
Intersection Intersection

Lane Group
v/c Ratio
Delay (sec)
LOSQueue Length
(ft)
Lane Group
v/c Ratio
Delay (sec)
LOSQueue Length
(ft)
Jeffery Ave & 67th St
Eastbound L 0.96 98.4 F 183 L 0.31 35.6 D 67TR 0.36 33.0 C 76 TR 0.52 39.2 D 104
Westbound L 0.19 31.3 C 44 L 0.12 31.5 C 35TR 0.70 28.4 C 105 TR 0.50 30.5 C 77
Northbound L 0.15 5.7 A 32 L 0.22 5.5 A 36TR 0.40 10.7 B 206 TR 0.21 10.2 B 108
Southbound L 0.15 2.4 A 14 L 0.22 4.3 A 44TR 0.25 2.9 A 38 TR 0.40 9.3 A 144
Intersection 19.5 B Intersection 15.5 B
Cornell Dr & Hayes Dr
Eastbound LTR 0.49 23.5 C 84 LTR 0.40 18.4 B 56Westbound LT 0.24 31.0 C 95 LT 0.17 30.2 C 69
R 0.23 17.2 B 91 R 0.18 3.5 A 34Northbound L 0.12 5.6 A 0 L 0.25 13.3 B 39
T 0.67 7.8 A 197 T 0.27 6.9 A 59R 0.28 1.6 A 35 R 0.08 1.7 A 0
Southbound L 0.45 12.2 B 52 L 0.65 10.5 B 143TR 0.18 4.5 A 71 TR 0.53 9.1 A 95
Intersection 10.5 B Intersection 10.5 B
Cornell Dr & S. Midway Plaisance
Eastbound L 0.36 17.2 B 52 L 0.51 9.4 A 27R 0.13 0.6 A 2 R 0.56 7.5 A 19
Northbound T 0.70 5.6 A 107 T 0.31 4.4 A 58Southbound T 0.18 5.0 A 50 T 0.56 6.9 A 139
Intersection 6.7 A Intersection 6.8 A
MSI Drop Off/Hyde Park Blvd & 57th Drive
Eastbound L 1.16 135.1 F 255 L 0.80 50.7 D 134TR 0.66 6.8 A 174 TR 0.55 12.8 B 178
Westbound L 0.08 4.8 A 5 L 0.01 4.4 A 1TR 0.81 21.9 C 487 TR 0.79 19.7 B 451
Southbound LT 0.58 44.8 D 206 LT 0.72 50.9 D 281R 0.39 21.9 C 131 R 0.52 26.2 C 190
Intersection 24.4 C Intersection 22.0 C
Stony Island Ave & N. Midway Plaisance
Westbound LTR 0.81 61.5 E 460 LTR 0.33 28.1 C 141Northbound LT 0.60 4.5 A 26 LT 0.31 2.4 A 18Southbound TR 0.37 3.5 A 13 TR 0.36 2.5 A 13
Intersection 31.2 C Intersection 8.7 A
Stony Island Ave & S. Midway Plaisance
Eastbound LTR 0.41 31.2 C 162 LTR 0.94 53.1 D 463Northbound TR 0.44 2.9 A 16 TR 0.31 4.4 A 39Southbound LT 0.38 4.8 A 38 LT 0.41 2.7 A 20
Intersection 10.8 B Intersection 26.0 C
Stony Island Ave & Cornell Dr1
Southwestbound LR 0.20 4.8 A 22 LR 0.66 9.7 A 203Northbound T 0.61 8.7 A 105 T 0.36 16.5 B 195Southbound T 0.17 18.7 B 70 T 0.36 23.8 C 151
Intersection 10.1 B Intersection 14.8 B
Cornell Dr & 67th St
Eastbound LT 0.21 2.5 A 5 LT 0.60 19.5 B 91Westbound TR 0.42 30.4 C 156 TR 0.39 31.7 C 151Northbound LTR 0.74 28.2 C 379 LTR 0.28 18.0 B 117
Intersection 25.9 C Intersection 22.3 C
Stony Island Ave & Marquette Dr
Eastbound L 0.13 31.3 C 51 L 0.08 30.4 C 36TR 0.50 34.9 C 203 TR 0.47 28.5 C 170
Westbound L 0.16 15.8 B 15 L 0.32 15.5 B 42TR 0.11 7.7 A 15 TR 0.11 7.0 A 5
Northbound L 0.39 11.4 B 58 L 0.51 40.5 D 73TR 0.43 5.0 A 72 TR 0.23 4.1 A 41
Southbound L 0.06 5.1 A 11 L 0.06 2.4 A 4TR 0.29 13.2 B 120 TR 0.73 13.4 B 393
Intersection 12.4 B Intersection 13.7 B
58
56
31
27
38
44
41
54
23
Syn
chro
N
od
e #
Intersection & Approach
Weekday AM Peak Hour Weekday PM Peak Hour

Lane Group
v/c Ratio
Delay (sec)
LOSQueue Length
(ft)
Lane Group
v/c Ratio
Delay (sec)
LOSQueue Length
(ft)
Cornell Dr & Marquette Dr
Eastbound LT 0.35 11.5 B 41 LT 0.26 19.2 B 73Westbound TR 0.10 21.6 C 40 TR 0.14 26.8 C 57Northbound LTR 0.50 6.0 A 116 LTR 0.19 3.5 A 30
Intersection 7.4 A Intersection 9.7 A
Marquette and Richards (East Intersection)
Eastbound LT 0.16 27.0 C 68 LT 0.16 27.0 C 68Westbound T 0.09 6.4 A 9 T 0.10 12.2 B 36
R 0.13 0.2 A 0 R 0.12 0.2 A 0Southeastbound LR 0.15 7.2 A 64 LR 0.47 17.2 B 236
Intersection 9.9 A Intersection 15.1 B
Marquette & Richards (North Intersection)
Northbound TR 0.03 2.1 A 5 TR 0.03 11.6 B 10Southbound L 0.13 0.4 A 0 L 0.37 0.9 A 0
T 0.01 0.0 A 0 T 0.02 0.0 A 0Northwestbound LR 0.19 0.4 A 0 LR 0.19 1.8 A 23
Intersection 0.5 A Intersection 1.3 A
Marquette & Richards (West Intersection)
Eastbound L 0.33 12.4 B 23 L 0.14 6.5 A 9T 0.12 3.0 A 28 T 0.13 3.7 A 33
Westbound TR 0.14 22.8 C 33 TR 0.13 21.1 C 34Southbound R 0.01 0.0 A 0 R 0.03 0.1 A 0
Intersection 10.0 B Intersection 8.7 A
Stony Island Ave & 59th St
Eastbound LR 0.09 20.4 C 27 LR 0.15 28.1 C 47Northbound LT 0.51 5.9 A 50 LT 0.20 1.9 A 14Southbound TR 0.58 32.0 C 264 TR 0.40 12.3 B 120
Intersection 19.1 B Intersection 8.9 A
Stony Island Ave & 60th St
Eastbound LR 0.27 23.0 C 52 LR 0.50 37.2 D 127Northbound LT 0.58 16.6 B 273 LT 0.33 13.4 B 151Southbound TR 0.22 1.0 A 2 TR 0.29 2.9 A 40
Intersection 11.2 B Intersection 10.3 B
Stony Island Ave & 57th Street
Eastbound LT 0.51 46.0 D 159 LT 0.64 106.7 F 265Westbound L 0.60 43.6 D 228 L 0.25 31.8 C 54
R 0.23 10.5 B 51 R 0.15 8.9 A 26Northbound TR 0.67 22.3 C 475 TR 0.45 31.6 C 325Southbound L 0.25 19.1 B 52 L 0.26 15.9 B 78
T 0.32 17.7 B 164 T 0.43 17.0 B 242Intersection 25.0 C Intersection 36.4 D
Cornell Dr/57th Drive & 57th Street/MSI Garage
Eastbound LTR 0.93 58.0 E 282 LTR 1.35 199.6 F 582Westbound LT 0.03 34.4 C 13 LT 0.24 36.1 D 73
R 0.01 0.6 A 0 R 0.10 4.9 A 18Northbound L 1.07 115.4 F 163 L 0.83 89.0 F 125
TR 0.73 9.1 A 354 TR 0.47 15.5 B 273Southbound L 0.25 9.2 A 9 L 0.00 0.0 A 0
TR 0.67 5.1 A 166 TR 0.77 7.3 A 215Intersection 14.5 B Intersection 36.5 D
Lake Shore Dr & Hayes Dr
Eastbound L 0.55 36.8 D 168 L 0.62 69.0 E 117TR 0.08 30.0 C 34 TR 0.66 85.2 F 151
Westbound L 0.00 0.0 A 0 L 0.07 59.6 E 18TR 0.02 39.2 D 14 TR 0.16 40.9 D 36
Northbound L 0.16 10.0 B 17 L 0.42 64.3 E 104TR 0.69 12.9 B 723 TR 0.27 3.7 A 145
Southbound L 0.02 8.0 A 6 L 0.07 55.8 E 26TR 0.57 17.4 B 448 TR 0.78 14.2 B 712
Intersection 16.8 B Intersection 16.2 BNotes: L = Left Turn, T= Through, R = Right Turn, DefL = Defacto Left Turn; LOS = Level of Service.Analysis Conducted in Synchro Version 10.1.2.20
76
74
78
83
81
59
70
64
71
Syn
chro
N
od
e #
Intersection & Approach
Weekday AM Peak Hour Weekday PM Peak Hour

Lane Group
v/c Ratio
Delay (sec)
LOSQueue Length
(ft)
Lane Group
v/c Ratio
Delay (sec)
LOSQueue Length
(ft)
MSI Drop Off/Everett Ave & 57th Drive (TWSC)
Northbound LTR 3.74 Err F Err LTR 1.21 306.6 F 147.0
Hayes & Richards (West Intersection) (TWSC)
Eastbound T TWestbound T TNorthbound L L
Hayes & Richards (South Intersection) (AWSC)
Northbound T 0.27 8.2 A - T 0.24 8.3 A -R 0.04 5.9 A - R 0.03 6.2 A -
Southbound LT 0.20 8.4 A - LT 0.68 15.9 C -Southwestbound LR 0.02 8.1 A - LR 0.04 9.0 A -
8.1 A 13.7 A
Stony Island Ave & 64th St (AWSC)
Eastbound LR 0.23 11.3 B - LR 0.23 11.1 B -Northbound L 0.29 10.2 B - L 0.08 8.5 A -
T 1.25 141.5 F - T 0.74 21.5 C -Southbound T 0.67 19.1 C - T 1.27 152.3 F -
R 0.09 8.0 A - R 0.07 7.0 A -79.8 F 90.3 F
East End Ave & 67th St (AWSC)
Eastbound T 0.27 9.5 A - T 0.38 10.2 B -Westbound T 0.44 11.1 B - T 0.42 10.7 B -Northbound LR 0.13 9.1 A - LR 0.10 9.0 A -
10.3 B 10.3 B
Cregier Ave & 67th St (AWSC)
Eastbound T 0.31 9.8 A - T 0.37 10.1 B -Westbound T 0.41 10.7 B - T 0.43 10.8 B -Northbound LR 0.13 9.0 A - LR 0.12 9.0 A -
10.1 B 10.3 B
Bennett Ave & 67th St (TWSC)
Northbound LR 0.16 11.6 B 14.0 LR 0.09 12.0 B 7.0Notes: L = Left Turn, T= Through, R = Right Turn, DefL = Defacto Left Turn, LOS = Level of Service(AWSC) = All-Way Stop Control, (TWSC) = Two-Way Stop Control, Err = Delay > 999.9 secAnalysis Conducted in Synchro Version 10.1.2.20
32
92
Intersection Intersection
90
88
82
69
51Stop sign configuration cannot be
analyzed using HCM methodology.Stop sign configuration cannot be
analyzed using HCM methodology.
Intersection Intersection
Intersection Intersection
Intersection Intersection
Table 3-4: 2016 Existing ConditionsCapacity Analysis Results - Unsignalized Intersections
Weekday PM Peak Hour
Syn
chro
N
od
e #
Intersection & Approach
Weekday AM Peak Hour

Jackson Park Revitalization Traffic Impact Study Final Report – February 2018 4-7
Cornell Drive/57th Drive and 57th Street/MSI Garage Driveway
The EB approach operates at LOS E during the AM peak hour and at LOS F during the PM peak hour.
The NB left-turn movement operates at LOS F during the AM and PM peak hours.
Lake Shore Drive and Hayes Drive
The EB left-turn movement operates at LOS E during the PM peak hour. The EB shared through/right movement operates at LOS F during the PM peak hour. The WB left-turn movement operates at LOS E during the PM peak hour. The NB left-turn movement operates at LOS E during the PM peak hour. The SB left-turn movement operates at LOS E during the PM peak hour.
Unsignalized intersections with lane groups that operate at LOS E or LOS F include the following:
57th Drive and Everett Avenue/MSI Driveway
The NB approach operates at LOS F during the AM and PM peak hours.
Stony Island Avenue and 64th Street
The NB through movement operates at LOS F during the AM peak hour. The SB through movement operates at LOS F during the PM peak hour.
4.3 2040 No Build Conditions
Table 4-5 and Table 4-6 presents the 2040 No Build Conditions traffic analysis results for the signalized and unsignalized study intersections, respectively. Based on the analysis results, the majority of the approaches/lane groups would operate at the same LOS as in the existing conditions.
At the following two locations, the increase in traffic volumes due to traffic growth between the Existing and No Build conditions would result in a change in LOS beyond LOS D:
Stony Island Avenue and North Midway Plaisance
The WB approach would degrade from LOS E to LOS F during the AM peak hour.
Stony Island Avenue and South Midway Plaisance
The EB approach would degrade from LOS D to LOS F during the PM peak hour.

Lane Group
v/c Ratio
Delay (sec)
LOSQueue Length
(ft)
Lane Group
v/c Ratio
Delay (sec)
LOSQueue Length
(ft)
Lake Shore Dr & 57th Drive
Eastbound L 0.85 30.1 C 339 L 0.91 38.0 D 345R 0.09 3.7 A 8 R 0.31 24.3 C 88
Northbound L 0.50 47.1 D 133 L 0.14 10.3 B 7T 1.00 36.1 D 821 T 0.41 7.6 A 173
Southbound T 0.82 33.4 C 456 T 0.86 19.6 B 631R 1.05 39.9 D 372 R 1.00 25.6 C 267
35.1 D 22.6 C
Lake Shore Dr & Science Dr
Eastbound L 0.03 43.6 D 15 L 0.16 45.7 D 44R 0.02 20.2 C 10 R 0.09 29.4 C 30
Northbound L 0.04 45.4 D 15 L 0.04 45.4 D 15T 0.61 2.6 A 261 T 0.29 1.8 A 76
Southbound T 0.38 3.6 A 175 T 0.71 7.3 A 353R 0.00 0.0 A 0 R 0.01 0.9 A 1
3.0 A 5.7 A
Stony Island Ave & 67th St
Eastbound LTR 0.37 25.2 C 111 LTR 0.59 27.1 C 133Westbound LTR 0.48 2.9 A 15 LTR 0.43 3.1 A 26Northbound L 0.65 74.3 E 117 L 0.77 70.3 E 209
TR 0.68 27.6 C 346 TR 0.31 19.8 B 147Southbound L 0.41 42.7 D 82 L 0.71 728.1 F 93
TR 0.35 7.9 A 36 TR 1.02 46.4 D 64418.6 B 54.6 D
South Shore Dr & 67th St
Eastbound L 0.08 39.2 D 51 L 0.05 38.8 D 38R 0.21 41.7 D 94 R 0.30 43.2 D 137
Northbound L 0.27 8.0 A 49 L 0.55 22.9 C 59T 0.69 14.1 B 481 T 0.37 9.2 A 192
Southbound TR 0.33 13.0 B 182 TR 0.76 21.1 C 60714.6 B 18.2 B
Jeffery Ave/Lake Shore Dr & Marquette Dr
Eastbound LT 0.56 48.3 D 126 LT 0.54 31.2 C 181R 0.28 43.5 D 98 R 0.57 34.6 C 205
Westbound LT 0.52 47.6 D 145 LT 0.42 45.1 D 200R 0.90 16.4 B 139 R 0.35 5.9 A 107
Northbound L 0.50 50.9 D 107 L 0.47 52.6 D 94TR 0.88 34.9 C 479 TR 0.53 31.1 C 201
Southbound L 0.48 14.2 B 83 L 0.83 31.0 C 514TR 0.23 7.6 A 40 TR 0.34 9.9 A 168
24.4 C 24.1 C
Stony Island Ave & 63rd Street/Hayes Dr
Eastbound L 0.46 38.4 D 104 L 0.17 29.4 C 60T 0.48 33.9 C 218 T 0.45 33.3 C 218R 0.29 8.4 A 48 R 0.40 8.5 A 78
Westbound L 0.23 24.7 C 39 L 0.17 21.4 C 34T 0.52 27.0 C 142 T 0.32 22.0 C 112R 0.12 5.5 A 4 R 0.07 5.2 A 11
Northbound L 0.37 12.8 B 108 L 0.21 11.0 B 48TR 0.36 10.7 B 140 TR 0.20 9.1 A 82
Southbound L 0.15 8.9 A 39 L 0.12 6.0 A 25TR 0.19 6.1 A 68 TR 0.35 7.5 A 140
16.3 B 13.3 B
20
Intersection Intersection
15
Intersection Intersection
19
Intersection Intersection
Table 3-5: 2040 No Build ConditionCapacity Analysis Results - Signalized Intersections
Syn
chro
N
od
e #
Intersection & Approach
Weekday AM Peak Hour Weekday PM Peak Hour
3
Intersection Intersection
6
Intersection Intersection
13
Intersection Intersection

Lane Group
v/c Ratio
Delay (sec)
LOSQueue Length
(ft)
Lane Group
v/c Ratio
Delay (sec)
LOSQueue Length
(ft)
Jeffery Ave & 67th St
Eastbound L 0.98 103.0 F 188 L 0.32 35.6 D 68TR 0.36 32.8 C 77 TR 0.53 39.3 D 106
Westbound L 0.19 31.0 C 44 L 0.13 31.4 C 36TR 0.71 29.4 C 110 TR 0.50 30.3 C 78
Northbound L 0.15 5.9 A 33 L 0.23 5.6 A 37TR 0.41 11.1 B 215 TR 0.22 10.4 B 112
Southbound L 0.16 2.6 A 13 L 0.23 4.4 A 45TR 0.25 3.0 A 39 TR 0.41 9.4 A 147
Intersection 20.1 C Intersection 15.6 B
Cornell Dr & Hayes Dr
Eastbound LTR 0.51 23.9 C 88 LTR 0.41 18.1 B 57Westbound LT 0.25 31.2 C 100 LT 0.18 30.3 C 71
R 0.23 17.8 B 94 R 0.19 3.5 A 35Northbound L 0.12 5.7 A 0 L 0.28 15.0 B 39
T 0.68 8.0 A 212 T 0.28 6.9 A 61R 0.29 1.7 A 42 R 0.08 1.7 A 0
Southbound L 0.48 13.6 B 56 L 0.67 11.0 B 147TR 0.18 4.6 A 78 TR 0.55 9.2 A 0
Intersection 10.9 B Intersection 10.6 B
Cornell Dr & S. Midway Plaisance
Eastbound L 0.40 16.8 B 54 L 0.64 8.8 A 27R 0.13 0.4 A 0 R 0.57 6.4 A 15
Northbound T 0.72 5.8 A 111 T 0.31 4.4 A 60Southbound T 0.18 5.1 A 56 T 0.58 7.2 A 140
Intersection 6.9 A Intersection 6.8 A
MSI Drop Off/Hyde Park Blvd & 57th Drive
Eastbound L 1.25 172.2 F 264 L 0.83 53.9 D 149TR 0.69 7.6 A 198 TR 0.61 15.0 B 212
Westbound L 0.09 4.8 A 4 L 0.02 4.4 A 1TR 0.88 23.6 C 494 TR 0.82 20.3 C 451
Southbound LT 0.59 45.2 D 210 LT 0.74 51.9 D 290R 0.40 22.2 C 135 R 0.53 26.6 C 195
Intersection 27.5 C Intersection 23.0 C
Stony Island Ave & N. Midway Plaisance
Westbound LTR 0.91 93.6 F 543 LTR 0.36 29.1 C 153Northbound LT 0.61 4.7 A 27 LT 0.32 2.3 A 18Southbound TR 0.38 3.5 A 13 TR 0.37 2.5 A 13
Intersection 48.4 D Intersection 9.2 A
Stony Island Ave & S. Midway Plaisance
Eastbound LTR 0.45 31.8 C 177 LTR 1.06 81.6 F 561Northbound TR 0.45 3.0 A 16 TR 0.31 4.4 A 40Southbound LT 0.40 5.0 A 43 LT 0.42 2.7 A 21
Intersection 11.3 B Intersection 40.9 D
Stony Island Ave & Cornell Dr1
Southwestbound LR 0.20 4.8 A 23 LR 0.68 10.7 B 210Northbound T 0.64 9.0 A 114 T 0.37 16.6 B 202Southbound T 0.17 18.7 B 71 T 0.38 24.1 C 159
Intersection 10.2 B Intersection 15.5 B
Cornell Dr & 67th St
Eastbound LT 0.21 2.5 A 5 LT 0.61 19.7 B 95Westbound TR 0.43 30.6 C 160 TR 0.39 32.0 C 154Northbound LTR 0.76 28.8 C 392 LTR 0.29 18.1 B 120
Intersection 26.3 C Intersection 22.5 C
Stony Island Ave & Marquette Dr
Eastbound L 0.13 31.4 C 52 L 0.08 30.5 C 36TR 0.52 35.3 D 208 TR 0.48 28.8 C 174
Westbound L 0.17 16.2 B 15 L 0.33 15.9 B 43TR 0.11 7.7 A 16 TR 0.12 7.0 A 6
Northbound L 0.41 12.3 B 58 L 0.52 41.8 D 75TR 0.45 5.0 A 75 TR 0.24 4.1 A 41
Southbound L 0.06 5.2 A 11 L 0.07 2.4 A 4TR 0.30 13.3 B 124 TR 0.76 14.3 B 410
Intersection 12.5 B Intersection 14.4 B
58
56
44
41
54
31
27
38
23
Syn
chro
N
od
e #
Intersection & Approach
Weekday AM Peak Hour Weekday PM Peak Hour

Lane Group
v/c Ratio
Delay (sec)
LOSQueue Length
(ft)
Lane Group
v/c Ratio
Delay (sec)
LOSQueue Length
(ft)
Cornell Dr & Marquette Dr
Eastbound LT 0.36 11.4 B 41 LT 0.27 19.4 B 76Westbound TR 0.10 21.7 C 40 TR 0.14 26.9 C 58Northbound LTR 0.51 6.4 A 127 LTR 0.20 3.5 A 30
Intersection 7.7 A Intersection 9.8 A
Marquette and Richards (East Intersection)
Eastbound LT 0.17 27.0 C 69 LT 0.16 27.0 C 69Westbound T 0.09 7.3 A 12 T 0.10 12.1 B 38
R 0.14 0.2 A 0 R 0.12 0.2 A 0Southeastbound LR 0.15 7.2 A 67 LR 0.49 18.5 B 247
Intersection 10.0 A Intersection 15.9 B
Marquette & Richards (North Intersection)
Northbound TR 0.03 2.1 A 5 TR 0.03 11.6 B 10Southbound L 0.14 0.4 A 0 L 0.39 1.0 A 0
T 0.01 0.0 A 0 T 0.02 0.0 A 0Northwestbound LR 0.19 0.4 A 0 LR 0.14 0.2 A 0
Intersection 0.5 A Intersection 1.0 A
Marquette & Richards (West Intersection)
Eastbound L 0.34 12.8 B 24 L 0.14 6.5 A 9T 0.12 3.0 A 29 T 0.13 3.7 A 34
Westbound TR 0.14 22.9 C 34 TR 0.14 21.2 C 36Southbound R 0.01 0.0 A 0 R 0.03 0.1 A 0
Intersection 10.1 B Intersection 9.0 A
Stony Island Ave & 59th St
Eastbound LR 0.09 20.4 C 27 LR 0.15 28.4 C 48Northbound LT 0.52 6.1 A 51 LT 0.21 2.0 A 15Southbound TR 0.60 32.2 C 271 TR 0.41 12.3 B 123
Intersection 19.3 B Intersection 8.9 A
Stony Island Ave & 60th St
Eastbound LR 0.27 22.8 C 52 LR 0.52 38.0 D 130Northbound LT 0.60 16.9 B 282 LT 0.34 13.5 B 156Southbound TR 0.23 1.0 A 4 TR 0.30 2.9 A 41
Intersection 11.2 B Intersection 10.4 B
Stony Island Ave & 57th Street
Eastbound LT 0.52 46.4 D 163 LT 0.66 107.7 F 272Westbound L 0.62 43.1 D 221 L 0.26 32.2 C 53
R 0.23 10.3 B 38 R 0.16 8.7 A 23Northbound TR 0.68 22.8 C 487 TR 0.46 31.8 C 332Southbound L 0.26 19.5 B 54 L 0.27 16.1 B 80
T 0.33 17.9 B 168 T 0.44 17.2 B 249Intersection 25.2 C Intersection 36.7 D
Cornell Dr/57th Drive & 57th Street/MSI Garage
Eastbound LTR 0.95 62.1 E 295 LTR 1.39 217.1 F 597Westbound LT 0.03 34.4 C 13 LT 0.25 36.2 D 73
R 0.01 0.6 A 0 R 0.10 8.5 A 25Northbound L 1.42 248.6 F 193 L 0.88 100.2 F 113
TR 0.76 10.2 B 397 TR 0.53 16.2 B 290Southbound L 0.27 12.6 B 10 L 0.00 0.0 A 0
TR 0.73 5.9 A 204 TR 0.80 7.8 A 241Intersection 20.1 C Intersection 38.7 D
Lake Shore Dr & Hayes Dr
Eastbound L 0.55 36.4 D 173 L 0.63 69.6 E 121TR 0.08 29.7 C 39 TR 0.67 85.9 F 153
Westbound L 0.00 0.0 A 0 L 0.07 59.6 E 18TR 0.02 39.2 D 14 TR 0.16 40.9 D 36
Northbound L 0.17 11.2 B 17 L 0.43 64.7 E 107TR 0.72 13.5 B 751 TR 0.28 3.7 A 149
Southbound L 0.02 8.2 A 6 L 0.07 55.8 E 26TR 0.59 18.1 B 494 TR 0.80 14.9 B 755
Intersection 17.3 B Intersection 16.7 BNotes: L = Left Turn, T= Through, R = Right Turn, DefL = Defacto Left Turn; LOS = Level of Service.Analysis Conducted in Synchro Version 10.1.2.20
83
81
78
70
64
71
76
59
Weekday PM Peak Hour
74
Syn
chro
N
od
e #
Intersection & Approach
Weekday AM Peak Hour

Lane Group
v/c Ratio
Delay (sec)
LOSQueue Length
(ft)
Lane Group
v/c Ratio
Delay (sec)
LOSQueue Length
(ft)
MSI Drop Off/Everett Ave & 57th Drive (TWSC)
Northbound LTR 5.85 Err F Err LTR 1.77 587.5 F 184.0
Hayes & Richards (West Intersection) (AWSC)
Eastbound T TWestbound T TNorthbound L L
Hayes & Richards (South Intersection) (AWSC)
Northbound T 0.29 8.3 A - T 0.25 8.4 A -R 0.04 5.9 A - R 0.03 6.2 A -
Southbound LT 0.20 8.4 A - LT 0.69 16.5 C -Southwestbound LR 0.02 8.2 A - LR 0.05 9.1 A -
8.1 A 14.1 A
Stony Island Ave & 64th St (AWSC)
Eastbound LR 0.24 11.4 B - LR 0.24 11.2 B -Northbound L 0.29 10.4 B - L 0.08 8.5 A -
T 1.32 171.1 F - T 0.76 23.3 C -Southbound T 0.69 20.1 C - T 1.34 181.5 F -
R 0.09 8.0 A - R 0.07 7.0 A -96.4 F 107.5 F
Stony Island Ave & 65th St (TWSC)
Eastbound L 0.01 14.9 B 1.0 L 0.07 30.1 D 5.0R 0.01 9.8 A 1.0 R 0.01 11.8 B 1.0
Northbound LT 0.02 0.6 A 1.0 LT 0.03 1.3 A 2.0
East End Ave & 67th St (AWSC)
Eastbound T 0.28 9.6 A - T 0.39 10.3 B -Westbound T 0.45 11.3 B - T 0.44 10.8 B -Northbound LR 0.13 9.2 A - LR 0.10 9.1 A -
10.5 B 10.5 B
Cregier Ave & 67th St (AWSC)
Eastbound T 0.32 9.9 A - T 0.38 10.2 B -Westbound T 0.42 10.9 B - T 0.45 11.0 B -Northbound LR 0.13 9.0 A - LR 0.12 9.1 A -
10.3 B 10.5 B
Bennett Ave & 67th St (TWSC)
Northbound LR 0.17 11.7 B 15.0 LR 0.09 12.1 B 7.0Notes: L = Left Turn, T= Through, R = Right Turn, DefL = Defacto Left Turn, LOS = Level of Service(AWSC) = All-Way Stop Control, (TWSC) = Two-Way Stop Control, Err = Delay > 999.9 secAnalysis Conducted in Synchro Version 10.1.2.20
32
92
Intersection Intersection
90
88
85
82
69
Stop sign configuration cannot be analyzed using HCM methodology.
Stop sign configuration cannot be analyzed using HCM methodology.
Intersection Intersection
Intersection Intersection
51
Intersection Intersection
Intersection Intersection
Table 3-6: 2040 No Build ConditionCapacity Analysis Results - Unsignalized Intersections
Weekday PM Peak Hour
Syn
chro
No
de
#Intersection &
Approach
Weekday AM Peak Hour

Jackson Park Revitalization Traffic Impact Study Final Report – February 2018 4-12
4.4 Recommended Mitigation
Roadway and intersection improvements are recommended to offset projected traffic impacts associated with the proposed roadway closures. These improvements include modifications to intersection and roadway geometry, intersection traffic controls, and adjustments to traffic signal timings and phasing.
Figure 4-1 presents an overall key map showing where mitigation measures are proposed, and each location is described in further detail below.

Jackson Park Revitalization Traffic Impact Study Final Report – February 2018 4-13
Figure 4-1: Proposed Mitigation Measures

Jackson Park Revitalization Traffic Impact Study Final Report – February 2018 4-14
4.4.1 Lake Shore Drive Improvements The proposed closure of the segment of Cornell Drive north of Hayes Drive would divert a significant portion of that traffic to Lake Shore Drive. Currently, Lake Shore Drive provides three northbound travel lanes but only two southbound travel lanes through much of the study area. With the additional traffic on Lake Shore Drive as a result of the proposed roadway closure, it is anticipated that the two southbound lanes on Lake Shore Drive would be insufficient to maintain acceptable levels of service (LOS D or better) in the southbound direction during the PM peak hour. As such, it is recommended that Lake Shore Drive be modified to accommodate three NB lanes and three SB lanes between 57th Drive and Hayes Drive. The additional travel lane would be achieved primarily through widening Lake Shore Drive along the western curb line into Jackson Park.
Lake Shore Drive at 57th Drive
At the 57th Drive intersection (see Figure 4-2), the following modifications are proposed to provide three NB lanes and three SB lanes through the intersection without having to widen beyond the exiting curb-lines:
Realign the median on Lake Shore Drive along the NB and SB approaches to create the space for a third SB travel lane.
Modify the existing channelized island for the free flow SB right turn to accommodate the additional travel lane on Lake Shore Drive and to provide more separation between SB right turns and NB left turns.
South of 57th Drive, the center grass median on Lake Shore Drive would be removed and replaced with a narrow concrete barrier (see photo below), which would create the space for the third SB travel lane. This segment of Lake Shore Drive is approximately 71 feet wide curb-to-curb, which can accommodate six 11-foot travel lanes (three NB and three SB) and a 5-foot median.
Modify signal timings to reallocate green time from 57th Drive to Lake Shore Drive, since 57th Drive volumes would significantly decrease, and Lake Shore Drive volumes would significantly increase due to the proposed closure of Cornell Drive.
Specifically, the following modifications to the signal timing at the Lake Shore Drive/57th Drive intersection are proposed:
During the AM peak: o Remove EB right-turn overlap from NB lead phase o Reallocate 6 seconds of green time from the NB lead phase to the NB/SB phase o Reallocate 21 seconds of green time from the EB phase to the NB/SB phase o Modify offset from 26 seconds to 0 seconds
During the PM peak:
o Reallocate 3 seconds of green time from the EB phase to the NB/SB phase o Maintain existing NB left-turn prohibition during the PM peak period

Jackson Park Revitalization Traffic Impact Study Final Report – February 2018 4-15
Figure 4-2: Lake Shore Drive at 57th Drive, Third SB Lane
Relocated
median barrier
Relocated
median barrier
Modify
Channelized
Island
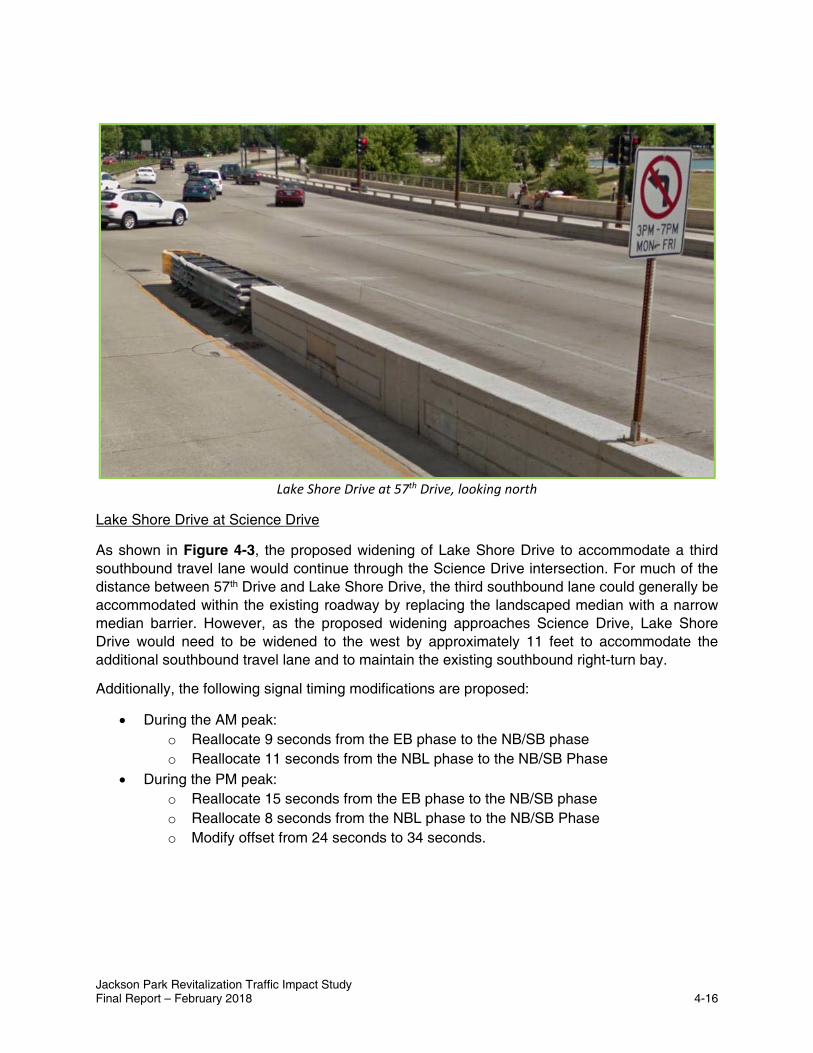
Jackson Park Revitalization Traffic Impact Study Final Report – February 2018 4-16
Lake Shore Drive at 57th Drive, looking north
Lake Shore Drive at Science Drive
As shown in Figure 4-3, the proposed widening of Lake Shore Drive to accommodate a third southbound travel lane would continue through the Science Drive intersection. For much of the distance between 57th Drive and Lake Shore Drive, the third southbound lane could generally be accommodated within the existing roadway by replacing the landscaped median with a narrow median barrier. However, as the proposed widening approaches Science Drive, Lake Shore Drive would need to be widened to the west by approximately 11 feet to accommodate the additional southbound travel lane and to maintain the existing southbound right-turn bay.
Additionally, the following signal timing modifications are proposed:
During the AM peak: o Reallocate 9 seconds from the EB phase to the NB/SB phase o Reallocate 11 seconds from the NBL phase to the NB/SB Phase
During the PM peak: o Reallocate 15 seconds from the EB phase to the NB/SB phase o Reallocate 8 seconds from the NBL phase to the NB/SB Phase o Modify offset from 24 seconds to 34 seconds.

Jackson Park Revitalization Traffic Impact Study Final Report – February 2018 4-17
Figure 4-3: Lake Shore Drive at Science Drive, Third SB Lane
Widen to provide
3 through lanes
and one right‐
turn lane
Widen to provide
3 SB lanes

Jackson Park Revitalization Traffic Impact Study Final Report – February 2018 4-18
Lake Shore Drive at 59thStreet Harbor Bridge (Figure 4-4)
Lake Shore Drive narrows as it crosses over the 59th Harbor Street Bridge where it is reduced from a 71-foot cross-section to a 60-foot cross-section. To provide a six-lane section over this segment of Lake Shore Drive, the bridge would need to be widened to the west.
Figure 4-4: Lake Shore Drive at 59th Street Harbor Bridge, Third SB Lane
Continue
widening to
provide 3 SB
lanes
Widen bridge to provide
an additional southbound
travel lane
Continue
widening to
provide 3 SB
lanes

Jackson Park Revitalization Traffic Impact Study Final Report – February 2018 4-19
Lake Shore Drive and Hayes Drive intersection (Figure 4-5)
At the Hayes Drive intersection with Lake Shore Drive, the following modifications are proposed:
Continue the widening of southbound Lake Shore Drive to maintain three SB travel lanes alongside the existing SB left-turn lane to the 63rd Street Beach Area. The rightmost SB lane would become a continuous-flow, exclusive right-turn lane at the intersection with Hayes Drive. Hayes Drive would also need to be widened west of the intersection to accept the channelized right-turn lane. This Lake Shore Drive widening would impact the pedestrian underpass structure north of Hayes Drive.
Widen the eastbound Hayes Drive approach to provide an exclusive right-turn lane and restripe the existing shared through/right lane to a shared left-turn/through lane.
Provide a new crosswalk across the south leg of the intersection to improve pedestrian connectivity across Lake Shore Drive and address an observed pedestrian desire path.
During the AM peak, the cycle length would be increased from 100 seconds to 105 seconds, while during the PM peak, the existing cycle length of 130 seconds would be maintained. The phase order would be as follows:
o Concurrent NB and SB lead left-turn phase on Lake Shore Drive; the EB right turn would overlap with the NB lead left turn
o NB and SB phase on Lake Shore Drive (left-turns prohibited during this phase), concurrent with east leg crosswalk
o EB Hayes Drive phase, concurrent with south leg crosswalk o WB Hayes Drive phase, concurrent with south leg crosswalk o Modify offset from 30 seconds to 38 seconds during the AM peak period and
from 0 seconds to 125 seconds during the PM peak period A seasonal timing plan with longer maximums for the NB/SB protected left turn and WB
phases during the summer months when the 63rd Street Beach Area is more active should be implemented.

Jackson Park Revitalization Traffic Impact Study Final Report – February 2018 4-20
Figure 4-5: Lake Shore Drive at Hayes Drive, Third SB Lane
Continue Widening to
provide 3 SB lanes
Impact to pedestrian
underpass structure
Continuous flow
right‐turn lane
Widen Hayes WB
New Crosswalk
Add EB RT Lane and
restripe for triple LT’s

Jackson Park Revitalization Traffic Impact Study Final Report – February 2018 4-21
4.4.2 Hayes Drive Improvements Hayes Drive would require an increase from two travel lanes to four travel lanes to accommodate the additional traffic resulting from the proposed roadway closures, as Hayes Drive would replace 57th Drive/Cornell Drive as the main connector roadway between Lake Shore Drive and Stony Island Avenue for accessing points south of Jackson Park. The additional traffic on Hayes Drive would be highly directional, with higher EB volumes during the AM peak hour and higher WB volumes during the PM peak hour. Hayes Drive between Richards Drive and Cornell Drive On-street parking is currently permitted along Hayes Drive between Richards Drive and Cornell Drive, which is used by park visitors as well as buses that are laying over between dropping off and picking up MSI visitor groups. Where parking is prohibited, Hayes Drive generally operates with four travel lanes (two in each direction). To provide additional roadway capacity along this section of Hayes Drive, on-street parking would be restricted along both sides of Hayes Drive to allow for a cross-section of one 10-foot inside lane and one 11-foot outside lane in each direction, plus a 6-foot median barrier. With the increase in traffic volumes and the horizontal curvature of Hayes Drive, the median will provide a physical separation of traffic that would help mitigate the risk of head-on collisions. Pedestrian underpasses are also recommended at various locations along Hayes Drive including the west leg of the Lake Shore Drive intersection and the west and south legs of the Cornell Drive intersection. These pedestrian underpasses would improve pedestrian and bicycle safety by providing grade-separated crossings across the higher-volume Hayes Drive and eliminate the potential conflicts with vehicular traffic.

Jackson Park Revitalization Traffic Impact Study Final Report – February 2018 4-22
Hayes Drive at Richards Drive (Figure 4-6)
The Hayes Drive and Richards Drive intersection is currently comprised of three separate stop-controlled intersections that form a triangle around the Statue of the Republic. With the increased traffic on Hayes Drive (due to the Cornell Drive closure) and Richards Drive (due to the proposed Marquette Drive closure), it is recommended that this cluster of intersections be consolidated into a single, signalized T-intersection.
Figure 4-6 – Hayes Drive and Richards Drive Mitigation
Richards Drive would be realigned to intersect Hayes Drive perpendicularly, and Hayes Drive would need to be widened by approximately 9 feet to the north over a short distance in order to provide a westbound left-turn lane and maintain a four-lane section along Hayes Drive. Despite the slight widening, the reconfiguration of the Hayes Drive and Richards Drive intersection would provide additional parkland by eliminating the west leg of the triangle of intersections and would also improve pedestrian access to the Statue by eliminating a roadway barrier.
A new traffic signal would be installed that would operate as a simple two-phase signal on the same 105-second cycle length as the other intersections to the west (73 seconds EB/WB and 32 seconds NB for both peak hours). A signal warrant analysis has been performed for this intersection (Table 4-7), which indicates that MUTCD “Warrant 2 - Four Hour Volumes” and “Warrant 3 - Peak Hour Volumes” would be met with 2022 traffic volumes.
New Traffic Signal

Jackson Park Revitalization Traffic Impact Study Final Report – February 2018 4-23
Table 4-7: Hayes Drive and Richard Drive Warrant Analysis
Start Time Major Approach (Hayes Dr) Minor Approach (Richards Dr) Warrant 2 Warrant 3
Morning Peak Period7:00 AM 1484 187 Warrant Met Warrant Met
8:00 AM 1054 133 Warrant Met Not Met
Midday Peak Period
11:00 AM 900 59 Not Met Not Met
12:00 PM 974 73 Not Met Not Met
Evening Peak Period
3:30 PM 1955 196 Warrant Met Warrant Met
4:30 PM 2076 172 Warrant Met Warrant Met
5:30 PM 1780 176 Warrant Met Warrant Met
Commuter Peak Hours (Not Included in "Independent Hours" below)
7:30 AM 1694 223 Warrant Met Warrant Met
4:00 PM 2150 182 Warrant Met Warrant Met
Total Independent Hours Met 5 4
Hours Needed for Warrant 4 1
Yes YesWarrant Condition Met
60 Minute Traffic VolumesHayes Drive with Richards Drive
2022 Build Projected Conditions2 Lane Major Street / 1 Lane Minor Street

Jackson Park Revitalization Traffic Impact Study Final Report – February 2018 4-24
Hayes Drive at Cornell Drive (Figure 4-7)
The removal of Cornell Drive north of Hayes Drive would allow for significant modifications to this intersection, which include converting it to a three-leg (“T”) intersection and realigning it to favor the higher volume movements between Hayes Drive and Cornell Drive.
The new intersection would have the following lane configurations:
The northbound Cornell Drive approach would provide an exclusive left-turn lane and two through lanes.
The westbound Hayes Drive approach would provide two through lanes and an exclusive right-turn lane.
The eastbound Hayes Drive approach would intersect as the third (minor) leg of the intersection and would provide an exclusive left-turn lane and a shared left/right-turn lane.
Pedestrian underpasses are proposed for the south and west legs of this intersection to improve safety by eliminating potential pedestrian-vehicle conflicts.
The signal would have a 105-cycle length during the AM and PM peak hours with the following phasing:
AM Peak: o 10-second protected NB lead phase for Cornell Drive o 55-second NB/SB phase (for Cornell Drive/Hayes Drive through movements) o 40-second EB phase for the minor Hayes Drive approach, with a SB right overlap o Offset of 74 seconds
PM Peak: o 10-second protected NB lead phase for Cornell Drive o 50-second NB/SB phase (for Cornell Drive/Hayes Drive through movements) o 45-second EB phase for the minor Hayes Drive approach, with a SB right overlap o Offset of 90 seconds

Jackson Park Revitalization Traffic Impact Study Final Report – February 2018 4‐25
Figure 4-7 – Hayes Drive and Cornell Drive Mitigation

Jackson Park Revitalization Traffic Impact Study Final Report – February 2018 4‐26
4.4.3 Stony Island Avenue Improvements Stony Island Avenue would require modifications to accommodate the additional traffic resulting from the proposed roadway closures and the increased traffic and curbside activity from the proposed OPC.
Stony Island Avenue between 59th Street and 60th Street (Figure 4-8)
The segment of Stony Island Avenue between 59th Street and 60th Street includes four closely spaced intersections. Currently, on-street parking is prohibited along this segment of Stony Island Avenue, which allows for four travel lanes (two in each direction).
With the removal of the short one-way EB segment of South Midway Plaisance between Stony Island Avenue and Cornell Drive, traffic traveling EB on South Midway Plaisance would need to either turn left or right onto Stony Island Avenue. Furthermore, the short one-way WB segment of North Midway Plaisance between Stony Island Avenue and Cornell Drive/57th Drive would need to be modified to accommodate two-way traffic to connect South Midway Plaisance EB traffic with 57th Drive to the north.
The following improvements are proposed:
Prohibit left turns in and out of 59th Street and 60th Street by installing a median barrier; this would also allow for the removal of the traffic signals at these two intersections.
Reconfigure the South Midway Plaisance intersection as a T-intersection due to the removal of South Midway Plaisance, east of Stony Island Avenue, and modify signal equipment as appropriate
Restripe the EB approach of South Midway Plaisance to provide two exclusive left-turn lanes and one right-turn lane. No widening would be required as the second left-turn lane would replace approximately 250 feet of parking along the north curb.
Restripe and widen Stony Island Avenue between South Midway Plaisance and North Midway Plaisance to provide one left-turn lane, one through lane, and two right-turn lanes in the northbound direction and two through lanes and a curbside parking lane in the southbound direction. A widening of approximately 23 feet to the east into Jackson Park would be required to accommodate the recommended cross-section.
Remove the “No Right Turn on Red” restriction for South Midway Plaisance EB traffic at Stony Island Avenue. Currently, this restriction is posted for weekdays from 7 AM to 7 PM.
Significant signal modifications (new and relocated equipment) would be required at both intersections to accommodate proposed geometric modifications and new turning movements.

Jackson Park Revitalization Traffic Impact Study Final Report – February 2018 4-27
Figure 4-8 – Stony Island Avenue at Midway Plaisance / 59th Street / 60th Street Mitigation

Jackson Park Revitalization Traffic Impact Study Final Report – February 2018 4-28
At the Stony Island Avenue/North Midway Plaisance intersection, the following timings and phasings are proposed:
o NB lead phase with protected left turn 24 seconds during AM peak 37 seconds during PM peak
o NB/SB phase 43 seconds during AM peak 39 seconds during PM peak
o WB phase including a 7-second split leading pedestrian interval (LPI) which would hold the WB left turn for 7 seconds but allow the WB through and right-turn movements to proceed 38 seconds during AM peak (including 7-second split LPI) 29 seconds during PM peak (including 7-second split LPI)
At the Stony Island Avenue/South Midway Plaisance intersection, the following timings and phasings are proposed:
o NB/SB phase 60 seconds during AM peak 50 seconds during PM peak
o EB phase 5-second LPI during the AM and PM peaks 40 seconds during AM peak 50 seconds during PM peak
Stony Island Avenue between 60th Street and 65th Street
Between 60th Street and 65th Street, Stony Island Avenue would be widened west into Jackson Park by approximately 17 to 19 feet to accommodate a wider cross-section that would include four travel lanes, on-street parking along both curbs, and a center landscaped median. The median would transition into left-turn lanes and would also provide pedestrian refuge islands at intersections.
Additionally, a northbound left-turn lane (approximately 50 feet of storage) would be provided at the intersection of 65th Street and Stony Island Avenue to accommodate left-turning traffic such that NB through traffic would not be impacted by vehicles waiting to turn left.
Stony Island Avenue at 63rd Street / Hayes Drive
At the Stony Island Avenue / 63rd Street / Hayes Drive intersection, the SB left-turn bay would be lengthened from 100 feet to approximately 250 feet. Additionally, the signal timing and phasing would be modified to provide a dual NB and SB left-turn lead phase by reducing the green time for the NB/SB approach. While not needed for mitigation, CDOT should consider upgrading the signal from pretimed to actuated so that phases can be skipped or shortened when traffic demand is lower.

Jackson Park Revitalization Traffic Impact Study Final Report – February 2018 4-29
Stony Island Avenue at 64th Street
The intersection of Stony Island Avenue at 64th Street is currently under all-way STOP control and already operates at LOS F for Stony Island Avenue in the peak direction. To mitigate increases in delay with the additional traffic on Stony Island Avenue, one option would be to convert the intersection from an all-way STOP to just having STOP control for the 64th Street approach; however, removing STOP control along Stony Island Avenue would require the removal of the north and south side crosswalks at this intersection. This would impact pedestrian access to Jackson Park and is not recommended.
Therefore, the proposed mitigation is to install a traffic signal at this location. As shown in Table 4-8, a signal would be warranted at this location based on MUTCD “Warrant 2 – Four Hour Volumes” and “Warrant 3 – Peak Hour Volumes.”
Table 4-8: Stony Island Avenue and 64th Street Warrant Analysis
The new signal would provide controlled crossings, which would provide a safety benefit for Mt. Carmel High School, which is adjacent to this intersection.
The new signal should match the existing cycle lengths along Stony Island Avenue (105 seconds) and be designed as a two-phase actuated signal with 83 seconds allocated to the NB/SB phase and 22 seconds allocated to the EB phase.
Start Time Major Approach (Stony Island Ave) Minor Approach (64th Street) Warrant 2 Warrant 3
Morning Peak Period7:00 AM 1532 117 Warrant Met Not Met
8:00 AM 888 39 Not Met Not Met
Midday Peak Period
11:00 AM 727 46 Not Met Not Met
12:00 PM 779 53 Not Met Not Met
Evening Peak Period
3:30 PM 1729 124 Warrant Met Warrant Met
4:30 PM 1741 83 Warrant Met Not Met
5:30 PM 1631 94 Warrant Met Not Met
Commuter Peak Hours (Not Included in "Independent Hours" below)
7:30 AM 1627 118 Warrant Met Not Met
4:00 PM 1829 128 Warrant Met Warrant Met
Total Independent Hours Met 4 1
Hours Needed for Warrant 4 1
Yes YesWarrant Condition Met
60 Minute Traffic VolumesStony Island Avenue with 64th Street
2022 Build Projected Conditions2 Lane Major Street / 1 Lane Minor Street

Jackson Park Revitalization Traffic Impact Study Final Report – February 2018 4-30
Stony Island Avenue at Marquette Drive
With the closure of Marquette Drive between Stony Island Avenue and Richards Drive, the Stony Island Avenue and Marquette Drive intersection would be converted to T-intersection through the removal of the east leg, and the signal equipment would need to be modified to accommodate the new geometry.
Stony Island Avenue / Cornell Drive between 68th Street and 65th Place (Figure 4-9)
The closely spaced Stony Island Avenue / 67th Street / Cornell Drive intersections operate under a single traffic signal controller. As part of the road closures the traffic currently using the northbound section of Cornell Drive would be diverted to northbound Stony Island Avenue. Therefore, Stony Island Avenue would need to be widened between 68th Street and 65th Place to accommodate this additional traffic.
The following is a summary of the recommended mitigation:
Widen Stony Island Avenue by up to 24 feet to the east into Jackson Park as shown in Figure 4-9.
Widen Southbound Cornell Drive by approximately 10 to 12 feet to accommodate northbound travel along this section.
Restripe the 67th Street EB approach at Stony Island Avenue to provide one left-turn bay and one shared through/right-turn lane.
Restripe the 67th Street WB approach at Stony Island Avenue to provide one-left-turn bay, one through lane, and one exclusive right-turn lane.
Lengthen the northbound and southbound left-turn lanes as follows: o The northbound left-turn lane should be lengthened to approximately 185 feet. o The southbound left-turn lane should be lengthened to approximately 215 feet.
Modify the signal timing and phasing at Stony Island Avenue and 67th Street: o Concurrent NB and SB lead left turns o NB/SB phase (with NB/SB left turns prohibited) o EB/WB phase (with EB/WB left turns permitted)
Modify signal timing at Stony Island Avenue and Cornell Drive: o During the AM peak, reallocate 5 seconds of green time from the WB phase to
the NB/SB phase.
Further study is required regarding the treatment and alignment of the pedestrian crossing across Cornell Drive (westbound leg) at its intersection with Stony Island Avenue.

Jackson Park Revitalization Traffic Impact Study Final Report – February 2018 4-31
Figure 4-9 – Stony Island Avenue between 68th Street and 65th Place/SB Cornell Mitigation

Jackson Park Revitalization Traffic Impact Study Final Report – February 2018 4-32
Additional Signal Timing Changes
In addition to the locations described above, the following minor signal timing and/or phasing changes are recommended at the following intersections:
North Midway Plaisance / 57th Drive / Cornell Drive / MSI Garage Access o Reallocate 6 seconds of green time from the NB/SB phase to the EB/WB phase
during both peak periods. 57th Drive / Hyde Park Boulevard / Museum Drive
o During the PM peak, reallocate 5 seconds of green time from the EB/WB phase to the SB phase.
67th Street / Jeffery Avenue o During the AM peak, reduce NB/SB phase by 4 seconds and reallocate 3
seconds of green time to the EB/WB lead left-turn phase and 1 second of green time to the EB/WB phase.
Lake Shore Drive / Marquette Drive / Jeffery Avenue o During the AM peak, change cycle length to 105 seconds. o During the PM peak, change cycle length to 130 seconds to match the new cycle
length for the Lake Shore Drive / Hayes Drive intersection. Potential Impacts to 67th Street Operations
Based on the previously outlined traffic reassignments, growth forecasts, and mitigation measures, the proposed street closures would have a negligible impact on 67th Street for the following reasons:
The current design of the roadway provides frequent all-way stop signs and parking on both sides of the street, making the roadway unattractive for cut-through traffic due to slow speeds and longer travel times compared to other east/west streets.
Per the CMAP traffic forecasts, the proposed closure of Cornell Drive would result in increased traffic volumes on Lake Shore Drive, Hayes Drive, Stony Island Avenue, and other parallel north/south corridors to the west. 67th Street traffic volumes would be unaffected. While the closure of Marquette Drive could increase traffic volumes on 67th Street, Marquette Drive currently carries relatively low traffic volumes, and the majority of those volumes would be diverted to the improved Hayes Drive segment to the north, which will progress traffic more effectively than 67th Street with the recommended mitigation.
Traffic operations along 67th Street are likely to improve over current conditions due to the elimination of the intersection of 67th Street with NB Cornell Drive, which would eliminate a traffic signal and simplify the traffic movements at 67th Street and Stony Island Avenue. Furthermore, the proposed EB and WB left-turn lanes for 67th Street at Stony Island Avenue would also help to reduce queuing and delays along 67th Street.
Pedestrian underpasses are proposed for South Shore Drive north of 67th Street and for Jeffery Drive between 67th Street and Marquette Drive; these underpasses will improve safety and traffic flow by eliminating pedestrian-vehicular conflicts.

Jackson Park Revitalization Traffic Impact Study Final Report – February 2018 4-33
4.4.4 Cornell Drive Improvements With the reduction in volume on Cornell Drive due to the closure of the street between North Midway Plaisance and Hayes Drive, the opportunity for a road diet along portions of Cornell Drive between Stony Island Avenue and 57th Street, as shown in Figure 4-10, is currently being explored. The road diet would convert the outside lanes from travel lanes into on-street parking lanes, thereby reducing the number of travel lanes from four lanes to two lanes (one lane in each direction) between intersections. The proposed reduction in travel lanes along this section would:
Calm traffic speeds to improve vehicular safety along a segment that CDOT has identified as having a history of speed-related crashes
Improve pedestrian safety by creating shorter pedestrian crossing distances; this includes the installation of a pedestrian refuge island at the existing midblock crosswalk, which is a desire line for pedestrians west of Cornell Drive walking to the Clarence Darrow Bridge, Wooded Island, and the Lakefront Trail, and volumes at the crosswalk are expected to increase in the future.
Provide an opportunity to offset some of the on-street parking loss that would occur along Hayes Drive.
As two travel lanes in each direction would be maintained at the signalized intersections along this section, intersection capacity would be unaffected. Approximately 200 feet south of the Cornell Drive and 57th Street intersection, the cross-section on Cornell Drive would transition to provide a 9-foot parking lane and 11-foot travel lane in each direction separated by a 10-foot painted median. The median would transition to a left-turn lane at intersections.
Figure 4-10 – Cornell Drive Road Diet Concept
The design presented was primarily developed from a traffic perspective. As design progresses, modifications could be made to this concept or portions of the concept to incorporate other design options in lieu of a full-lane reduction to achieve some or all of the desired safety goals, such as narrower lane widths and/or rush hour parking controls. However, the concept shown in Figure 4-10 represents a conservative assumption for traffic impact analysis purposes and is therefore the condition that was selected for inclusion in this traffic study.
N

Jackson Park Revitalization Traffic Impact Study Final Report – February 2018 4-34
4.4.5 Pedestrian and Bicycle Improvements Improving pedestrian and bicycle safety and circulation within and around Jackson Park is vital to supporting continued economic development in the surrounding neighborhoods. Therefore, it is a crucial part of the traffic mitigation package and site planning efforts, particularly as recreational and economic activity in the area is expected to increase with the opening of the OPC.
The pedestrian and bicycle improvements that are included in the traffic mitigation package or suggested as part of the OPC site or the South Lakefront Plan are as follows:
Close Cornell Drive to improve park connectivity for pedestrians and provide a way to travel between the OPC, MSI, and the lagoons that is free from vehicular conflicts.
Provide a separated north-south off-street bike facility through the OPC site. Provide an east-west separated off-street bike facility south of the OPC site and along
the north side of Hayes Drive to connect Stony Island Avenue with the existing shared use path along Hayes Drive.
Provide signage along the Lakefront Trail directing bicyclists to OPC and vice versa. Provide pedestrian refuge areas at crossing locations within the proposed raised median
along Stony Island Avenue to reduce crossing distances and calm traffic. Provide curb extensions framing the parking/loading lanes along Stony Island Avenue to
reduce crossing distances and slow down turning vehicles. Provide a pedestrian refuge island on Cornell Drive where travel lanes can be reduced
north of the Midway Plaisance. Provide a crosswalk and pedestrian phase across the south leg of Lake Shore Drive at
Hayes Drive to accommodate a desire path that results in jaywalking across Lake Shore Drive.
Provide crosswalks and pedestrian phases at the new signalized intersection at Hayes Drive and Richards Drive. This new intersection configuration reduces intersection/ paved area in the vicinity of the Statue the Republic and provides improved north-south pedestrian access within the park.
Provide continental-style striped crosswalks at all marked crossings. Provide pedestrian countdown signals at all new signalized intersections. Provide a pedestrian underpass on the west leg of Hayes Drive at Lake Shore Drive to
facilitate pedestrian movements and trail connectivity. Provide a pedestrian underpass on the west leg of Hayes Drive and the south leg of
Cornell Drive at the realigned intersection of Cornell Drive and Hayes Drive to facilitate pedestrian movements and trail connectivity.
Provide a pedestrian underpass along Jeffery Drive between 67th Street and Marquette Drive to improve safety and accommodate increased non-motorized activity.
Provide a pedestrian underpass under the north leg of South Shore Drive at 67th Street to improve safety and accommodate increased non-motorized activity.
Reconstruct the Clarence Darrow Bridge, which is expected to be completed before the end of 2019.

Jackson Park Revitalization Traffic Impact Study Final Report – February 2018 4-35
Additionally, pending further development of the golf course redevelopment plan, CDOT and the Park District will revisit the specific proposals for underpass locations identified in CDOT's Lakefront Protection Ordinance applications in the context of future pedestrian desire paths and confirm underpass locations and/or improved pedestrian connections across Hayes Drive.
4.5 2040 Build Conditions (with Mitigation)
The 2040 Build Conditions reflect future traffic conditions with the proposed street closures and incorporate the traffic volume pattern changes, the trip generation for the OPC site, and the mitigation measures described in the previous section. The 2040 Build Conditions are compared to the 2040 No Build Conditions to identify potential traffic impacts. Table 4-9 and Table 4-10 presents this comparison for the signalized and unsignalized study intersections, respectively.
As shown in the tables, one of the following conditions are met for all intersections and lane groups during both peak hours:
For all lane groups that operate at LOS D or better in the 2040 No Build Condition, the same lane group would operate at LOS D or better in the 2040 Build Condition.
For all lane groups that operate at LOS E in the 2040 No Build Condition, the same lane group would operate at LOS E or better in the 2040 Build Condition.
For all lane groups that operate at LOS F in the 2040 No Build Condition, the same lane group would remain at LOS F with reduced delay or improve to LOS E or better in the 2040 Build Condition.
The few exceptions to these conditions are described in further detail below:
At the Lake Shore Drive and Science Drive intersection, the NB left-turn movement would degrade from LOS D (45.4 seconds of delay) in the No Build Condition to LOS E (55.6 seconds of delay) in the Build Condition during the AM peak hour. However, the projected volume for this movement is only 5 vehicles during the AM peak hour, and the projected 95th-percentile queue length is calculated by Synchro as 4 feet, which is negligible and can easily be accommodated within the storage bay. Therefore, this does not represent a significant traffic impact.
At the Stony Island Avenue and 67th Street intersection, the SB left-turn movement would degrade from LOS D in the No Build Condition to LOS E in the Build Condition during the AM peak hour. However, the projected volume for this movement is only 92 vehicles during the PM peak hour. Furthermore, the projected 95th-percentile queue is calculated by Synchro as 135 feet, which can be accommodated within the existing storage bay length (which could be further lengthened if necessary as part of the proposed mitigation for this intersection). Therefore, this condition does not represent a significant traffic impact.
At the Stony Island Avenue and 65th Street intersection, the EB left-turn movement would degrade from LOS D in the No Build Condition to LOS E in the Build Condition during the PM peak hour. However, the projected volume for this movement is only 10 vehicles during the PM peak hour, and the delay would be 37.8 seconds (which is just

Jackson Park Revitalization Traffic Impact Study Final Report – February 2018 4-36
beyond the LOS D/E threshold of 35 seconds). Furthermore, the projected 95th-percentile queue is calculated by Synchro as 7 feet, which is negligible. Therefore, this LOS E condition does not represent a significant traffic impact.
At the modified intersection of Stony Island Avenue and the proposed OPC Access Driveway at 61st Street, the left-turn movement exiting the OPC garage would operate at LOS E during the AM peak hour and LOS F during the PM peak hour; however, queue lengths – which would all be contained on-site – would not exceed 55 feet (approximately two to three vehicles), and the v/c ratios do not exceed 0.48. Therefore, this condition does not represent a significant traffic impact.
Therefore, the traffic analysis results show that the proposed improvements would successfully mitigate any potential traffic impacts in the 2040 horizon year and there would be no significant traffic impacts as a result of the proposed project.
Appendix G contains travel time comparisons between the 2016 Existing and 2040 Build conditions for various travel routes through the study area, which were approximated using the SimTraffic traffic simulation models based on the mitigation measures presented to the public in August 2017. This traffic report presents an updated mitigation package not reflected in the Build Condition travel time results; however, the enhancements made since August 2017, in total, would likely improve travel times for the 2040 Build Condition. Therefore, the travel time comparisons presented in the appendix are conservative

Lane Group
v/c Ratio
Delay (sec)
LOSQueue Length
(ft)
Lane Group
v/c Ratio
Delay (sec)
LOSQueue Length
(ft)
Lane Group
v/c Ratio
Delay (sec)
LOSQueue Length
(ft)
Lane Group
v/c Ratio
Delay (sec)
LOSQueue Length
(ft)
Eastbound L 0.85 30.1 C 339 LR 0.66 36.8 D 183 L 0.91 38.0 D 345 LR 0.76 29.4 C 159
R 0.09 3.7 A 8 R 0.31 24.3 C 88
Northbound L 0.50 47.1 D 133 L 0.70 53.2 D 121 L 0.14 10.3 B 7 L 0.16 11.7 B 8
T 1.00 36.1 D 821 T 0.91 12.0 B 469 T 0.41 7.6 A 173 T 0.50 8.2 A 202
Southbound T 0.82 33.4 C 456 T 0.44 9.2 A 186 T 0.86 19.6 B 631 T 0.88 17.2 B 603
R 1.05 39.9 D 372 R 0.78 3.8 A 0 R 1.00 25.6 C 267 R 0.07 0.1 A 0
35.1 D 12.8 B 22.6 C 16.4 B
Eastbound L 0.03 43.6 D 15 L 0.03 43.6 D 15 L 0.16 45.7 D 44 L 0.17 46.4 D 46
R 0.02 20.2 C 10 R 0.02 21.8 C 11 R 0.09 29.4 C 30 R 0.10 34.5 C 33
Northbound L 0.04 45.4 D 15 L 0.05 55.6 E 4 L 0.04 45.4 D 15 L 0.06 49.4 D 16
T 0.61 2.6 A 261 T 0.75 5.3 A 700 T 0.29 1.8 A 76 T 0.36 1.9 A 95
Southbound T 0.38 3.6 A 175 T 0.32 0.5 A 19 T 0.71 7.3 A 353 T 0.71 1.4 A 39
R 0.00 0.0 A 0 R 0.00 0.0 A 0 R 0.01 0.9 A 1 R 0.01 0.0 A 0
3.0 A 4.0 A 5.7 A 2.0 A
Eastbound LTR 0.37 25.2 C 111 L 0.47 35.8 D 127 LTR 0.59 27.1 C 133 L 0.22 21.7 C 69
TR 0.38 23.7 C 138 TR 0.57 23.3 C 252
Westbound LTR 0.48 2.9 A 15 L 0.42 34.3 C 114 LTR 0.43 3.1 A 26 L 0.78 49.3 D 247
T 0.37 30.3 C 171 T 0.28 21.4 C 145
R 0.35 7.3 A 53 R 0.15 5.5 A 26
Northbound L 0.65 74.3 E 117 L 0.38 49.2 D 93 L 0.77 70.3 E 209 L 0.64 52.4 D 185
TR 0.68 27.6 C 346 T 0.76 21.7 C 432 TR 0.31 19.8 B 147 T 0.45 25.2 C 192
R 0.22 6.1 A 61 R 0.24 4.3 A 40
Southbound L 0.41 42.7 D 82 L 0.62 60.9 E 135 L 0.71 728.1 F 93 L 0.74 65.3 E 215
TR 0.35 7.9 A 36 TR 0.23 16.7 B 84 TR 1.02 46.4 D 644 TR 0.94 34.3 C 315
18.6 B 22.3 C 54.6 D 31.9 C
Eastbound L 0.08 39.2 D 51 L 0.08 39.2 D 51 L 0.05 38.8 D 38 L 0.05 38.8 D 38
R 0.21 41.7 D 94 R 0.64 54.1 D 257 R 0.30 43.2 D 137 R 0.56 29.0 C 189
Northbound L 0.27 8.0 A 49 L 0.23 7.5 A 49 L 0.55 22.9 C 59 L 0.58 24.2 C 56
T 0.69 14.1 B 481 T 0.69 14.1 B 482 T 0.37 9.2 A 192 T 0.38 9.3 A 196
Southbound TR 0.33 13.0 B 182 TR 0.26 12.3 B 141 TR 0.76 21.1 C 607 TR 0.73 8.2 A 180
14.6 B 17.1 B 18.2 B 11.0 B
Eastbound LT 0.56 48.3 D 126 LT 0.26 51.9 D 65 LT 0.54 31.2 C 181 LT 0.49 43.2 D 167
R 0.28 43.5 D 98 R 0.28 52.9 D 93 R 0.57 34.6 C 205 R 0.66 51.8 D 252
Westbound LT 0.52 47.6 D 145 LT 0.57 42.5 D 128 LT 0.42 45.1 D 200 LT 0.78 52.7 D 240
R 0.90 16.4 B 139 R 0.89 14.4 B 21 R 0.35 5.9 A 107 R 0.37 8.2 A 242
Northbound L 0.50 50.9 D 107 L 0.51 51.4 D 119 L 0.47 52.6 D 94 L 0.32 22.5 C 44
TR 0.88 34.9 C 479 TR 0.88 41.0 D 491 TR 0.53 31.1 C 201 TR 0.72 54.4 D 273
Southbound L 0.48 14.2 B 83 L 0.48 11.0 B 82 L 0.83 31.0 C 514 L 0.79 19.2 B 751
TR 0.23 7.6 A 40 TR 0.23 2.1 A 82 TR 0.34 9.9 A 168 TR 0.36 4.3 A 186
24.4 C 23.5 C 24.1 C 24.0 C
Eastbound L 0.46 38.4 D 104 L 0.72 38.3 D 227 L 0.17 29.4 C 60 L 0.27 27.1 C 84
T 0.48 33.9 C 218 T 0.16 19.1 B 88 T 0.45 33.3 C 218 T 0.55 31.1 C 276
R 0.29 8.4 A 48 R 0.21 4.0 A 31 R 0.40 8.5 A 78 R 0.42 11.5 B 92
Westbound L 0.23 24.7 C 39 L 0.05 20.8 C 29 L 0.17 21.4 C 34 L 0.63 51.1 D 155
T 0.52 27.0 C 142 T 0.41 24.6 C 244 T 0.32 22.0 C 112 T 0.31 33.5 C 183
R 0.12 5.5 A 4 R 0.37 5.9 A 64 R 0.07 5.2 A 11 R 0.29 11.9 B 74
Northbound L 0.37 12.8 B 108 L 0.82 29.4 C 219 L 0.21 11.0 B 48 L 0.26 14.3 B 35
TR 0.36 10.7 B 140 TR 0.81 30.1 C 370 TR 0.20 9.1 A 82 TR 0.62 26.0 C 259
Southbound L 0.15 8.9 A 39 L 0.59 15.6 B 29 L 0.12 6.0 A 25 L 0.86 27.1 C 287
TR 0.19 6.1 A 68 TR 0.46 19.1 B 185 TR 0.35 7.5 A 140 TR 0.86 31.9 C 475
16.3 B 23.4 C 13.3 B 28.2 C
Sy
nc
hro
No
de
#
Weekday AM Peak Hour Weekday PM Peak Hour
No-Build Condition Build ConditionIntersection &
Approach
Intersection
19
Intersection Intersection
Intersection
No-Build Condition
Intersection
Intersection Intersection Intersection
Intersection
IntersectionIntersection
Build Condition
Intersection
Intersection Intersection
Table 4-9: 2040 No Build vs. 2040 Build ConditionsCapacity Analysis Results Comparison - Signalized Intersections
Intersection Intersection
3
6
13
15
20
Intersection Intersection
IntersectionIntersection
Lake Shore Dr & 57th Drive
Science Dr & Lake Shore Dr
Stony Island Ave & 67th St
South Shore Dr & 67th St
Jeffery Ave/Lake Shore Dr & Marquette Dr
Stony Island Ave & 63rd Street/Hayes Dr
IntersectionIntersection Intersection Intersection

Lane Group
v/c Ratio
Delay (sec)
LOSQueue Length
(ft)
Lane Group
v/c Ratio
Delay (sec)
LOSQueue Length
(ft)
Lane Group
v/c Ratio
Delay (sec)
LOSQueue Length
(ft)
Lane Group
v/c Ratio
Delay (sec)
LOSQueue Length
(ft)
Eastbound L 0.98 103.0 F 188 L 0.74 50.6 D 131 L 0.32 35.6 D 68 L 0.27 30.2 C 64
TR 0.36 32.8 C 77 TR 0.57 39.4 D 140 TR 0.53 39.3 D 106 TR 0.71 44.5 D 163
Westbound L 0.19 31.0 C 44 L 0.20 28.4 C 41 L 0.13 31.4 C 36 L 0.18 28.7 C 34
TR 0.71 29.4 C 110 TR 0.69 28.9 C 110 TR 0.50 30.3 C 78 TR 0.41 25.5 C 74
Northbound L 0.15 5.9 A 33 L 0.17 7.4 A 38 L 0.23 5.6 A 37 L 0.34 9.0 A 49
TR 0.41 11.1 B 215 TR 0.43 13.1 B 242 TR 0.22 10.4 B 112 TR 0.26 13.7 B 137
Southbound L 0.16 2.6 A 13 L 0.17 7.6 A 31 L 0.23 4.4 A 45 L 0.27 7.3 A 69
TR 0.25 3.0 A 39 TR 0.30 11.2 B 151 TR 0.41 9.4 A 147 TR 0.54 16.1 B 307
20.1 C 20.8 C 15.6 B 20.5 C
Eastbound LTR 0.51 23.9 C 88 LR 0.70 33.3 C 165 LTR 0.41 18.1 B 57 LR 0.80 30.1 C 277
Westbound LT 0.25 31.2 C 100 LT 0.18 30.3 C 71
R 0.23 17.8 B 94 R 0.19 3.5 A 35
Northbound L 0.12 5.7 A 0 L 0.19 2.0 A 14 L 0.28 15.0 B 39 L 0.01 9.6 A 10
T 0.68 8.0 A 212 T 0.37 2.0 A 33 T 0.28 6.9 A 61 T 0.16 10.3 B 128
R 0.29 1.7 A 42 R 0.08 1.7 A 0
Southbound L 0.48 13.6 B 56 T 0.13 13.6 B 79 L 0.67 11.0 B 147 T 0.45 15.3 B 304
TR 0.18 4.6 A 78 R 0.35 1.1 A 32 TR 0.55 9.2 A 0 R 0.33 1.2 A 100
10.9 B 9.8 A 10.6 B 17.1 B
Eastbound L 0.40 16.8 B 54 L 0.64 8.8 A 27
R 0.13 0.4 A 0 R 0.57 6.4 A 15
Northbound T 0.72 5.8 A 111 T 0.31 4.4 A 60
Southbound T 0.18 5.1 A 56 T 0.58 7.2 A 140
6.9 A 6.8 A
Eastbound L 1.25 172.2 F 264 L 0.87 51.0 D 142 L 0.83 53.9 D 149 L 0.25 8.0 A 77
TR 0.69 7.6 A 198 TR 0.18 9.4 A 80 TR 0.61 15.0 B 212 TR 0.40 19.4 B 188
Westbound L 0.09 4.8 A 4 L 0.03 6.5 A 7 L 0.02 4.4 A 1 L 0.01 6.6 A 5
TR 0.88 23.6 C 494 TR 0.65 20.8 C 394 TR 0.82 20.3 C 451 TR 0.07 10.7 B 31
Southbound LT 0.59 45.2 D 210 LT 0.60 45.3 D 210 LT 0.74 51.9 D 290 LT 0.66 43.4 D 270
R 0.40 22.2 C 135 R 0.40 21.2 C 131 R 0.53 26.6 C 195 R 0.41 4.5 A 52
27.5 C 24.1 C 23.0 C 19.1 B
L 0.31 51.2 D 148 L 0.53 49.2 D 165
Westbound LTR 0.91 93.6 F 543 TR 0.75 49.0 D 382 LTR 0.36 29.1 C 153 TR 0.22 27.8 C 85
L 0.79 53.2 D 335 L 0.46 19.8 B 292
Northbound LT 0.61 4.7 A 27 T 0.50 14.6 B 302 LT 0.32 2.3 A 18 T 0.38 7.7 A 159
R 0.32 10.5 B 93 R 0.65 39.0 D 262
Southbound TR 0.38 3.5 A 13 LTR 0.51 20.3 C 190 TR 0.37 2.5 A 13 LTR 0.78 32.6 C 290
48.4 D 31.8 C 9.2 A 28.6 C
Eastbound LTR 0.45 31.8 C 177 L 0.44 28.6 C 155 LTR 1.06 81.6 F 561 L 0.48 22.7 C 188
Northbound TR 0.45 3.0 A 16 T 0.62 12.8 B 167 TR 0.31 4.4 A 40 T 0.54 15.7 B 160
Southbound LT 0.40 5.0 A 43 T 0.37 7.7 A 59 LT 0.42 2.7 A 21 T 0.70 22.6 C 388
11.3 B 13.9 B 40.9 D 22.2 C
Richards Dr & Hayes DrEastbound TR 0.60 9.5 A 371 TR 0.50 4.2 A 98
L 0.03 3.6 A 2 L 0.05 5.5 A 10
T 0.21 3.4 A 27 T 0.47 6.7 A 223
Northbound L 0.69 49.2 D 141 L 0.70 54.5 D 182
R 0.00 0.0 0 R 0.05 17.0 15
12.7 B 9.1 A
Southwestbound LR 0.20 4.8 A 23 LR 0.17 7.0 A 16 LR 0.68 10.7 B 210 LR 0.47 13.9 B 197
Northbound T 0.64 9.0 A 114 T 0.73 22.7 C 487 T 0.37 16.6 B 202 T 0.46 21.5 C 256
R 0.55 5.5 A 147 R 0.13 0.4 A 0
Southbound T 0.17 18.7 B 71 T 0.22 6.3 A 23 T 0.38 24.1 C 159 T 0.72 16.4 B 197
10.2 B 12.7 B 15.5 B 15.1 B
Stony Island Ave & SB Cornell Dr
Unsignalized Unsignalized
Intersection
#Intersection &
Approach
Weekday AM Peak Hour Weekday PM Peak Hour
No-Build Condition
Intersection
23
27
31
38
44
54
52
Intersection Intersection
Intersection
Intersection Intersection Intersection Intersection
Intersection Intersection
MSI Drop Off/Hyde Park Blvd & 57th Dr
Stony Island Ave & N. Midway Plaisance
S. Midway Plaisance & Stony Island Ave
Build Condition No-Build Condition
Intersection
Intersection Intersection
Intersection Intersection
Intersection EliminatedIntersection Eliminated
Cornell Dr & S. Midway Plaisance
Cornell Dr & Hayes DrIntersection Intersection Intersection Intersection
Build Condition
Jeffery Ave & 67th St
Intersection
Intersection Intersection
Intersection
41
IntersectionIntersection Intersection Intersection

Lane Group
v/c Ratio
Delay (sec)
LOSQueue Length
(ft)
Lane Group
v/c Ratio
Delay (sec)
LOSQueue Length
(ft)
Lane Group
v/c Ratio
Delay (sec)
LOSQueue Length
(ft)
Lane Group
v/c Ratio
Delay (sec)
LOSQueue Length
(ft)
Eastbound LT 0.21 2.5 A 5 LT 0.61 19.7 B 95
Westbound TR 0.43 30.6 C 160 TR 0.39 32.0 C 154
Northbound LTR 0.76 28.8 C 392 LTR 0.29 18.1 B 120
26.3 C 22.5 C
Eastbound L 0.13 31.4 C 52 LR 0.81 52.3 D 245 L 0.08 30.5 C 36 LR 0.80 42.3 D 182
TR 0.52 35.3 D 208 TR 0.48 28.8 C 174
Westbound L 0.17 16.2 B 15 L 0.33 15.9 B 43
TR 0.11 7.7 A 16 TR 0.12 7.0 A 6
Northbound L 0.41 12.3 B 58 L 0.37 2.6 A 11 L 0.52 41.8 D 75 L 0.60 53.8 D 95
TR 0.45 5.0 A 75 T 0.61 2.1 A 45 TR 0.24 4.1 A 41 T 0.25 1.1 A 19
Southbound L 0.06 5.2 A 11 L 0.07 2.4 A 4
TR 0.30 13.3 B 124 TR 0.22 10.2 B 92 TR 0.76 14.3 B 410 TR 0.58 14.4 B 297
12.5 B 8.4 A 14.4 B 14.3 B
Eastbound LT 0.36 11.4 B 41 LT 0.27 19.4 B 76
Westbound TR 0.10 21.7 C 40 TR 0.14 26.9 C 58
Northbound LTR 0.51 6.4 A 127 LTR 0.20 3.5 A 30
7.7 A 9.8 A
Eastbound LT 0.17 27.0 C 69 LT 0.16 27.0 C 69
Westbound T 0.09 7.3 A 12 T 0.10 12.1 B 38
R 0.14 0.2 A 0 R 0.12 0.2 A 0
Southeastbound LR 0.15 7.2 A 67 LR 0.49 18.5 B 247
10.0 A 15.9 B
Northbound TR 0.03 2.1 A 5 TR 0.03 11.6 B 10
Southbound L 0.14 0.4 A 0 L 0.39 1.0 A 0
T 0.01 0.0 A 0 T 0.02 0.0 A 0
Northwestbound LR 0.19 0.4 A 0 LR 0.14 0.2 A 0
0.5 A 1.0 A
Eastbound L 0.34 12.8 B 24 L 0.14 6.5 A 9
T 0.12 3.0 A 29 T 0.13 3.7 A 34
Westbound TR 0.14 22.9 C 34 TR 0.14 21.2 C 36
Southbound R 0.01 0.0 A 0 R 0.03 0.1 A 0
10.1 B 9.0 A
Eastbound LR 0.09 20.4 C 27 LR 0.15 28.4 C 48
Northbound LT 0.52 6.1 A 51 LT 0.21 2.0 A 15
Southbound TR 0.60 32.2 C 271 TR 0.41 12.3 B 123
19.3 B 8.9 A
Eastbound LR 0.27 22.8 C 52 LR 0.52 38.0 D 130
Northbound LT 0.60 16.9 B 282 LT 0.34 13.5 B 156
Southbound TR 0.23 1.0 A 4 TR 0.30 2.9 A 41
11.2 B 10.4 B
Eastbound LT 0.52 46.4 D 163 LT 0.35 42.0 D 111 LT 0.66 107.7 F 272 LT 0.45 41.0 D 153
Westbound L 0.62 43.1 D 221 L 0.60 18.2 B 96 L 0.26 32.2 C 53 L 0.33 43.8 D 92
R 0.23 10.3 B 38 R 0.00 0.0 0.0 0 R 0.16 8.7 A 23 R 0.06 10.8 B 2
Northbound TR 0.68 22.8 C 487 TR 0.84 25.5 C 294 TR 0.46 31.8 C 332 TR 0.58 21.1 C 282
Southbound L 0.26 19.5 B 54 L 0.27 22.2 C 41 L 0.27 16.1 B 80 L 0.16 12.8 B 38
T 0.33 17.9 B 168 T 0.36 18.3 B 184 T 0.44 17.2 B 249 T 0.53 16.5 B 311
25.2 C 22.1 C 36.7 D 37.2 D
Build Condition#Intersection &
Approach
Weekday AM Peak Hour Weekday PM Peak Hour
No-Build Condition Build Condition No-Build Condition
Intersection Eliminated Intersection Eliminated
64
70
71
74
76
IntersectionIntersection
59
Marquette Dr & NB Cornell Dr
Intersection
Intersection Eliminated
Marquette & Richards (North Intersection)
Intersection Eliminated
Intersection Intersection
Intersection Eliminated
Intersection Eliminated
Intersection Intersection
Intersection Eliminated
Intersection
58
56
78
Marquette and Richards (East Intersection)
Intersection Eliminated
Intersection
Intersection
Stony Island Ave & Marquette Rd/Marquette Dr
59th St & Stony Island Ave
Intersection Intersection
Marquette & Richards (West Intersection)
Intersection Eliminated
Intersection Intersection
Intersection Eliminated
Intersection Unsignalized Intersection Unsignalized
Intersection Intersection
Stony Island Ave & 57th Street
Stony Island Ave & 60th St
Intersection Intersection
Intersection Unsignalized Intersection Unsignalized
NB Cornell Dr & 67th St
IntersectionIntersection
IntersectionIntersection
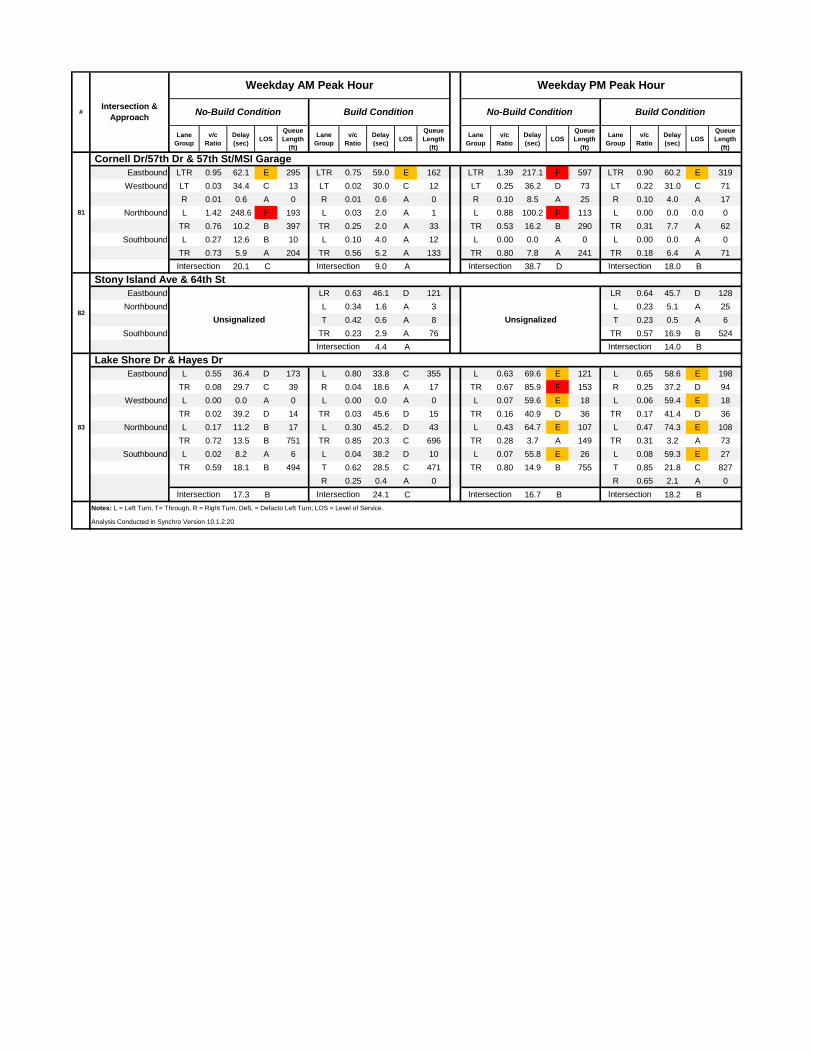
Lane Group
v/c Ratio
Delay (sec)
LOSQueue Length
(ft)
Lane Group
v/c Ratio
Delay (sec)
LOSQueue Length
(ft)
Lane Group
v/c Ratio
Delay (sec)
LOSQueue Length
(ft)
Lane Group
v/c Ratio
Delay (sec)
LOSQueue Length
(ft)
Eastbound LTR 0.95 62.1 E 295 LTR 0.75 59.0 E 162 LTR 1.39 217.1 F 597 LTR 0.90 60.2 E 319
Westbound LT 0.03 34.4 C 13 LT 0.02 30.0 C 12 LT 0.25 36.2 D 73 LT 0.22 31.0 C 71
R 0.01 0.6 A 0 R 0.01 0.6 A 0 R 0.10 8.5 A 25 R 0.10 4.0 A 17
Northbound L 1.42 248.6 F 193 L 0.03 2.0 A 1 L 0.88 100.2 F 113 L 0.00 0.0 0.0 0
TR 0.76 10.2 B 397 TR 0.25 2.0 A 33 TR 0.53 16.2 B 290 TR 0.31 7.7 A 62
Southbound L 0.27 12.6 B 10 L 0.10 4.0 A 12 L 0.00 0.0 A 0 L 0.00 0.0 A 0
TR 0.73 5.9 A 204 TR 0.56 5.2 A 133 TR 0.80 7.8 A 241 TR 0.18 6.4 A 71
20.1 C 9.0 A 38.7 D 18.0 B
Eastbound LR 0.63 46.1 D 121 LR 0.64 45.7 D 128
Northbound L 0.34 1.6 A 3 L 0.23 5.1 A 25
T 0.42 0.6 A 8 T 0.23 0.5 A 6
Southbound TR 0.23 2.9 A 76 TR 0.57 16.9 B 524
4.4 A 14.0 B
Eastbound L 0.55 36.4 D 173 L 0.80 33.8 C 355 L 0.63 69.6 E 121 L 0.65 58.6 E 198
TR 0.08 29.7 C 39 R 0.04 18.6 A 17 TR 0.67 85.9 F 153 R 0.25 37.2 D 94
Westbound L 0.00 0.0 A 0 L 0.00 0.0 A 0 L 0.07 59.6 E 18 L 0.06 59.4 E 18
TR 0.02 39.2 D 14 TR 0.03 45.6 D 15 TR 0.16 40.9 D 36 TR 0.17 41.4 D 36
Northbound L 0.17 11.2 B 17 L 0.30 45.2 D 43 L 0.43 64.7 E 107 L 0.47 74.3 E 108
TR 0.72 13.5 B 751 TR 0.85 20.3 C 696 TR 0.28 3.7 A 149 TR 0.31 3.2 A 73
Southbound L 0.02 8.2 A 6 L 0.04 38.2 D 10 L 0.07 55.8 E 26 L 0.08 59.3 E 27
TR 0.59 18.1 B 494 T 0.62 28.5 C 471 TR 0.80 14.9 B 755 T 0.85 21.8 C 827
R 0.25 0.4 A 0 R 0.65 2.1 A 0
17.3 B 24.1 C 16.7 B 18.2 B
Notes: L = Left Turn, T= Through, R = Right Turn, DefL = Defacto Left Turn; LOS = Level of Service.
Analysis Conducted in Synchro Version 10.1.2.20
83
81
No-Build Condition# Build Condition No-Build Condition Build Condition
Intersection
Lake Shore Dr & Hayes Dr
Intersection & Approach
Weekday AM Peak Hour Weekday PM Peak Hour
Intersection
Unsignalized
Intersection
Unsignalized
Stony Island Ave & 64th StIntersection
82
Intersection
Intersection Intersection Intersection
Intersection Intersection
Cornell Dr/57th Dr & 57th St/MSI Garage

Lane Group
v/c Ratio
Delay (sec)
LOSQueue Length
(ft)
Lane Group
v/c Ratio
Delay (sec)
LOSQueue Length
(ft)
Lane Group
v/c Ratio
Delay (sec)
LOSQueue Length
(ft)
Lane Group
v/c Ratio
Delay (sec)
LOSQueue Length
(ft)
Stony Island Ave with 59th St (TWSC)Eastbound R 0.03 11.1 B 2 R 0.03 11.9 B 2
MSI Drop Off/Everett Ave & 57th Drive (TWSC)Northbound LTR 5.85 Err F Err LTR 0.34 61.4 F 33 LTR 1.77 587.5 F 184 LTR 0.21 18.9 C 20
Eastbound T T
Westbound T T
Northbound L L
Stony Island Ave with 60th St (TWSC)Eastbound R 0.04 9.2 A 3 R 0.09 9.8 A 7
Stony Island Ave with OPC Access & 61st St (TWSC)Eastbound LTR 0.04 20.8 C 3 LTR 0.13 31.1 D 11
Westbound L 0.01 48.6 E 1 L 0.48 57.3 F 55
R 0.00 12.8 B 0 R 0.10 11.4 B 8
Hayes & Richards (South Intersection) (AWSC)Northbound T 0.29 8.3 A - T 0.25 8.4 A -
R 0.04 5.9 A - R 0.03 6.2 A -
Southbound LT 0.20 8.4 A - LT 0.69 16.5 C -
Southwestbound LR 0.02 8.2 A - LR 0.05 9.1 A -
8.1 A 14.1 A
Stony Island Ave & 64th St (AWSC)Eastbound LR 0.24 11.4 B - LR 0.24 11.2 B -
Northbound L 0.29 10.4 B - L 0.08 8.5 A -
T 1.32 171.0 F - T 0.76 23.3 C -
Southbound T 0.69 20.1 C - T 1.34 181.5 F -
R 0.09 8.0 A - R 0.07 7.0 A -
96.4 F 107.5 F
Stony Island Ave & 65th St (TWSC)Eastbound L 0.01 14.9 B 1 L 0.02 18.7 C 1 L 0.07 30.1 D 5 L 0.09 37.8 E 7
R 0.01 9.8 A 1 R 0.02 11.6 B 2 R 0.01 11.8 B 1 R 0.02 16.0 C 1
East End Ave & 67th St (AWSC)Eastbound T 0.28 9.6 A - T 0.47 12.1 B - T 0.39 10.4 B - T 0.59 14.5 B -
Westbound T 0.45 11.3 B - T 0.54 13.3 B - T 0.44 10.8 B - T 0.56 13.8 B -
Northbound LR 0.13 9.2 A - LR 0.15 9.8 A - LR 0.10 9.1 A - LR 0.11 9.8 A -
10.5 B 12.5 B 10.5 B 13.8 B
Cregier Ave & 67th St (AWSC)Eastbound T 0.32 9.9 A - T 0.53 13.1 B - T 0.38 10.2 B - T 0.61 15.4 C -
Westbound T 0.42 10.9 B - T 0.51 12.7 B - T 0.45 11.0 B - T 0.61 15.1 C -
Northbound LR 0.13 9.0 A - LR 0.15 9.7 A - LR 0.12 9.1 A - LR 0.14 10.2 B -
10.3 B 12.6 B 10.5 B 14.8 B
Bennett Ave & 67th St (TWSC)Northbound LR 0.17 11.7 B 15 LR 0.22 14.4 B 21 LR 0.09 12.1 B 7 LR 0.14 15.9 C 12
Notes: L = Left Turn, T= Through, R = Right Turn, DefL = Defacto Left Turn, LOS = Level of Service
(AWSC) = All-Way Stop Control, (TWSC) = Two-Way Stop Control
Analysis Conducted in Synchro Version 10.1.2.20
Intersection
Intersection
Intersection
31
31
Signalized Intersection
Signalized Intersection
Stop sign configuration cannot be analyzed using
HCM methodology.
69
85
51
Hayes & Richards (West Intersection)
Intersection Intersection
56
92
Table 4-10: 2040 No Build vs. 2040 Build ConditionsCapacity Analysis Results Comparison - Unsignalized Intersections
90
Intersection Intersection Intersection
Intersection
88
82Intersection Signalized Intersection Signalized
32
Intersection
Weekday PM Peak HourNo-Build Condition Build Condition No-Build Condition
Signalized Intersection
Intersection Eliminated Intersection Eliminated
Intersection
Intersection
Intersection Eliminated Intersection Eliminated
Stop sign configuration cannot be analyzed using
HCM methodology.
Intersection Not Analyzed Intersection Not Analyzed
Signalized Intersection
Build Condition
Sy
nc
hro
No
de
#
Intersection & Approach
Weekday AM Peak Hour

Jackson Park Revitalization Traffic Impact Study Final Report – February 2018 5‐1
5.0 PARKING ANALYSIS A parking analysis was performed to determine if the proposed on-site parking could accommodate the projected peak parking demand for the OPC site and to determine the potential impact that the loss of parking associated with the proposed mitigation measures might have on the off-site parking supply.
5.1 Existing Parking Conditions
Parking within and around Jackson Park is provided via free on-street spaces and metered off-street parking lots. Currently, there are a total of approximately 790 on-street parking spaces and over 2,300 off-street parking spaces, including the MSI parking garage. To estimate existing parking supply where on-street spaces are not marked with pavement striping, either (a) the actual number of legally parked cars was counted on blocks where parking was fully utilized or (b) the number of legal parking spaces was estimated by assuming one space per 20 feet of continuous available curb length on blocks where parking utilization was lower. Figure 5-1 depicts the free on-street and metered/paid off-street parking locations within the study area.
Figure 5-1 – Existing Public Parking Locations

Jackson Park Revitalization Traffic Impact Study Final Report – February 2018 5-2
5.2 On-Site Parking Analysis
OPC development plans include the construction of a maximum 450-space underground parking garage located on the east side of Stony Island Avenue within the boundaries of the site. Access to the parking garage is proposed to be provided via a single access drive that will align opposite 61st Street. The access drive will provide one inbound lane and two outbound lanes with outbound movements under stop-sign control. Sam Schwartz conducted an analysis of OPC’s parking needs, including visitor and employee parking demand estimates. Parking is typically designed to accommodate the 30th highest day of a facility to provide a good experience accessing the site and that costs and land are used in the most efficient manner. For days higher than the 30th design day peak, parking management strategies can be implemented that could include timed ticketing, reserving space in nearby lots such as MSI, and/or providing shuttle service to and from remote parking lots. To estimate vehicular demand generated by OPC on the 30th design day, historical data from the National Archives and Records Administration (NARA) on all other Presidential Centers were analyzed to understand daily and hourly distribution, average vehicle occupancy, average visit time, and staffing levels. Data from MSI was also reviewed. The historical information was modified in cases where more specific information was available from OPC. The following assumptions or inputs were used in the calculation:
4,200 museum visitors arriving on the 30th day An hourly distribution of arrivals 8 AM to 8 PM based on data from other presidential
centers Vehicular mode share for staff and visitors (% of total that arrives by car and parks)
o 50% of the visitors would travel by car o 50% of employees would travel by car
An average visit time of 2.5 hours for museum visits and 3 hours for programs/events Estimated staff size of approximately 150 persons An average vehicle occupancy of:
o Visitor: 2.5 persons per vehicle o Employee: 1.2 persons per vehicle
A screenshot of the parking demand calculator is shown in Figure 5-2, and additional detail is included in Appendix C.

Jackson Park Revitalization Traffic Impact Study Final Report – February 2018 5-3
Figure 5-2 – Parking Demand Calculator
Figure 5-3 displays the hourly parking demand for the site compared with the proposed capacity of the OPC parking facility and shows that the peak parking demand is estimated to be 344 vehicles, which would occur at approximately 1:00 PM on the design day. As the OPC parking facility would provide a maximum of 450 off-street parking spaces, the garage would be able to accommodate the peak site-generated parking demand.
Figure 5-3 – OPC Hourly Parking Demand
Design Day % Annual
Traffic [C]Peak Day Visitors
[D]=[A]*[B]*[C]
Annual Attendance
[A]820000 Inputs
10th 2.2% 13,069
15th 1.7%
9,977
Visitor as % of Annual
Attendance [B]73%
Assumptions
20th 1.1% 6,784 ## Calculated values
30th 0.7% 4,190 (select below)
45th 0.5% 2,893 30th 0.7%
Visitor
Vehicle
Occupancy
[V0_1] 2.5
Visitor Vehicular
Mode Share
[MS_2] 50.0%
Total Peak
Parking
Demand
344
Staff Vehicle
Occupancy
[V0_2] 1.2
Staff Vehicular Mode
Share
[MS_3] 50.0%Tour Bus
Occupancy
[V0_3] 48.5
Bus Mode Share
[MS_1] 12.0%
Hour
% of Daily
Arrivals [E]
Museum Visitors
= [D]*[E] Foundation Other Staff Program Visitors
Museum
Visitors
Program
Visitors Foundation
Other
Staff
Museum
Visitors
Museum
Visitors
(Buses)
Program
Visitors
Found
ation
Other
Staff
Museum
Visitors
Museum
Visitors
(Buses)
Program
Visitors Foundation
Other
Staff Total Cars
8 AM 0.3% 11 100 50 0 11 0 100 50 2 1 0 42 21 2 1 0 42 21 65
9 AM 7.4% 311 10 317 10 100 50 62 1 2 0 0 63 1 2 42 21 128
10 AM 18.3% 768 15 925 18 100 50 154 2 3 0 0 185 3 4 42 21 251
11 AM 17.2% 719 100 1,143 125 100 50 144 2 20 0 0 229 3 25 42 21 316
12 PM 16.3% 683 100 1,158 225 100 50 137 2 20 0 0 232 3 45 42 21 339
1 PM 16.7% 699 15 1,179 230 100 50 140 2 3 0 0 236 3 46 42 21 344
2 PM 13.8% 578 10 1,058 225 100 50 116 2 2 0 0 212 3 45 42 21 319
3 PM 7.9% 332 15 751 140 100 50 66 1 3 0 0 150 2 28 42 21 240
4 PM 2.0% 82 25 15 364 55 100 50 16 0 3 0 10 73 1 11 42 21 146
5 PM 0.1% 4 150 123 190 100 75 1 0 30 0 0 25 1 38 42 31 135
6 PM 0.0% 1 150 35 330 0 25 0 0 30 0 0 7 1 66 0 10 83
7 PM 0.0% 0 10 6 325 0 25 0 0 2 0 0 1 1 65 0 10 77
8PM 0.0% 0 10 0 320 0 25 0 0 2 0 0 0 1 64 0 10 74
People Arriving [F] People on Site [G] Vehicles Arriving = [F]*[MS_x]/[VO_x] Vehicles on Site (Parking Demand) = [G]*[MS_x]/[VO_x]
0
50
100
150
200
250
300
350
400
450
500
8 AM 9 AM 10 AM 11 AM 12 PM 1 PM 2 PM 3 PM 4 PM 5 PM 6 PM 7 PM 8PM
OPC Parking Dem
and
Time of Day
Projected OPC Weekday Parking ‐ Supply vs Demand
Demand
Supply

Jackson Park Revitalization Traffic Impact Study Final Report – February 2018 5-4
5.3 Off-Site Parking Analysis
An evaluation of parking was conducted to quantify the number of parking spaces that would potentially be impacted by the proposed traffic improvements outlined in the previous sections. Each area shown in Figure 5-1 was surveyed.
5.3.1 Parking Inventory Sam Schwartz conducted a parking inventory survey of the streets within Jackson Park and adjacent to OPC to establish existing on-street parking supply. Changes to on-street parking resulting from the roadway improvements proposed are summarized below and tabulated in Table 5-1 by street segment:
On-street parking would be prohibited along the east curb of Stony Island Avenue between 60th Street and just south of 62nd Street to provide curbside space for visitor and bus pick-up and drop-off activity, which would result in a loss of approximately 30 parking spaces.
On-street parking would be eliminated on Hayes Drive to accommodate an additional travel lane in each direction, which would result in a loss of approximately 147 parking spaces.
The closure of Marquette Drive between Stony Island Avenue and Richards Drive would result in a loss of approximately 125 on-street parking spaces; however, due to the distance of these on-street spaces from park attractions, this location is only significantly utilized during peak summer days.
Converting two travel lanes on 57th Drive between 57th Street and North Midway Plaisance into parking lanes is an option that is under consideration that could provide approximately 80 new parking spaces.
The provision of an additional left-turn lane on South Midway Plaisance with its intersection at Stony Island Avenue will result in the removal of approximately 14 spaces from the north side of South Midway Plaisance.
With a total projected loss of 316 spaces and gain of 80 spaces, the net loss in on-street parking supply due to the proposed roadway changes would be approximately 236 parking spaces.

Jackson Park Revitalization Traffic Impact Study Final Report – February 2018 5-5
Table 5-1: On-Street Parking Supply
Note: All on-street parking within the study area is unmetered.
5.3.2 Parking Utilization Sam Schwartz also conducted a parking utilization survey in Jackson Park to determine the existing parking demand within the park. The surveys were conducted on Saturday, September 30, 2017. On-street surveys were conducted three times between 1:00 PM and 5:00 PM, and off-street parking lots were surveyed once at various times from 1:00 to 5:00 PM. Table 5-2 shows the results of the parking survey compared with existing and future supply. The highest parking demand occurred at approximately 3:00 PM with a peak of 270 vehicles parked on-street. Overall, the numbers show there was ample available on-street parking at the time of the count. Specifically, the only area where demand exceeded future supply was on Hayes Drive where 33 vehicles would no longer be allowed to park.
As shown in the table, there are off-street lots that could accommodate the loss of on-street spaces; however, all but one of these off-street lots are metered/paid lots. As shown, at least 500 unoccupied off-street spaces were observed within the off-street parking lots, excluding the MSI lots where data was not collected on the day of the observations.
Segment From To
Approximate
Existing Supply
(Legal)
Impact of Traffic
Mitigation
Approximate
Future Supply
56th Street Shore Dr Stony Island 101 101
Everett Avenue 56th Cornell 18 18
57th Drive 57th Midway 0 +80 80
Stony Island Avenue 56th 59th 102 102
59th 60th 0 0
60th 61st 41 ‐20 21
61st 62nd 19 ‐10 10
62nd 63rd 42 42
63rd 67th 76 76
Hayes Drive LSD Richards 65 ‐65 0
Richards Cornell 82 ‐82 0
Richards Drive Hayes Marquette 78 78
Marquette Drive LSD Richards 40 40
Richards Stony Island 125 ‐125 0
S. Midway Plaisance Stony Island Rail Viaduct 52 ‐14 38
Total 842 ‐236 607
Parking Supply

Jackson Park Revitalization Traffic Impact Study Final Report – February 2018 5-6
Table 5-2: Parking Utilization
Segment From ToApproximate
Future Supply1:00PM 3:00PM 5:00PM
56th Street Shore Dr Stony Island 101 88 95 97
Everett Avenue 56th Cornell 18 17 17 18
57th Drive 57th Midway 80 0 0 0
Stony Island Avenue 56th 59th 102 59 62 60
59th 60th 0 0 0 0
60th 61st 21 3 6 3
61st 62nd 10 8 6 10
62nd 63rd 42 0 0 1
63rd 67th 76 46 37 37
Hayes Drive LSD Richards 0 3 5 0
Richards Cornell 0 30 27 4
Richards Drive Hayes Marquette 78 1 1 0
Marquette Drive LSD Richards 40 11 14 16
Richards Stony Island 0 0 0 0
TOTAL 569 266 270 246
Supply
A 63rd Street Beach 168
B
Southwest Quadrant of
Lake Shore Drive and
Hayes Drive
63
C
Northwest Quadrant of
Lake Shore Drive and
Hayes Drive
202
D
Northeast Quadrant of
Cornell Drive and
Hayes Drive
170
E North of Tennis Courts 18
F South and East of MSI 226
G Directly East of MSI 76
H
Underground Museum
of Science and Industry
Garage
1,405
TOTAL 2,328
On‐Street Parking
Unknown
Free
Metered
Metered
Paid/Attendant
Unknown
Parking Demand (Saturday, Sept 30)
Maximum Parking Demand (Saturday, Sept 30)
57
3
17
Off‐Street Parking Lots
12
8
Unknown
Type
Metered
Metered
Metered
Metered

Jackson Park Revitalization Traffic Impact Study Final Report – February 2018 6‐1
6.0 OPC SITE AND CURBSIDE CHARACTERISTICS The OPC will include a museum dedicated to the presidency of Barack Obama, the 44th President of the United States, as well as hosting programs of the Obama Foundation and community. This section describes how the transportation-related components of the OPC site will interface with the right-of-way and public realm. It describes loading dock access and operations, parking garage access, general pedestrian access points, and bike facilities. Curbside uses along the east side of Stony Island are also discussed, including bus and visitor pick-ups and drop-offs.
6.1 Service Access and Loading Docks
Delivery/loading access to and from the OPC center is proposed via an underground service area within the OPC site. The service access drive is proposed on the east side of Stony Island Avenue, north of 61st Street, and will provide access to eight VIP parking spaces and a loading dock with three bays (including trash). All vehicles will be scheduled and will gain access to the service entrance via a secure gate along Stony Island Avenue. Security screenings and truck maneuvering will both occur entirely on-site. The current design can accommodate a WB-40 design vehicle. The driveway will be full-access from Stony Island Avenue and will provide one inbound lane and one outbound lane with outbound movements under stop-sign control.
The following delivery types and frequencies are anticipated:
Food service delivery/operations: 3 to 5 times per week Trash removal: 3 to 5 times per week Retail deliveries: once per week Art deliveries: 1 to 2 times per month Large event delivery: 2 to 5 times per week
6.2 Garage Access
The OPC will include the construction of a maximum 450-space underground parking garage to be located on-site with access to the garage provided opposite 61st Street. The access drive will provide one inbound lane and two outbound lanes, with outbound movements under stop-sign control.
6.3 Pedestrian Access
A network of walking and multi-use paths is shown on the site plan connecting OPC with Stony Island Avenue and Jackson Park. Connection points and continuity are being coordinated with CDOT and the Park District. The main pedestrian access points into the OPC buildings will occur along Stony Island Avenue surrounding the plaza space just south of 60th Street. In an effort to increase foot traffic in the park and on Stony Island, there will be no direct pedestrian access from the parking garage to the plaza or OPC building. Instead, there will be multiple pedestrian exits from the parking garage into the park and Stony Island Avenue. Pedestrian access will also be provided on the east side of the site into Jackson Park connecting to the network of existing multi-use paths.

Jackson Park Revitalization Traffic Impact Study Final Report – February 2018 6-2
6.4 Bike Facilities
A network of walking and multi-use paths is shown on the site plan and are being coordinated with CDOT and the Park District. An east-west separated off-street multi-use path is shown north of Hayes Drive to complete the shared use bike path to Stony Island Avenue. Within the OPC site, there will be multi-use east-west paths to connect Stony Island to the paths within the park, and there will also be a main north-south multi-use path along the east side of the OPC buildings to be integrated into a future bike path along Stony Island Avenue.
A docking station associated with Divvy, Chicago’s bikeshare system, within the OPC site is being studied in coordination with CDOT and the Park District. Siting of the station should consider convenience for transit along Stony Island and connectivity with the Lakefront Trail system, as well as placement of nearby docking stations. Stations are currently provided at the following locations within the study area:
The 55th/56th/57th Street Metra Station (18 docks, ½ mile north of the site) The 59th Street Metra Station (13 docks, 500 feet west of the site) The 63rd Street Metra Station (14 docks, ½ mile southwest of the site) 64th Street and Stony Island Avenue (14 docks, ½ mile south of the site) The Museum of Science and Industry (26 docks, ¼ mile north of the site)
6.5 Curbside Operations
On-street parking will be prohibited along the east curb of Stony Island Avenue between 60th Street and 62nd Street to provide curbside space for visitor and bus pick-up and drop-off activity. Curbside uses will be organized as illustrated in Figure 6-1. Vehicular loading areas are shown in front of the OPC and adjacent to the Athletic Center; these spaces will be used for pick-ups and drop-offs by Transportation Network Companies (Uber, Lyft, etc.), taxis, and the general public. CTA bus stops are shown generally unchanged at 60th, 61st, and 62nd Streets (near-side), and CTA bus stop locations and amenities are still being coordinated with CTA and CDOT.
Charter and school bus drop-off and pick-up will also occur on the east side of Stony Island Avenue. A visitor study performed by the Obama Foundation projected a peak need of six bus loading spaces on Stony Island Avenue. Buses will be scheduled through a designated Obama Foundation process, such as Group Visitors or an Education Department. That same process will staff the curbside space to greet buses and manage their flow. As buses will not be allowed to park on campus, several possibilities for bus parking have been identified and are being analyzed for feasibility. The most viable options will be presented to CDOT for their review and comment over the next few months.

Jackson Park Revitalization Traffic Impact Study Final Report – February 2018 6‐3
Figure 6-1: OPC Curbside and Access Plan

Jackson Park Revitalization Traffic Impact Study Final Report – February 2018 7‐1
7.0 CONCLUSION The City of Chicago and Chicago Park District are considering a large-scale revitalization plan for Jackson Park that would increase green space, improve pedestrian connectivity, and create new and upgraded facilities. As part of the that revitalization plan, Cornell Drive would be closed between North Midway Plaisance and Hayes Drive, South Midway Plaisance would be closed between Stony Island Avenue and Cornell Drive, and Marquette Drive would be closed between Stony Island Avenue and Richards Drive. Traffic mitigation in the form of signal timing and phasing changes, parking regulation changes, and capital improvements along key roadways and at key intersections to increase capacity would be implemented along with the roadway closures to accommodate the changes in traffic patterns. By providing acceptable levels of service for traffic flow, bus transit demand can also be accommodated through the future horizon year.
The traffic analysis results for the weekday AM and PM peak hours show that the proposed improvements would successfully mitigate any potential traffic impacts in the 2040 horizon year and there would be no significant traffic impacts as a result of the proposed project.
A parking analysis was performed that shows the proposed on-site parking would be sufficient to accommodate the projected peak parking demand for the OPC site. Due to the proposed roadway changes, there would be a net loss in on-street parking supply of 236 spaces within the study area, leaving a total on-street parking supply of 569 spaces, which can still accommodate the surveyed peak demand of 270 parked cars. There is additional parking available for a fee in the public parking lots within Jackson Park.