j31800_micro hydro report - friends of the ... - peak · pdf filepeak power: developing micro...
TRANSCRIPT
PEAK POWER:DEVELOPING MICRO HYDRO POWER
IN THE PEAK DISTRICT

This project was principally supported by a grant from the Peak DistrictSustainable Development Fund (SDF – Defra funded, operated by the Peak
District National Park Authority) plus additional grants from the East MidlandsCommunity Renewables Initiative (CRI, administered by the East Midlands
Regional Assembly, EMRA) and the Chesterfield Steels Group, corporate sponsorsof Friends of the Peak District.
This report was written by Graham Woods and Andy Tickle (of Friends of thePeak District), Paul Chandler and John Beardmore (of T4Sustainability Ltd) with
a contribution by Richard Pymm (of the Devon Association for RenewableEnergy) on behalf of Friends of the Peak District.
© Friends of the Peak District 2010.
All Ordnance Survey maps are reproduced with permission
under Licence No. LA 100005734 and Licence No. WL 10972.
Designed as a downloadable PDF by Northend Creative Print Solutions, Sheffield.
All uncredited photos: Graham Woods & Andy Tickle/Friends of the Peak District.
Cover photo: Monsal Dale, Graham Dunn
Chesterfield Steels Group
PEAK POWER:DEVELOPING MICRO HYDRO POWER
IN THE PEAK DISTRICT
Graham Woods, Andy Tickle, Paul Chandler and John Beardmore
with an additional contribution by Richard Pymm
March 2010
© Friends of the Peak District

Table of contents ii-iii
Foreword by Hilary Benn, MP, Secretary of State, DEFRA iv
Preface by Narendra Bajaria, CBE, Chair, PDNPA v
Disclaimer/Acknowledgments vi
CHAPTER 1 - INTRODUCTION 1The Peak District micro hydro project 1
The vision 1
Aims and objectives 1
Study approach 2
The need 2
Setting the challenge – the national context 2
Planning for renewables 3
Regional targets 3
The local challenge 3
Recent hydro developments in the Peak District 4
Scope and structure of the report 5
CHAPTER 2 – MICRO HYDRO POWEREXPLAINED 6Background 6
Small scale hydro power 7
Hydropower basics 7
Power 7
Typical layouts 8
Technology 8
Context 8
Waterwheels 8
Archimedes screw 10
Turbines 11
Screens 14
CHAPTER 3 – LICENSING, ENVIRONMENTALAND PLANNING ISSUES 16Introduction 16
Licensing and the river environment – the EnvironmentAgency’s role 16
Environmental assessment 17
Licences 17
Flow control 18
Historic rights 18
Catchment Abstraction Management Strategies 18
River Basin Management Plans 18
Fish passage 19
Planning 19
Initial advice 19
Ecological issues 20
Protected species 20
Cultural heritage issues 22
Electrical connection – planning issues 22
Land ownership issues 22
CHAPTER 4 – HOW TO SCOPE ANDIMPLEMENT A MICRO HYDRO SCHEME 23Introduction 23
Initial site assessment 23
Head 24
Flow 24
Demand assessment 25
Finance 26
Costs 26
Grants 26
Loans 27
Community schemes 27
Revenue 28
Electricity generation 29
Electrical connection 29
Off grid systems 30
Grid connected systems 30
Electricity sales 30
Heat from hydro 31
Heat pump systems 31
Hybrid systems 31
CHAPTER 5 – SURVEYING HYDROPOWERPOTENTIAL IN THE PEAK DISTRICT 32Introduction 32
Consultation with key stakeholders and local communities 32
Existing Peak hydro power capacity 32
Water and sewerage companies 33
Desk study and ‘walk over’ assessment 33
Old mill sites 34
Non-mill sites 34
Geographical Information System (GIS) screening 34
GIS screening and its limitations 34
Data sets used 35
Site assessments 35
Table of contents
ii

Site maps 36
Sites outside the National Park boundary 36
Further site investigations 36
Results from the GIS analysis – commentary 37
Old mill sites 37
Non-mill sites 40
CHAPTER 6 – KEY CASE STUDY SITES 43Background 43
Methodology 43
Key case study site choice 43
Follow up data gathering and analysis 43
Case studies: analysis and commentary 44
Major residential mill conversion: Bamford Mill 44
Working heritage mill with upgrade potential: Caudwell’s Mill 45
Planned conversion to residential units: Diggle Mill 47
Reinstating hydro in a historic estate landscape: Edensor Mill 49
Non-mill site, high head on natural watercourse: Grinds Brook 50
Reinstatement of historic site undergoing conversion tomixed use development: Lumford Mill 52
Potential urban community scheme, low flows: Marsden 53
Pico DIY/bespoke private scheme, low flows: Millthorpe 55
Reinstatement of existing industrial site with low flows:Bonsall (Via Gellia) Mill(s) 56
Potential rural community scheme: Whitelee Mill 57
Overview of key case study sites 59
CHAPTER 7 – CONCLUSIONS ANDRECOMMENDATIONS 61Overview 61
Assessing future micro hydro power capacity in the Peak District 61
Data limitations 62
Overall PDNP hydro capacity 62
Next steps 63
Local engagement and action 63
Political engagement and action 64
Overall recommendations 64
REFERENCES 65
GLOSSARY OF SELECTED HYDRO TERMS 67
APPENDICESAPPENDIX A
A1: Potential old mill micro hydro sites within the Peak District National Park 68
A2: Potential micro hydro sites outside the Peak District National Park 71
A3: Potential non-mill micro hydro sites within the Peak District National Park 73
A4: Old mill sites with little/no micro hydro powerpotential 74
A5: Potential hydro sites ranked by installed capacity 77
APPENDIX B
List of sites assessed by GIS constraints model 79
B1: GIS site assessment and maps for old mill sites within the PDNP 80
B2: GIS site assessments and maps for non-mill siteswithin the PDNP 160
B3: GIS site assessments and maps for sites outside the PDNP 168
APPENDIX C
DARE final report on HydrA desktop studies 198
APPENDIX D
T4Sustainability report on grid connection analysis and outline hydro plant costs 219
APPENDIX E
Useful contacts (web addresses): hydro and relatedequipment suppliers/agents; grant bodies; other sources of useful information 222
APPENDIX F
Membership of the hydro project advisory group 225
iii

iv
FOREWORD BY HILARY BENN, MP, SECRETARY OF STATE FOR THE ENVIRONMENT,FOOD AND RURAL AFFAIRSIn 2009 I was fortunate enough to visit the Peak District National Park, to celebrate the 60thanniversary of the legislation which established England’s wonderful National Parks.
While I was there I was delighted to hear about the work which Friends of the Peak District andothers are doing to explore the potential of small scale hydro power. The challenges which face uson climate change are huge and will require a global agreement. But they also need small scaleanswers with individual households and businesses taking responsibility for doing something. Andthat is where Friends of the Peak District’s work fits in. It is striking that in many of our rural areaswe were making more use of water power in the 19th century than we did in the 20th.
That needs to change, hence the importance of the work which Friends of the Peak District isdoing with its partners. I am delighted that these include the National Park Authority, which Iknow has also helped with finance from its Sustainable Development Fund. Of course any new ideabecomes much more powerful when we can actually see it working in practice and that’s why thecase studies in this report are so valuable. They show just how viable hydro power is in lots ofplaces.
Hilary Benn
v
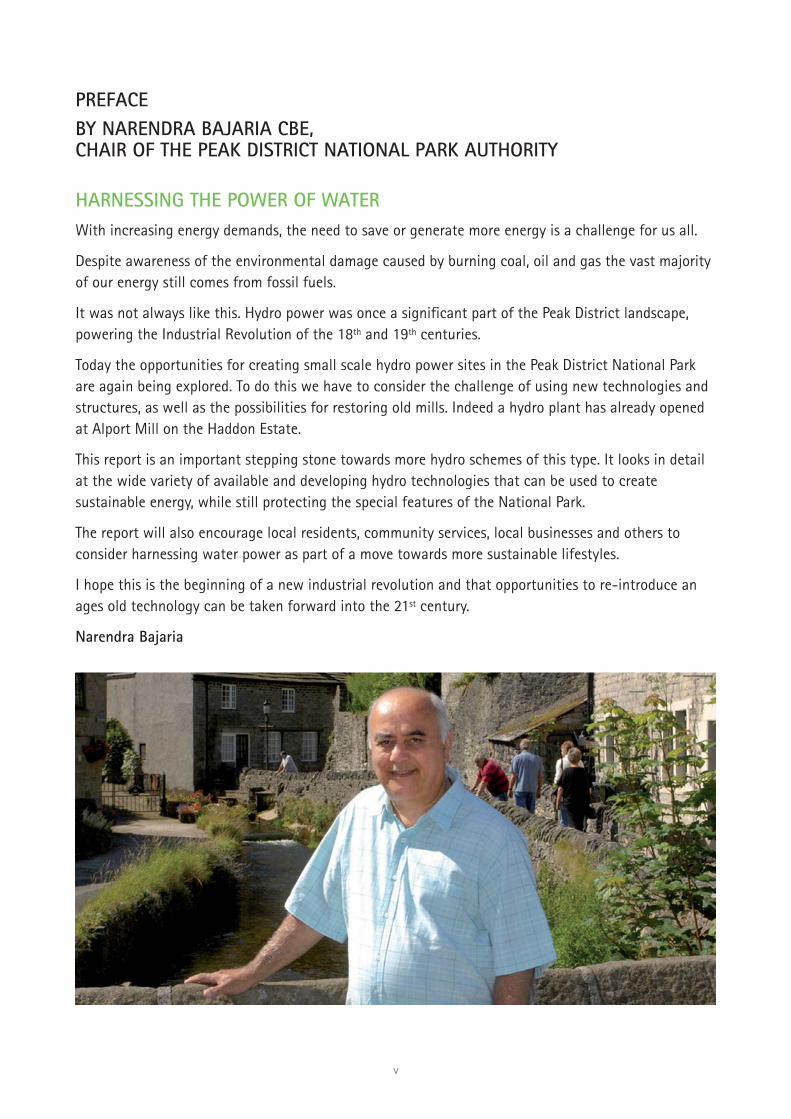
PREFACE BY NARENDRA BAJARIA CBE, CHAIR OF THE PEAK DISTRICT NATIONAL PARK AUTHORITY
HARNESSING THE POWER OF WATERWith increasing energy demands, the need to save or generate more energy is a challenge for us all.
Despite awareness of the environmental damage caused by burning coal, oil and gas the vast majorityof our energy still comes from fossil fuels.
It was not always like this. Hydro power was once a significant part of the Peak District landscape,powering the Industrial Revolution of the 18th and 19th centuries.
Today the opportunities for creating small scale hydro power sites in the Peak District National Parkare again being explored. To do this we have to consider the challenge of using new technologies andstructures, as well as the possibilities for restoring old mills. Indeed a hydro plant has already openedat Alport Mill on the Haddon Estate.
This report is an important stepping stone towards more hydro schemes of this type. It looks in detailat the wide variety of available and developing hydro technologies that can be used to createsustainable energy, while still protecting the special features of the National Park.
The report will also encourage local residents, community services, local businesses and others toconsider harnessing water power as part of a move towards more sustainable lifestyles.
I hope this is the beginning of a new industrial revolution and that opportunities to re-introduce anages old technology can be taken forward into the 21st century.
Narendra Bajaria

vi
DISCLAIMER
This report was produced by Friends of the Peak District (withcontributions from T4Sustainability and Richard Pymm of theDevon Association for Renewable Energy, DARE) to investigateand promote the potential for renewable energy from microhydro power installations in the Peak District. Its specificpurpose is not to act as an expert feasibility study thoughclearly we hope that the information collated in the report isof use in helping focus on and resolve site-based issues.
The contents of this report represents the views of Friends ofthe Peak District, with specialist technical input fromT4Sustainability. This report is not binding on the Peak DistrictNational Park Authority or neighbouring planning authoritiesin the determination of any subsequent planning applicationwhich would be judged on the merits of any scheme comingforward. Any comments in this report relating to theEnvironment Agency do not prejudge any decision orguidance on licensing.
The report (save photographs where copyright is elsewhere)may be used and reproduced by any person but we ask thatthe source and its authors are acknowledged when originalmaterial is cited or used. In any event, Friends of the PeakDistrict, T4Sustainability or DARE accept no liability for anycosts, liabilities or losses arising as a result of the use orreliance upon the contents of this report by any person.
All landowners or other interested parties should be fullyaware that further assessment will be required before thesuitability of a site is fully understood. The content of thisreport does not constitute legal advice.
ACKNOWLEDGEMENTS
The project team wishes to acknowledge the significant timeand input of all the owners and other parties interested inhydro sites in helping with information and access to theirland, rivers and weirs. In particular, we acknowledge theaccess given by the Chatsworth and Haddon estates anddialogue with them and their agents, in particular Jon Needleand Olly Paish at Derwent Hydro Power (DHP) who developedAlport Mill for the Haddon Estate. DHP gave much help andadvice throughout the project and also provided a number ofillustrations, as did the British Hydropower Association. Weare also very grateful to Hilary Benn (and his staff) andNarendra Bajaria for their kind words of support.
We also thank the project advisory group for their inputthroughout the project and particularly at the inception andmid-term review stages. Richard Pymm of DARE did sterlingwork from a distance to ensure the HydrA flow studies andthe accompanying advice were as accurate as possible. Webenefited greatly from the Dartmoor hydro work by DAREwhich preceded and inspired this report.
Local Environment Agency staff, including Margaret Neal, Jim Finnegan and Steve Tupper, also helped and advised onvarious issues, and staff from other EA regions helped usunderstand the hydro implications of relevant elements oftheir local CAMS documents. We are grateful for the help andassistance of Richard Hall of Yorkshire Water, Martin Dent atSevern Trent Water and various staff at United Utilities inidentifying existing and potential schemes within theirownership. Officers at the Peak District National ParkAuthority, including Judith Fidler, Frances Horsford, JohnLomas, Brian Taylor, and Sarah Whiteley, all made helpfulcomments especially during the project write-up. Dr JohnBarnatt of the Peak District Mines Historical Society alsocommented on the use of soughs. However any errors oropinions in this report remain those of the authors on behalfof FPD.
We are indebted to Richard Godley, the SDF officer, for hishuge and unwavering commitment to see the project throughto completion. We also thank the PDNPA and the East PeakInnovation Partnership (EPIP) for funding the final communityworkshop which was ably delivered by Steve Welsh of WaterPower Entreprises (H2OPE). We also thank Helen Chadwickand Murray Hunter for their help in delivering the CRI/EMRAfunding and Berenice Wilson and Adrian Cole of theChesterfield Steels Group for their generosity.

Peak Power | page 1
1.1 THE PEAK DISTRICT MICRO HYDRO PROJECT
This report has been produced by Friends of the Peak District(FPD) in conjunction with technical input from renewableenergy consultants, T4Sustainability (T4S) and the DevonAssociation for Renewable Energy (DARE). DARE pioneeredsurveying hydro power potential in a national park (Dartmoor)context (DARE, 2004) and also devised a survey template thatcould be applied in other designated landscapes (Pymm,2005), which formed the starting point for the Peak Districtmicro hydro1 project. This project, spread over more than twoyears, was funded principally by the Peak District SustainableDevelopment Fund (SDF – Defra funded, operated by theNational Park Authority) with a further contribution from theEast Midlands’ Community Renewables Initiative (CRI,operated by the East Midlands Regional Assembly) andcorporate sponsorship from the Chesterfield Steels Group(CSG).
The micro hydro project deals primarily with the identificationand assessment of rivers and streams in the Peak Districtwhere micro hydro power (MHP) could be reinstated ordeveloped from new. It draws in part on previous national andregional studies (Salford Civil Engineering Ltd, 1989, usuallyknown as the ‘ETSU report’; LUC and IT Power, 2001) whichidentified a number of potential Peak District sites. Thecurrent study attempts to assess further potential for microhydro power in the Peak, focusing predominantly onopportunities for reinstating old mill sites.
The project team comprised a part-time hydro project officer(water engineer Graham Woods), based with FPD, whooversaw the literature and technology reviews and the sitesurvey work. Technical expertise was provided by PaulChandler and John Beardmore, directors at T4S, who devisedand ran the Geographic Information Systems (GIS) constraintsscreening model and also advised on case study turbinechoices and costs. Technical site assessments for the key casestudies (principally modelled flow and power predictions
using the HydrA model) were commissioned from RichardPymm, a DARE director. The project was managed and drawntogether by FPD’s Head of Planning, Andy Tickle.
The overall progress and direction of the project was steeredby a project advisory group (see Appendix F) comprisingrepresentatives of the regional water and seweragecompanies (Yorkshire Water, United Utilities and SevernTrent); the hydro industry; key PDNPA officers plus a memberof the National Park Authority with experience of the waterindustry; the Environment Agency; English Heritage and twohydro/renewable energy experts drawn from academia.
1.2 THE VISIONThe vision for this project was to identify a comprehensive dataset of potential micro hydro power sites in the Peak District,paving the way for enhanced uptake of hydro-based renewableenergy (RE) schemes by residents, larger landowners and localcommunities in the National Park and beyond. This shouldhelp meet local, regional and national policy targets to offsetthe damaging impacts of climate change.
By addressing residents, landowners and communities, theproject aimed to raise general awareness of the need forincreased RE (appropriate to the special characteristics of theNational Park). The project should also help to identify how tomeet the national need for renewable energy whilstrespecting the statutory purposes and duty enshrined inNational Park legislation.
1.3 AIMS AND OBJECTIVESThe overall aim of the project was to produce acomprehensive survey of micro hydro power potential in thePeak District National Park (PDNP) area and its immediatesurroundings. The results are produced in full in this technicalreport. A separate popular booklet, summarising the projectfindings for wider circulation and awareness raising, has alsobeen produced.
Chapter 1 Introduction
Chapter 1 Introduction
1 Micro hydro power usually describes schemes with capacities between 10-100 kilowatts (kW); small scale hydro is used to describe schemes between100 kW-2 megawatts (MW); schemes under 10 kW are sometimes referred to as ‘pico’.

page 2 | Peak Power
Chapter 1 Introduction
The project has involved the local community, initially via twoconsultation events (in the north and south of the PeakDistrict: Glossop and Cromford). These were aimed at raisingawareness of the opportunities for private or community-ledhydro projects (or other RE schemes if more appropriate) andwere useful in obtaining feedback on the project at aformative stage, including suggestions of potential sites. Atthe end of the project, a further workshop (jointly organisedby FPD, the PDNPA and Water Power Entreprises, H2OPE) washeld in Low Bradfield, on how to develop a community hydroscheme.
The project’s specific objectives were as follows:• To introduce and overview currently available hydro power
technology and to review opportunities and constraints toits introduction in the Peak District
• To set out the policy and legal frameworks associated withgaining permission to develop a micro hydro scheme
• To give practical advice on dealing with site issues such asthe water environment, ecology, archaeology, landscapeimpact, access for civil works, electrical connection etc
• To use appropriate datasets (including GIS information) toidentify possible sites for micro hydro installations
• To create accessible databases with site listings that will beavailable to residents, landowners, communities and otherinterested parties (e.g. PDNPA planners, statutory agencies,other local authorities)
• To consult and engage with parish councils, localcommunities and residents to help raise awareness of hydropower potential in the Peak District
• To investigate the opportunities for innovative low headschemes (including modern waterwheel technology) andrefurbishment of existing historic mill sites; also to scopethe potential use of water flows from lead mine drainagechannels (soughs) – a typical and historic Peak Districtresource
• To encourage and facilitate the assessment of potentialhydro power sites with the intention to bring forward newschemes, in particular using a set of key case study sites asexemplars of different types of micro hydro opportunities
• To provide helpful information on recent micro hydroschemes in the Peak District and other UK designatedlandscapes as potential models for development
• To publish a full report on the project’s main findings whichwill be an authoritative reference source for potential smallscale hydro scheme developers and those who assess orcomment on such schemes (statutory consultees, plannersand interested third parties such as local communities,amenity groups, wildlife trusts etc)
• To disseminate the project findings more widely through anattractive and accessible booklet illustrating hydro powerpotential and best practice in a National Park perspective
1.4 STUDY APPROACH
To realise the project objectives the following broad approachwas taken to gathering the relevant data:i Literature reviews of current hydro technologies, planning
and licensing regimes for micro hydro schemes andgathering information on specialist hydro suppliers andgrants currently available for hydro schemes
ii A desk study of all known old mill and other potentialmicro hydro sites, using specialist publications, databasesand map-based resources; this was augmented by wideconsultation with local communities, parish councils andkey landowners who nominated additional potential sites
iii Walk-over surveys (117) of many of the sites identified inthe desk study (162) to assess potential fordevelopment/re-development
iv An assessment of the major constraints (planning,environmental, cultural, electrical connection) affectingthe sites with the most potential: this involved creating anovel GIS computer model to screen 59 sites
v Undertaking more detailed investigations, in liaison withlocal landowners and/or stakeholders, of 20 key sites ofwhich 10 were developed into case studies where thefeasibility of a scheme was assessed, design optionsconsidered and recommendations developed
1.5 THE NEED1.5.1 Setting the challenge – the national contextIn 2003 the UK Government published the Energy WhitePaper Our energy future – creating a low carbon economy (DTI,2003). This paper highlighted three major energy challengesthat face the UK:• climate change – to help lessen the effects of climate
change, there must be a reduction in greenhouse gasemissions
• security of supply – within a few years the UK will nolonger be self sufficient in energy and is expected tobecome a net importer of gas
• ageing energy infrastructure – many conventional andnuclear power stations need massive investment,replacement or closure by 2020.
In October 2006 the Stern Review on the Economics ofClimate Change was published2 and it made clear that actionwas required quickly to mitigate climate change. The UKGovernment reacted quickly to the review and soon promoteda UK target of 60% reduction in CO2 by 2050. More recently,evolving scientific evidence of climate change and increasingdomestic and international pressure has led the UKGovernment to set even more demanding targets for thereduction of greenhouse gas emissions, including CO2, thatcause adverse climate change.
2 See http://www.occ.gov.uk/activities/stern.htm (see also Stern, 2007).
Peak Power | page 3
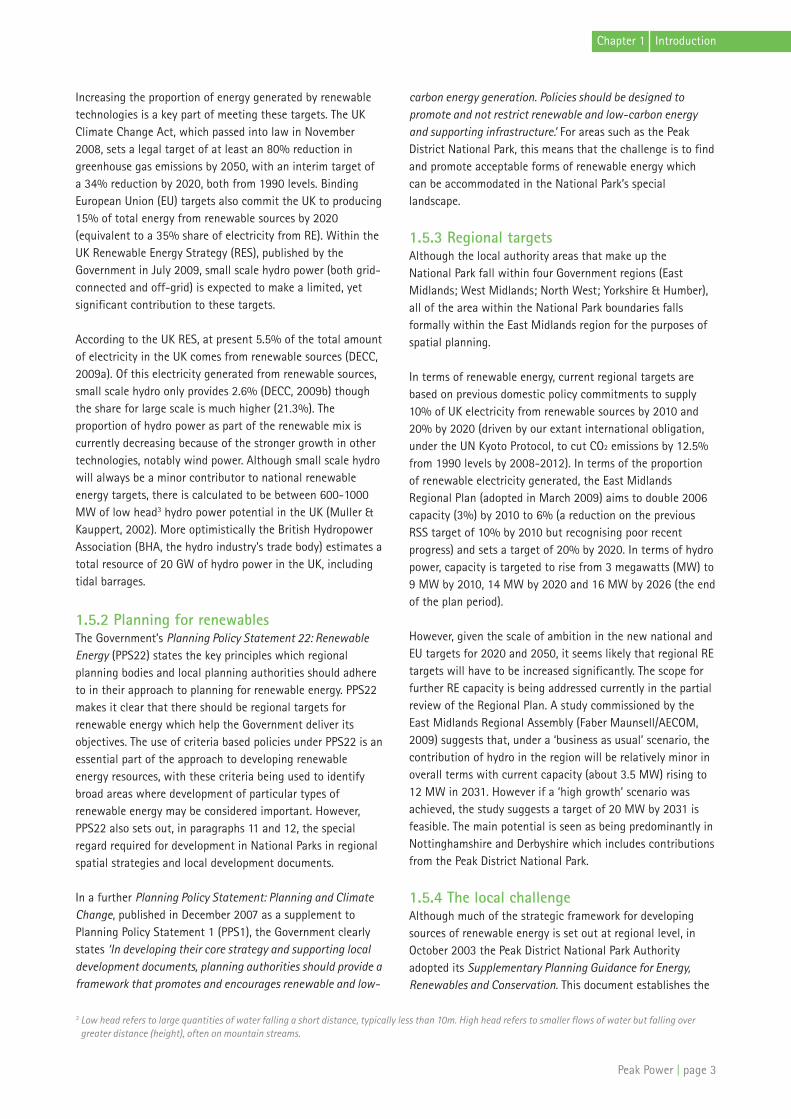
Increasing the proportion of energy generated by renewabletechnologies is a key part of meeting these targets. The UKClimate Change Act, which passed into law in November2008, sets a legal target of at least an 80% reduction ingreenhouse gas emissions by 2050, with an interim target ofa 34% reduction by 2020, both from 1990 levels. BindingEuropean Union (EU) targets also commit the UK to producing15% of total energy from renewable sources by 2020(equivalent to a 35% share of electricity from RE). Within theUK Renewable Energy Strategy (RES), published by theGovernment in July 2009, small scale hydro power (both grid-connected and off-grid) is expected to make a limited, yetsignificant contribution to these targets.
According to the UK RES, at present 5.5% of the total amountof electricity in the UK comes from renewable sources (DECC,2009a). Of this electricity generated from renewable sources,small scale hydro only provides 2.6% (DECC, 2009b) thoughthe share for large scale is much higher (21.3%). Theproportion of hydro power as part of the renewable mix iscurrently decreasing because of the stronger growth in othertechnologies, notably wind power. Although small scale hydrowill always be a minor contributor to national renewableenergy targets, there is calculated to be between 600-1000MW of low head3 hydro power potential in the UK (Muller &Kauppert, 2002). More optimistically the British HydropowerAssociation (BHA, the hydro industry’s trade body) estimates atotal resource of 20 GW of hydro power in the UK, includingtidal barrages.
1.5.2 Planning for renewablesThe Government’s Planning Policy Statement 22: RenewableEnergy (PPS22) states the key principles which regionalplanning bodies and local planning authorities should adhereto in their approach to planning for renewable energy. PPS22makes it clear that there should be regional targets forrenewable energy which help the Government deliver itsobjectives. The use of criteria based policies under PPS22 is anessential part of the approach to developing renewableenergy resources, with these criteria being used to identifybroad areas where development of particular types ofrenewable energy may be considered important. However,PPS22 also sets out, in paragraphs 11 and 12, the specialregard required for development in National Parks in regionalspatial strategies and local development documents.
In a further Planning Policy Statement: Planning and ClimateChange, published in December 2007 as a supplement toPlanning Policy Statement 1 (PPS1), the Government clearlystates ‘In developing their core strategy and supporting localdevelopment documents, planning authorities should provide aframework that promotes and encourages renewable and low-
carbon energy generation. Policies should be designed topromote and not restrict renewable and low-carbon energyand supporting infrastructure.’ For areas such as the PeakDistrict National Park, this means that the challenge is to findand promote acceptable forms of renewable energy whichcan be accommodated in the National Park’s speciallandscape.
1.5.3 Regional targetsAlthough the local authority areas that make up the National Park fall within four Government regions (EastMidlands; West Midlands; North West; Yorkshire & Humber),all of the area within the National Park boundaries fallsformally within the East Midlands region for the purposes ofspatial planning.
In terms of renewable energy, current regional targets arebased on previous domestic policy commitments to supply10% of UK electricity from renewable sources by 2010 and20% by 2020 (driven by our extant international obligation,under the UN Kyoto Protocol, to cut CO2 emissions by 12.5%from 1990 levels by 2008-2012). In terms of the proportion of renewable electricity generated, the East MidlandsRegional Plan (adopted in March 2009) aims to double 2006capacity (3%) by 2010 to 6% (a reduction on the previousRSS target of 10% by 2010 but recognising poor recentprogress) and sets a target of 20% by 2020. In terms of hydropower, capacity is targeted to rise from 3 megawatts (MW) to9 MW by 2010, 14 MW by 2020 and 16 MW by 2026 (the endof the plan period).
However, given the scale of ambition in the new national andEU targets for 2020 and 2050, it seems likely that regional REtargets will have to be increased significantly. The scope forfurther RE capacity is being addressed currently in the partialreview of the Regional Plan. A study commissioned by theEast Midlands Regional Assembly (Faber Maunsell/AECOM,2009) suggests that, under a ‘business as usual’ scenario, thecontribution of hydro in the region will be relatively minor inoverall terms with current capacity (about 3.5 MW) rising to12 MW in 2031. However if a ‘high growth’ scenario wasachieved, the study suggests a target of 20 MW by 2031 isfeasible. The main potential is seen as being predominantly inNottinghamshire and Derbyshire which includes contributionsfrom the Peak District National Park.
1.5.4 The local challengeAlthough much of the strategic framework for developingsources of renewable energy is set out at regional level, inOctober 2003 the Peak District National Park Authorityadopted its Supplementary Planning Guidance for Energy,Renewables and Conservation. This document establishes the
Chapter 1 Introduction
3 Low head refers to large quantities of water falling a short distance, typically less than 10m. High head refers to smaller flows of water but falling overgreater distance (height), often on mountain streams.
page 4 | Peak Power
Chapter 1 Introduction
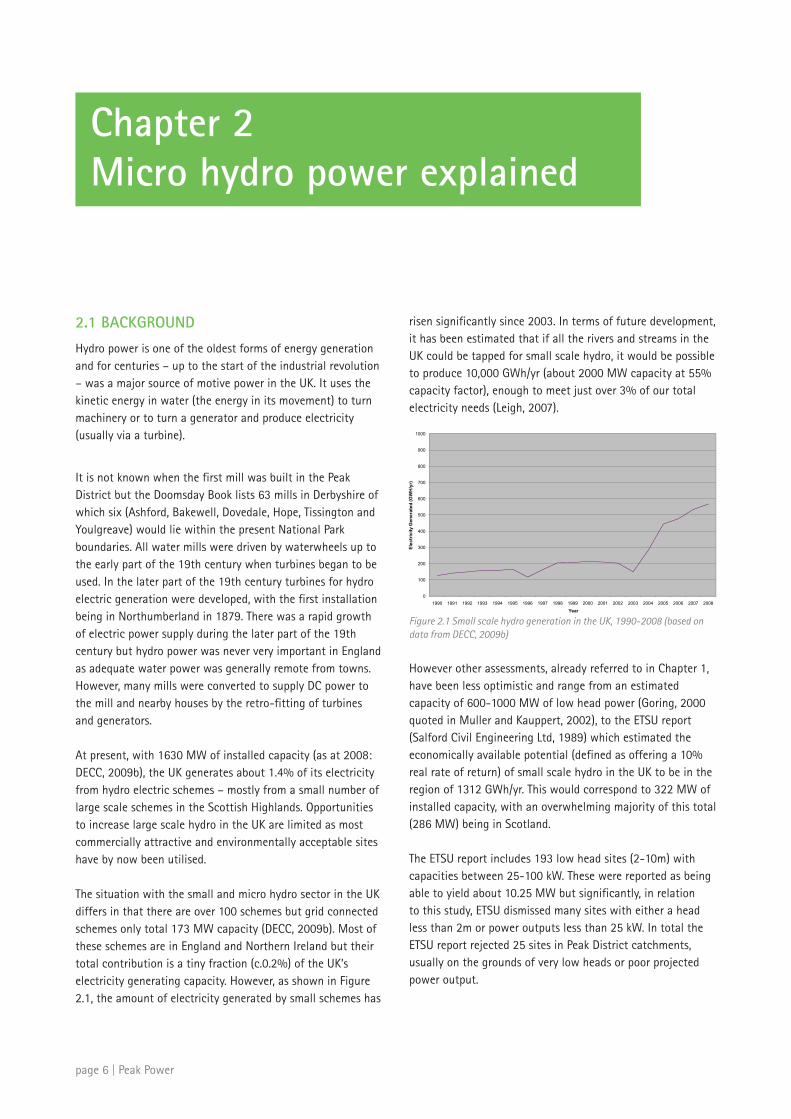
Figure 1.2 The newly installed crossflow turbine at Alport Mill (photo courtesy of Derwent Hydro)
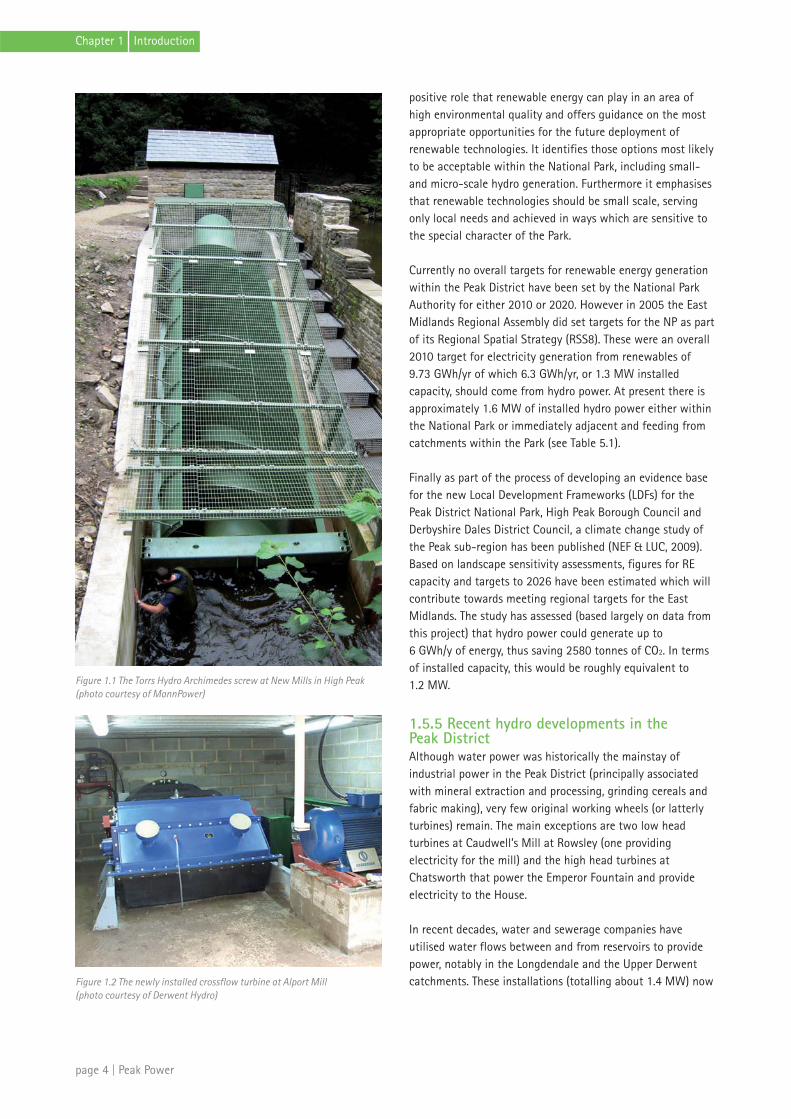
Figure 1.1 The Torrs Hydro Archimedes screw at New Mills in High Peak(photo courtesy of MannPower)
positive role that renewable energy can play in an area ofhigh environmental quality and offers guidance on the mostappropriate opportunities for the future deployment ofrenewable technologies. It identifies those options most likelyto be acceptable within the National Park, including small-and micro-scale hydro generation. Furthermore it emphasisesthat renewable technologies should be small scale, servingonly local needs and achieved in ways which are sensitive tothe special character of the Park.
Currently no overall targets for renewable energy generationwithin the Peak District have been set by the National ParkAuthority for either 2010 or 2020. However in 2005 the EastMidlands Regional Assembly did set targets for the NP as partof its Regional Spatial Strategy (RSS8). These were an overall2010 target for electricity generation from renewables of 9.73 GWh/yr of which 6.3 GWh/yr, or 1.3 MW installedcapacity, should come from hydro power. At present there isapproximately 1.6 MW of installed hydro power either withinthe National Park or immediately adjacent and feeding fromcatchments within the Park (see Table 5.1).
Finally as part of the process of developing an evidence basefor the new Local Development Frameworks (LDFs) for thePeak District National Park, High Peak Borough Council andDerbyshire Dales District Council, a climate change study ofthe Peak sub-region has been published (NEF & LUC, 2009).Based on landscape sensitivity assessments, figures for REcapacity and targets to 2026 have been estimated which willcontribute towards meeting regional targets for the EastMidlands. The study has assessed (based largely on data fromthis project) that hydro power could generate up to 6 GWh/y of energy, thus saving 2580 tonnes of CO2. In termsof installed capacity, this would be roughly equivalent to 1.2 MW.
1.5.5 Recent hydro developments in the Peak DistrictAlthough water power was historically the mainstay ofindustrial power in the Peak District (principally associatedwith mineral extraction and processing, grinding cereals andfabric making), very few original working wheels (or latterlyturbines) remain. The main exceptions are two low headturbines at Caudwell’s Mill at Rowsley (one providingelectricity for the mill) and the high head turbines atChatsworth that power the Emperor Fountain and provideelectricity to the House.
In recent decades, water and sewerage companies haveutilised water flows between and from reservoirs to providepower, notably in the Longdendale and the Upper Derwentcatchments. These installations (totalling about 1.4 MW) now

Peak Power | page 5
Chapter 1 Introduction
form the backbone of hydro power generated in the PeakDistrict. Latterly, spurred mainly by the need to find newforms of low carbon energy generation, two new schemeshave been implemented at New Mills in the High Peak (a 70kW Archimedes screw installed in 2008 – see Figure 1.1) andAlport Mill (a 30 kW turbine installed in 2009 – see Figure1.2), near Youlgreave. These schemes readily demonstrate thepotential for both private and community-led micro hydropower in the Peak District.
Thus the Peak District is now beginning to mirror theexperience of other UK national parks, such as Dartmoor(DARE, 2004), the Brecon Beacons (e.g. the Green Valleysinitiative) and the Yorkshire Dales (Inter Hydro Technology,2009), in focusing on micro hydro power as a sustainablesource of renewable energy that does not cause significantlandscape or environmental conflicts.
1.6 SCOPE AND STRUCTURE OF THE REPORT
As stated earlier, this report focuses on assessing thepotential for developing further micro hydro power capacitywithin the PDNP, predominantly in relation to old mill sites.As the project has progressed, and in response to localstakeholder feedback, the scope was extended to sites justoutside the NP boundary but where the main part of thestream or river’s catchment lay within the National Park. Atypical example would be Hayfield in the High Peak where themain part of the village and a former weir lie just outside thepark boundary. In total 42 sites outside the PDNP wereassessed in detail (i.e. assessing local constraints with the GISmodel), compared with 120 assessed within the boundary.
The report is divided into six substantive chapters. Chapter 2introduces and explains the physical principles underpinningthe generation of power from water and the main forms oftechnology and associated infrastructure in use today.Chapter 3 covers the main regulatory issues that affect anysubstantive form of hydro power development includingwater licensing, planning permission and other necessaryconsents. Chapter 4 builds on this and explains – in simpleterms – how a hydro scheme can be taken forward from earlyscoping and assessment, what grants may be available andhow income streams can be harnessed.
Chapter 5 reviews the first two elements of the project’ssurvey of potential Peak District sites: the initial resourceassessment (all sites) followed by detailed screening of nearly60 sites with the most potential. This is followed in Chapter 6by ten key case studies focusing on differing types of microhydro opportunity in the area with recommendations for nextsteps.
Overall conclusions and recommendations are then set out inChapter 7. A series of Appendices contains detailed site dataand maps, detailed flow and power data for the key casestudy sites and information on how to access other hydro-related resources, such as hydro installers, equipmentsuppliers and sources of grants and other forms of financialassistance.
page 6 | Peak Power
Chapter 2 Micro hydro power explained
2.1 BACKGROUND
Hydro power is one of the oldest forms of energy generationand for centuries – up to the start of the industrial revolution– was a major source of motive power in the UK. It uses thekinetic energy in water (the energy in its movement) to turnmachinery or to turn a generator and produce electricity(usually via a turbine).
It is not known when the first mill was built in the PeakDistrict but the Doomsday Book lists 63 mills in Derbyshire ofwhich six (Ashford, Bakewell, Dovedale, Hope, Tissington andYoulgreave) would lie within the present National Parkboundaries. All water mills were driven by waterwheels up tothe early part of the 19th century when turbines began to beused. In the later part of the 19th century turbines for hydroelectric generation were developed, with the first installationbeing in Northumberland in 1879. There was a rapid growthof electric power supply during the later part of the 19thcentury but hydro power was never very important in Englandas adequate water power was generally remote from towns.However, many mills were converted to supply DC power tothe mill and nearby houses by the retro-fitting of turbinesand generators.
At present, with 1630 MW of installed capacity (as at 2008:DECC, 2009b), the UK generates about 1.4% of its electricityfrom hydro electric schemes – mostly from a small number oflarge scale schemes in the Scottish Highlands. Opportunitiesto increase large scale hydro in the UK are limited as mostcommercially attractive and environmentally acceptable siteshave by now been utilised.
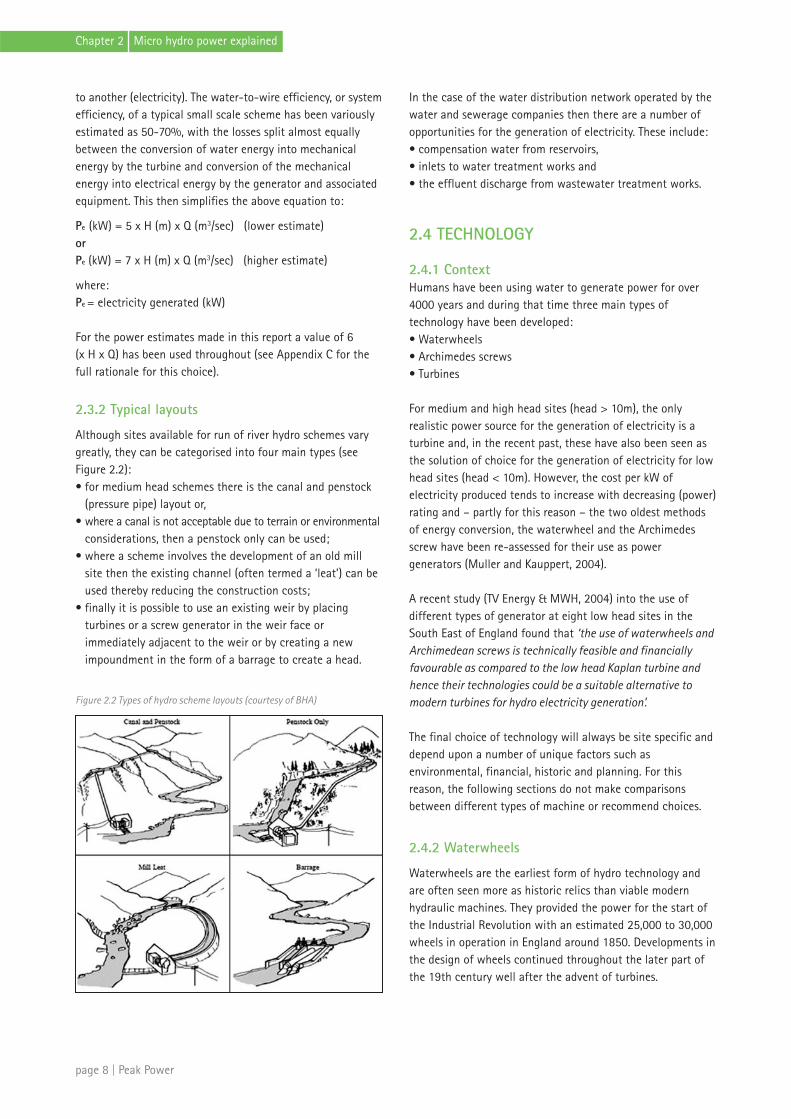
The situation with the small and micro hydro sector in the UKdiffers in that there are over 100 schemes but grid connectedschemes only total 173 MW capacity (DECC, 2009b). Most ofthese schemes are in England and Northern Ireland but theirtotal contribution is a tiny fraction (c.0.2%) of the UK’selectricity generating capacity. However, as shown in Figure2.1, the amount of electricity generated by small schemes has
risen significantly since 2003. In terms of future development,it has been estimated that if all the rivers and streams in theUK could be tapped for small scale hydro, it would be possibleto produce 10,000 GWh/yr (about 2000 MW capacity at 55%capacity factor), enough to meet just over 3% of our totalelectricity needs (Leigh, 2007).
Figure 2.1 Small scale hydro generation in the UK, 1990-2008 (based ondata from DECC, 2009b)
However other assessments, already referred to in Chapter 1,have been less optimistic and range from an estimatedcapacity of 600-1000 MW of low head power (Goring, 2000quoted in Muller and Kauppert, 2002), to the ETSU report(Salford Civil Engineering Ltd, 1989) which estimated theeconomically available potential (defined as offering a 10%real rate of return) of small scale hydro in the UK to be in theregion of 1312 GWh/yr. This would correspond to 322 MW ofinstalled capacity, with an overwhelming majority of this total(286 MW) being in Scotland.
The ETSU report includes 193 low head sites (2-10m) withcapacities between 25-100 kW. These were reported as beingable to yield about 10.25 MW but significantly, in relation to this study, ETSU dismissed many sites with either a headless than 2m or power outputs less than 25 kW. In total theETSU report rejected 25 sites in Peak District catchments,usually on the grounds of very low heads or poor projectedpower output.
0
100
200
300
400
500
600
700
800
900
1000
1990 1991 1992 1993 1994 1995 1996 1997 1998 1999 2000 2001 2002 2003 2004 2005 2006 2007 2008
Elec
tric
ity G
ener
ated
(GW
H/y
r)
Year

Peak Power | page 7
Chapter 2 Micro hydro power explained
2.2 SMALL SCALE HYDRO POWER
Although there is no internationally agreed definition of smallscale hydro, in the UK it is usually taken to mean schemeswith an output less than 2 MW. Small hydro power issomething of a catch-all category and can be broken downfurther into three size ranges:• Mini hydro schemes from 100 kW-1 MW• Micro hydro schemes from 10-100 kW• Pico hydro schemes below 10 kW
Similarly, schemes can be divided based on the head of water available at the site, with the normally acceptedclassifications being:• High head > 50m• Medium head 10-50m• Low head <10m
All the potential schemes considered in this project falloutside the mini hydro and high head categories with themajority being low head micro hydro.
It is widely considered that small scale hydro is one of themost effective and reliable energy technologies used forgenerating clean electricity. Also, as an indigenous renewablesource of energy, it helps to reduce dependence on importedfossil fuels, bringing diversity and security of supply to theUK’s energy infrastructure, as well as helping to minimise theimpact of climate change.
In particular small scale hydro offers the following keyfeatures (British Hydropower Association, 2005):
• A high efficiency (70-90%) of the turbine, screw or wheel• Constant generation over long periods unlike wind and
solar power• A high level of predictability, varying with annual rain
patterns• Slow rate of change; the power output varies only
gradually from day to day, not from minute to minute• A good correlation with demand in that output is greatest
in winter (this feature is sometimes described as ‘loadfollowing’)
• It is a long lasting and robust, tried technology; systemscan be engineered to last for over 50 years (and many havelasted longer)
• Low maintenance requirements and running costs• Reasonable payback for grid connected systems, often
10 years or less
A good quality hydro installation will generate electricity forat least 40 years. Assuming an annual saving of 1.6 tonnesper year of CO2 for a 10 kW scheme (compared with fossil fuel
generation), then over the lifetime of the scheme this wouldamount to a saving of 24 tonnes of CO2.
2.3 HYDRO POWER BASICS
Hydro power is best described as harnessing the energy ofwater to do work. The energy can be captured wherever aflow of water falls from a higher to a lower level, such aswhen a river passes over a waterfall or weir or when a streamflows down a hillside.
The vertical fall of water created either naturally (waterfall,slope) or artificially (weir) is generally considered essential forhydro power generation as fast flowing water on its own haslimited applications for power generation. The energy inwater is a function of the weight of water and the verticalheight through which it falls, usually expressed by the rate offlow, Q, and the head, H.
The rate of flow (Q) is the volume of water passing per secondand is usually expressed in cubic metres per second, m3/sec(often called ‘cumecs’).
The head (H), expressed in metres, m, is the net head appliedacross the hydro installation and, due to efficiency lossesincurred, will be less than the gross head which is themaximum available vertical fall across the site.
2.3.1 Power
Energy, measured in joules, is defined as an amount of workdone or the capacity to do work and power is the rate of workbeing done measured in watts (where 1 watt = 1 joule/sec).
Waterwheels and turbines convert kinetic energy in the waterinto mechanical power to drive a generator and therebyproduce electrical energy. The formula for the output of ahydro scheme is:
P = n p g Q H
where:• P = the mechanical power produced• n = the hydraulic efficiency of the waterwheel, turbine etc• p = the density of water (1000 kg/m3)• g = the acceleration due to gravity ( 9.81 m/s2)• Q = the volume of water (m3/sec)• H = the net head of water across the waterwheel,
turbine etc (m)
To estimate the electrical power produced it is necessary toconsider the efficiencies of the various types of plant andgenerators, which vary depending not only on the type ofplant but also on the size of scheme. Efficiency is a measureof how well power is converted from one form (water power)
page 8 | Peak Power
Chapter 2 Micro hydro power explained
to another (electricity). The water-to-wire efficiency, or systemefficiency, of a typical small scale scheme has been variouslyestimated as 50-70%, with the losses split almost equallybetween the conversion of water energy into mechanicalenergy by the turbine and conversion of the mechanicalenergy into electrical energy by the generator and associatedequipment. This then simplifies the above equation to:
Pe (kW) = 5 x H (m) x Q (m3/sec) (lower estimate)orPe (kW) = 7 x H (m) x Q (m3/sec) (higher estimate)
where:Pe = electricity generated (kW)
For the power estimates made in this report a value of 6 (x H x Q) has been used throughout (see Appendix C for thefull rationale for this choice).
2.3.2 Typical layouts
Although sites available for run of river hydro schemes varygreatly, they can be categorised into four main types (seeFigure 2.2):• for medium head schemes there is the canal and penstock
(pressure pipe) layout or, • where a canal is not acceptable due to terrain or environmental
considerations, then a penstock only can be used;• where a scheme involves the development of an old mill
site then the existing channel (often termed a ‘leat’) can beused thereby reducing the construction costs;
• finally it is possible to use an existing weir by placingturbines or a screw generator in the weir face orimmediately adjacent to the weir or by creating a newimpoundment in the form of a barrage to create a head.
Figure 2.2 Types of hydro scheme layouts (courtesy of BHA)
In the case of the water distribution network operated by thewater and sewerage companies then there are a number ofopportunities for the generation of electricity. These include: • compensation water from reservoirs, • inlets to water treatment works and • the effluent discharge from wastewater treatment works.
2.4 TECHNOLOGY
2.4.1 ContextHumans have been using water to generate power for over4000 years and during that time three main types oftechnology have been developed:• Waterwheels• Archimedes screws• Turbines
For medium and high head sites (head > 10m), the onlyrealistic power source for the generation of electricity is aturbine and, in the recent past, these have also been seen asthe solution of choice for the generation of electricity for lowhead sites (head < 10m). However, the cost per kW ofelectricity produced tends to increase with decreasing (power)rating and – partly for this reason – the two oldest methodsof energy conversion, the waterwheel and the Archimedesscrew have been re-assessed for their use as powergenerators (Muller and Kauppert, 2004).
A recent study (TV Energy & MWH, 2004) into the use ofdifferent types of generator at eight low head sites in theSouth East of England found that ‘the use of waterwheels andArchimedean screws is technically feasible and financiallyfavourable as compared to the low head Kaplan turbine andhence their technologies could be a suitable alternative tomodern turbines for hydro electricity generation’.
The final choice of technology will always be site specific anddepend upon a number of unique factors such asenvironmental, financial, historic and planning. For thisreason, the following sections do not make comparisonsbetween different types of machine or recommend choices.
2.4.2 Waterwheels
Waterwheels are the earliest form of hydro technology andare often seen more as historic relics than viable modernhydraulic machines. They provided the power for the start ofthe Industrial Revolution with an estimated 25,000 to 30,000wheels in operation in England around 1850. Developments inthe design of wheels continued throughout the later part ofthe 19th century well after the advent of turbines.
Peak Power | page 9
Chapter 2 Micro hydro power explained
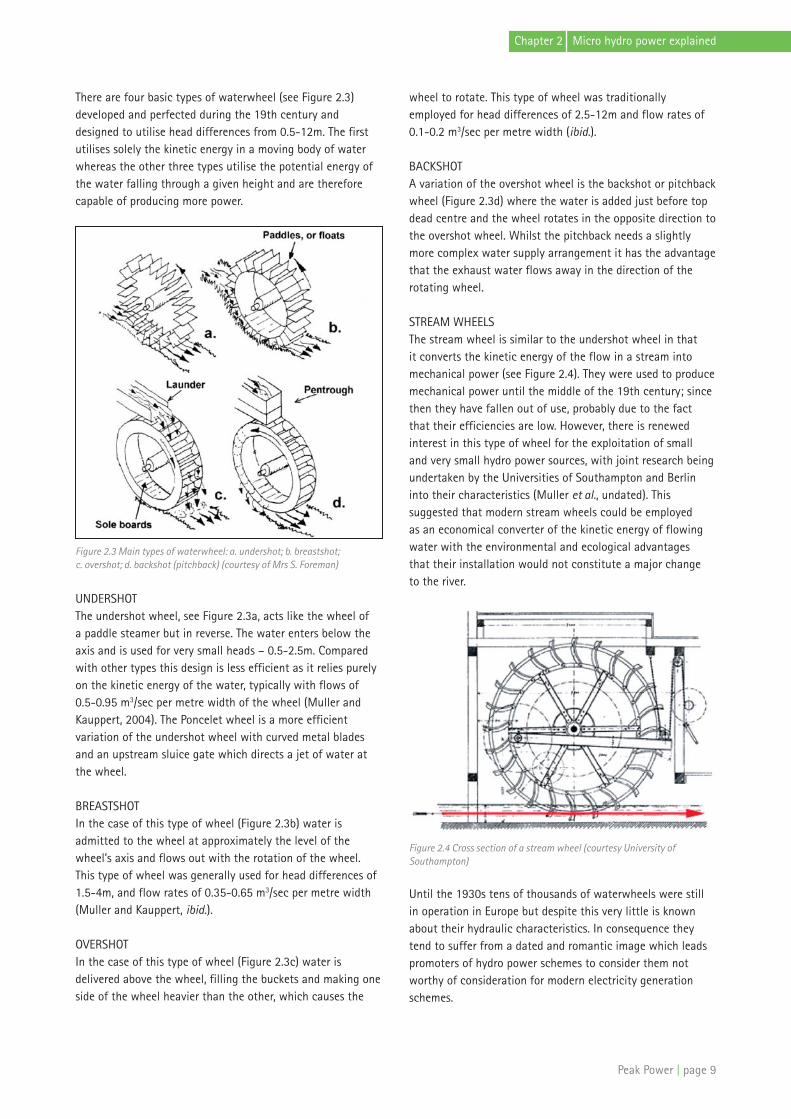
There are four basic types of waterwheel (see Figure 2.3)developed and perfected during the 19th century anddesigned to utilise head differences from 0.5-12m. The firstutilises solely the kinetic energy in a moving body of waterwhereas the other three types utilise the potential energy ofthe water falling through a given height and are thereforecapable of producing more power.
Figure 2.3 Main types of waterwheel: a. undershot; b. breastshot; c. overshot; d. backshot (pitchback) (courtesy of Mrs S. Foreman)
UNDERSHOT The undershot wheel, see Figure 2.3a, acts like the wheel of a paddle steamer but in reverse. The water enters below theaxis and is used for very small heads – 0.5-2.5m. Comparedwith other types this design is less efficient as it relies purelyon the kinetic energy of the water, typically with flows of 0.5-0.95 m3/sec per metre width of the wheel (Muller andKauppert, 2004). The Poncelet wheel is a more efficientvariation of the undershot wheel with curved metal bladesand an upstream sluice gate which directs a jet of water atthe wheel.
BREASTSHOTIn the case of this type of wheel (Figure 2.3b) water isadmitted to the wheel at approximately the level of thewheel’s axis and flows out with the rotation of the wheel.This type of wheel was generally used for head differences of1.5-4m, and flow rates of 0.35-0.65 m3/sec per metre width(Muller and Kauppert, ibid.).
OVERSHOTIn the case of this type of wheel (Figure 2.3c) water isdelivered above the wheel, filling the buckets and making oneside of the wheel heavier than the other, which causes the
wheel to rotate. This type of wheel was traditionallyemployed for head differences of 2.5-12m and flow rates of0.1-0.2 m3/sec per metre width (ibid.).
BACKSHOTA variation of the overshot wheel is the backshot or pitchbackwheel (Figure 2.3d) where the water is added just before topdead centre and the wheel rotates in the opposite direction tothe overshot wheel. Whilst the pitchback needs a slightlymore complex water supply arrangement it has the advantagethat the exhaust water flows away in the direction of therotating wheel.
STREAM WHEELSThe stream wheel is similar to the undershot wheel in that it converts the kinetic energy of the flow in a stream intomechanical power (see Figure 2.4). They were used to producemechanical power until the middle of the 19th century; sincethen they have fallen out of use, probably due to the fact that their efficiencies are low. However, there is renewedinterest in this type of wheel for the exploitation of small and very small hydro power sources, with joint research beingundertaken by the Universities of Southampton and Berlininto their characteristics (Muller et al., undated). Thissuggested that modern stream wheels could be employed as an economical converter of the kinetic energy of flowingwater with the environmental and ecological advantages that their installation would not constitute a major change to the river.
Figure 2.4 Cross section of a stream wheel (courtesy University ofSouthampton)
Until the 1930s tens of thousands of waterwheels were stillin operation in Europe but despite this very little is knownabout their hydraulic characteristics. In consequence theytend to suffer from a dated and romantic image which leadspromoters of hydro power schemes to consider them notworthy of consideration for modern electricity generationschemes.

page 10 | Peak Power
Chapter 2 Micro hydro power explained
Indeed, waterwheels are often restored as part of millconversions (usually to residential use), usually because theyare listed, but unfortunately without power generation beingre-instated. Recent examples in the area include BradbourneMill, near Ashbourne, Bearda Mill near Danebridge and therecently restored Malin Bridge Corn Mill in Sheffield (seeFigure 2.5). This is obviously a missed opportunity although itis accepted that noise (from the wheel and gears) can be aproblem, especially for residential conversions.
However, some detailed investigations were undertaken inGermany and the USA in the early 20th century and theseresults, together with some recent research at Queen’sUniversity, Belfast, would seem to indicate that waterwheelsare efficient energy converters with maximum efficiencies ofover 85% for overshot wheels and about 75% for breastshotand undershot wheels. Furthermore waterwheels operateefficiently over a wide flow range, typically from 20% of thedesigned flow rate (Muller & Kauppert, 2004).
One problem with waterwheels is their slow speed of rotation,typically 7-12 revolutions per minute (rpm). These slowspeeds are not sufficient for electricity generation wheregenerator speeds of 650 rpm and above are required toproduce alternating current (AC) which can be fed into theelectricity distribution network. Therefore a gearing system isrequired; in the past these have included belt and pulleysystems and old tractor gearboxes. It has been estimated thatthe overall efficiency of a modern waterwheel installation,water to wire, is in the order of 62-69%.
One particular advantage of waterwheels is that they can beconsidered to be ‘fish friendly’ due to their low speed ofoperation and large cells and therefore do not require thefish-screening measures often deemed necessary for turbines.Also, depending on location (whether they are fed by a millpond), there may not be any need for screening, withresultant savings in capital and operational costs.
Although there has been a number of schemes undertaken in the UK in which an existing wheel has been renovatedusing traditional materials (see Figure 2.5) there are no UK manufacturers of wheels using modern materials andtechniques. An example of a modern design of waterwheelmanufactured by HydroWatt in Germany is shown in Figure 2.6.
2.4.3 Archimedes screw
The Archimedes screw has been known since ancient times asa simple and effective machine for lifting water and is stillwidely used, e.g. for pumping sewage and grain. It is a simpledesign with only one moving part and two bearings. In thelate 20th century it was realised that the Archimedes screwcould also be used in a reverse role as an energy converter toproduce electricity from water power.
It is claimed that the screw offers a number of advantagesover other hydro power machines due to the following factors:• No complex control system as the screw matches itself
automatically to the water supply
Figure 2.5 Renovated (but non-working) wheel at Malin Bridge Corn Mill,Sheffield
Figure 2.6 A modern waterwheel in Germany
Peak Power | page 11
Chapter 2 Micro hydro power explained
• High efficiency across a wide flow range (20 to 100% ofdesign flow)
• Robust simple machinery so little maintenance required• Fish friendly so no fish screen required• Floating objects and debris simply pass through the screw
negating the need for fine screening
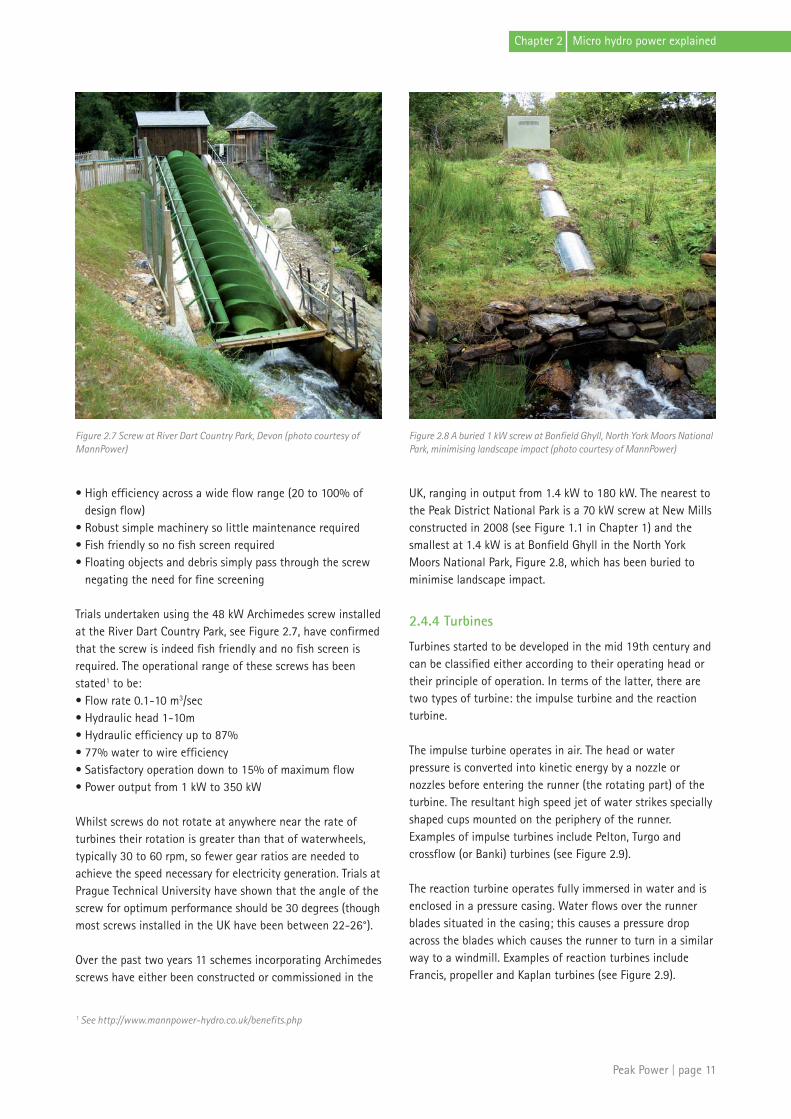
Trials undertaken using the 48 kW Archimedes screw installedat the River Dart Country Park, see Figure 2.7, have confirmedthat the screw is indeed fish friendly and no fish screen isrequired. The operational range of these screws has beenstated1 to be:• Flow rate 0.1-10 m3/sec• Hydraulic head 1-10m• Hydraulic efficiency up to 87%• 77% water to wire efficiency• Satisfactory operation down to 15% of maximum flow• Power output from 1 kW to 350 kW
Whilst screws do not rotate at anywhere near the rate ofturbines their rotation is greater than that of waterwheels,typically 30 to 60 rpm, so fewer gear ratios are needed toachieve the speed necessary for electricity generation. Trials atPrague Technical University have shown that the angle of thescrew for optimum performance should be 30 degrees (thoughmost screws installed in the UK have been between 22-26°).
Over the past two years 11 schemes incorporating Archimedesscrews have either been constructed or commissioned in the
UK, ranging in output from 1.4 kW to 180 kW. The nearest tothe Peak District National Park is a 70 kW screw at New Millsconstructed in 2008 (see Figure 1.1 in Chapter 1) and thesmallest at 1.4 kW is at Bonfield Ghyll in the North YorkMoors National Park, Figure 2.8, which has been buried tominimise landscape impact.
2.4.4 Turbines
Turbines started to be developed in the mid 19th century andcan be classified either according to their operating head ortheir principle of operation. In terms of the latter, there aretwo types of turbine: the impulse turbine and the reactionturbine.
The impulse turbine operates in air. The head or waterpressure is converted into kinetic energy by a nozzle ornozzles before entering the runner (the rotating part) of theturbine. The resultant high speed jet of water strikes speciallyshaped cups mounted on the periphery of the runner.Examples of impulse turbines include Pelton, Turgo andcrossflow (or Banki) turbines (see Figure 2.9).
The reaction turbine operates fully immersed in water and isenclosed in a pressure casing. Water flows over the runnerblades situated in the casing; this causes a pressure dropacross the blades which causes the runner to turn in a similarway to a windmill. Examples of reaction turbines includeFrancis, propeller and Kaplan turbines (see Figure 2.9).
Figure 2.7 Screw at River Dart Country Park, Devon (photo courtesy ofMannPower)
Figure 2.8 A buried 1 kW screw at Bonfield Ghyll, North York Moors NationalPark, minimising landscape impact (photo courtesy of MannPower)
1 See http://www.mannpower-hydro.co.uk/benefits.php

The approximate relationship between head and type ofturbine is given in Table 2.1.
Turbine Type Operating Head
High (>50m) Medium (10-50m) Low (<10m)
IMPULSE Pelton Turgo CrossflowTurgo Crossflow
REACTION Francis FrancisPropellerKaplan
Table 2.1 Operating head and type of turbine
The British Hydropower Association has published a chartgiving the approximate operating ranges for different types ofturbine and also giving a power output guide for the differentcombinations of design flow and operating head and this isreproduced in Figure 2.10.
IMPULSE TURBINESThe Pelton turbine is ideally suited to the high heads and lowflows from steep mountain streams and consists of a wheelwith a series of specially shaped cups set around its rim. Anozzle directs a high velocity jet tangentially at the wheelwhich rotates at high speed in reaction to the impact of thewater jet. The jet hits each cup, is split in half and nearly allthe kinetic energy in the water goes into propelling the cupwith the deflected water falling into a discharge channelbelow the wheel.
The Turgo turbine functions like the Pelton except the waterjet strikes the plane of the runner at an angle so that thewater enters the runner at one side and exits at the other.Blades rather than cups are fixed around the periphery of thewheel and these are shaped so that the water jet impartsnearly all its energy by being diverted through a tight curve. A Turgo machine tends to have a smaller diameter runnerthan a Pelton machine for an equivalent power output.
The crossflow turbine, also known as the Banki, has only comeinto widespread use fairly recently due partly to the fact thatit is easy to make and hence relatively cheap. It can alsooperate over a very wide range of heads, from 3-100m. Theturbine is drum shaped and uses an elongated nozzle to directthe water jet against curved blades on a cylindrically shapedrunner. The water jet enters the top of the drum and flowsfrom the outside to the inside; the second pass is from theinside to the outside. The shape of the blades is such that oneach pass the water transfers some of its energy, making thecrossflow a very efficient machine. Figure 2.11 illustrates apairing of Pelton and crossflow turbines (not operating) atCressbrook Mill in the Peak District.
page 12 | Peak Power
Chapter 2 Micro hydro power explained
Figure 2.9 The main different type of turbines (courtesy of BHA)
Figure 2.10 Turbine types and operating ranges in relation to head and flowparameters (courtesy Oliver Paish/BHA)
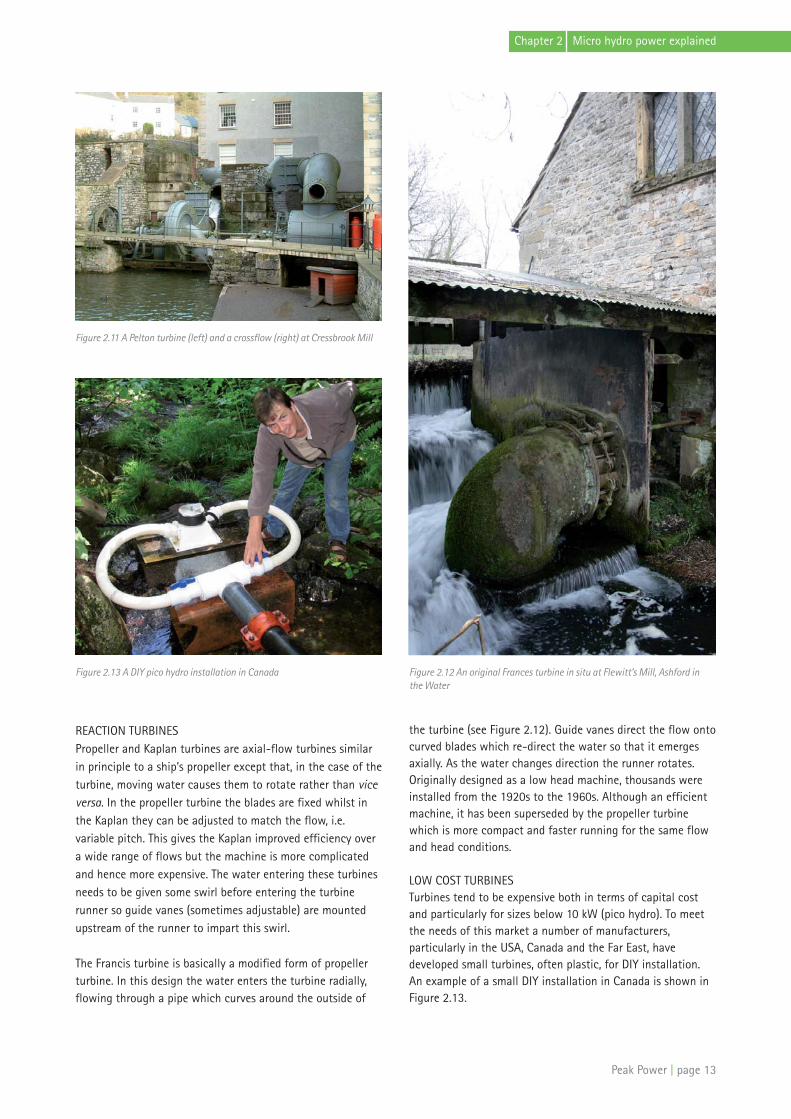
REACTION TURBINESPropeller and Kaplan turbines are axial-flow turbines similarin principle to a ship’s propeller except that, in the case of theturbine, moving water causes them to rotate rather than viceversa. In the propeller turbine the blades are fixed whilst inthe Kaplan they can be adjusted to match the flow, i.e.variable pitch. This gives the Kaplan improved efficiency overa wide range of flows but the machine is more complicatedand hence more expensive. The water entering these turbinesneeds to be given some swirl before entering the turbinerunner so guide vanes (sometimes adjustable) are mountedupstream of the runner to impart this swirl.
The Francis turbine is basically a modified form of propellerturbine. In this design the water enters the turbine radially,flowing through a pipe which curves around the outside of
the turbine (see Figure 2.12). Guide vanes direct the flow ontocurved blades which re-direct the water so that it emergesaxially. As the water changes direction the runner rotates.Originally designed as a low head machine, thousands wereinstalled from the 1920s to the 1960s. Although an efficientmachine, it has been superseded by the propeller turbinewhich is more compact and faster running for the same flowand head conditions.
LOW COST TURBINESTurbines tend to be expensive both in terms of capital costand particularly for sizes below 10 kW (pico hydro). To meetthe needs of this market a number of manufacturers,particularly in the USA, Canada and the Far East, havedeveloped small turbines, often plastic, for DIY installation.An example of a small DIY installation in Canada is shown inFigure 2.13.
Peak Power | page 13
Chapter 2 Micro hydro power explained
Figure 2.11 A Pelton turbine (left) and a crossflow (right) at Cressbrook Mill
Figure 2.12 An original Frances turbine in situ at Flewitt’s Mill, Ashford in the Water
Figure 2.13 A DIY pico hydro installation in Canada
2.4.5 ScreensFor small scale hydro schemes the large majority of operating problems and maintenance costs can be traced back to problemswith the screening system. Screens (or trash racks as they are often called) have been used since the early days of waterwheels tofilter out waterborne debris before it enters the hydro installation and damages the machinery. In addition, to protect fish, thereare guidelines set down by the Environmental Agency (see EA, 2009) regarding the bar spacing of screens (depending upon thetype of machinery installed) and these are given in Table 2.2.
Turbine type/screw Bar Spacing of Screen
Waterwheel or Archimedes screw 100mm or as appropriate
Propeller/Francis/Kaplan turbine (flow greater than 1.5 m3/sec) 10/12.5mm
Kaplan/Francis turbine (flow less than 1.5 m3/sec) Default 6mm if evidence of young fry present in summer monthsCrossflow turbine otherwise 10/12.5mm
Pelton turbine 3mm Coanda drop through screen
Table 2.2 Suggested bar spacing for inlet screens (Environment Agency, 2009)
The screening of debris from the watercourse can be seen asan additional benefit of hydro schemes. However, the controlleddisposal of the debris on land can bring with it charges forwaste disposal. Depending upon the location it is sometimesnecessary to incorporate a floating boom upstream of thescreen to catch large items of floating debris, such as treetrunks, before they reach the screen and cause damage.
RAKED BAR SCREENSThese screens consist of a series of inclined bars spacedacross the intake so that a rake can be used to drag theaccumulated debris to the top of the screen. Originally thiswas done by hand but there are now a range of automaticdevices available to clean the screen.
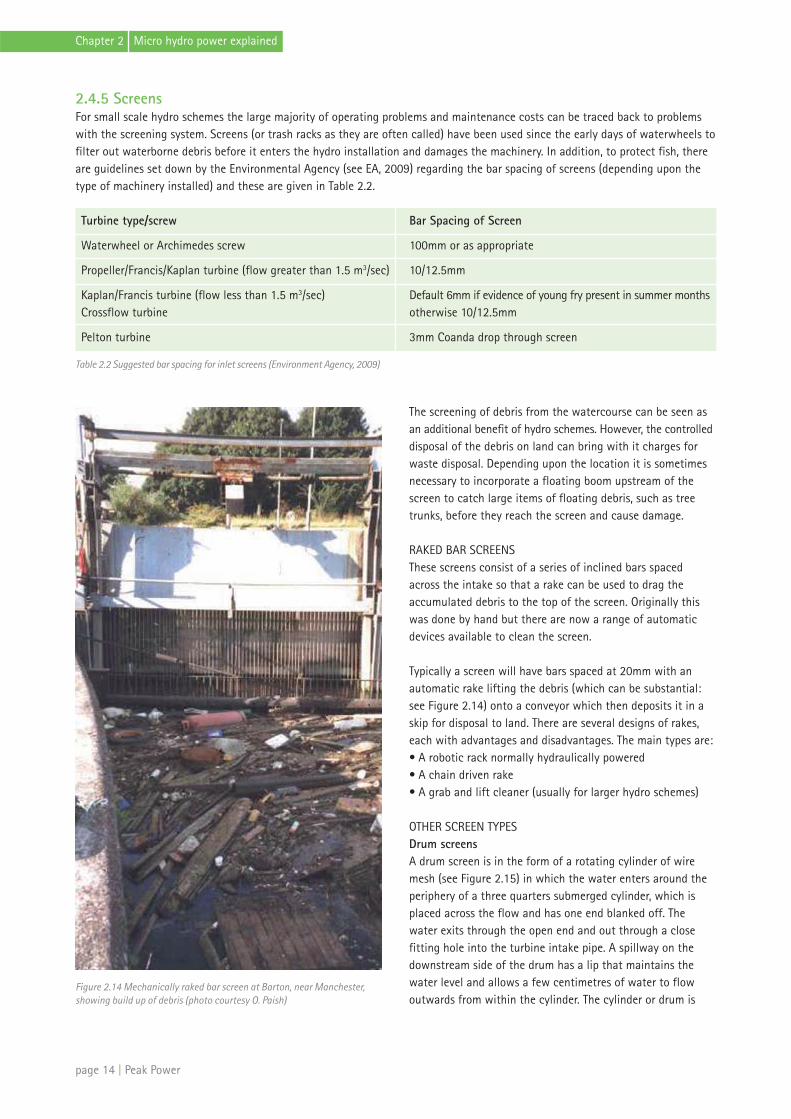
Typically a screen will have bars spaced at 20mm with anautomatic rake lifting the debris (which can be substantial:see Figure 2.14) onto a conveyor which then deposits it in askip for disposal to land. There are several designs of rakes,each with advantages and disadvantages. The main types are:• A robotic rack normally hydraulically powered• A chain driven rake• A grab and lift cleaner (usually for larger hydro schemes)
OTHER SCREEN TYPESDrum screensA drum screen is in the form of a rotating cylinder of wiremesh (see Figure 2.15) in which the water enters around theperiphery of a three quarters submerged cylinder, which isplaced across the flow and has one end blanked off. Thewater exits through the open end and out through a closefitting hole into the turbine intake pipe. A spillway on thedownstream side of the drum has a lip that maintains thewater level and allows a few centimetres of water to flowoutwards from within the cylinder. The cylinder or drum is
page 14 | Peak Power
Chapter 2 Micro hydro power explained
Figure 2.14 Mechanically raked bar screen at Barton, near Manchester,showing build up of debris (photo courtesy O. Paish)
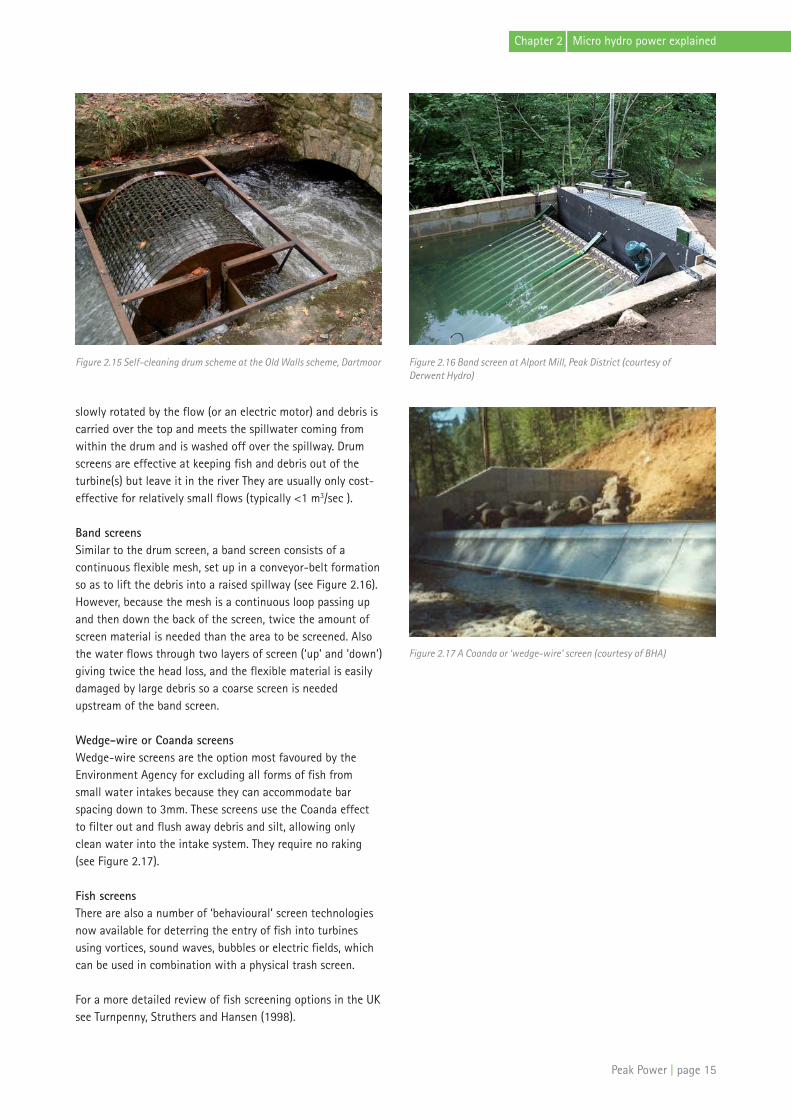
slowly rotated by the flow (or an electric motor) and debris iscarried over the top and meets the spillwater coming fromwithin the drum and is washed off over the spillway. Drumscreens are effective at keeping fish and debris out of theturbine(s) but leave it in the river They are usually only cost-effective for relatively small flows (typically <1 m3/sec ).
Band screensSimilar to the drum screen, a band screen consists of acontinuous flexible mesh, set up in a conveyor-belt formationso as to lift the debris into a raised spillway (see Figure 2.16).However, because the mesh is a continuous loop passing upand then down the back of the screen, twice the amount ofscreen material is needed than the area to be screened. Alsothe water flows through two layers of screen (‘up’ and ‘down’)giving twice the head loss, and the flexible material is easilydamaged by large debris so a coarse screen is neededupstream of the band screen.
Wedge-wire or Coanda screensWedge-wire screens are the option most favoured by theEnvironment Agency for excluding all forms of fish from small water intakes because they can accommodate barspacing down to 3mm. These screens use the Coanda effectto filter out and flush away debris and silt, allowing onlyclean water into the intake system. They require no raking(see Figure 2.17).
Fish screensThere are also a number of ‘behavioural’ screen technologiesnow available for deterring the entry of fish into turbinesusing vortices, sound waves, bubbles or electric fields, whichcan be used in combination with a physical trash screen.
For a more detailed review of fish screening options in the UKsee Turnpenny, Struthers and Hansen (1998).
Peak Power | page 15
Chapter 2 Micro hydro power explained
Figure 2.15 Self-cleaning drum scheme at the Old Walls scheme, Dartmoor Figure 2.16 Band screen at Alport Mill, Peak District (courtesy ofDerwent Hydro)
Figure 2.17 A Coanda or ‘wedge-wire’ screen (courtesy of BHA)
3.1 INTRODUCTION
Developing a micro hydro scheme, especially within aNational Park, inevitably has the potential to create impactson sensitive environments: the river, its margins and adjacentland and, of course, the surrounding landscape. Impacts mayinclude changes in river flow, possible alterations to habitats,new structures in a sensitive area or the alteration of existingstructures which are historically valued. Connection to thegrid may also become an environmental or planning issue asany new connection would be placed underground or on newoverhead poles.
The following chapter attempts to offer an introduction tothe likely consultations and/or consents that may be requiredto bring a scheme to fruition – even when all that is proposedis the reinstatement of a disused site where all infrastructureis intact.
There are three main areas that usually need to be addressed,assuming that land, weir and riparian (bankside) rights areunder the control of the applicant(s):• River/water related consents (from the Environment
Agency) – see section 3.2• Planning permission for new structures or changes to land
use (from the local planning authority/National ParkAuthority) – see section 3.3
• Consents for alteration to scheduled monument and/orlisted structures (from either English Heritage or the localplanning authority, depending on scheduling/grade oflisting) – see section 3.4
Of necessity, the following material in this chapter drawsheavily on up to date advice given by Environment Agencyguidelines and staff plus additional comments provided byplanners from the Peak District National Park Authority.However every potential scheme raises different andsometimes unique issues. For this reason, all potentialdevelopers are advised to contact the relevant body as earlyas possible for advice when developing a design for a scheme.
Information given here is broadly applicable but cannotnecessarily be applied to specific sites nor will be bindingupon consequent negotiations with appropriate bodies.
3.2 LICENSING AND THE RIVER ENVIRONMENT– THE ENVIRONMENT AGENCY’S ROLE
Whilst there are aspects of environmental impact dealt withunder planning regulations (see Section 3.3), the main bodyfor licensing micro hydro schemes (and hence assessing theirimpact) is the Environment Agency (EA).
The EA has responsibility for fish protection, water quality andother environmental aspects of riverside developments andhence has regulatory powers which require them to balancethe requirements of hydro developments with protection ofthe environment. The EA is generally sympathetic torenewable energy schemes and has a position statement andpolicy on hydro power which encompasses three main tenets:• Strong support for the Government’s targets for the use of
renewable energy, including hydro power schemes and theirrole in addressing climate change
• Recognition of the potential benefits of small scale hydropower to rural communities and in meeting local needs forpower
• Seeking to work constructively with the hydro powerindustry to achieve the aspirations of Government, theAgency and the industry
They have produced an internal document Hydro power - AHandbook for Agency Staff (EA, 2003 but updated regularlysince then) which they will provide upon request to potentialdevelopers. The handbook helps to explain the breadth andcomplexity of the Agency’s statutory duties as well as theprocedures to be followed in any application for a microhydro scheme. This document has also been supplementedrecently (August 2009) by the Good Practice Guidelines Annexto the Environment Agency Hydro power Handbook: TheEnvironmental Assessment of Proposed Low Head Hydro PowerDevelopments. See http://www.environment-
page 16 | Peak Power
Chapter 3 Licensing, environmental andplanning issues
agency.gov.uk/static/documents/Business/Low_Head_Hydropower_August_2009.pdf .
Both these documents and related publications stress theimportance of an early approach to the Agency, usually viathe relevant Area Environment Planning Team (for much ofthe Peak District (Derbyshire Derwent catchment) this is theEA’s Nottingham office).
3.2.1 Environmental assessmentStatutory Environmental Impact Assessments (EIAs) are onlyrequired for schemes with an installed capacity of more than500 kW – well above the capacity of any hydro power schemelikely to be proposed in the Peak District. However, the EAconsiders that the benefits of an EIA for non-statutoryschemes is well established and state that ‘…all hydro powerproposals need environmental assessment, although in somecases this may be minimal’ (EA Hydro power Handbook, section 10).
The new Good Practice Guidelines (EA, 2009) also set out an‘environmental site audit’ (ESA) approach. This is essentialreading for anybody interested in developing or re-instating amicro hydro power scheme. The ESA comprises a check listguide (with a green/red ‘traffic light’ system) which has beendeveloped to help identify schemes that are not expected topose environmental problems, those that require moredetailed investigations, or may require an EIA.
Any assessment of impact will relate particularly to the EA’sconservation function but EA staff are warned not to ask formore than they need to help with determination of theproposal. Appendix A of the Hydro power Handbook(‘Guidance to applicants on environmental informationrequired’1) sets out the main areas of impact that need to beconsidered which include:• Hydrological information• Details of structures• Water resources• Fisheries• Conservation (effects on habitats and species, including
survey information)• Recreation• Navigation• Water quality• Flood defence• Environmental monitoring
It may be necessary to employ specialist consultants toundertake some assessments but a general hydro consultantwith the appropriate track record may be able to carry outsome of the work.
Also, to ensure that any potential problems are identified atan early stage, it is also wise to have formal and informalconsultation with other conservation agencies such asNatural England and amenity/recreation groups such as localangling clubs, boating and water sports associations.
The Environment Agency warns that, due to each site oftenhaving unique and complicated environmental impacts whichrequire thorough assessment, the time taken to determinepermit applications can be lengthy and significantly exceedthe statutory minimum. Consequently, this should be builtinto any project plan. Pre-application discussion will also helpminimise the risk of abortive work.
The local planning authority may also have separaterequirements for environmental information, depending onthe nature of the development (see section 3.3 below).
3.2.2 LicencesTo remove water from a watercourse for a micro hydroscheme requires permission(s) from the EA in the form ofwater resources permits. There are three different types whichcan apply to a scheme depending upon its location anddesign. In addition ‘flood defence consent’ is likely to berequired for all schemes. This involves undertaking a flood riskassessment to ensure there is no adverse impact on floodingin the locality.
ABSTRACTION LICENCEThis licence is required if water is diverted away from themain flow of the watercourse i.e. outside the existing banksof the river or stream. This means that all projects, exceptbarrages where a turbine or Archimedes screw is installed onan existing weir within the existing banks, require anabstraction licence. All new licences are normally for 12 yearsafter which they must be renewed. Some may expire earlierwith the Common End Date specified in the local EACatchment Abstraction Management Strategy (CAMS)document. Although there is a presumption of renewal of thelicence by the EA, this is clearly an area of risk for a schemedeveloper. Schemes extracting less than 20 cubic metres (m3)per day are exempt from this requirement. Hydro powerschemes which return water back to the same watercourseare normally issued with a ‘transfer licence’, which does notattract an annual charge.
IMPOUNDMENT LICENCEThis licence is required when changes are made to structureswhich impound water, such as weirs and mill ponds, or if anew structure is to be built. Where a weir already exists itmay not be necessary to apply for an impoundment licence –the EA will be able to advise on this.
Peak Power | page 17
Chapter 3 Licensing, environmental and planning issues
1 Also available as a freestanding handout at EA area offices.

LAND DRAINAGE CONSENTThis is required for permission to return the abstracted flowback to the watercourse and for any works carried out in themain channel of the watercourse.
3.2.3 Flow controlMicro hydro schemes are deemed to be a non-consumptiveuse of water, unlike water supply and agricultural uses.However, a certain minimum volume of water, variouslytermed the ‘residual’, ‘compensation’, ‘reserve’ or ‘hands off’flow, must be left in the section of river or stream which by-passes the micro hydro site. This section of watercourse –often referred to as the depleted reach – is between the pointof abstraction and the point where the flow is returned.Maintaining a sufficient hands off flow is key to protectingthe environment and ecology of the river in the depletedstretch, and is also important for aesthetic reasons.
The EA will prescribe what residual flow must be left in theriver and hence what can be used for hydro power. Themaximum hydro power flow figure has historically been takenas that in excess of a residual flow of Q95 (the flow in thewatercourse for over 95% of the time) but recently it hasbeen suggested that this should be varied depending uponthe length of the depleted stretch of stream and the type ofriver (as measured by its Base Flow Index or BFI). The longerthe depleted reach and the more ‘flashy’ the river2, thegreater the residual flow will need to be – up to Q85 or greater(see Table 2 and associated text, Good Practice GuidelinesAnnex, pp.30-32: EA, 2009).
3.2.4 Historic rightsThe fact that the site may be a former water mill does notmean it has a historic right to extract water, even if shown intitle deeds or allied documents. In the late 1970s legislationwas passed which required mill owners to take specific andpositive action to maintain their abstraction rights. Most didnot, so now have no rights and will probably need to re-applyas if for a new site.
3.2.5 Catchment Abstraction ManagementStrategies The EA produces a water resource management plan for mostriver catchments and makes these publically available. Theresulting Catchment Abstraction Management Strategies(CAMS) seek to balance the needs of abstractors, theenvironment and other water users.
CAMS are also the mechanism for managing time-limitedabstraction licences by determining whether they should berenewed and, if so, on what terms (through the context of thecurrent and likely future availability of water for abstraction).
They are therefore necessary reading for anyone operating anexisting hydro scheme or contemplating constructing such ascheme.
CAMS relevant to schemes within the Peak District andadjacent catchments are• The Derbyshire Derwent CAMS• The Dove CAMS• The Don and Rother CAMS• The Tame, Goyt and Etherow CAMS• The Weaver and Dane CAMSCopies of the documents together with details of anyproposed revisions can be found at www.environment-agency.gov.uk/cams
Areas of catchments/rivers in CAMS are commonly split intoWater Resource Management Units where more specificguidelines are defined and applied, including ‘environmentalweightings’ (EW, from very low to very high, with low,medium and high between, representing the sensitivity of theriver to abstraction) which are then developed into river flowobjectives. However, although the EW may act as a proxy forenvironmental factors that may also be a constraint todeveloping a hydro scheme, the resultant designations such as‘over-licensed’ or ‘over-abstracted’ do not necessarily form ahindrance to a potential hydro scheme (as the use of the waterwill be non-consumptive). Again the EA will be able to advise.
3.2.6 River Basin Management PlansIn addition to the CAMS are the River Basin ManagementPlans (RBMPs) which set out the strategies for each of theriver basins in England and Wales in order to implementWater Framework Directive (WFD) requirements. At present,consultation drafts for the two main river basins in which thePeak District sits, the Humber and the North West, areavailable for perusal on the Environment Agency’s web site,having been consulted upon in the first half of 2009. The finalRBMPs will be published shortly and will be due for reviewafter six years in 2015.
The draft RBMPs also set out protected area objectives (tomeet other EU legislation on aquatic environments such asthe Freshwater Fish Directive) for particular natureconservation areas (e.g. EU-designated Special Areas ofConservation, SACs, aimed at habitat protection) and otherstretches of rivers. In the main, these objectives relate towater quality indices and current compliance status (andmeasures that may be necessary to improve compliance)should not directly affect the viability of a potential hydroscheme. In due course, these objectives will be subsumed bythe more generic target, under the WFD, to reach ‘goodcondition’ status.
page 18 | Peak Power
Chapter 3 Licensing, environmental and planning issues
2 ‘Flashy’ rivers are those that respond quickly to rainfall episodes with frequent extremes of high and low flows. A flashy river will also usually have a lowBase Flow Index (BFI = ratio of Q95:Qmean <0.1)
3.2.7 Fish passageIn 2009 the Department for Environment, Food and RuralAffairs (Defra) issued a consultation document concerning theneed to improve the free passage of fish and to allow freeaccess to breeding, nursery and feeding grounds for fish inEngland and Wales. The consultation ended on 10th April 2009.
The proposed regulations intended to extend the powers ofthe EA to require fish passes (at present limited to newobstructions and enabling the migration of salmon and seatrout) so they could additionally:– require the installation of a fish pass to facilitate the
passage of all migratory and freshwater species;– require the installation of a fish pass at an extant
obstruction whether or not works (e.g. a hydro scheme) areunderway.
The deadline for implementation of such powers, required tomeet obligations under the WFD, is 2015 but this may beextended up to 2027.
As part of the consultation process the Environmental Agencyissued a Statement of Intent (SoI) setting out in principle theway in which they intend to use the new powers that theregulations will provide, with the aim of meeting the WFDobligations by 2027.
The SoI states a number of general principles which will beused by the EA in the future implementation of theregulations, namely:• New hydro schemes will be required to incorporate
appropriate provisions for fish passage• Installation of fish passes on existing obstructions (weirs)
will be phased, based on River Basin Plans, with their needassessed and prioritised in terms of impact on fishpopulations
• Where the need for a pass is identified at an existing weirthen the owner of the obstruction shall pay for the pass.This may be varied where there are other beneficiaries suchas fishery owners or where there is a wider public benefit
• The owner of the obstruction shall be responsible for theongoing repair and maintenance of the pass
• New enforcement powers will enable the EA to serve noticeon an owner to take action in respect of a pass or to accessland to construct a pass and to recover costs
Late in 2009, after consultation responses had beenconsidered by Defra, it was announced that implementationof the proposed regulations would be set back until at leastMay 2011. The reason cited was the potential impact onbusiness, in particular in the light of the current financialclimate. In the meantime, the Environment Agency willcontinue its current approach of only targeting critical
barriers and working closely with owners and occupiers ofbarriers to find pragmatic solutions. More detailed advice onwhen fish passes3 for hydro schemes are required is given inthe Good Practice Guidelines (EA, 2009).
3.3 PLANNING
Planning permission is required for most forms ofdevelopment. Development is defined in section 55 of theTown and Country Planning Act 1990 as follows:-“The carrying out of building, engineering, mining or otheroperations in, on, over or under land, or the making of anymaterial change in the use of any buildings or other land.“
3.3.1 Initial adviceThe National Park Authority’s website(www.peakdistrict.gov.uk) has a large section devoted toplanning advice and this is well worth consulting. Planners atthe NPA should be consulted on the general scope of apotential scheme and they should be able to advise as towhich parts (if any) of a scheme may require permission,including listed building consents. Prospective developersshould call the NPA’s Customer Service Team to initiatecontact with their Planning Service. A planning officer canthen co-ordinate a response, drawing in other specialist staffas required. An experienced hydro consultant or agent shouldalso be able to give guidance on likely planning issues.
National Park planning policy (currently covered by the PDNPLocal Plan, adopted in 2001: see paragraphs 8.14-8.19, page92 and Policy LU4) allows for small scale energy schemes tomeet local needs, subject to the impact on the valuedcharacteristics of the area being acceptable. Any renewableenergy schemes need to be acceptable in the landscape andof a scale and output consistent with local demand for power.Size, design, siting, noise generation, impact on wildlife andassociated landscaping will all be relevant. Local Plan PolicyLU4(b) also states that ‘Transmission lines should always beplaced underground’ (see also section 3.5 below). In duecourse, the Local Plan will be superseded by a new LocalDevelopment Framework (LDF). The LDF Core Strategy, whichwill cover renewable energy issues (including support forsmall scale hydro), should be adopted by 2011.
The Local Plan (para. 8.19) also notes that some small scale,normally supplementary, power generation may constitute‘permitted development’ (i.e. that formal planning permissionmay not need to be sought). For micro hydro schemes, whichusually have a range of potential impacts, this is unlikely toapply, save on rare occasions. However, the Government iscurrently consulting on extending such rights for small scalerenewable technologies (DCLG, 2009). It recognises, for hydro
Peak Power | page 19
3 There are basically five types of fish pass: pool and weir; baffled passes; locks and lifts; pre-barrages; and natural type by-passes, rock ramps andeasements. Brief descriptions of each type can be found on the EA web site: http://www.environment-agency.gov.uk/business/sectors/37579.aspx
Chapter 3 Licensing, environmental and planning issues

power, that alterations to river courses and structures (e.g.weirs) should be kept within existing consenting proceduresbut suggest that planning permission should not be requiredfor turbine houses placed on agricultural or forestry land. Theconsultation closed in February 2010.
3.3.2 Ecological issuesIn relation to potential ecological impacts, the NPA’s Validationof Planning Applications: Guidance Notes document4
particularly encourages pre-application on ecological mattersfor hydro power schemes. Akin to the Environment Agency’sscope of potential impacts, the aspects that the NPA wouldconsider during consultation on a hydro scheme include:• The general watercourse character• Macrophytes (aquatic plants)• Fish (including fish passage)• Invertebrates• Habitat (those that are protected and those of UK/regional/
local importance, e.g. Biodiversity Action Plan habitats)• Birds (protected and of local importance)• Geomorphological (landscape) features
Direct and indirect impacts will be considered, includingpotential impacts from increased water levels upstream of thesite, changes in sediment composition, decreased water levelsbetween the point of water abstraction and discharge, anyassociated infrastructure, works to banks, tree works, repairsto existing structures etc. Although these aspects will beconsidered, only surveys relevant to the application will berequired and this will be determined on a case-by-case basis.The need for specific surveys will be guided by the scale ofthe scheme, the type of hydro equipment involved, themethod of abstraction etc.
3.3.3 Protected speciesIf protected species are found during survey, details ofmeasures to avoid, mitigate or compensate for potential harmto these species must be reported. This depends on thespecies found and the extent of use of the site but generallythe report must include recommendations on the timing ofany operations, the methods used and how species andhabitats can be retained and enhanced as part of the scheme.
It should be noted that the presence of a protected speciesneed not detrimentally affect the potential to gain planningpermission. PDNPA planning officers will consider surveyrecommendations in assessing any application. Changes mayhave to be made to initial plans and, for example, if speciestranslocation is required, a licence from Natural England maybe required to allow some works to proceed. In the majorityof cases, protected species can be accommodated withindevelopment proposals.
PLANNING CASE STUDY: ALPORT MILL NEAR YOULGREAVE, RIVER LATHKILL
In 2007 the Haddon Estate, owners of Alport Mill,commissioned local hydro consultants and installers,Derwent Hydro, to scope a micro hydro scheme on the siteof the mill on the River Lathkill. Derwent Hydro’s reportsuggested it was feasible to install a 30 kilowatt (kW)turbine, partly using remnant structures (weir, intake, tailrace channel) but with a new, buried penstock (see Figure3.1) leading to a partly buried powerhouse. It wasenvisaged that the scheme could supply up to 70% of theproperties in the adjacent Alport village. It should be notedthat the River Lathkill (both upstream and downstream ofthe proposed scheme) is important for recreational fishingand is controlled by the Estate. The site is also close toimportant protected habitats.
Figure 3.1a/b Burying the pipe (‘penstock’) carrying the water from theintake to the powerhouse at Alport Mill, Peak District (photos courtesyof Derwent Hydro)
page 20 | Peak Power
Chapter 3 Licensing, environmental and planning issues
4 Available on the PDNPA website.

Figure 3.2 The new turbine house at Alport Mill faced with local stone(photo courtesy of Derwent Hydro)
After extensive pre-consultation with a range of bodies,statutory and non-statutory, two applications were made insummer 2008 for i) erection of turbine house and intake; andii) listed building consent for alteration to walls in thecurtilage of a listed building. The main planning issues wereconsidered to be:• The principle of the proposed development• The proposed design and external appearance (of the new
powerhouse)• Potential impact on the Alport Conservation Area
• Potential impact on the setting of a listing building• Potential impact on features of archaeological interest and,• Potential impact on features of ecological interest
The principle of development was supported by formerStructure Plan Policy C17 which allows for small scale localenergy generation. The powerhouse was felt to be modest inscale and, with suitable finishing (turf roof, externallimestone walls – see Figure 3.2), would be acceptable andnot affect either the Conservation Area nor the setting ofthe listed mill.
Both archaeological and ecological interests were present at the site. An archaeological desk based assessment wasprepared for the site to inform the planning application.Subsequently a watching brief on excavations and buildingrecording was carried out as mitigation for the scheme. Inrelation to ecological concerns, mitigation measures tosafeguard local species of special interest were also agreedand implemented.
No objections were registered to the applications and it wasrecommended for approval subject to relevant conditions.The relevant planning consents were issued in October 2008.The scheme was implemented successfully in spring/summer2009 and is now operational.
Peak Power | page 21
Chapter 3 Licensing, environmental and planning issues
Figure 3.3a/b Before and after picturesof the Alport Mill scheme showing theburied powerhouse at left (photoscourtesy of Derwent Hydro)

3.4 CULTURAL HERITAGE ISSUES
All old mill sites have historic value and many may also belisted or scheduled, or be registered in the HistoricEnvironment Record (HER5), usually held on a county basis.Proposed works for a micro hydro scheme may either affectthe historic fabric or the setting of a site or area. If the site isa Scheduled Monument (sometimes also referred to as a‘scheduled ancient monument’) or listed at either grade I orgrade II* status, consent for allied works will be required byEnglish Heritage.
Changes to listed structures below grade II* may need ‘listedbuilding consent’ (as was necessary at Alport Mill, above) andthis must be sought from the local planning authority.Applicants should consult the PDNPA (or other planningauthority if outside the NP) in order that anyarchaeological/listed building issues can be identified at anearly stage and any necessary investigations and surveys becommissioned. Because of the levels of ground disturbanceand the potential modification of existing water managementfeatures involved, an old mill site is likely to require thefollowing archaeological input at the pre-application stage:• Desk-based assessment• Walkover survey• Measured survey• Trial trenching
This work should be undertaken by recognised archaeologicalcontractors to a brief prepared by the National Park’s CulturalHeritage team. The costs of archaeological evaluation can besignificant (running to several thousands of pounds) andshould be budgeted for by applicants so that any grant aidapplied for can include these costs.
Often issues identified can be dealt with quite readily bysmall amendments to plans or by conditions associated withthe consents or planning permission obtained. Mitigatingmeasures may be required (usually by condition) and mayinvolve pre-recording of any building fabric affected by thescheme, measured survey of earthwork features and smallscale excavation of any ground to be disturbed by the works.
3.5 ELECTRICAL CONNECTION – PLANNINGISSUES
If a micro hydro scheme is going to be grid connected, thismay raise some ancillary planning issues (for more detailregarding on site electrical connection, see Chapter 4). Theseissues arise primarily where a relatively long stretch of newcabling is required, carrying power either by overhead wiresand associated poles or – more usually – by undergroundcabling (particularly in the National Park, see 3.3.1 above).
Policy LU1 of the PDNP Local Plan states that ‘Developmentrequiring new or upgraded service infrastructure will bepermitted providing that the new infrastructure: (i) does notadversely affect the valued characteristics of the area; and (ii) can be provided before any new land use begins. As statedabove, the default position in the National Park is that newutility services (including electricity wires) will be placedunderground. On very rare occasions, for example wheretrenching would cross ground that is ecologically orarchaeologically sensitive and where suitable screening isavailable, an overhead route may be considered.
Planning consents for new electricity connections are handledby the distribution network operator (DNO, also see section4.4.3). Provision of such connection will also be dependent onsuccessful negotiation of relevant wayleaves and/oreasements (types of permission to run wires or cables throughadjacent land). Needless to say, the overall costs of providinga new connection over some distance may prove prohibitiveat some sites. It is therefore wise to deal with this issue at arelatively early stage in any pre-application scoping process.
3.6 LAND OWNERSHIP ISSUES
Care should obviously be taken to ensure that all areas of asite are either within the ownership or control (via lease orsome other form of suitable agreement) of the developer(s) ofthe scheme. Advice may be necessary from specialist sources(e.g. solicitors, Land Registry) as to ownership (weirownerships can be difficult to fathom and may not attachnecessarily to a mill property/curtilage). Again, earlyresolution of any contentious matters is a pre-requisite. Leaseterms should also be subject to very careful scrutiny as theywill be key to the economic viability of any scheme.
page 22 | Peak Power
Chapter 3 Licensing, environmental and planning issues
5 Formerly known as the Site and Monuments Record (SMR). In the GIS analysis data used in Chapter 5 (and the accompanying data in Appendix B),reference is still made to the SMR. See section 5.1.5 for further information.

4.1 INTRODUCTION
Two of the major barriers to developing a micro hydro schemeare the relatively high cost of site assessment and the largeoutlay of capital in implementing the project. Detailedfeasibility studies are usually undertaken by a consultant toestablish the viability of the scheme. The fact that capitalcosts are more site specific than for any other form ofrenewable energy unfortunately means that making initialeconomic estimates is difficult. There are therefore threestages a site owner can progress through (to minimise costsand risk) before deciding to move forward with a scheme.
Stage 1 Initial site assessmentThis can be a DIY stage which seeks to answer two basicquestions. Approximately how much electrical power can Igenerate? Are there any major environmental, ecological,cultural heritage, planning or grid connection problems(‘show stoppers’) which would prohibit the development?
Stage 2 Preliminary site (pre-feasibility) studyThis is an interim stage which can be undertaken before a fullfeasibility study. It would be undertaken by an experiencedhydro power professional at a cost of between £500 and£1,000. A list (not exhaustive) of hydro power consultants andinstallers is given in Appendix E. Some costs towardsrenewable energy studies can be met by grants, including theBRE Community Sustainable Energy Programme (see 4.3.2).
Stage 3 Feasibility studyThis stage, again undertaken by a professional, takes theproject forward to the final design stage looking closely at(amongst other items) costs, project finance, sale of electricitygenerated, and the necessary approvals and licences. The costof a feasibility study can range from £3,000 for a domesticscale scheme to £10,000 for a commercial scheme.
4.2 INITIAL SITE ASSESSMENT
This assessment seeks to provide a first estimate of thepotential electrical power available from the proposed siteand ascertain any major constraints, often related toenvironmental or planning issues (see Chapter 3).
To determine the power potential (Pe, electrical power) it isnecessary to measure the head (H) and the flow (Q) availableand then use the formula
Pe (kW) = 6 x H (m) x Q (m3/sec)
This will give a conservative, yet realistic estimate of theelectrical power available. If using one of the simpler methodsof flow measurement detailed in section 4.2.2 below, then Qshould be the summer flow. If flow rates over a year areavailable then the average over the year (Qmean) should betaken as the value for flow. As an example, varying the keyfactors of flow and head shows how the same power can beachieved in very different situations of head and flow:
6 x 10 metre head x flow of 1 cubic metre per second = 60 kW or
6 x 1 metre head x flow of 10 cubic metres per second = 60 kW
The amount of energy produced per year can then beestimated as follows (with 8760 being the number of hours ina year)
Energy (kWh/yr) = Pe (kW) x CF x 8760
and where CF = capacity factor which varies depending uponthe flow used for hydro power but can be taken as 0.4 (i.e.that the system will be running for 40% of the year) for theinitial assessment. Capacity factors for hydro are usuallyhigher in reality (usually upwards of 0.5) but for initialestimates it is better to be conservative. Using the workedexample above, energy capture would be
60 kW power x 0.4 capacity factor x 8760 = 210,240 kWh per year
Peak Power | page 23
Chapter 4 How to scope and implement a micro hydro scheme
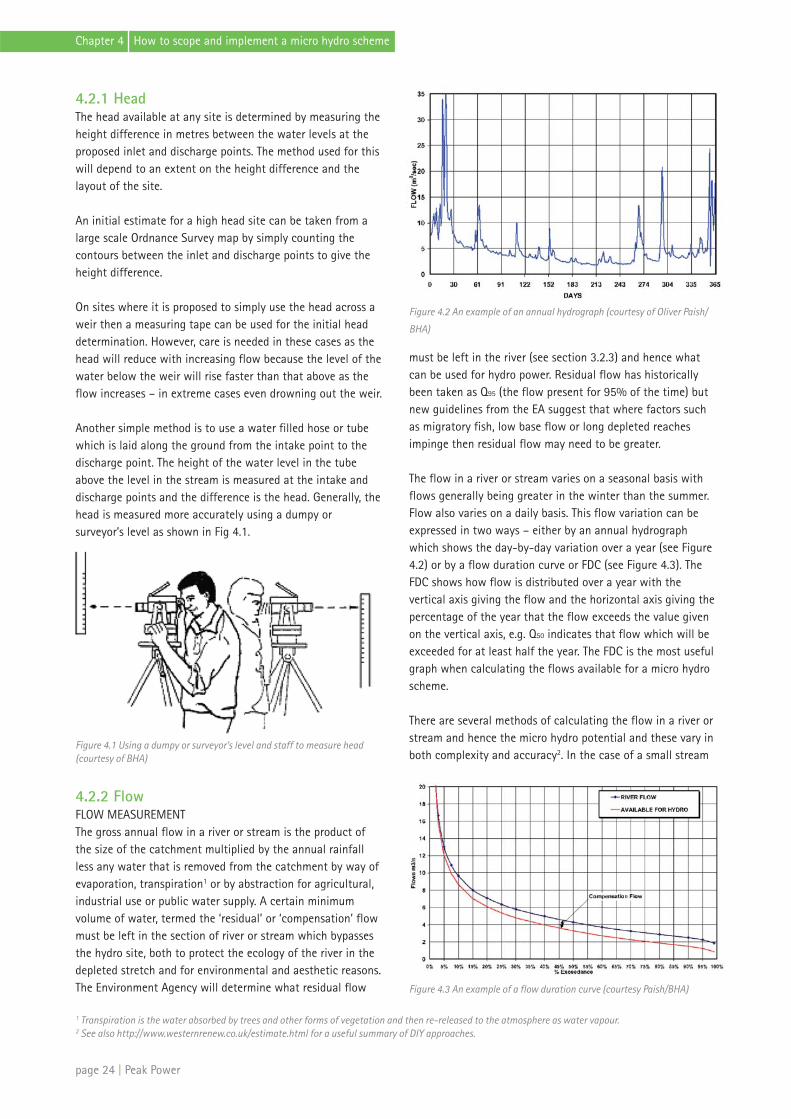
4.2.1 HeadThe head available at any site is determined by measuring theheight difference in metres between the water levels at theproposed inlet and discharge points. The method used for thiswill depend to an extent on the height difference and thelayout of the site.
An initial estimate for a high head site can be taken from alarge scale Ordnance Survey map by simply counting thecontours between the inlet and discharge points to give theheight difference.
On sites where it is proposed to simply use the head across aweir then a measuring tape can be used for the initial headdetermination. However, care is needed in these cases as thehead will reduce with increasing flow because the level of thewater below the weir will rise faster than that above as theflow increases – in extreme cases even drowning out the weir.
Another simple method is to use a water filled hose or tubewhich is laid along the ground from the intake point to thedischarge point. The height of the water level in the tubeabove the level in the stream is measured at the intake anddischarge points and the difference is the head. Generally, thehead is measured more accurately using a dumpy orsurveyor’s level as shown in Fig 4.1.
Figure 4.1 Using a dumpy or surveyor’s level and staff to measure head(courtesy of BHA)
4.2.2 FlowFLOW MEASUREMENTThe gross annual flow in a river or stream is the product ofthe size of the catchment multiplied by the annual rainfallless any water that is removed from the catchment by way ofevaporation, transpiration1 or by abstraction for agricultural,industrial use or public water supply. A certain minimumvolume of water, termed the ‘residual’ or ‘compensation’ flowmust be left in the section of river or stream which bypassesthe hydro site, both to protect the ecology of the river in thedepleted stretch and for environmental and aesthetic reasons.The Environment Agency will determine what residual flow
must be left in the river (see section 3.2.3) and hence whatcan be used for hydro power. Residual flow has historicallybeen taken as Q95 (the flow present for 95% of the time) butnew guidelines from the EA suggest that where factors suchas migratory fish, low base flow or long depleted reachesimpinge then residual flow may need to be greater.
The flow in a river or stream varies on a seasonal basis withflows generally being greater in the winter than the summer.Flow also varies on a daily basis. This flow variation can beexpressed in two ways – either by an annual hydrographwhich shows the day-by-day variation over a year (see Figure4.2) or by a flow duration curve or FDC (see Figure 4.3). TheFDC shows how flow is distributed over a year with thevertical axis giving the flow and the horizontal axis giving thepercentage of the year that the flow exceeds the value givenon the vertical axis, e.g. Q50 indicates that flow which will beexceeded for at least half the year. The FDC is the most usefulgraph when calculating the flows available for a micro hydroscheme.
There are several methods of calculating the flow in a river orstream and hence the micro hydro potential and these vary inboth complexity and accuracy2. In the case of a small stream
page 24 | Peak Power
Chapter 4 How to scope and implement a micro hydro scheme
Figure 4.2 An example of an annual hydrograph (courtesy of Oliver Paish/
BHA)
Figure 4.3 An example of a flow duration curve (courtesy Paish/BHA)
1 Transpiration is the water absorbed by trees and other forms of vegetation and then re-released to the atmosphere as water vapour.2 See also http://www.westernrenew.co.uk/estimate.html for a useful summary of DIY approaches.

one can simply divert the full flow into a container of knownvolume, time how long it takes to fill and hence calculate theflow rate.
For larger streams, an initial estimate can be made bymeasuring the perceived average flow – a variation on‘Poohsticks’. The speed of the stream is measured by timing afloat over a measured distance (in metres, preferably in astraight line) and multiplying by a factor of between 0.8(smooth straight channel) and 0.6 (rocky channel). The crosssectional area of the stream can be calculated by measuringthe depth at several points across the stream, taking theaverage and multiplying that by the width. Then speed(metres per second, m/s) x area (m2) = flow Q (m3/sec).Alternatively, if available, an electro-magnetic velocity meteror similar device can be used to measure the velocity of flow.
A more accurate method of flow measurement, which alsoallows the recording of the daily flow rate over a long periodand hence the flow variation, is to build a weir (usually ofwood) across the stream with a rectangular notch cut in it asshown in Figure 4.4. The simplified formula for the flow overa rectangular weir is:
Q = 1.8 (L - 0.2h) h1.5 where
L = width of rectangular notch (m)h = height of water flowing over the weir (m)Q = flow rate (m3/sec)
Figure 4.4. The use of a rectangular notched weir for calculating flow(courtesy of the BHA)
An alternative to physical flow measurement, which to beaccurate needs to be undertaken over a long period (at least ayear and preferably several years), is to run a computerprogram which will calculate a range of flow values andproduce a FDC for a given site based on its grid reference.There are two models commonly used: HydrA and a moremodern version of the same program named LowFlows 2000.The latter is more accurate but HydrA has been usedsuccessfully to predict flows at potential hydro sites for anumber of years.
LowFlows 2000 is offered on a bureau basis by its developers,Wallingford Hydrosolutions Ltd, for those interested only in
the development of one or two sites at a cost of £175+VATper site. It is also available for longer lease periods if ongoingestimation for multiple sites is envisaged. Flow estimates arepresented in a simple graphical report format, includingestimates of both monthly and annual mean flows and flowduration statistics (Q95 for example), as well as giving clear advice on the best way to use this information inevaluating the potential of a particular site. Seewww.hydrosolutions.co.uk.
HydrA based evaluations are available from the DevonAssociation for Renewable Energy (DARE) who, upon receiptof basic site information, will produce a desk top report for£75+VAT per site. They can also provide a more detailedservice, including a site visit and assessment, at further cost.See www.devondare.org. The format and level of informationDARE provide can be seen in Appendix C, where their reporton selected Peak micro hydro sites is reproduced.
Finally, the Environment Agency measures the flow in mostsignificant rivers in the UK by means of permanent gaugingstations, with records going back over many years. There are anumber of such stations in and around the Peak District andtheir locations, and the data from them (stored in theNational River Flow Archive, NRFL) can be obtained atwww.ceh.ac.uk/data/nrfa/index.html. These records, whichinclude FDCs, can be used to estimate the flow at a particularsite providing allowance is made for the location of thegauging station relative to the proposed hydro site.
4.2.3 Demand assessmentDomestic electrical energy demand varies throughout the yearand also varies greatly during each day. For grid connectedsystems it is therefore important to assess the expecteddemand in terms of annual consumption and the averagedemand over 24 hours at different times of the year. This canbe achieved by taking regular (daily or at least weekly)electricity meter readings.
Energy efficiency should be investigated to ascertain if it ispossible to lower energy consumption as, by reducing localconsumption (demand), export potential (grid sales) andrevenue can be increased. As a guide, the electrical powerdemand of a house (excluding heating) is approximately 600W (i.e. roughly 5,300 kWh per year). This varies widely anddepends upon the number of power consuming devices andtheir useage (houses with electrical heating use substantiallymore).
Off grid systems require detailed load calculations to specifybattery and inverter sizing (see section 4.4).
Peak Power | page 25
Chapter 4 How to scope and implement a micro hydro scheme

4.3 FINANCE
4.3.1 CostsCAPITAL COSTSIt is difficult to give guidance on the estimated costs of microhydro schemes as hydro power, unlike other forms ofrenewable energy, is very site specific and hence costs varyenormously from site to site. However, the costs can usuallybe reduced considerably if the project is the renovation of anold mill site where infrastructure, such as the weir and leat, isstill in existence and in good condition.
The costs of a scheme can be divided into four parts:1 Civil works being all physical/engineering works concerned
with the abstraction and return of the water, as well as anybuilding costs to house the machinery.
2 Machinery being all the machinery (plant) necessary toconvert water power into electrical power from a turbine,waterwheel etc. to the generator. This may also includescreens, where needed.
3 Electrical works which include the control panel andcontrol system, wiring and grid connection and metering ifrequired.
4 External costs being the cost of a consultant to design andmanage the project plus costs of licences, planningpermission etc.
Generally, the cost per kilowatt of installed power increasesas the project size reduces due to certain fixed costs andeconomies of scale. A number of estimates of capital costhave been given which fall in the range of £1,000 to £4,500per installed kilowatt subject to the amount of civilengineering required. Above £5,000 per kW scheme viabilityusually diminishes rapidly.
The British Hydropower Association gives the following costbreakdown for a low head 100 kW scheme (see http://www.british-hydro.org/mini-hydro/infopageb5eb.html?infoid=379but note these prices may be a little dated). Total high headcosts for a comparably sized scheme would normally be alittle lower (£85,000-£200,000).
Civil works £30,000 to £100,000Machinery £60,000 to £120,000Electrical works £15,000 to £30,000(excl. grid connection)External costs £10,000 to £30,000TOTAL COSTS £115,000 to £280,000
The recent High Torrs scheme at New Mills, which involvedthe installation of an Archimedes screw with a capacity of 70 kW, cost £300,000 or about £4,300/kW. If all the electricitygenerated at New Mills (c.266,000 kWh/y) were sold at
15p/kWh (c.£39,990) then pay-back would be less than tenyears. However the estimation of the pay-back period for amicro hydro scheme is further complicated not only by theproportion of electricity which is exported to the grid andthat which is used on site but also by current fiscal incentivesfor renewable energy (see section 4.3.5).
OPERATING COSTSThe maintenance and servicing of a micro hydro scheme arelow as modern machinery is robust and requires littlemaintenance. The cost of routine inspections and servicingshould be about 1-2% of capital costs. To these costs shouldbe added the cost of insurance, rates (business if not part of adomestic property), disposal of screenings and metering ifconnected to the grid.
4.3.2 GrantsThere is a wide range of regional and national fundingavailable for micro hydro schemes. However, these tend tovary in availability in both time and space (region).Furthermore, grants depend upon whether the scheme is aprivate or community venture, the latter usually attractingmore support. Details of some current schemes are givenbelow and further sources of information are given inAppendix E.
LOW CARBON BUILDINGS PROGRAMMEThe Government’s Low Carbon Buildings Programme (LCBP)Phase 1 offers grants to domestic owners of mini hydro plantup to a maximum of £2,500 per property. The equipment mustbe chosen from an approved product list, and installed by aregistered installer. This scheme will now close in April 2010due to the introduction of feed-in tariffs.
The LCBP (Phase 2 extended) also offers larger grants tocommunity schemes which are owned and operated by a non-profit organisation for the benefit of the local community.Such organisations can include councils, schools, housingassociations, community groups etc. Grants of up to 50% ofproject costs can be obtained up to a maximum of £200,000.An essential element of these schemes is their ability to raiseawareness within the community and improve the nationalprofile of renewable energy schemes.
This scheme will also close in April 2011. It should be notedthat any project that obtains funding from central governmentsources may have to pay back these monies to be eligible forsupport from the proposed Feed-in Tariff (see below).
BRE COMMUNITY SUSTAINABLE ENERGY PROGRAMMEThis Big Lottery funded scheme supports not-for-profitcommunity organisations with funding for studies and project
page 26 | Peak Power
Chapter 4 How to scope and implement a micro hydro scheme

development. Grants are available for studies investigatingthe feasibility of installing renewable energy and energyconservation systems. The maximum grant available is £5,000or 75% of the study cost, whichever is smaller.
Capital funding is also available for energy efficiencymeasures in combination with micro-generation technology.Organisations can apply for up to £50,000 or 50% of theproject cost (whichever is lower) for installing renewableenergy technologies and energy efficiency measures. At thetime of writing, spending in the East Midlands and on hydrohas been less than in others areas and technologies, so theprobability of receiving funding is relatively good. Seewww.communitysustainable.org.uk.
COMMUNITY ACTION FOR ENERGY (CAfE) This is a programme from the Energy Saving Trust that isdesigned to promote and facilitate local community basedenergy projects. They offer a community support panel whichprovides free expertise and advice to CAfE members, includinghelp on grant funding, see http://www.energysavingtrust.org.uk/cafe/Green-Communities/Funding-Advice. After a freeconsultation, experts provide a review of the proposed projectand a short report, including recommendations for action.This may consist of advice over the phone and/or a site visitanywhere in the UK. The total time allocated for eachorganisation applying for support is limited however to oneand a half days.
OTHER GRANTS FROM LOCAL/REGIONAL BODIESSome planning authorities and the Peak District SustainableDevelopment Fund (SDF) have been willing to offer smallgrants towards small scale renewable energy projects in theirarea on an ad hoc basis. Exceptionally, larger sums may beoffered to help support capital expenditure but the norm isfor assistance with project development. Local authorities and the SDF should be able to advise on the currentavailability of grants.
A useful listing of funds available for renewable energyschemes can be found at Future Energy Yorkshire’s web site(http://www.co2sense.org.uk/) and follow the funding links. Inthe North West, grants are available via EnvirolinkNorthwest’s Low Carbon Development Programme(http://www.envirolinknorthwest.co.uk/). Unfortunately thereappear to be no regionally dedicated funded streams formicro generation (other than national provision) in the Eastor West Midlands regions but it is suggested that applicantscould try to access EU funding streams for rural innovationand diversification (such as LEADER), also available from theregional development agencies (RDAs), especially if thescheme can be linked with the farm-based economy.
TAX BREAKSIn addition to grants there are some tax breaks available. TheVAT payable on hydro electric plant installation is reduced to5% for systems supplying buildings which are eitherresidential or used for charitable purposes.
4.3.3 LoansA micro hydro project which is constructed solely forcommunity benefit is usually eligible for so-called soft loans.Soft loans are a type of business loan where little or nopersonal collateral is required by the bank or commerciallender. The main UK providers of such loans are Charity Bank,Triodos Bank and Co-operative Bank, with Triodos havingdedicated schemes for renewable energy projects.
4.3.4 Community schemesThere are various funding streams available for communityhydro schemes, depending upon the legal structure of theenterprise, which can take several forms, including a• Trust• Limited liability company (by shares or guarantee)• Community interest company• Industrial provident society• Charitable incorporated organisation or co-operative
Which of these structures is adopted will depend upon theparticular circumstances of the scheme but it is generallyconsidered that the three most appropriate for a non-profitcommunity business activity are a company limited byguarantee, a community interest company or an industrialprovident society. These structures allow the use of ‘equity’funding (capital raised, usually by a share offer) from socialinvestors who generally consider their investment to be forsocial and community benefit rather than short-medium termfinancial gain and therefore do not expect high rates of return.
Water Power Enterprises (H2OPE), a social enterprise companycreated to develop community hydro schemes (focusingmainly on Archimedes screw solutions), offers a bespokemodel for communities to engage with. In essence, H2OPEmanage scheme development from inception to fruition inreturn for a fee on completion of the project (or a proportionof subsequent income). Project funding is usually a mixture ofgrants, soft loans and a share offer. Projects successfullydelivered so far include the Torrs hydro scheme at New Millsand at Settle in the Yorkshire Dales National Park, amongothers. See http://www.h2ope.org.uk/.
Energy4all Ltd is another not-for-profit organisation helpingcommunities own a stake in renewable energy schemes (seewww.energy4all.co.uk). Although their main successes have sofar been with wind power, they are also interested in helpingdevelop hydro projects.
Peak Power | page 27
Chapter 4 How to scope and implement a micro hydro scheme

4.3.5 RevenueA micro hydro scheme can generate revenue by differentmethods, many of which can be used in combination:• On site electricity use (reducing bills)• Local electricity sales• Utility company sales• Renewable Obligation Certificates (ROCs)• Levy Exemption Certificates (LECs)• Renewable Energy Guarantees of Origin (REGOs)• Feed-In Tariffs (FITs)
ROCs are to be replaced by the Feed-In Tariff in April 2010 forprojects under 50 kW. The sale of renewable energy iscomplicated and for most schemes the sale of electricity to autility to claim income from the Feed-In Tariff and LECs willoffer the best income. In this case, any electricity used at thesite would reduce electricity bills and still be eligible forincome from the Feed-In Tariff.
Each of these sources of income is now described in moredetail below:
ON SITE ELECTRICITY USEIf the electricity is used on site, as for example at ChatsworthHouse and Caudwell’s Mill, so displacing electricity boughtfrom the grid, then there is a financial saving and someenergy companies will also pay for renewable electricitygenerated, even if it is consumed on site (e.g. Good Energy,Ecotricity, Green Energy).
LOCAL ELECTRICITY SALESAlternatively, the electricity generated could be sold to asubstantial local user (e.g. the Co-op supermarket in the caseof the New Mills/Torrs hydro scheme) at the same price as ifit was purchased from the grid. Also, if the customer is abusiness user they would save having to pay an extra 0.47p/kWh Climate Change Levy with each unit of hydro electricitypurchased. Preparing a Power Purchase Agreement contractfor such an arrangement can be complicated and expensive,making it easier to sell to a utility company (who may offerreduced rates for purchased energy in return).
UTILITY COMPANY SALESMost electricity suppliers will buy renewable energy andspecialists include Ecotricity, Green Energy (UK) plc and GoodEnergy. Prices can be in the region of 15p per kWh. Thesecompanies will also pay for the ROC (or Feed-in Tariff) andLEC elements as well as the wholesale value of the electricity(around 5p/kWh).
ROCsRenewable Obligation Certificates (ROCs) are awarded byOfgem for every 1 MWh of power generated from a
renewable source. They are needed by energy supplycompanies to show that they are meeting Government targetsfor CO2 emission reduction and hence can be traded withtheir value depending upon the supply and demand of ROCson the open market. ROCs are to be replaced by the Feed-InTariff in April 2010; the latter offers a less complicatedsystem and better income.
From 1 April 2009 a new Government banding system willmean that schemes of 50 kW installed capacity and less willbe eligible for double ROCs. Under this scheme a base price isset, guaranteeing the minimum value of a ROC. However,there are insufficient ROCs on the market at present to satisfydemand which results in a higher value for each ROC. At theend of 2008 ROCs had a base price of about £37.00/MWh anda market value of about £45.00/MWh with estimated futurelevels based on a growth rate of 2.5% given in Table 4.1,although with the increased construction of wind farms themarket value of ROCs could fall.
Table 4.1 Estimated ROC Values 2008/09 to 2013/14
YEAR £ per MWh
2008/09 45.00
2009/10 46.13
2010/11 47.28
2011/12 48.46
2012/13 49.67
2013/14 50.91
In addition there are monies available from the ROC BuyoutFund Premium, again administered by Ofgem, which are paidto renewable energy generators based on penalties levied onsuppliers for missing RO targets.
LEVY EXEMPTION CERTIFICATESElectricity purchased from micro hydro schemes is exemptfrom the Climate Change Levy (introduced by the Governmentin 2001) and hence hydro generators are issued with LevyExemption Certificates (LECs) by Ofgem. LECs are issued forevery MWh and have a price in 2009/2010 of £4.70 each,which is indexed in line with the retail price index (RPI). Thecurrent legislation applies until 2011 but it is expected to beextended. However, the revenue received from the sale ofLECs through any agreement with an electricity supplier istypically 20-55% of their face value.
REGOsRenewable Energy Guarantees of Origin are again issued byOfgem at 1 per MWh of electricity generated but at presentthey have no market value. This may change in the future if aEuropean renewable energy market develops. Therefore it is
page 28 | Peak Power
Chapter 4 How to scope and implement a micro hydro scheme
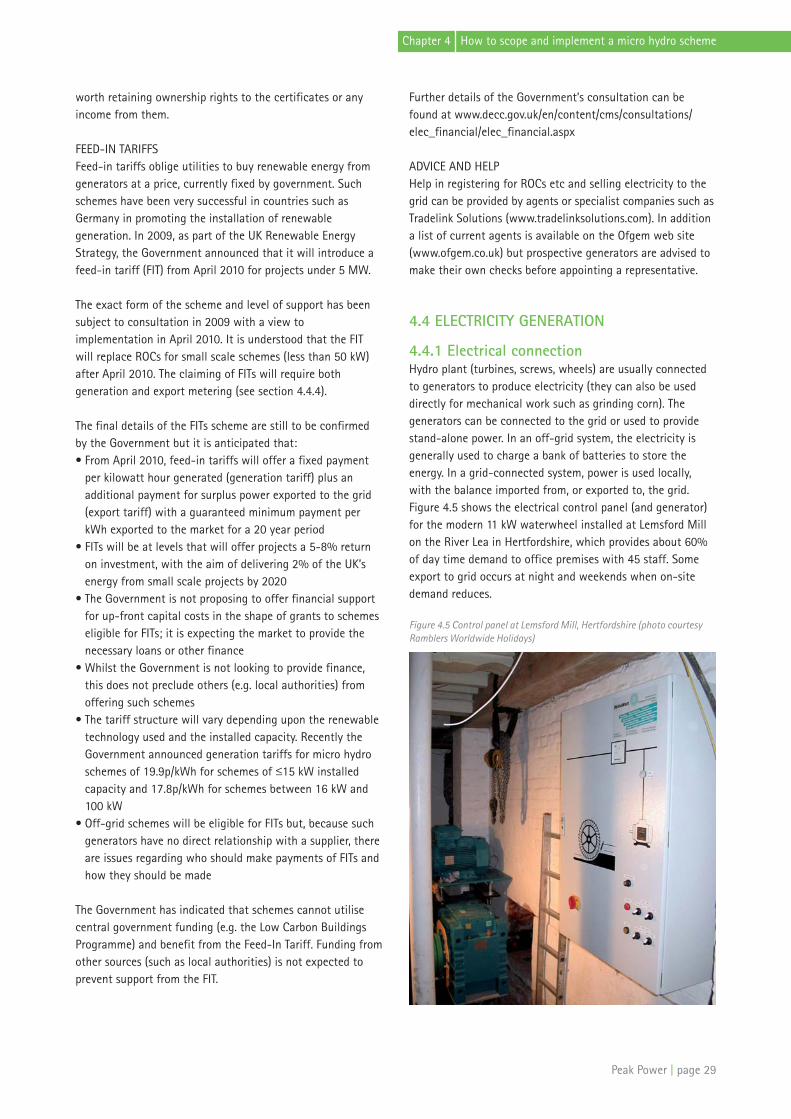
worth retaining ownership rights to the certificates or anyincome from them.
FEED-IN TARIFFSFeed-in tariffs oblige utilities to buy renewable energy fromgenerators at a price, currently fixed by government. Suchschemes have been very successful in countries such asGermany in promoting the installation of renewablegeneration. In 2009, as part of the UK Renewable EnergyStrategy, the Government announced that it will introduce afeed-in tariff (FIT) from April 2010 for projects under 5 MW.
The exact form of the scheme and level of support has beensubject to consultation in 2009 with a view toimplementation in April 2010. It is understood that the FITwill replace ROCs for small scale schemes (less than 50 kW)after April 2010. The claiming of FITs will require bothgeneration and export metering (see section 4.4.4).
The final details of the FITs scheme are still to be confirmedby the Government but it is anticipated that:• From April 2010, feed-in tariffs will offer a fixed payment
per kilowatt hour generated (generation tariff) plus anadditional payment for surplus power exported to the grid(export tariff) with a guaranteed minimum payment perkWh exported to the market for a 20 year period
• FITs will be at levels that will offer projects a 5-8% returnon investment, with the aim of delivering 2% of the UK’senergy from small scale projects by 2020
• The Government is not proposing to offer financial supportfor up-front capital costs in the shape of grants to schemeseligible for FITs; it is expecting the market to provide thenecessary loans or other finance
• Whilst the Government is not looking to provide finance,this does not preclude others (e.g. local authorities) fromoffering such schemes
• The tariff structure will vary depending upon the renewabletechnology used and the installed capacity. Recently theGovernment announced generation tariffs for micro hydroschemes of 19.9p/kWh for schemes of <_15 kW installedcapacity and 17.8p/kWh for schemes between 16 kW and100 kW
• Off-grid schemes will be eligible for FITs but, because suchgenerators have no direct relationship with a supplier, thereare issues regarding who should make payments of FITs andhow they should be made
The Government has indicated that schemes cannot utilisecentral government funding (e.g. the Low Carbon BuildingsProgramme) and benefit from the Feed-In Tariff. Funding fromother sources (such as local authorities) is not expected toprevent support from the FIT.
Further details of the Government’s consultation can befound at www.decc.gov.uk/en/content/cms/consultations/elec_financial/elec_financial.aspx
ADVICE AND HELPHelp in registering for ROCs etc and selling electricity to thegrid can be provided by agents or specialist companies such asTradelink Solutions (www.tradelinksolutions.com). In additiona list of current agents is available on the Ofgem web site(www.ofgem.co.uk) but prospective generators are advised tomake their own checks before appointing a representative.
4.4 ELECTRICITY GENERATION
4.4.1 Electrical connectionHydro plant (turbines, screws, wheels) are usually connectedto generators to produce electricity (they can also be useddirectly for mechanical work such as grinding corn). Thegenerators can be connected to the grid or used to providestand-alone power. In an off-grid system, the electricity isgenerally used to charge a bank of batteries to store theenergy. In a grid-connected system, power is used locally,with the balance imported from, or exported to, the grid.Figure 4.5 shows the electrical control panel (and generator)for the modern 11 kW waterwheel installed at Lemsford Millon the River Lea in Hertfordshire, which provides about 60%of day time demand to office premises with 45 staff. Someexport to grid occurs at night and weekends when on-sitedemand reduces.
Figure 4.5 Control panel at Lemsford Mill, Hertfordshire (photo courtesyRamblers Worldwide Holidays)
Peak Power | page 29
Chapter 4 How to scope and implement a micro hydro scheme

4.4.2 Off-grid systemsMost off-grid micro hydro systems are battery based. Batteriescan also be connected to wind turbines and solar panels inhybrid systems. Batteries store energy between the time ofgeneration and use. Where stream flow is consistent, it isoften possible to use a small battery bank. Battery banks costa significant amount, require considerable space and have anegative environmental impact due to the lead and acid theycontain, as well as the energy required to make and recyclethem. As a battery bank can only store a limited amount ofenergy for a moderate length of time and is damaged byrepeated deep discharge, a back-up generator (or alternativesources of renewable energy) might also be required toprovide additional energy at times of low water flow.
Batteries can be used to run low voltage direct current (DC)appliances including lights, computers and audio equipment,or used with inverters which convert the low voltage DC to240 volt alternating current (AC), as used in most homes.When using a battery bank and inverter, the maximum amountof power that can be supplied is limited not by the water flowor turbine but the size of the battery bank and inverter.
A charge controller is also required to ensure that thebatteries are not over charged or discharged too deeply. Suchappliances divert excess electricity to loads such as space orwater heaters when the batteries are fully charged (‘shuntregulation’ using ‘dump loads’) or shut down the supply ofwater to the generating system.
4.4.3 Grid connected systemsIn sites that are connected to the grid, power will typically besupplied at 240V AC via the main distribution breaker.Schemes of 10 kW or over usually require connection at 415VAC (three phase), and need to meet the requirements of theG59 standard for grid connection (see box below). The G59standard also details the requirement for disconnection fromthe grid (for safety reasons) in the event of a grid fault.
GRID CONNECTION STANDARDSAny decentralised (sometimes termed ‘embedded’)generation, including micro hydro, must conform tostandards set for connection to an electrical distributionsystem (the grid). There are two standards that are applicable:
• G83: this covers up to 16 amps (A) per phase, equating to an upper limit of 6 kW at low voltage or around 11 kWfor three phase connections. Thus if your generator isaround 10 kW or lower in power output, this is likely to be the applicable standard. The connecting equipment will need to be certified to the G83 technical specificationand the distribution network operator (DNO) only needs to be notified of the connection.
• G59: this covers connection upwards of 6/11 kW (to anupper limit of 5 MW at 20 kV). It will require a connectionapplication and potential study by the DNO (which will be charged for) to ensure the local grid has the capacity to absorb new generation. A connection offer should bemade by the DNO within 90 days with cost estimates(some of which may be ‘contestable’: see below).
The amount of generated energy that can enter the grid at agiven location depends on the ‘strength’ of the nearby grid. A weak grid will suffer noticeable voltage increases wheneven a small amount of generation is added. The strength ofthe grid can be assessed by consideration of factors such asthe size of cable supplying the building, the number ofphases3, the distance to the substation, local loads and thecombined effects of hydro and any other local generation.Connecting a generator can increase or decrease local powerquality and network stability depending on the localgenerator and network characteristics.
The cost of connecting to the grid depends on a number offactors including the distance to a suitable connection pointand any reinforcement works that need to be undertaken.The cost of three-phase connection varies widely and mostcosts, including reinforcement, are passed on by the DNO tothe customer (hydro developer). Costs include: - equipment and its installation- the provision of wayleaves and easements (see section 3.5)- reinforcement and diversions of the existing grid
distribution system- administrative charges, and- commissioning
Long connection distances and associated wayleaves orreinforcement works frequently make connection costsprohibitive, especially where cables may need to be placedunderground.
Work such as cable laying and installation of sub-stations canbe undertaken by approved contractors and then ‘adopted’ bythe DNO. Work which may be carried out by such approvedcontractors is referred to as ‘contestable’, whereas non-contestable work covers the design, connection andadministration tasks that can only be undertaken by the DNOwho will charge for these services.
4.4.4 Electricity salesAs well as the standard electricity import meter, ‘generation’and/or ‘export’ metering is required to sell electricity from agenerator. A generation meter measures the total output ofthe generator, whilst an export meter measures the netgeneration at the site. A generation meter is normally
page 30 | Peak Power
3 Commonly single phase for domestic properties and three phase for commercial, industrial or agricultural premises with heavier loads.
Chapter 4 How to scope and implement a micro hydro scheme

installed as part of an installation, whilst an optional exportmeter will incur an additional cost, typically around £100. Seethe revenue section (4.3.5) above for details of the differentways to sell electricity generated.
4.4.5 Heat from hydroHydro systems offer a relatively constant power outputaround the clock, with higher output in winter. This outputprofile means that hydro is well suited to running heatingsystems such as heat pumps where energy is required most ofthe time and particularly in winter.
Hydro systems may be used to provide heat by the use ofgenerated electricity. This may either be achieved by the useof resistive heating (electric fires, fan heaters, storage heatersetc), or the use of heat pumps. In general, the use of resistiveheating should be discouraged on efficiency grounds.
In addition to the use of generated electricity, the use ofwaste heat from generators and gearboxes might beconsidered. Although more expensive, water cooledgenerators are available and cooling will help to minimise theenergy losses from a generator by reducing the resistance ofthe internal wiring.
The cooling of gearboxes may also be considered, but theoptimum oil temperature should be considered with care andthe manufacturer’s instructions followed, as cooling the oilexcessively will increase energy losses due to oil viscosity, andallowing it to run too hot will shorten the life of the oil andreduce the protection of mechanical components.
4.4.6 Heat pump systemsHeat pump systems use heat at ambient temperatures fromthe ground, air or water, to drive a high efficiency heatingsystem. Particularly when used in conjunction with under-floor heating, they can deliver three to six times more heatinto a building than the amount of electricity they consume.This ratio is known as the coefficient of performance (COP).The higher this value in a given set of circumstances, thebetter the performance of the heat pump. By modernstandards, COP values of three and below are poor and valuesabove five are good. Traditional resistive electric heating canonly achieve a COP of one.
The COP that a heat pump can attain depends on thedifference in temperature between the heat source and theemitter of the heat within the building. The smaller thedifference in temperature the better the COP, thus the use ofunder floor heating at less than 40°C offers betterperformance than radiators above 60°C. By the same token,the higher the temperature of the heat source (air, ground orwater), the better the COP.
Air source heat pumps have the disadvantage that on thecoldest days of winter, condensation may freeze on the heatexchangers, energy has to be used to defrost these, and thenet COP may be little above one. Ground source systems needextensive ground works to avoid excessive cooling of theground and are prone to low input temperatures late in theheating season because the thermal capacity andconductivity of the surrounding soil are limited.
By contrast, water source heat pumps use water as the sourceof heat which on a hydro site is always being replenished, andwater temperatures are higher than air in the depths ofwinter by a significant margin, making this an ideal spaceheating technology to exploit at most hydro sites. Watersource heat pump systems can offer good efficiency withlittle infrastructure. Such systems will not necessarily beavailable ‘out of the box’ and some bespoke design andconstruction of heat exchangers will typically be required.This must be undertaken with some care to avoid damage inthe event of unusually high flow rates.
More information applicable to water source heat pumps canbe found in the T4S report Peak District Spring Water SourceHeat Pump Opportunities, also produced with funding fromthe Peak District National Park Authority, available at:http://www.t4sustainability.co.uk/downloads/PeakDistrictHeatingFromSpringWater0123.pdf
4.4.7 Hybrid systemsHydro can be used in conjunction with other renewableenergy sources and this is particularly relevant for off-gridsystems where photo-voltaics (solar electrical generators) canbe used to complement hydro. Solar and hydro can work welltogether as solar peak output is in summer, whilst hydro peakoutput is in winter; thus offering a more constant outputthroughout the year.
Peak Power | page 31
Chapter 4 How to scope and implement a micro hydro scheme
5.1 INTRODUCTION
A core aim of the project was to bring together an up-to-dateand comprehensive data set of existing and potential microhydro schemes and sites in the wider Peak District. Thisinvolved data gathering from a variety of sources including:previous studies; old mill records and databases; companies orother owners and organisations operating or implementinghydro schemes; consultation with communities and landowners; and finally, visiting, surveying and assessing potentialsites identified by the data gathering process.
Three main categories of sites were noted or investigated:existing (operating) sites (12); old mill sites (131); and non-mill sites (19, including potential high head schemes). Afurther sub-division of sites inside or just outside the NationalPark was also recognised (120 inside; 42 just outside). A threestage process was then applied to the potential sites: 1. A ‘walk over’ visit (117 sites) – see section 5.42. Constraint mapping and assessment using a GeographicalInformation System or GIS (59 sites) – see section 5.53. More detailed site investigations (20 sites) – see section 5.6;followed by pre-feasibility studies for 10 key sites (Chapter 6). The full methodologies for each stage are described below.
Finally, it should be noted that the ten sites taken forward askey case studies (described in full in Chapter 6) were notchosen as being the ‘top ten’ sites with the best hydropotential, but rather because they represented a good rangeof typical Peak District sites with reasonable potential. It wasfelt that exploring the opportunities and constraints of a widerange of sites would be of more utility to site owners andcommunities whose situations are usually quite varied.
5.2 CONSULTATION WITH KEY STAKEHOLDERSAND LOCAL COMMUNITIES
In addition to forming a project advisory group (see section1.1 and see Appendix F), early and ongoing discussions alsotook place with representatives of the three water andsewerage companies with assets within the National Park:United Utilities (UU), Yorkshire Water (YW) and Severn TrentWater (STW). This was to ascertain their existing hydroelectric generating capacity and any studies undertakenand/or subsequent proposals for the development of anyadditional hydro power installations.
In relation to raising public awareness of the project andseeking suggestions for potential sites, a letter introducingthe project was sent to every Parish Council within theNational Park. Following completion of the initial site visits, apress release was issued to garner further interest and twopublic consultation meetings were held, a week apart. Thefirst was in Glossop and the second in Cromford, cateringroughly for more northerly and southerly communitiesrespectively. These were well attended, especially by thosewith direct interest in a variety of mill sites.
A key outcome from these events was the recommendationthat hydro sites just outside the National Park be includedwithin the study, especially where a community spanned theboundary. This was duly adopted and resulted in an additional42 sites being assessed, including two as key case study sites(Via Gellia Mills near Bonsall; Millthorpe in North EastDerbyshire).
5.3 EXISTING PEAK HYDRO POWER CAPACITY
There are about 1.6 megawatts (MW) of installed mini/microhydro capacity within (or just outside) the National Park areaat present and all sites are listed in Table 5.1. The vastmajority of this capacity is situated within water supplynetworks (see below) with the only other significantinstallations being at Chatsworth, where a 162 kW turbine isused to provide electricity to the House, and the new 30 kWscheme at Alport Mill, near Youlgreave, installed in 2009 (see section 3.3).
page 32 | Peak Power
Chapter 5 Surveying hydro power potential in the Peak District
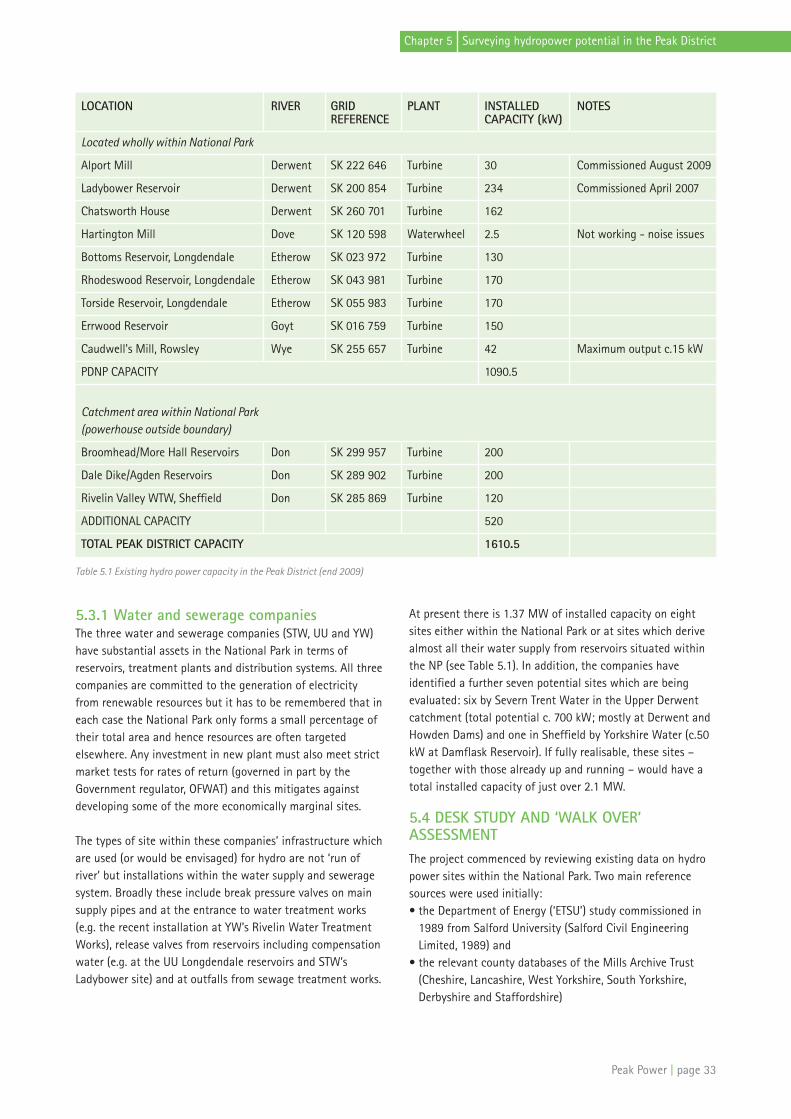
5.3.1 Water and sewerage companiesThe three water and sewerage companies (STW, UU and YW)have substantial assets in the National Park in terms ofreservoirs, treatment plants and distribution systems. All threecompanies are committed to the generation of electricityfrom renewable resources but it has to be remembered that ineach case the National Park only forms a small percentage oftheir total area and hence resources are often targetedelsewhere. Any investment in new plant must also meet strictmarket tests for rates of return (governed in part by theGovernment regulator, OFWAT) and this mitigates againstdeveloping some of the more economically marginal sites.
The types of site within these companies’ infrastructure whichare used (or would be envisaged) for hydro are not ‘run ofriver’ but installations within the water supply and seweragesystem. Broadly these include break pressure valves on mainsupply pipes and at the entrance to water treatment works(e.g. the recent installation at YW’s Rivelin Water TreatmentWorks), release valves from reservoirs including compensationwater (e.g. at the UU Longdendale reservoirs and STW’sLadybower site) and at outfalls from sewage treatment works.
At present there is 1.37 MW of installed capacity on eightsites either within the National Park or at sites which derivealmost all their water supply from reservoirs situated withinthe NP (see Table 5.1). In addition, the companies haveidentified a further seven potential sites which are beingevaluated: six by Severn Trent Water in the Upper Derwentcatchment (total potential c. 700 kW; mostly at Derwent andHowden Dams) and one in Sheffield by Yorkshire Water (c.50kW at Damflask Reservoir). If fully realisable, these sites –together with those already up and running – would have atotal installed capacity of just over 2.1 MW.
5.4 DESK STUDY AND ‘WALK OVER’ASSESSMENTThe project commenced by reviewing existing data on hydropower sites within the National Park. Two main referencesources were used initially:• the Department of Energy (‘ETSU’) study commissioned in
1989 from Salford University (Salford Civil EngineeringLimited, 1989) and
• the relevant county databases of the Mills Archive Trust(Cheshire, Lancashire, West Yorkshire, South Yorkshire,Derbyshire and Staffordshire)
Peak Power | page 33
Chapter 5 Surveying hydropower potential in the Peak District
Table 5.1 Existing hydro power capacity in the Peak District (end 2009)
LOCATION RIVER GRID PLANT INSTALLED NOTESREFERENCE CAPACITY (kW)
Located wholly within National Park
Alport Mill Derwent SK 222 646 Turbine 30 Commissioned August 2009
Ladybower Reservoir Derwent SK 200 854 Turbine 234 Commissioned April 2007
Chatsworth House Derwent SK 260 701 Turbine 162
Hartington Mill Dove SK 120 598 Waterwheel 2.5 Not working - noise issues
Bottoms Reservoir, Longdendale Etherow SK 023 972 Turbine 130
Rhodeswood Reservoir, Longdendale Etherow SK 043 981 Turbine 170
Torside Reservoir, Longdendale Etherow SK 055 983 Turbine 170
Errwood Reservoir Goyt SK 016 759 Turbine 150
Caudwell's Mill, Rowsley Wye SK 255 657 Turbine 42 Maximum output c.15 kW
PDNP CAPACITY 1090.5
Catchment area within National Park(powerhouse outside boundary)
Broomhead/More Hall Reservoirs Don SK 299 957 Turbine 200
Dale Dike/Agden Reservoirs Don SK 289 902 Turbine 200
Rivelin Valley WTW, Sheffield Don SK 285 869 Turbine 120
ADDITIONAL CAPACITY 520
TOTAL PEAK DISTRICT CAPACITY 1610.5

The ETSU study, whilst providing valuable data on a numberof sites, was limited in its scope in that it set lower limits of25 kW of installed power or a 2m head. However, the studydid include a list of rejected sites (i.e. those below thoselimits) which formed a useful starting point.
Additional data on historic watermill sites was obtained fromthe book Derbyshire Watermills – Corn Mills by Alan Gifford(Gifford, 1999) to which was added details of sites obtainedfrom sources such as suggestions from Parish Councils andlocal historical societies. In all, over 130 old mill sites wereidentified either within or adjacent to the National Park.These historic sites give a good indication of the overall grossriver potential1 for hydro power in the Peak District and themost likely locations for new/reinstated schemes.
5.4.1 Old mill sitesMost of the old mill sites within the National Park and some(but not all) just outside were visited and a rough ‘walk-over’survey conducted (either using adjacent public rights of wayor by permission of the owner) to ascertain their potential fordevelopment as micro hydro sites. Many were found to be nolonger in existence or derelict (some even flooded by laterreservoir schemes); some had fallen into disuse but with theiroriginal equipment still in place; some have been or are beingrestored (often as dwellings); and a few have been convertedto generate electricity. Excluding the latter category, the restof the sites were then classified into three categories:• ‘a’ – those sites with good potential for micro hydro power
(MHP) development• ‘b’ – those sites with possible potential for MHP development• ‘c’ – those sites with little or no potential
The classification is indicative but took into account thefollowing criteria:• Whether the site was still in existence• If the mill building was demolished or converted into
dwelling• The condition and extent of existing mill infrastructure
(leats etc)• The flow in the watercourse available for power• The head available• Location and access (e.g. for civil works)• Any other obvious potential constraints
The main reason for classifying mill sites as ‘c’ was generallybecause the mill or its infrastructure had ceased to existand/or the flow was too low for power generation. In somelocations, although the flow would have been sufficient topower a waterwheel and slow moving machinery (often withthe aid of overnight storage in a millpond), the ‘run of river’flow was generally insufficient to drive a turbine or similarmachinery to generate electricity.
Those sites classified as ‘a’ or ‘b’, see Appendix A1, were thensubjected to detailed GIS analysis (see sections 5.5 and 5.7below). The ‘c’ mills, listed in Appendix A4, were not subjectto any further analysis but, if the need for rural micro-generation were to increase substantially in the future, somesites may become viable and worth re-examining. Viablelocations just outside the National Park, comprising both milland non-mill sites where the catchment is largely within theNP, are listed in Appendix A2.
5.4.2 Non-mill sitesDue mainly to the likely environmental and ecologicalproblems associated with the construction of new weirs andextraction points on rivers and streams within the NationalPark, it was decided at the outset of the project not to place astrong focus on investigating potential new hydro sites(including high head sites). However, the ETSU studyidentified two such sites, one on the Bar Brook at Baslow andone on Burbage Brook (Padley Gorge) and other potentialsites have been identified during the study.
Additionally other (non-mill) weir structures (usually ownedby one of the water and sewerage companies) were alsoidentified, leading to a total of 18 non-mill sites. All thesesites are listed in Appendix A3 to give a more completepicture of the potential for micro hydro in the National Park(if visited, the same classification potential ‘a’/’b’/’c’ has beenapplied). Some more information on and assessment of thesesites is given in both this chapter (see section 5.7.2) and thenext chapter on key case study sites.
5.5 GEOGRAPHICAL INFORMATION SYSTEM(GIS) SCREENING
Roughly 60 sites (classified ‘a’ and ‘b’) were investigated usinga bespoke computer model specially commissioned for thisproject from T4Sustainability. The Peak District National ParkAuthority made its planning constraint data availablespecially to the project and other spatial information wassourced from MAGIC (Multi-Agency Geographic Informationfor the Countryside – a publicly-available web-basedinteractive map service which brings together environmentalinformation from across government – seewww.magic.gov.uk).
5.5.1 GIS screening and its limitationsThe sites selected for investigation were imported into theGIS to facilitate the identification of potential constraints todevelopment (most of the GIS data supplied by the NPA isthat used by their planning service to identify constraintswhen development proposals are submitted). A constraintsmap and list was produced for each site studied and these arereproduced in full in Appendix B. It should be noted that
page 34 | Peak Power
Chapter 5 Surveying hydropower potential in the Peak District
1 A crude estimate of all possible power from ‘run of river’ schemes, i.e. excluding potential high head sites.
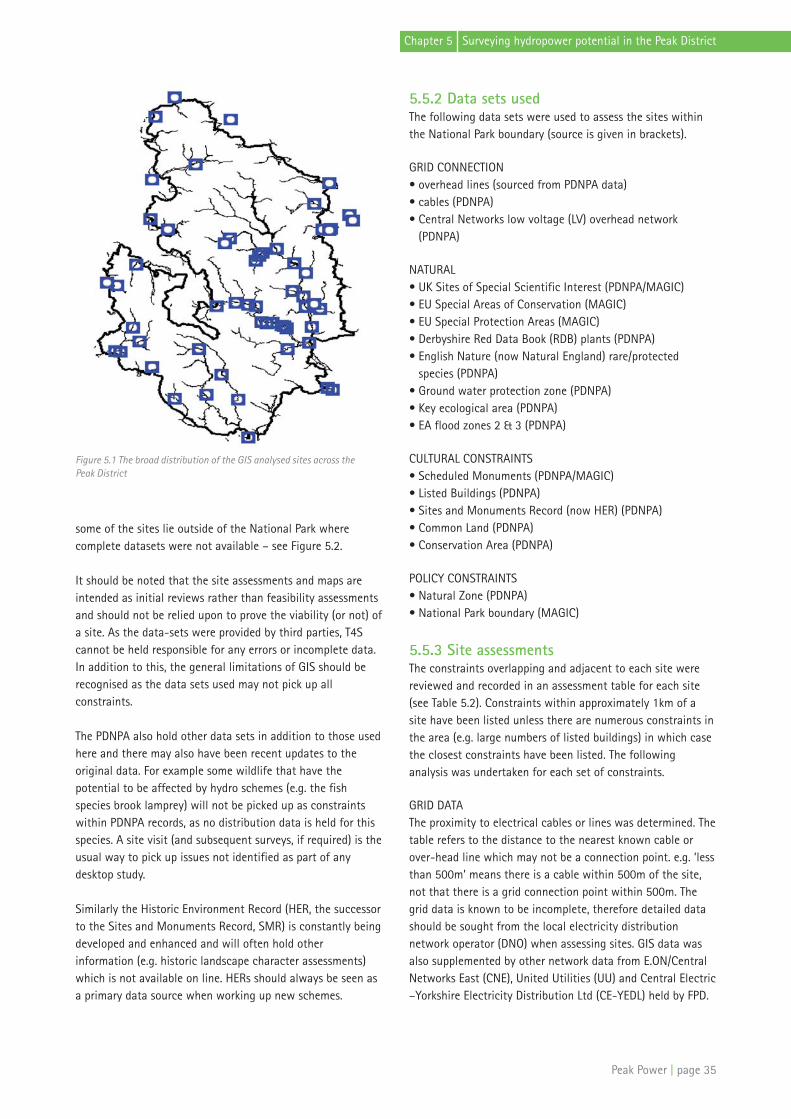
some of the sites lie outside of the National Park wherecomplete datasets were not available – see Figure 5.2.
It should be noted that the site assessments and maps areintended as initial reviews rather than feasibility assessmentsand should not be relied upon to prove the viability (or not) ofa site. As the data-sets were provided by third parties, T4Scannot be held responsible for any errors or incomplete data.In addition to this, the general limitations of GIS should berecognised as the data sets used may not pick up allconstraints.
The PDNPA also hold other data sets in addition to those usedhere and there may also have been recent updates to theoriginal data. For example some wildlife that have thepotential to be affected by hydro schemes (e.g. the fishspecies brook lamprey) will not be picked up as constraintswithin PDNPA records, as no distribution data is held for thisspecies. A site visit (and subsequent surveys, if required) is theusual way to pick up issues not identified as part of anydesktop study.
Similarly the Historic Environment Record (HER, the successorto the Sites and Monuments Record, SMR) is constantly beingdeveloped and enhanced and will often hold otherinformation (e.g. historic landscape character assessments)which is not available on line. HERs should always be seen asa primary data source when working up new schemes.
5.5.2 Data sets usedThe following data sets were used to assess the sites withinthe National Park boundary (source is given in brackets).
GRID CONNECTION• overhead lines (sourced from PDNPA data)• cables (PDNPA)• Central Networks low voltage (LV) overhead network
(PDNPA)
NATURAL• UK Sites of Special Scientific Interest (PDNPA/MAGIC)• EU Special Areas of Conservation (MAGIC)• EU Special Protection Areas (MAGIC) • Derbyshire Red Data Book (RDB) plants (PDNPA)• English Nature (now Natural England) rare/protected
species (PDNPA)• Ground water protection zone (PDNPA)• Key ecological area (PDNPA)• EA flood zones 2 & 3 (PDNPA)
CULTURAL CONSTRAINTS• Scheduled Monuments (PDNPA/MAGIC)• Listed Buildings (PDNPA)• Sites and Monuments Record (now HER) (PDNPA)• Common Land (PDNPA)• Conservation Area (PDNPA)
POLICY CONSTRAINTS• Natural Zone (PDNPA)• National Park boundary (MAGIC)
5.5.3 Site assessments The constraints overlapping and adjacent to each site werereviewed and recorded in an assessment table for each site(see Table 5.2). Constraints within approximately 1km of asite have been listed unless there are numerous constraints inthe area (e.g. large numbers of listed buildings) in which casethe closest constraints have been listed. The followinganalysis was undertaken for each set of constraints.
GRID DATAThe proximity to electrical cables or lines was determined. Thetable refers to the distance to the nearest known cable orover-head line which may not be a connection point. e.g. ‘lessthan 500m’ means there is a cable within 500m of the site,not that there is a grid connection point within 500m. Thegrid data is known to be incomplete, therefore detailed datashould be sought from the local electricity distributionnetwork operator (DNO) when assessing sites. GIS data wasalso supplemented by other network data from E.ON/CentralNetworks East (CNE), United Utilities (UU) and Central Electric–Yorkshire Electricity Distribution Ltd (CE-YEDL) held by FPD.
Peak Power | page 35
Chapter 5 Surveying hydropower potential in the Peak District
Figure 5.1 The broad distribution of the GIS analysed sites across thePeak District

NATURAL CONSTRAINTSThe names (or reference numbers where names were notavailable) of relevant local constraints (usually species orhabitats) have been given for each constraint exceptnationally protected species which are confidential. For suchprotected species, their presence has been noted and wherepossible an indication of rough location given.
CULTURAL CONSTRAINTSThe names (or reference numbers where names were notavailable) of relevant local constraints have been given foreach site. Where there are numerous listed buildings orscheduled monuments only the closest have been listed.Please note that SMR data was used in the GIS analysis –these records are now part of the HER (see 5.5.1).
POLICY CONSTRAINTSIf the site is within or adjacent to the Natural Zone2, this wasrecorded. Sites near or outside the National Park boundarywere recorded as such. The relationship to Conservation Areaswas also recorded.
5.5.4 Site mapsA map showing potential constraints to development wasprepared for each site (see Figure 5.1). The map has a legendand gives a site reference number as well as the site name.The scale of each map was set to best show the relevantconstraints as clearly as possible. Each potential hydro site isshown using a blue square symbol and to reduce confusionmany are not centred on the page to avoid showing adjacentsites on the same map.
The following should also be noted about the maps prepared:
FLOOD ZONESThe GIS data for EA-designated flood zones 2 and 3 appearsto be corrupted and therefore they have not been shown forsome sites although the constraint is listed in theaccompanying tables.
GROUND WATER PROTECTION ZONEThis constraint is not shown on the maps as it obscures otherdata layers; again this constraint is listed in the tables.
5.5.5 Sites outside the National Park boundaryAs the PDNPA data sets are limited to the National Parkboundaries, only limited data (from MAGIC) is available forsites outside the NP boundaries. As all the sites outside theNP were close to the boundary, a combination of PDNPA andMAGIC data sets was used to determine most constraints.
Where PDNPA data showed there were constraints near tothe site they have been listed, otherwise the data row hasbeen removed from the table (as it has not been possible todefinitively determine whether the constraint is present ornot due to a lack of data).
Where constraints have been identified in the vicinity of asite using PDNPA data, it is not possible to establish whetherthe site is overlapped by other data points in this constraintdata set (as the site is outside the NP). In this case the tablerefers to ‘not known’ (rather than not applicable, N/A) in therelevant row.
The full set of constraint maps and tables for each ‘a’ or ‘b’site is reproduced in Appendix B. Old mill sites are referencedM1 et seq., non-mill sites N1 et seq. and sites outside the NPas O1 et seq.
5.6 FURTHER SITE INVESTIGATIONS
Twenty sites were either chosen specifically for furtherinvestigation (the key case study sites) or were investigated inmore detail at the request of site owners or other interestedparties. This usually involved a further site visit, oftenaccompanied by land owners/other parties, to scope issuesincluding: neighbour considerations/riparian rights; extractionrights; other riverine issues; local landscape character andvisual impact issues; ground-truthing GIS/MAGIC dataincluding archaeology, ecology and electrical connection;state of infrastructure; and owner ambitions. Head wasmeasured by a dumpy level (Topcon AT-24A), tripod (Topcon)and 5m staff (Stanley). Crude measurements of flow weremade if no other local data was available.
The sites looked at in more detail were the ten key case studysites: Whitelee Mill; Lumford Mill (Riverside); Bamford Mill;Edensor Mill; Caudwell’s Mill; Diggle Mill; Millthorpe weir;Via Gellia Mills, Bonsall; Marsden town weir; Grinds Brook,Edale (see Chapter 6). The further group of ten (investigatedin varying levels of detail) were: Low Bradfield corn mill;Ashford Bobbin Mill; Magpie Sough; Hodgkinson’s Mill,Baslow; Blackwell Mill, Wyedale; Gradbach Mill; theChatsworth estate; Greenlands Farm, Edale; Alport Bridgeweir, Woodlands Valley; Ilam Church.
In addition, other major sites where head, flow and powerestimates had already been made (such as Litton MillFlewitt’s Mill, Calver Mill and Cressbrook Mill) were also re-visited in the course of the project, usually at the behest of local interested parties. It should be noted that many of
page 36 | Peak Power
Chapter 5 Surveying hydropower potential in the Peak District
2 Areas mapped under provisions in the Wildlife and Countryside Act (1981) whose natural beauty is particularly important to conserve.

the ‘a’ and ‘b’ sites listed in Appendix A1 and A2 will havepotential for micro hydro development but limited resourcesand time prevented their fuller investigation. The issue ofoverall capacity is dealt with in Chapter 7.
5.7 RESULTS FROM THE GIS ANALYSIS -COMMENTARY
5.7.1 Old mill sitesIn total 38 old mill sites (see Appendix A1) within the NPwere subject to the GIS constraints analysis. Of these seven(Whitelee Mill, Lumford Mill, Bamford Mill, Edensor Mill,Caudwell’s Mill, Diggle Mill and Low Bradfield) wereselected for further study (including flow modelling, using theHydrA model, where necessary – see Appendix C) and these(bar Low Bradfield, see below) are described in full as ‘keycase study sites’ in Chapter 6. For the remaining sites, the GISanalysis is helpful in identifying initial potential constraints,some of which may be ‘show-stoppers’.
POLICY AND NATURAL CONSTRAINTSMajor constraints to hydro development include a site fallingwithin the PDNPA’s Natural Zone where most forms ofdevelopment are prohibited. This constraint will often overlapwith nature conservation designations such as Site of SpecialScientific Development (national level) and EU designationssuch as Special Protection Area (SPA, under the BirdsDirective) and Special Area for Conservation (SAC, under theHabitats Directive). Development within such areas isextremely unlikely and can only occur in exceptionalcircumstances. However, there may be opportunities for microhydro power in connection with existing development in theNatural Zone if the National Park Authority and othersconsider any environmental impact to be minimal.
A good example of a site faced by these constraints would bethe Paper Mill, near Crowden in Longdendale (site ref. no.M18, Appendix B) which overlaps a combination of all thesedesignations (Natural Zone and SSSI/SPA/SAC). However thepresence of rare species and valued habitats need notnecessarily be a barrier to development as the new Alport Millscheme demonstrates (see site ref. no. M2, Appendix B andsection 3.3).
CULTURAL CONSTRAINTSGiven that all old mill sites have historic value and are ofteneither recorded on the HER (SMR), listed or sometimesscheduled, this is a key constraint that appears for many ofthe sites examined. The importance of evaluating the real ‘onthe ground’ constraints and early consultation with the
appropriate authorities (usually the PDNPA cultural heritageteam in the first instance) has already been highlighted insections 3.3 and 3.4.
However, being valued historically is not necessarily an over-riding barrier – even where a site is nationally scheduled. Reinstating hydro power may, in some circumstances, addinterpretive value and context to the historic dimension ofthe site (hence why the Arkwright Society are redevelopinghydro at Cromford Corn Mill, site ref. no. O13, see AppendixA2) or schemes may be designed in such a way as to minimisethe impact on features of interest (such as at Alport Mill).
But at some sites, e.g. Lumford Mill (site ref. no. M5 and alsoa ‘key case study site’ – see Chapter 6 for full detail) where alarge proportion of the original water management system isscheduled, the barriers to obtaining the appropriatepermissions (in this case, scheduled monument consent) arelikely to be significant, time-consuming and costly. Happilyhowever, and as the key case study explains, there are otherpotential ways of exploiting hydro power at or adjacent tothis site.
Some sites however may be more problematic, for exampleEdensor Mill (also known variously as Calton or Pain’s Mill)which is situated within the grade 1 listed park and garden ofChatsworth. It is currently unclear whether developing therelated weirs, which the case study shows are viable in termsof power available, would have an adverse effect on thelisting (see Chapter 6 for more detail). Unusually, atCaudwell’s Mill – again another key case study site – thehistorical value of the mill and its working turbines (they arealso listed) potentially militates against either their increaseduse for electricity generation or the addition of more modernequipment.
GRID CONNECTIONThe GIS analysis showed that the majority of old mill sites areusually within reasonable distances of grid connection,although distance is not the only connection issue to beaddressed (see sections 3.5 and 4.4.3). However, some sites dohave a level of remoteness (sometimes combined withlandscape sensitivity that would rule out overhead wires andpoles) that may act as an overriding deterrent to developing ascheme, unless an off-grid use for the power can be found.These included Ashford Bobbin Mill (see below), the EdensorMill weirs and the Lumford Mill weir.
An example of this issue is found at Ashford Bobbin Mill (siteref. no. M3) which has good (albeit listed) infrastructure (weir,leat, wheels in situ), good flow (could power up to 30 kW) yet
Peak Power | page 37
Chapter 5 Surveying hydropower potential in the Peak District

would probably require about a mile of underground cable toconnect it to the grid in Ashford in the Water, which wouldbe very costly. However, on the optimistic assumption thatother site issues (e.g. presence of EA gauging station, valuablelocal game fishery) could be dealt with, and if the millbuildings were to require power for some low-key form ofdevelopment (e.g. a camping barn, heritage interpretationsite), then off-grid hydro power could be an attractive andobvious option (although matching demand with the energyavailable could be difficult).
CAPACITY OPTIONSA number of old mill sites were looked at in more detail bythe project team or have already had capacity studies (ofvarying levels of detail) completed. The most obvious majorsites for further study and development are those covered bythe ETSU study and comprise (with original power estimates):Hodgkinson’s (Old) Mill, Baslow (35 kW), Calver Mill (125 kW),Cressbrook Mill (94 kW) and Litton Mill (120 kW). Given thatETSU calculated power potential based on residual flows ofQ95, which may no longer be permitted by the EnvironmentAgency, the capacity estimates may now be over optimistic.Two old mill sites (Vincent Works, Brough; Stoney Middleton)have also had feasibility studies carried out by Derwent Hydro(funded by the PDNPA Sustainable Development Fund).Together these sites would net c.15 kW (11 kW at Brough, 4 kW at Stoney Middleton – see Derwent Hydro, 2007; ibid., 2008).
The project team also examined in some detail the feasibilityof the former corn mill site at Low Bradfield, includingrunning the HydrA model for this site to gauge flows (seeAppendix C for the DARE report on this site). Unfortunately,due to the fact that no statutory compensation flow isreleased from the reservoirs above the site, the likely powercapacity was very low (0.8 kW). This was very disappointingas there was substantial local interest in developing acommunity scheme and the site itself presented few otherconstraints.
Acting on ad hoc requests, the FPD project team also lookedat the weir once associated with Blackwell Mill in Wye Dale(c.1m weir only but good flow), Gradbach Mill (now YHA site– c.5 kW potential but low flows, little infrastructure and along depleted reach imply substantial constraints) as well asAshford Bobbin Mill (see above and also the section below onthe nearby Magpie Mine sough). Both Blackwell Mill andGradbach Mill may also be limited by environmental/ecologyissues, either being in/close to sensitive areas (especiallyBlackwell) or providing very natural river habitat for fish(Upper Dane at Gradbach – see the Weaver and Dane CAMS:EA 2006, p.36).
In terms of ‘a’ and ‘b’ sites outside the National Park (seeAppendix A2), at least 20 out of 25 of these were old millsites and the majority of these have been studied in furtherdetail, notably at Bollington (Leigh, 2008) and on the RiverDon and its tributaries in and around Sheffield (IT Power2006; Zeleznikar, 2008), including power estimates. Threesites (Via Gellia Mills, Bonsall; Millthorpe; Marsden townweir) were also assessed in greater detail by the project teamand are reported on in Chapter 6. Most of these sites haveviable potential in varying degrees but clearly those sites withthe greatest potential power output should be prioritisedinitially for further investigation.
REFURBISHMENT PROJECTSTwo of the ‘a’ and ‘b’ mill sites, Flewitt’s Mill (also known asAshford Old Mill, site ref. no. M4) on the Wye and Hodgkinson’sMill (also known as Old Mill, site ref. no. M9) on the Derwent,have a degree of intact infrastructure possibly only rivalled byCressbrook Mill (M16, where two turbines are still in situ –see Figure 2.11) and therefore are good early options forincreasing Peak District micro hydro capacity.
Indeed, during the course of this project, refurbishment beganat Flewitt’s Mill and the 1920s Frances turbine (made byGilkes) should be reinstated and running by early 2010. Powercapacity is expected to be about 18 kW, the maximum ratingfor the turbine. Reaching this stage has been a long-runningproject for the owner who commissioned a full feasibilitystudy in 2008 which gave options of refurbishment of the oldturbine or installing a new Kaplan turbine which couldincrease capacity and output significantly. Although a new,larger turbine would offer a significant return on investmentin due course, the option of refurbishing and reinstating theexisting turbine has been preferred (partly on cost grounds).See Figures 2.12 and 5.2 showing the disused turbine in situand its removal, respectively.
page 38 | Peak Power
Chapter 5 Surveying hydropower potential in the Peak District
Figure 5.2 The Frances turbine from Flewitt’s Mill awaiting refurbishmentin winter 2009 (photo courtesy of R. Griffiths)
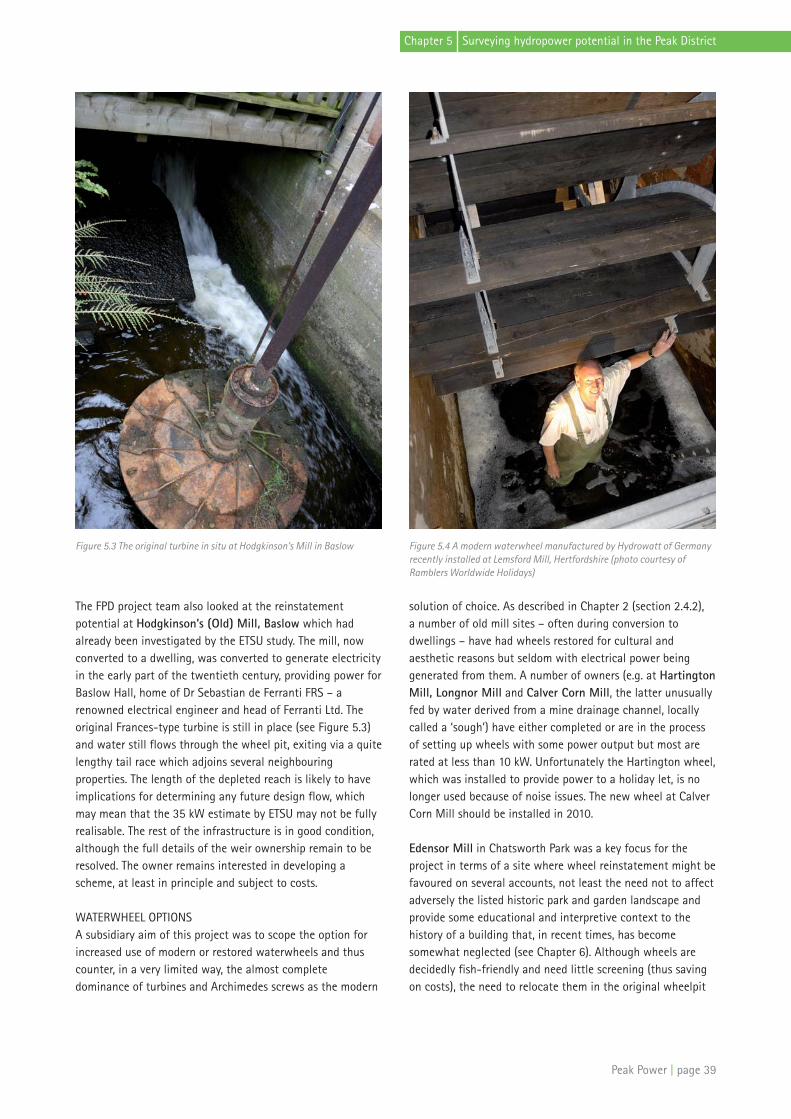
The FPD project team also looked at the reinstatementpotential at Hodgkinson’s (Old) Mill, Baslow which hadalready been investigated by the ETSU study. The mill, nowconverted to a dwelling, was converted to generate electricityin the early part of the twentieth century, providing power forBaslow Hall, home of Dr Sebastian de Ferranti FRS – arenowned electrical engineer and head of Ferranti Ltd. Theoriginal Frances-type turbine is still in place (see Figure 5.3)and water still flows through the wheel pit, exiting via a quitelengthy tail race which adjoins several neighbouringproperties. The length of the depleted reach is likely to haveimplications for determining any future design flow, whichmay mean that the 35 kW estimate by ETSU may not be fullyrealisable. The rest of the infrastructure is in good condition,although the full details of the weir ownership remain to beresolved. The owner remains interested in developing ascheme, at least in principle and subject to costs.
WATERWHEEL OPTIONSA subsidiary aim of this project was to scope the option forincreased use of modern or restored waterwheels and thuscounter, in a very limited way, the almost completedominance of turbines and Archimedes screws as the modern
solution of choice. As described in Chapter 2 (section 2.4.2), a number of old mill sites – often during conversion todwellings – have had wheels restored for cultural andaesthetic reasons but seldom with electrical power beinggenerated from them. A number of owners (e.g. at HartingtonMill, Longnor Mill and Calver Corn Mill, the latter unusuallyfed by water derived from a mine drainage channel, locallycalled a ‘sough’) have either completed or are in the processof setting up wheels with some power output but most arerated at less than 10 kW. Unfortunately the Hartington wheel,which was installed to provide power to a holiday let, is nolonger used because of noise issues. The new wheel at CalverCorn Mill should be installed in 2010.
Edensor Mill in Chatsworth Park was a key focus for theproject in terms of a site where wheel reinstatement might befavoured on several accounts, not least the need not to affectadversely the listed historic park and garden landscape andprovide some educational and interpretive context to thehistory of a building that, in recent times, has becomesomewhat neglected (see Chapter 6). Although wheels aredecidedly fish-friendly and need little screening (thus savingon costs), the need to relocate them in the original wheelpit
Peak Power | page 39
Chapter 5 Surveying hydropower potential in the Peak District
Figure 5.3 The original turbine in situ at Hodgkinson’s Mill in Baslow Figure 5.4 A modern waterwheel manufactured by Hydrowatt of Germanyrecently installed at Lemsford Mill, Hertfordshire (photo courtesy ofRamblers Worldwide Holidays)

(usually the easiest solution) may mean reduced design flowif a significant depleted reach were to ensue.
It is also fair to say that, in terms of overall efficiency (andtherefore generation and carbon saving), wheels fall slightlyshort of turbine solutions (including screws), which also havethe flexibility to be installed as in- or near-weir solutions, thusaddressing the depleted reach issue. Nonetheless, the experienceat one UK site, Lemsford Mill on the River Lea in Hertfordshire(see section 4.4.3 and Figure 5.4), has shown that retrofittinga modern (11 kW) waterwheel can be highly successful.
5.7.2 Non-mill sitesAlthough the main focus of the project was generally on run-of-river old mill sites, 19 non-mill locations for potentialmicro hydro schemes were identified and a number of themlooked at in varying degrees of detail, right up to key casestudy level (the Grinds Brook site in Edale – see Chapter 6).Sixteen of these sites are within the NP and these are listedin Appendix A3; three sites (Combs Reservoir; More HallReservoir, site ref. no. O5; Rivelin Water Treatment Works, 08)fell outside the NP and are listed in Appendix A2. Twelve ofthese non-mill sites had the benefit of GIS constraint analysis(see Appendix B, sites numbered N1-N15 (incomplete) plusO5 and O8) and general commentary on these and other sitesis made below.
POLICY AND NATURAL CONSTRAINTSOf the 15 sites listed in Appendix A3, the large majority (12)are in reasonably remote, semi-natural locations, where thewatercourse is in the upper, and often uppermost, reach of itscatchment. Indeed six of the sites (Swint Clough; Bar Brook,site ref. no. N1, see Appendix B; Greenlands Farm, N10;Grinds Brook, N15; Padley Gorge, N5; and Manor Farm) areslated as medium/high head sites.
Potential high head sites, despite the natural attraction oftheir gradient and their ubiquity in upland areas with highprecipitation, often present major barriers to development.Many of those mentioned above, despite clear potential (theETSU study estimated the Burbage Brook (Padley Gorge)scheme at 106 kW and Bar Brook at 88 kW) fall within theNatural Zone or strict nature conservation designations andwould involve very long depleted reaches to achieve themaximum potential head. This would present severedifficulties for the two ETSU schemes, for example.
Two other non-mill sites, assessed by ETSU but rejected onvarious grounds, were identified in Lathkill Dale (waterfall)and a sizeable weir (c.4-5m) in Monsal Dale on the Wye.Both would be severely constrained by ecological issues andwould be very remote for grid connection. The potential todevelop such sites is very low and they were graded ‘c’ for
this reason. Another site on the River Lathkill, at Raper Lodge,has been identified recently in a study commissioned bySustainable Youlgreave (Clarke, 2009) as potentially the bestoption remaining (after the implementation of the Alport Millscheme) on the Lathkill and Bradford rivers. Power wasestimated at 10-15 kW.
The project team, at the request of various landowners/interested parties, were asked to assess two further high headschemes: Swint Clough in Alport Dale and Greenlands Farm inEdale (on an upper tributary of Harden Clough). Swint Cloughhad already been the subject of a scoping study prompted bya nearby local resident and the major landowner in the area,the National Trust. Although a scheme could have potentiallygenerated 2 kW (sufficient for a local property) and the visualand ecological impacts were likely to be manageable, a buriedpenstock was likely to be at risk of rupture due to locallyunstable slopes.
The FPD team also made investigations at Greenlands whichrevealed a c.50m head across the landholding with goodlayout options including suitable sites for an upper cofferdam and a lower powerhouse, both within the landholding.Visual impact would have been low given that the stream ranin a deep, scrubby clough, although ecologically it is likely tobe sensitive and it is in the Natural Zone. However, aninstantaneous measurement of winter flow (4.5 litres persecond) suggested that maximum power would be about 1 kW or less. The owner was advised that a DIY ‘pico’ schemewas the only realistic option and that planning andenvironmental constraints may outweigh viability.
Two medium head sites identified in the course of the studywere judged to have much more potential: Grinds Brook inEdale (developed as a key case study site, see Chapter 6 butagain likely to be environmentally constrained) and ManorFarm, Quarnford. The latter has been scoped and developedas a viable scheme by Western Renewable Energy on behalf ofa local landowner/farmer and licences from the EnvironmentAgency are currently being sought. It aims to provide c.12 kWon a 35m head and is intended to help diversify the farm’sincome.
Finally four sites, mostly being weirs for in-catchmentmanagement by water and sewerage companies wereidentified at Crowden, Pikenaze Farm (both in Longdendale),Dovestone Reservoir (Chew Valley) and Alport Bridge(Woodlands Valley). The former two were judged poorprospects for development, mainly on the grounds ofremoteness and naturalness but the 2m weir on the RiverAlport may have some limited potential, although increasingdesign flow to a turbine/screw would alter the originalpurpose of the weir which was to divert water along an
page 40 | Peak Power
Chapter 5 Surveying hydropower potential in the Peak District

artificial channel to a further weir on the nearby River Ashopwhere a larger diversion channel feeds water to DerwentReservoir. Flow data is currently being sought from the localwater company (STW) to estimate likely power.
It is possible that if further water company sites were foundbut not judged viable enough to meet their own investmentcriteria, leasing sites to a local community (who might also bein a better position to secure grant aid) might provide apossible development route. This strategy is currently beingpursued at the Dovestone site.
CULTURAL CONSTRAINTSA number of atypical non-mill sites fall broadly into a bracketof facing cultural constraints, including opportunities atChatsworth, Ilam and Magpie Sough. As has been mentionedpreviously, Chatsworth already has a purpose built high headscheme (where a new turbine was installed in 1988) whichprovides electricity to the House in winter and some export to grid in the summer. In addition, the project team scopedthe potential for re-developing the weirs adjacent to EdensorMill (see Chapter 6).
However, in discussions with senior Chatsworth staff, furtheroptions for either upgrading power or further schemes wereidentified. These included re-lining the current Emperorpenstock so as to increase flow and power output and alsocapturing energy from the further head between the currentturbine exhausts and where the flow re-joins the river. Theformer option should not necessarily give rise to impacts onthe listed park and garden but the latter might. Given theextent of the Chatsworth land holdings in the area, severalother mill and non-mill options are also open to the Estate,including Heathy Lea Saw Mill (M38), close to Chatsworth,and Ashford Bobbin Mill (M3, see section 5.6.1) and theadjacent Magpie Sough outfall.
In addition to the special project sub-focus on waterwheels,the original aims also included an objective to investigate thepotential of lead mine drainage channels, ‘soughs’ inDerbyshire parlance, for micro hydro power. This stemmed inpart from the observation that some soughs have quiteconsiderable year-round flows, sometimes capturing drainagewaters at depth over considerable catchment areas (sometimeseven capturing flows from adjacent river catchments).
In addition, in 2004 a hydro power feasibility study forNorchard Drift, a similar mine drainage tunnel near Lydney inthe Forest of Dean, Gloucestershire, suggested an 8 kW wasfeasible and – with then Government grant aid (the ‘ClearSkies’ programme) – a good payback time (c.7 years) could beachieved (Renewable Heat & Power Ltd, 2004). Also, duringthe course of the project, our attention was drawn to the
unusual example of Calver Corn Mill which derives its waterfrom a local sough (see Willies, 1989). The owners of the mill(now two dwellings) are currently reinstating a wheel, due tobe providing power (4 kW capacity) in early 2010.
LEAD MINE SOUGHS – A UNIQUE PEAK DISTRICTMICRO HYDRO RESOURCE?Mine drainage tunnels were driven to de-water PeakDistrict lead mines all across the South Pennine/Derbyshireorefield, from the sixteenth to the nineteenth centuries.Although they can capture underground drainage overwide areas, their gradient (between the base or ‘sole’ of amine and their outfall in an adjacent river valley) is usuallyvery small (usually dropping only several feet in a mile),hence heads are usually somewhat limited.
The larger soughs (see below) usually have strong, yearround baseflows and one, Meerbrook Sough, which drainsthe Wirksworth area and has its outfall on the Derwentnear Whatstandwell, is actually under the control of thelocal water company. An initial investigation of this soughby Derwent Hydro (Paish, pers.comm.) suggested a roughestimate of up to 10 kW power might be obtained.
The larger soughs (and some natural resurgences) in thewider Peak District that may be worth further investigationinclude: the Bagshawe Cavern resurgence in Bradwell(also possibly sough-fed; the resurgence once powered asmall wheel linked to the adjacent smelting works);Magpie Sough; Yatestoop Sough, near Darley Bridge(which also has an additional small head at its outfall intothe Derwent); Meerbrook Sough; Ridgeway Sough nearCrich; Hillcarr Sough near Stanton Lees; WatergroveSough in Stoney Middleton Dale; Moorwood Sough inStoney Middleton; Stoke Sough near Froggatt; CromfordSough (which used to feed wheels at Arkwright’s CromfordMill); and Peakshole Sough/Slop Moll resurgence inCastleton3.
It must be borne in mind that the archaeological value ofsoughs is intrinsically high – tails and portals are oftenscheduled together with associated features – and thismitigates strongly against their use. Other constraints,such as the lack of head – without creating new structuresunderground in potentially historically fragile andunstable, restricted environments – also suggest that thisoption remains a low priority for the future.
The project team also conducted a scoping survey of one ofthe larger local soughs, Magpie Sough. This major sough hasits outfall into the River Wye about 400m west of AshfordBobbin Mill and drains Magpie Mine about 1.5 km to thesouth. Some drainage that would otherwise flow to the
Peak Power | page 41
Chapter 5 Surveying hydropower potential in the Peak District
3 We are grateful to Dr Jim Rieuwerts, the leading authority on Peak District soughs, for his advice in compiling this initial list.

Lathkill, further south, is also captured by the sough. A recentreview of historic flow figures combined with estimates madein late 2009 (pers.comm. Gunn, 2009) suggest an averageflow (based on 1989-1995 data) of c.370 litres per second (L/s).Flow in late 2009 ranged between 370-650 L/s and Gunnsuggests assuming a Q95 of 350 L/s (0.35 m3/s) is reasonable.
The FPD site investigation suggested that a 1m head could beachieved by building a small coffer dam at the sough exit (seeFigure 5.5) although this would likely flood the sough to rooflevel in its lower reaches. Assuming design flow would beclose to mean flow, this would give a potential power outputof some 2 kW. However, a greater head could be obtained,either by moving the intake higher up the sough (i.e.underground) or by running a penstock from the sough to alower powerhouse nearer to the Bobbin Mill, which could addan extra 3m or so to the head, albeit with a small deprivationof water to the Wye over a 400m or so stretch. Issuesassociated with such a scheme would include continuedaccessibility to the sough, impacts on its function andimpacts on its setting and underground archaeologicalfeatures and, as mentioned previously for Ashford BobbinMill, lack of grid connection.
However, if any sough sites were to be taken forward fordevelopment, it is extremely important that detailedconsultations are entered into with both the PDNPA and thePeak District Mines Historical Society (PDMHS). The PDMHShave stated they would potentially welcome any potentialmicro hydro scheme that fully respected and maintained thehistoric and archaeological integrity of the structure (andwhere there were no other legitimate non-mining issues thatothers raised in objection).
The PDMHS also suggest the best way to ensure this (wherepossible) would be to place any turbine and/or other
equipment in the tail race rather than the sough itself. But inmost cases, it is also very important that access up soughs ismaintained. These are important underground resourcesvisited regularly by mine historians and archaeologists forresearch and education purposes and no additional accessrestraints should be put in place.
Finally a further non-mill site near Ilam Church wasidentified by a local community initiative, Ilam CommunityEnergy (ICE) to address the issue of supplying energy (heat ifnot power) to Ilam Church by using weirs on the RiverManifold. A feasibility study was carried out (Derwent Hydro,2004) which scoped two options ranging between 8-20 kW.However use of the larger head (option A) was deemed likelyto be problematic for a number of reasons (newimpoundment and leat, possible effects on local hydrology)but subsequently concerns were also raised that siting aturbine house below the lower weir could affect the settingof the adjacent scheduled bridge.
This was unfortunate given that the feasibility reportsuggested matching hydro power to a ground source heatpump that would have heated the church over the key wintermonths. The matter rested there until the National Trustbecame interested in providing power to a nearby off gridproperty (Wood Lodge) and asked the FPD hydro team toadvise on further options. The only different option FPD wereable to suggest was placing either a turbine or screw (thelatter could possibly be buried) downstream of the bridge(also nearer to Wood Lodge), thus reducing the impact on itssetting of the bridge and Ilam Hall park and garden. Howeverthis would also have involved re-instating/raising the upperweir and the 1910 leat (Option A in the Derwent Hydroreport) which brought with it other environmental challenges.
GRID CONNECTIONThe GIS analysis adds little to what has been described in theabove sections, save emphasising that many of the non-millsites tend to be more remote than old mill sites and maysuffer from high connection costs as a result.
CAPACITY OPTIONSThe above analyses suggest, especially in comparison with theold mill sites identified, that non-mill sites offer much lessreadily developable micro hydro capacity, especially at remoteand/or medium/high head sites. This unfortunately confoundsthe lay perception that the uplands (due to their steeptopography) should offer good opportunities for hydro power.Nonetheless, where structures and impoundments already exist,predominantly associated with local water supply networks,there may be reasonable scope for more capacity. A broaderassessment of overall future Peak District micro hydro capacity– based on previous studies, the sites identified in thischapter and the key case study sites – follows in Chapter 7.
page 42 | Peak Power
Chapter 5 Surveying hydropower potential in the Peak District
Figure 5.5 Strong flow at Magpie Sough tail in the 1970s (photo courtesyof Richard Bird)

6.1 BACKGROUND
Chapter 5 has already set out how the total data set of 162sites was refined down – via desktop study, walk over survey,GIS constraints mapping and further site visits andmeasurement/data gathering (see sections 5.3-5.6) – to afinal group of ten key case study sites, chosen to exemplify acharacteristic range of Peak District micro hydroopportunities. These are now described in full after a briefdescription of the selection and data gathering process.
6.2 METHODOLOGY
Site visits to investigate head, flow, GIS-identified constraintsand other issues have already been described in section 5.6.This process was applied to all of the key case study siteschosen but in addition flow estimates (using the HydrAmodel) were commissioned from Richard Pymm at the DevonAssociation for Renewable Energy (DARE), who offer this siteassessment service on an affordable basis (see section 4.2.2and Appendix C).
6.2.1 Key case study site choiceAs has been explained previously, the key case sites were notchosen to be the most developable or highest poweropportunities in the Peak District but instead represent arange of typical micro hydro opportunities available to (andhopefully, deliverable by) communities and other site owners.In choosing the sites the following initial primary criteriawere used: viability; potential for community involvement;ability of project to add value (i.e. data not already availablevia previous studies or other sources); and would cover arange of hydro technologies (medium/high head, low head,turbines, screws and wheels). Secondary criteria includedseeking a range of sites that achieved a good geographicalspread across the Peak District and had varying ownershipsituations (commercial, landed estate, charitable trusts, smallprivate landowners, farm).
6.2.2 Follow up data gathering and analysisFollowing on from further site visits, other data sources were
consulted including: planning history (PDNPA files), cultural
heritage data (from a variety of sources, including previous
planning applications), local landscape character assessments,
the relevant Environment Agency (EA) Catchment Abstraction
Management Strategy (CAMS) and draft River Basin
Management Plan (RBMP), EA flow monitoring data (where
available), reference to the EA hydro power handbook and the
good practice guidelines, local planning policies (usually the
Peak Power | page 43
Chapter 6 Key case study sites
Figure 6.1 The waterwheel at Diggle Mill in 1924 (source: OldhamStandard)
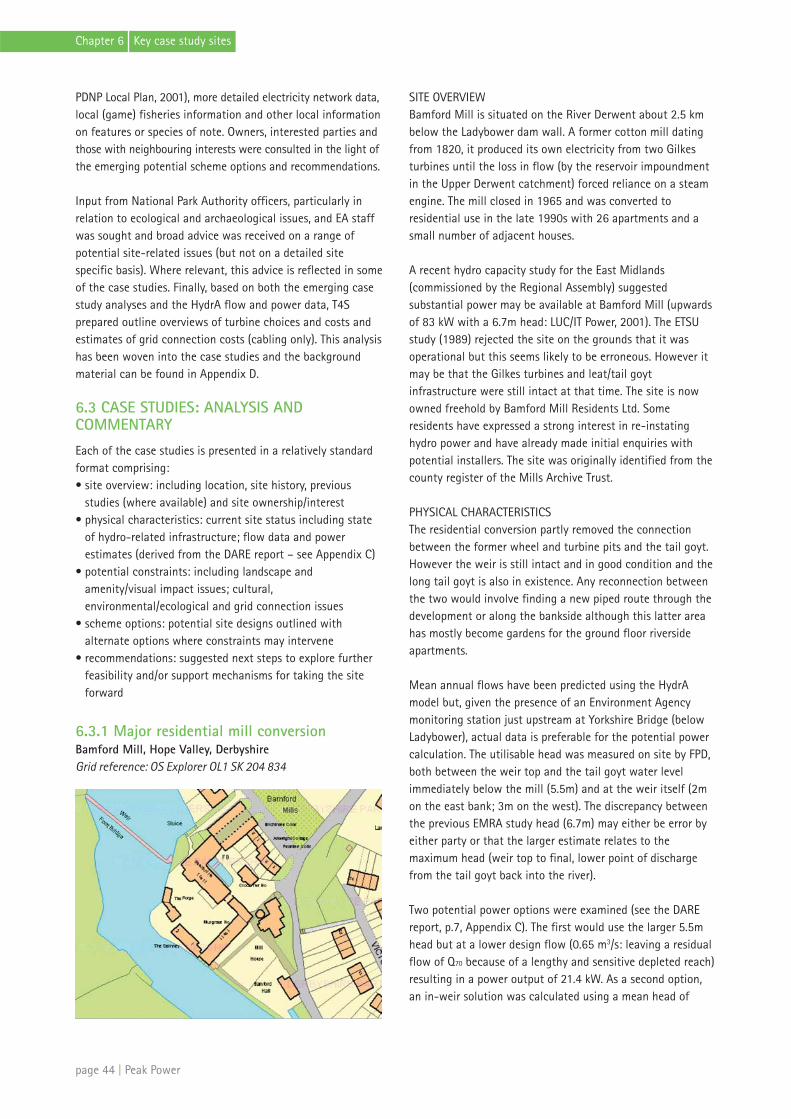
PDNP Local Plan, 2001), more detailed electricity network data,local (game) fisheries information and other local informationon features or species of note. Owners, interested parties andthose with neighbouring interests were consulted in the light ofthe emerging potential scheme options and recommendations.
Input from National Park Authority officers, particularly inrelation to ecological and archaeological issues, and EA staffwas sought and broad advice was received on a range ofpotential site-related issues (but not on a detailed sitespecific basis). Where relevant, this advice is reflected in someof the case studies. Finally, based on both the emerging casestudy analyses and the HydrA flow and power data, T4Sprepared outline overviews of turbine choices and costs andestimates of grid connection costs (cabling only). This analysishas been woven into the case studies and the backgroundmaterial can be found in Appendix D.
6.3 CASE STUDIES: ANALYSIS ANDCOMMENTARY
Each of the case studies is presented in a relatively standardformat comprising:• site overview: including location, site history, previous
studies (where available) and site ownership/interest• physical characteristics: current site status including state
of hydro-related infrastructure; flow data and powerestimates (derived from the DARE report – see Appendix C)
• potential constraints: including landscape andamenity/visual impact issues; cultural,environmental/ecological and grid connection issues
• scheme options: potential site designs outlined withalternate options where constraints may intervene
• recommendations: suggested next steps to explore furtherfeasibility and/or support mechanisms for taking the siteforward
6.3.1 Major residential mill conversion Bamford Mill, Hope Valley, DerbyshireGrid reference: OS Explorer OL1 SK 204 834
SITE OVERVIEWBamford Mill is situated on the River Derwent about 2.5 kmbelow the Ladybower dam wall. A former cotton mill datingfrom 1820, it produced its own electricity from two Gilkesturbines until the loss in flow (by the reservoir impoundmentin the Upper Derwent catchment) forced reliance on a steamengine. The mill closed in 1965 and was converted toresidential use in the late 1990s with 26 apartments and asmall number of adjacent houses.
A recent hydro capacity study for the East Midlands(commissioned by the Regional Assembly) suggestedsubstantial power may be available at Bamford Mill (upwardsof 83 kW with a 6.7m head: LUC/IT Power, 2001). The ETSUstudy (1989) rejected the site on the grounds that it wasoperational but this seems likely to be erroneous. However itmay be that the Gilkes turbines and leat/tail goytinfrastructure were still intact at that time. The site is nowowned freehold by Bamford Mill Residents Ltd. Someresidents have expressed a strong interest in re-instatinghydro power and have already made initial enquiries withpotential installers. The site was originally identified from thecounty register of the Mills Archive Trust.
PHYSICAL CHARACTERISTICSThe residential conversion partly removed the connectionbetween the former wheel and turbine pits and the tail goyt.However the weir is still intact and in good condition and thelong tail goyt is also in existence. Any reconnection betweenthe two would involve finding a new piped route through thedevelopment or along the bankside although this latter areahas mostly become gardens for the ground floor riversideapartments.
Mean annual flows have been predicted using the HydrAmodel but, given the presence of an Environment Agencymonitoring station just upstream at Yorkshire Bridge (belowLadybower), actual data is preferable for the potential powercalculation. The utilisable head was measured on site by FPD,both between the weir top and the tail goyt water levelimmediately below the mill (5.5m) and at the weir itself (2mon the east bank; 3m on the west). The discrepancy betweenthe previous EMRA study head (6.7m) may either be error byeither party or that the larger estimate relates to themaximum head (weir top to final, lower point of dischargefrom the tail goyt back into the river).
Two potential power options were examined (see the DAREreport, p.7, Appendix C). The first would use the larger 5.5mhead but at a lower design flow (0.65 m3/s: leaving a residualflow of Q70 because of a lengthy and sensitive depleted reach)resulting in a power output of 21.4 kW. As a second option,an in-weir solution was calculated using a mean head of
page 44 | Peak Power
Chapter 6 Key case study sites

2.5m and a higher design flow (1.81 m3/s) resulting in apower output of 27.1 kW. The earlier power estimate of 83kW appears to be based on a flow close to the mean annualflow (2.10 m3/s) with 6.71m head. It is difficult to envisagehow such an estimate can currently be realised.
POTENTIAL CONSTRAINTSThe site is situated at the northern edge of the DerwentValley character area and, although the site itself lies withinthe built up, residential area of Bamford, it is adjacent to theRiverside meadows landscape character type (LCT) where thepriority is to restore the diversity of the river corridorlandscape. The site also lies within the Bamford villageConservation Area, controlled by Local Plan policy LC5.Applications for development in a Conservation Area shouldclearly demonstrate how existing character and appearanceof the area will be preserved and, where possible, enhanced. Aright of way (footpath) runs between the weir and theoverflow channel on the east bank of the river, then crossesthe river via stepping stones and a footbridge. This route mustbe maintained, although minor diversions may be approved.
Bamford Mill itself, though not scheduled, is clearly of stronghistoric interest and its area (including the weir and the tailgoyt) is registered on the county Sites and MonumentsRecord (now Historic Environment Record). Development ofhydro power may alter the setting, if not the fabric, of themill and its curtilage and this impact will need to be assessedappropriately.
As noted in the DARE report, the river has a ‘Very High’environmental weighting (see Derbyshire Derwent CAMS,2006) which primarily indicates sensitivity to further(consumptive) abstraction. This should not be an issue forhydro development but it does denote a likely high sensitivityof the local ecology to flow variations. The river is known tocontain brown trout, pike, grayling and fishing rights on thewest bank are with the Derbyshire Fly Fishing Club. Thestretch from Yorkshire Bridge to Hathersage Bridge (whichincludes Bamford Mill) is also designated for protection ofsalmonid fishery under the EU Freshwater Fish Directive andis currently compliant with ‘guideline pass’ status, based onwater quality criteria (see EA Humber River BasinManagement Plan consultation draft, Annex D, p.38). Dippers,wagtails and kingfishers have all been observed locally. Rareand protected species are also adjacent to the site;assessment of impacts on such species would likely bemandatory prior to any development taking place. TheEnvironment Agency have already indicated informally that aproposal for an in-weir solution (such as an Archimedesscrew) with a fish pass would be contemplated favourably.Electrical connection should not be problematic. A low
voltage (LV) network has been identified as passing throughsite (based on data from PDNPA). There is a pole mountedtransformer just to the north of the site on an 11 kV line andthis supply continues to a substation in the village less than1km away from the Mill (data from CE-YEDL plans). Given thedensity of housing at the site and nearby it is assumed thatthe area is supplied by three-phase electricity. Based on theabove and assuming 10m of cabling is required, gridconnection could cost as little as £4,000 (assumingreinforcement is not required).
SCHEME OPTIONSAlthough an option does exist to pipe water from the weir tothe beginning of the lower portal of the tail goyt (which itselfforms a suitable physical location to install a screw orturbine) to maximise the head, this presents the problems of: a) finding an acceptable route for a pipe (most likely buried)
and b) creating a significant length of depleted reach downstream
of the weir. The DARE HydrA flow studies also demonstrate that thisoption, with a reduced design flow to minimise impacts onthe depleted reach, also yields less power (21 kW) and energycapture. This strongly suggests, and this is supported by initialfeedback from the Environment Agency, that an in-weir(Archimedes screw) solution is preferable as long as it isaccompanied by a suitable fish pass.
RECOMMENDATIONS• Further feasibility work should focus on scoping design
options (including costs) for an in-weir solution• Site stakeholders, principally Bamford Mill Residents Ltd,
need to consider a business model for progressing ascheme and whether participation may need to bewidened to include the local community and/or through ashare offer
6.3.2 Working heritage mill with upgradepotentialCaudwell’s Mill, Rowsley, DerbyshireGrid reference: OS Explorer OL24 SK 255 657
SITE OVERVIEWThis mill is situated on the River Wye very close to itsconfluence with the Derwent. The present corn mill (built byJohn Caudwell), dates from 1874. Originally powered bywater wheels, by the end of the 19th century, these had beenreplaced by turbines. These are still extant at the site: the‘Little Giant’ rated at 56hp (42 kW) which still generateselectricity, though only producing c.15 kW; and a Francisturbine rated at 80hp (60 kW) which powers the millingmachinery. The mill ceased commercial production of flour in1978 and now operates as a tourist attraction.
Peak Power | page 45
Chapter 6 Key case study sites

(PDNP Landscape Strategy, 2009). The priority for this LCT isto restore the diversity of the river corridor landscape andmanage the landscape to provide flood water storage. Thestrong history of using water as an energy source and theopportunity to develop new forms of hydro electricityschemes is noted as an issue for change and a planningopportunity. Sensitive re-development of hydro power at thissite is unlikely to have landscape scale impacts.
The GIS constraints mapping exercise reveals some potentiallysignificant natural constraints in the form of rare and protectedspecies close by the site. These would have to be surveyed byappropriately qualified specialists and advice sought onwhether mitigation was possible but bearing in mind that anextant, licensed hydro system is already operating. Culturalconstraints also exist in the form of the Mill being listed(grade II* including the existing turbines) and it being withinthe Rowsley Conservation Area (which also includes the widerwater management system: weir, mill races and the course ofthe river from the weir to just below Wye Bridge).
Grade II* listing means that the mill is nationally importantand any changes to the structure would need consent fromEnglish Heritage. New development within the ConservationArea is controlled by PDNP Local Plan policy LC5 and anyscheme should preserve, and where possible enhance, thecharacter and appearance of the Area. Given that most of thenecessary infrastructure is already in existence (and is apositive feature within the Area), the addition of a furtherturbine and any related infrastructure should not affect theintegrity of the Conservation Area. The GIS analysis also notesa SMR entry in the near vicinity (‘Rowsley earthwork’); thismay need assessment if any works might impinge directly onit or its setting.
Since the potential power output predicted by HydrA is belowthe rated capacity of the existing turbines, another constraintrelates to the potential renovation of both turbines which arelisted and if there are any physical constraints preventing theadaption of the Francis turbine to electrical generation. This isa matter for the owners, the Caudwell’s Mill Trust Ltd (inreality the trustees), to consider in conjunction with thelisting authority.
The stretch of the Wye that Caudwell’s Mill takes water fromis designated by the Environment Agency (see Annex D,draft River Basin Management Plan for the Humber RiverBasin District, 2009) as a salmonid fishery whose compliancestatus is good (‘guideline pass/imperative pass’). The EA isnow charged, under the Water Framework Directive, tomaintain and enhance river quality and fish passage. These
page 46 | Peak Power
Chapter 6 Key case study sites
PHYSICAL CHARACTERISTICSAs this is still a working mill (albeit for demonstrationpurposes only) the necessary infrastructure for powergeneration is largely in place and in relatively good condition(for example the head and flow could be enhanced by de-silting the mill races). At present only the Little Giant turbineis used to produce electricity but the Francis turbine couldalso be linked to a generator by a clutch to produce electricitywhen not being used to power the mill machinery. The optionof installing a third turbine for electricity is regarded asrequiring extensive additional civil engineering works.
Mean annual flow has been predicted by HydrA at 4.9 m3/s,although some reservations are expressed regardingmodifications to the catchment, both in terms of waterabstractions for drinking water and possible undergroundflows caused by lead mine soughs (principally Hillcarr Soughthat takes water from the Bradford and Lathkill catchmentsto the east and returns it to the Derwent below Stanton Lees).However the figure appears commensurate with gaugingstation data upstream on the Wye (at Ashford, 3.24 m3/s) anddownstream on the Derwent at Matlock Bath (12.99 m3/s;summing predicted flow at Caudwells, 4.9 m3/s and Derwentat Chatsworth, 6.43 m3/s gives 11.33 m3/s).
The depleted reach is very long at approximately 500m longand this could seriously affect the design flow which the EAwill allow to be removed for power generation. However theextant flow regime will be licensed by the EA though theymay wish to vary the level of abstraction in the future in linewith targets under the Water Framework Directive. TheHydrA/DARE study suggests a design flow of 2.5 m3/s basedon leaving a residual flow of Q70 because of the depletedreach issue. It is not known what the currently licensedabstraction at the site is. The indicative design flow suggestedby DARE gives a potential power output of 40.5 kW and anannual energy capture of 178 MWh per year.
POTENTIAL CONSTRAINTSCaudwell’s Mill lies in the Riverside meadows landscapecharacter type (LCT) within the Derwent Valley character area
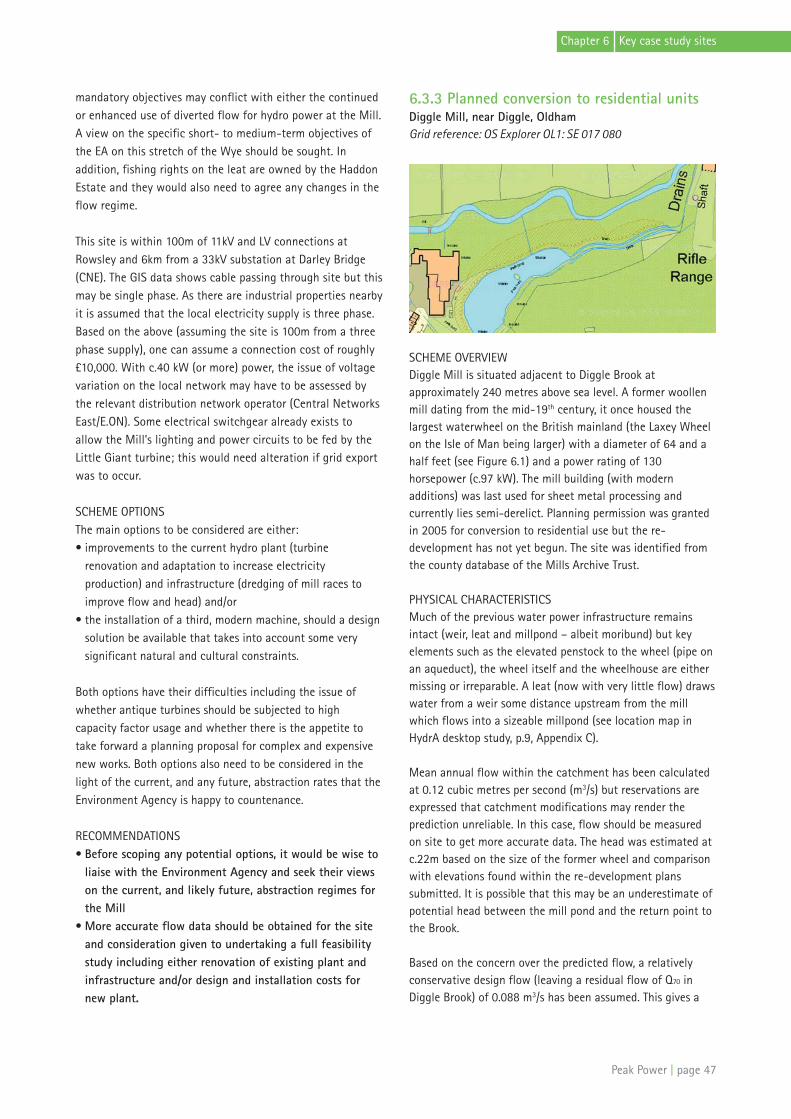
mandatory objectives may conflict with either the continuedor enhanced use of diverted flow for hydro power at the Mill.A view on the specific short- to medium-term objectives ofthe EA on this stretch of the Wye should be sought. Inaddition, fishing rights on the leat are owned by the HaddonEstate and they would also need to agree any changes in theflow regime.
This site is within 100m of 11kV and LV connections atRowsley and 6km from a 33kV substation at Darley Bridge(CNE). The GIS data shows cable passing through site but thismay be single phase. As there are industrial properties nearbyit is assumed that the local electricity supply is three phase.Based on the above (assuming the site is 100m from a threephase supply), one can assume a connection cost of roughly£10,000. With c.40 kW (or more) power, the issue of voltagevariation on the local network may have to be assessed bythe relevant distribution network operator (Central NetworksEast/E.ON). Some electrical switchgear already exists toallow the Mill’s lighting and power circuits to be fed by theLittle Giant turbine; this would need alteration if grid exportwas to occur.
SCHEME OPTIONSThe main options to be considered are either:• improvements to the current hydro plant (turbine
renovation and adaptation to increase electricityproduction) and infrastructure (dredging of mill races toimprove flow and head) and/or
• the installation of a third, modern machine, should a designsolution be available that takes into account some verysignificant natural and cultural constraints.
Both options have their difficulties including the issue ofwhether antique turbines should be subjected to highcapacity factor usage and whether there is the appetite totake forward a planning proposal for complex and expensivenew works. Both options also need to be considered in thelight of the current, and any future, abstraction rates that theEnvironment Agency is happy to countenance.
RECOMMENDATIONS• Before scoping any potential options, it would be wise to
liaise with the Environment Agency and seek their viewson the current, and likely future, abstraction regimes forthe Mill
• More accurate flow data should be obtained for the siteand consideration given to undertaking a full feasibilitystudy including either renovation of existing plant andinfrastructure and/or design and installation costs fornew plant.
6.3.3 Planned conversion to residential unitsDiggle Mill, near Diggle, OldhamGrid reference: OS Explorer OL1: SE 017 080
SCHEME OVERVIEWDiggle Mill is situated adjacent to Diggle Brook atapproximately 240 metres above sea level. A former woollenmill dating from the mid-19th century, it once housed thelargest waterwheel on the British mainland (the Laxey Wheelon the Isle of Man being larger) with a diameter of 64 and ahalf feet (see Figure 6.1) and a power rating of 130horsepower (c.97 kW). The mill building (with modernadditions) was last used for sheet metal processing andcurrently lies semi-derelict. Planning permission was grantedin 2005 for conversion to residential use but the re-development has not yet begun. The site was identified fromthe county database of the Mills Archive Trust.
PHYSICAL CHARACTERISTICSMuch of the previous water power infrastructure remainsintact (weir, leat and millpond – albeit moribund) but keyelements such as the elevated penstock to the wheel (pipe onan aqueduct), the wheel itself and the wheelhouse are eithermissing or irreparable. A leat (now with very little flow) drawswater from a weir some distance upstream from the millwhich flows into a sizeable millpond (see location map inHydrA desktop study, p.9, Appendix C).
Mean annual flow within the catchment has been calculatedat 0.12 cubic metres per second (m3/s) but reservations areexpressed that catchment modifications may render theprediction unreliable. In this case, flow should be measuredon site to get more accurate data. The head was estimated atc.22m based on the size of the former wheel and comparisonwith elevations found within the re-development planssubmitted. It is possible that this may be an underestimate ofpotential head between the mill pond and the return point tothe Brook.
Based on the concern over the predicted flow, a relativelyconservative design flow (leaving a residual flow of Q70 inDiggle Brook) of 0.088 m3/s has been assumed. This gives a
Peak Power | page 47
Chapter 6 Key case study sites

potential power output of 11.6 kW and an annual energycapture of 58 MWh per year. The former power output of thewheel at 97 kW suggests that a much larger flow was onceavailable. This may indicate that 11.6 kW is also a somewhatconservative estimate of current potential power (i.e. flow inDiggle Brook may be greater than 0.12 m3/s) but the fact thatwater is also abstracted at Diggle Reservoir (above the site)will have reduced the flow. Full power on the wheel may alsoonly have been realisable through enhanced flow from thestored water in the millpond. Setting up a temporary gaugingstation would resolve this issue.
POTENTIAL CONSTRAINTSIn landscape terms the site falls within the Dark Peak WesternFringe character area and the Valley pastures with industrylandscape character type. Infrastructure and works associatedwith re-instating hydro power is unlikely to give rise tosignificant landscape impacts, especially if any above groundstructures were kept close to the curtilage of the existingbuildings. The GIS mapping analysis revealed relatively fewnatural constraints though the source catchment clearly lieswithin the Dark Peak SSSI/South Pennine Moors SAC and SPA.
One constraint on re-development of hydro power is probablycultural, given the archaeological value of the remaining milland associated water power system. Re-use and/or alterationof any parts of the system would trigger a need for furtherarchaeological assessment/recording before planning consentcould be gained. However, the site is not a scheduledmonument and is not nationally important. The remains,however, are of local or regional importance which – ifaffected – would require appropriate recording to be made(Grimsditch et al., 2008).
Electrical connection (presumably three phase) already existsat the mill, therefore grid connection could cost as little as£4,000. However the local distribution network operator(DNO), United Utilities, would need to be consulted if a G59connection was sought and a grid connection study may needto be commissioned.
In terms of the water environment, use of the extant leat andmill pond system would mean Diggle Brook having a depletedreach of some 300m or more which the Environment Agencymay be resistant to. The Brook lies within the Upper RiverTame catchment which attracts a ‘Very High’ environmentalrating and the Tame, Goyt and Etherow CAMS (2004) statesthat ‘there will be a presumption against consumptiveabstraction when flows are not meeting the ecological riverflow objective’. However, ‘non-consumptive abstractions[including hydro] will be considered, provided they do notcompromise the current ecological status of the reaches…’.Diggle Brook also attracts designation for its salmon and
trout fisheries and, based on water quality indices, itscompliance status is relatively good. This suggests there mayalso be sensitivity to maintaining stretches of Diggle Brookfor fish presence and passage. To address these concerns mayrequire increases in the residual flow. A fish pass at the weiris unlikely to be needed as a large natural barrier (waterfall)to upstream fish passage lies just above the weir.
SCHEME OPTIONSThe most obvious option would be to re-instate flow into theleat and millpond and then drop a buried pipe from themillpond to a discreetly located turbine house between themill building and the Brook. This would maximise the headbut mean that design flow may have to be reduced to ensurethe residual (hands off) flow of the Brook is maintained. Asnoted above, the restoration of the former water system mayhave archaeological sensitivities. Failing this, a second optioncould involve an in-weir solution with greater flow but a veryreduced head. This latter option has not been investigated inany detail. However, the current weir is some distance fromthe mill building and both access for civil works and electricalconnection could be problematic.
The site has recently changed hands and the new owner iskeen to press ahead with the planned re-development. One ofthe conditions attached to the planning permission stipulatesthat details of any potential scheme to realise renewableenergy be submitted to the National Park Authority. Theoriginal proposals did not envisage hydro power beingdeveloped as part of the development but this does notpreclude any such proposal from coming forward in thefuture, either by the developer/landowner or future residentsof the mill.
RECOMMENDATIONS• More accurate flow data should be obtained for the site
and consideration given to undertaking a full feasibilitystudy including design and installation costs
• National and regional funding regimes for small scalerenewable energy generation should be investigated toexplore options to offset initial capital expenditure
• At the very least, the final design of the re-developmentscheme should prioritise the safeguarding ofinfrastructure that can be re-utilised in any future hydroscheme, especially the leat and millpond and associatedcontrol sluices etc
page 48 | Peak Power
Chapter 6 Key case study sites
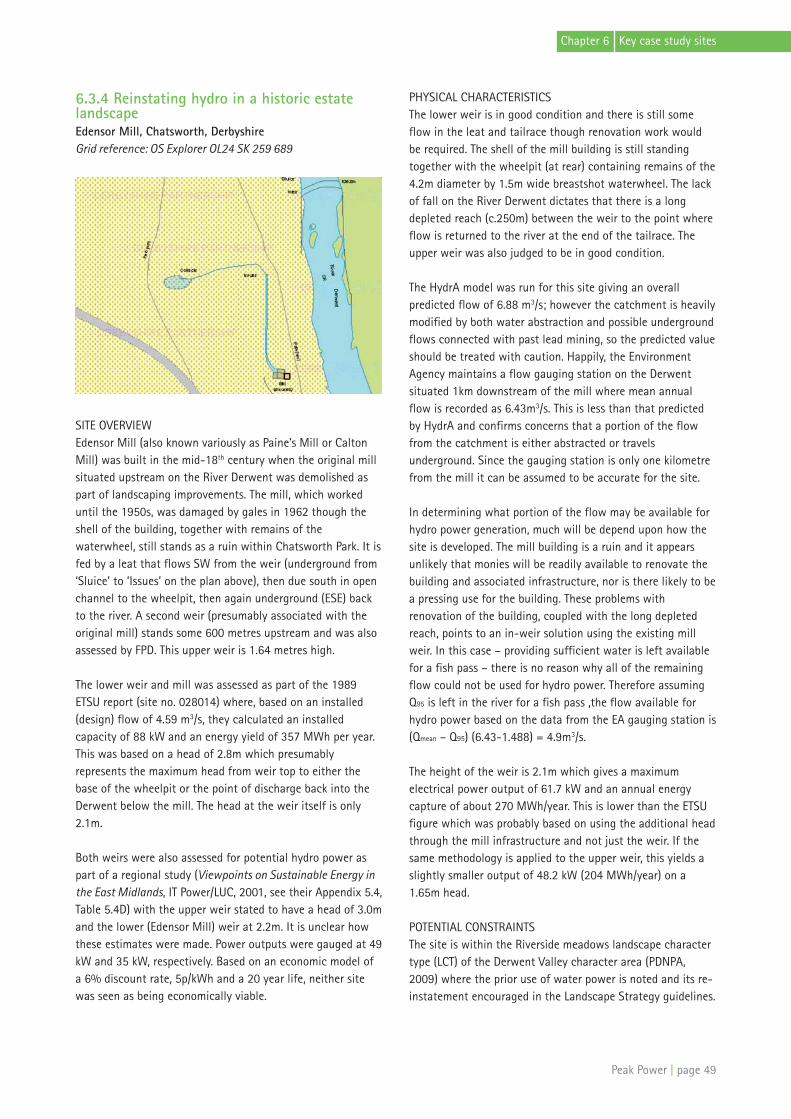
6.3.4 Reinstating hydro in a historic estatelandscapeEdensor Mill, Chatsworth, DerbyshireGrid reference: OS Explorer OL24 SK 259 689
SITE OVERVIEWEdensor Mill (also known variously as Paine’s Mill or CaltonMill) was built in the mid-18th century when the original millsituated upstream on the River Derwent was demolished aspart of landscaping improvements. The mill, which workeduntil the 1950s, was damaged by gales in 1962 though theshell of the building, together with remains of thewaterwheel, still stands as a ruin within Chatsworth Park. It isfed by a leat that flows SW from the weir (underground from‘Sluice’ to ‘Issues’ on the plan above), then due south in openchannel to the wheelpit, then again underground (ESE) backto the river. A second weir (presumably associated with theoriginal mill) stands some 600 metres upstream and was alsoassessed by FPD. This upper weir is 1.64 metres high.
The lower weir and mill was assessed as part of the 1989ETSU report (site no. 028014) where, based on an installed(design) flow of 4.59 m3/s, they calculated an installedcapacity of 88 kW and an energy yield of 357 MWh per year.This was based on a head of 2.8m which presumablyrepresents the maximum head from weir top to either thebase of the wheelpit or the point of discharge back into theDerwent below the mill. The head at the weir itself is only2.1m.
Both weirs were also assessed for potential hydro power aspart of a regional study (Viewpoints on Sustainable Energy inthe East Midlands, IT Power/LUC, 2001, see their Appendix 5.4,Table 5.4D) with the upper weir stated to have a head of 3.0mand the lower (Edensor Mill) weir at 2.2m. It is unclear howthese estimates were made. Power outputs were gauged at 49kW and 35 kW, respectively. Based on an economic model ofa 6% discount rate, 5p/kWh and a 20 year life, neither sitewas seen as being economically viable.
PHYSICAL CHARACTERISTICSThe lower weir is in good condition and there is still someflow in the leat and tailrace though renovation work wouldbe required. The shell of the mill building is still standingtogether with the wheelpit (at rear) containing remains of the4.2m diameter by 1.5m wide breastshot waterwheel. The lackof fall on the River Derwent dictates that there is a longdepleted reach (c.250m) between the weir to the point whereflow is returned to the river at the end of the tailrace. Theupper weir was also judged to be in good condition.
The HydrA model was run for this site giving an overallpredicted flow of 6.88 m3/s; however the catchment is heavilymodified by both water abstraction and possible undergroundflows connected with past lead mining, so the predicted valueshould be treated with caution. Happily, the EnvironmentAgency maintains a flow gauging station on the Derwentsituated 1km downstream of the mill where mean annualflow is recorded as 6.43m3/s. This is less than that predictedby HydrA and confirms concerns that a portion of the flowfrom the catchment is either abstracted or travelsunderground. Since the gauging station is only one kilometrefrom the mill it can be assumed to be accurate for the site.
In determining what portion of the flow may be available forhydro power generation, much will be depend upon how thesite is developed. The mill building is a ruin and it appearsunlikely that monies will be readily available to renovate thebuilding and associated infrastructure, nor is there likely to bea pressing use for the building. These problems withrenovation of the building, coupled with the long depletedreach, points to an in-weir solution using the existing millweir. In this case – providing sufficient water is left availablefor a fish pass – there is no reason why all of the remainingflow could not be used for hydro power. Therefore assumingQ95 is left in the river for a fish pass ,the flow available forhydro power based on the data from the EA gauging station is(Qmean – Q95) (6.43-1.488) = 4.9m3/s.
The height of the weir is 2.1m which gives a maximumelectrical power output of 61.7 kW and an annual energycapture of about 270 MWh/year. This is lower than the ETSUfigure which was probably based on using the additional headthrough the mill infrastructure and not just the weir. If thesame methodology is applied to the upper weir, this yields aslightly smaller output of 48.2 kW (204 MWh/year) on a1.65m head.
POTENTIAL CONSTRAINTSThe site is within the Riverside meadows landscape charactertype (LCT) of the Derwent Valley character area (PDNPA,2009) where the prior use of water power is noted and its re-instatement encouraged in the Landscape Strategy guidelines.
Peak Power | page 49
Chapter 6 Key case study sites
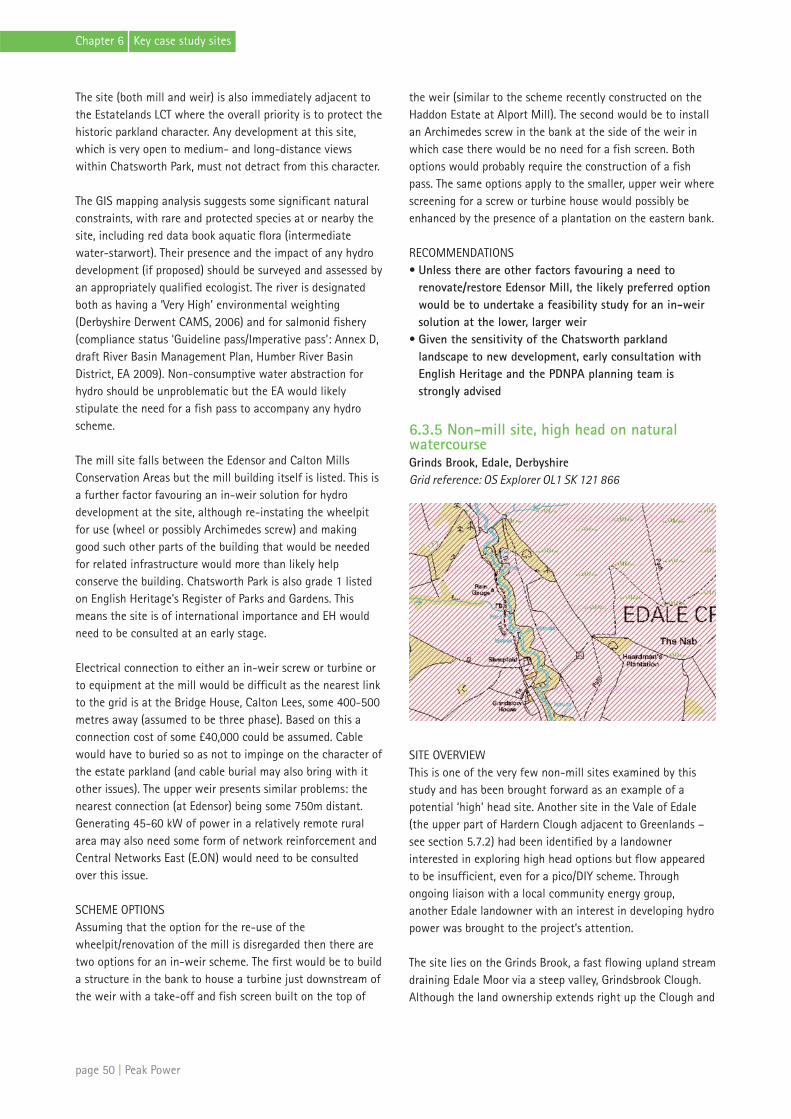
The site (both mill and weir) is also immediately adjacent tothe Estatelands LCT where the overall priority is to protect thehistoric parkland character. Any development at this site,which is very open to medium- and long-distance viewswithin Chatsworth Park, must not detract from this character.
The GIS mapping analysis suggests some significant naturalconstraints, with rare and protected species at or nearby thesite, including red data book aquatic flora (intermediatewater-starwort). Their presence and the impact of any hydrodevelopment (if proposed) should be surveyed and assessed byan appropriately qualified ecologist. The river is designatedboth as having a ‘Very High’ environmental weighting(Derbyshire Derwent CAMS, 2006) and for salmonid fishery(compliance status ‘Guideline pass/Imperative pass’: Annex D,draft River Basin Management Plan, Humber River BasinDistrict, EA 2009). Non-consumptive water abstraction forhydro should be unproblematic but the EA would likelystipulate the need for a fish pass to accompany any hydroscheme.
The mill site falls between the Edensor and Calton MillsConservation Areas but the mill building itself is listed. This isa further factor favouring an in-weir solution for hydrodevelopment at the site, although re-instating the wheelpitfor use (wheel or possibly Archimedes screw) and makinggood such other parts of the building that would be neededfor related infrastructure would more than likely helpconserve the building. Chatsworth Park is also grade 1 listedon English Heritage’s Register of Parks and Gardens. Thismeans the site is of international importance and EH wouldneed to be consulted at an early stage.
Electrical connection to either an in-weir screw or turbine orto equipment at the mill would be difficult as the nearest linkto the grid is at the Bridge House, Calton Lees, some 400-500metres away (assumed to be three phase). Based on this aconnection cost of some £40,000 could be assumed. Cablewould have to buried so as not to impinge on the character ofthe estate parkland (and cable burial may also bring with itother issues). The upper weir presents similar problems: thenearest connection (at Edensor) being some 750m distant.Generating 45-60 kW of power in a relatively remote ruralarea may also need some form of network reinforcement andCentral Networks East (E.ON) would need to be consultedover this issue.
SCHEME OPTIONSAssuming that the option for the re-use of thewheelpit/renovation of the mill is disregarded then there aretwo options for an in-weir scheme. The first would be to builda structure in the bank to house a turbine just downstream ofthe weir with a take-off and fish screen built on the top of
the weir (similar to the scheme recently constructed on theHaddon Estate at Alport Mill). The second would be to installan Archimedes screw in the bank at the side of the weir inwhich case there would be no need for a fish screen. Bothoptions would probably require the construction of a fishpass. The same options apply to the smaller, upper weir wherescreening for a screw or turbine house would possibly beenhanced by the presence of a plantation on the eastern bank.
RECOMMENDATIONS• Unless there are other factors favouring a need to
renovate/restore Edensor Mill, the likely preferred optionwould be to undertake a feasibility study for an in-weirsolution at the lower, larger weir
• Given the sensitivity of the Chatsworth parklandlandscape to new development, early consultation withEnglish Heritage and the PDNPA planning team isstrongly advised
6.3.5 Non-mill site, high head on naturalwatercourseGrinds Brook, Edale, DerbyshireGrid reference: OS Explorer OL1 SK 121 866
SITE OVERVIEWThis is one of the very few non-mill sites examined by thisstudy and has been brought forward as an example of apotential ‘high’ head site. Another site in the Vale of Edale(the upper part of Hardern Clough adjacent to Greenlands –see section 5.7.2) had been identified by a landownerinterested in exploring high head options but flow appearedto be insufficient, even for a pico/DIY scheme. Throughongoing liaison with a local community energy group,another Edale landowner with an interest in developing hydropower was brought to the project’s attention.
The site lies on the Grinds Brook, a fast flowing upland streamdraining Edale Moor via a steep valley, Grindsbrook Clough.Although the land ownership extends right up the Clough and
page 50 | Peak Power
Chapter 6 Key case study sites

onto the Moor, the section of the Brook chosen for study wasfrom just below the junction with Golden Clough to a pointadjacent to Grindslow House, a stretch of some 500 metres or so.
PHYSICAL CHARACTERISTICSFrom Golden Clough to Grindslow House, the stream dropsabout 30 metres in height, mostly in a fairly incised andheavily wooded clough with poor access, even for minor civilengineering works. Along most of the western bank, there is arough farm track which then peters out after reaching themoorland wall (edge of the in-bye land). The track alsocrosses the Grinds Brook to the eastern bank at a ford. All theclough in which the stream flows is owned by GrindslowHouse; to the east of the clough, Grindsbrook Meadows (partof the Pennine Way route) is in the ownership of the NationalPark Authority.
The likely scheme envisaged would involve a take off pointjust inside the moorland wall with a long leat contouringsouthwards through grazing pastures before being dropped(in a penstock) to a turbine house, possibly in outbuildingsbehind Grindslow House. The HydrA model predicted a meanflow of 0.12m3/s. In gauging potential power output, aresidual flow of Q70 was used in deference to the long (over500m) depleted reach. This gave a potential power output ofnearly 15 kW.
POTENTIAL CONSTRAINTSIn landscape terms the site is in the Upper valley pasturessub-type (LCT) of the Dark Peak LCA (PDNP LandscapeStrategy, 2009) – priorities for this LCT include protecting thehistoric settlement and enclosure pattern whilst enhancinghabitats within a sustainable farming system. Issues forchange include the scope for the development of hydroschemes with appropriate siting, scale and design. Asensitively developed scheme at Grinds Brook need notimpact adversely on the local landscape as topography andtree cover could help screen development.
The GIS constraints mapping analysis reveal potentiallysignificant issues relating to the proximity to areasdesignated nationally and internationally for natureconservation and the proximity of the ‘Natural Zone’,although the site itself does not appear to impact on red databook, rare or protected species (but two ‘key ecological areas’are adjacent). However, it is likely that some form ofecological survey would be required before any developmenttook place, given that the clough comprises predominantlynatural, undisturbed habitat.
As the site had no former mill infrastructure, cultural heritageissues should not affect development potential. However the
site falls within the Edale Conservation Area which isunusually widely drawn. It should be possible to develop asensitive scheme that can meet the standards expected bydevelopments in a Conservation Area. Grindslow House islisted and if changes to its structure were proposed, this mayneed consent. It is unclear if the outbuildings are also listed;it is more likely that these would be used for any hydroinfrastructure developed.
The river environment itself is likely to be the largestconstraint to development however. The River Noe has a ‘VeryHigh’ environmental weighting given to it in the DerbyshireDerwent CAMS (EA, 2006) which indicates sensitivity toabstraction (usually consumptive). The Noe to its source isalso designated for salmonid fishery with a compliance statusof ‘Guideline fail/Imperative pass’. The Environment Agencyhave already made clear the high value of the Grinds Brook asa superb natural small stream habitat for juvenile brown troutand indicated their concern at any scheme that might putthis status at risk. The proposal for a long depleted reach onthe Grinds Brook would therefore be likely to be stronglyopposed (or the design flow reduced severely, making anyscheme uneconomic).
Finally, electrical connection could also be problematic. Thesite appears to be within 100m of LV (based on data fromPDNPA) but a long way from higher voltage lines. The nearestconnection point is likely to be single phase only andtherefore reinforcement of the line from Edale may berequired. Based on the above one can assume a connectioncost of over £10,000.
SCHEME OPTIONSThe potential scheme envisaged, utilising a long leat and/orpenstock to realise some 30m of head, appears to haveserious environmental constraints associated with it, not tomention likely difficulties with access and topography interms of realising the necessary civil engineering works.However a second option of utilising a previous watercollection scheme for the local village may provide a morefeasible alternative.
Historically Edale was supplied with water from a collectiontank buried high on the flank of Grindslow Knoll then pipedunder the pastures and down to the village. The system is nolonger in use as Edale now is on mains supply but the mainelements of it could readily be renovated. Initial investigationhas revealed a likely flow of some 300 litres per minute(equivalent to 0.005 m3/s) and a head of 180 metres, giving apotential power output of around 5 kW which would besuitable for Grindslow House. It is suggested that thisbecomes a preferred option for further investigations.
Peak Power | page 51
Chapter 6 Key case study sites
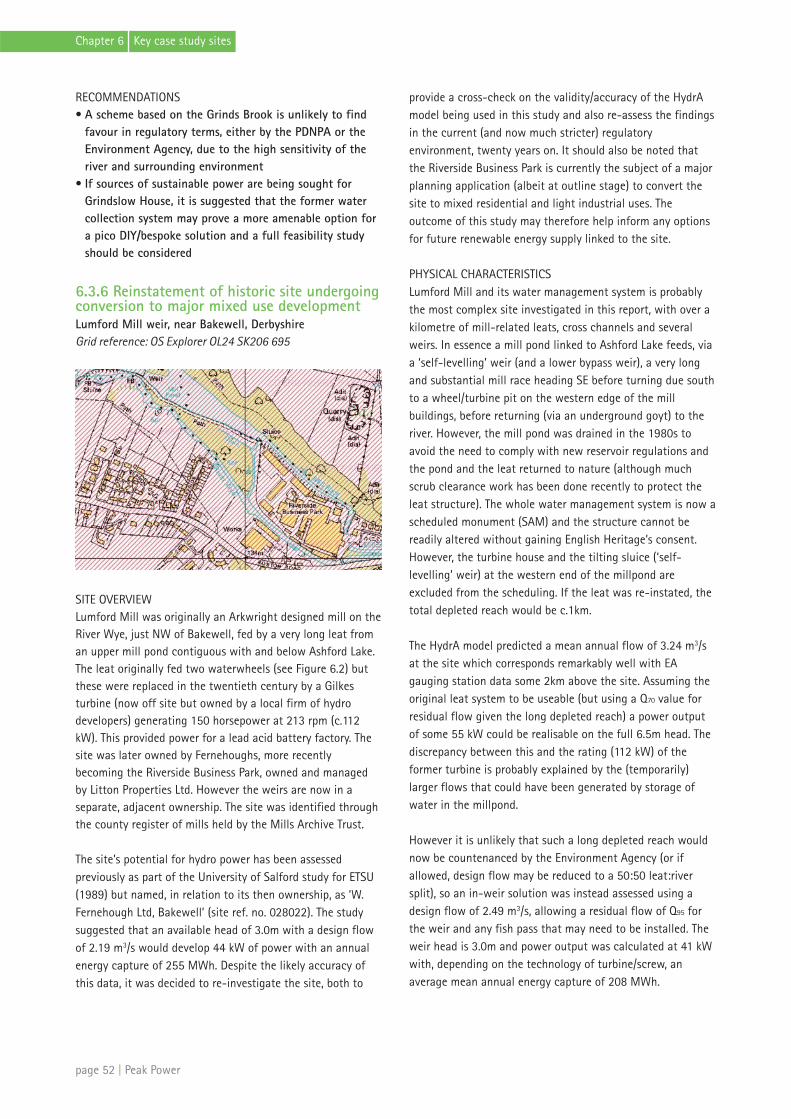
RECOMMENDATIONS• A scheme based on the Grinds Brook is unlikely to find
favour in regulatory terms, either by the PDNPA or theEnvironment Agency, due to the high sensitivity of theriver and surrounding environment
• If sources of sustainable power are being sought forGrindslow House, it is suggested that the former watercollection system may prove a more amenable option fora pico DIY/bespoke solution and a full feasibility studyshould be considered
6.3.6 Reinstatement of historic site undergoingconversion to major mixed use developmentLumford Mill weir, near Bakewell, DerbyshireGrid reference: OS Explorer OL24 SK206 695
SITE OVERVIEWLumford Mill was originally an Arkwright designed mill on theRiver Wye, just NW of Bakewell, fed by a very long leat froman upper mill pond contiguous with and below Ashford Lake.The leat originally fed two waterwheels (see Figure 6.2) butthese were replaced in the twentieth century by a Gilkesturbine (now off site but owned by a local firm of hydrodevelopers) generating 150 horsepower at 213 rpm (c.112kW). This provided power for a lead acid battery factory. Thesite was later owned by Fernehoughs, more recentlybecoming the Riverside Business Park, owned and managedby Litton Properties Ltd. However the weirs are now in aseparate, adjacent ownership. The site was identified throughthe county register of mills held by the Mills Archive Trust.
The site’s potential for hydro power has been assessedpreviously as part of the University of Salford study for ETSU(1989) but named, in relation to its then ownership, as ‘W.Fernehough Ltd, Bakewell’ (site ref. no. 028022). The studysuggested that an available head of 3.0m with a design flowof 2.19 m3/s would develop 44 kW of power with an annualenergy capture of 255 MWh. Despite the likely accuracy ofthis data, it was decided to re-investigate the site, both to
provide a cross-check on the validity/accuracy of the HydrAmodel being used in this study and also re-assess the findingsin the current (and now much stricter) regulatoryenvironment, twenty years on. It should also be noted thatthe Riverside Business Park is currently the subject of a majorplanning application (albeit at outline stage) to convert thesite to mixed residential and light industrial uses. Theoutcome of this study may therefore help inform any optionsfor future renewable energy supply linked to the site.
PHYSICAL CHARACTERISTICSLumford Mill and its water management system is probablythe most complex site investigated in this report, with over akilometre of mill-related leats, cross channels and severalweirs. In essence a mill pond linked to Ashford Lake feeds, viaa ‘self-levelling’ weir (and a lower bypass weir), a very longand substantial mill race heading SE before turning due southto a wheel/turbine pit on the western edge of the millbuildings, before returning (via an underground goyt) to theriver. However, the mill pond was drained in the 1980s toavoid the need to comply with new reservoir regulations andthe pond and the leat returned to nature (although muchscrub clearance work has been done recently to protect theleat structure). The whole water management system is now ascheduled monument (SAM) and the structure cannot bereadily altered without gaining English Heritage’s consent.However, the turbine house and the tilting sluice (‘self-levelling’ weir) at the western end of the millpond areexcluded from the scheduling. If the leat was re-instated, thetotal depleted reach would be c.1km.
The HydrA model predicted a mean annual flow of 3.24 m3/sat the site which corresponds remarkably well with EAgauging station data some 2km above the site. Assuming theoriginal leat system to be useable (but using a Q70 value forresidual flow given the long depleted reach) a power outputof some 55 kW could be realisable on the full 6.5m head. Thediscrepancy between this and the rating (112 kW) of theformer turbine is probably explained by the (temporarily)larger flows that could have been generated by storage ofwater in the millpond.
However it is unlikely that such a long depleted reach wouldnow be countenanced by the Environment Agency (or ifallowed, design flow may be reduced to a 50:50 leat:riversplit), so an in-weir solution was instead assessed using adesign flow of 2.49 m3/s, allowing a residual flow of Q95 forthe weir and any fish pass that may need to be installed. Theweir head is 3.0m and power output was calculated at 41 kWwith, depending on the technology of turbine/screw, anaverage mean annual energy capture of 208 MWh.
page 52 | Peak Power
Chapter 6 Key case study sites

POTENTIAL CONSTRAINTSThe site is situated in the Riverside meadows character typeof the Derwent Valley character area, although it isimmediately adjacent to the border with the White Peak LCA.The lower (south eastern) part of the site sits within the builtup area of Bakewell. The priority for the Riverside meadows isto restore the river corridor landscape and provide floodwater storage. The opportunity for new hydro electricschemes is noted, recognising the strong history of usingwater power in the Derwent Valley. Several of the landscapecharacter types, including the riverside meadows, areconsidered suitable for hydro.
The GIS constraints analysis shows a variety of ecologicalsensitivities nearby, including local red data book species andnationally rare and protected species. If any of these arerelated to riverine/aquatic habitats, then ecological surveysand appropriate mitigation may be required before anydevelopment can be contemplated. There are also a numberof key ecological areas (a local PDNPA designation) nearby.
As mentioned above, cultural heritage constraints also existwith the scheduling of the water management system andthe listed status of the Mill itself. The scheduling is of thepost-1820 hydraulic system and includes the millpond,millrace, dam wall, wheel pits and goyts, tail culverts and raceand river bridge (SAM entry no.12010). Unsurprisingly, the siteis also on the county SMR (now HER) as both a point andarea entry. No changes can be made to the fabric or setting ofa scheduled monument without the express consent ofEnglish Heritage.
In terms of the river environment, the Wye (see theDerbyshire Derwent CAMS, EA 2006) carries an EA ‘High’environmental weighting score (based on its sensitivity toabstraction, usually consumptive) and the stretch (from theA6 road bridge by Shacklow Woods to Rowsley) is alsodesignated as a salmonid fishery with current compliancestatus of ‘Guideline pass/Imperative pass’. It is unlikely thatthe EA would wish these standards to be threatened and aretherefore likely to be concerned about any potential schemewith a long depleted reach.
Assuming an in-weir scheme to be pursued, this does give riseto issues in respect of electrical connection. If the scheme isto be developed in connection with supplying the RiversideBusiness Park (a possible scenario), this would involve runninga connection (probably underground) some 500m to a threephase connection in the industrial site. This could cost asmuch as £40,000. There may also be archaeological issueswith cable burial given the scheduled monument status ofmuch of the leat.
SCHEME OPTIONSA scheme utilising the former infrastructure and full head ofthe site seems unlikely to be a feasible option, though avariant of the original scheme has been suggested using apenstock comprising a buried pipe in the old leat feeding theoriginal turbine reinstated on site. However, realising aneconomic design flow would be very difficult if, as seemslikely, the EA wish to minimise impacts on the depleted reach.In this case, the best option would be to look at an in-weir (orjust adjacent) turbine or Archimedes screw, though even thisscenario is not without its problems: access for civil works,the sensitivity of the scheduled monument and the length ofelectrical connection.
RECOMMENDATIONS• Initial liaison with English Heritage is suggested to
explore how any potential hydro scheme may affect thescheduled monument
• A full feasibility study should be considered focusing onan in-weir solution, although other options should not beruled out, at least initially
• Land ownership issues may need to be clarified, especiallyif a scheme were to be linked with the re-development ofthe Riverside Business Park
6.3.7 Potential urban community scheme, low flowsMarsden town weir, Marsden, W. Yorks.Grid reference: OS Explorer OL21 SE 048 116
SITE OVERVIEWThis weir is located in the centre of Marsden adjacent toArgyle Street, on the final stretch of Butterley Brook before itjoins the River Colne. The site lies about 1 km outside theNational Park boundary but most of the catchment – drainingWessenden Moor – lies within. The previous use of the weir isunknown but a possible route for a mill race is discernible onthe western bank on the site (now a residential block: Wessen
Peak Power | page 53
Chapter 6 Key case study sites

Court). There is a bypass sluice on the eastern side of the weir.A grassy area below the weir (and leading to the waterside) isdirectly accessible from the street and is a popular amenityarea. The site was identified by the FPD hydro team in thecourse of the project.
PHYSICAL CHARACTERISTICSWessenden Brook is canalised as it passes through Marsdencentre and, in the apparent absence of the former mill race,all flow passes over the weir. The weir, whose ownership isnot known, is in reasonable condition and is substantial,possibly based on a natural outcrop of bedrock. Within 50mof the weir, the Brook flows into a revetted section of theColne, flowing west to east.
Mean flow cannot easily be calculated using the HydrA modelbecause of the presence of a number of reservoirs in thecatchment, whose abstraction rates are not known. HoweverYorkshire Water (YW) have provided flow data including therate of compensation water release which stands at 8.068megalitres per day (ML/day) which is equivalent to 0.093m3/s. Given the canalised nature of the Brook at the weir site,it is suggested that virtually all of the flow could be utilisedfor hydro power, especially if an in-weir solution werefavoured. However, because the flow is comparatively low,power output is still very small at c. 1.4 kW (see DARE report,Appendix C, p.11). The YW data did however reveal thatannual mean daily flows are likely to be higher (at c.0.32m3/s) – caused by stronger winter flows. This could increasepower output to c.5 kW but this would mean any generatingplant may be idle in drier periods (a lower capacity factor)unless two small units were installed, one for summer flowsand a further machine to utilise the additional winter flow.
POTENTIAL CONSTRAINTSAs the site is urban, neither the local landscape characteranalyses nor the natural constraints/designation GIS data willbe relevant in assessing any planning constraints.
The site may form a point entry on the county Sites andMonuments Record (SMR) and there may be archaeologicalconstraints to consider. The virtual inclusion of the site aspart of the local ‘street scene’ may be seen as a barrier todevelopment as could any encroachment of hydroinfrastructure onto the adjacent amenity area. Conversely,micro hydro development can also be seen as adding interestfor the local community and visitors.
The site is within the Marsden Conservation Area wheredevelopment must conform with policy BE5 of KirkleesCouncil’s UDP which states that new development mustrespect the architectural qualities of surrounding buildingsand contribute to the preservation or enhancement of the
Area. Sensitive development of the site should be able tomeet these aims.
Electrical connection should be unproblematic as there arelow voltage (LV) connection points in the vicinity.
Given that the state of the Brook at this point is far fromnatural, the potential for damage to the water environment isnot a serious concern. The adjacent stretches of the Colne(both upstream and downstream from the confluence) areboth designated for salmonid fishery and compliance status is‘Guideline fail/Imperative pass’ (see Annex D of the RiverBasin Management Plan for the Humber River Basin District).This may indicate that the Environment Agency might wish topromote further passage of fish up Wessenden Brook; if thiswere the case, they may seek to include a fish pass as part ofthe development. Given that developing the site is likely to beon the margins of economic feasibility, the addition of a fishpass would reduce viability significantly.
SCHEME OPTIONSIf an in-weir solution was sought then an Archimedes screwis the obvious choice and they are available down to 1 kWcapacity (see Figure 2.8). There is ready access for civil worksalthough the physical space at the edge of the Brook issomewhat restricted, especially on the eastern side. There ismore area available for development adjacent to the curtilageof Wessen Court. However developing this site, especially if afish pass were required by the Environment Agency, wouldprobably not constitute a ‘simple low cost scheme’ (seeconclusion of the DARE HydrA report) and therefore isquestionable in overall terms unless funding options andsubsidies for renewably generated electricity were to increasevery markedly.
RECOMMENDATIONS• Further analysis of annual flow release data (if made
available by Yorkshire Water) may reveal opportunitiesfor a (dual unit) scheme that could maximise outputfrom higher winter flows
• Ownership of the site should be clarified; furtherpublicity regarding hydro options at the weir may reveala local community group who may wish to promote ascheme
• Further weir sites should be investigated locally,especially downstream on the Colne where the flow ishigher
page 54 | Peak Power
Chapter 6 Key case study sites
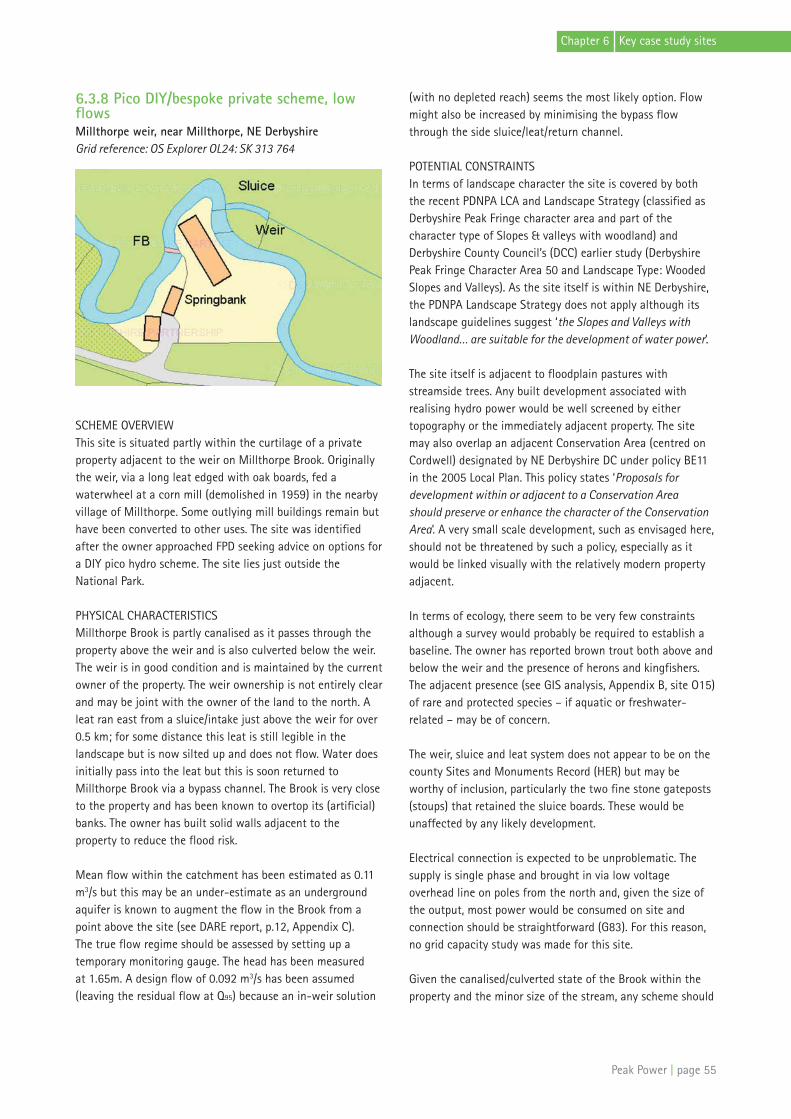
6.3.8 Pico DIY/bespoke private scheme, lowflowsMillthorpe weir, near Millthorpe, NE DerbyshireGrid reference: OS Explorer OL24: SK 313 764
SCHEME OVERVIEWThis site is situated partly within the curtilage of a privateproperty adjacent to the weir on Millthorpe Brook. Originallythe weir, via a long leat edged with oak boards, fed awaterwheel at a corn mill (demolished in 1959) in the nearbyvillage of Millthorpe. Some outlying mill buildings remain buthave been converted to other uses. The site was identifiedafter the owner approached FPD seeking advice on options fora DIY pico hydro scheme. The site lies just outside theNational Park.
PHYSICAL CHARACTERISTICSMillthorpe Brook is partly canalised as it passes through theproperty above the weir and is also culverted below the weir.The weir is in good condition and is maintained by the currentowner of the property. The weir ownership is not entirely clearand may be joint with the owner of the land to the north. Aleat ran east from a sluice/intake just above the weir for over0.5 km; for some distance this leat is still legible in thelandscape but is now silted up and does not flow. Water doesinitially pass into the leat but this is soon returned toMillthorpe Brook via a bypass channel. The Brook is very closeto the property and has been known to overtop its (artificial)banks. The owner has built solid walls adjacent to theproperty to reduce the flood risk.
Mean flow within the catchment has been estimated as 0.11m3/s but this may be an under-estimate as an undergroundaquifer is known to augment the flow in the Brook from apoint above the site (see DARE report, p.12, Appendix C). The true flow regime should be assessed by setting up atemporary monitoring gauge. The head has been measured at 1.65m. A design flow of 0.092 m3/s has been assumed(leaving the residual flow at Q95) because an in-weir solution
(with no depleted reach) seems the most likely option. Flowmight also be increased by minimising the bypass flowthrough the side sluice/leat/return channel.
POTENTIAL CONSTRAINTSIn terms of landscape character the site is covered by boththe recent PDNPA LCA and Landscape Strategy (classified asDerbyshire Peak Fringe character area and part of thecharacter type of Slopes & valleys with woodland) andDerbyshire County Council’s (DCC) earlier study (DerbyshirePeak Fringe Character Area 50 and Landscape Type: WoodedSlopes and Valleys). As the site itself is within NE Derbyshire,the PDNPA Landscape Strategy does not apply although itslandscape guidelines suggest ‘the Slopes and Valleys withWoodland… are suitable for the development of water power’.
The site itself is adjacent to floodplain pastures withstreamside trees. Any built development associated withrealising hydro power would be well screened by eithertopography or the immediately adjacent property. The sitemay also overlap an adjacent Conservation Area (centred onCordwell) designated by NE Derbyshire DC under policy BE11in the 2005 Local Plan. This policy states ‘Proposals fordevelopment within or adjacent to a Conservation Area should preserve or enhance the character of the ConservationArea’. A very small scale development, such as envisaged here,should not be threatened by such a policy, especially as itwould be linked visually with the relatively modern propertyadjacent.
In terms of ecology, there seem to be very few constraintsalthough a survey would probably be required to establish abaseline. The owner has reported brown trout both above andbelow the weir and the presence of herons and kingfishers.The adjacent presence (see GIS analysis, Appendix B, site O15)of rare and protected species – if aquatic or freshwater-related – may be of concern.
The weir, sluice and leat system does not appear to be on thecounty Sites and Monuments Record (HER) but may beworthy of inclusion, particularly the two fine stone gateposts(stoups) that retained the sluice boards. These would beunaffected by any likely development.
Electrical connection is expected to be unproblematic. Thesupply is single phase and brought in via low voltageoverhead line on poles from the north and, given the size ofthe output, most power would be consumed on site andconnection should be straightforward (G83). For this reason,no grid capacity study was made for this site.
Given the canalised/culverted state of the Brook within theproperty and the minor size of the stream, any scheme should
Peak Power | page 55
Chapter 6 Key case study sites
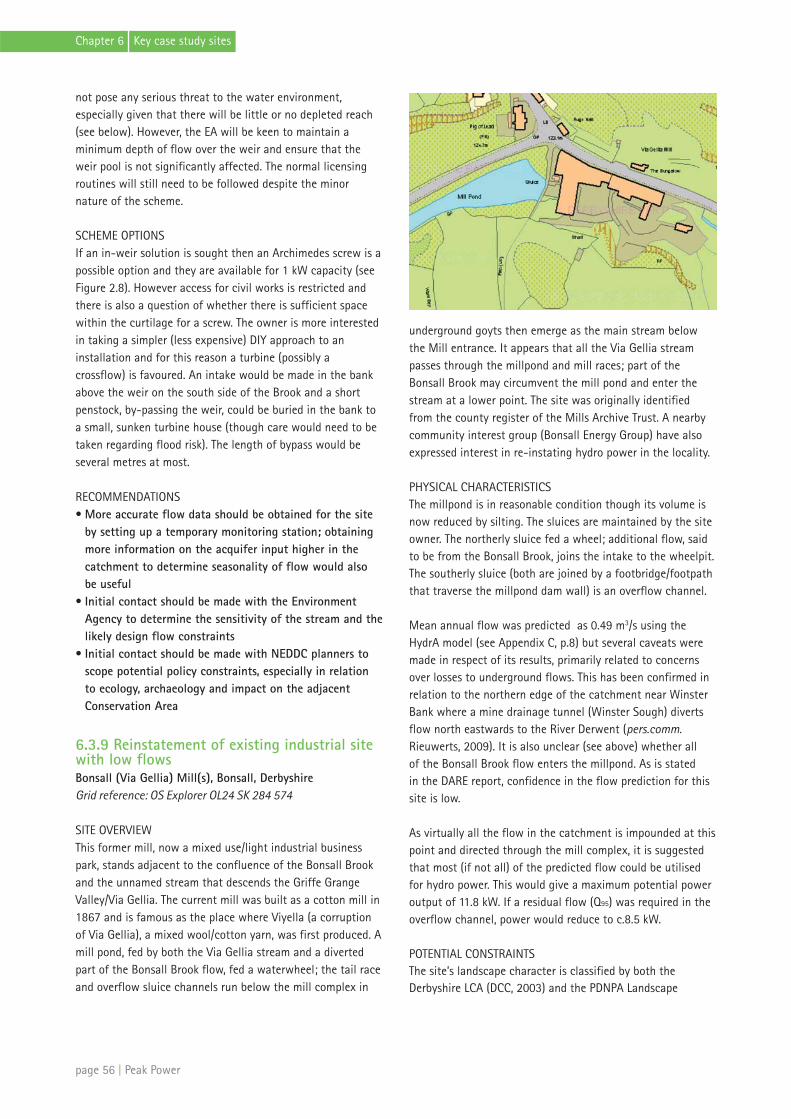
not pose any serious threat to the water environment,especially given that there will be little or no depleted reach(see below). However, the EA will be keen to maintain aminimum depth of flow over the weir and ensure that theweir pool is not significantly affected. The normal licensingroutines will still need to be followed despite the minornature of the scheme.
SCHEME OPTIONSIf an in-weir solution is sought then an Archimedes screw is apossible option and they are available for 1 kW capacity (seeFigure 2.8). However access for civil works is restricted andthere is also a question of whether there is sufficient spacewithin the curtilage for a screw. The owner is more interestedin taking a simpler (less expensive) DIY approach to aninstallation and for this reason a turbine (possibly acrossflow) is favoured. An intake would be made in the bankabove the weir on the south side of the Brook and a shortpenstock, by-passing the weir, could be buried in the bank toa small, sunken turbine house (though care would need to betaken regarding flood risk). The length of bypass would beseveral metres at most.
RECOMMENDATIONS• More accurate flow data should be obtained for the site
by setting up a temporary monitoring station; obtainingmore information on the acquifer input higher in thecatchment to determine seasonality of flow would alsobe useful
• Initial contact should be made with the EnvironmentAgency to determine the sensitivity of the stream and thelikely design flow constraints
• Initial contact should be made with NEDDC planners toscope potential policy constraints, especially in relationto ecology, archaeology and impact on the adjacentConservation Area
6.3.9 Reinstatement of existing industrial sitewith low flowsBonsall (Via Gellia) Mill(s), Bonsall, DerbyshireGrid reference: OS Explorer OL24 SK 284 574
SITE OVERVIEWThis former mill, now a mixed use/light industrial businesspark, stands adjacent to the confluence of the Bonsall Brookand the unnamed stream that descends the Griffe GrangeValley/Via Gellia. The current mill was built as a cotton mill in1867 and is famous as the place where Viyella (a corruptionof Via Gellia), a mixed wool/cotton yarn, was first produced. Amill pond, fed by both the Via Gellia stream and a divertedpart of the Bonsall Brook flow, fed a waterwheel; the tail raceand overflow sluice channels run below the mill complex in
underground goyts then emerge as the main stream belowthe Mill entrance. It appears that all the Via Gellia streampasses through the millpond and mill races; part of theBonsall Brook may circumvent the mill pond and enter thestream at a lower point. The site was originally identifiedfrom the county register of the Mills Archive Trust. A nearbycommunity interest group (Bonsall Energy Group) have alsoexpressed interest in re-instating hydro power in the locality.
PHYSICAL CHARACTERISTICSThe millpond is in reasonable condition though its volume isnow reduced by silting. The sluices are maintained by the siteowner. The northerly sluice fed a wheel; additional flow, saidto be from the Bonsall Brook, joins the intake to the wheelpit.The southerly sluice (both are joined by a footbridge/footpaththat traverse the millpond dam wall) is an overflow channel.
Mean annual flow was predicted as 0.49 m3/s using theHydrA model (see Appendix C, p.8) but several caveats weremade in respect of its results, primarily related to concernsover losses to underground flows. This has been confirmed inrelation to the northern edge of the catchment near WinsterBank where a mine drainage tunnel (Winster Sough) divertsflow north eastwards to the River Derwent (pers.comm.Rieuwerts, 2009). It is also unclear (see above) whether all of the Bonsall Brook flow enters the millpond. As is stated in the DARE report, confidence in the flow prediction for thissite is low.
As virtually all the flow in the catchment is impounded at thispoint and directed through the mill complex, it is suggestedthat most (if not all) of the predicted flow could be utilisedfor hydro power. This would give a maximum potential poweroutput of 11.8 kW. If a residual flow (Q95) was required in theoverflow channel, power would reduce to c.8.5 kW.
POTENTIAL CONSTRAINTSThe site’s landscape character is classified by both theDerbyshire LCA (DCC, 2003) and the PDNPA Landscape
page 56 | Peak Power
Chapter 6 Key case study sites

Strategy (2009) as Limestone Dales character type within theWhite Peak character area, although the site formally liessome 200m from the National Park boundary. The DCCdescription notes the extensive urbanisation of the BonsallBrook and Via Gellia dales whilst the PDNPA landscapeguidelines suggest there are localised opportunities in thelimestone dales for the development of water power.Landscape sensitivity is unlikely to be a constraint toinstalling hydro power infrastructure at the site.
The site lies outside both the Bonsall and CromfordConservation Areas and the building is not listed. The GISconstraints mapping exercise notes that Bonsall Mill is on thecounty Sites and Monuments Record (SMR, now HER); it isnot clear whether this is Via Gellia Mill or the dry colour milljust to the north on the Clatterway (the two mills are shownseparately on the 1971 OS 6 inch map SK 25 NE). The site alsolays within the buffer zone of the Derwent Valley WorldHeritage Site. Thus any development within the mill curtilagewill probably require some form of archaeological assessment,especially if located within the original water managementsystem. There is also a limekiln recorded very close to the sitebut it seems unlikely that this or its setting would beimpacted adversely.
The site is adjacent to the Via Gellia woodlands which aredesignated as SSSI and SPA but any scheme is unlikely tohave impacts on their biological interest or the integrity ofthe habitat. There are however rare and protected species inthe vicinity; if any of these are dependent on the waterenvironment, then some appropriate form of assessment willbe required. However, the stretch of brook is not listed ineither the local CAMS or the Humber River BasinManagement Plan as having environmental or fisherydesignations. Initial comments by the Environment Agencysuggest that they view the site as highly modified. Howeverfurther assessment would be required before a concludedview could be given.
Electrical connection should not be problematic: the Millsalready have three phase connection for some 25 businessunits which would consume most of the generated electricity.Even if the maximum power (c.11 kW) was realised, theconnection would be unlikely to require a G59 connection.However, this should be confirmed by contacting the localDNO, Central Networks East (E.ON). Cabling costs should beminimal.
SCHEME OPTIONSThe most obvious option would be to install either a turbine(either a propeller or cross flow – see HydrArecommendations) or an Archimedes screw in or immediatelyadjacent to the former wheelpit. Design flow should be
maximised by reducing the second sluice flow to theminimum acceptable to the Environment Agency. Given thehighly modified nature of the stream in the Via Gellia, itwould seem unlikely that a fish pass would be requiredthough screening would still be needed if a turbine was to beinstalled. The company that owns the mill are building andcivil engineers and have expressed interest in re-instatinghydro power. If this were to go ahead, they would take on asmuch of the work as possible themselves.
RECOMMENDATIONS• A better understanding of the flow regime (volume and
seasonality) should be obtained before proceeding withany further feasibility studies
• An enhanced knowledge of the physical layout andinterconnections of the Bonsall Brook, the mill sluices,and the subterranean drains with the lower river coursewould also be helpful in fully evaluating any proposeddesign
• The owners may wish to consult with Bonsall EnergyGroup to see if community interest/involvement mightrelease various forms of capital grant aid that wouldotherwise be unavailable to a commercial developer
6.3.10 Potential rural community scheme Whitelee Mill, Danebridge, CheshireGrid reference: OS Explorer OL24 SJ 956 642
SITE OVERVIEWNearly all traces of the former Whitelee Mill have disappeared(it was on the bypass stream to the north of the eastern weir– just west of ‘Sluice’ on the plan above) with the exceptionof the upper weir on the River Dane. Downstream of this weira second weir was built to divert flow from the Dane, via afeeder channel, into Rudyard Reservoir which provided waterfor the Caldon Canal. The feeder is now fed by the upper weirwhich was renovated recently (a fish pass was installed at thesame time). Both weirs plus the land adjacent to the feeder
Peak Power | page 57
Chapter 6 Key case study sites

appear to be in the ownership of British Waterways (BW).Adjacent riparian rights are shared between properties to thenorth and south (Whitelee Farm and Gig Hall, respectively).The site is close to the boundary of the National Park but lieswholly within it. The site was identified through the countyregister of mill sites held by the Mills Archive Trust.
PHYSICAL CHARACTERISTICSThe two weirs, measuring 2.0m and 2.45m high respectively,are situated about 200m apart with a total head measuredbetween both weirs of 5.1m. Little remains of the leat for themill at the upper weir but the feeder for Rudyard Reservoirand the associated take-off works and feeder still exist, albeitsilted up and seldom used. The feeder channel was designedto take water off the Dane when flow exceeded c.2 m3/s, viaan overflow lip at the side of the upper weir.
The HydrA model gives a prediction of mean annual flow of1.41 m3/s for this site. Other catchment data (see DAREreport, Appendix C) suggests this may be an underestimatebut this can only be resolved by undertaking monitoring atthe site itself. The long depleted reach, which would result if
a single installation spanning both weirs was adopted, meansthat a residual flow of Q70 would probably be necessary tosatisfy Environment Agency concerns. In this case the designflow would be (Qmean – Q70) (1.41 – 0.49) = 0.92m3/s, yieldinga power output of some 28 kW and mean energy capture of120 MWh/year.
There are clearly two options here. Firstly, using the feederchannel as a leat/penstock running from above the top weirto a turbine or screw situated below the bottom weir. Thiswould result in a 200m depleted stretch of river between thetwo weirs. Secondly, two separate ‘in-weir’ installations –most probably Archimedes screws – linked to a common gridconnection. In both cases a fish pass would be required at thelower weir and in the first case a fish screen at the intake.The final choice would depend on capital costs and revenuethough the EA are more likely to favour the in-weir option.
POTENTIAL CONSTRAINTSThe site is part of the Riverside meadows character typewithin the South West Peak character area (PDNP LandscapeStrategy, 2009) where the priority is to protect the diversityof the river corridor landscape and encourage natural riverprocesses to provide flood storage, amenity and biodiversitybenefits. The opportunity is noted for small scale hydro-electric schemes within the strategy but in the landscapeguidelines for the LCT it is not a priority but may be consideredin some locations. Given the BW feeder infrastructure alreadyin place at the site and the well screened nature of the rivercorridor, it is unlikely that further hydro development wouldimpact negatively on the local landscape.
The GIS constraints analysis reveals that a small strip ofNatural Zone land (woodland) is immediately adjacent to theupper section of the feeder (between the two weirs). It isunclear how this may affect the potential to develop the site;a further assessment of any scheme’s impact on this area maybe needed at some point. The site also falls within the RiverDane ‘key ecological area’ (a local PDNPA designation)although rare and protected species are not recorded. Thissuggests that an ecological survey may be required before afull proposal could be worked up although the PDNPA mayalready hold more detailed ecological records for the site. Interms of cultural constraints, there is a SMR (HER) entry forthe former watermill site but this should be unaffected byany scheme.
Information from the Environment Agency (the Weaver andDane CAMS, EA 2006) suggests the site is very sensitive forfish: ‘The Upper Dane supports an excellent brown troutfishery. It is valued for its spawning gravels and juvenile refugeareas and therefore supports a diversity of age groups of fish
page 58 | Peak Power
Chapter 6 Key case study sites
Figure 6.2 An early example of the marketing and economic advantages ofhydro power at Lumford Mill (image courtesy of Paul Hudson)
ranging from fry to adults’. This stretch of the Dane is alsodesignated for salmonid fishery under the protected areaobjectives in the draft River Basin Management Plan, NorthWest River Basin District (Annex D, p.29) with a compliancestatus of ‘Guideline fail/Imperative pass’. Given these factors,it is unlikely that the Environment Agency would allow adepleted reach of any significance (at least withoutsignificantly increasing residual flow) and would also want toensure fish passage through any hydro related barrier.
Electrical connection (low voltage, Central Networks) isclosest at Gig Hall, within 50m of the site and 11 kV within200m but, alternatively, connection could also be sought atWhitelee Farm (LV, probably 3 phase, but on the UnitedUtilities network), but this is c.200m away with difficultground in between. Costs to connect to Whitelee Farm havebeen estimated at over £15,000. Given the relativeremoteness of the grid in this rural area, an analysis of thestrength of the local grid to absorb 30 kW of generation maybe necessary.
SCHEME OPTIONSIn terms of civil works and making use of the existinginfrastructure, a scheme utilising the full head by way of theextant feeder channel, with a return to river below the lowerweir, makes a good deal of sense. However, this study hasrevealed a likely significant sensitivity of the river to furthermodification. The second option would comprise an in-weirscheme at both weirs with a residual flow of Q95 servicing theweirs (including fish passes). In this case, the design flowcould be increased to 1.23m3/s and the maximum electricalpower output would be 32.84 kW (6 x 2.0 x 1.23 + 6 x 2.45 x1.23) with an mean annual energy capture in the order of 135 MWh/year.
Both weirs and much of the associated infrastructure andland are owned by British Waterways. They have alreadyindicated an in-principle readiness to examine a scheme atthis site and possibly lease the site for hydro power generationby the local landowners and/or the local community. Thelikely mechanism for this would be via a royalty arrangement(percentage of the income from the electricity export) but noterms have been disclosed. These would clearly be crucial tothe overall economic case for proceeding with development.
RECOMMENDATIONS• More accurate flow data should be obtained for the site
and consideration given to undertaking a full feasibilitystudy including design and installation costs
• Given the likely sensitivity of the river environment,principally for fish, early contact should be made withthe Environment Agency
• Negotiations should be undertaken with British Waterwaysto ascertain likely leasing conditions and costs
• Consideration should be given to the formation of anIndustrial and Provident Society (IPS) to develop thescheme for the benefit of the local community
6.4 OVERVIEW ON KEY CASE STUDY SITES
The key case study sites have illustrated an interesting mix ofsites varying greatly in the associated constraints and alsolikely power outputs. Although two (Marsden and Millthorpeweirs) fell squarely into the bracket of ‘pico’ schemes (lessthan 10 kW), where economic viability is often marginal,either community involvement or a willingness to do most ofthe civil and other works without outside contractors, couldenhance their developability. The likely enhanced subsidies forsub-10 kW schemes under the Feed-In Tariff may also assistin reducing payback times. However, a similar site at LowBradfield (output 0.8 kW) was felt to be too marginal and notworth further study (see Table 6.1) and was therefore notdeveloped into a key case study site (see section 5.7.1). Thesole ‘high’ head site, Grinds Brook in Edale, is unfortunatelyhighly constrained by its own high quality naturalenvironment but again an innovative pico scheme (c.5 kW)may be realisable as an alternative.
At the opposite end of the scale, a number of former mill siteson the main Peak District rivers of the Wye and Derwent offergood opportunities, including Bamford Mill (21-27 kW),Lumford Mill weir (50 kW), Caudwell’s Mill (50 kW) andEdensor Mill weirs (43 kW and 56 kW) though the latter threesites are likely to have significant historic environment issuesto address. The Bamford Mill site appears to be the leastconstrained and there is significant local interest in progressinga scheme. On the Dane, in the southwest Peak, excellentinfrastructure at two weirs at the former Whitelee Mill mayafford a good opportunity (34 kW) for a remoter rural scheme.
A number of light industrial sites on the edges of the NationalPark (Via Gellia Mills and Diggle Mill, although the latter hasplanning permission for conversion to residences) offerreasonable opportunities for on-site power (both just over 10kW). Economic viability at these sites may be enhanced byinstalling smaller turbines that could take advantage of thehigher Feed-in Tariffs. Via Gellia Mills is particularly promisinggiven the artificial nature of the river environment; DiggleMill would be a much more difficult scheme to develop butthe key issue here is to protect future options by safeguardingthe remaining historic infrastructure.
Finally it should be noted that all the sites (bar Low Bradfield)were recommended as being worth further study. In the finaland concluding chapter, all the sites identified and described
Peak Power | page 59
Chapter 6 Key case study sites

in Chapter 5 and this chapter are drawn together to estimate,with key caveats, likely future hydro capacity for the PeakDistrict. The total potential capacity of the case study sites isalso shown in Table 6.1 showing nearly 300 kW that could berealisable (285 kW within the PDNP).
page 60 | Peak Power
Chapter 6 Key case study sites
Table 6.1 Summary table of case study sites subject to HydrA analysis
# alternative scheme*mean output from range of turbine options† not written up as a key case study site (see section 5.7.1)
1
#1a
2
3
4
5
6
7
8
9
10
11
11a
Bamford Mill
Bamford Mill
Via Gellia Mills, Bonsall
Diggle Mill
Low Bradfield weir†
Marsden town weir
Millthorpe weir
Whitelee/Gig Hall weirs
Caudwell’s Mill
Grinds Brook, Edale
Lumford Mill weir
Edensor upper weir
Edensor (Mill) weir
Total capacity/output
(capacity within PDNP)
2.50
5.50
4.00
22.0
2.00
2.60
1.65
5.10
2.70
30.0
3.00
1.64
2.10
-
SITE NAME HEAD (m)
1.81
0.65
0.49
0.09
0.07
0.09
0.07
0.92
2.50
0.08
2.26
4.90
4.90
-
DESIGNFLOW(m3/S)
27.0
21.0
10.7*
11.6
0.8
1.4
0.9
34.0*
49.8*
12.5
50.2*
43.0
56.0
297.9
(284.9)
INSTALLEDCAPACITY (RATED POWER)(kW)
216
168
45*
58
4
12
3
117*
182*
47
208*
204
261
1357
(1297)
MEANANNUALENERGY CAPTURE(MWh/y)
Y
Y
Y
Y
N
Y
Inconclusive
Y
Y
Y
Y
Y
Y
-
WORTHFURTHERSTUDY?
7.1 OVERVIEW
Through a sequential process of data gathering including deskstudies, consultation with parish councils, local communitygroups and other interested parties, the FPD micro hydroproject has identified a total of 162 sites across the PeakDistrict National Park and immediately adjoining areas (120inside the NP boundary, 42 just outside). At 12 sites (ninewithin, three just outside – see Table 5.1), there is installedhydro plant (all turbines save one waterwheel at HartingtonMill) totalling 1.6 megawatts (MW) and the potential toupgrade power output exists for at least two of these sites(Chatsworth’s Emperor stream and at Caudwell’s Mill). Of the150 potential (currently undeveloped) sites, two (at Flewitt’sMill in Ashford in the Water and Calver Corn Mill) should beproducing power in early-mid 2010 and other schemes (e.g.Meadow Farm near Flash) are currently seeking licences fromthe Environment Agency.
Of the remaining 150 sites, the majority of which are old millsites, the outlook is variable. This project and other recentstudies (for example examining sites around Bollington andon the Peak fringe to the west of Sheffield: see Leigh, 2008and IT Power, 2006, respectively) have identified 80 or so sites(mill and non-mill sites, both inside and just outside the NP –see Appendix A, Tables A1, A2 and A3) where there isworthwhile scope for further investigation. The majority ofthese sites (59) were subject to a GIS constraints analysisprocess (see Chapter 5 and Appendix B).
Ten sites (the key case study sites written up in the precedingChapter 6) were examined in much greater detail with flowand power output estimated, design options explored and gridconnection and turbine choices analysed. Less detailed studyof a further ten sites (see Chapter 5) suggested that there willbe scope for schemes at many more sites across the PeakDistrict but identifying viability and possible power outputswas beyond the scope and resources of this project.Nonetheless, the issue of wider capacity for new micro hydrodevelopment in the Peak District is addressed in this chapter.
Of the remaining 70 sites (see Appendix A, Table A4), thepotential for re-development is thought to be low with themain issues being low flow and/or lack of infrastructure.Many low flow streams historically had mills where powercould only be generated intermittently by storing water in amillpond and, in general, such sites are unsuitable for ‘run ofriver’ electricity generation. However if the pressure for newrenewable energy (RE) sources, including micro generation,increases markedly, then some of these sites may becomemore economically viable, especially if the balance betweenconservation and the need for RE shifts.
Finally, it should be noted that the list of sites identifiedshould not be regarded as fully comprehensive, especially inrelation to non-mill sites. Although these seem unlikely to bedeveloped in great numbers (either due to significantenvironmental constraints in the uppermost parts of rivercatchments for medium/high head sites or issues relating tocreating new weirs), the scope for such schemes was onlyexplored in a relatively minor way. Our coverage of old millsites has been more exhaustive yet new sites continued tocome to light throughout the project (e.g. Calver Corn Mill;Panna Mill near Meltham), most of which have been belatedlyincluded, at least in the site listings (Appendix A).
7.2 ASSESSING FUTURE MICRO HYDROPOWER CAPACITY IN THE PEAK DISTRICT
As has been stated earlier, there is currently just over 1 MWinstalled capacity of small/micro hydro power within thePDNP boundary and 1.6 MW if schemes that traverse theboundary (catchment within/powerhouse outside – see Table5.1) are included. Although there are currently no local orregional planning targets for hydro power generationallocated to the PDNP area, the Draft Regional EnergyStrategy for the East Midlands (referred to in the RegionalSpatial Strategy for the East Midlands (RSS8), 2005) did set atarget of 1.3 MW by 2010 which has been largely met.However, strong pressure to provide ever more energy fromrenewable sources suggests that higher targets will be
Peak Power | page 61
Chapter 7 Conclusions andrecommendations

necessary. A recent study of renewable energy (RE) capacity inthe East Midlands (Faber Maunsell/AECOM, 2009) suggeststhat somewhere between 12-20 MW of hydro capacity by2031 is feasible for the whole of the region, with the mainpotential being in Nottinghamshire and Derbyshire, includingthe National Park area.
A more detailed RE capacity study carried out for the Peaksub-region (which comprises the Derbyshire Dales, High Peakand the Peak District NP), and based largely on interim datafrom this project, suggested further potential hydro capacityof 2.6 MW generating up to 13.2 GWh/y of energy across thethree areas of which c.1-1.2 MW was in the PDNP (NEF &LUC, 2009). Although this current project was not taskedwith analysing overall future hydro capacity for the PeakDistrict, at the conclusion of the work we are now in a betterposition to provide some context and indicative data tofinesse the NEF/LUC study, albeit with some major caveats.
7.2.1 Data limitationsThe first caveat relates to the fact that this project can onlycomment (with any confidence) on the potential capacitywithin the National Park itself, rather than the Peak sub-region. Although sites on or near the boundary of the NPwere also examined, there was no corresponding analysis ofsites with High Peak or the Derbyshire Dales local authorityareas as a whole. Figures for these latter areas wereestimated by the NEF/LUC study but the information base wasat quite a low level; therefore their figures may beconservative.
Secondly, the capacity estimates are only known (either fromthis study or previous reports) for a proportion of the moreviable sites (about 30 – see Appendix A, Table A5); it is likelythat there will be viable schemes within the other 50 or somore developable sites (Appendix A, Tables A1, A2 and A3).Set against this, however, is the fact that most of the majorriver sites (generally the larger mills on the Wye and Derwent)have already been identified and studied (to varying degrees)and, as other sites get scoped, the ‘law of diminishing returns’is likely to operate.
Thirdly, for various reasons – related to both economic,planning and environmental constraints – a number of sitesseem unlikely to be developed, at least in the short term.Nonetheless, parallel changes in planning policy and anincreasing need to produce renewable energy (usuallyaddressed through fiscal incentives) may offset some of theseconstraints to differing degrees.
7.2.2 Overall PDNP hydro capacityTaking these essential caveats into account, and based on thisproject and other studies’ data, we calculate that there is apotential capacity of c.1.8 MW (1840 kW with an output ofc.9.2 GWh/y) known about at the current time (end 2009), asshown in Table 7.1 and in more detail (by individual sites) inTable A5 in Appendix A. This improves on the potentialcapacity in the recent NEF/LUC study which was reported asbetween 5.1-6.0 GWh/y, equivalent to c.1.0-1.2 MW ofinstalled capacity (the NEF/LUC assessment appears to use arelatively high capacity factor of 0.6/60%). The increase incapacity we report is predominantly due to the addition of
page 62 | Peak Power
Chapter 7 Conclusions and recommendations
Table 7.1 Potential small/micro hydro sites - additional capacity within the PDNP
Site groupings Installedcapacity (kW) Sites/locations
New water and sewerage company sites 700 Upper Derwent catchment
Upgrade existing hydro schemes 148 Chatsworth and Caudwell’s Mill
FPD key case study sites 235 Excluding Caudwell’s Mill and sites outside the NP
ETSU mill sites 374 Calver/Cressbrook/Litton/Baslow
ETSU high head sites 194 Bar Brook and Burbage Brook
Derwent Hydro/Segen/WRE/SY etc 97 Flewitts/Brough Bus. Pk/Stoney Middleton/Ilam/Meadow/Raper Lodge/Ashford Bobbin Mill/Calver Corn Mill
LUC/ITP sites 92 Leadmill/Lathkilldale
Sub total potential sites 1840 (c.9.2 GWh/year output)
Existing hydro capacity 1090 Excluding water and sewerage company sites justoutside the PDNP
TOTAL 2930 (c.14.5 GWh/year output)

the potential for further schemes in the Upper Derwentcatchment, as scoped by Severn Trent Water.
Put together with existing capacity (c.1.1 MW), this gives anoverall capacity for the PDNP area of 2.9 MW (2933 kW,c.14.5 GWh/y) which – if realisable - would be a substantialcontribution to local and regional hydro capacity. However,this estimate must (again) be strongly hedged with caveats.
In terms of what is usually understood as ‘gross river potential’– the total theoretical energy available in all weirs andpotential medium-high head sites – the 2.9 MW is probablyan under-estimate, especially as our estimate of potential isbased on only 30 or so sites from at least 80 of the moreviable locations and a further 70 or so less viable sites.However, in relation to what might be readily deliverable inthe short-medium term, the 1.8 MW capacity figure must betreated with some caution. This is because licensing/planningissues (often related to environmental constraints), gridconnection difficulties and economic viability factors willintervene to varying degrees.
To address this issue, we have allocated an indicative level ofconstraint (running from ‘low’ to ‘very high’) against each ofthe potential sites listed in Table A5 (in Appendix A). Summingthe capacities within broad bands of constraint levels gives arough indication of the distribution of hydro opportunities andthis is shown in Figure 7.1. In crude terms this demonstratesthat the majority of potential capacity falls within the lower tomiddle constraint bands, which is encouraging for future uptake.To realise this potential it would obviously be best to focus mosteffort on the sites with highest capacity and least constraint.
7.3 NEXT STEPS
7.3.1 Local engagement and actionAs well as identifying a comprehensive data set of potentialmicro hydro power sites in the Peak District, another key aim
was help encourage and enable site owners and/or localcommunity groups to progress sites towards implementation.This has been attempted in a variety of ways, including: • compiling the advice and ‘how to’ elements of this report
(Chapters 2, 3, 4)• investigating the comparative viability of a large number of
sites and• producing – via the key case studies – pre-feasibility reports
which reduce the need for initial consultants’ advice, thussaving developer costs, particularly to interested communities
In addition, throughout the whole project, advice has beendispensed to individuals and groups in a variety of formats(telephone; e-mail; letter; face-to-face discussion; site visits)on developing particular sites or areas, and engagement hasoccurred with community groups (e.g. Sustainable Youlgreave,Sustainable Bakewell, Sustainable Edale, Dales Association forIntegrated Renewable Energy, Sustainable Wirksworth etc)interested in developing micro hydro as part of widerrenewable energy or local sustainability initiatives. Much ofthis engagement led on from the two initial communityconsultation events (see section 5.2) which were specificallyaimed at raising awareness among individuals andcommunities in and around the Peak District.
To conclude the project, a community workshop (held jointlywith Water Power Entreprises – H2OPE, and sponsored by theNational Park Authority and the LEADER-funded East PeakInnovation Project) in Low Bradfield shared the survey resultsand then focused on showing how an established businessmodel (as used for the Torrs Hydro development at New Millsin High Peak) could be adopted to develop a community hydrosite. The workshop was well attended by a range of siteowners and community interest groups from all over the PeakDistrict and beyond. However, its true effectiveness can onlybe judged by schemes progressed in the future. It is alsointended to hold at least two further workshops in 2010 toroll out the project results and encourage further action.
Finally it is suggested that a further way forward to facilitatesite development would be to form some kind of Peak Districtmicro-hydro ‘user group’ which could be used as a forum forexchanging advice and experiences and learning from bestpractice, as demonstrated in the Peak District and otherprotected landscapes. This model has been adopted in otherareas, notably Dartmoor, with some success. The group couldalso have an informal role in monitoring progress against thesite lists produced by this project. If this recommendation issupported, Friends of the Peak District will assist in thegroup’s inception and support it through its initial period ofoperation.
Peak Power | page 63
Chapter 7 Conclusions and recommendations
900
800
700
600
500
400
300
200
100
0
847
711
281
Medium/Medium-high High/very highLow/Low-Medium
Figure 7.1 Potential PDNP hydro capacity (kW) versus level of site constraint
7.3.2 Political engagement and actionFor progress to be made in delivering more micro hydroschemes in the Peak District, other forms of assistance will berequired. Grant aid for micro renewable projects is variableacross the Peak District and the paucity of dedicated schemesto support small scale generation in the East Midlands region(as compared to those available in Yorkshire & Humber) needsto be remedied. It is also the case that national grantschemes do not appear – as yet (though this may change withthe introduction of feed-in tariffs) – to have had a major rolein catalysing the growth of micro hydro and a number nowseem likely to end prematurely (e.g. the Low Carbon BuildingProgramme – see section 4.3.2) when the Feed-In Tariff startsin April 2010, for fear of ‘double-funding’.
The role of the PDNP Sustainable Development Fund has beenvery valuable in supporting scoping studies for micro hydro(as well as providing a substantial grant towards this project)but none of the sites investigated (Ilam, Brough Business Park,Bakewell, Stoney Middleton, Caudwell’s Mill) have progressedmuch further as yet. However at the end of 2008 the SDF alsoawarded a much larger grant (£25,000) towards the capitalcosts of a proposed 10 kW scheme at Cromford Corn Mill bythe Arkwright Society. Notably the site lies just outside theNational Park but is seen as having an important educationalrole at a key southern gateway to the NP area.
Elsewhere, for example in the Yorkshire Dales National Park, aYDNPA-commissioned hydro power feasibility study (notdissimilar from this project) has been completed (Inter HydroTechnology, 2009) and is being followed up by:• holding a one day seminar to gauge local support for new
hydro schemes• YDNPA planning officers (working together with the
Environment Agency) doing further scoping work on themost viable sites
• putting in place a programme to provide financial supportfor full feasibility studies at key sites with the objective oftaking some sites through to design and commissioning.
The YDNPA’s ultimate aim is to achieve a range of exemplarsites across the YDNP that can be shared with others,illustrating a range of turbine technologies and constructiontechniques demonstrating best practice.
In Wales, a similar approach has been put into practice in theBrecon Beacons National Park with the Green Valleys Project,part of which has also received SDF grants and NPAassistance. There are already 10 operating schemes, some ofwhich have been brought to fruition by the BBNPA’sRenewable Energy Asssistance Programme (REAP). In 2009,community groups identified a further 92 possible schemeswith the first 23 having a combined potential capacity of 399kW. A second phase of surveys is planned (seewww.thegreenvalleys.org.uk).
The Peak District National Park Authority’s Management Plan(2006-2011) already prioritises the promotion of low carbontechnologies to address climate change. It recognises thenecessity to promote renewable energy within the NationalPark context and finding ways to enable a greater level ofrenewable energy generation. In part, this can be achievedthrough planning policies and the recent PDNPA consultationdocument Preferred Approaches for the Peak District NationalPark Core Strategy (2009) which emphasises the PDNPA’s aimto be an exemplar of best practice in low impact, low carbonand renewable technologies. To realise this, it is thereforesuggested that the Peak District National Park Authority,possibly working in conjunction with adjacent planningauthorities in the Peak sub-region, consider enhancing thecurrent level of both policy and financial support so that agreater number of appropriate micro hydro schemes,particularly at a community level, are progressed more quickly.
7.4 OVERALL RECOMMENDATIONS
Based on the findings of this project and the evidence set outin this and preceding chapters (including experiences andgood practice noted from other areas, including otherNational Parks in England and Wales) it is recommended that:
• in the short term, attention should be focused ondeveloping the potential hydro sites identified with thehighest capacity (>25 kW) and least constraint. Thesewould include opportunities in the Upper Derwent reservoirscomplex, Chatsworth Park and the large mills/weirs on theWye, Derwent and Dane (Litton Mill, Cressbrook Mill,Lumford Mill, Caudwell’s Mill; Bamford Mill, Calver Mill andHodgkinson’s Mill; Whitelee Mill)
• further workshops should be held to promote awareness oflocal micro hydro opportunities and to engage with siteowners and local communities so schemes are progressed.The formation of a Peak District micro hydro users’ group toshare best practice and monitor progress should be activelyconsidered. Such groups have proved valuable elsewhere
• the National Park Authority should consider makingavailable further resources, both in terms of staff time andgrant aid (similar to the Brecon Beacon’s Renewable EnergyAssistance Programme), to enable the swifterimplementation of a range of exemplar micro hydro sitesthroughout the Peak District, particularly in support ofcommunity-led projects
• to fully realise the renewable energy potential in the PeakDistrict and wider Peak sub-region, better grant aid formicro generation (including hydro) should be provided inthe East Midlands region
page 64 | Peak Power
Chapter 7 Conclusions and recommendations

British Hydropower Association (2005) A Guide to UK Mini-Hydro Developments. Wimborne, Dorset. (also updated athttp://www.british-hydro.co.uk/)
Clarke, I. (2009) Feasibility study on small scale hydroelectricpower systems. Unpublished research project report.Department of Chemical & Process Engineering, University ofSheffield.
Department for Communities and Local Government (2009)Permitted development rights for small scale renewable andlow carbon energy technologies, and electric vehicle charginginfrastructure: Consultation. TSO, London.
Department of Energy and Climate Change (2009a) The UKRenewable Energy Strategy. Cm 7686. TSO, London.
Department of Energy and Climate Change (2009b) Digest ofUnited Kingdom Energy Statistics. TSO, London.
Department of Trade and Industry (2003) Our energy future:creating a low carbon economy. Cm 5761. TSO, London.
Department of Trade and Industry (2007) Meeting the EnergyChallenge: A White Paper on Energy. Cm 7124. TSO, London.
Derwent Hydro (2004) Ilam Hydro Scheme: Feasibility Study.Report for Ilam Community Group, September 2004. DHP,Duffield.
Derwent Hydro (2007) Hydropower at Brough Business Centre:Pre-Feasibility Study. Report for Direct Charcoal Ltd, April2007. DHP, Duffield.
Derwent Hydro (2008) Hydropower at Stoney Middleton: Pre-Feasibility Study. Report for William Lennon & Co. Ltd,June 2008. DHP, Duffield.
Devon Association for Renewable Energy (2004) DartmoorHydropower Survey. DARE, North Tawton.
Environment Agency (2003) Hydropower: A handbook forAgency staff. [maintained by electronic updates since 2003]
Environment Agency (2004) The Tame, Goyt and EtherowCatchment Abstraction Management Strategy. EA,Warrington.
Environment Agency (2006) The Weaver and Dane CatchmentAbstraction Management Strategy. EA, Warrington.
Environment Agency (2006) The Derbyshire DerwentCatchment Abstraction Management Strategy. EA, Solihull.
Environment Agency (2008) Draft River Basin ManagementPlan: Humber River Basin District. EA, Leeds.
Environment Agency (2009) Good Practice Guidelines Annexto the Environment Agency Hydropower Handbook: theenvironmental assessment of proposed low head hydro powerdevelopments. EA, August 2009.
Faber Maunsell/AECOM (2009) Reviewing Renewable Energyand Energy Efficiency Targets for the East Midlands. Finalreport to East Midlands Regional Assembly, June 2009.
Gifford, Alan (1999) Derbyshire Watermills – Corn Mills. TheMidland Wind & Water Mills Group.
Goring, O. (2000) Powering up the River Thames. InternationalWater Power & Dam Construction no.11, pp.34-35.
Grimsditch, B. et al. (2008) Diggle Mill, Diggle, Oldham: Anarchaeological building survey of a mid-19th century woollenmill. University of Manchester Archaeology Unit, Manchester.
Gunn, J. (2009) Flow from Magpie Sough. Unpublishedresearch note. LRC Ltd, Marsden.
Inter Hydro Technology (2009) Small scale hydro feasibilitystudy: final report. Report ref. H25044/CDV for the YorkshireDales National Park Authority, July 2009.
IT Power (2006) Renewable energy scoping and feasibilitystudy for Sheffield. Final report to Sheffield City Council,ITP/0974. IT Power, Chineham.
Peak Power | page 65
References

Land Use Consultants & IT Power (2001) Viewpoints onSustainable Energy in the East Midlands: A Study of CurrentEnergy Projects and Future Prospects. Final Report, March2001. LUC, London.
Leigh, P. (2007) Time to go with the flow. Water andEnvironment Magazine Vol.12, no.3, pp.24-25.
Leigh, P. (2008) Feasibility study for hydropower potential inBollington: Joule Hydro Resource Model Project. Blue SkySustainable Solutions Ltd, Lancaster/Moffat.
Muller, G. & Kauppert, K. (2002) Old watermills – Britain’snew source of energy? Civil Engineering no.150, pp.178-186.
Muller, G. & Kauppert, K. (2004) Performance characteristicsof water wheels. Journal of Hydraulic Research Vol.42, no.5,pp.452-460.
Muller, G. et al. (undated) Stream wheels for application inshallow and deep water. Unpublished paper. SustainableEnergy Group, University of Southampton.
National Energy Foundation & Land Use Consultants (2009)Peak Sub-Region Climate Change Study: Focussing on thecapacity and potential for renewables and low carbontechnologies, incorporating a landscape sensitivity study of thearea. Final Report for DDDC/PDNPA/HPBC, July 2009.
Peak District National Park Authority (2001) Peak DistrictNational Park Local Plan. Adopted March 2001. PDNPA,Bakewell.
Peak District National Park Authority (2003) SupplementaryPlanning Guidance for Energy, Renewables and Conservation.PDNPA, Bakewell.
Peak District National Park Authority (2009) Peak DistrictNational Park Landscape Strategy and Action Plan 2009-2019.PDNPA, Bakewell.
Pymm, R. (2005) A Template to develop a HydropowerPotential Survey. DARE, North Tawton.
Renewable Heat & Power Ltd (2004) Norchard Drift: ‘ClearSkies’ hydropower feasibility study. RHP Ltd, Tiverton.
Salford Civil Engineering Limited (1989) Small scalehydroelectric generation potential in the UK. Contractorreport: 3 volumes. Report No. ETSU-SSH-4063-P1 et seq.commissioned from Salford University. Department of Energy,London.
Stern, N. (2007) The Economics of Climate Change: the SternReview. Cambridge University Press, Cambridge.
Thames Valley Energy & Montgomery Watson Harza (2004)Low Head Hydro Power in the South-East of England – A Review of the Resource and Associated Technical,Environmental and Socio-Economic Issues. Report TV017,February 2004.
Townsend, S. (2010) Ashford Bobbin Mill: HydropowerFeasibility Report. Unpublished report for Friends of the PeakDistrict, January 2010.
Turnpenny A.W.H., Struthers G. & Hansen, K.P. (1998) A UKguide to intake fish screening regulations, policy and bestpractice, with particular reference to hydroelectric powerschemes. Energy Technology Support Unit, report no. ETSUH/06/00052/00/00. Harwell, Oxon.
Willies, L. (1989) Calver Mill. Bulletin of the Peak DistrictMines Historical Society, Vol. 10, no.5, pp.276-280.
Zeleznikar, S. (2008) Opportunities for promoting anddeveloping community renewable projects in Sheffield: Smallhydroelectric schemes. Report to the Sheffield CommunityRenewables Group. Department for EnvironmentalManagement, Sheffield Hallam University.
page 66 | Peak Power
References
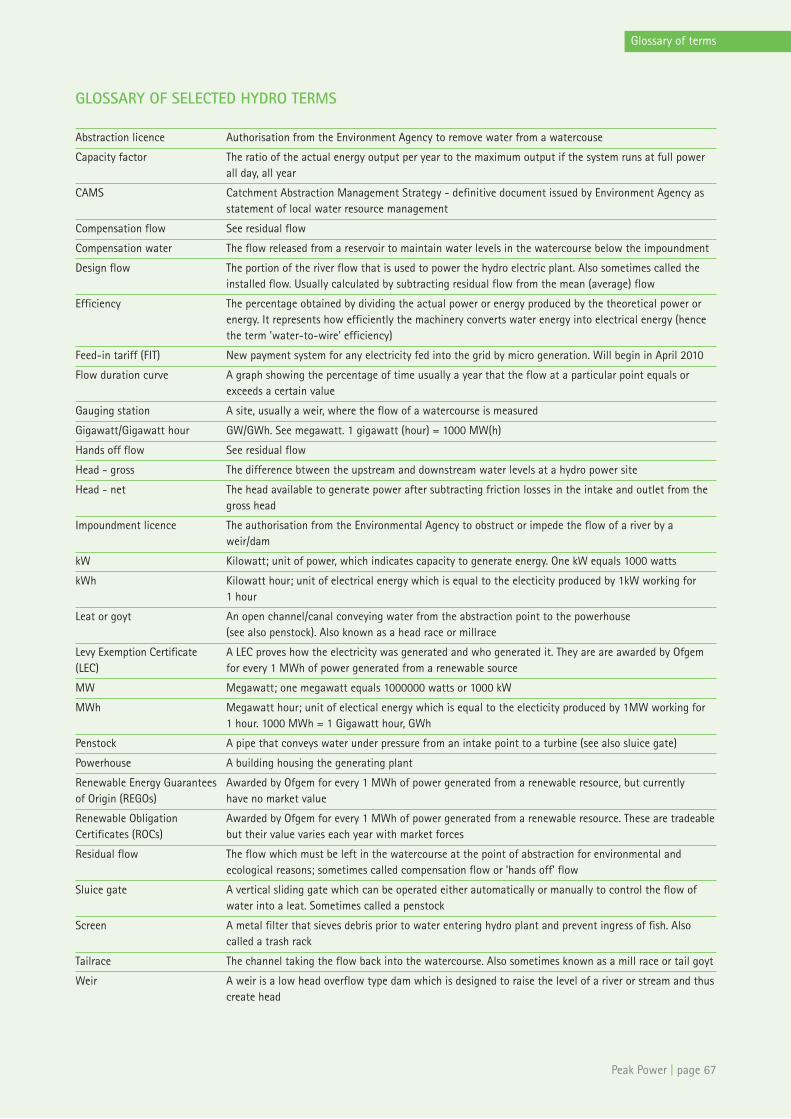
Peak Power | page 67
Glossary of terms
GLOSSARY OF SELECTED HYDRO TERMS
Abstraction licence Authorisation from the Environment Agency to remove water from a watercouse
Capacity factor The ratio of the actual energy output per year to the maximum output if the system runs at full powerall day, all year
CAMS Catchment Abstraction Management Strategy - definitive document issued by Environment Agency asstatement of local water resource management
Compensation flow See residual flow
Compensation water The flow released from a reservoir to maintain water levels in the watercourse below the impoundment
Design flow The portion of the river flow that is used to power the hydro electric plant. Also sometimes called theinstalled flow. Usually calculated by subtracting residual flow from the mean (average) flow
Efficiency The percentage obtained by dividing the actual power or energy produced by the theoretical power orenergy. It represents how efficiently the machinery converts water energy into electrical energy (hencethe term 'water-to-wire' efficiency)
Feed-in tariff (FIT) New payment system for any electricity fed into the grid by micro generation. Will begin in April 2010
Flow duration curve A graph showing the percentage of time usually a year that the flow at a particular point equals orexceeds a certain value
Gauging station A site, usually a weir, where the flow of a watercourse is measured
Gigawatt/Gigawatt hour GW/GWh. See megawatt. 1 gigawatt (hour) = 1000 MW(h)
Hands off flow See residual flow
Head - gross The difference btween the upstream and downstream water levels at a hydro power site
Head - net The head available to generate power after subtracting friction losses in the intake and outlet from the gross head
Impoundment licence The authorisation from the Environmental Agency to obstruct or impede the flow of a river by aweir/dam
kW Kilowatt; unit of power, which indicates capacity to generate energy. One kW equals 1000 watts
kWh Kilowatt hour; unit of electrical energy which is equal to the electicity produced by 1kW working for 1 hour
Leat or goyt An open channel/canal conveying water from the abstraction point to the powerhouse (see also penstock). Also known as a head race or millrace
Levy Exemption Certificate A LEC proves how the electricity was generated and who generated it. They are are awarded by Ofgem(LEC) for every 1 MWh of power generated from a renewable source
MW Megawatt; one megawatt equals 1000000 watts or 1000 kW
MWh Megawatt hour; unit of electical energy which is equal to the electicity produced by 1MW working for 1 hour. 1000 MWh = 1 Gigawatt hour, GWh
Penstock A pipe that conveys water under pressure from an intake point to a turbine (see also sluice gate)
Powerhouse A building housing the generating plant
Renewable Energy Guarantees Awarded by Ofgem for every 1 MWh of power generated from a renewable resource, but currently of Origin (REGOs) have no market value
Renewable Obligation Awarded by Ofgem for every 1 MWh of power generated from a renewable resource. These are tradeableCertificates (ROCs) but their value varies each year with market forces
Residual flow The flow which must be left in the watercourse at the point of abstraction for environmental andecological reasons; sometimes called compensation flow or 'hands off' flow
Sluice gate A vertical sliding gate which can be operated either automatically or manually to control the flow ofwater into a leat. Sometimes called a penstock
Screen A metal filter that sieves debris prior to water entering hydro plant and prevent ingress of fish. Alsocalled a trash rack
Tailrace The channel taking the flow back into the watercourse. Also sometimes known as a mill race or tail goyt
Weir A weir is a low head overflow type dam which is designed to raise the level of a river or stream and thuscreate head

page 68 | Peak Power
Appendix A
Appe
ndix
A1:
Pot
entia
l old
mill
mic
ro h
ydro
pow
er s
ites
with
in t
he P
eak
Dist
rict
Nat
iona
l Par
k
Coun
tyDi
stric
t or
Tow
nM
ill N
ame
NGR
Ref
No
Rive
r Sy
stem
Trib
utar
ySo
urce
Cate
gory
*N
otes
Ches
hire
Dane
brid
geW
hite
lee
Mill
SJ 9
60 6
50M
93Da
neM
ills
Trus
ta
No
mill
, upp
er w
eir a
nd a
djac
ent
feed
er o
wne
d by
Brit
ish
Wat
erw
ays
- se
e ca
se s
tudy
Ches
hire
Rain
owG
incl
ough
Mill
SJ 9
58 7
64M
1De
anH
ayes
Clo
ugh
Bolli
ngto
n Ci
vic
Soci
ety
aCe
ased
pro
duct
ion
1890
, pro
pert
yre
nova
ted,
infr
astr
uctu
re s
till i
npl
ace
Ches
hire
Wild
boar
clou
ghCr
ag W
orks
SJ 9
83 6
87M
99Da
neCl
ough
Bro
okFP
Db
Wor
ks d
emol
ishe
d, n
o w
eirs
or
infr
astr
uctu
re b
ut m
ill p
ond
exta
ntDe
rbys
hire
Ashf
ord
in t
he W
ater
Ashf
ord
Bobb
in M
illSK
182
697
M3
Derw
ent
Wye
Mill
s Tr
ust
aLe
ats
and
whe
els
inta
ct, E
Aga
ugin
g st
atio
n ad
jace
nt t
o m
illDe
rbys
hire
Ashf
ord
in t
he W
ater
Com
b M
illSK
190
694
M45
Derw
ent
Wye
Mill
s Tr
ust
aM
ill d
emol
ishe
d bu
t w
eirs
and
som
e in
fras
truc
ture
in p
lace
Derb
yshi
reAs
hfor
d in
the
Wat
erFl
ewitt
's M
illSK
198
695
M4
Derw
ent
Wye
Mill
s Tr
ust
aEx
istin
g tu
rbin
e be
ing
refu
rbis
hed
for r
e-us
e (a
utum
n 20
09);
also
calle
d As
hfor
d O
ld M
illDe
rbys
hire
Bake
wel
lLu
mfo
rd M
illSK
213
691
M5
Derw
ent
Wye
Mill
s Tr
ust
aIn
dust
rial s
ite, o
rigin
al t
win
whe
els
gene
rate
d 90
kW
- s
eeca
se s
tudy
tex
tDe
rbys
hire
Bake
wel
lRu
tland
Mill
SK 2
20 6
85M
6De
rwen
tW
yeM
ills
Trus
ta
Now
off
ices
, tur
bine
rem
oved
but
c.1.
5-2m
hea
d w
ith in
let
and
tailr
ace
in p
lace
Derb
yshi
reBa
kew
ell
Vict
oria
Mill
SK 2
16 6
88M
7De
rwen
tW
yeM
ills
Trus
ta
Conv
erte
d in
to fl
ats
but
leat
etc
inpl
ace;
est
imat
es s
ugge
st 1
0-20
kW p
oten
tial
Derb
yshi
reBa
mfo
rdBa
mfo
rd M
illSK
205
833
M8
Derw
ent
Mill
s Tr
ust
aCo
nver
ted
into
flat
s, w
eir i
n pl
ace,
leat
/tai
lrace
inco
mpl
ete
- se
e ca
sest
udy
text
Derb
yshi
reBa
slow
Hea
thy
Lea
Saw
Mill
SK 2
72 7
21M
38De
rwen
tH
eath
y Le
a Br
ook
Giff
ord
bDe
relic
t m
ill b
ut w
eir e
xtan
t, c.
4m h
ead
Derb
yshi
reBa
slow
Hod
gkin
son'
s M
illSK
250
724
M9
Derw
ent
Giff
ord
aG
ood
infr
astr
uctu
re a
nd w
eir,
1930
s tu
rbin
e st
ill in
situ
, als
oca
lled
Old
Mill
, Bas
low
Derb
yshi
reBl
ackw
ell
Blac
kwel
l Mill
, Wye
Dal
eSK
113
727
M10
Derw
ent
Wye
Giff
ord
aW
eir (
1.2m
) but
no
othe
rin
fras
truc
ture
app
aren
tDe
rbys
hire
Brad
wel
lBu
tts
Mill
SK 1
73 8
12M
11De
rwen
tBr
adw
ell B
rook
Mill
s Tr
ust
bDe
relic
t bu
ildin
g as
trid
e Br
adw
ell
Broo
k, lo
w fl
ows
Derb
yshi
reBr
adw
ell
Stre
tfie
ld M
illSK
178
820
M13
Derw
ent
Brad
wel
l Bro
okM
ills
Trus
tb
Mill
pon
d st
ill t
here
but
all
othe
rin
fras
truc
ture
lost
Derb
yshi
reBr
ough
Brou
gh (V
ince
nt W
orks
) Mill
SK 1
84 8
25De
rwen
tBr
adw
ell B
rook
Mill
s Tr
ust
aN
ow B
roug
h Bu
sine
ss C
entr
e;fe
asib
ility
stu
dy b
y De
rwen
t H
ydro
estim
ated
11
kW
Cont
inue
d…

Appe
ndix
A1:
Pot
entia
l old
mill
mic
ro h
ydro
pow
er s
ites
with
in t
he P
eak
Dist
rict
Nat
iona
l Par
k (c
ontin
ued)
Coun
tyDi
stric
t or
Tow
nM
ill N
ame
NGR
Ref
No
Rive
r Sy
stem
Trib
utar
ySo
urce
Cate
gory
*N
otes
Derb
yshi
reBr
ough
Brou
gh M
illSK
184
826
M12
Derw
ent
Noe
Giff
ord
aN
ow W
m E
yre
& S
ons
Coun
try
Stor
e bu
t w
eir a
nd w
heel
stil
l in
pla
ceDe
rbys
hire
Calv
erCa
lver
Cor
n M
illSK
245
743
Derw
ent
Calv
er M
ill S
ough
Giff
ord
aN
ow re
side
ntia
l pro
pert
y bu
tin
fras
truc
ture
stil
l in
plac
e,
low
flow
sDe
rbys
hire
Calv
erCa
lver
Mill
SK 2
47 7
45M
14De
rwen
tM
ills
Trus
ta
Long
dep
lete
d re
ach
appr
ox.1
km,
in w
eir s
chem
e on
reno
vate
d w
eir
may
be
bett
erDe
rbys
hire
Chat
swor
thEd
enso
r Mill
SK 2
60 6
88M
15De
rwen
tM
ills
Trus
ta
Dere
lict
build
ing
but
wei
r and
leat
still
in p
lace
- s
ee c
ase
stud
y te
xtDe
rbys
hire
Cres
sbro
okCr
essb
rook
Mill
SK 1
73 7
27M
16De
rwen
tW
yeM
ills
Trus
ta
Conv
erte
d in
to fl
ats,
infr
astr
uctu
rean
d tu
rbin
es s
till i
n pl
ace
Derb
yshi
reCr
owde
nPa
per M
illSK
079
990
M18
Ethe
row
Fair
Vage
Gut
ter
Mill
s Tr
ust
aN
ow re
side
ntia
l pro
pert
y; lo
w fl
owbu
t c.
8-10
m h
ead
Derb
yshi
reEd
ale
Edal
e M
illSK
133
853
M40
Derw
ent
Noe
Mill
s Tr
ust
aCo
nver
ted
into
flat
s, no
infr
astr
uctu
re re
mai
ning
bar
silt
edup
mill
pon
dDe
rbys
hire
Grin
dlef
ord
Padl
ey M
illSK
251
789
M19
Derw
ent
Padl
ey B
rook
Mill
s Tr
ust
aN
ow re
side
ntia
l pro
pert
y; n
ow
heel
but
whe
elpi
t pl
us m
ost
infr
astr
uctu
re in
tact
Derb
yshi
reH
athe
rsag
eLe
ad M
illSK
233
807
M21
Derw
ent
Mill
s Tr
ust
aN
ow re
side
ntia
l pro
pert
y, go
yt/
tailr
ace
in p
lace
tho
ugh
wei
r in
very
poo
r con
ditio
nDe
rbys
hire
Kett
lesh
ulm
eLu
mbh
ole
Mill
SJ 9
88 8
04M
22G
oyt
Todd
Bro
okM
ills
Trus
ta
Dere
lict
med
ium
siz
ed m
ill b
utpo
tent
ial f
or c
onve
rsio
n an
d hy
dro
Derb
yshi
reLo
ngno
rO
ld S
aw M
illSK
085
646
M23
Dove
Man
ifold
Mill
s Tr
ust
aBe
ing
reno
vate
d; w
heel
rest
ored
plus
gen
erat
or in
stal
led
Derb
yshi
reM
iller
s Da
leLi
tton
Mill
SK 1
61 7
29M
24De
rwen
tW
yeM
ills
Trus
ta
Inle
t w
orks
and
tai
lrace
in p
lace
Derb
yshi
reM
iller
s Da
leM
iller
s Da
le M
eal M
illSK
142
733
M41
Derw
ent
Wye
Mill
s Tr
ust
bN
ow s
ewag
e pu
mpi
ng s
tatio
n bu
tw
heel
and
leat
stil
l the
reDe
rbys
hire
Row
arth
Litt
le M
illSK
011
890
M25
Goy
tM
ills
Trus
ta
Conv
erte
d to
inn
(199
2) w
ithde
mon
stra
tion
10m
bre
asts
hot
whe
el, w
eir a
nd le
at in
pla
ce
Derb
yshi
reRo
wsl
eyCa
udw
ell's
Mill
SK 2
55 6
57M
26De
rwen
tW
yeM
ills
Trus
ta
Two
hist
oric
tur
bine
s, op
tions
to
incr
ease
cap
acity
- s
ee c
ase
stud
yte
xtDe
rbys
hire
Ston
ey M
iddl
eton
Ston
ey M
iddl
eton
Mill
SK 2
30 7
55M
29De
rwen
tSt
oke
Broo
kG
iffor
da
Subj
ect
of D
erw
ent
Hyd
rofe
asib
ility
stu
dy, e
stim
ated
4 k
W
Peak Power | page 69
Cont
inue
d…
Appendix A

Appendix A
page 70 | Peak Power
Appe
ndix
A1:
Pot
entia
l old
mill
mic
ro h
ydro
pow
er s
ites
with
in t
he P
eak
Dist
rict
Nat
iona
l Par
k (c
ontin
ued)
Coun
tyDi
stric
t or
Tow
nM
ill N
ame
NGR
Ref
No
Rive
r Sy
stem
Trib
utar
ySo
urce
Cate
gory
*N
otes
Derb
yshi
reU
pper
Hul
me
Dain
's M
illSK
012
613
M27
Chur
net
Mill
s Tr
ust
aRe
nova
ted
whe
el in
pla
ceDe
rbys
hire
Wet
ton
Wet
ton
Mill
SK 0
96 5
61M
28Do
veM
anifo
ldM
ills
Trus
tb
Old
mill
bui
ldin
g on
site
but
infr
astr
uctu
re, i
nclu
ding
wei
r, lo
st
Lanc
ashi
reDi
ggle
Digg
le M
illSE
017
080
M30
Tam
eDi
ggle
Bro
okM
ills
Trus
ta
Dere
lict
mill
bui
ldin
g, le
at a
nd m
illpo
nd in
pla
ce -
see
cas
e st
udy
text
W Y
orks
hire
Mel
tham
Pann
a M
illSE
088
106
Hol
me
Mel
tham
Dyk
ePi
tLa
Wei
rs in
tact
, rem
aini
ng m
illbu
ildin
gs n
ow re
side
nces
, pow
eres
timat
e <5
kW
S Yo
rksh
ireLo
w B
radf
ield
Low
Bra
dfie
ld M
illSK
264
918
M31
Don
Loxl
eyFP
Da
No
mill
but
2m
wei
r and
som
ein
fras
truc
ture
, low
flow
sSt
affo
rdsh
ireG
radb
ach
Gra
dbac
h M
illSJ
993
660
M33
Dane
Mill
s Tr
ust
bN
ow y
outh
hos
tel,
exte
nsiv
ein
fras
truc
ture
but
in p
oor
cond
ition
, low
flow
Staf
ford
shire
Hea
ton
Bear
da M
illSJ
963
641
M34
Dane
unna
med
trib
utar
yM
ills
Trus
ta
Now
resi
dent
ial p
rope
rty
with
non-
wor
king
bre
asts
hot
whe
el s
till
in p
lace
.St
affo
rdsh
ireM
illda
leLo
de M
illSK
146
551
M36
Dove
Mill
s Tr
ust
aM
ill s
ubje
ct o
f pla
nnin
gap
plic
atio
n to
con
vert
with
out
hydr
o (a
utum
n 20
09)
Staf
ford
shire
One
cote
One
cote
Mill
SK 0
47 5
54M
37Do
veH
amps
Mill
s Tr
ust
aM
ill d
emol
ishe
d bu
t w
eir s
till t
here
Sour
ces
FPD
= id
entif
ied
in c
ours
e of
pro
ject
Mill
s Tr
ust
= M
ills
Arch
ive
Trus
t: w
ww
.mill
arch
ive.
com
G
iffor
d =
Giff
ord
A. (1
999)
Der
bysh
ire W
ater
mill
s,Th
e M
idla
nd W
ind
& W
ater
Mill
s G
roup
PitL
= P
ower
from
the
Lan
dsca
pe (s
ee w
ww
.pow
erfr
omth
elan
dsca
pe.c
o.uk
)* s
ee s
ectio
n 5.
4.1,
p.3
4 fo
r an
expl
anat
ion
of c
ateg
orie
s a,
b

Appe
ndix
A2:
Pot
entia
l mic
ro h
ydro
site
s ou
tsid
e th
e Pe
ak D
istr
ict
Nat
iona
l Par
k
Coun
tyDi
stric
t or
Tow
nM
ill N
ame
NGR
Ref
No
Rive
r Sy
stem
Trib
utar
yCa
tego
ry*
Sour
ceN
otes
Ches
hire
Bolli
ngto
nIn
gers
ley
Road
SJ 9
36 7
79De
anH
arro
p Br
ook
aBC
RBC
R es
timat
e 27
kW
on
22m
hea
d w
ithc.
800m
dep
lete
d re
ach
Ches
hire
Bolli
ngto
nIn
gers
ley
Vale
SJ 9
36 7
79De
anb
BCR
BCR
estim
ate
3.4
kW o
n c.
2m h
ead
with
50m
dep
lete
d re
ach
Ches
hire
Bolli
ngto
nLo
wer
hous
e M
illSJ
921
777
Dean
aBC
RBC
R es
timat
e 9
kW o
n 3m
hea
d w
ith
in-w
eir s
olut
ion
Ches
hire
Bolli
ngto
nRe
crea
tion
Gro
und
SJ 9
32 7
79De
anH
arro
p Br
ook
bBC
RBC
R es
timat
e 3.
1 kW
on
1.3m
hea
d w
ithin
-wei
r sol
utio
nCh
eshi
reBo
lling
ton
Wau
lkm
ill F
arm
SJ 9
43 7
70O
1De
anb
BCR
BCR
estim
ate
27 k
W o
n 16
m h
ead
but
c.1k
m d
eple
ted
reac
hDe
rbys
hire
Bons
all
Bons
all M
ill/V
ia G
ellia
Mill
sSK
284
574
O12
Derw
ent
Bons
all B
rook
bFP
DVi
a G
ellia
Mill
s no
w in
dust
rial u
nits
but
infr
astr
uctu
re s
till i
n pl
ace
- se
e ca
se s
tudy
Derb
yshi
reCh
apel
-en-
le-F
rith
Brid
geho
lm G
reen
SK 0
51 8
18G
oyt
Mill
s Tr
ust
Not
vis
ited
Derb
yshi
reCh
apel
-en-
le-F
rith
Com
bs R
eser
voir
SK 0
34 7
98G
oyt
FPD
Briti
sh W
ater
way
s re
serv
oir w
ith p
opul
aram
enity
use
(sai
ling)
Derb
yshi
reCr
omfo
rdCr
omfo
rd C
orn
Mill
SK 2
92 5
70O
13De
rwen
tBo
nsal
l Bro
oka
Mill
s Tr
ust
11 k
W s
chem
e be
ing
deve
lope
d by
Arkw
right
Soc
iety
Derb
yshi
reH
ayfie
ldH
ayfie
ld w
eir
SK 0
37 8
70O
2G
oyt
Kind
era
FPD
Old
wei
r 3-3
.5m
hig
h, p
ossi
ble
old
mill
at
side
, ver
y po
or a
cces
sDe
rbys
hire
Mill
thor
peM
illth
orpe
wei
rSK
312
764
O15
Roth
erM
illth
orpe
Bro
oka
FPD
2m w
eir f
or o
ld M
illth
orpe
Mill
- s
ee c
ase
stud
y te
xtLa
ncas
hire
Hol
lingw
orth
Hol
lingw
orth
wei
rSK
013
963
O3
Ethe
row
aM
ills
Trus
tSt
one
wei
r in
good
con
ditio
n 3m
hea
dS
York
sSh
effie
ldM
ore
Hal
l Res
ervo
irSK
287
956
O5
Don
Ewde
n Be
cka
SCR/
IT P
ower
IT P
ower
stu
dy e
stim
ated
41
kW c
apac
ityw
ith m
ean
flow
0.2
9 m
3 /s
on 2
0m h
ead
S Yo
rks
Shef
field
Old
Whe
el F
arm
1SK
297
899
Don
Loxl
eySC
R/IT
Pow
erN
o ou
tput
sta
ted
in IT
Pow
er s
tudy
but
mea
n flo
w e
stim
ated
as
0.56
m3 /
sS
York
sSh
effie
ldO
ld W
heel
Far
m 2
SK 2
87 9
03Do
nLo
xley
SCR/
IT P
ower
ditt
oS
York
sSh
effie
ldO
live
Mill
SK 3
06 8
94Do
nLo
xley
SCR/
IT P
ower
ditt
oS
York
sSh
effie
ldRi
velin
Dam
sSK
276
869
O6
Don
Rive
lina
SCR/
IT P
ower
IT P
ower
est
imat
ed 1
9 kW
with
mea
n flo
w0.
11 m
3 /s
on 2
5m h
ead
S Yo
rks
Shef
field
Rive
lin M
illSK
291
872
O11
Don
Rive
lina
SCR/
IT P
ower
Just
out
side
NP
boun
dary
, ver
y lo
w h
ead
(<1.
2m)
S Yo
rks
Shef
field
Rive
lin V
alle
y Ea
stSK
323
887
O7
Don
Rive
lina
SCR/
IT P
ower
IT P
ower
stu
dy e
stim
ated
10
kW w
ith m
ean
flow
1.1
m3 /
s on
1.3
m h
ead
S Yo
rks
Shef
field
Rive
lin W
ater
Tre
atm
ent W
orks
SK 2
87 8
68O
8Do
nRi
velin
aSC
R/IT
Pow
erIT
Pow
er s
tudy
est
imat
ed 1
9 kW
on
mea
nflo
w 0
.55
m3 /
s on
5m
hea
d S
York
sSh
effie
ldLo
xley
Riv
er, W
isew
ood
Forg
eSK
318
897
O4
Don
Loxl
eya
SCR/
IT P
ower
IT P
ower
stu
dy e
stim
ated
11
kW o
n m
ean
flow
0.5
6 m
3 /s
on 2
.8m
hea
d
Cont
inue
d…
Appendix A
Peak Power | page 71

Appendix A
page 72 | Peak Power
Appe
ndix
A2:
Pot
entia
l mic
ro h
ydro
site
s ou
tsid
e th
e Pe
ak D
istr
ict
Nat
iona
l Par
k (c
ontin
ued)
Coun
tyDi
stric
t or
Tow
nM
ill N
ame
NGR
Ref
No
Rive
r Sy
stem
Trib
utar
yCa
tego
ry*
Sour
ceN
otes
Staf
ford
shire
Map
plet
onO
keov
er M
illSK
162
481
O14
Dove
aM
ills
Trus
tM
ill a
nd in
fras
truc
ture
in g
ood
cond
ition
Staf
ford
shire
Wat
erho
uses
Cald
on M
illSK
078
502
Dove
Ham
psM
ills
Trus
tN
ot v
isite
dW
Yor
ksH
olm
firth
Bott
oms
wei
rSE
135
076
O9
Hol
me
aFP
DW
eir n
eeds
som
e re
pair,
3m
hea
dW
Yor
ksM
arsd
enM
arsd
en t
own
wei
rSE
048
116
O10
Coln
eBu
tter
ley
Broo
ka
FPD
Ston
e w
eir i
n ce
ntre
of t
own,
2.5
m h
ead,
low
flow
- s
ee c
ase
stud
y te
xt
Sour
ces
Bolli
ngto
n Ca
rbon
Rev
olut
ion
(Lei
gh, 2
008)
Fea
sibi
lity
Stud
y fo
r Hyd
ropo
wer
Pot
entia
l in
Bolli
ngto
n, J
oule
Cen
tre,
Lan
cast
erSh
effie
ld C
omm
unity
Ren
ewab
les
Gro
up (Z
elez
nika
r, 20
08),
Smal
l Hyd
roel
ectr
ic S
chem
es, S
heff
ield
Hal
lam
Uni
vers
ity, S
heff
ield
IT P
ower
(200
6) R
enew
able
Ene
rgy
Scop
ing
and
Feas
ibili
ty S
tudy
for S
heff
ield
, IT
Pow
er re
port
for S
heff
ield
City
Cou
ncil
Mill
s Tr
ust
= M
ills
Arch
ive
Trus
t: w
ww
.mill
arch
ive.
com
FP
D =
Site
iden
tifie
d in
cou
rse
of p
roje
ct* s
ee s
ectio
n 5.
4.1,
p.3
4 fo
r an
expl
anat
ion
of c
ateg
orie
s a,
b

Appe
ndix
A3
Pote
ntia
l non
-mill
site
s w
ithin
the
Pea
k Di
stric
t N
atio
nal P
ark
Coun
tyDi
stric
t or
Tow
nSi
te N
ame
NGR
Ref
No
Rive
r Sy
stem
Trib
utar
ySo
urce
Cate
gory
*N
otes
Derb
yshi
reW
oodl
ands
Val
ley
Alpo
rt D
ale
Derw
ent
Swin
t Cl
ough
SK 1
35 9
11N
T/co
mm
unity
bLo
w fl
ow h
igh
head
sch
eme,
<5
kWDe
rbys
hire
Woo
dlan
ds V
alle
yAl
port
Brid
geN
7De
rwen
tAl
port
SK 1
41 8
97FP
D/co
mm
unity
bW
eir p
lus
leat
bel
ongs
to
Seve
rn T
rent
W
ater
Derb
yshi
reBa
slow
Bar B
rook
, nr B
aslo
wN
1De
rwen
tBa
r Bro
okSK
263
730
(PH
)ET
SUc
Envi
ronm
enta
l con
side
ratio
ns m
ay ru
le o
ut;
SK 2
76 7
39 (I
nt.)
95/8
8kW
estim
ated
Derb
yshi
reCh
atsw
orth
Chat
swor
th H
ouse
N3
Derw
ent
Empe
ror S
trea
mSK
259
699
(PH
)ET
SUa
Upg
rade
of e
xist
ing
Chat
swor
th s
chem
eSK
267
702
(Int
.)De
rbys
hire
Crow
den
Crow
den
N13
Ethe
row
Crow
den
Broo
kSK
070
995
FPD
cW
eir c
ompl
ex b
elon
ging
to
Uni
ted
Util
ities
Derb
yshi
reCr
owde
nPi
kena
ze F
arm
N14
Ethe
row
With
ens
Broo
kSK
096
004
FPD
cW
eir c
ompl
ex b
elon
ging
to
Uni
ted
Util
ities
Derb
yshi
reEd
ale
Gre
enla
nds
Farm
N10
Noe
Har
den
Clou
ghSK
125
844
Ow
ner
bLo
w fl
ow h
igh
head
sch
eme,
c.1
kW
Derb
yshi
reEd
ale
Grin
ds B
rook
N15
Noe
Grin
ds B
rook
SK 1
21 8
63FP
D/ow
ner
bLo
w fl
ow h
igh
head
sch
eme
Derb
yshi
reG
rindl
efor
dPa
dley
Gor
geN
5De
rwen
tBu
rbag
e Br
ook
SK 2
51 7
89 (P
H)
ETSU
cEn
viro
nmen
tal c
onsi
dera
tions
may
rule
out
;SK
257
800
(Int
.)10
0/10
6kW
est
imat
ed
Derb
yshi
reIla
mIla
m C
hurc
hN
11Do
veSK
132
505
Derw
ent
Hyd
roa
Feas
ibili
ty s
tudy
by
Derw
ent
Hyd
ro; 8
kW
Derb
yshi
reLi
ttle
Lon
gsto
neM
onsa
l Dal
e W
yeSK
176
714
LUC/
ITP
bW
eir o
nly
in s
ensi
tive
envi
ronm
enta
l are
aDe
rbys
hire
Shel
don
Mag
pie
Soug
hW
yeSK
179
686
FPD
bCo
uld
be li
nked
with
Ash
ford
Bob
bin
Mill
sche
me
Derb
yshi
reO
ver H
addo
nU
pper
Lat
hkill
Dal
eN
6La
thki
llSK
177
655
ETSU
cU
nlik
ely
site
due
to
envi
ronm
enta
lco
nstr
aint
sDe
rbys
hire
Ove
r Had
don
Rape
r Lod
geLa
thki
llSK
214
653
SYb
11-1
4 kW
est
imat
ed b
y st
udy
for
Sust
aina
ble
Youl
grea
veLa
ncas
hire
Gre
enfie
ldDo
vest
one
Res
ervo
irTa
me
Gre
enfie
ld B
rook
SE 0
04 0
36Co
mm
unity
aCo
mpe
nsat
ion
wat
er fl
ow fr
om re
serv
oir
Staf
ford
shire
Gra
dbac
hM
anor
Far
mDa
neSK
004
663
WRE
/ow
ner
aIn
itial
des
ign
com
plet
ed; 1
2 kW
NT
= N
atio
nal T
rust
FPD
= si
te id
entif
ied
in c
ours
e of
pro
ject
ETSU
= S
alfo
rd U
nive
rsity
stu
dy (1
989)
LUC/
ITP
= ca
paci
ty s
tudy
for E
ast
Mid
land
s re
gion
(200
1)SY
= S
usta
inab
le Y
oulg
reav
eW
RE =
Wes
tern
Ren
ewab
le E
nerg
yPH
= P
ower
hous
eIn
t. =
Inta
ke* s
ee s
ectio
n 5.
4.1,
p.3
4 fo
r an
expl
anat
ion
of c
ateg
orie
s a,
b, c
Appendix A
Peak Power | page 73

Appendix A
page 74 | Peak Power
Appe
ndix
A4:
Old
mill
site
s w
ith li
ttle
/no
mic
ro h
ydro
pot
entia
l
Coun
tyDi
stric
t or
Tow
nM
ill N
ame
NGR
Ref
No
Rive
r Sy
stem
Trib
utar
ySo
urce
Cate
gory
*N
otes
INSI
DE N
ATIO
NAL
PAR
KCh
eshi
rePo
tt S
hrig
ley
Pott
Mill
SJ 9
47 7
96M
42M
ills
Trus
tc
Smal
l str
eam
, no
infr
astr
uctu
reCh
eshi
reRa
inow
Corn
Mill
SJ 9
49 7
57De
anH
erita
gec
Dem
olis
hed
Derb
yshi
reAb
ney
Corn
Mill
SK 2
14 7
95M
71De
rwen
tH
ighl
ow B
rook
Mill
s Tr
ust
cRe
mot
e sm
all s
trea
mDe
rbys
hire
Ashf
ord
in t
he W
ater
SK 1
81 6
96M
44De
rwen
tW
yeM
ills
Trus
tc
Refe
rs t
o w
ater
pum
ping
whe
elad
jace
nt A
shfo
rd B
obbi
n M
ill
(site
M3)
Derb
yshi
reAs
hfor
d in
the
Wat
erSK
193
698
Derw
ent
Wye
ETSU
cVe
ry li
ttle
infr
astr
uctu
re,
very
low
hea
dDe
rbys
hire
Basl
owBa
rbro
ok S
mel
ting
Mill
SK 2
68 7
34De
rwen
tBa
r Bro
okH
erita
gec
Dem
olis
hed
Derb
yshi
reBi
rcho
ver
Birc
hove
r Mill
SK 2
32 6
26M
46De
rwen
tIv
y Ba
r Bro
okG
iffor
dc
Dere
lict
site
, sm
all f
low
, no
pot
entia
lDe
rbys
hire
Brad
wel
lBu
mp
Mill
SK17
6 81
7De
rwen
tBr
adw
ell B
rook
Her
itage
cDe
mol
ishe
dDe
rbys
hire
Cast
leto
nCa
stle
ton
Mill
SK 1
51 8
31M
55De
rwen
tPe
aksh
ole
Wat
erM
ills
Trus
tc
No
infr
astr
uctu
re, n
ow c
onve
rted
to h
ouse
Derb
yshi
reCa
stle
ton
Saw
Mill
SK 1
51 8
31De
rwen
tPe
aksh
ole
Wat
erH
erita
gec
Dem
olis
hed,
was
adj
acen
t to
co
rn m
illDe
rbys
hire
Char
lest
own,
Glo
ssop
Gna
thol
e M
illSK
039
924
M58
Ethe
row
Bray
Clo
ugh
Mill
s Tr
ust
cCo
nver
ted
into
hom
es;
no in
fras
truc
ture
left
Derb
yshi
reCr
owde
cote
Crow
deco
te M
illSK
100
651
M60
Dove
Giff
ord
cN
ot fo
und
Derb
yshi
reCu
rbar
Bar B
rook
Mill
SK 2
75 7
39M
61De
rwen
tBa
r Bro
okM
ills
Trus
tc
Mill
foun
datio
ns p
lus
rem
ains
of
pon
d/go
yt, i
ntak
e po
int
for
Bar B
rook
(si
te N
1)De
rbys
hire
Frog
gatt
Slag
Mill
SK 2
47 7
71De
rwen
tH
erita
gec
Dem
olis
hed
Derb
yshi
reG
lutt
on B
ridge
Corn
Mill
SK 0
84 6
65Do
veH
erita
gec
Dem
olis
hed
Derb
yshi
reG
rang
emill
Gra
nge
Mill
SK 2
43 5
77M
64De
rwen
tM
ills
Trus
tc
Dere
lict
with
pon
d, s
mal
l fee
der
stre
am, n
o po
tent
ial
Derb
yshi
reG
reen
Fai
rfie
ldDa
le E
nd M
illSK
085
726
M65
Derw
ent
Wye
Giff
ord
cN
o po
tent
ial
Derb
yshi
reG
reen
Fai
rfie
ldPi
ctor
Hal
lSK
093
725
M66
Derw
ent
Wye
Mill
s Tr
ust
cW
eir l
eft
but
no p
oten
tial
Derb
yshi
reG
rindl
efor
dG
rindl
efor
d M
illSK
241
790
Derw
ent
ETSU
cN
o in
fras
truc
ture
or w
eir a
ppar
ent
Derb
yshi
reH
artin
gton
Ludw
ell C
orn
Mill
SK 1
24 6
23M
77Do
veM
ills
Trus
tc
Dem
olis
hed
Derb
yshi
reH
athe
rsag
eDa
le M
illSK
235
817
Derw
ent
Her
itage
cCo
nver
ted
into
hou
seDe
rbys
hire
Hay
field
Bank
Val
e M
illSK
031
875
M69
Goy
tSe
ttM
ills
Trus
tc
Dem
olis
hed
Derb
yshi
reH
ope
Hop
e M
illSK
174
838
M72
Derw
ent
Noe
Giff
ord
cCo
nver
ted
into
hom
es, n
oin
fras
truc
ture
left
, als
o kn
own
as K
ilhill
Brid
ge M
ill
Cont
inue
d…

Appe
ndix
A4:
Old
mill
site
s w
ith li
ttle
/no
mic
ro h
ydro
pot
entia
l (co
ntin
ued)
Coun
tyDi
stric
t or
Tow
nM
ill N
ame
NGR
Ref
No
Rive
r Sy
stem
Trib
utar
ySo
urce
Cate
gory
*N
otes
Derb
yshi
reIb
leLo
de M
illSK
246
569
M73
Derw
ent
Mill
s Tr
ust
cCo
mpl
etel
y de
relic
t no
pot
entia
lDe
rbys
hire
Litt
le H
ayfie
ldSK
031
880
M74
Goy
tSe
ttFP
Dc
Larg
e m
ill c
onve
rted
into
flat
s, no
infr
astr
uctu
reDe
rbys
hire
Long
nor?
SK 0
00 6
71M
76G
oyt
Dane
Mill
s Tr
ust
cN
ot fo
und,
grid
refe
renc
ein
corr
ect?
If c
orre
ct, s
ite is
inQ
uarn
ford
, Sta
ffs.
Derb
yshi
reM
iddl
eton
SK 1
99 6
36M
78De
rwen
tBr
adfo
rdM
ills
Trus
tc
Dere
lict
site
, som
e in
fras
truc
ture
Derb
yshi
reM
iddl
eton
SK 1
99 6
33M
79De
rwen
tBr
adfo
rdM
ills
Trus
tc
Dere
lict
site
, som
e in
fras
truc
ture
Derb
yshi
reM
iller
s Da
leSK
127
732
Derw
ent
Wye
ETSU
cVe
ry re
mot
e si
te, l
ow h
ead
and
envi
ronm
enta
l con
stra
ints
Derb
yshi
reM
iller
s Da
leW
orm
hill
Mill
SK 1
37 7
32M
80De
rwen
tW
yeM
ills
Trus
tc
Now
cra
ft s
hop
with
all
leat
s et
cei
ther
dem
olis
hed
or fi
lled
inDe
rbys
hire
Out
seat
s, H
athe
rsag
eG
reen
's H
ouse
Mill
SK 2
33 8
37M
81De
rwen
tH
ood
Broo
kM
ills
Trus
tc
Rem
ote
smal
l str
eam
Derb
yshi
reO
ver H
addo
nCa
rter
's M
illSK
184
657
M82
Derw
ent
Lath
kill
Mill
s Tr
ust
cN
o po
tent
ial d
ue t
o en
viro
nmen
tal
cons
trai
nts
and
inte
rmitt
ent
flow
sDe
rbys
hire
Ove
r Had
don
Soug
h M
illSK
203
662
M83
Derw
ent
Lath
kill
Mill
s Tr
ust
cN
o po
tent
ial d
ue t
o en
viro
nmen
tal
cons
trai
nts
and
inte
rmitt
ent
flow
sDe
rbys
hire
Peak
For
est
Dam
Dal
eSK
115
787
M84
Derw
ent
Mill
s Tr
ust
cN
o po
tent
ial
Derb
yshi
reSt
anto
n-in
-the
-Pea
kSt
anto
n M
illSK
233
639
M86
Derw
ent
Ivy
Bar B
rook
Mill
s Tr
ust
cCo
nver
ted
into
hou
se; s
mal
l str
eam
Derb
yshi
reSt
oney
Mid
dlet
onLo
rd's
Mill
SK 2
24 7
56M
87De
rwen
tDa
le B
rook
Mill
s Tr
ust
cN
ow R
ock
Mill
Bus
ines
s Pa
rk,
no p
oten
tial
Derb
yshi
reTa
ddin
gton
Old
Mill
SK 1
48 7
09M
88M
ills
Trus
tc
Conv
erte
d in
to h
ouse
; no
sign
of
wat
er s
ourc
eDe
rbys
hire
Thor
peTh
orpe
Mill
SK 1
46 5
05M
89Do
veM
ills
Trus
tc
Dow
nstr
eam
of I
lam
site
(N1)
; no
sig
n of
mill
Derb
yshi
reTi
ssin
gton
Woo
deav
es M
illSK
184
504
Dove
Bent
ley
Broo
kH
erita
gec
Dem
olis
hed
Derb
yshi
reW
inst
erCo
tton
Mill
SK 2
41 6
05De
rwen
tH
erita
gec
Not
foun
dSo
uth
York
shire
Brad
field
Dam
flask
Mill
1Sk
281
908
Don
Loxl
eyFP
Dc
Und
er D
amfla
sk R
eser
voir
Sout
h Yo
rksh
ireBr
adfie
ldDa
mfla
sk M
ill 2
SK 2
78 9
08Do
nLo
xley
FPD
cU
nder
Dam
flask
Res
ervo
irSt
affo
rdsh
ireAl
lgre
ave
Folly
Mill
SJ 9
71 6
64M
43Da
neM
ills
Trus
tc
Not
foun
d; o
n M
AT d
atab
ase
as D
erby
shire
Staf
ford
shire
Goy
tscl
ough
SK 0
12 7
33M
63G
oyt
Mill
s Tr
ust
cIs
olat
ed s
ite n
o si
gn o
f mill
; on
MAT
dat
abas
e as
Der
bysh
ireSt
affo
rdsh
ireG
rindo
nFo
rd M
illSK
067
534
M67
Dove
Ham
psM
ills
Trus
tc
Dem
olis
hed;
on
MAT
dat
abas
e as
Der
bysh
ireSt
affo
rdsh
ireH
artin
gton
Upp
er Q
trFe
rnile
eSK
013
771
M68
Goy
tM
ills
Trus
tc
Floo
ded
by re
serv
oir;
on M
ATda
taba
se a
s De
rbys
hire
Appendix A
Peak Power | page 75
Cont
inue
d…

Appendix A
page 76 | Peak Power
Appe
ndix
A4:
Old
mill
site
s w
ith li
ttle
/no
mic
ro h
ydro
pot
entia
l (co
ntin
ued)
Coun
tyDi
stric
t or
Tow
nM
ill N
ame
NGR
Ref
No
Rive
r Sy
stem
Trib
utar
ySo
urce
Cate
gory
*N
otes
Staf
ford
shire
Cros
sbro
ok M
illSK
005
700
M85
Mill
s Tr
ust
cG
rid re
fere
nce
high
ly s
uspe
ct;
on M
AT d
atab
ase
as D
erby
shire
Staf
ford
shire
Upp
er H
ulm
eU
pper
Hul
me
Mill
SK 0
12 6
09Ch
urne
tH
erita
gec
Not
foun
d; o
n M
AT d
atab
ase
as D
erby
shire
Staf
ford
shire
Alto
nO
ld W
ire M
illSK
000
742
M92
Mill
s Tr
ust
cG
rid re
fere
nce
high
ly s
uspe
ctSt
affo
rdsh
ireFa
wfie
ldhe
adLu
dbur
n M
illSK
094
626
M94
Dove
Man
ifold
Mill
s Tr
ust
cN
o tr
ace
of in
fras
truc
ture
Staf
ford
shire
Mee
rbro
okCo
rn M
illSJ
993
607
Chur
net
Her
itage
cU
nder
Titt
esw
orth
Res
ervo
irSt
affo
rdsh
ireM
illda
leM
illda
leSK
139
547
M95
Dove
Mill
s Tr
ust
cN
o si
gn o
f mill
; Nat
iona
l Tru
stpr
oper
ty o
n si
te, g
oyt
visi
ble
Staf
ford
shire
Shee
nBr
und
Mill
SK 0
99 6
13M
96Do
veM
anifo
ldM
ills
Trus
tc
Conv
erte
d in
to h
ouse
, no
infr
astr
uctu
reSt
affo
rdsh
ireW
arsl
owBr
ownl
ow M
illSK
075
576
M98
Dove
War
slow
Bro
okM
ills
Trus
tc
Not
foun
dSt
affo
rdsh
ireW
arsl
owW
est
Side
Mill
SK 1
01 5
89M
97Do
veM
ills
Trus
tc
Mill
bui
ldin
g no
w g
arag
e fo
r hou
se;
othe
rwis
e no
infr
astr
uctu
reW
est
York
shire
Hol
me
Hol
me
Mill
SE 1
05 0
55H
olm
eRa
ke D
yke
FPD
cDe
relic
t si
te
OUT
SIDE
NAT
ION
AL P
ARK
Derb
yshi
reBo
nsal
lCa
lam
ine
Wor
ksSK
275
580
M47
Derw
ent
Bons
all B
rook
Ark.
Soc
.c
Very
low
flow
, no
pote
ntia
lDe
rbys
hire
Bons
all
Com
b M
illSK
281
580
M48
Derw
ent
Bons
all B
rook
Ark.
Soc
.c
Very
low
flow
, no
pote
ntia
lDe
rbys
hire
Bons
all
Corn
Mill
SK 2
81 5
78M
49De
rwen
tBo
nsal
l Bro
okAr
k. S
oc.
cVe
ry lo
w fl
ow, n
o po
tent
ial
Derb
yshi
reBo
nsal
lPa
int
Mill
SK 2
78 5
80M
50De
rwen
tBo
nsal
l Bro
okAr
k. S
oc.
cVe
ry lo
w fl
ow, n
o po
tent
ial
Derb
yshi
reBo
nsal
lPa
int
Mill
2SK
281
579
M51
Derw
ent
Bons
all B
rook
Ark.
Soc
.c
Very
low
flow
, no
pote
ntia
lDe
rbys
hire
Bons
all
Ston
e M
illSK
282
577
M52
Derw
ent
Bons
all B
rook
Ark.
Soc
.c
Very
low
flow
, no
pote
ntia
lDe
rbys
hire
Brad
bour
neBr
adbo
urne
Mill
SK 2
01 5
22M
53Do
veH
aven
hill
Dale
Mill
s Tr
ust
cRe
side
ntia
l con
vers
ion
with
Broo
k no
n-w
orki
ng w
heel
sDe
rbys
hire
Cads
ter
SK 0
03 8
01M
54G
oyt
Rand
al C
arr B
rook
Giff
ord
cN
ot v
isite
dDe
rbys
hire
Chap
el e
n le
Frit
hSK
073
798
M57
Mill
s Tr
ust
cQ
uery
NG
RDe
rbys
hire
Chap
el e
n le
Frit
hCo
mb'
s M
illSK
045
782
M56
Goy
tPy
egre
ave
Broo
kM
ills
Trus
tc
Onl
y m
ill p
ond
rem
aini
ngDe
rbys
hire
Crom
ford
Slin
ter M
illSK
288
572
M59
Derw
ent
Bons
al B
rook
Ark.
Soc
.c
Now
hol
iday
cot
tage
with
dem
onst
ratio
n w
heel
Derb
yshi
reDa
rley
Abbe
yW
arnl
ey M
ilSK
276
625
M62
Derw
ent
War
ney
Broo
kG
iffor
dc
Not
foun
dDe
rbys
hire
Hay
field
Phos
ide
Mill
SK 0
37 8
59M
70G
oyt
Sett
Mill
s Tr
ust
cN
ot fo
und
Sout
h Yo
rksh
ireSh
effie
ldRo
wel
l Mill
SK 2
99 8
95M
91Do
nLo
xley
Mill
s Tr
ust
cDe
relic
t site
, no
pote
ntia
l, bu
ildin
gsde
stro
yed
by G
reat
She
ffie
ld F
lood
Sour
ceFP
D =
site
iden
tifie
d in
cou
rse
of p
roje
ctH
erita
ge =
ww
w.d
erby
shire
herit
age.
co.u
k/M
enu/
Arch
aeol
ogy/
Mill
s.htm
lAr
k. S
oc. =
Ark
wrig
ht S
ocie
ty, C
rom
ford
, Der
bys.
Mill
s Tr
ust/
MAT
= M
ills
Arch
ive
Trus
t w
ww
.mill
arch
ive.
com
G
iffor
d =
Giff
ord
A. (1
999)
Der
bysh
ire W
ater
mill
s, Th
e M
idla
nd W
ind
& W
ater
Mill
s G
roup
* see
sec
tion
5.4.
1, p
.34
for a
n ex
plan
atio
n of
cat
egor
y c

Appe
ndix
A5:
Pot
entia
l hyd
ro s
ites
in t
he P
DNP,
ran
ked
by in
stal
led
capa
city
(kW
)
Site
nam
e/lo
catio
nRi
ver/
stre
amCa
paci
ty k
WO
utpu
t GW
h/y#
Stud
y re
fere
nce
Cons
trai
nts
Not
es/o
ther
stu
dies
Upp
er D
erw
ent
catc
hmen
tDe
rwen
t/As
hop
700
3.4
STW
Low
-med
ium
Six
sites
incl
udin
g De
rwen
t and
How
den
dam
s sc
oped
by
Seve
rn T
rent
Wat
erCa
lver
Mill
Derw
ent
125
0.72
ETSU
Med
ium
Like
ly t
o be
ove
r-es
timat
e; fu
ll he
ad o
r des
ign
flow
now
unr
ealis
able
due
to lo
ng d
eple
ted
reac
hLi
tton
Mill
Wye
120
0.65
ETSU
Med
ium
Prev
ious
stu
dy: I
TP/L
UC,
200
1: 6
3-15
7 kW
/0.2
9-0.
51 G
Wh/
y; li
kely
to
beov
eres
timat
e re
new
EA
guid
elin
esCh
atsw
orth
upg
rade
*Em
pero
r str
eam
113
0.54
Chat
swor
th E
stat
eLo
w-m
ediu
mCu
rren
t in
stal
led
capa
city
162
kW
; sug
gest
ed t
otal
aft
er u
pgra
de:
205-
275
kWPa
dley
Gor
geBu
rbag
e Br
ook
106
0.5
ETSU
Very
hig
hVe
ry h
igh
natu
ral c
onst
rain
ts -
ver
y un
likel
y to
be
real
isab
leCr
essb
rook
Mill
Wye
940.
52ET
SUM
ediu
mPr
evio
us s
tudy
: ITP
/LU
C, 2
001:
57-
100
kW/0
.27-
0.39
GW
h/y;
like
ly t
o be
over
estim
ates
re n
ew E
A gu
idel
ines
Bar B
rook
, Bas
low
Bar B
rook
880.
39ET
SUVe
ry h
igh
Very
hig
h na
tura
l con
stra
ints
- v
ery
unlik
ely
to b
e re
alis
able
Wat
erfa
ll, L
athk
illda
leLa
thki
ll75
0.35
LUC/
ITP
Very
hig
hVe
ry h
igh
natu
ral c
onst
rain
ts; l
ow s
umm
er fl
ows
- ve
ry u
nlik
ely
to
be re
alis
able
Eden
sor l
ower
wei
rDe
rwen
t56
0.26
FPD
Med
ium
-hig
hPr
evio
us s
tudi
es: E
TSU
, 198
9: 8
8 kW
/0.3
6 G
Wh/
y; IT
P/LU
C, 2
001:
35
kW/0
.16
GW
h/y
Lum
ford
wei
rW
ye50
0.21
FPD
Med
ium
-hig
hPr
evio
us s
tudy
: ETS
U e
stim
ate
was
44
kW a
nd 0
.255
GW
h/y
Eden
sor u
pper
wei
rDe
rwen
t43
0.2
FPD
Med
ium
-hig
hPr
evio
us s
tudi
es: I
TP/L
UC,
200
1: 4
9 kW
/0.2
3 G
Wh/
y (s
eem
s lik
ely
LUC/
ITP
conf
used
the
tw
o w
eirs
)Ca
udw
ell's
Mill
upg
rade
*W
ye35
0.18
FPD
Med
ium
-hig
hEx
istin
g tu
rbin
e pr
oduc
es 1
5 kW
(off
grid
); 50
kW
pot
entia
l fro
m H
ydrA
stud
y -
thus
add
ition
al c
apac
ity =
35
kWO
ld M
ill, B
aslo
wDe
rwen
t35
0.25
ETSU
Med
ium
Full
estim
ate
may
be
unre
alis
able
due
to
depl
eted
reac
h an
d ne
w
EA g
uide
lines
Whi
tele
e M
ill, D
aneb
ridge
Dane
340.
12FP
DM
ediu
mAl
tern
ativ
e op
tion
of 2
in-w
eir s
chem
es p
rodu
cing
32
kW/0
.14
GW
h/y
Ashf
ord
Bobb
in M
illW
ye30
0.14
Tow
nsen
d/FP
DM
ediu
m-h
igh
FPD
estim
ate
base
d on
stu
dy (T
owns
end,
200
9) b
y po
stgr
adua
te s
tude
ntat
CAT
, Mac
hynl
leth
Bam
ford
Mill
Derw
ent
270.
22FP
DM
ediu
mPr
evio
us s
tudy
: ITP
/LU
C: 8
3-18
7 kW
- v
ery
unlik
ely
to b
e re
alis
able
Flew
itt's
Mill
, Ash
ford
Wye
180.
14Se
gen
Low
Estim
ate
base
d on
exi
stin
g tu
rbin
e. S
egen
als
o sc
oped
95
kW w
ith n
ewKa
plan
- h
ighl
y un
real
istic
Lead
Mill
, nr H
athe
rsag
eDe
rwen
t17
0.08
LUC/
ITP
Med
ium
-hig
hFP
D w
alk
over
sur
vey
sugg
este
d w
eir i
n po
or c
ondi
tion
Edal
eG
rinds
Bro
ok12
.50.
05FP
DH
igh
Diff
icul
t to
real
ise
due
to e
nviro
nmen
tal c
onst
rain
ts; 5
kW
pic
o DI
Ysc
hem
e m
ay b
e po
ssib
leDi
ggle
Mill
Digg
le B
rook
120.
06FP
DM
ediu
m-h
igh
Form
er s
ite o
f 97
kW w
heel
but
fed
by lo
ng le
at/m
illpo
nd; w
heel
cap
acity
now
unr
ealis
able
Mea
dow
Far
m, n
r Fla
shDa
ne12
0.06
WRE
Med
ium
Curr
ently
with
EA
for l
icen
sing
; far
m s
chem
e/fe
asib
ility
stu
dy b
y W
este
rnRe
new
able
Ene
rgy
Brou
gh B
usin
ess
Park
Brad
wel
l Bro
ok11
0.06
Derw
ent
Hyd
roM
ediu
mSt
udy
com
mis
sion
ed b
y Di
rect
Cha
rcoa
l Ltd
with
gra
nt a
id b
y PD
NP
SDF
Rape
r Lod
ge, n
r Alp
ort
Lath
kill
100.
05SY
/Cla
rke
Med
ium
-hig
hSc
opin
g st
udy
(Cla
rke,
200
9) fo
r Sus
tain
able
You
lgra
ve re
hyd
ro p
oten
tial
on B
radf
ord/
Lath
kill
river
s
Appendix A
Cont
inue
d…
Peak Power | page 77

Appendix A
page 78 | Peak Power
Appe
ndix
A5:
Pot
entia
l hyd
ro s
ites
in t
he P
DNP,
ran
ked
by in
stal
led
capa
city
(kW
) (c
ontin
ued)
Site
nam
e/lo
catio
nRi
ver/
stre
amCa
paci
ty k
WO
utpu
t GW
h/y#
Stud
y re
fere
nce
Cons
trai
nts
Not
es/o
ther
stu
dies
Ilam
Dove
80.
05De
rwen
t H
ydro
Med
ium
-hig
hSi
gnifi
cant
con
stra
ints
- c
ultu
ral h
erita
ge a
nd ri
ver e
nviro
nmen
t;fe
asib
ility
stu
dy fu
nded
by
PDN
P SD
FCa
lver
Cor
n M
illCa
lver
Mill
Sou
gh4
0.02
FPD
Low
Whe
el t
o be
re-i
nsta
ted
in 2
010;
low
flow
s on
a m
ine
drai
nage
cha
nnel
;no
env
ironm
enta
l iss
ues
Ston
ey M
iddl
eton
Stok
e Br
ook
40.
02De
rwen
t H
ydro
Med
ium
Pre-
feas
ibili
ty s
tudy
fund
ed b
y PD
NP
SDF
Tota
l18
409.
24
Not
es:
* exi
stin
g si
tes:
cap
acity
not
ed is
add
ition
al t
o cu
rren
t in
stal
led
capa
city
# =
whe
re n
o ou
tput
/ann
ual e
nerg
y ca
ptur
e es
timat
ed in
orig
inal
stu
dy, a
cap
acity
fact
or o
f 55%
has
bee
n us
ed1.
Man
y m
ore
site
s (4
0+) e
xam
ined
by
FPD
desk
/GIS
con
stra
ints
stu
dy b
ut n
o he
ad m
easu
red
nor f
low
kno
wn.
Som
e m
ay p
rovi
de a
dditi
onal
cap
acity
but
diff
icul
t to
est
imat
e2.
Oth
er s
ites
whe
re e
stim
ates
mad
e in
clud
e Lo
w B
radf
ield
(0.8
kW
), G
radb
ach
Mill
(<5
kW),
Mag
pie
Soug
h (2
kW
), H
arde
n Cl
ough
(1 k
W),
Swin
t Cl
ough
(2 k
W) -
all
likel
y to
be
unec
onom
ic t
o de
velo
p