j. nutr.-1981-deady-1568-79
DESCRIPTION
J. Nutr.-1981-Deady-1568-79TRANSCRIPT
Effects of Level of Dietary Glutamic Acid and Thiaminon Food Intake, Weight Gain, Plasma Amino Acids,and Thiamin Status of Growing Kittens1
JOAN E. DEADY,2 BRUCE ANDERSON,3JOSEPH A. O'DONNELL III,4 JAMES G. MORRIS
ANDQUINTON R. ROGERS
Departments of Physiological Sciences and Animal Sciences,University of California, Davis, CA 95616
ABSTRACT Specific pathogen-free kittens were individually fed purifiedamino acid diets containing 4.4 mg of thiamin and 3.0, 4.5, 6.0, 9.0 or 12.0%glutamic acid (Glu) in a balanced 5x5 latin square design. Kittens fed either the9.0% followed by the 12.0%glutamate diets or vice versa developed severe clinicalsigns of thiamin deficiency and two kittens died. Other affected kittens given5 mg additional thiamin per day for 3 days promptly recovered. In a subsequentexperiment, the effect of a diet containing 12.0% glutamic acid with either 4.4 or25.0 mg thiamin per kilogram diet was compared with a diet containing 3.0%glutamic acid with either 0.0 or 4.4 mg thiamin per kilogram. Kittens fed the dietcontaining the high level of glutamic acid with 4.4 mg thiamin exhibited depressed food intake and body weight gain and an elevated level of plasmaglutamic acid compared to diets containing 3.0% glutamic acid. Red blood cellsfrom this group of kittens also showed a transitory incomplete saturation of trans-ketolase with thiamin pyrophosphate. Kittens fed the high glutamate dietsvomited occasionally during the 1st month of the dietary regimen. Although increased thiamin (25 mg/kg diet) decreased the severity of the adverse effects of thehigh glutamate diet, maximal growth was not obtained in kittens fed the highglutamate, high thiamin diet. J. Nutr. Ill: 1568-1579, 1981.INDEXING KEY WORDS glutamic acid •thiamin deficiency •cats
Intolerance to glutamic acid (Glu) has absorption from the gut. This has beenbeen extensively studied because of the reported in the rat (6, 7), dog (8, 9) anduse of monosodium L-glutamate (MSG) as cat (8).a flavor enhancer in foods for humans. Marked high tolerance to dietary levelsLarge dosages of MSG (4 g/kg body of glutamic acid ranging from 5 to 18% byweight) have produced brain lesions and weight have been reported in rats (10-12)abnormal hormonal secretions when par- and in chicks (13). Some reports haveenterally administered to rats, (1), ham- indicated food intake and body weightsters (2) and mice (3). Infant monkeys depression in animals fed diets containing0-14 days of age given 4 g MSG/kg bodyweight were unaffected, although infantmice following the same experimental —r~
. - ° Received for publication 15 September 1980.prOtOCOl developed lesions in the arcuate -Supported in put by a gift from Quaker Oat, Company,nucleus (4, 5). The tolerance for high Bamngton,IL.I • •J •1_ 1 *Present address: Department of Anesthesia, School of Medi-leVelS OI glutamic acid might be at- cine. University of California, San Francisco, CA 94143.tributable to detoxification through trans- „Ipre[fent^d,jres1,:Cal^' VeterinaryTeachin«Center.Route
_ . . 8 Box 215, Caldwell, ID 83605OI glutamate tO alanine during •Current address, Quaker Oats Company, Bamngton, IL.
1568
by guest on August 19, 2014
jn.nutrition.orgD
ownloaded from
GLUTAMATE EFFECTS ON THIAMIN STATUS OF THE CAT 1569
glutamic acid at levels of more than 8.0%in rats (14) and 10% in chicks (15).
Glutamate-containing amino acid dietshave supported good growth in the kitten(16). No work to date has been reportedon the possible growth-depressing effectof an excess of any amino acid present inthe diet of the cat. Glutamate has beencommonly used to make up any nitrogendeficit in diets fed in a variety of protocols to various experimental animals.Early amino acid nutritional researchers(17-20) observed that glutamic acid wasan effective and inexpensive source ofnonspecific nitrogen.
Even though a variable intolerance toglutamic acid exists, its rather indiscriminate use in adjusting dietary nitrogen levels continues. There have beenno reports in the literature of inter-ations between dietary levels of thiaminand glutamic acid, but there have beenreports of thiamin deficiency in cats (21-24). The present experiment was carriedout to determine the level to whichglutamic acid could be tolerated inpurified diets for kittens.
MATERIALS AND METHODS
Animals
Specific pathogen-free (SPF) domesticshorthair kittens weighing 800-1200 gwere purchased (Federated Medical Resources, Honeybrook, PA) and housedunder SPF conditions in stainless steelmetabolism cages in a room at 25°with a12:12 light:dark cycle during both experiments. In the second experiment,SFP conditions were compromised intransit and the kittens contracted arespiratory disease. Subsequently, thekittens were vaccinated against pan-leukopenia (Felocine, Norden and Laboratories, Lincoln, NE) and rhinotracheitis(Felomune CVR modified liver virus vaccine, Norden Laboratories, Lincoln, NE).
The kittens were adjusted to the dietaryregimen by the feeding of a standardamino acid diet (table 1) for 2-3 weeksby which time they ate the diet well andgained weight at a normal rate.
Dietary regimens
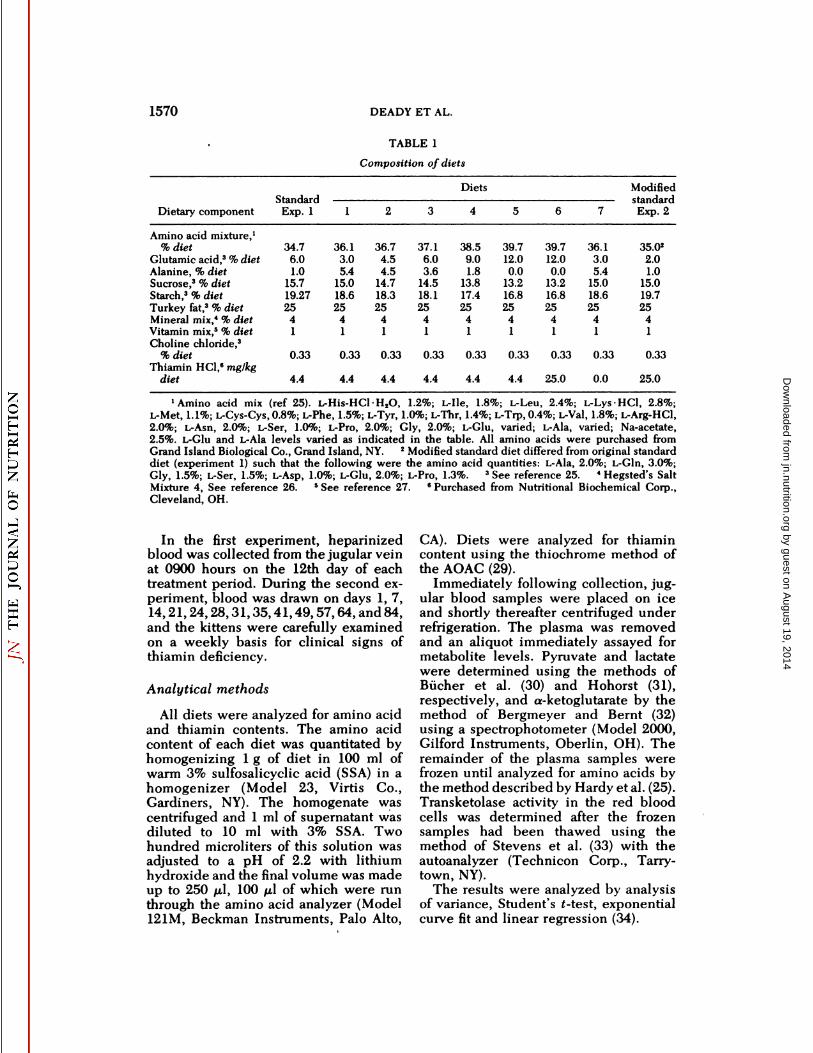
Experiment 1. Following the adjustment period, the kittens were fed dietscontaining various levels of glutamicacid (table 1, diets 1-5). All diets weremade isonitrogenous by adjusting thealanine and carbohydrate components ofeach diet. The diets contained 3.0, 4.5,6.0, 9.0 or 12.0% glutamic acid.
Experiment 2. Following adjustment toa modified standard diet (table 1), thekittens were fed diets which containedeither 3.0% glutamic acid with 4.4 mgthiamin/kg (table 1, diet 1), 12.0% glutamic acid with 4.4 mg thiamin/kg (table 1,diet 5), 12.0% glutamic acid with 25 mgthiamin/kg diet (table 1, diet 6) or 3.0%glutamic acid devoid of thiamin (table 1,diet 7).
Experimental design
Experiment 1. Ten female kittensweighing 1,105 ±37 g were fed the fivelevels of glutamic acid (table 1, diets1-5) in a 5 x 5 balanced latin squaredesign (28) using 2-week periods. However, kittens fed the 9% glutamic acid(diet 4) followed by the 12.0% glutamicacid diet (diet 5) or vice versa developedsigns of thiamin deficiency. Therefore,the design was modified and the resultswere treated as individual groups fedfive different diets assuming there wereno carry-over effects.
Experiment 2. The second experimentwas designed to investigate the possibleinteraction of dietary glutamic acid withthiamin. Three groups of each of fivekittens weighing 1,348 ±34 g composedof either two or three males and two orthree females per group were assigned tothe diets 1, 5 and 6 described above.After 28 days, one male and two femalespreviously fed the 3.0% glutamic aciddiet (diet 1)were switched to the thiamin-devoid diet (diet 7). The experimentlasted for 84 days.
In both experiments, food and waterwere available ad libitum. Fresh food andwater were provided daily at 1600 hours,when daily food intake and body weightswere recorded.
by guest on August 19, 2014
jn.nutrition.orgD
ownloaded from
1570 DEADY ET AL.
TABLE 1
Composition of diets
DietarycomponentAmino
acidmixture,'%dietGlutamic
acid,3 %dietAlanine,%dietSucrose,3%dietStarch,3
%dietTurkeyfat,3 %dietMineralmix,4 %dietVitaminmix,5 %dietCholine
chloride,3%dietThiamin
HC1,6mg/kgdietStandard
Exp.134.76.01.015.719.2725410.334.4136.13.05.415.018.625410.334.4236.74.54.514.718.325410.334.4337.16.03.614.518.125410.334.4Diets438.59.01.813.817.425410.334.4539.712.00.013.216.825410.334.4639.712.00.013.216.825410.3325.0736.13.05.415.018.625410.330.0ModifiedstandardExp.235.022.01.015.019.725410.3325.0
•Aminoacid mix (ref 25). L-His-HCl H2O, 1.2%; L-Ile, 1.8%; L-Leu, 2.4%; L-Lys-HCl, 2.8%;L-Met, 1.1%; L-Cys-Cys, 0.8%; L-Phe, 1.5%; L-Tyr, 1.0%; L-Thr, 1.4%; L-Trp,0.4%; L-Val, 1.8%; L-Arg-HCl,2.0%; L-Asn, 2.0%; L-Ser, 1.0%; L-Pro, 2.0%; Gly, 2.0%; L-Glu, varied; L-Ala, varied; Na-acetate,2.5%. L-Glu and L-Ala levels varied as indicated in the table. All amino acids were purchased fromGrand Island Biological Co., Grand Island, NY. 2 Modified standard diet differed from original standarddiet (experiment 1) such that the following were the amino acid quantities: L-Ala, 2.0%; L-Gln, 3.0%;Gly, 1.5%; L-Ser, 1.5%; L-Asp, 1.0%; L-Glu, 2.0%; L-Pro, 1.3%. 3 See reference 25. «Hegsted's SaltMixture 4, See reference 26. 5See reference 27. 6Purchased from Nutritional Biochemical Corp.,Cleveland, OH.
In the first experiment, heparinizedblood was collected from the jugular veinat 0900 hours on the 12th day of eachtreatment period. During the second experiment, blood was drawn on days 1, 7,14,21,24,28,31,35,41,49,57,64, and 84,and the kittens were carefully examinedon a weekly basis for clinical signs ofthiamin deficiency.
Analytical methods
All diets were analyzed for amino acidand thiamin contents. The amino acidcontent of each diet was quantitated byhomogenizing l g of diet in 100 ml ofwarm 3% sulfosalicyclic acid (SSA) in ahomogenizer (Model 23, Virtis Co.,Gardiners, NY). The homogenate wascentrifuged and 1 ml of supernatant wasdiluted to 10 ml with 3% SSA. Twohundred microliters of this solution wasadjusted to a pH of 2.2 with lithiumhydroxide and the final volume was madeup to 250 fu, 100 fil of which were runthrough the amino acid analyzer (Model121M, Beckman Instruments, Palo Alto,
CA). Diets were analyzed for thiamincontent using the thiochrome method ofthe AOAC (29).
Immediately following collection, jugular blood samples were placed on iceand shortly thereafter centrifuged underrefrigeration. The plasma was removedand an aliquot immediately assayed formetabolite levels. Pyruvate and lactatewere determined using the methods ofBücher et al. (30) and Hohorst (31),respectively, and a-ketoglutarate by themethod of Bergmeyer and Bernt (32)using a spectrophotometer (Model 2000,Gilford Instruments, Oberlin, OH). Theremainder of the plasma samples werefrozen until analyzed for amino acids bythe method described by Hardy et al. (25).Transketolase activity in the red bloodcells was determined after the frozensamples had been thawed using themethod of Stevens et al. (33) with theautoanalyzer (Technicon Corp., Tarry-town, NY).
The results were analyzed by analysisof variance, Student's t-test, exponential
curve fit and linear regression (34).
by guest on August 19, 2014
jn.nutrition.orgD
ownloaded from
GLUTAMATE EFFECTS ON THIAMIN STATUS OF THE CAT 1571
o•o
o»
50 r
40 -
30
20
IO
O L
riC
(4 (6) (8) (8)
25
^ 20>,o•o
X.o>
~ 15
I
LU
$
IO
-ib
(7) (6) 18)
-ia,b
(8)
3 4.5 6 9 12GLU IN DIET(%)
3 4.5 6 9 12GLU IN DIET (%)
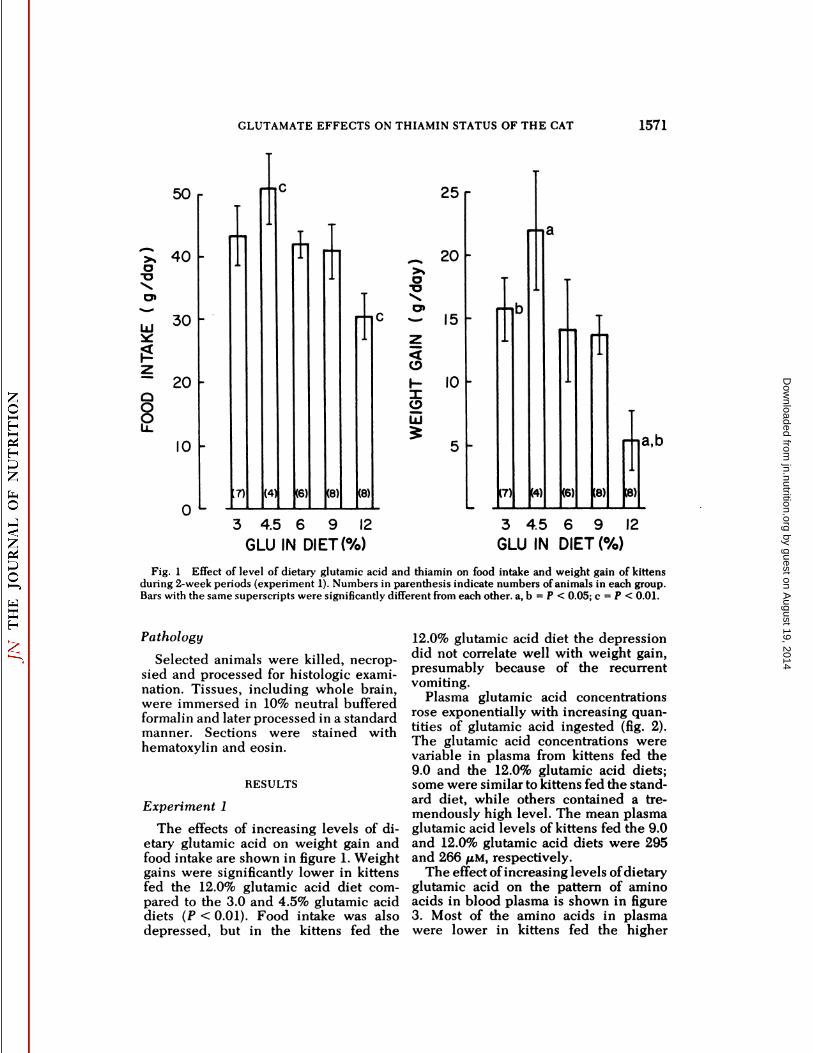
Fig. I Effect of level of dietary glutamic acid and thiamin on food intake and weight gain of kittensduring 2-week periods (experiment 1). Numbers in parenthesis indicate numbers of animals in each group.Bars with the same superscripts were significantly different from each other, a, b = P < 0.05; c = P < 0.01.
PathologySelected animals were killed, necrop-
sied and processed for histologie examination. Tissues, including whole brain,were immersed in 10% neutral bufferedformalin and later processed in a standardmanner. Sections were stained withhematoxylin and eosin.
RESULTS
Experiment 1
The effects of increasing levels of dietary glutamic acid on weight gain andfood intake are shown in figure 1. Weightgains were significantly lower in kittensfed the 12.0% glutamic acid diet compared to the 3.0 and 4.5% glutamic aciddiets (P < 0.01). Food intake was alsodepressed, but in the kittens fed the
12.0% glutamic acid diet the depressiondid not correlate well with weight gain,presumably because of the recurrentvomiting.
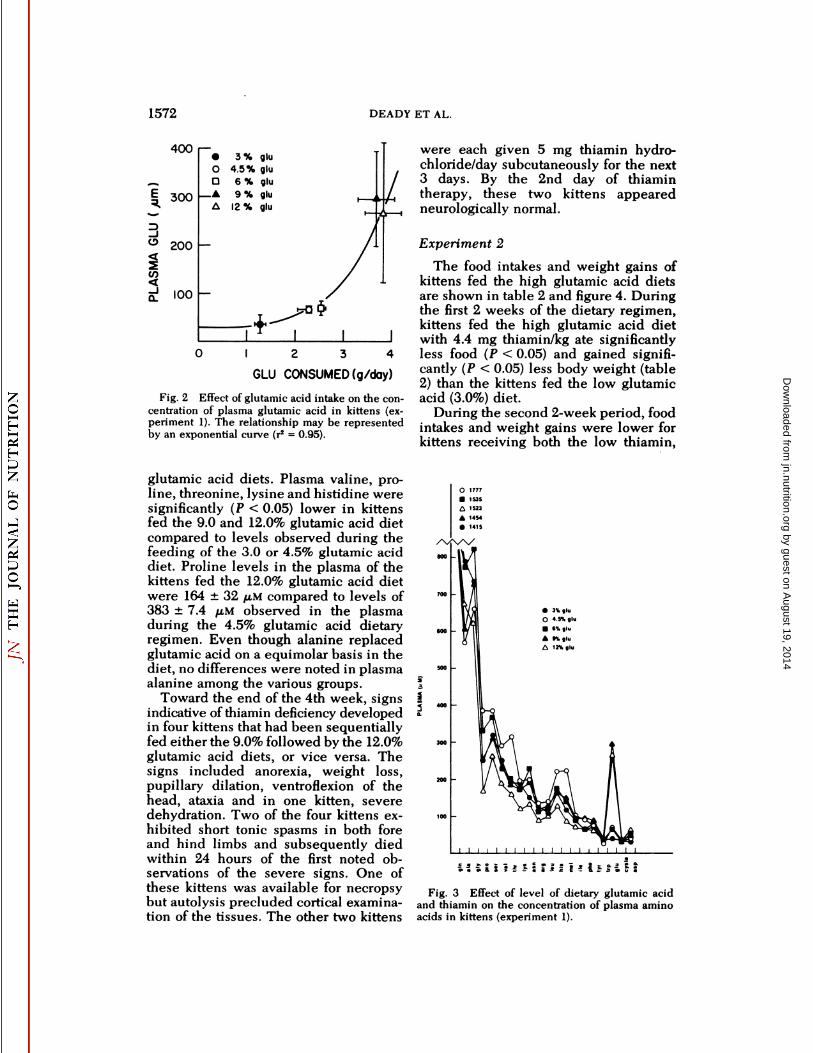
Plasma glutamic acid concentrationsrose exponentially with increasing quantities of glutamic acid ingested (fig. 2).The glutamic acid concentrations werevariable in plasma from kittens fed the9.0 and the 12.0% glutamic acid diets;some were similar to kittens fed the standard diet, while others contained a tremendously high level. The mean plasmaglutamic acid levels of kittens fed the 9.0and 12.0% glutamic acid diets were 295and 266 /AM, respectively.
The effect of increasing levels of dietaryglutamic acid on the pattern of aminoacids in blood plasma is shown in figure3. Most of the amino acids in plasmawere lower in kittens fed the higher
by guest on August 19, 2014
jn.nutrition.orgD
ownloaded from
1572 DEADY ET AL.
400
300
200
(O
• 3% gluO 4.5% gluD 6 % glu
-A 9 % gluA 12 % glu
01234
GLU CONSUMED (g/day)
Fig. 2 Effect of glutamic acid intake on the concentration of plasma glutamic acid in kittens (experiment 1). The relationship may be representedby an exponential curve (r2 = 0.95).
were each given 5 mg thiamin hydro-chloride/day subcutaneously for the next3 days. By the 2nd day of thiamintherapy, these two kittens appearedneurologically normal.
Experiment 2
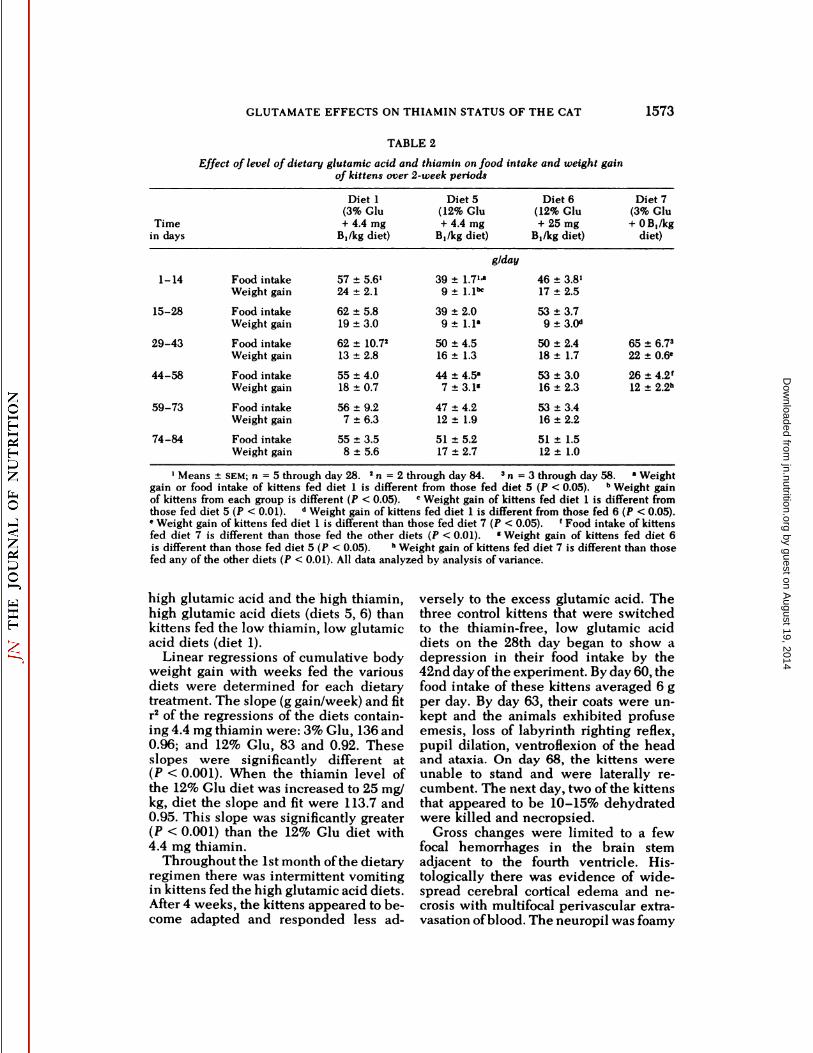
The food intakes and weight gains ofkittens fed the high glutamic acid dietsare shown in table 2 and figure 4. Duringthe first 2 weeks of the dietary regimen,kittens fed the high glutamic acid dietwith 4.4 mg thiamin/kg ate significantlyless food (P < 0.05) and gained significantly (P < 0.05) less body weight (table2) than the kittens fed the low glutamicacid (3.0%) diet.
During the second 2-week period, foodintakes and weight gains were lower forkittens receiving both the low thiamin,
glutamic acid diets. Plasma valine, pro-line, threonine, lysine and histidine weresignificantly (P < 0.05) lower in kittensfed the 9.0 and 12.0% glutamic acid dietcompared to levels observed during thefeeding of the 3.0 or 4.5% glutamic aciddiet. Proline levels in the plasma of thekittens fed the 12.0% glutamic acid dietwere 164 ±32 piM compared to levels of383 ±7.4 fj.M observed in the plasmaduring the 4.5% glutamic acid dietaryregimen. Even though alanine replacedglutamic acid on a equimolar basis in thediet, no differences were noted in plasmaalanine among the various groups.
Toward the end of the 4th week, signsindicative of thiamin deficiency developedin four kittens that had been sequentiallyfed either the 9.0% followed by the 12.0%glutamic acid diets, or vice versa. Thesigns included anorexia, weight loss,pupillary dilation, ventroflexion of thehead, ataxia and in one kitten, severedehydration. Two of the four kittens exhibited short tonic spasms in both foreand hind limbs and subsequently diedwithin 24 hours of the first noted observations of the severe signs. One ofthese kittens was available for necropsybut autolysis precluded cortical examination of the tissues. The other two kittens
454
415
• r. gluO 4.5% glu
•t* gluA «%gluA 12\ glu
i? Si : ; i 1:Î3J ê* t££il:
Fig. 3 Effect of level of dietary glutamic acidand thiamin on the concentration of plasma aminoacids in kittens (experiment 1).
by guest on August 19, 2014
jn.nutrition.orgD
ownloaded from
GLUTAMATE EFFECTS ON THIAMIN STATUS OF THE CAT 1573
TABLE 2
Effect of level of dietary glutamic acid and thiamin on food intake and weight gainof kittens over 2-week periods
TimeindaysDiet
1(3%Glu+
4.4mgB,/kg diet)DietS(12%
Glu+4.4mgB,
/kg diet)Diet
6(12%Glu+
25mgB,/kg diet)Diet
7(3%Glu+
OB,/kgdiet)
g/day
1-1415-2829-4344-5859-7374-84FoodintakeWeightgainFood
intakeWeightgainFood
intakeWeightgainFood
intakeWeightgainFood
intakeWeightgainFood
intakeWeight gain57
±5.6'24±2.162
±5.819 ±3.062
±10.7213 ±2.855
±4.018±0.756
±9.27±6.355
±3.58 ±5.639
±1.71'"9±1.11*39
±2.09±1.1a50
±4.516 ±1.344
±4.5"7 ±3.1«47
±4.212 ±1.951
±5.217 ±2.746
±3.8'17 ±2.553
±3.79±3.0"50
±2.418 ±1.753
±3.016 ±2.353
±3.416 ±2.251
±1.512 ±1.065
±6.7»22 ±0.6e26
±4.2'12 ±2.2"
1Means ±SEM;n = 5 through day 28. 2n = 2 through day 84. 3n = 3 through day 58. " Weightgain or food intake of kittens fed diet 1 is different from those fed diet 5 (P < 0.05). hWeight gainof kittens from each group is different (P < 0.05). c Weight gain of kittens fed diet 1 is different fromthose fed diet 5 (P < 0.01). d Weight gain of kittens fed diet 1 is different from those fed 6 (P < 0.05).' Weight gain of kittens fed diet 1 is different than those fed diet 7 (P < 0.05). ' Food intake of kittensfed diet 7 is different than those fed the other diets (P < 0.01). «Weight gain of kittens fed diet 6is different than those fed diet 5 (P < 0.05). hWeight gain of kittens fed diet 7 is different than thosefed any of the other diets (P < 0.01). All data analyzed by analysis of variance.
high glutamic acid and the high thiamin, versely to the excess glutamic acid. Thehigh glutamic acid diets (diets 5, 6) than three control kittens that were switchedkittens fed the low thiamin, low glutamic to the thiamin-free, low glutamic acidacid diets (diet 1). diets on the 28th day began to show a
Linear regressions of cumulative body depression in their food intake by theweight gain with weeks fed the various 42nd day of the experiment. By day 60, thediets were determined for each dietary food intake of these kittens averaged 6 gtreatment. The slope (g gain/week) and fit per day. By day 63, their coats were un-r2 of the regressions of the diets contain- kept and the animals exhibited profuseing 4.4 mg thiamin were: 3% Glu, 136 and emesis, loss of labyrinth righting reflex,0.96; and 12% Glu, 83 and 0.92. These pupil dilation, ventroflexion of the headslopes were significantly different at and ataxia. On day 68, the kittens were(P < 0.001). When the thiamin level of unable to stand and were laterally re-the 12% Glu diet was increased to 25 mg/ cumbent. The next day, two of the kittenskg, diet the slope and fit were 113.7 and that appeared to be 10-15% dehydrated0.95. This slope was significantly greater were killed and necropsied.(P < 0.001) than the 12% Glu diet with Gross changes were limited to a few4.4 mg thiamin. focal hemorrhages in the brain stem
Throughout the 1st month of the dietary adjacent to the fourth ventricle. His-regimen there was intermittent vomiting tologically there was evidence of wide-in kittens fed the high glutamic acid diets, spread cerebral cortical edema and ne-After 4 weeks, the kittens appeared to be- crosis with multifocal perivascular extra-come adapted and responded less ad- vasation of blood. The neuropil was foamy
by guest on August 19, 2014
jn.nutrition.orgD
ownloaded from
1574 DEADY ET AL.
1750
1500
o«— 1250
1000
750UJ
500
250
A 12% glu,4.4 mg B,
O 12% glu, 25 mg B,
• 3% glu, 4.4 mg B,
• 3% glu, 0 mg B,
l l l l l l l l l l l4567
WEEKS
8 9 IO II 12
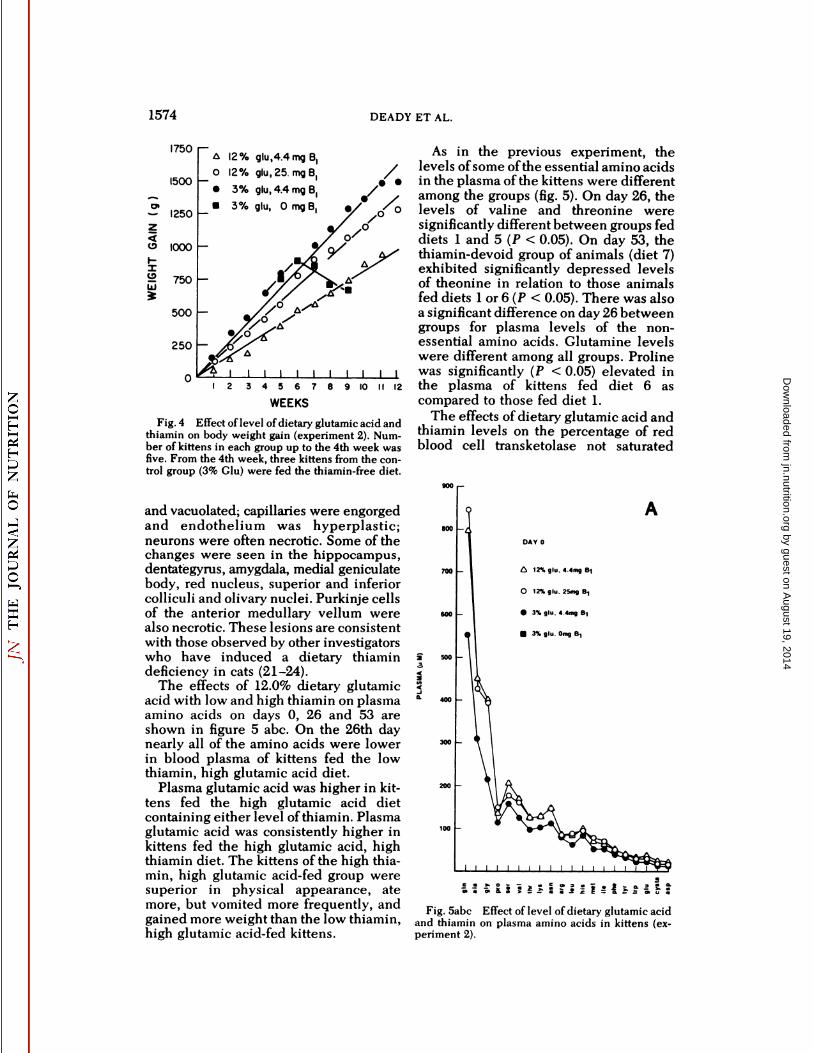
Fig. 4 Effect of level of dietary glutamic acid andthiamin on body weight gain (experiment 2). Number of kittens in each group up to the 4th week wasfive. From the 4th week, three kittens from the control group (3% Glu) were fed the thiamin-free diet.
and vacuolated; capillaries were engorgedand endothelium was hyperplastic;neurons were often necrotic. Some of thechanges were seen in the hippocampus,dentategyrus, amygdala, medial geniculatebody, red nucleus, superior and inferiorcolliculi and olivary nuclei. Purkinje cellsof the anterior medullary vellum werealso necrotic. These lesions are consistentwith those observed by other investigatorswho have induced a dietary thiamindeficiency in cats (21-24).
The effects of 12.0% dietary glutamicacid with low and high thiamin on plasmaamino acids on days 0, 26 and 53 areshown in figure 5 abc. On the 26th daynearly all of the amino acids were lowerin blood plasma of kittens fed the lowthiamin, high glutamic acid diet.
Plasma glutamic acid was higher in kittens fed the high glutamic acid dietcontaining either level of thiamin. Plasmaglutamic acid was consistently higher inkittens fed the high glutamic acid, highthiamin diet. The kittens of the high thiamin, high glutamic acid-fed group weresuperior in physical appearance, atemore, but vomited more frequently, andgained more weight than the low thiamin,high glutamic acid-fed kittens.
As in the previous experiment, thelevels of some of the essential amino acidsin the plasma of the kittens were differentamong the groups (fig. 5). On day 26, thelevels of valine and threonine weresignificantly different between groups feddiets 1 and 5 (P < 0.05). On day 53, thethiamin-devoid group of animals (diet 7)exhibited significantly depressed levelsof theonine in relation to those animalsfed diets 1 or 6 (P < 0.05). There was alsoa significant difference on day 26 betweengroups for plasma levels of the non-essential amino acids. Glutamine levelswere different among all groups. Prolinewas significantly (P < 0.05) elevated inthe plasma of kittens fed diet 6 ascompared to those fed diet 1.
The effects of dietary glutamic acid andthiamin levels on the percentage of redblood cell transketolase not saturated
Õ 500¿
Õ
<
¿ 400
DAY 0
A 12', glu. J 4m, B,
O 12% glu. 25mg B,
3\ glu. 4.4mg B)
3% glu Omg B,
&ÌÌI£ÌÌJÌÌ*|££iît
Fig. 5abc Effect of level of dietary glutamic acidand thiamin on plasma amino acids in kittens (experiment 2).
by guest on August 19, 2014
jn.nutrition.orgD
ownloaded from
GLUTAMATE EFFECTS ON THIAMIN STATUS OF THE CAT 1575
B
FIG. Sabe—Continued.
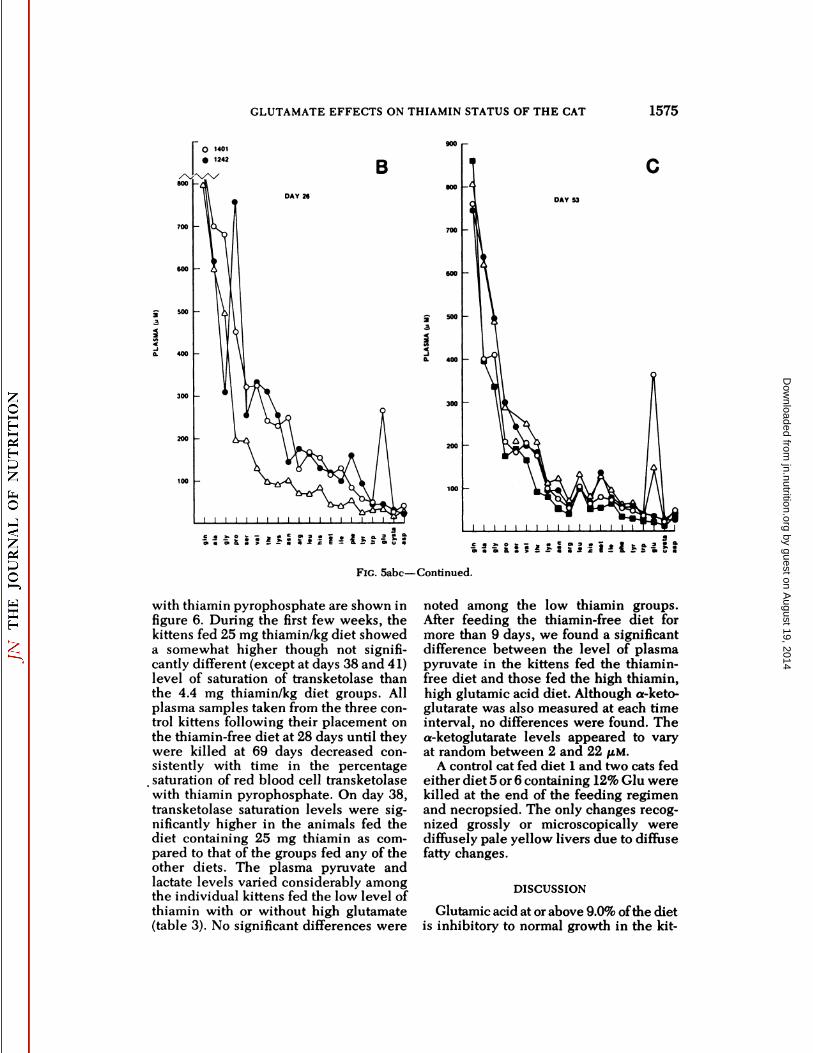
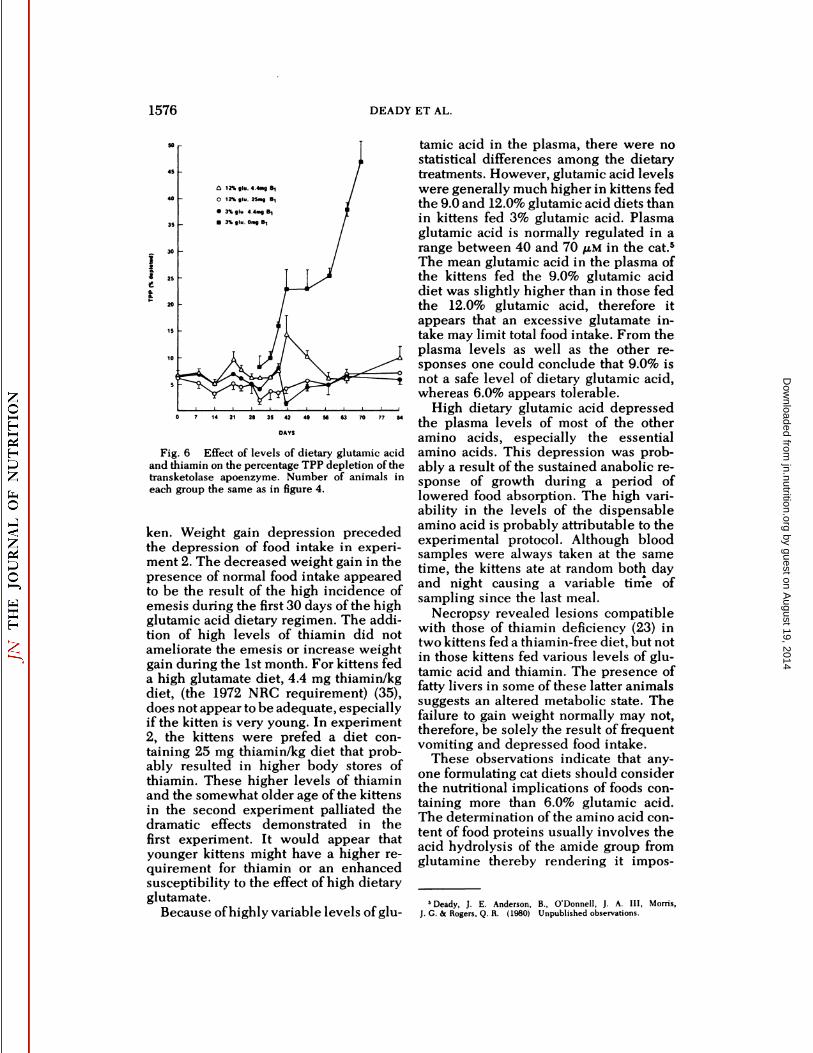
with thiamin pyrophosphate are shown infigure 6. During the first few weeks, thekittens fed 25 mg thiamin/kg diet showeda somewhat higher though not significantly different (except at days 38 and 41)level of saturation of transketolase thanthe 4.4 mg thiamin/kg diet groups. Allplasma samples taken from the three control kittens following their placement onthe thiamin-free diet at 28 days until theywere killed at 69 days decreased consistently with time in the percentage
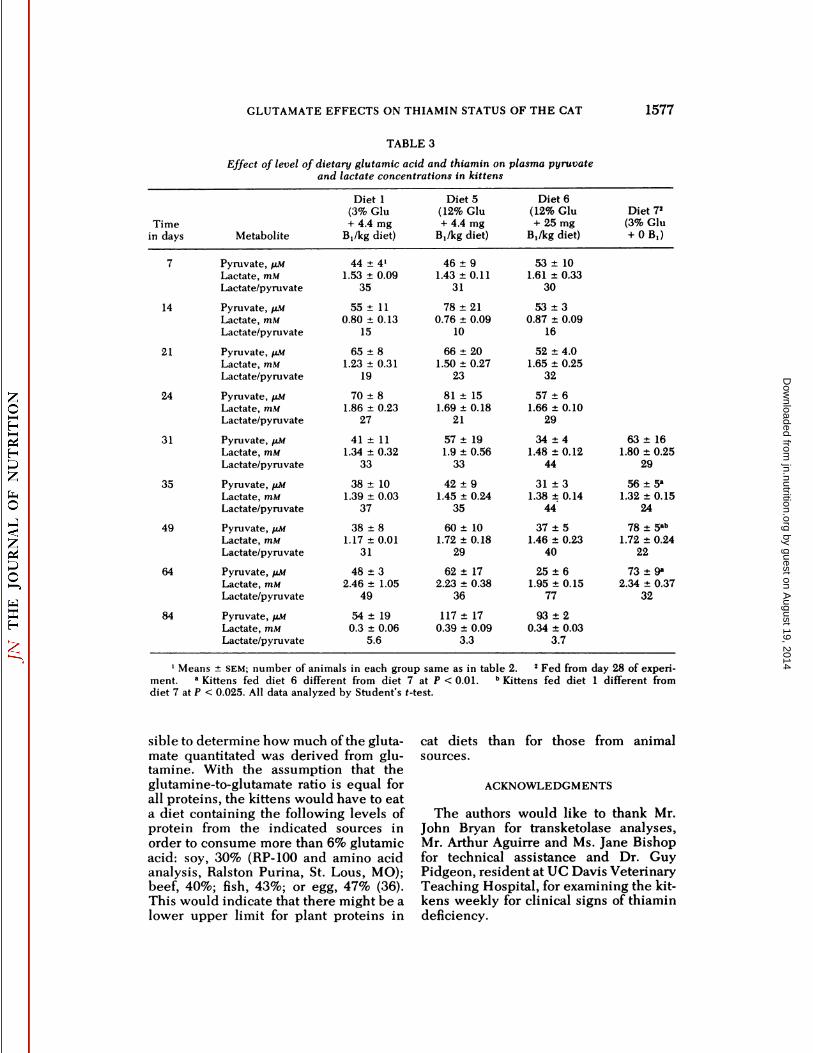
. saturation of red blood cell transketolasewith thiamin pyrophosphate. On day 38,transketolase saturation levels were significantly higher in the animals fed thediet containing 25 mg thiamin as compared to that of the groups fed any of theother diets. The plasma pyruvate andlactate levels varied considerably amongthe individual kittens fed the low level ofthiamin with or without high glutamate(table 3). No significant differences were
noted among the low thiamin groups.After feeding the thiamin-free diet formore than 9 days, we found a significantdifference between the level of plasmapyruvate in the kittens fed the thiamin-free diet and those fed the high thiamin,high glutamic acid diet. Although a-keto-glutarate was also measured at each timeinterval, no differences were found. Thea-ketoglutarate levels appeared to varyat random between 2 and 22 JU.M.
A control cat fed diet 1 and two cats fedeither diet 5 or 6 containing 12% Glu werekilled at the end of the feeding regimenand necropsied. The only changes recognized grossly or microscopically werediffusely pale yellow livers due to diffusefatty changes.
DISCUSSION
Glutamic acid at or above 9.0% of the dietis inhibitory to normal growth in the kit-
by guest on August 19, 2014
jn.nutrition.orgD
ownloaded from
1576 DEADY ET AL.
• 12% glu. 4.4mg 8,
O 12% glu. 25mg e,
• 3% glu 4 4mg B,
• 3% glu. Omg B1
Fig. 6 Effect of levels of dietary glutamic acidand thiamin on the percentage TPP depletion of thetransketolase apoenzyme. Number of animals ineach group the same as in figure 4.
ken. Weight gain depression precededthe depression of food intake in experiment 2. The decreased weight gain in thepresence of normal food intake appearedto be the result of the high incidence ofemesis during the first 30 days of the highglutamic acid dietary regimen. The addition of high levels of thiamin did notameliorate the emesis or increase weightgain during the 1st month. For kittens feda high glutamate diet, 4.4 mg thiamin/kgdiet, (the 1972 NRC requirement) (35),does not appear to be adequate, especiallyif the kitten is very young. In experiment2, the kittens were prefed a diet containing 25 mg thiamin/kg diet that probably resulted in higher body stores ofthiamin. These higher levels of thiaminand the somewhat older age of the kittensin the second experiment palliated thedramatic effects demonstrated in thefirst experiment. It would appear thatyounger kittens might have a higher requirement for thiamin or an enhancedsusceptibility to the effect of high dietaryglutamate.
Because of highly variable levels of glu
tamic acid in the plasma, there were nostatistical differences among the dietarytreatments. However, glutamic acid levelswere generally much higher in kittens fedthe 9.0 and 12.0% glutamic acid diets thanin kittens fed 3% glutamic acid. Plasmaglutamic acid is normally regulated in arange between 40 and 70 /^iMin the cat.5The mean glutamic acid in the plasma ofthe kittens fed the 9.0% glutamic aciddiet was slightly higher than in those fedthe 12.0% glutamic acid, therefore itappears that an excessive glutamate intake may limit total food intake. From theplasma levels as well as the other responses one could conclude that 9.0% isnot a safe level of dietary glutamic acid,whereas 6.0% appears tolerable.
High dietary glutamic acid depressedthe plasma levels of most of the otheramino acids, especially the essentialamino acids. This depression was probably a result of the sustained anabolic response of growth during a period oflowered food absorption. The high variability in the levels of the dispensableamino acid is probably attributable to theexperimental protocol. Although bloodsamples were always taken at the sametime, the kittens ate at random both dayand night causing a variable time ofsampling since the last meal.
Necropsy revealed lesions compatiblewith those of thiamin deficiency (23) intwo kittens fed a thiamin-free diet, but notin those kittens fed various levels of glutamic acid and thiamin. The presence offatty livers in some of these latter animalssuggests an altered metabolic state. Thefailure to gain weight normally may not,therefore, be solely the result of frequentvomiting and depressed food intake.
These observations indicate that anyone formulating cat diets should considerthe nutritional implications of foods containing more than 6.0% glutamic acid.The determination of the amino acid content of food proteins usually involves theacid hydrolysis of the amide group fromglutamine thereby rendering it impos-
»Deady, J. E. Anderson, B., O'Donnell, J. A. HI, Morris,
J. G. & Rogers, Q. R. (1980) Unpublished observations.
by guest on August 19, 2014
jn.nutrition.orgD
ownloaded from
GLUTAMATE EFFECTS ON THIAMIN STATUS OF THE CAT 1577
TABLE 3
Effect of level of dietary glutamic acid and thiamin on plasma pyruvateand lactate concentrations in kittens
Timein days71421243135496484MetabolitePyruvate,
fiMLactate,mMLactate/pyruvatePyruvate,
fiMLactate,mMLactate/pyruvatePyruvate,
fiMLactate,mMLactate/pyruvatePyruvate,
uMLactate,mMLactate/pyruvatePyruvate,
/¿MLactate,mMLactate/pyruvatePyruvate,
¡iMLactate,mMLactate/pyruvatePyruvate,
UMLactate,mMLactate/pyruvatePyruvate,
¿iMLactate,mMLactate/pyruvatePyruvate,
¡IMLactate,mMLactate/pyruvateDiet
1(3%Glu
+ 4.4 mgB,/kgdiet)44
±4'1.53±0.093555
±110.80±0.131565
±81.23±0.311970
±81.86±0.232741
±111.34±0.323338
±101.39±0.033738
±81.17±0.013148
±32.46±1.054954
±190.3±0.065.6Diet
5(12% Glu+ 4.4 mg
B,/kgdiet)46
±91.43±0.113178
±210.76±0.091066
±201.50±0.272381
±151.69±0.182157
±191.9±0.563342
±91.45±0.243560
±101.72±0.182962
±172.23±0.3836117
±170.39±0.093.3Diet6(12%
Glu+ 25 mg
B,/kgdiet)53
±101.61±0.333053±30.87
±0.091652
±4.01.65±0.253257
±61.66±0.102934
±41.48±0.124431
±31.38±0.144437
±51.46±0.234025
±61.95±0.157793
±20.34±0.033.7Diet
T(3% Glu+OB,)63
±161.80±0.252956±5a1.32
±0.152478±5«b1.72
±0.242273
±9"2.34±0.3732
1Means ±SEM; number of animals in each group same as in table 2. 2Fed from day 28 of experiment. •Kittens fed diet 6 different from diet 7 at P < 0.01. * Kittens fed diet 1 different fromdiet 7 at P < 0.025. All data analyzed by Student's t-test.
sible to determine how much of the gluta- cat diets than for those from animalmate quantitated was derived from glu- sources.tamine. With the assumption that theglutamine-to-glutamate ratio is equal for ACKNOWLEDGMENTSall proteins, the kittens would have to eata diet containing the following levels of The authors would like to thank Mr.protein from the indicated sources in John Bryan for transketolase analyses,order to consume more than 6% glutamic Mr. Arthur Aguirre and Ms. Jane Bishopacid: soy, 30% (RP-100 and amino acid for technical assistance and Dr. Guyanalysis, Ralston Purina, St. Lous, MO); Pidgeon, resident at UC Davis Veterinarybeef, 40%; fish, 43%; or egg, 47% (36). Teaching Hospital, for examining the kit-This would indicate that there might be a kens weekly for clinical signs of thiaminlower upper limit for plant proteins in deficiency.
by guest on August 19, 2014
jn.nutrition.orgD
ownloaded from
1578 DEADY ET AL.
LITERATURE CITED
1. Nemeroff, C. B., Konkol, R. J., Bissette, G.,Youngblood, W., Martin, J. B., Brazeau, P.,Rone, M. S., Prange, A. J. Jr., Bréese,G. R. &Kizer, J. S. (1977) Analysis of the disruptionin hypothalamic-pituitary regulation in ratstreated neonatally with monosodium L-gluta-mate (MSG): evidence for the involvement oftuberoinfundibular cholinergic and dopa-aminergic systems in neuroendocrine regulation. Endocrinology 101, 613-622.
2. Lamperti, A. & Blaha, G. (1976) The effectsof neonatally-administered monosodium L-glutamate on the reproductive system ofadult hamsters. Biol. Reprod. 14, 362-369.
3. Olney, J. W. (1969) Brain lesions, obesity,and other disturbances in mice treated withMSG. Science 164, 719-721.
4. Reynolds, W. A., Butler, V. & Lemkey-Johns-ton, N. (1976) Hypothalamic morphologyfollowing ingestion of aspartame or MSG inthe neonatal rodent and primate: a preliminary report. J. Toxicol. Environ. Health 2,471-480.
5. Abraham, R., Swart, J., Goldberg, L. & Coulston,F. (1975) Electron microscopic observationsof hypothalami in neonatal rhesus monkeys(Mucaca mulata) after administration of mono-sodium L-glutamate. Exp. Mol. Path. 23,203-213.
6. Windmueller, H. G. & Spaeth, A. E. (1975)Intestinal metabolism of glutamine and glutamate from the lumen as compared to glutaminefrom blood. Arch. Biochem. Biophys. 171,662-672.
7. Windmueller, H. G. & Spaeth, A. E. (1977)Vascular perfusion of rat small intestine:metabolic studies with isolated and in situpreparations. Fed. Proc. 36, 177-181.
8. Wiseman, G., ed. (1964) Protein: transamina-tion during amino acid absorption. In: Absorption from the Small Intestine, pp. 63-65,Academic Press, New York.
9. Neame, K. D. & Wiseman, G. (1957) Thetransamination of glutamic and aspartic acidduring absorption of the small intestine of thedog in vivo. J. Physiol. 135, 442-450.
10. Swendseid, M. E., Hickson, J. B. & Friedrich,B. W. (1962) Effect of nonessential nitrogensupplementation on growth and on the aminoacid content in plasma and muscle of weanlingrats fed a low protein diet. J. Nutr. 78, 115-119.
11. Harper, A. E., Benevenga, N. J. & Wohlheuter,R. M. (1970) Effects of ingestion of disproportionate amounts of amino acids. Physiol.Rev. 50, 428-539.
12. Peng, Y., Gubin, J., Harper, A. E., Vavich, M. G.& Kemmerer, A. R. (1973) Food intake regulation: amino acid toxicity and changes in ratbrain and plasma amino acids. J. Nutr. 103,608-617.
13. Klain, G. J., Scott, H. M. & Johnson, B. C.(1958) The amino acid requirement of a grow
ing chick fed crystalline amino acids. PoultrySci. 37, 967-977.
14. Anderson, T. A. & Redlin, J. (1973) Effect ofdietary monosodium L-glutamate and cholesterol on growth and lipid metabolism in the rat.Proc. Soc. Exp. Bio. Med. 143, 270-274.
15. Smith, R. R. (1969) Effect of arginine uponthe toxicity of excesses of single amino acids inchicks. J. Nutr. 95, 547-553.
16. Rogers, Q. R. & Morris, J. G. (1979) Essentiality of amino acids for the growing kitten. J.Nutr. 109, 718-723.
17. Rose, W. C., Oesterling, M. J. & Womack, M.(1948) Comparative growth on diets containing 10 and 19 amino acids with furtherobservations on the role of glutamic and asparticacids. J. Biol. Chem. 176, 753-762.
18. Rose, W. C., Smith, L. C., Womack M. & Shane,M. (1949) The utilization of nitrogen of ammonium salts, urea, and certain other compounds in the synthesis of nonessential aminoacids in vivo. J. Biol. Chem. 181, 307-316.
19. Lardy, H. A. & Feldott, G. (1950) The netutilization of ammonium nitrogen by growingrat. J. Biol. Chem. 186, 85-91.
20. Rechcigl, M. Jr., Loosli, J. K. & Williams, H. H.(1957) The net utilization of nonspecific nitrogen sources for the synthesis of nonessentialamino acids. I. Growth and nitrogen utilization.J. Nutr. 63, 177-192.
21. Smith, D. C. & Prourt, L. M.(1944) Development of thiamin deficiency in the cat on a diet ofraw fish. Proc. Soc. Exp. Biol. Med. 56, 1—3.
22. Everett, G. M. (1944) Observations on thebehavior and neurophysiology of acute thiamin-deficient cats. Am. J. Physio. 141, 439-448.
23. Jubb, K. V., Saunders, L. Z. & Coates, H. V.(1956) Thiamin deficiency encephalopathy incats. J. Comp. Path. 66, 217-227.
24. Loew, F. M., Martin, C. L., Dunlop, R. H.,Mapletoff, R. J. & Smith, S. I. (1970) Naturally occurring and experimental thiamin deficiency in cats receiving commercial cat food.Can. Vet. J. 11, 109-113.
25. Hardy, A. J., Morris, J. G. & Rogers, Q. R.(1977) Valine requirement of the growing kitten. J. Nutr. 107, 1308-1312.
26. Gershoff, A. N., Andrus, S. B. & Hegsted, D. M.(1959) The effect of the carbohydrate and fatcontent of the diet upon the riboflavin requirement of the cat. J. Nutr. 68, 75-88.
27. Carey, C. J. & Morris, J. G. (1977) Biotindeficiency in the cat and the effect of hepaticpropionyl CoA carboxylase. J. Nutr. 107,330-334.
28. Cochran, W. G. & Cox, G. M. (1957) Experimental Designs, John Wiley & Sons Inc., NewYork.
29. Horwitz, W., ed. (1975) Method 43:024. In:Official Methods of Analysis of Association ofOfficial Analytical Chemists, pp. 823-825,Washington, DC.
30. Bûcher,T., Czok, R., Lamprecht, W. & Latzko,E. C. (1963) Pyruvate. In: Methods of En-
by guest on August 19, 2014
jn.nutrition.orgD
ownloaded from
GLUTAMATE EFFECTS ON THIAMIN STATUS OF THE CAT 1579
zymatic Analysis (Bergmeyer, H. U., ed.), pp.253-259, Academic Press, New York.
31. Hohorst, H. J. (1965) L-(+)-Lactate: déterminations with lactic dehydrogenase and DPN.In: Methods of Enzymatic Analysis (Bergmeyer, H. U., ed.), pp. 266-270, AcademicPress, New York.
32. Bergmeyer, H. U. & Bernt, E. (1965) o-Oxoglutarate. In: Methods of Enzymatic Analysis (Bergmeyer, H. U., éd.),pp. 324-327,Academic Press, New York.
33. Stevens, C. O., Sauberlich, H. E. & Long, J. L.
(1968) An automated assay for transketolasedeterminations. Technicon Symp. 7, 533-558.
34. Lapin, K. K., ed. (1975) Statistics: Meaningand Method, Harcourt, Brace and JovanovichInc., New York.
35. National Academy of Sciences (1972) Nutrient Requirements of Laboratory Animals, 2ndrev. éd.,NAS, Washington, DC.
36. Block, R. J. & Boiling, D. (1951) The AminoAcid Composition of Proteins and Food, pp.338-342, Charles C. Thomas, Springfield, IL.
by guest on August 19, 2014
jn.nutrition.orgD
ownloaded from