j. marshall phd thesis
TRANSCRIPT
Chemical Arguments Shedding Light on the
Biosynthesis of Curious Natural Products
James William MarshallSchool of Chemistry, August 2010.
A dissertation submitted to the University of Bristol in accordance with the
requirements for award of the degree of Ph.D in the Faculty of Science.
Word count (text only): 37,877
i
Abstract
The study of biosynthesis is fascinating and with progression in molecular biology, understanding of the field is advancing rapidly. Underpinning all areas of biosynthetic research however, is natural product chemistry. The isolation and characterisation of compounds provides the answers to the questions posed by molecular biology and genetics. Isotopic labelling studies also remain fundamental to the identification of biosynthetic pathways, linking compound structures to genes.
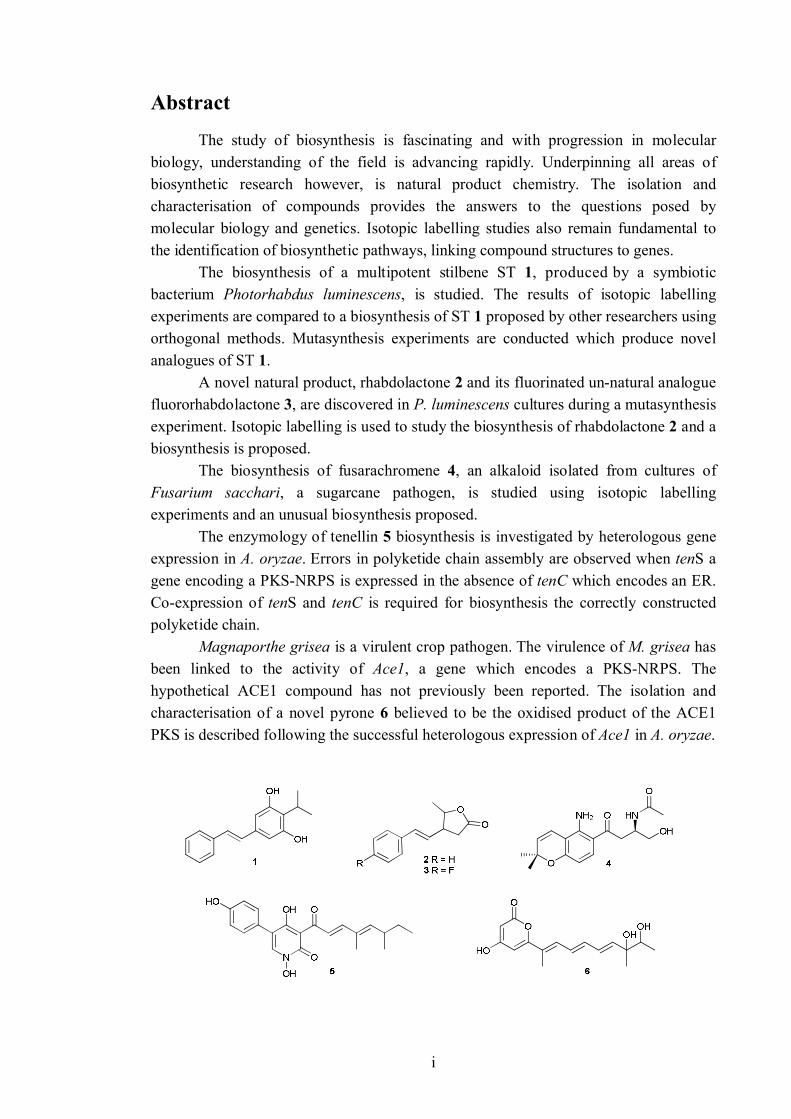
The biosynthesis of a multipotent stilbene ST 1, produced by a symbiotic bacterium Photorhabdus luminescens, is studied. The results of isotopic labelling experiments are compared to a biosynthesis of ST 1 proposed by other researchers using orthogonal methods. Mutasynthesis experiments are conducted which produce novel analogues of ST 1.
A novel natural product, rhabdolactone 2 and its fluorinated un-natural analogue fluororhabdolactone 3, are discovered in P. luminescens cultures during a mutasynthesis experiment. Isotopic labelling is used to study the biosynthesis of rhabdolactone 2 and a biosynthesis is proposed.
The biosynthesis of fusarachromene 4, an alkaloid isolated from cultures of Fusarium sacchari, a sugarcane pathogen, is studied using isotopic labelling experiments and an unusual biosynthesis proposed.
The enzymology of tenellin 5 biosynthesis is investigated by heterologous gene expression in A. oryzae. Errors in polyketide chain assembly are observed when tenS a gene encoding a PKS-NRPS is expressed in the absence of tenC which encodes an ER. Co-expression of tenS and tenC is required for biosynthesis the correctly constructed polyketide chain.
Magnaporthe grisea is a virulent crop pathogen. The virulence of M. grisea has been linked to the activity of Ace1, a gene which encodes a PKS-NRPS. The hypothetical ACE1 compound has not previously been reported. The isolation and characterisation of a novel pyrone 6 believed to be the oxidised product of the ACE1 PKS is described following the successful heterologous expression of Ace1 in A. oryzae.
ii
Dedication and Acknowledgements
This thesis is dedicated to all my family and friends. Thank you all, in particular, Mum,
Dad, Ros, Kate (Wee Feeney) and Mike the Greek.
I am very grateful to Mr Mark Evans, whose scholarship provided financial
backing to my research. It was a pleasure to have update meetings with someone who
shared my enthusiasm, not only for my science, but the many other topics we discussed
over several excellent lunches. Thanks also go to the BBSRC which provided half my
stipend for three years, then an extra twelve months stipend allowing me to continue to
experiment. Thanks also to the Bristol University Alumni foundation for the travel grant
which enabled me to attend the Natural Products Conference 2008 (in Antigua).
Thanks to all the support staff in the School of Chemistry, particularly to Rose
and Paul who go out of their way to ensure that some of the most important research
facilities run like clockwork.
Thanks to all the people who have passed through lab N314 and the biosuite in
the few years I have been in residence. You are too many to mention by name, but each
of you has contributed to the stimulating working environment we have shared, which is
unique without question.
Thank you to all the people (from biology, N314, and external organisations)
who have collaborated with me on some of the various projects I have been fortunate
enough to work on. In particular I would like to thank Asifa, Laura, Song and Walid
who were major (biological) contributors to Chapters 4, 5 and 6. A special thank you to
Song, who taught me all (not much) I know about practical molecular biology and
biochemistry.
Thank you to a few people who have contributed to my studies both
scientifically and ‘non-scientifically’, namely: Andy, Annabel (Chemistry) Murphy,
Elizabeth, Helen, Jack (and Maddy), Jennifer, Mc Chris (and family) and Pedro, for:
dinner, drinks, laughter, poker, squash, teatimes, tennis, witty banter and much more
(including some science).
Thanks to Craig who has worked hard to ensure that the NMR facility is able to
answer the demands of tenacious natural product chemists, who have a propensity to
ask for experiments that haven’t been tried or tested (or even thought of) on our
equipment. Who the hell is Graham Onions anyway?
Thank you to Russell for all your constructive criticism over the years. Although
not always gratefully received at the time, there is no question that I have improved
iii
enormously as a scientist as a result of this and although I still have a long way to go, I
am very grateful. I have really enjoyed working with you.
Thank you Tom for all the things you have done for me over the years (often
behind the scenes), including arranging an extra 12 months stipend and writing terrific
references. I really appreciate it. Thank you for all the many structure elucidation and
biosynthetic hypothesis brainstorming sessions which were insightful, illuminating and
always very enjoyable because of your infectious enthusiasm for all types of natural
product chemistry. When I first came to see you as a project student several years ago, I
had no intention of going on to carry out a Ph.D, but your vision and advice (and the
fascination for the biosynthesis of natural products I quickly developed) changed my
mind. I am very glad it did.
Finally I would like to thank the people who I consider to be responsible for my
general interest in all aspects of science as a whole and who inspired me to study
chemistry. Mr Crockett (Bournemouth Grammar) was an inspirational chemistry
teacher; he was enthusiastic about his subject and keen for others to share his
enthusiasm, particularly for practical chemistry, which sadly seems to be disappearing
from classrooms nowadays. To Grandad, I admit, I wasn’t sure whether you expressed
the opinion of the whole family when you said “no one in this family is ever going to
stop you from studying chemistry” when we spoke about what I intended to put on my
UCAS form. I am sure though, that talking to you over the last 26 years or so has been
one of the biggest influences behind my interest in science and although you claim
analytical chemistry has moved on a bit since you retired, the problem solving remains,
so I hope you enjoy this account of nearly four years of applied analysis (no one else in
the family is likely to!). You can always ask Granny if you would like any clarification.
iv
Authors Declaration
I declare that the work in this dissertation was carried out in accordance with the requirements of the University's Regulations and Code of Practice for Research Degree Programmes and that it has not been submitted for any other academic award. Except where indicated by specific reference in the text, the work is the candidate's own work. Work done in collaboration with, or with the assistance of, others, is indicated as such. Any views expressed in the dissertation are those of the author.
SIGNED: ............................................................. DATE:..........................
v
Table of Contents
Abstract ........................................................................................................................... i
Dedication and Acknowledgements ................................................................................ ii
Authors Declaration....................................................................................................... iv
Table of Contents............................................................................................................ v
List of abbreviations ....................................................................................................... x
1.0 Introduction .............................................................................................................. 1
1.1 Natural product biosynthesis .......................................................................... 2
1.1.1 Polyketide biosynthesis....................................................................... 2
1.1.2 Non ribosomal peptide biosynthesis .................................................... 8
1.1.3 PKS-NRPS hybrid pathways............................................................. 10
1.1.4 Terpene biosynthesis......................................................................... 11
1.1.5 Alkaloid biosynthesis........................................................................ 12
1.1.6 Tailoring reactions ............................................................................ 13
1.2 Approaches to study biosynthesis ................................................................. 14
1.2.1 Chemical approaches. ....................................................................... 14
1.2.2 Biological approaches. ...................................................................... 16
1.3 Harnessing biosynthesis ............................................................................... 17
1.4 Research Aims ............................................................................................. 19
2.0 Biosynthesis of an unusual stilbene natural product in Photorhabdus luminescens
TT01............................................................................................................................. 21
2.0.1 Previous work ........................................................................................... 25
2.0.2 Aims ......................................................................................................... 26
2.1 The biosynthesis of ST ................................................................................. 26
2.1.1 Acetate labelling studies ................................................................... 27
2.1.2 Isopropylmalonate labelling study..................................................... 30
2.1.3 Leucine labelling study..................................................................... 31
2.1.4 [1-13C] cinnamate labelling study...................................................... 33
2.2 Mutasynthesis .............................................................................................. 36
2.2.1 ortho-fluorocinnamate feed............................................................... 37
2.2.2 meta-fluorocinnamate feed................................................................ 40
2.2.3 para-fluorocinnamate feed................................................................ 43
2.3 Conclusion ................................................................................................... 46
2.4 Further work................................................................................................. 47
vi
3.0 Fluororhabdolactone – synthesis and biosynthesis ................................................... 48
3.1 Relative stereochemistry of fluororhabdolactone .......................................... 48
3.2 Two step total syntheses of a hypothetical natural product and an un-natural
natural product......................................................................................................... 48
3.3 Detection of rhabdolactone........................................................................... 50
3.4 Investigating possible downstream pathways from rhabdolactone................. 52
3.5 The biosynthesis of fluororhabdolactone ...................................................... 55
3.5.1 Acetate labelling studies in fluororhabdolactone ............................... 57
3.5.2 Methionine and leucine labelling in fluororhabdolactone .................. 59
3.5.3 Cinnamate labelling in fluororhabdolactone...................................... 60
3.5.4 Fluororhabdolactone biosynthetic proposal ....................................... 62
3.5.5 Biotransformations ........................................................................... 63
3.5.6 Acetoacetate feeds ............................................................................ 66
3.6 Rhabdolactone reported in the literature[100].................................................. 70
3.7 Conclusion ................................................................................................... 70
3.8 Suggested further work................................................................................. 71
4.0 Fusarachromene – novel metabolite of Fusarium sacchari ...................................... 73
4.1 Aims ............................................................................................................ 74
4.2 Chromatographic analysis of crude F. sacchari culture extracts.................... 74
4.3 Isolation and identification of metabolites .................................................... 75
4.3.1 Compound A .................................................................................... 75
4.3.1 Compound B .................................................................................... 76
4.4 Fusarachromene stereochemistry.................................................................. 80
4.4.1 MTPA derivatisation of fusarachromene........................................... 82
4.4.1 Chemical models .............................................................................. 86
4.4.1 Derivatisation to aid crystalisation .................................................... 91
4.5 Fusarachromene biosynthesis ....................................................................... 93
4.5.1 Acetate labelling study...................................................................... 94
4.5.2 [U-13C6]-Glucose labelling study .................................................... 101
4.5.3 [U-13C3]-Glycerol labelling study.................................................... 104
4.5.4 [4-13C]-L-Aspartate labelling study................................................. 107
4.5.5 Revision of biosynthetic proposal ................................................... 107
4.5.6 Thoughts on fusarachromene biosynthesis ...................................... 111
4.5.7 Biosynthetic implications of stereochemical assignment ................. 112
4.6 Biological activity ...................................................................................... 113
vii
4.7 Conclusion ................................................................................................. 115
4.8 Suggested future work................................................................................ 115
5.0 Structure elucidation of fungal metabolites: Investigating the function of enzymes
responsible for tenellin biosynthesis in Beauvaria bassiana ........................................ 117
5.1 Expression of tenS...................................................................................... 119
5.2 Results ....................................................................................................... 120
5.2.1 Compound A .................................................................................. 122
5.2.2 Compound B .................................................................................. 124
5.3 Co-expression of tenS with tenC (ER) ........................................................ 127
5.4 Conclusion ................................................................................................. 127
5.5 Further work............................................................................................... 128
6.0 Investigating the chemistry of Ace1, a gene encoding a PKS-NRPS of unknown
function in Magnaporthe grisea .................................................................................. 130
6.1 Expression of Ace1 ..................................................................................... 131
6.2 Results ....................................................................................................... 132
6.2.1 Compound A .................................................................................. 133
6.2.2 Compound B .................................................................................. 137
6.2.3 Heterologous expression of Ace1 in A. oryzae results in the production of
12,13-dihydroxymagnaporthepyrone 203 ....................................................... 138
6.2.4 Biological activity........................................................................... 139
6.2.5 Acetate labelling ............................................................................. 140
6.3 Conclusions................................................................................................ 141
6.4 Further work............................................................................................... 142
Experimental............................................................................................................... 143
General Methods.............................................................................................. 143
Culturing strains of P. luminescens TT01 and StlA................................ 143
Extraction of secondary metabolites from cultures of P. luminescens....... 143
Culturing F. sacchari............................................................................... 144
Culturing A. oryzae transformants ........................................................... 144
Extraction of secondary metabolites from A. oryzae transformants and cultures
of F. sacchari ................................................................................................. 144
F. sacchari biological assays ................................................................... 144
Analysis of compounds and mixtures by TLC ......................................... 145
Separation of components of crude P. luminescens and F. sacchari extracts by
flash chromatography..................................................................................... 145
viii
GCMS method ........................................................................................ 145
HPLC methods ........................................................................................ 146
Instrumentation ....................................................................................... 149
Characteristic data and compound origin. ......................................................... 150
ST 1[67] .................................................................................................... 150
-Angelica lactone 94[91] ......................................................................... 150
Rhabdolactone 2 (synthetic)[90] ................................................................ 151
Fluororhabdolactone 3 (synthetic) ........................................................... 151
Fluororhabdolactone 3 (Isolated) ............................................................. 152
trans-Cinnamic acid 12[33] ....................................................................... 153
p-Fluoro trans-cinnamic acid 54.............................................................. 153
Isopropylmalonate 56 .............................................................................. 154
[2-13C] Isopropylmalonate 59 .................................................................. 155
Diethyl [2-13C] isopropylmalonate 61...................................................... 155
Diethyl isopropylmalonate 61’[175] ........................................................... 156
[1-13C] trans-Cinnamic acid 68[33] ........................................................... 157
Extended o-fluorocinnamates (E, E)-71 and (E)-72.................................. 157
Extended o-fluorocinnamate methyl esters (E, E)-73 and (E)-74.............. 158
o-Fluoro ST 75 ........................................................................................ 158
Epoxy-o-fluoro ST 76.............................................................................. 159
Extended m-fluorocinnamates (E, E)-77 and (E)-78................................. 159
Extended m-fluorocinnamate methyl esters (E, E)-79 and (E)-80............. 160
m-Fluoro ST 81 and epoxy-m-fluoro ST 82 ............................................. 161
Extended p-fluorocinnamates (E, E)-83 and (E)-84.................................. 161
Extended p-fluorocinnamate methyl esters (E, E)-85 and (E)-86.............. 162
p-Fluoro ST 87 and epoxy-p-fluoro ST 88 ............................................... 163
m-Fluororhabdolactone 97....................................................................... 163
[1-13C] p-Fluoro trans-cinnamic acid 104 ................................................ 164
Lithium acetoacetate 112......................................................................... 165
Lithium [2,4-13C2] acetoacetate 114......................................................... 165
Fusaric acid 122[120]................................................................................. 165
Fusarachromene 123................................................................................ 166
Fusarachromene (S)-MTPA ester 136...................................................... 167
Fusarahromene (R)-MTPA ester 137 ....................................................... 167
p-Bromo-benzoyl chromene 150.............................................................. 168
ix
N-acetyl –(S)-serine methyl ester 141[137]................................................. 169
Aspartate model compound 142[138] ......................................................... 169
(S)-L-Serine methyl ester hydrochloride 143[139] ...................................... 170
Serine model (R)-MTPA ester 144........................................................... 171
Serine model (S)-MTPA ester 145........................................................... 171
N-Acetyl-(S)-aspartic acid 146[136] ........................................................... 172
N-Acetyl-(S)-aspartic anhydride 147[136, 138] ............................................. 172
Aspartate model (R)-MTPA ester 148...................................................... 173
Aspartate model (S)-MTPA ester 149...................................................... 174
Pre-tenellin A 198 ................................................................................... 174
Proto-tenellin A 201 and Proto-tenellin B 202 ......................................... 175
12,13-Dihydroxymagnaporthepyrone 203................................................ 176
References .................................................................................................................. 178
x
List of abbreviations
A adenylation domain
ACE1 avirulence conferring enzyme 1
ACP acyl carrier protein
AT acyl transferase
ATP adenosine triphosphate
Bkd branched chain keto-acid dehydrogenase
BMS Bristol-Myers Squibb
BSTFA N,O-bis (trimethlsilyl) trifluoroacetamide
C condensation domain
CD Czapek Dox
CM complete medium
CMet C-methyltransferase
CoA coenzyme A
COSY correlation spectroscopy
Cyc cyclase
DAD diode array detector
DAHP 3-deoxy-D-arabino-heptulosonate-7-phosphate
DEBS 6-deoxyerythronolide B synthase
DEPT distortionless enhancement by polarisation transfer
DH dehydratase
DHAP dihydroxyacetone-phosphate
DMAP 4-dimethylaminopyridine
DMAPP dimethylallyl pyrophosphate
DMAT dimethylallyl transferase
DMF dimethylformamide
DMSO dimethylsulfoxide
E epimerase
ELSD evaporative light scattering detector
ER enoyl reductase
ESI electrospray ionisation
F formylase
GAP glyceraldehyde-3-phosphate
GC-MS gas chromatography-mass spectrometry
HMBC heteronuclear multiple bond correlation
xi
HMG hydroxymethylglutaryl
HPLC high performance liquid chromatography
HRMS high resolution mass spectrometry
HSQC heteronuclear single quantum coherence
IJ infective juvenile
IPP isopentenyl pyrophosphate
IR infra red
KR ketoreductase
KS ketosynthase
LB Luria-Bertani
LC-MS liquid chromatography-mass spectrometry
LDKS lovastatin diketide synthase
LNKS lovastatin nonaketide synthase
MS mass spectrometry
MTPA α-methoxy-α-trifluoromethyl-phenyl acetate
MVA mevalonic aid
MY manitol yeast extract medium
NADPH nicotinamide adenine dinucleotide phosphate
NMR nuclear magnetic resonance
nOe nuclear Overhauser effect
NRPS non-ribosomal peptide synthetase
PAL phenylalanine ammonia lyase
PCF plant cell fermentation
PCP peptidyl carrier protein
PKS polyketide synthase
PLP pyridoxal phosphate
ppm parts per million
PPP pentose phosphate pathway
R reductive domain
Rf retention factor
RP reversed phase
RT-PCR reversed transcriptase-polymeric chain reaction
SAM S-adenosyl methionine
SIM selective ion monitoring
ST 3,5-dihydroxy-4-isopropyl-stilbene

xii
STS stilbene synthase
T thiolation domain
TE thiolesterase
THF tetrahydrofuran
TLC thin layer chromatography
TMS trimethylsilyl
UV ultra violet
WT wild type
1
1.0 Introduction
The term natural product, broadly speaking, refers to any chemical entity produced by a
living organism.[1] Natural products then, include the primary metabolites which play a
central role in the metabolism and reproduction of organisms such as amino acids,
proteins, sugars and nucleic acids.[1] The term ‘natural products’, is also commonly used
to refer to secondary metabolites and will be used in this context in the following
chapters.[1, 2] Secondary metabolites are typically produced from a relatively small range
of building blocks and key intermediates such as amino acids, malonate 7, mevalonate 8
and shikimate 9, which are present as a result of the pathways responsible for the
production or catabolism of primary metabolites.[2] Primary metabolites typically exert
their biological effects within the cell or organism responsible for their production.[1]
Unlike primary metabolites, secondary metabolites usually have no proven effect on the
producing organism, but often possess biological activity against other organisms.[1]
The activities displayed by natural products are wide ranging but are typically
thought to offer a competitive advantage to the producing organism.[1] There are many
instances of potent antimicrobial compounds which are produced by microorganisms
and toxins and insecticides produced by plants and animals are also well known.[1, 3-5]
Whether as stimulants or poisons, or to treat illnesses, the biological activities of natural
products have been of significance to human civilisation presumably since before
recorded history and this significance has not diminished over time. Reports show that
in the field of cancer therapy alone of the 155 small molecules approved since the
1940s, 47% are either natural products or natural product derived.[6] Natural product
derivatives also account for over 50% of pharmaceutical compounds across all
therapeutic areas introduced between 1981 and 2002. This equates to more than 450 top
selling compounds.[7]
In recent years, chemical scientists have worked to produce novel chemical
entities to combat drug resistance and to lower the toxicity and increase the efficacy of
potentially useful pharmaceutical and agrochemical compounds. Considerable time and
funding has been invested in the development of synthetic methodology aimed at the
production of natural products and natural product analogues via total or semi synthesis
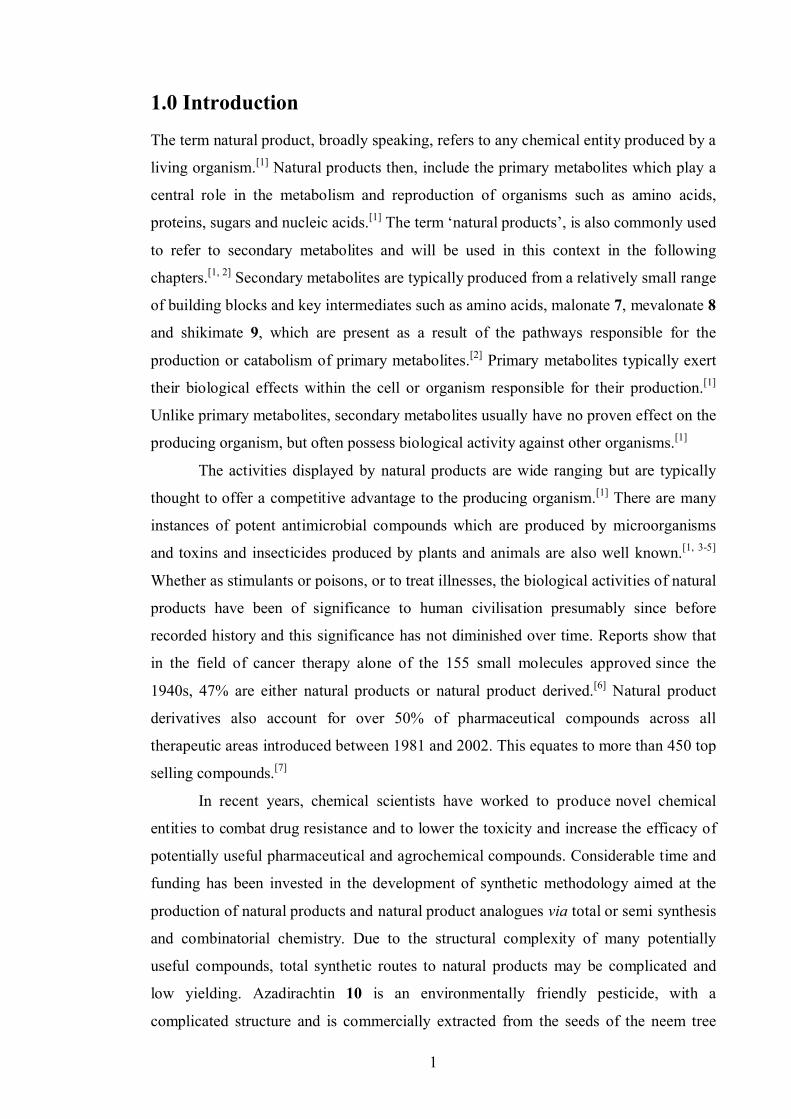
and combinatorial chemistry. Due to the structural complexity of many potentially
useful compounds, total synthetic routes to natural products may be complicated and
low yielding. Azadirachtin 10 is an environmentally friendly pesticide, with a
complicated structure and is commercially extracted from the seeds of the neem tree
2
Azadirachta indica.[8] Many synthetic chemists have aspired to synthesise Azadirachtin
10, yet just one total synthesis has been reported so far, taking 22 years for 40 co-
workers to complete.[9]
Combinatorial chemistry techniques have successfully been used in the
optimization of many approved pharmaceuticals; nevertheless in the 25 years preceding
2006 only one de novo combinatorial compound produced by combinatorial chemistry
was approved as a drug.[6]
In the future scientists will continue to investigate solutions to many of the
problems facing modern societies such as antibiotic resistance, sourcing alternative
renewable energy from bio-fuels and increasing food production in line with an ever
increasing global population. Chemistry is likely to be at the forefront of this research
and natural products, which are the largest library of biologically active and efficacious
compounds in existence, will probably be involved in some of the solutions.
1.1 Natural product biosynthesis
One of the most fascinating aspects of natural product chemistry is that despite their
extremely broad ranging biological activities, natural products are constructed from a
relatively small pool of simple chemical building blocks. The range of biological
activities exhibited by natural products is related to their amazing structural diversity
which is in turn related to the level of control of the molecular machinery responsible
for their production. All natural product families, including non-ribosomal peptides,
terpenes, alkaloids and polyketides are classified according to the common building
blocks from which they are constructed. Biosynthesis of natural product families
relevant to the research in the following chapters is briefly discussed below.
1.1.1 Polyketide biosynthesis
Polyketides are produced by organisms including sponges, fungi, plants and bacteria.
Arguably more so than other families of natural products, the polyketides display an
3
overwhelming array of functional and structural diversity.[10] It is perhaps as a result of
this diversity that the polyketides exhibit physiological activities which are more varied
and extensive than those seen in other classes of compounds. Well known activities of
polyketides include antibiotic, antifungal, anti parasitic and anticancer properties among
others.[10]
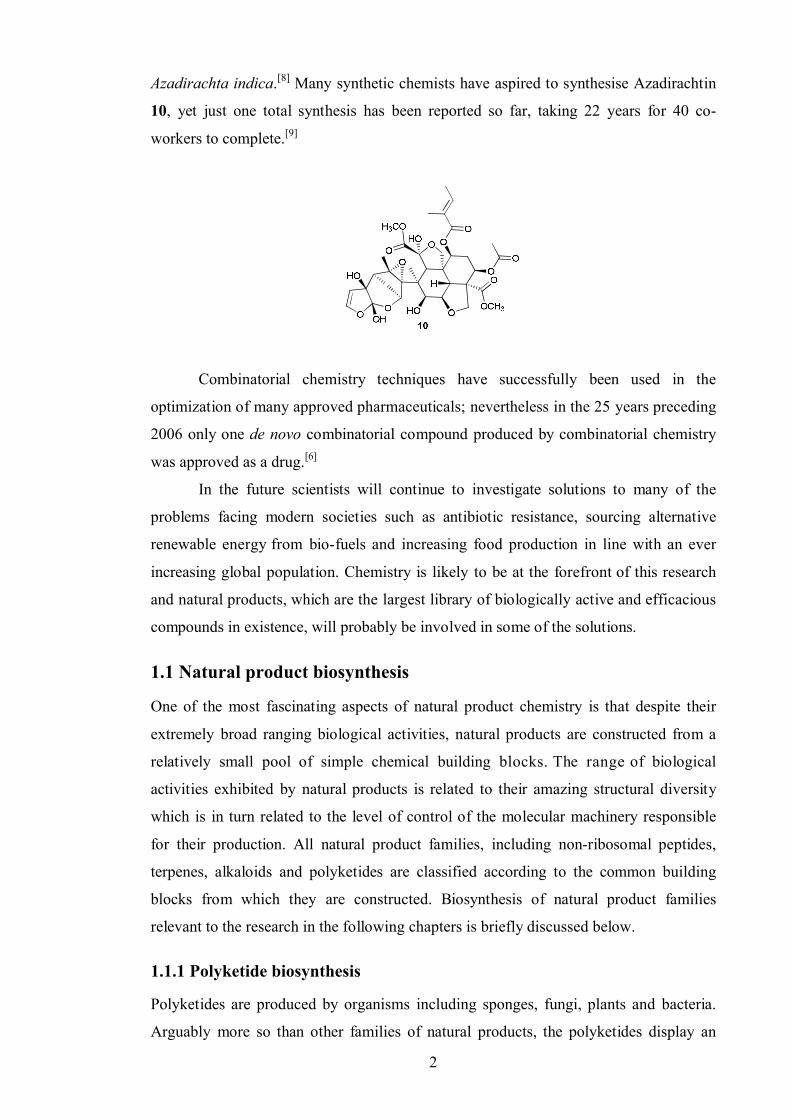
The building blocks of polyketide biosynthesis are small carboxylic acids.[2]
Acetate 11 is perhaps the most common starter unit although other carboxylates such as
cinnamate 12 are used. Once the starter unit has been selected and enzyme bound,
successive acetate units are joined to it in a head to tail fashion by a series of
decarboxylative Claisen condensations of malonate 7 (itself produced by carboxylation
of acetate) onto the growing carbon backbone. Between each round of chain extension a
series of further chemical reactions such as methylations and reductions are possible
which create functionality in the growing chain (Scheme 1). Polyketide biosynthesis is
controlled by a family of enzymes known as polyketide synthases (PKS) which can be
thought of as ‘molecular machines’.
Scheme 1: Reactions and enzymes involved in polyketide biosynthesis
PKS are large multifunctional proteins which use a series of discrete catalytic
domains to biosynthesise polyketides and their biosynthetic intermediates. The starter
unit is first bound to the ketosynthase (KS) via a cysteine thiol. It is the KS which
catalyses chain extension. The chain extender unit is bound to the thiol residue of the
phosphopantetheine moiety of what is known as the acyl carrier protein (ACP). The
ACP is believed to act as a swinging arm which carries the growing chain to the active
4
sites of the required enzymes to produce the polyketide. Between extension cycles the
β-keto thiolester may be reduced by a ketoreductase (KR) which delivers a hydride from
NADPH to either the Re or Si face of the ketone, (resulting in a chiral alcohol). This
chiral alcohol can then be dehydrated to give an alkene by a dehydratase (DH). The
resulting alkene can be further reduced to an alkane by an enoylreductase (ER) again
with the use of the cofactor NADPH. Following the required chain extension and
reduction steps the polyketide product is passed to a thiolesterase (TE) and released.[2,
10]
PKS can be classified by type (type I, II or III) according to enzyme architecture.
Although in each type of PKS the same catalytic domains catalyse the same reactions
between the same or similar building blocks, the distinct architecture of each type lends
itself to the production of polyketides with particular structural features.
1.1.1.1 Type I PKS
In type I PKS the catalytic functions are covalently linked (all part of the same protein
backbone). These enzymes may be used singularly in order (‘Modular’ type I PKS) or
iteratively (‘Iterative’ type I PKS). In an iterative PKS there is just one set of catalytic
domains, with each domain used in any of the catalytic cycles for which it is required. A
modular PKS can be thought of as a molecular production line or ‘conveyer belt’.[10] In
a modular system each domain carries out its function according to its order in the
peptide sequence and is only used in a single cycle.
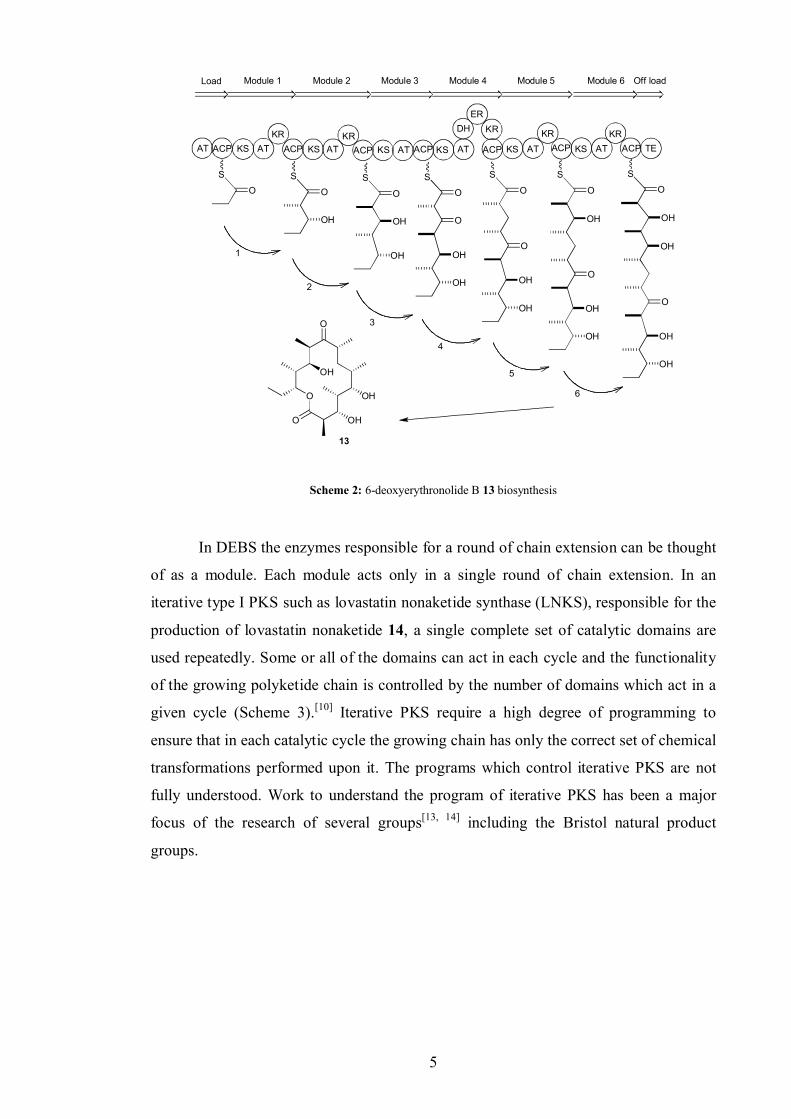
6-Deoxyerythronolide B 13 is the precursor of the active antibiotic erythromycin
A.[10] 6-Deoxyerythronolide B synthase (DEBS) is one of the most studied examples of
a modular type I PKS. In 6-deoxyerythronolide B 13 biosynthesis (Scheme 2) there is
an AT, ACP and KS domain for each chain extension cycle. Varying levels of reduction
are achieved in each cycle. In cycles 1, 2, 5 and 6 a KR domain reduces the ketone to an
alcohol. In cycle 3 the ketone is completely unreduced. In cycle 4 the ketone is reduced
to an alcohol, dehydrated (DH) and the resulting alkene reduced to an alkane (ER).[11, 12]
5
S
OS
O
OH
S
O
OH
OH
S
O
O
OH
OH
O
OH
OH
S
O
O
OH
OH
OH
S
O
O
OH
OH
OH
OH
S
O
13
AT AT AT AT AT AT ATACP ACP ACP ACP ACP ACP ACPKS KS KS KS KS KSKR KR
KR KR KRDHER
TE
1
2
3
4
5
6
O
OHO
OHO
OH
Load Module 1 Module 2 Module 3 Module 4 Module 5 Module 6 Off load
Scheme 2: 6-deoxyerythronolide B 13 biosynthesis
In DEBS the enzymes responsible for a round of chain extension can be thought
of as a module. Each module acts only in a single round of chain extension. In an
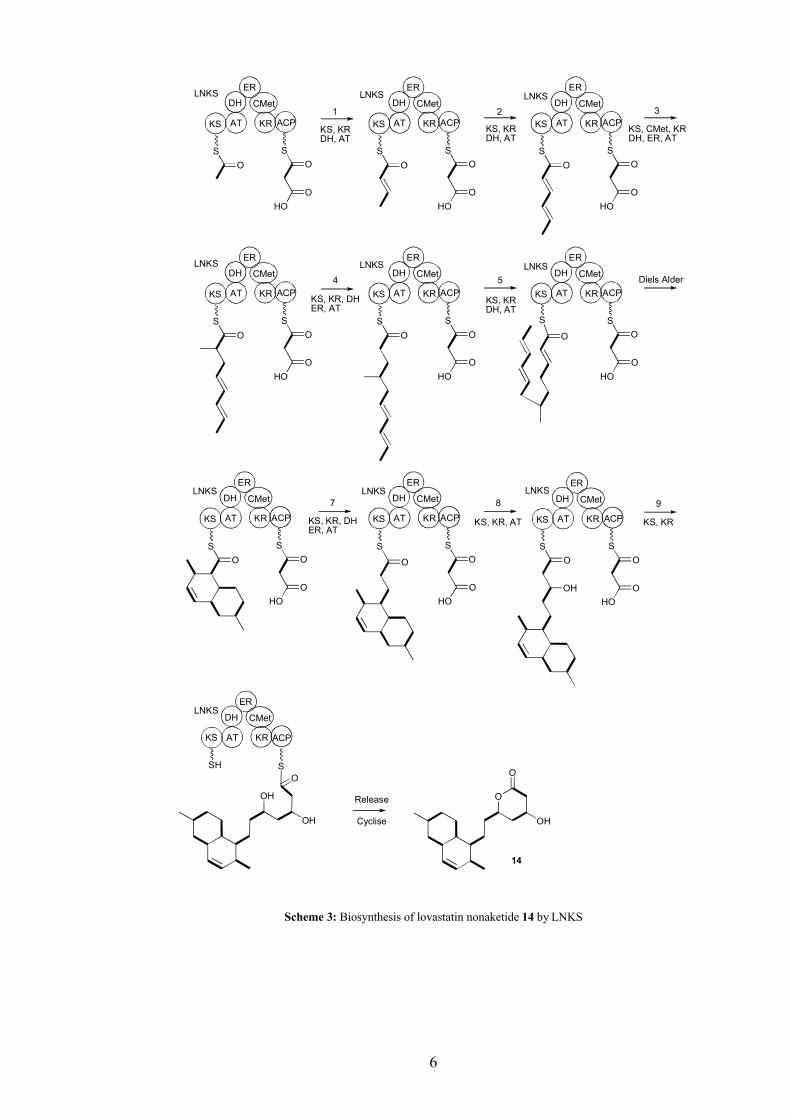
iterative type I PKS such as lovastatin nonaketide synthase (LNKS), responsible for the
production of lovastatin nonaketide 14, a single complete set of catalytic domains are
used repeatedly. Some or all of the domains can act in each cycle and the functionality
of the growing polyketide chain is controlled by the number of domains which act in a
given cycle (Scheme 3).[10] Iterative PKS require a high degree of programming to
ensure that in each catalytic cycle the growing chain has only the correct set of chemical
transformations performed upon it. The programs which control iterative PKS are not
fully understood. Work to understand the program of iterative PKS has been a major
focus of the research of several groups[13, 14] including the Bristol natural product
groups.
6
LNKS
S S
AT ACPKS KR
DH
ER
CMet
O
HO
OS S
AT ACPKS KR
DH
ER
CMet
O
HOO
OS S
AT ACPKS KR
DH
ER
CMet
O
HO
O
LNKS LNKS
LNKS
S S
AT ACPKS KR
DH
ER
CMet
O
HO
OS S
AT ACPKS KR
DH
ER
CMet
O OS S
AT ACPKS KR
DH
ER
CMetLNKS LNKS
1 2 3
4 5 Diels Alder
7
O
O O
HOO O
O
HOO
S S
AT ACPKS KR
DH
ER
CMetLNKS
O
HOO
O
8
S S
AT ACPKS KR
DH
ER
CMetLNKS
O
HOO
9
S
AT ACPKS KR
DH
ER
CMetLNKS
O
HOO
O
SO
OH
S
AT ACPKS KR
DH
ER
CMetLNKS
SH
OH
OH
O
Release
Cyclise OH
O
O
14
KS, KRDH, AT
KS, KRDH, AT
KS, KRDH, AT
KS, CMet, KRDH, ER, AT
KS, KR, DHER, AT
KS, KR, DHER, AT
KS, KR, AT KS, KR
Scheme 3: Biosynthesis of lovastatin nonaketide 14 by LNKS
7
1.1.1.2 Type II PKS
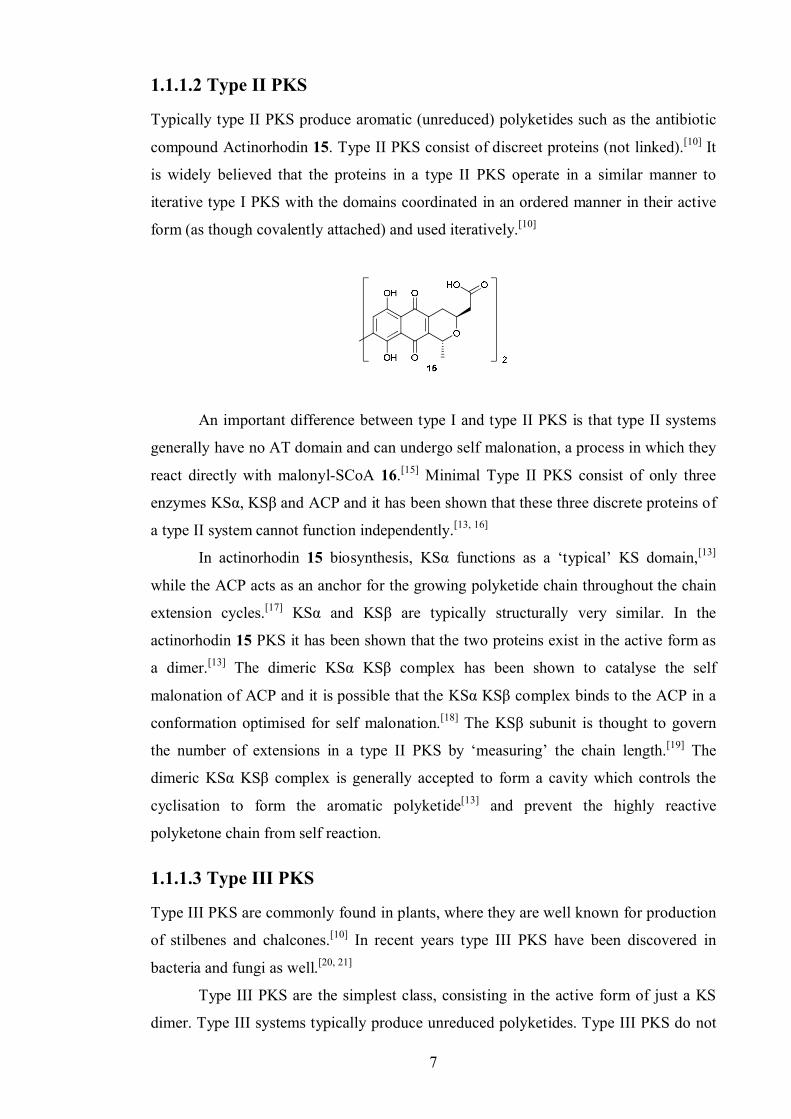
Typically type II PKS produce aromatic (unreduced) polyketides such as the antibiotic
compound Actinorhodin 15. Type II PKS consist of discreet proteins (not linked).[10] It
is widely believed that the proteins in a type II PKS operate in a similar manner to
iterative type I PKS with the domains coordinated in an ordered manner in their active
form (as though covalently attached) and used iteratively.[10]
An important difference between type I and type II PKS is that type II systems
generally have no AT domain and can undergo self malonation, a process in which they
react directly with malonyl-SCoA 16.[15] Minimal Type II PKS consist of only three
enzymes KSα, KSβ and ACP and it has been shown that these three discrete proteins of
a type II system cannot function independently.[13, 16]
In actinorhodin 15 biosynthesis, KSα functions as a ‘typical’ KS domain,[13]
while the ACP acts as an anchor for the growing polyketide chain throughout the chain
extension cycles.[17] KSα and KSβ are typically structurally very similar. In the
actinorhodin 15 PKS it has been shown that the two proteins exist in the active form as
a dimer.[13] The dimeric KSα KSβ complex has been shown to catalyse the self
malonation of ACP and it is possible that the KSα KSβ complex binds to the ACP in a
conformation optimised for self malonation.[18] The KSβ subunit is thought to govern
the number of extensions in a type II PKS by ‘measuring’ the chain length.[19] The
dimeric KSα KSβ complex is generally accepted to form a cavity which controls the
cyclisation to form the aromatic polyketide[13] and prevent the highly reactive
polyketone chain from self reaction.
1.1.1.3 Type III PKS
Type III PKS are commonly found in plants, where they are well known for production
of stilbenes and chalcones.[10] In recent years type III PKS have been discovered in
bacteria and fungi as well.[20, 21]
Type III PKS are the simplest class, consisting in the active form of just a KS
dimer. Type III systems typically produce unreduced polyketides. Type III PKS do not
8
rely upon the ACP to transfer substrates and intermediates between active sites of
enzymes often using malonyl-SCoA 16 thiolesters directly. Type III PKS do not possess
an AT domain.[10] Substrate priming, decarboxylation and chain extension of substrates,
ring closing and or aromatisation of the polyketide all occurs in a single multifunctional
active site.[21]
Type III PKS are generally perceived to be remarkably relaxed with regard to
substrate specificity. Plant type III PKS for example have been shown to accept a
variety of un-natural substrates such as aromatic and aliphatic CoA thiolesters in place
of malonyl thiolesters. This allows for great potential in harnessing the biosynthesis of
polyketides and engineering production of biologically active small molecules.[22]
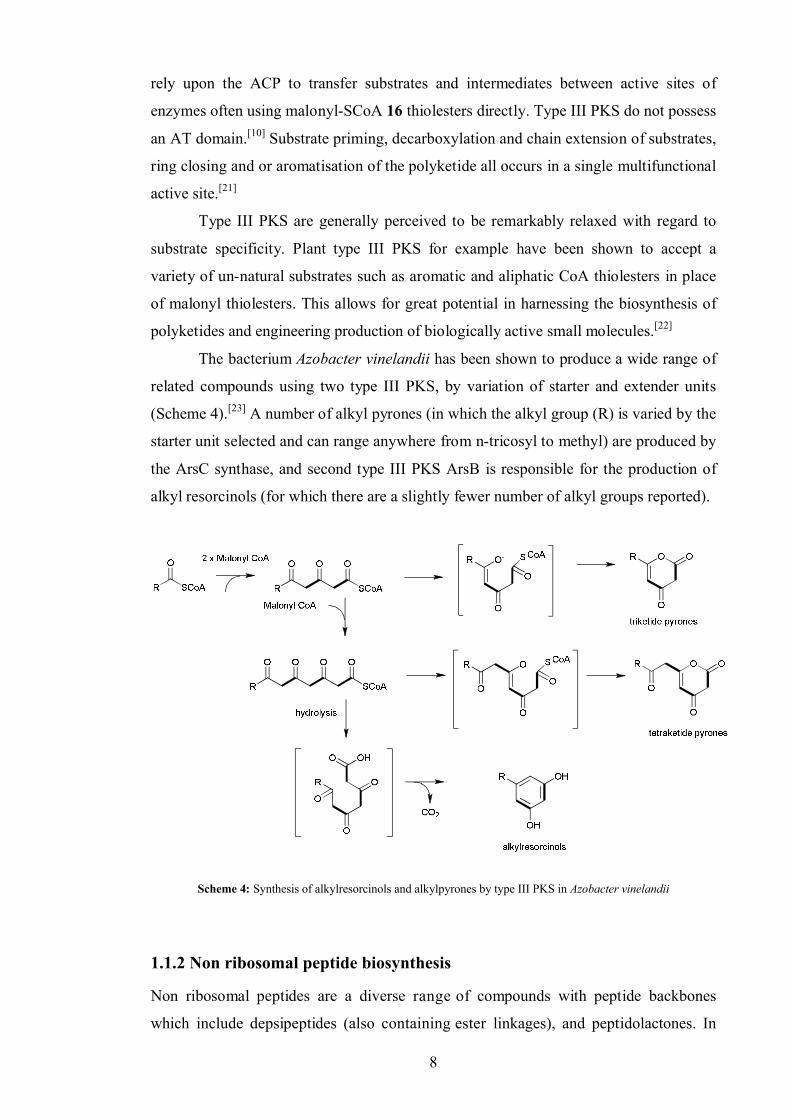
The bacterium Azobacter vinelandii has been shown to produce a wide range of
related compounds using two type III PKS, by variation of starter and extender units
(Scheme 4).[23] A number of alkyl pyrones (in which the alkyl group (R) is varied by the
starter unit selected and can range anywhere from n-tricosyl to methyl) are produced by
the ArsC synthase, and second type III PKS ArsB is responsible for the production of
alkyl resorcinols (for which there are a slightly fewer number of alkyl groups reported).
Scheme 4: Synthesis of alkylresorcinols and alkylpyrones by type III PKS in Azobacter vinelandii
1.1.2 Non ribosomal peptide biosynthesis
Non ribosomal peptides are a diverse range of compounds with peptide backbones
which include depsipeptides (also containing ester linkages), and peptidolactones. In
9
contrast to the ribosomal synthesis of peptides and proteins, non ribosomal peptides are
not restricted to proteinogenic amino acids as building blocks. Non ribosomal peptides
are assembled from a large pool of possible precursors including pseudo,
nonproteinogenic, hydroxy, N-methylated and D-amino acids.[24]
Non ribosomal peptide synthesis is carried out by non ribosomal peptide
synthetases (NRPS). NRPS exhibit a modular organization with each module
responsible for the incorporation of one amino acid into the final product.[24, 25]
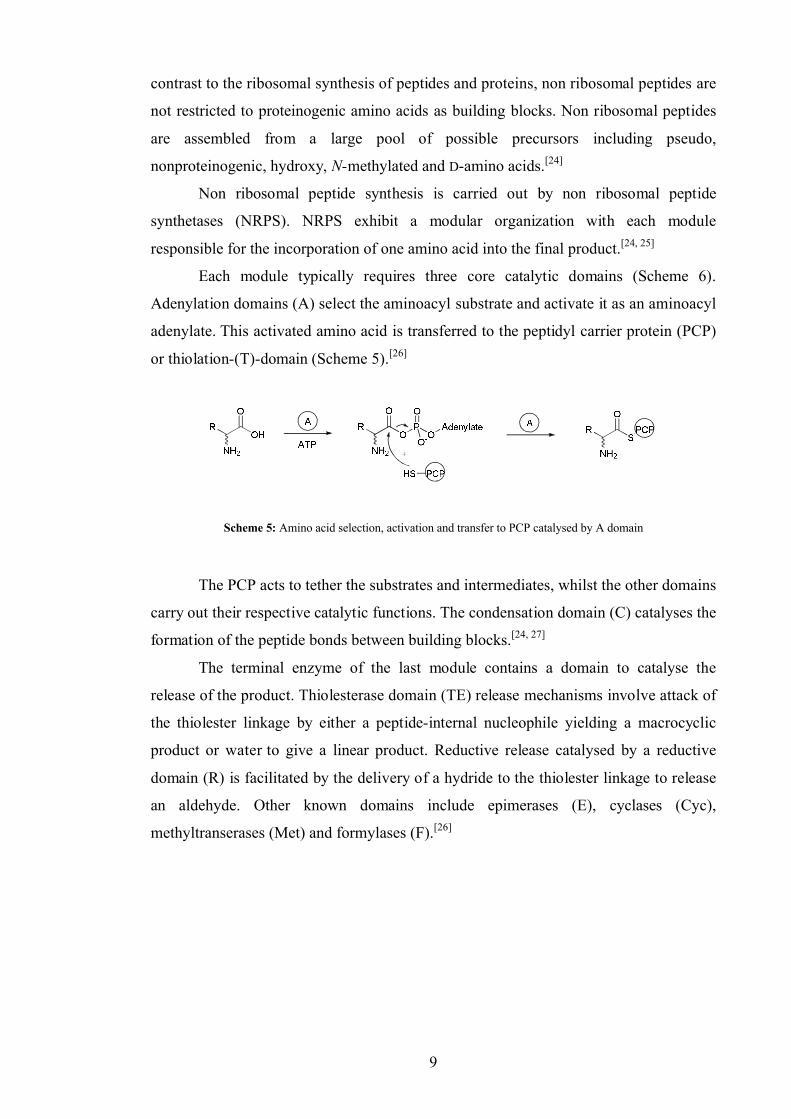
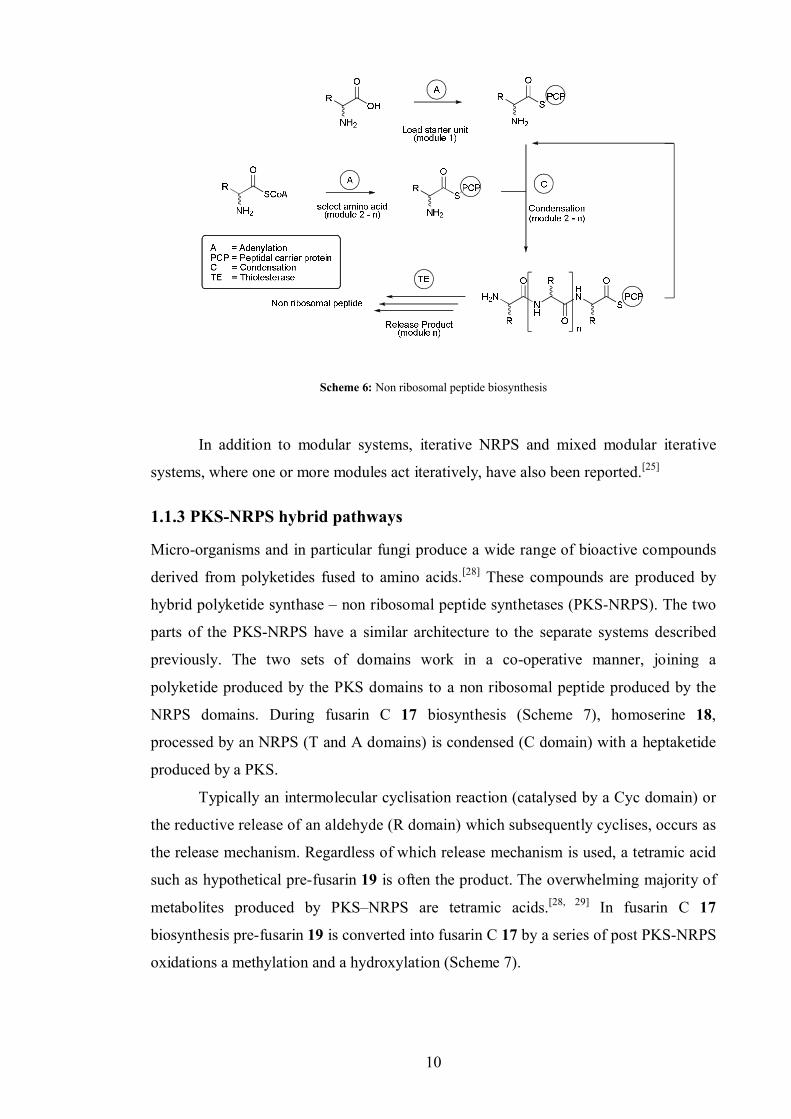
Each module typically requires three core catalytic domains (Scheme 6).
Adenylation domains (A) select the aminoacyl substrate and activate it as an aminoacyl
adenylate. This activated amino acid is transferred to the peptidyl carrier protein (PCP)
or thiolation-(T)-domain (Scheme 5).[26]
Scheme 5: Amino acid selection, activation and transfer to PCP catalysed by A domain
The PCP acts to tether the substrates and intermediates, whilst the other domains
carry out their respective catalytic functions. The condensation domain (C) catalyses the
formation of the peptide bonds between building blocks.[24, 27]
The terminal enzyme of the last module contains a domain to catalyse the
release of the product. Thiolesterase domain (TE) release mechanisms involve attack of
the thiolester linkage by either a peptide-internal nucleophile yielding a macrocyclic
product or water to give a linear product. Reductive release catalysed by a reductive
domain (R) is facilitated by the delivery of a hydride to the thiolester linkage to release
an aldehyde. Other known domains include epimerases (E), cyclases (Cyc),
methyltranserases (Met) and formylases (F).[26]
10
Scheme 6: Non ribosomal peptide biosynthesis
In addition to modular systems, iterative NRPS and mixed modular iterative
systems, where one or more modules act iteratively, have also been reported.[25]
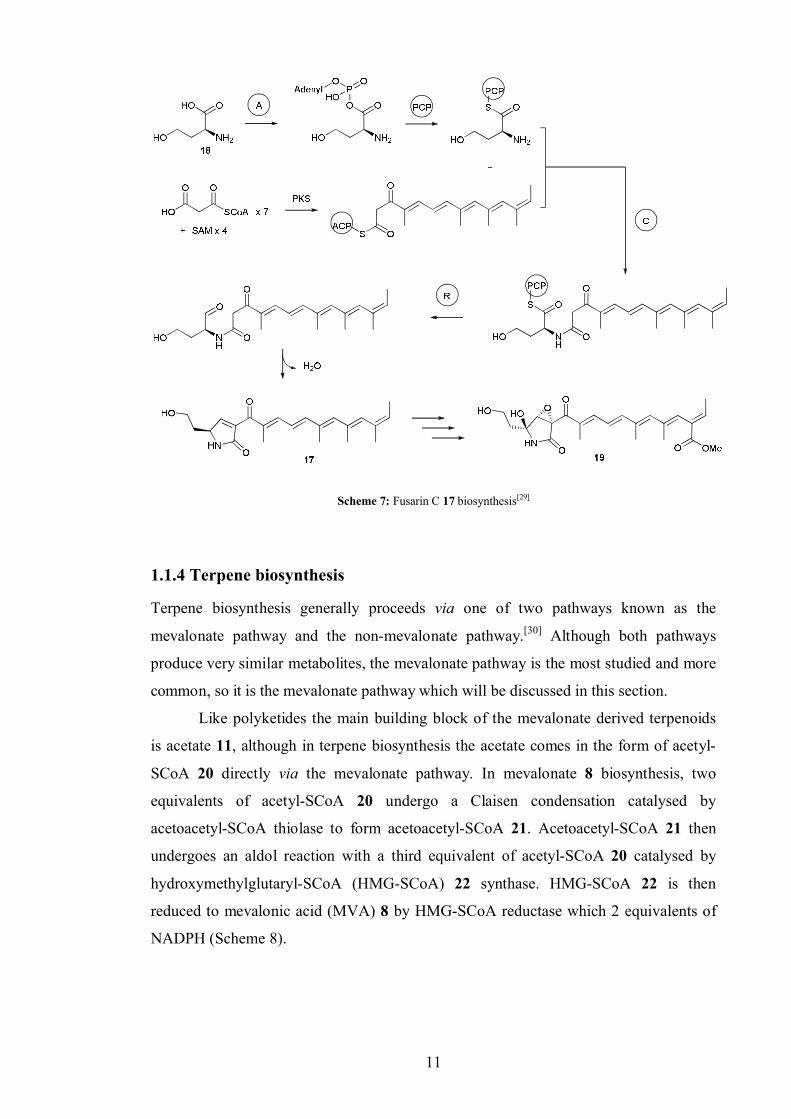
1.1.3 PKS-NRPS hybrid pathways
Micro-organisms and in particular fungi produce a wide range of bioactive compounds
derived from polyketides fused to amino acids.[28] These compounds are produced by
hybrid polyketide synthase – non ribosomal peptide synthetases (PKS-NRPS). The two
parts of the PKS-NRPS have a similar architecture to the separate systems described
previously. The two sets of domains work in a co-operative manner, joining a
polyketide produced by the PKS domains to a non ribosomal peptide produced by the
NRPS domains. During fusarin C 17 biosynthesis (Scheme 7), homoserine 18,
processed by an NRPS (T and A domains) is condensed (C domain) with a heptaketide
produced by a PKS.
Typically an intermolecular cyclisation reaction (catalysed by a Cyc domain) or
the reductive release of an aldehyde (R domain) which subsequently cyclises, occurs as
the release mechanism. Regardless of which release mechanism is used, a tetramic acid
such as hypothetical pre-fusarin 19 is often the product. The overwhelming majority of
metabolites produced by PKS–NRPS are tetramic acids.[28, 29] In fusarin C 17
biosynthesis pre-fusarin 19 is converted into fusarin C 17 by a series of post PKS-NRPS
oxidations a methylation and a hydroxylation (Scheme 7).
11
Scheme 7: Fusarin C 17 biosynthesis[29]
1.1.4 Terpene biosynthesis
Terpene biosynthesis generally proceeds via one of two pathways known as the
mevalonate pathway and the non-mevalonate pathway.[30] Although both pathways
produce very similar metabolites, the mevalonate pathway is the most studied and more
common, so it is the mevalonate pathway which will be discussed in this section.
Like polyketides the main building block of the mevalonate derived terpenoids
is acetate 11, although in terpene biosynthesis the acetate comes in the form of acetyl-
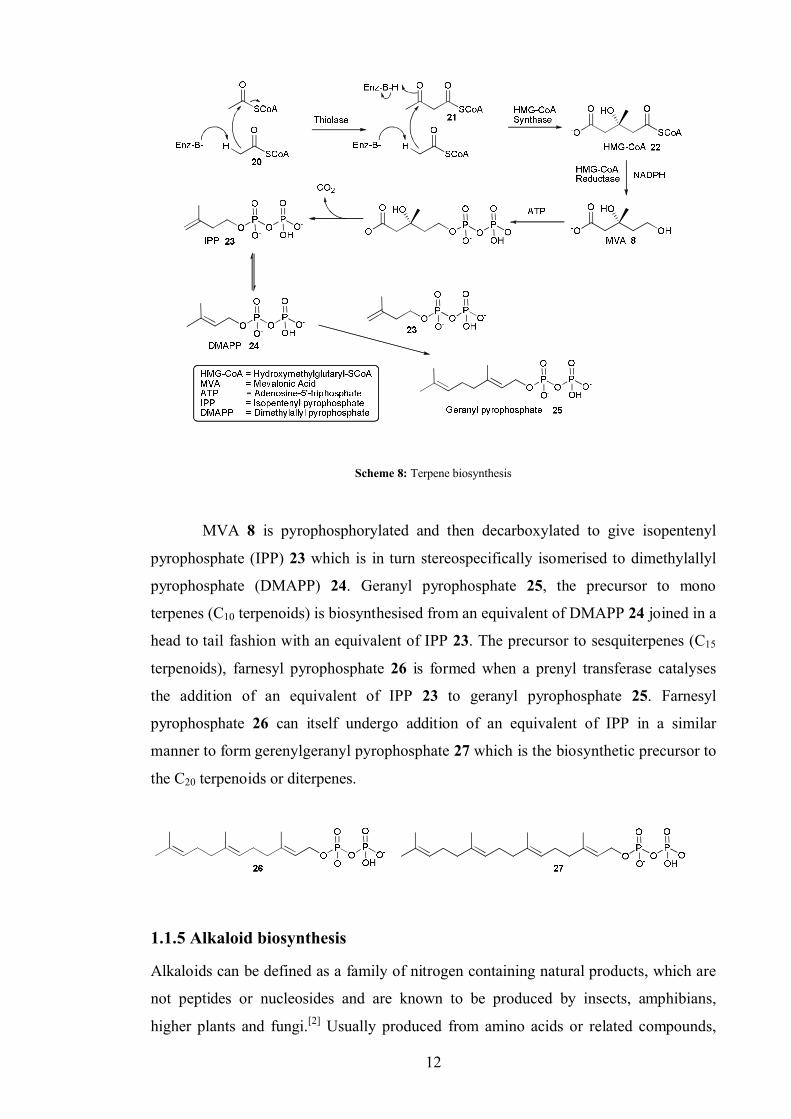
SCoA 20 directly via the mevalonate pathway. In mevalonate 8 biosynthesis, two
equivalents of acetyl-SCoA 20 undergo a Claisen condensation catalysed by
acetoacetyl-SCoA thiolase to form acetoacetyl-SCoA 21. Acetoacetyl-SCoA 21 then
undergoes an aldol reaction with a third equivalent of acetyl-SCoA 20 catalysed by
hydroxymethylglutaryl-SCoA (HMG-SCoA) 22 synthase. HMG-SCoA 22 is then
reduced to mevalonic acid (MVA) 8 by HMG-SCoA reductase which 2 equivalents of
NADPH (Scheme 8).
12
Scheme 8: Terpene biosynthesis
MVA 8 is pyrophosphorylated and then decarboxylated to give isopentenyl
pyrophosphate (IPP) 23 which is in turn stereospecifically isomerised to dimethylallyl
pyrophosphate (DMAPP) 24. Geranyl pyrophosphate 25, the precursor to mono
terpenes (C10 terpenoids) is biosynthesised from an equivalent of DMAPP 24 joined in a
head to tail fashion with an equivalent of IPP 23. The precursor to sesquiterpenes (C15
terpenoids), farnesyl pyrophosphate 26 is formed when a prenyl transferase catalyses
the addition of an equivalent of IPP 23 to geranyl pyrophosphate 25. Farnesyl
pyrophosphate 26 can itself undergo addition of an equivalent of IPP in a similar
manner to form gerenylgeranyl pyrophosphate 27 which is the biosynthetic precursor to
the C20 terpenoids or diterpenes.
1.1.5 Alkaloid biosynthesis
Alkaloids can be defined as a family of nitrogen containing natural products, which are
not peptides or nucleosides and are known to be produced by insects, amphibians,
higher plants and fungi.[2] Usually produced from amino acids or related compounds,
13
Mann suggests that the pathways responsible for alkaloid biosynthesis evolved at a time
when organisms had a surplus of amino acids.[2] Alkaloids are often biologically
active.[31, 32] Many alkaloids may possess deterrent properties, which help secure the
survival of the producing organism so have been passed on to later generations. [32, 33]
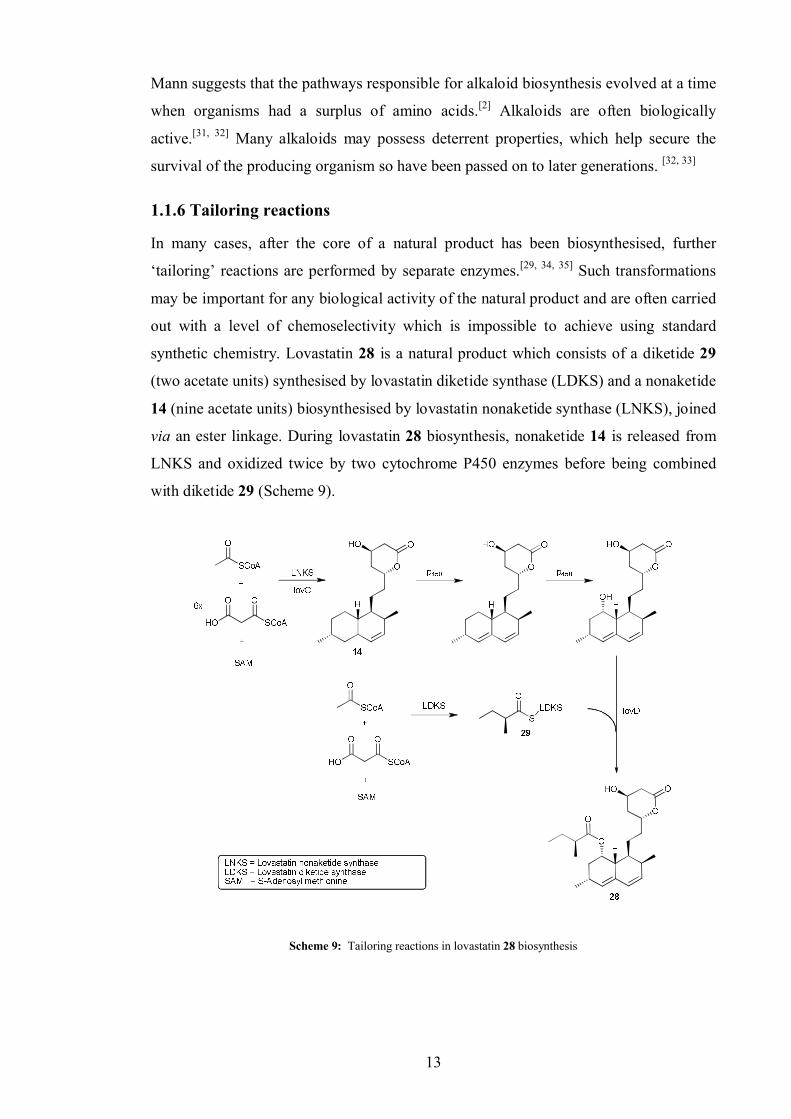
1.1.6 Tailoring reactions
In many cases, after the core of a natural product has been biosynthesised, further
‘tailoring’ reactions are performed by separate enzymes.[29, 34, 35] Such transformations
may be important for any biological activity of the natural product and are often carried
out with a level of chemoselectivity which is impossible to achieve using standard
synthetic chemistry. Lovastatin 28 is a natural product which consists of a diketide 29
(two acetate units) synthesised by lovastatin diketide synthase (LDKS) and a nonaketide
14 (nine acetate units) biosynthesised by lovastatin nonaketide synthase (LNKS), joined
via an ester linkage. During lovastatin 28 biosynthesis, nonaketide 14 is released from
LNKS and oxidized twice by two cytochrome P450 enzymes before being combined
with diketide 29 (Scheme 9).
Scheme 9: Tailoring reactions in lovastatin 28 biosynthesis

14
The oxidation of an alkane to an olefin and a methylene to an alcohol are carried
out in the presence of other oxidisable functional groups (an olefin and alcohols); this
would not be possible without enzymatic control.
1.2 Approaches to study biosynthesis
Biosynthetic pathways can only be considered elucidated when all intermediates (and
enzymes) have been identified.[2] The two main ways of achieving this are chemical
analysis and genetics (since c1980). Irrespective of how a biosynthetic pathway is
established, a large amount of work is involved. One of the biggest problems facing
natural products chemists is the amount of available compound of interest. This varies
enormously, but tends to be of the order of mg L-1 of culture and the compound of
interest has to be isolated cleanly from a large total extract to allow full characterisation.
This is a particular problem with the intermediates in a biosynthetic pathway (which are
typically present only at very low levels).
1.2.1 Chemical approaches.
Isolation and structural elucidation of secondary metabolites and their precursors
probably gives the most valuable insight into natural product biosynthesis. If the
structures of intermediates are identified, it is possible to determine the chemical
changes which occur in discrete biosynthetic steps. Knowing the chemical
transformations involved in natural product biosynthesis gives information about the
enzymes involved.
In the past full characterisation of isolated compounds was often carried out
laboriously by means of chemical degradation to known compounds.[10] Since NMR
spectroscopy and mass spectrometry (MS) have become widely available, a molecule
can be fully characterised relatively quickly, with 1-10 mg of pure material.
Feeding isotopically labelled precursors such as 14C labelled glucose to
organisms has been widely carried out in the past.[10] Radio labels are easy to detect in
isolated natural products, typically using a scintillation counter. Incorporation locations
within the framework of natural products can then be determined by chemical
degradation.[10] Utilisation of spin active isotopes (following the advent of NMR
spectroscopy), such as 13C and 2H (D), allow the location of a label to be determined
spectroscopically and as a result has advanced the field of biosynthetic studies
enormously.[10, 36]
15
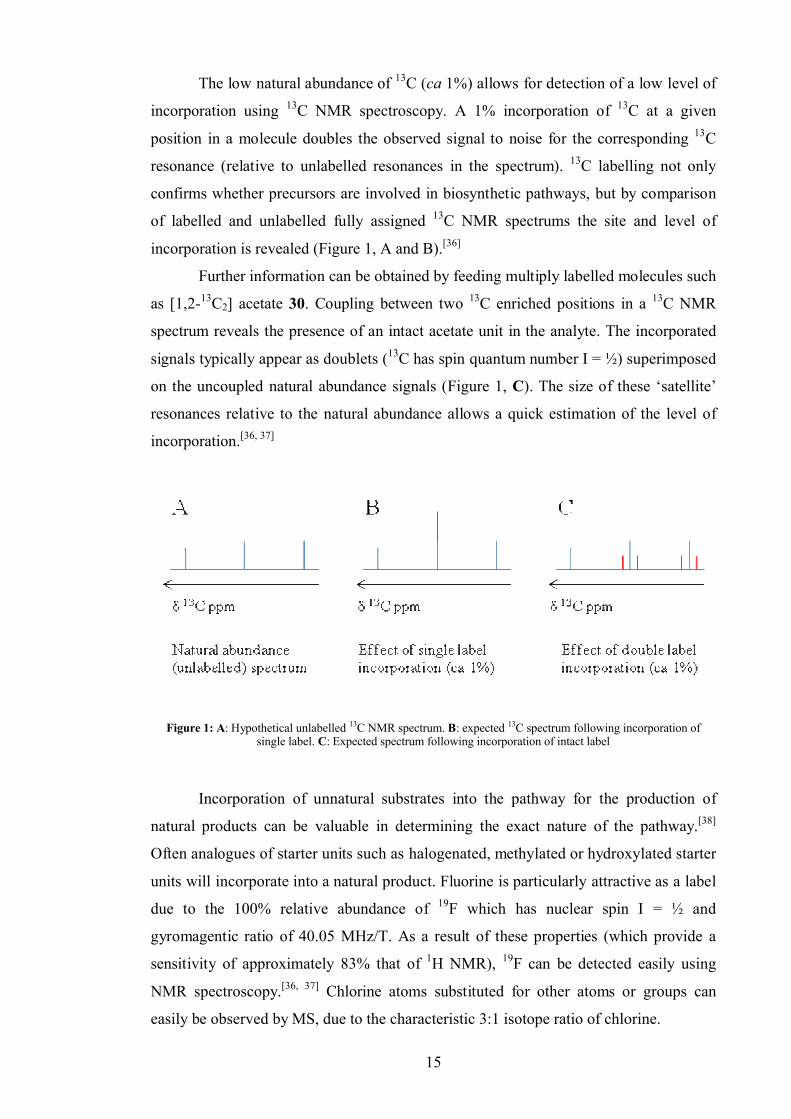
The low natural abundance of 13C (ca 1%) allows for detection of a low level of
incorporation using 13C NMR spectroscopy. A 1% incorporation of 13C at a given
position in a molecule doubles the observed signal to noise for the corresponding 13C
resonance (relative to unlabelled resonances in the spectrum). 13C labelling not only
confirms whether precursors are involved in biosynthetic pathways, but by comparison
of labelled and unlabelled fully assigned 13C NMR spectrums the site and level of
incorporation is revealed (Figure 1, A and B).[36]
Further information can be obtained by feeding multiply labelled molecules such
as [1,2-13C2] acetate 30. Coupling between two 13C enriched positions in a 13C NMR
spectrum reveals the presence of an intact acetate unit in the analyte. The incorporated
signals typically appear as doublets (13C has spin quantum number I = ½) superimposed
on the uncoupled natural abundance signals (Figure 1, C). The size of these ‘satellite’
resonances relative to the natural abundance allows a quick estimation of the level of
incorporation.[36, 37]
Figure 1: A: Hypothetical unlabelled 13C NMR spectrum. B: expected 13C spectrum following incorporation of single label. C: Expected spectrum following incorporation of intact label
Incorporation of unnatural substrates into the pathway for the production of
natural products can be valuable in determining the exact nature of the pathway.[38]
Often analogues of starter units such as halogenated, methylated or hydroxylated starter
units will incorporate into a natural product. Fluorine is particularly attractive as a label
due to the 100% relative abundance of 19F which has nuclear spin I = ½ and
gyromagentic ratio of 40.05 MHz/T. As a result of these properties (which provide a
sensitivity of approximately 83% that of 1H NMR), 19F can be detected easily using
NMR spectroscopy.[36, 37] Chlorine atoms substituted for other atoms or groups can
easily be observed by MS, due to the characteristic 3:1 isotope ratio of chlorine.
16
Fluorine is also very similar in size to hydrogen and (unlike OH) is not an H-
bond donor, so the presence of a fluorine atom is less likely than a hydroxyl or methyl
group to have a strong effect on the affinity of a given substrate for the active site of a
protein. In general fluorine atoms and hydroxyl groups have been found to make
suitable substitutes for one another or for hydrogen atoms. This is due to the similarity
in van der Waals radii of the atoms/groups.[39, 40]
Since high performance liquid chromatography (HPLC) and gas
chromatography (GC) have become widely available, it is often possible to perform a
high level of analysis on crude extracts. The powerful separation associated with these
techniques allows the components of the crude extract to be resolved on a small scale.
When using a MS and/or UV detector, information such as the molecular weight,
fragmentation patterns and UV spectra of the individual compounds in a mixture can be
determined. These techniques are usually very sensitive and as a result far less material
is required (than for NMR).
1.2.2 Biological approaches.
Biological or genetic approaches to biosynthetic studies are becoming more and more
prevalent. The field has in recent years developed rapidly and produced extremely
interesting results. A large number of techniques and approaches are available and those
briefly described in this section are by no means exhaustive but rather the most relevant
to the following chapters.
With an increasing number of sequenced genomes, it is possible (and
commonplace) to compare the genomes of different organisms. Areas on genomes
known to encode particular enzymes typically bear homology to areas on the genomes
of other organisms which encode a gene of a similar function.[10, 13] Genome mining [41]
can be used to search for hypothetical genes suspected to be responsible for the
biosynthesis of natural products. Genes responsible for the biosynthesis of hypothetical
natural products are often identified before their respective natural products have been
isolated.[42, 43]
Engineering the genomes of organisms in order to study biosynthesis can also
be an extremely powerful way to study the natural products that the organism naturally
produces.[44] Disruptive ‘knock out’[45-47] experiments (where a gene is disrupted within
the genome preventing active protein production) and ‘silencing’[48-50] experiments
(where protein production is ‘arrested’ during transcription) are valuable for linking
genes to compounds and particular biosynthetic steps. Heterologous expression of genes
17
encoding proteins responsible for a whole or parts of a biosynthetic pathway in an un-
related host organism allows gene function to be studied in a ‘clean’ background where
any ‘new’ metabolites can be identified chromatographically by comparison to a wild
type (WT). [10, 51, 52]
1.3 Harnessing biosynthesis
Given the broad spectrum of biological activities of natural products and their related
inherent structural complexity, total chemical synthesis of natural products and their
analogues is unlikely to become commercially viable for the more complicated
compounds. The prospect of being able to produce complicated, biologically active
compounds, on a large scale in a one pot processes, using only basic starting materials,
by harnessing the control and chemoselective power of enzymes is an attractive one
indeed.
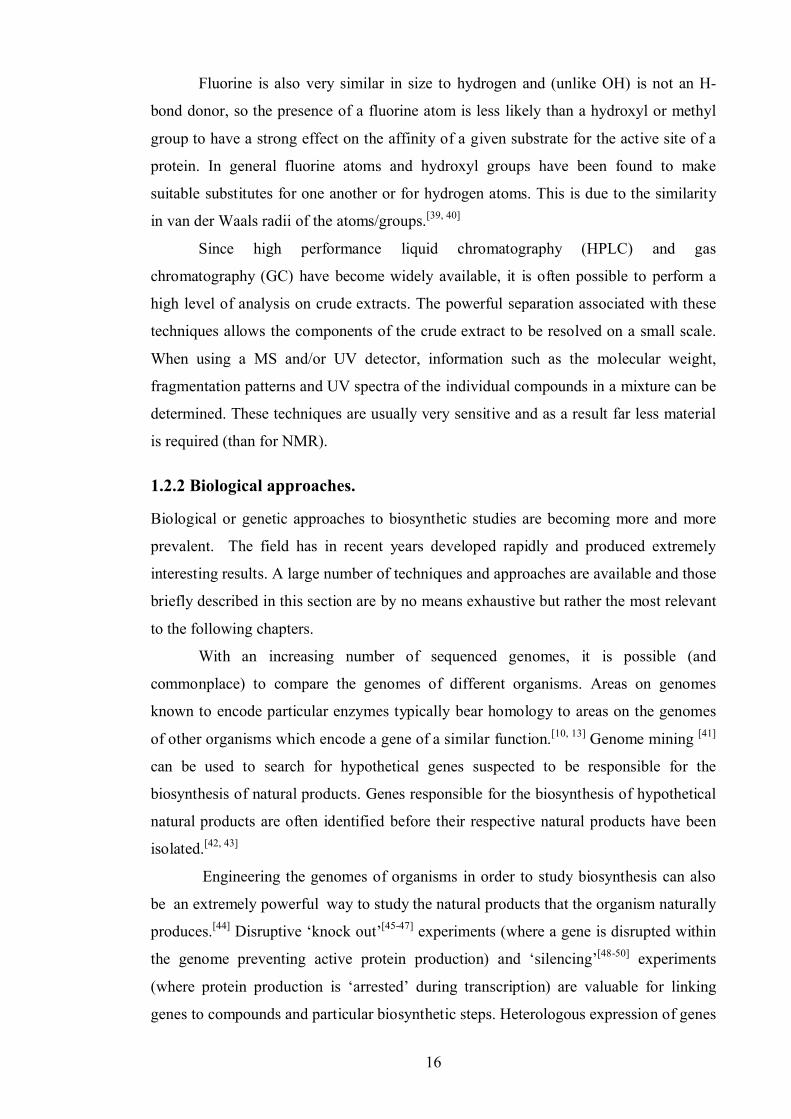
This kind of biotechnology is already in use in the pharmaceutical industry. The
terpenoid taxol 31 or “Paclitaxel®” is a cancer chemotherapy agent originally registered
by Bristol-Myers Squibb (BMS).
From its discovery in 1962 until 1993, almost all taxol 31 produced was
extracted from the bark of the pacific yew Taxus brevifolia (the organism responsible
for its biosynthesis). The harvesting process resulted in the death of the tree, which was
in danger of becoming endangered in order to keep up with demand.[53] Although taxol
31 has been prepared synthetically by a number of groups, including the group of
Nicolaou,[53] the structural complexity of the core renders commercial preparation by
total synthesis uneconomic.[54]
Forced to find an alternative source of taxol, BMS switched to semi-synthetic
production in 1995, starting from 10-deacetylbaccatin which can be isolated in an
sustainable manner from harvested needles of the European yew.[54, 55] Currently BMS
produces taxol 31 directly using plant cell fermentation (PCF) technology where a taxus
18
cell line is propagated in aqueous medium batch scale fermentation reactors. This PCF
technology is a relatively ‘green’ process using fewer chemicals and less energy than
the semi-synthesis method.[56]
The complete engineering of biosynthesis where enzymes are mixed and
matched to give an un-natural desired product is also becoming a reality. There are now
many examples of modular polyketide and non ribosomal peptide systems where chain
length and oxidation states have been altered in a predictable way to produce novel
‘engineered’ natural products.[57-59]
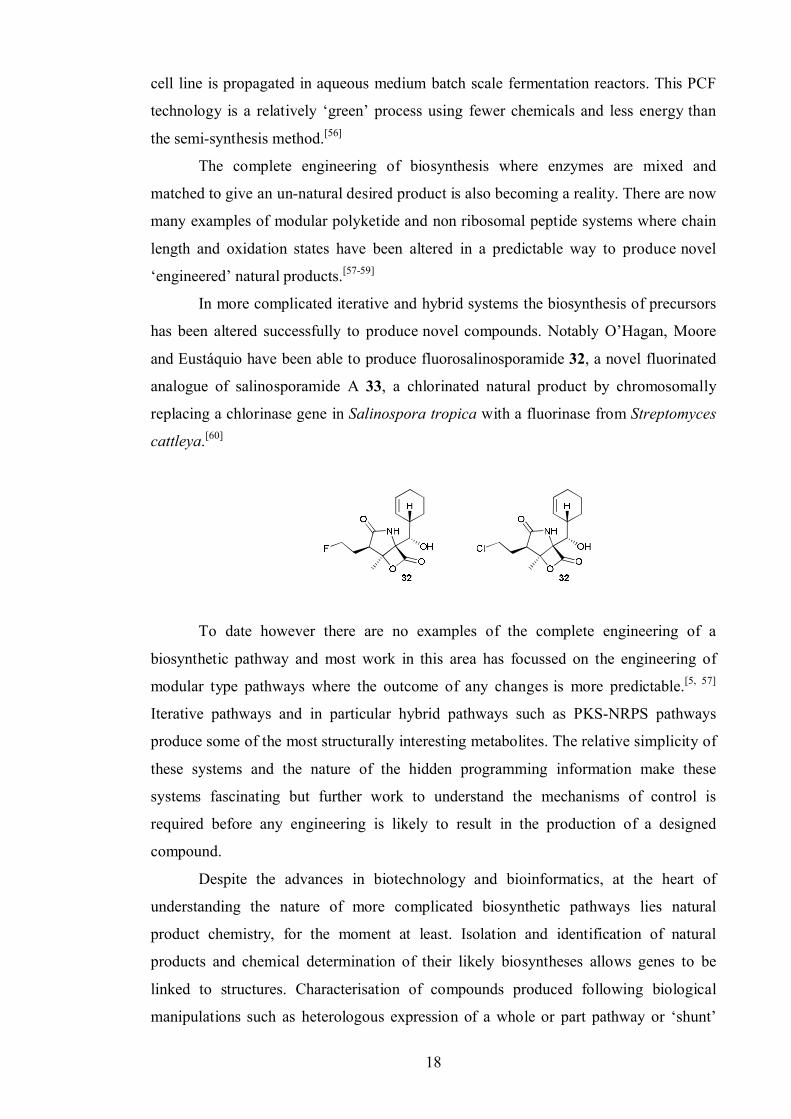
In more complicated iterative and hybrid systems the biosynthesis of precursors
has been altered successfully to produce novel compounds. Notably O’Hagan, Moore
and Eustáquio have been able to produce fluorosalinosporamide 32, a novel fluorinated
analogue of salinosporamide A 33, a chlorinated natural product by chromosomally
replacing a chlorinase gene in Salinospora tropica with a fluorinase from Streptomyces
cattleya.[60]
To date however there are no examples of the complete engineering of a
biosynthetic pathway and most work in this area has focussed on the engineering of
modular type pathways where the outcome of any changes is more predictable.[5, 57]
Iterative pathways and in particular hybrid pathways such as PKS-NRPS pathways
produce some of the most structurally interesting metabolites. The relative simplicity of
these systems and the nature of the hidden programming information make these
systems fascinating but further work to understand the mechanisms of control is
required before any engineering is likely to result in the production of a designed
compound.
Despite the advances in biotechnology and bioinformatics, at the heart of
understanding the nature of more complicated biosynthetic pathways lies natural
product chemistry, for the moment at least. Isolation and identification of natural
products and chemical determination of their likely biosyntheses allows genes to be
linked to structures. Characterisation of compounds produced following biological
manipulations such as heterologous expression of a whole or part pathway or ‘shunt’
19
metabolites and intermediates produced after a knockout experiment is the only way to
be certain of the result of the experiment.[61-63]
1.4 Research Aims
It is the aim of this research to provide solid chemical arguments to improve the
understanding of natural product biosynthesis. A chemical science based approach has
been adopted which uses an appropriate combination of the most up to date analytical
chemistry techniques and the most informative long established techniques. Known
natural products, novel compounds and biosynthetic intermediates sought out of
complex mixtures are studied. The results of collaborative experiments with
microbiologists are chemically interpreted. Light will be shed on the biosynthetic
pathways pathways involved. Underpinning all strands of this research is structure
elucidation, which represents the crucial first step between the isolation of a compound
and the determination of biosynthetic pathways.
The biosynthesis of a multipotent stilbene ST 1, produced by Photorhabdus
luminescens (a symbiotic bacterium isolated from a pathogenic nematode), is studied
and the results of our isotopic labelling experiments are compared and contrasted with a
biosynthetic proposal of ST 1 proposed by other researchers by orthogonal methods.
Mutasynthesis experiments are conducted which produce novel ST 1 analogues.
A novel natural product, rhabdolactone 2 and its fluorinated un-natural analogue
fluororhabdolactone 3, are discovered in P. luminescens cultures during a mutasynthesis
experiment. The unprecedented biosynthesis of rhabdolactone 2 is studied at length via
isotopic labelling studies and a biosynthesis is proposed.
The ‘pseudo polyketide’ fusarachromene 4 (an alkaloid) is isolated from cultures
of Fusarium sacchari, which is the causative agent of Pokkah boeng disease in
sugarcane. The structure and stereochemistry are determined by NMR and
crystallographic methods. The biosynthesis of fusarachromene 4 is studied using
isotopic labelling experiments and an unusual biosynthesis is proposed.
The gene cluster encoding enzymes responsible for the biosynthesis of the PKS-
NPRS derived pigment tenellin 5 in Beauvaria bassiana (the first pathogen ever to be
identified)[64] is investigated by heterologous gene expression in A. oryzae. Errors in
polyketide chain assembly are observed when tenS the PKS-NRPS encoding gene is
expressed in the absence of tenC another gene from the gene cluster which encodes an
ER. Co-expression of the tenS and tenC is required for biosynthesis of tenellin
precursors with the correctly constructed side chain.

20
Magnaporthe grisea is a virulent crop pathogenic fungus. The virulence of M.
grisea has been shown to be linked to the biosynthetic activity of a gene – Ace1, which
is believed to encode a PKS-NRPS. Much work has been carried out to attempt to
isolate and identify the hypothetical ACE1 compound, though so far this has been
unsuccessful. In the final chapter, the isolation and characterisation of a novel pyrone 6,
believed to be the product of the ACE1 PKS is described following the successful
heterologous expression of Ace1 in A. oryzae.
21
2.0 Biosynthesis of an unusual stilbene natural product in
Photorhabdus luminescens TT01.
The Gram-negative entomopathgenic bacteria Photorhabdus is a member of the family
Enterobacteriaceae and is closely related to many known pathogens such as E. coli.
Photorhabdus luminescens subspecies laumondii TT01 is native to France, and is a
symbiont of Heterorhabditidae (a member of the Rhabditoid family) of nematodes.
Photorhabdus is typically found in the gut of these free living soil dwelling
nematodes.[45]
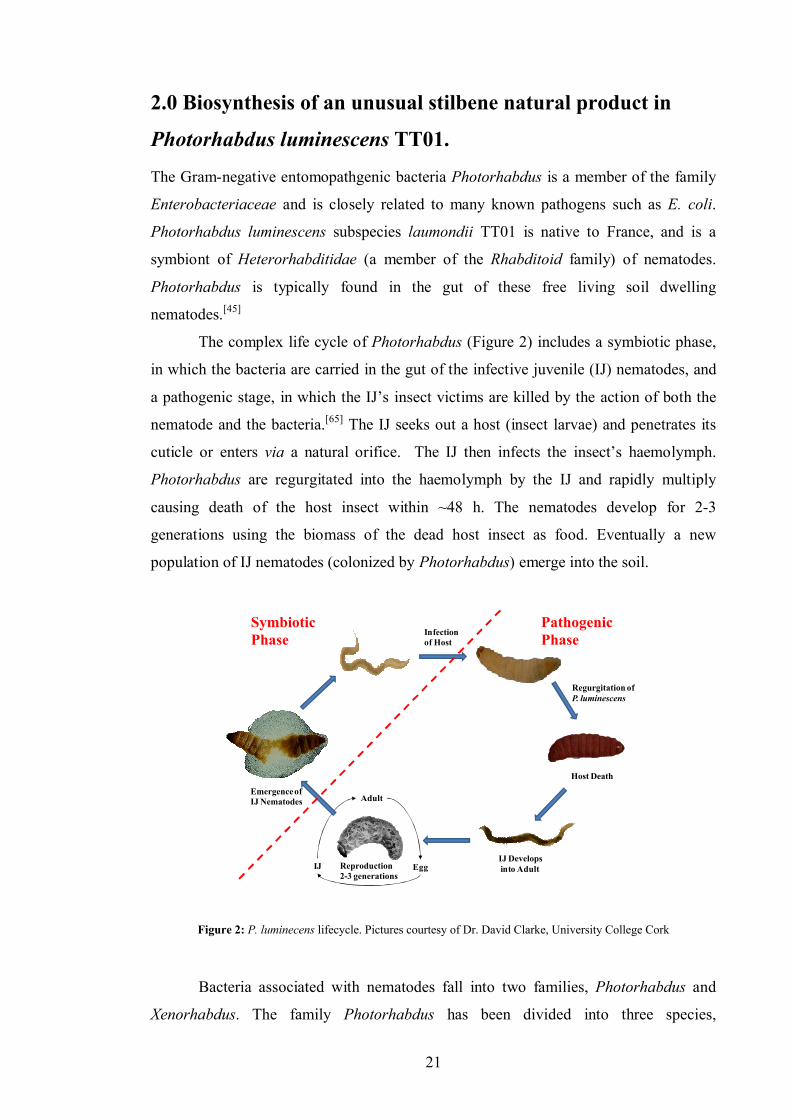
The complex life cycle of Photorhabdus (Figure 2) includes a symbiotic phase,
in which the bacteria are carried in the gut of the infective juvenile (IJ) nematodes, and
a pathogenic stage, in which the IJ’s insect victims are killed by the action of both the
nematode and the bacteria.[65] The IJ seeks out a host (insect larvae) and penetrates its
cuticle or enters via a natural orifice. The IJ then infects the insect’s haemolymph.
Photorhabdus are regurgitated into the haemolymph by the IJ and rapidly multiply
causing death of the host insect within ~48 h. The nematodes develop for 2-3
generations using the biomass of the dead host insect as food. Eventually a new
population of IJ nematodes (colonized by Photorhabdus) emerge into the soil.
Infection of Host
Host Death
IJ Developsinto Adult
Emergenceof IJ Nematodes Adult
EggReproduction2-3 generations
IJ
Symbiotic Phase
Pathogenic Phase
Regurgitation of P. luminescens
Figure 2: P. luminecens lifecycle. Pictures courtesy of Dr. David Clarke, University College Cork
Bacteria associated with nematodes fall into two families, Photorhabdus and
Xenorhabdus. The family Photorhabdus has been divided into three species,
22
Photorhabdus luminescens, Photorhabdus temperata and Photorhabdus asymbiotica.[66]
Photorhabdus luminescens has been further divided into three subspecies, luminescens,
akhurstii and laumondii. Photorhabdus luminescens laumondii TT01 is the only
nematode associated strain of Photorhabdus whose genome has been sequenced.
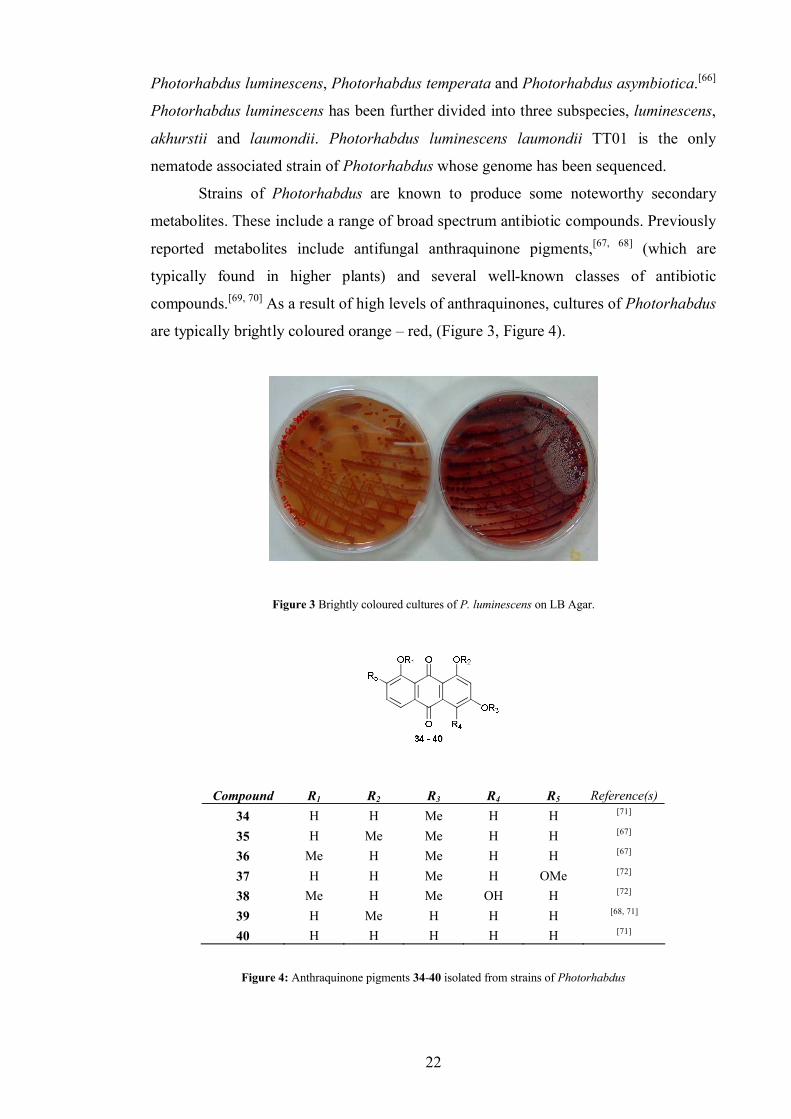
Strains of Photorhabdus are known to produce some noteworthy secondary
metabolites. These include a range of broad spectrum antibiotic compounds. Previously
reported metabolites include antifungal anthraquinone pigments,[67, 68] (which are
typically found in higher plants) and several well-known classes of antibiotic
compounds.[69, 70] As a result of high levels of anthraquinones, cultures of Photorhabdus
are typically brightly coloured orange – red, (Figure 3, Figure 4).
Figure 3 Brightly coloured cultures of P. luminescens on LB Agar.
Compound R1 R2 R3 R4 R5 Reference(s)34 H H Me H H [71]
35 H Me Me H H [67]
36 Me H Me H H [67]
37 H H Me H OMe [72]
38 Me H Me OH H [72]
39 H Me H H H [68, 71]
40 H H H H H [71]
Figure 4: Anthraquinone pigments 34-40 isolated from strains of Photorhabdus
23
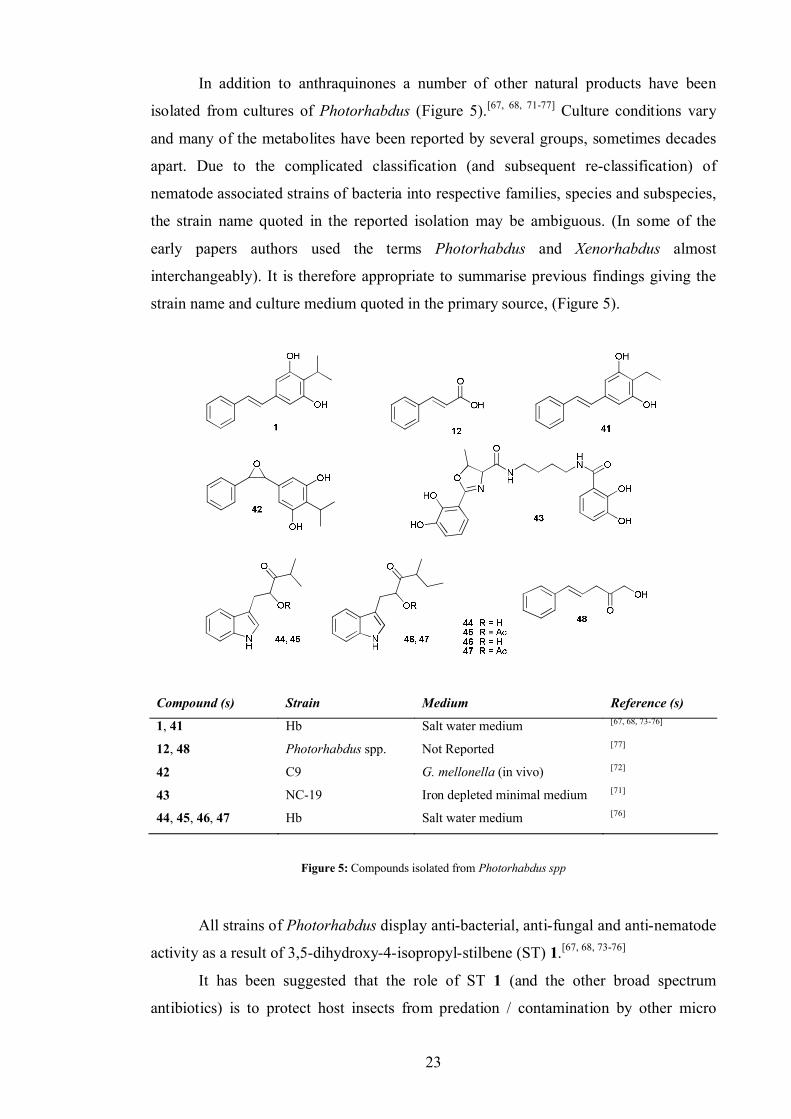
In addition to anthraquinones a number of other natural products have been
isolated from cultures of Photorhabdus (Figure 5).[67, 68, 71-77] Culture conditions vary
and many of the metabolites have been reported by several groups, sometimes decades
apart. Due to the complicated classification (and subsequent re-classification) of
nematode associated strains of bacteria into respective families, species and subspecies,
the strain name quoted in the reported isolation may be ambiguous. (In some of the
early papers authors used the terms Photorhabdus and Xenorhabdus almost
interchangeably). It is therefore appropriate to summarise previous findings giving the
strain name and culture medium quoted in the primary source, (Figure 5).
Compound (s) Strain Medium Reference (s)
1, 41 Hb Salt water medium [67, 68, 73-76]
12, 48 Photorhabdus spp. Not Reported [77]
42 C9 G. mellonella (in vivo) [72]
43 NC-19 Iron depleted minimal medium [71]
44, 45, 46, 47 Hb Salt water medium [76]
Figure 5: Compounds isolated from Photorhabdus spp
All strains of Photorhabdus display anti-bacterial, anti-fungal and anti-nematode
activity as a result of 3,5-dihydroxy-4-isopropyl-stilbene (ST) 1.[67, 68, 73-76]
It has been suggested that the role of ST 1 (and the other broad spectrum
antibiotics) is to protect host insects from predation / contamination by other micro
24
organisms.[78] ST 1 has also been found to inhibit prophenoloxidase – an enzyme
important in insect autoimmune response and thus protects Photorhabdus and its
nematode symbiont from the insect’s immune system.[79] It has also been found that
hydroxystilbenes are active against human melanoma tyrosinase which is known to be
important in regulating melanin production and therefore involved in preventing sun
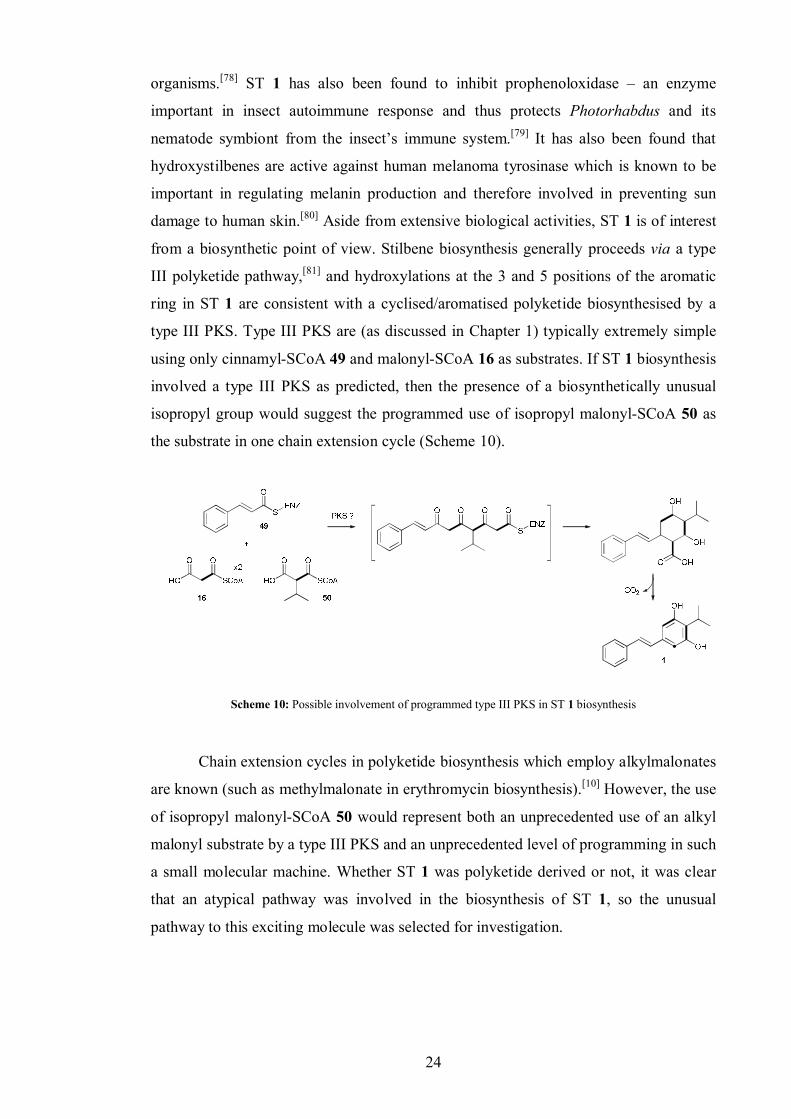
damage to human skin.[80] Aside from extensive biological activities, ST 1 is of interest
from a biosynthetic point of view. Stilbene biosynthesis generally proceeds via a type
III polyketide pathway,[81] and hydroxylations at the 3 and 5 positions of the aromatic
ring in ST 1 are consistent with a cyclised/aromatised polyketide biosynthesised by a
type III PKS. Type III PKS are (as discussed in Chapter 1) typically extremely simple
using only cinnamyl-SCoA 49 and malonyl-SCoA 16 as substrates. If ST 1 biosynthesis
involved a type III PKS as predicted, then the presence of a biosynthetically unusual
isopropyl group would suggest the programmed use of isopropyl malonyl-SCoA 50 as
the substrate in one chain extension cycle (Scheme 10).
Scheme 10: Possible involvement of programmed type III PKS in ST 1 biosynthesis
Chain extension cycles in polyketide biosynthesis which employ alkylmalonates
are known (such as methylmalonate in erythromycin biosynthesis).[10] However, the use
of isopropyl malonyl-SCoA 50 would represent both an unprecedented use of an alkyl
malonyl substrate by a type III PKS and an unprecedented level of programming in such
a small molecular machine. Whether ST 1 was polyketide derived or not, it was clear
that an atypical pathway was involved in the biosynthesis of ST 1, so the unusual
pathway to this exciting molecule was selected for investigation.
25
2.0.1 Previous work
Given the extensive biological activities of hydroxystilbenes, in particular ST 1 and the
unusual nature of the structure of ST 1, some work to elucidate the pathway responsible
for ST 1 biosynthesis had already been undertaken using a genetic approach by our
collaborators Dr. D. Clarke and Prof. S. Reynolds from the Department of Biochemistry
at the University of Bath.
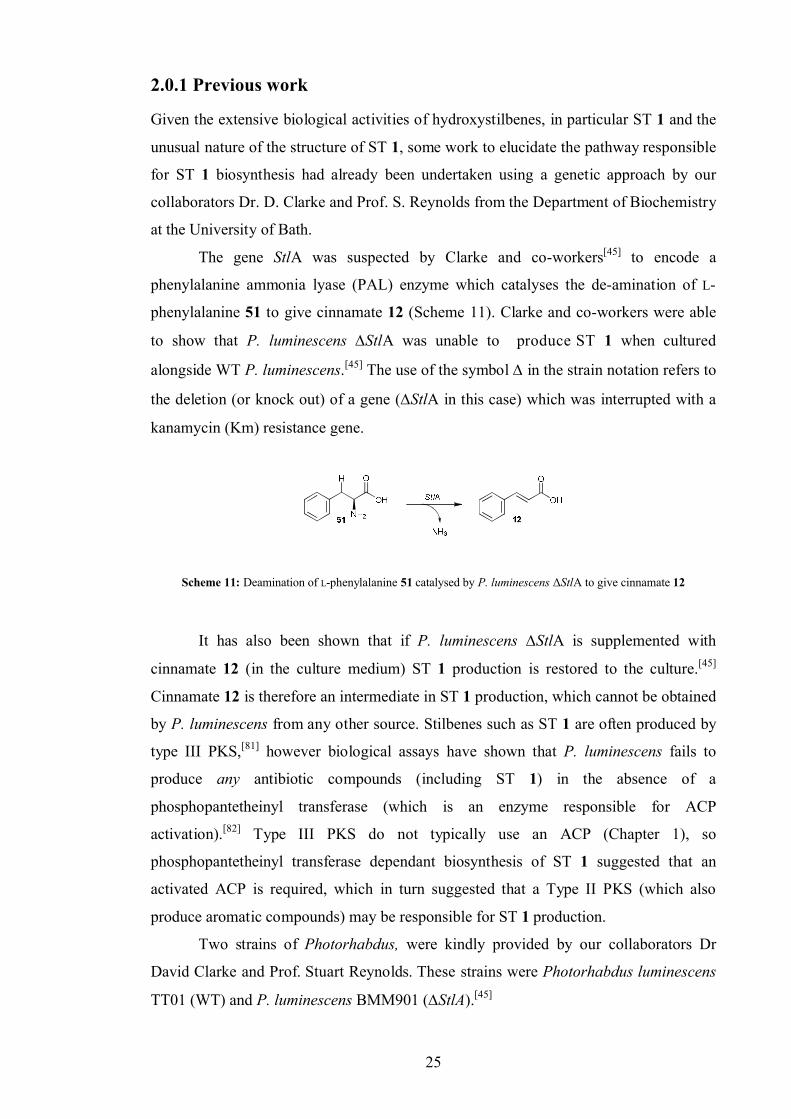
The gene StlA was suspected by Clarke and co-workers[45] to encode a
phenylalanine ammonia lyase (PAL) enzyme which catalyses the de-amination of L-
phenylalanine 51 to give cinnamate 12 (Scheme 11). Clarke and co-workers were able
to show that P. luminescens StlA was unable to produce ST 1 when cultured
alongside WT P. luminescens.[45] The use of the symbol in the strain notation refers to
the deletion (or knock out) of a gene (StlA in this case) which was interrupted with a
kanamycin (Km) resistance gene.
Scheme 11: Deamination of L-phenylalanine 51 catalysed by P. luminescens ΔStlA to give cinnamate 12
It has also been shown that if P. luminescens StlA is supplemented with
cinnamate 12 (in the culture medium) ST 1 production is restored to the culture.[45]
Cinnamate 12 is therefore an intermediate in ST 1 production, which cannot be obtained
by P. luminescens from any other source. Stilbenes such as ST 1 are often produced by
type III PKS,[81] however biological assays have shown that P. luminescens fails to
produce any antibiotic compounds (including ST 1) in the absence of a
phosphopantetheinyl transferase (which is an enzyme responsible for ACP
activation).[82] Type III PKS do not typically use an ACP (Chapter 1), so
phosphopantetheinyl transferase dependant biosynthesis of ST 1 suggested that an
activated ACP is required, which in turn suggested that a Type II PKS (which also
produce aromatic compounds) may be responsible for ST 1 production.
Two strains of Photorhabdus, were kindly provided by our collaborators Dr
David Clarke and Prof. Stuart Reynolds. These strains were Photorhabdus luminescens
TT01 (WT) and P. luminescens BMM901 (StlA).[45]
26
2.0.2 Aims
Given the unusual structure of ST 1, the probability of an associated atypical
biosynthetic pathway and the uncommonly broad range of biological activities
displayed, solving the biosynthesis was an attractive goal. Chemical probes and analysis
were used to dismantle the pathway to ST 1 one step at a time. By means of isotopic
labelling studies, we hoped that the biological precursors to ST 1 could be identified and
the manner of their assembly during biosynthesis interpreted and linked to the operating
pathway. In particular, information concerning the molecular origin of the isopropyl
group was anticipated. Given that P. luminescens StlA was incapable of producing
cinnamate and thus incapable of biosynthesising ST 1, it was also decided to perform
some mutasynthesis experiments to attempt to produce analogues of ST 1 – which has
interesting physiological activities – for biological testing. As discussed in Chapter 1,
fluorine atoms generally make good substitutes for hydrogen atoms due to their similar
size.[39] We envisaged that feeding fluorine labelled precursors to P. luminescens StlA
would produce novel fluorinated ST 1 analogues which in turn may have interesting
biological activities. Ortho, meta and para-fluorocinnamate 52, 53 and 54, were
commercially available and inexpensive. Fluorinated components of the crude culture
extract could be ‘counted’ using 19F NMR, which would reveal the number of chemical
environments for fluorine present in the extract and therefore the number of fluorinated
compounds. The crude extract could then be chromatographically fractionated and any
fluorine containing compounds traced using 19F NMR, purified and characterised. The
use of 19F NMR as an off-line chromatographic detector should be sensitive and
reasonably fast given the sensitivity of 19F as a nucleus in NMR, quickly allowing the
isolation and identification of fluorine containing compounds which were present in the
culture.
2.1 The biosynthesis of ST
To enable effective experimental design for labelling studies and the isolation of
intermediates it was necessary to monitor the production of ST 1 in cultures of P.
luminescens over a period of time (Figure 6). To reduce flask to flask variations,
aliquots (1 mL) of 3 culture flasks grown in parallel and pooled. The total extract was
then analysed by HPLC, which had been calibrated with standard solutions of ST 1 and
the reproducibility of the injections measured. ST 1 was shown to be present (at < 0.05
mg L-1) 4 h after inoculation and the main period of production was seen to occur
between ~10 and 22 h. After 22 h ST 1 levels were seen to remain fairly constant at ~ 8
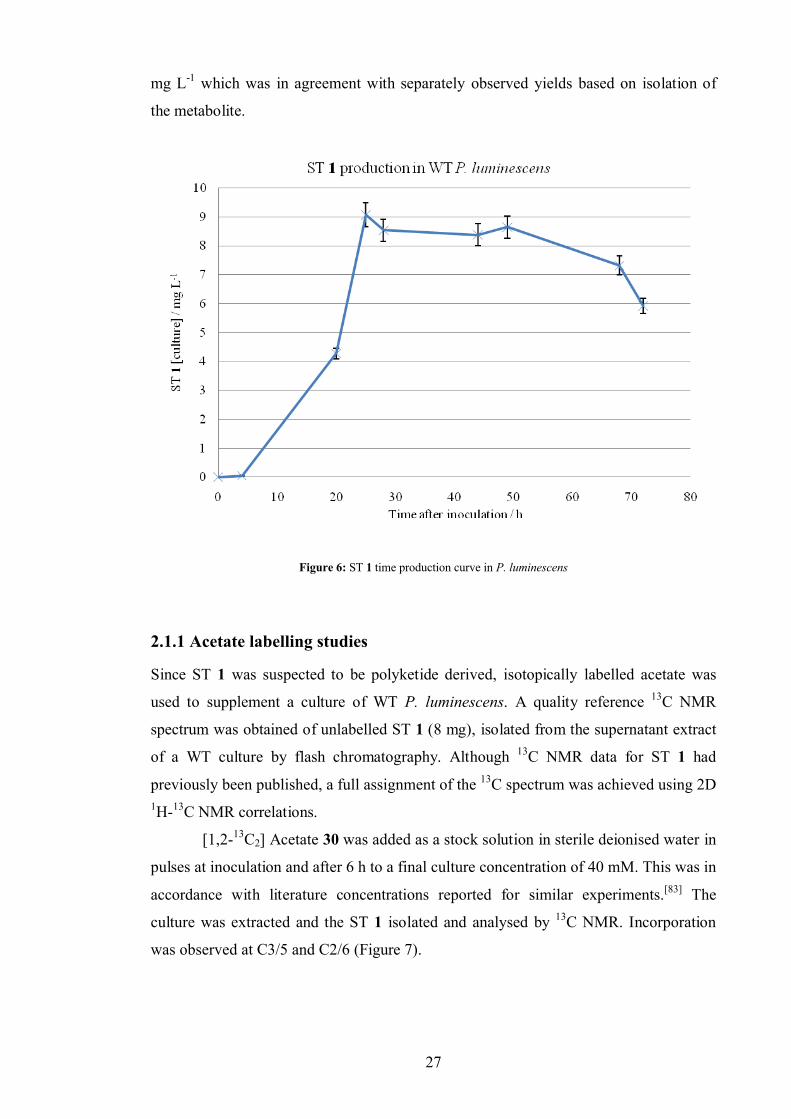
27
mg L-1 which was in agreement with separately observed yields based on isolation of
the metabolite.
Figure 6: ST 1 time production curve in P. luminescens
2.1.1 Acetate labelling studies
Since ST 1 was suspected to be polyketide derived, isotopically labelled acetate was
used to supplement a culture of WT P. luminescens. A quality reference 13C NMR
spectrum was obtained of unlabelled ST 1 (8 mg), isolated from the supernatant extract
of a WT culture by flash chromatography. Although 13C NMR data for ST 1 had
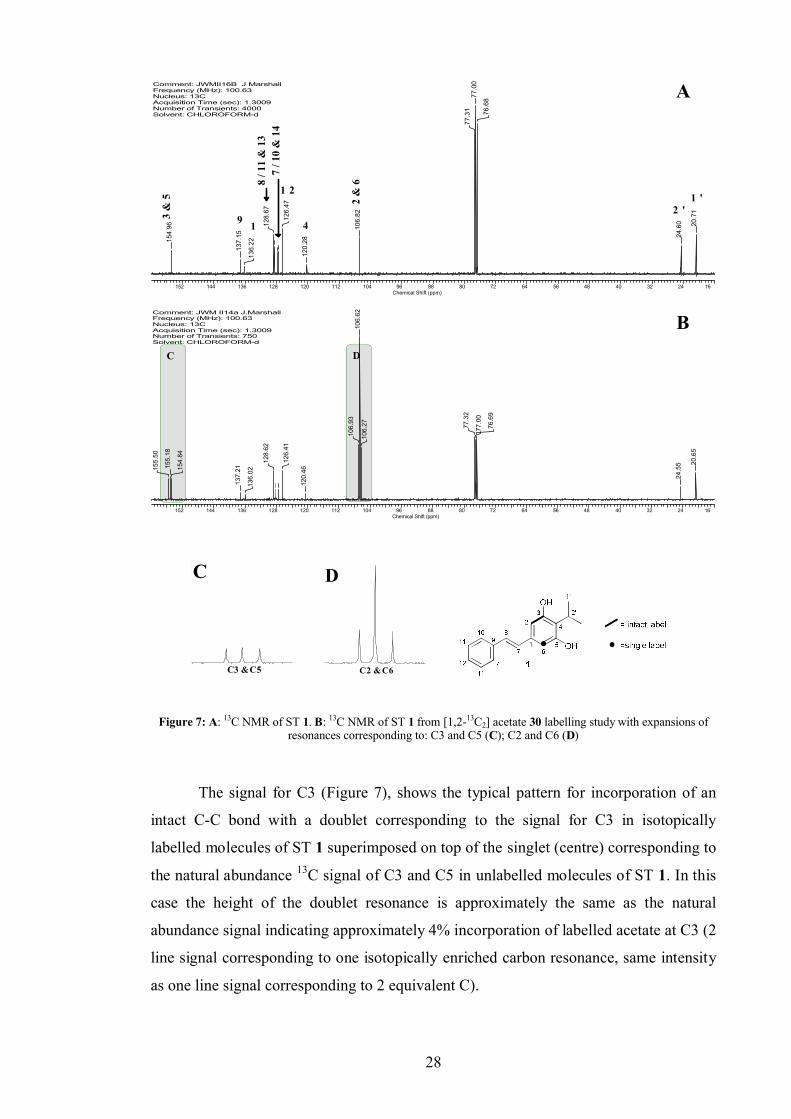
previously been published, a full assignment of the 13C spectrum was achieved using 2D 1H-13C NMR correlations.
[1,2-13C2] Acetate 30 was added as a stock solution in sterile deionised water in
pulses at inoculation and after 6 h to a final culture concentration of 40 mM. This was in
accordance with literature concentrations reported for similar experiments.[83] The
culture was extracted and the ST 1 isolated and analysed by 13C NMR. Incorporation
was observed at C3/5 and C2/6 (Figure 7).
28
Comment: JWMII16B J MarshallFrequency (MHz): 100.63Nucleus: 13CAcquisition Time (sec): 1.3009Number of Transients: 4000Solvent: CHLOROFORM-d
152 144 136 128 120 112 104 96 88 80 72 64 56 48 40 32 24 16Chemical Shift (ppm)
154.
96
137.
15
136.
22
128.
67
126.
47
120.
28
106.
82
77.3
177
.00
76.6
8
24.6
0 20.7
1
1 '2 '3
& 5 2
& 6
4
8 / 1
1 &
13
9 1
1 2
7 / 1
0 &
14
A
Comment: JWM II14a J.MarshallFrequency (MHz): 100.63Nucleus: 13CAcquisition Time (sec): 1.3009Number of Transients: 750Solvent: CHLOROFORM-d
152 144 136 128 120 112 104 96 88 80 72 64 56 48 40 32 24 16Chemical Shift (ppm)
20.6
5
24.5
5
76.6
9
77.0
0
77.3
2
106.
2710
6.62
106.
93
120.
46
126.
41
128.
62
136.
02
137.
21154.
84
155.
18
155.
50
BC D
Comment: JWM II14a J.MarshallFrequency (MHz): 100.63Nucleus: 13CAcquisition Time (sec): 1.3009Number of Transients: 750Solvent: CHLOROFORM-dC
C 3 & C 5
Comment: JWM II14a J.MarshallFrequency (MHz): 100.63Nucleus: 13CAcquisition Time (sec): 1.3009Number of Transients: 750Solvent: CHLOROFORM-dD
C 2 & C 6
Figure 7: A: 13C NMR of ST 1. B: 13C NMR of ST 1 from [1,2-13C2] acetate 30 labelling study with expansions of resonances corresponding to: C3 and C5 (C); C2 and C6 (D)
The signal for C3 (Figure 7), shows the typical pattern for incorporation of an
intact C-C bond with a doublet corresponding to the signal for C3 in isotopically
labelled molecules of ST 1 superimposed on top of the singlet (centre) corresponding to
the natural abundance 13C signal of C3 and C5 in unlabelled molecules of ST 1. In this
case the height of the doublet resonance is approximately the same as the natural
abundance signal indicating approximately 4% incorporation of labelled acetate at C3 (2
line signal corresponding to one isotopically enriched carbon resonance, same intensity
as one line signal corresponding to 2 equivalent C).
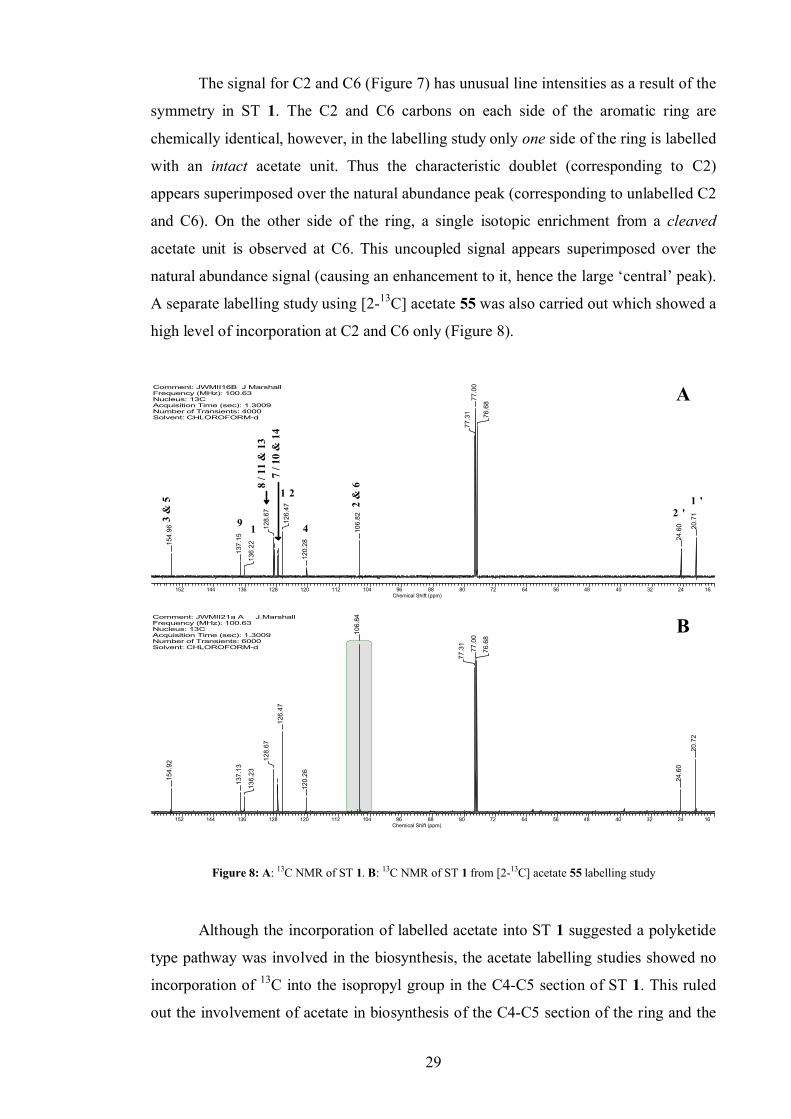
29
The signal for C2 and C6 (Figure 7) has unusual line intensities as a result of the
symmetry in ST 1. The C2 and C6 carbons on each side of the aromatic ring are
chemically identical, however, in the labelling study only one side of the ring is labelled
with an intact acetate unit. Thus the characteristic doublet (corresponding to C2)
appears superimposed over the natural abundance peak (corresponding to unlabelled C2
and C6). On the other side of the ring, a single isotopic enrichment from a cleaved
acetate unit is observed at C6. This uncoupled signal appears superimposed over the
natural abundance signal (causing an enhancement to it, hence the large ‘central’ peak).
A separate labelling study using [2-13C] acetate 55 was also carried out which showed a
high level of incorporation at C2 and C6 only (Figure 8).
Comment: JWMII16B J MarshallFrequency (MHz): 100.63Nucleus: 13CAcquisition Time (sec): 1.3009Number of Transients: 4000Solvent: CHLOROFORM-d
152 144 136 128 120 112 104 96 88 80 72 64 56 48 40 32 24 16Chemical Shift (ppm)
154.
96
137.
15
136.
22
128.
67
126.
47
120.
28
106.
82
77.3
177
.00
76.6
8
24.6
0 20.7
1
1 '2 '3
& 5 2
& 6
4
8 / 1
1 &
13
9 1
1 2
7 / 1
0 &
14
A
Comment: JWMII21a A J.MarshallFrequency (MHz): 100.63Nucleus: 13CAcquisition Time (sec): 1.3009Number of Transients: 6000Solvent: CHLOROFORM-d
152 144 136 128 120 112 104 96 88 80 72 64 56 48 40 32 24 16Chemical Shift (ppm)
20.7
2
24.6
0
76.6
8
77.0
0
77.3
1
106.
84
120.
26
126.
47
128.
67
136.
23
137.
13
154.
92
B
Figure 8: A: 13C NMR of ST 1. B: 13C NMR of ST 1 from [2-13C] acetate 55 labelling study
Although the incorporation of labelled acetate into ST 1 suggested a polyketide
type pathway was involved in the biosynthesis, the acetate labelling studies showed no
incorporation of 13C into the isopropyl group in the C4-C5 section of ST 1. This ruled
out the involvement of acetate in biosynthesis of the C4-C5 section of the ring and the

30
isopropyl group C1’-C2’, but did not rule out the involvement of isopropylmalonate 56
which could possibly be obtained by P. luminescens during valine 57 or leucine 58
catabolism, (Scheme 12).[84, 85] If isopropylmalonate derived from an amino acid was
involved in the biosynthesis, then no incorporation of 13C from labelled acetate would
be expected in the isopropyl group or C4-C5 section of the aromatic ring of ST 1, which
would explain the result of the [13C] acetate labelling studies.
NH2
OH
O
O
OH
O
HOOH
O
OHO
OH
O
HO
O
OH
OH
O
O
O
OH
O
O
OHH2N
O
OH
OH
O
O OH
amino transferase
amino transferase dehydrogenase
isomerase
L-leucine 58
L-valine 57
SCoA
O
Isopropylmalonate 56
[O]
Scheme 12: Possible biosynthetic routes to isopropylmalonate 56.
2.1.2 Isopropylmalonate labelling study
In order to test for the involvement of isopropyl malonate 56, [2-13C]
isopropylmalonate 59 was synthesised from commercially available diethyl [2-13C]
malonate 60 (Scheme 13).
Scheme 13: [2-13C] 2-isopropyl malonate 59, from [2-13C] diethyl malonate 60.
The synthesis was first carried out with unlabelled diethyl malonate to test the
conditions. Diethyl isopropylmalonate was obtained in 89% yield by flash
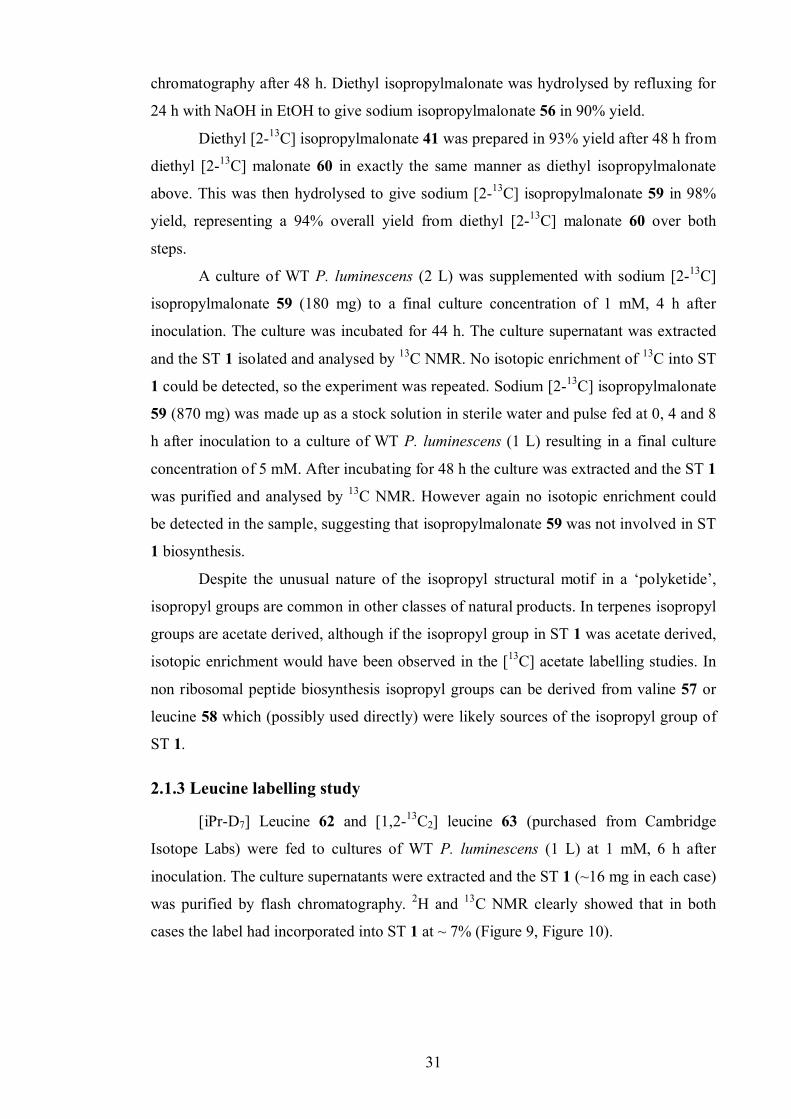
31
chromatography after 48 h. Diethyl isopropylmalonate was hydrolysed by refluxing for
24 h with NaOH in EtOH to give sodium isopropylmalonate 56 in 90% yield.
Diethyl [2-13C] isopropylmalonate 41 was prepared in 93% yield after 48 h from
diethyl [2-13C] malonate 60 in exactly the same manner as diethyl isopropylmalonate
above. This was then hydrolysed to give sodium [2-13C] isopropylmalonate 59 in 98%
yield, representing a 94% overall yield from diethyl [2-13C] malonate 60 over both
steps.
A culture of WT P. luminescens (2 L) was supplemented with sodium [2-13C]
isopropylmalonate 59 (180 mg) to a final culture concentration of 1 mM, 4 h after
inoculation. The culture was incubated for 44 h. The culture supernatant was extracted
and the ST 1 isolated and analysed by 13C NMR. No isotopic enrichment of 13C into ST
1 could be detected, so the experiment was repeated. Sodium [2-13C] isopropylmalonate
59 (870 mg) was made up as a stock solution in sterile water and pulse fed at 0, 4 and 8
h after inoculation to a culture of WT P. luminescens (1 L) resulting in a final culture
concentration of 5 mM. After incubating for 48 h the culture was extracted and the ST 1
was purified and analysed by 13C NMR. However again no isotopic enrichment could
be detected in the sample, suggesting that isopropylmalonate 59 was not involved in ST
1 biosynthesis.
Despite the unusual nature of the isopropyl structural motif in a ‘polyketide’,
isopropyl groups are common in other classes of natural products. In terpenes isopropyl
groups are acetate derived, although if the isopropyl group in ST 1 was acetate derived,
isotopic enrichment would have been observed in the [13C] acetate labelling studies. In
non ribosomal peptide biosynthesis isopropyl groups can be derived from valine 57 or
leucine 58 which (possibly used directly) were likely sources of the isopropyl group of
ST 1.
2.1.3 Leucine labelling study
[iPr-D7] Leucine 62 and [1,2-13C2] leucine 63 (purchased from Cambridge
Isotope Labs) were fed to cultures of WT P. luminescens (1 L) at 1 mM, 6 h after
inoculation. The culture supernatants were extracted and the ST 1 (~16 mg in each case)
was purified by flash chromatography. 2H and 13C NMR clearly showed that in both
cases the label had incorporated into ST 1 at ~ 7% (Figure 9, Figure 10).
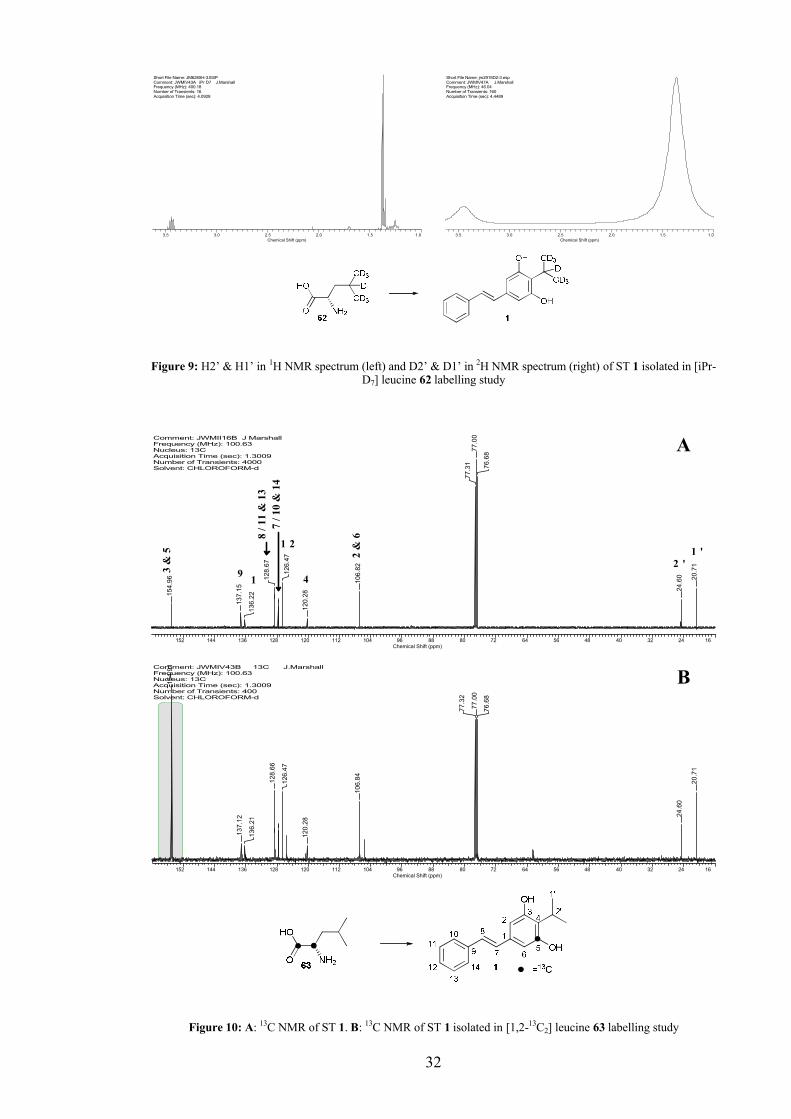
32
Short File Name: JM6265H-3.ESPComment: JWMIV43A iPr D7 J.MarshallFrequency (MHz): 400.18Number of Transients: 16Acquisition Time (sec): 4.0928
3.5 3.0 2.5 2.0 1.5 1.0Chemical Shift (ppm)
Short File Name: jm2915D2-3.espComment: JWMIV47A J.MarshallFrequency (MHz): 46.04Number of Transients: 160Acquisition Time (sec): 4.4489
3.5 3.0 2.5 2.0 1.5 1.0Chemical Shift (ppm)
Figure 9: H2’ & H1’ in 1H NMR spectrum (left) and D2’ & D1’ in 2H NMR spectrum (right) of ST 1 isolated in [iPr-D7] leucine 62 labelling study
Comment: JWMII16B J MarshallFrequency (MHz): 100.63Nucleus: 13CAcquisition Time (sec): 1.3009Number of Transients: 4000Solvent: CHLOROFORM-d
152 144 136 128 120 112 104 96 88 80 72 64 56 48 40 32 24 16Chemical Shift (ppm)
154.
96
137.
15
136.
22
128.
67
126.
47
120.
28
106.
82
77.3
177
.00
76.6
8
24.6
0 20.7
1
1 '2 '3
& 5 2
& 6
4
8 / 1
1 &
13
9 1
1 2
7 / 1
0 &
14
A
Comment: JWMIV43B 13C J.MarshallFrequency (MHz): 100.63Nucleus: 13CAcquisition Time (sec): 1.3009Number of Transients: 400Solvent: CHLOROFORM-d
152 144 136 128 120 112 104 96 88 80 72 64 56 48 40 32 24 16Chemical Shift (ppm)
20.7
1
24.6
0
76.6
8
77.0
0
77.3
2
106.
84
120.
28
126.
47
128.
66
136.
21
137.
12
154.
91 B
Figure 10: A: 13C NMR of ST 1. B: 13C NMR of ST 1 isolated in [1,2-13C2] leucine 63 labelling study
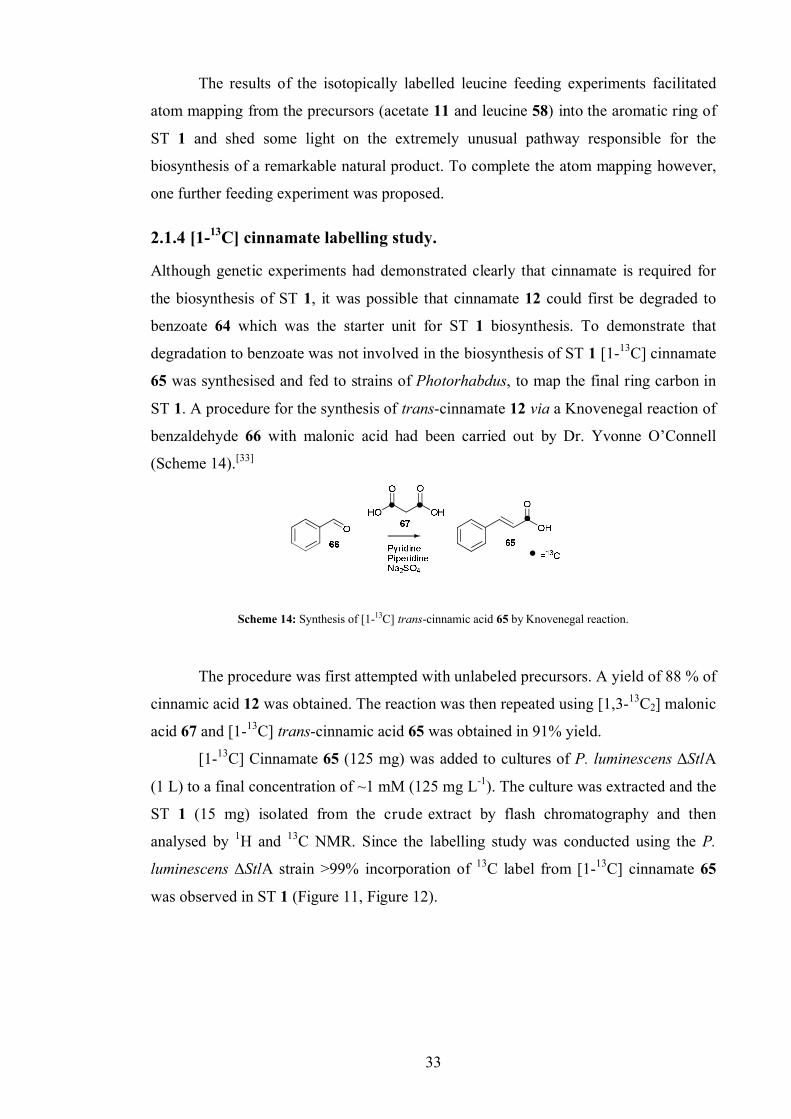
33
The results of the isotopically labelled leucine feeding experiments facilitated
atom mapping from the precursors (acetate 11 and leucine 58) into the aromatic ring of
ST 1 and shed some light on the extremely unusual pathway responsible for the
biosynthesis of a remarkable natural product. To complete the atom mapping however,
one further feeding experiment was proposed.
2.1.4 [1-13C] cinnamate labelling study.
Although genetic experiments had demonstrated clearly that cinnamate is required for
the biosynthesis of ST 1, it was possible that cinnamate 12 could first be degraded to
benzoate 64 which was the starter unit for ST 1 biosynthesis. To demonstrate that
degradation to benzoate was not involved in the biosynthesis of ST 1 [1-13C] cinnamate
65 was synthesised and fed to strains of Photorhabdus, to map the final ring carbon in
ST 1. A procedure for the synthesis of trans-cinnamate 12 via a Knovenegal reaction of
benzaldehyde 66 with malonic acid had been carried out by Dr. Yvonne O’Connell
(Scheme 14).[33]
Scheme 14: Synthesis of [1-13C] trans-cinnamic acid 65 by Knovenegal reaction.
The procedure was first attempted with unlabeled precursors. A yield of 88 % of
cinnamic acid 12 was obtained. The reaction was then repeated using [1,3-13C2] malonic
acid 67 and [1-13C] trans-cinnamic acid 65 was obtained in 91% yield.
[1-13C] Cinnamate 65 (125 mg) was added to cultures of P. luminescens ΔStlA
(1 L) to a final concentration of ~1 mM (125 mg L-1). The culture was extracted and the
ST 1 (15 mg) isolated from the crude extract by flash chromatography and then
analysed by 1H and 13C NMR. Since the labelling study was conducted using the P.
luminescens ΔStlA strain >99% incorporation of 13C label from [1-13C] cinnamate 65
was observed in ST 1 (Figure 11, Figure 12).
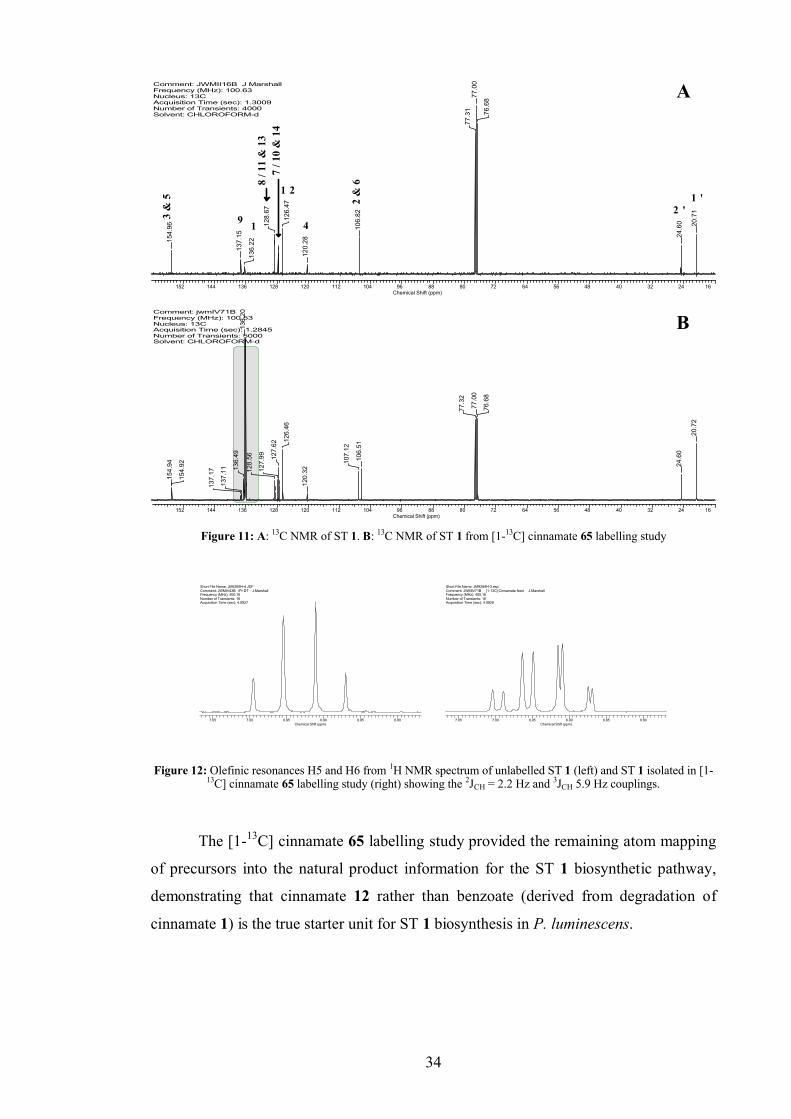
34
Comment: JWMII16B J MarshallFrequency (MHz): 100.63Nucleus: 13CAcquisition Time (sec): 1.3009Number of Transients: 4000Solvent: CHLOROFORM-d
152 144 136 128 120 112 104 96 88 80 72 64 56 48 40 32 24 16Chemical Shift (ppm)
154.
96
137.
15
136.
22
128.
67
126.
47
120.
28
106.
82
77.3
177
.00
76.6
8
24.6
0 20.7
1
1 '2 '3
& 5 2
& 6
4
8 / 1
1 &
13
9 1
1 2
7 / 1
0 &
14
A
Comment: jwmIV71BFrequency (MHz): 100.53Nucleus: 13CAcquisition Time (sec): 1.2845Number of Transients: 5000Solvent: CHLOROFORM-d
152 144 136 128 120 112 104 96 88 80 72 64 56 48 40 32 24 16Chemical Shift (ppm)
20.7
2
24.6
0
76.6
8
77.0
0
77.3
2
106.
51
107.
12
120.
32
126.
46
127.
62
127.
99
128.
5613
6.20
136.
49
137.
11
137.
17
154.
92
154.
94
B
Figure 11: A: 13C NMR of ST 1. B: 13C NMR of ST 1 from [1-13C] cinnamate 65 labelling study
Short File Name: JM6265H-4.JDFComment: JWMIV43B iPr D7 J.MarshallFrequency (MHz): 400.18Number of Transients: 16Acquisition Time (sec): 4.0927
7.05 7.00 6.95 6.90 6.85 6.80Chemical Shift (ppm)
Short File Name: JM9284H-3.espComment: JWMIV71B [1-13C] Cinnamate feed J.MarshallFrequency (MHz): 400.18Number of Transients: 16Acquisition Time (sec): 4.0928
7.05 7.00 6.95 6.90 6.85 6.80Chemical Shift (ppm)
Figure 12: Olefinic resonances H5 and H6 from 1H NMR spectrum of unlabelled ST 1 (left) and ST 1 isolated in [1-13C] cinnamate 65 labelling study (right) showing the 2JCH = 2.2 Hz and 3JCH 5.9 Hz couplings.
The [1-13C] cinnamate 65 labelling study provided the remaining atom mapping
of precursors into the natural product information for the ST 1 biosynthetic pathway,
demonstrating that cinnamate 12 rather than benzoate (derived from degradation of
cinnamate 1) is the true starter unit for ST 1 biosynthesis in P. luminescens.
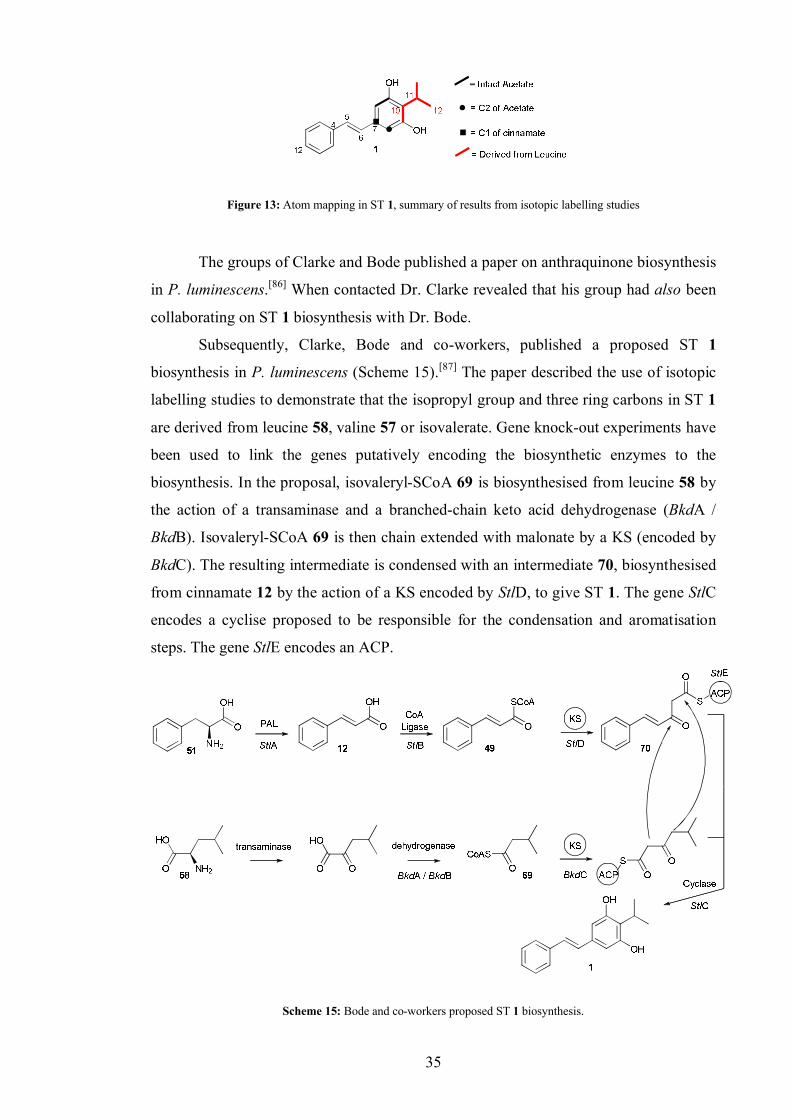
35
Figure 13: Atom mapping in ST 1, summary of results from isotopic labelling studies
The groups of Clarke and Bode published a paper on anthraquinone biosynthesis
in P. luminescens.[86] When contacted Dr. Clarke revealed that his group had also been
collaborating on ST 1 biosynthesis with Dr. Bode.
Subsequently, Clarke, Bode and co-workers, published a proposed ST 1
biosynthesis in P. luminescens (Scheme 15).[87] The paper described the use of isotopic
labelling studies to demonstrate that the isopropyl group and three ring carbons in ST 1
are derived from leucine 58, valine 57 or isovalerate. Gene knock-out experiments have
been used to link the genes putatively encoding the biosynthetic enzymes to the
biosynthesis. In the proposal, isovaleryl-SCoA 69 is biosynthesised from leucine 58 by
the action of a transaminase and a branched-chain keto acid dehydrogenase (BkdA /
BkdB). Isovaleryl-SCoA 69 is then chain extended with malonate by a KS (encoded by
BkdC). The resulting intermediate is condensed with an intermediate 70, biosynthesised
from cinnamate 12 by the action of a KS encoded by StlD, to give ST 1. The gene StlC
encodes a cyclise proposed to be responsible for the condensation and aromatisation
steps. The gene StlE encodes an ACP.
Scheme 15: Bode and co-workers proposed ST 1 biosynthesis.
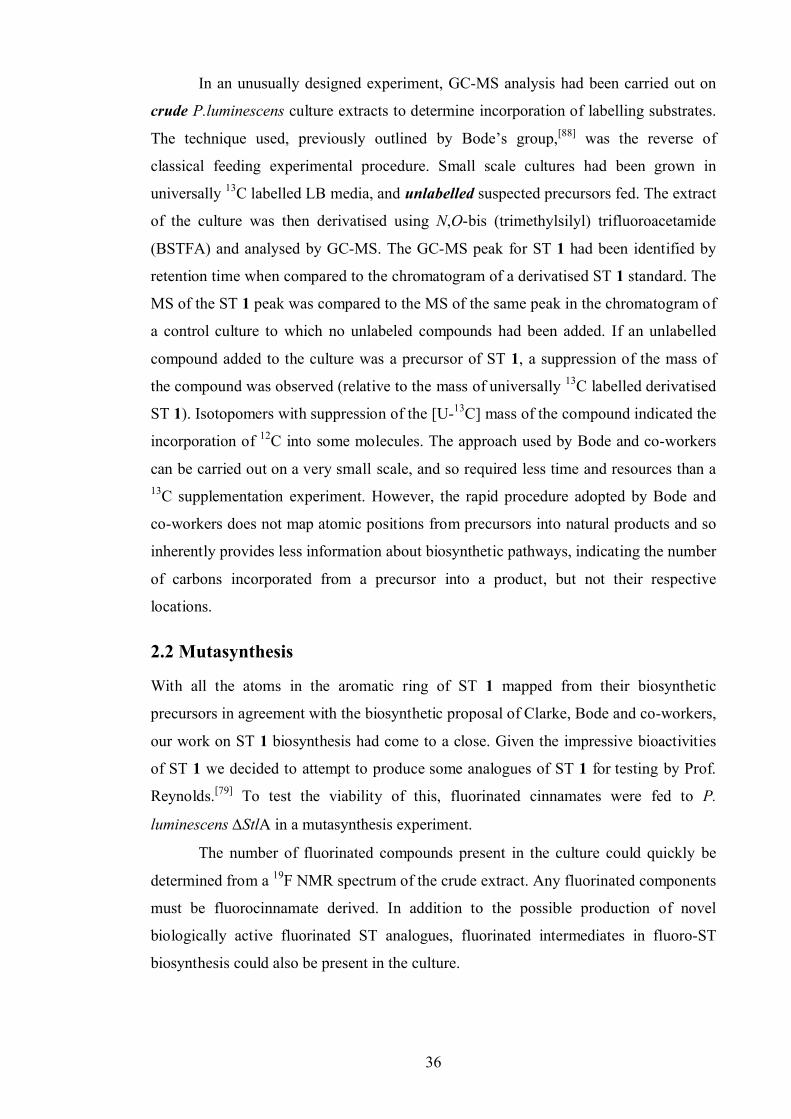
36
In an unusually designed experiment, GC-MS analysis had been carried out on
crude P.luminescens culture extracts to determine incorporation of labelling substrates.
The technique used, previously outlined by Bode’s group,[88] was the reverse of
classical feeding experimental procedure. Small scale cultures had been grown in
universally 13C labelled LB media, and unlabelled suspected precursors fed. The extract
of the culture was then derivatised using N,O-bis (trimethylsilyl) trifluoroacetamide
(BSTFA) and analysed by GC-MS. The GC-MS peak for ST 1 had been identified by
retention time when compared to the chromatogram of a derivatised ST 1 standard. The
MS of the ST 1 peak was compared to the MS of the same peak in the chromatogram of
a control culture to which no unlabeled compounds had been added. If an unlabelled
compound added to the culture was a precursor of ST 1, a suppression of the mass of
the compound was observed (relative to the mass of universally 13C labelled derivatised
ST 1). Isotopomers with suppression of the [U-13C] mass of the compound indicated the
incorporation of 12C into some molecules. The approach used by Bode and co-workers
can be carried out on a very small scale, and so required less time and resources than a 13C supplementation experiment. However, the rapid procedure adopted by Bode and
co-workers does not map atomic positions from precursors into natural products and so
inherently provides less information about biosynthetic pathways, indicating the number
of carbons incorporated from a precursor into a product, but not their respective
locations.
2.2 Mutasynthesis
With all the atoms in the aromatic ring of ST 1 mapped from their biosynthetic
precursors in agreement with the biosynthetic proposal of Clarke, Bode and co-workers,
our work on ST 1 biosynthesis had come to a close. Given the impressive bioactivities
of ST 1 we decided to attempt to produce some analogues of ST 1 for testing by Prof.
Reynolds.[79] To test the viability of this, fluorinated cinnamates were fed to P.
luminescens StlA in a mutasynthesis experiment.
The number of fluorinated compounds present in the culture could quickly be
determined from a 19F NMR spectrum of the crude extract. Any fluorinated components
must be fluorocinnamate derived. In addition to the possible production of novel
biologically active fluorinated ST analogues, fluorinated intermediates in fluoro-ST
biosynthesis could also be present in the culture.
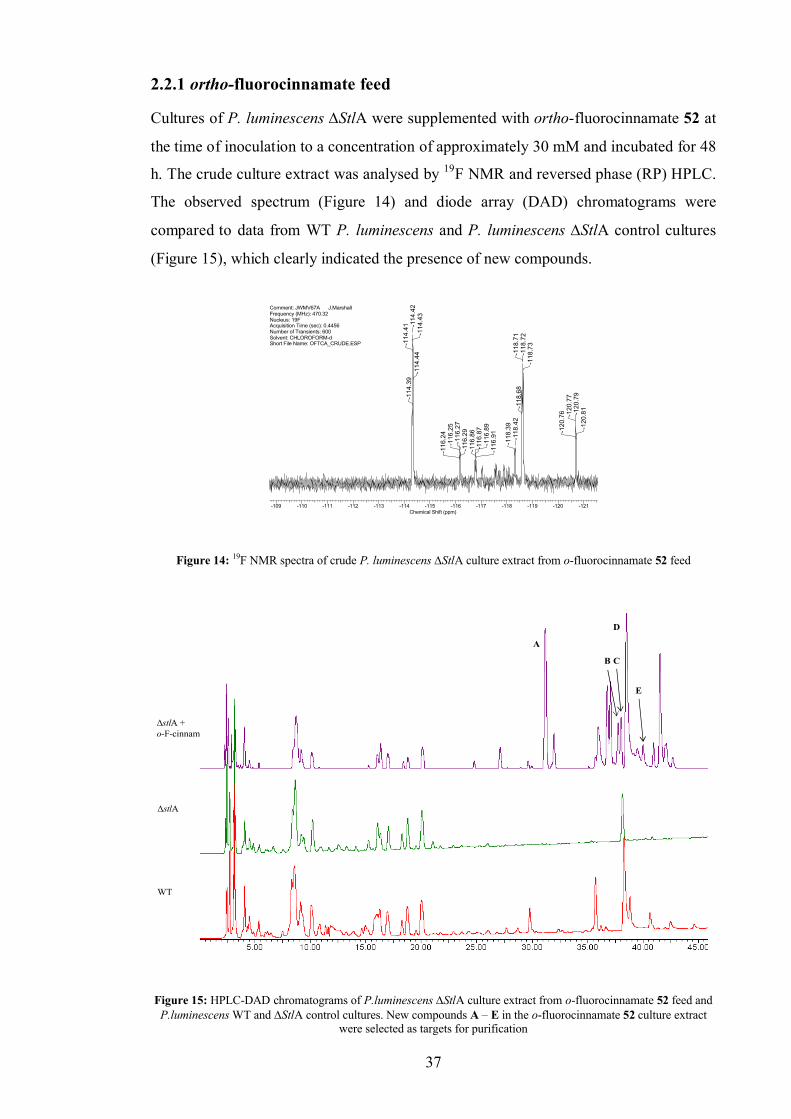
37
2.2.1 ortho-fluorocinnamate feed
Cultures of P. luminescens StlA were supplemented with ortho-fluorocinnamate 52 at
the time of inoculation to a concentration of approximately 30 mM and incubated for 48
h. The crude culture extract was analysed by 19F NMR and reversed phase (RP) HPLC.
The observed spectrum (Figure 14) and diode array (DAD) chromatograms were
compared to data from WT P. luminescens and P. luminescens StlA control cultures
(Figure 15), which clearly indicated the presence of new compounds.
Comment: JWMV67A J.MarshallFrequency (MHz): 470.32Nucleus: 19FAcquisition Time (sec): 0.4456Number of Transients: 600Solvent: CHLOROFORM-dShort File Name: OFTCA_CRUDE.ESP
-109 -110 -111 -112 -113 -114 -115 -116 -117 -118 -119 -120 -121Chemical Shift (ppm)
-120
.81-120
.79
-120
.77
-120
.76
-118
.73
-118
.72
-118
.71
-118
.68
-118
.42
-118
.39
-116
.91
-116
.89
-116
.87
-116
.86
-116
.29
-116
.27
-116
.25
-116
.24
-114
.44
-114
.43
-114
.42
-114
.41
-114
.39
Figure 14: 19F NMR spectra of crude P. luminescens StlA culture extract from o-fluorocinnamate 52 feed
WT
ΔstlA +o-F-cinnamate
ΔstlA
A
B C
D
E
Figure 15: HPLC-DAD chromatograms of P.luminescens StlA culture extract from o-fluorocinnamate 52 feed and P.luminescens WT and StlA control cultures. New compounds A – E in the o-fluorocinnamate 52 culture extract
were selected as targets for purification
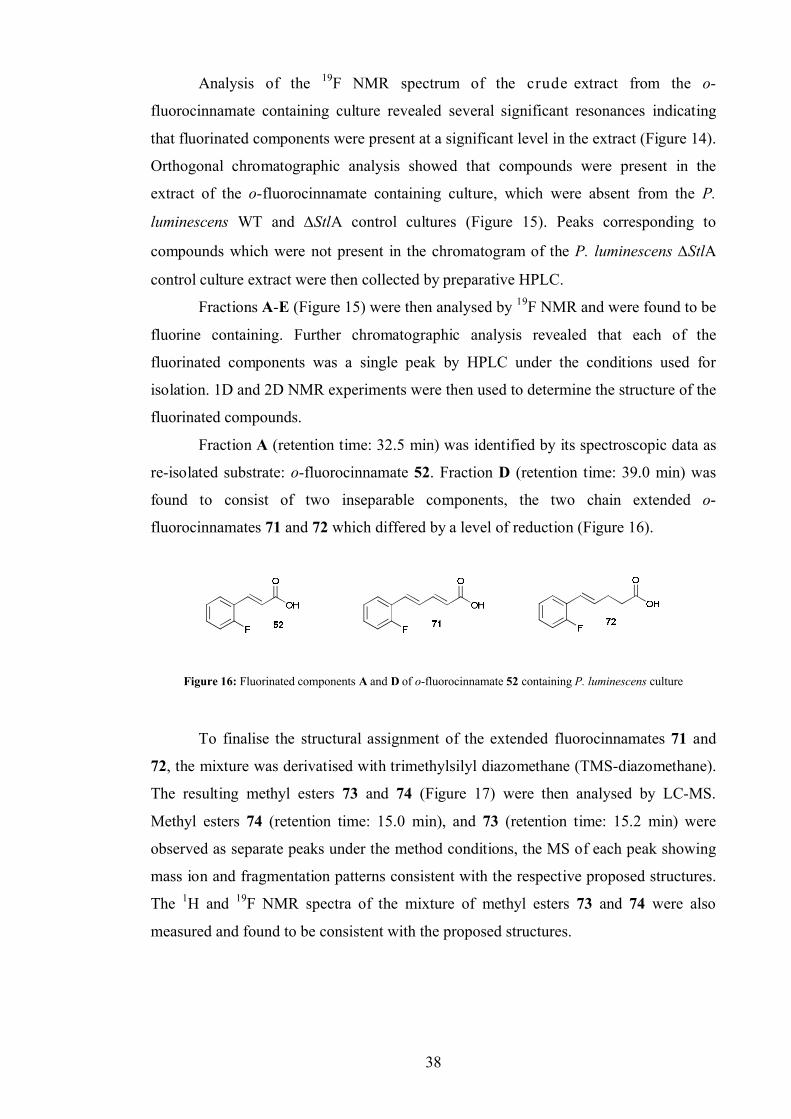
38
Analysis of the 19F NMR spectrum of the crude extract from the o-
fluorocinnamate containing culture revealed several significant resonances indicating
that fluorinated components were present at a significant level in the extract (Figure 14).
Orthogonal chromatographic analysis showed that compounds were present in the
extract of the o-fluorocinnamate containing culture, which were absent from the P.
luminescens WT and StlA control cultures (Figure 15). Peaks corresponding to
compounds which were not present in the chromatogram of the P. luminescens StlA
control culture extract were then collected by preparative HPLC.
Fractions A-E (Figure 15) were then analysed by 19F NMR and were found to be
fluorine containing. Further chromatographic analysis revealed that each of the
fluorinated components was a single peak by HPLC under the conditions used for
isolation. 1D and 2D NMR experiments were then used to determine the structure of the
fluorinated compounds.
Fraction A (retention time: 32.5 min) was identified by its spectroscopic data as
re-isolated substrate: o-fluorocinnamate 52. Fraction D (retention time: 39.0 min) was
found to consist of two inseparable components, the two chain extended o-
fluorocinnamates 71 and 72 which differed by a level of reduction (Figure 16).
Figure 16: Fluorinated components A and D of o-fluorocinnamate 52 containing P. luminescens culture
To finalise the structural assignment of the extended fluorocinnamates 71 and
72, the mixture was derivatised with trimethylsilyl diazomethane (TMS-diazomethane).
The resulting methyl esters 73 and 74 (Figure 17) were then analysed by LC-MS.
Methyl esters 74 (retention time: 15.0 min), and 73 (retention time: 15.2 min) were
observed as separate peaks under the method conditions, the MS of each peak showing
mass ion and fragmentation patterns consistent with the respective proposed structures.
The 1H and 19F NMR spectra of the mixture of methyl esters 73 and 74 were also
measured and found to be consistent with the proposed structures.
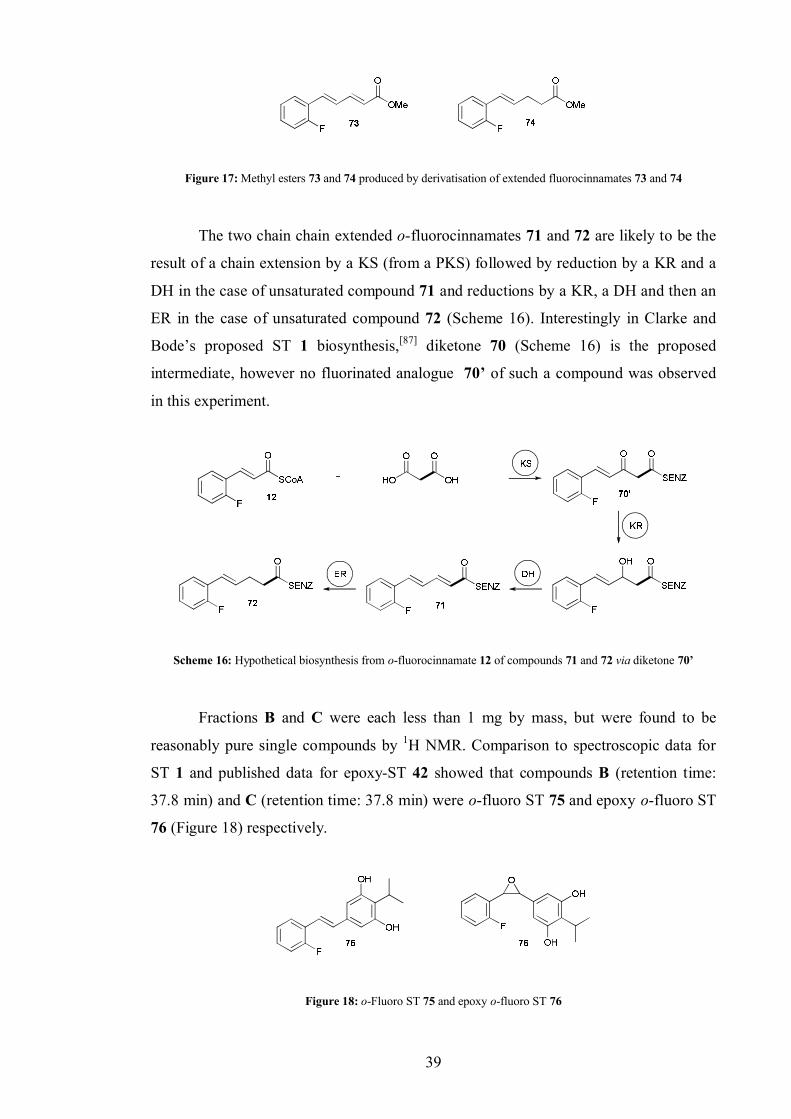
39
Figure 17: Methyl esters 73 and 74 produced by derivatisation of extended fluorocinnamates 73 and 74
The two chain chain extended o-fluorocinnamates 71 and 72 are likely to be the
result of a chain extension by a KS (from a PKS) followed by reduction by a KR and a
DH in the case of unsaturated compound 71 and reductions by a KR, a DH and then an
ER in the case of unsaturated compound 72 (Scheme 16). Interestingly in Clarke and
Bode’s proposed ST 1 biosynthesis,[87] diketone 70 (Scheme 16) is the proposed
intermediate, however no fluorinated analogue 70’ of such a compound was observed
in this experiment.
Scheme 16: Hypothetical biosynthesis from o-fluorocinnamate 12 of compounds 71 and 72 via diketone 70’
Fractions B and C were each less than 1 mg by mass, but were found to be
reasonably pure single compounds by 1H NMR. Comparison to spectroscopic data for
ST 1 and published data for epoxy-ST 42 showed that compounds B (retention time:
37.8 min) and C (retention time: 37.8 min) were o-fluoro ST 75 and epoxy o-fluoro ST
76 (Figure 18) respectively.
Figure 18: o-Fluoro ST 75 and epoxy o-fluoro ST 76
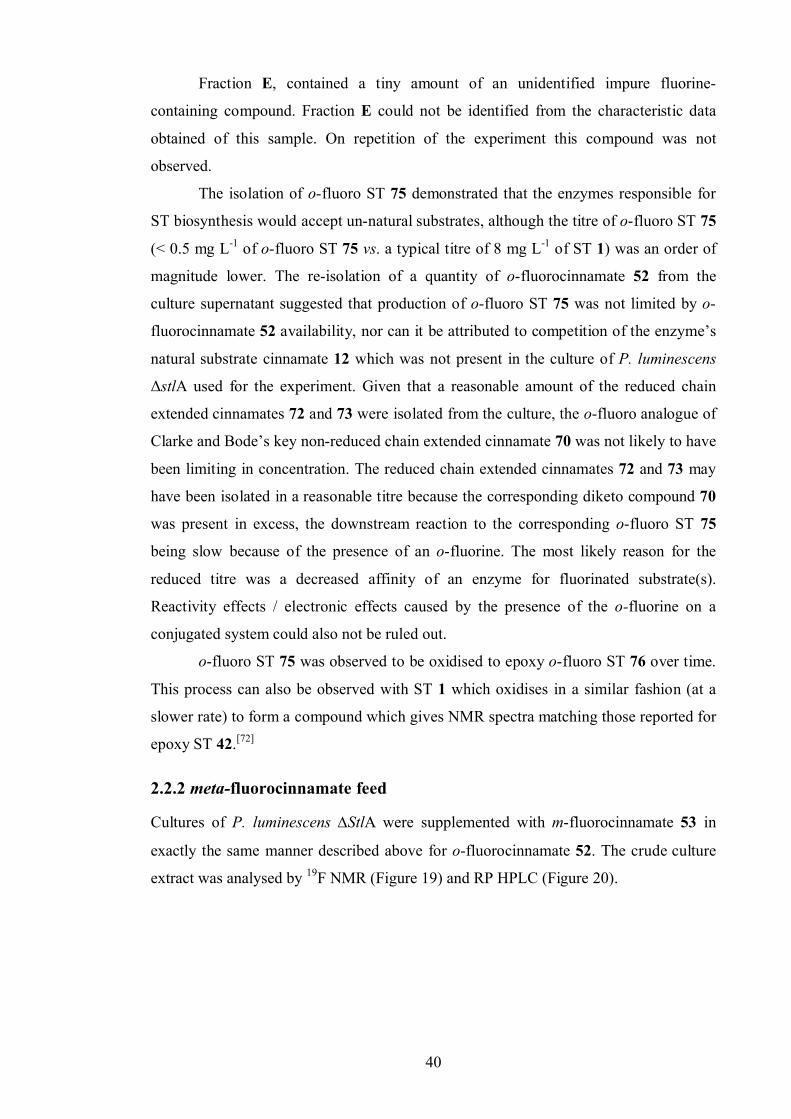
40
Fraction E, contained a tiny amount of an unidentified impure fluorine-
containing compound. Fraction E could not be identified from the characteristic data
obtained of this sample. On repetition of the experiment this compound was not
observed.
The isolation of o-fluoro ST 75 demonstrated that the enzymes responsible for
ST biosynthesis would accept un-natural substrates, although the titre of o-fluoro ST 75
(< 0.5 mg L-1 of o-fluoro ST 75 vs. a typical titre of 8 mg L-1 of ST 1) was an order of
magnitude lower. The re-isolation of a quantity of o-fluorocinnamate 52 from the
culture supernatant suggested that production of o-fluoro ST 75 was not limited by o-
fluorocinnamate 52 availability, nor can it be attributed to competition of the enzyme’s
natural substrate cinnamate 12 which was not present in the culture of P. luminescens
ΔstlA used for the experiment. Given that a reasonable amount of the reduced chain
extended cinnamates 72 and 73 were isolated from the culture, the o-fluoro analogue of
Clarke and Bode’s key non-reduced chain extended cinnamate 70 was not likely to have
been limiting in concentration. The reduced chain extended cinnamates 72 and 73 may
have been isolated in a reasonable titre because the corresponding diketo compound 70
was present in excess, the downstream reaction to the corresponding o-fluoro ST 75
being slow because of the presence of an o-fluorine. The most likely reason for the
reduced titre was a decreased affinity of an enzyme for fluorinated substrate(s).
Reactivity effects / electronic effects caused by the presence of the o-fluorine on a
conjugated system could also not be ruled out.
o-fluoro ST 75 was observed to be oxidised to epoxy o-fluoro ST 76 over time.
This process can also be observed with ST 1 which oxidises in a similar fashion (at a
slower rate) to form a compound which gives NMR spectra matching those reported for
epoxy ST 42.[72]
2.2.2 meta-fluorocinnamate feed
Cultures of P. luminescens StlA were supplemented with m-fluorocinnamate 53 in
exactly the same manner described above for o-fluorocinnamate 52. The crude culture
extract was analysed by 19F NMR (Figure 19) and RP HPLC (Figure 20).
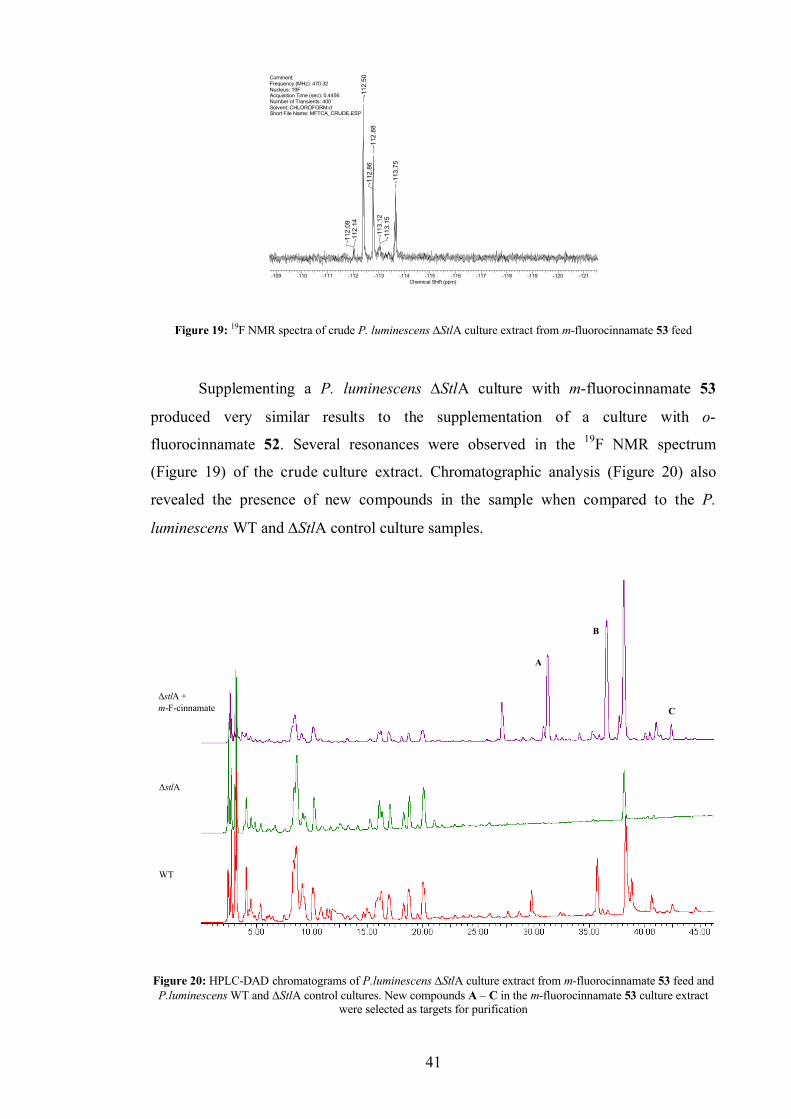
41
Comment: Frequency (MHz): 470.32Nucleus: 19FAcquisition Time (sec): 0.4456Number of Transients: 400Solvent: CHLOROFORM-dShort File Name: MFTCA_CRUDE.ESP
-109 -110 -111 -112 -113 -114 -115 -116 -117 -118 -119 -120 -121Chemical Shift (ppm)
-112
.09
-112
.14
-112
.50
-112
.86
-112
.88
-113
.12
-113
.15
-113
.75
Figure 19: 19F NMR spectra of crude P. luminescens StlA culture extract from m-fluorocinnamate 53 feed
Supplementing a P. luminescens StlA culture with m-fluorocinnamate 53
produced very similar results to the supplementation of a culture with o-
fluorocinnamate 52. Several resonances were observed in the 19F NMR spectrum
(Figure 19) of the crude culture extract. Chromatographic analysis (Figure 20) also
revealed the presence of new compounds in the sample when compared to the P.
luminescens WT and StlA control culture samples.
WT
ΔstlA +m-F-cinnamate
ΔstlA
A
B
C
Figure 20: HPLC-DAD chromatograms of P.luminescens StlA culture extract from m-fluorocinnamate 53 feed and P.luminescens WT and StlA control cultures. New compounds A – C in the m-fluorocinnamate 53 culture extract
were selected as targets for purification
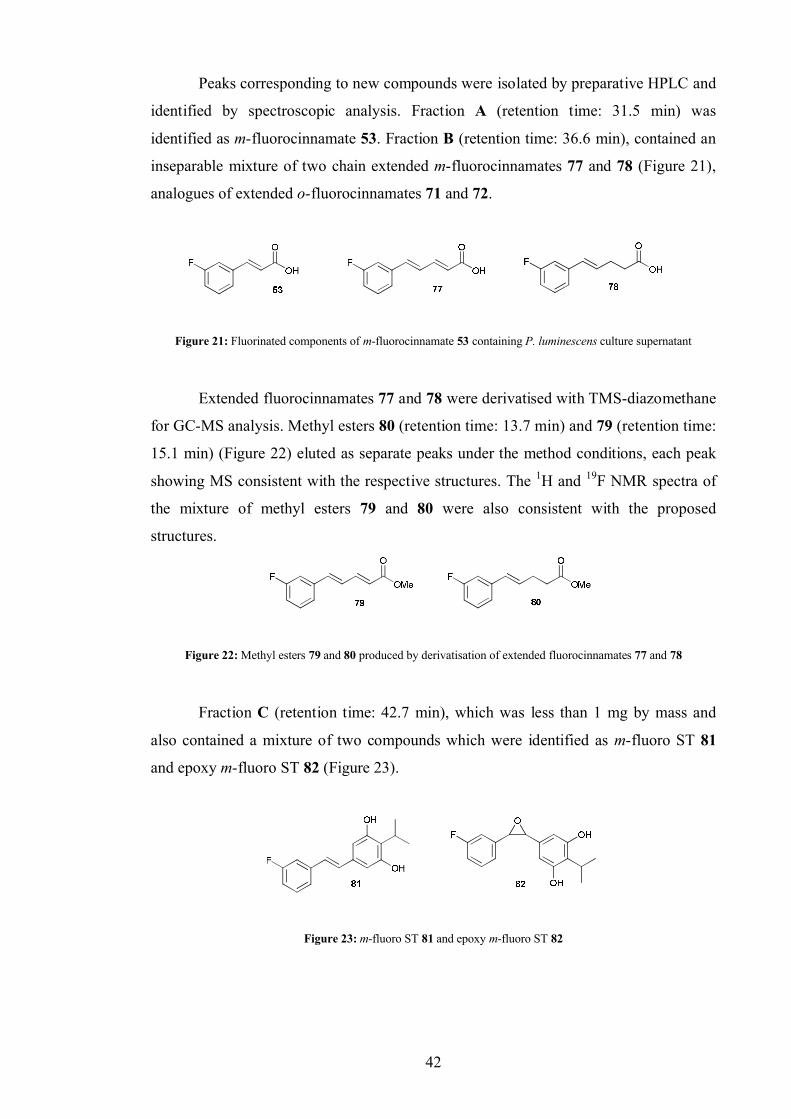
42
Peaks corresponding to new compounds were isolated by preparative HPLC and
identified by spectroscopic analysis. Fraction A (retention time: 31.5 min) was
identified as m-fluorocinnamate 53. Fraction B (retention time: 36.6 min), contained an
inseparable mixture of two chain extended m-fluorocinnamates 77 and 78 (Figure 21),
analogues of extended o-fluorocinnamates 71 and 72.
Figure 21: Fluorinated components of m-fluorocinnamate 53 containing P. luminescens culture supernatant
Extended fluorocinnamates 77 and 78 were derivatised with TMS-diazomethane
for GC-MS analysis. Methyl esters 80 (retention time: 13.7 min) and 79 (retention time:
15.1 min) (Figure 22) eluted as separate peaks under the method conditions, each peak
showing MS consistent with the respective structures. The 1H and 19F NMR spectra of
the mixture of methyl esters 79 and 80 were also consistent with the proposed
structures.
Figure 22: Methyl esters 79 and 80 produced by derivatisation of extended fluorocinnamates 77 and 78
Fraction C (retention time: 42.7 min), which was less than 1 mg by mass and
also contained a mixture of two compounds which were identified as m-fluoro ST 81
and epoxy m-fluoro ST 82 (Figure 23).
Figure 23: m-fluoro ST 81 and epoxy m-fluoro ST 82
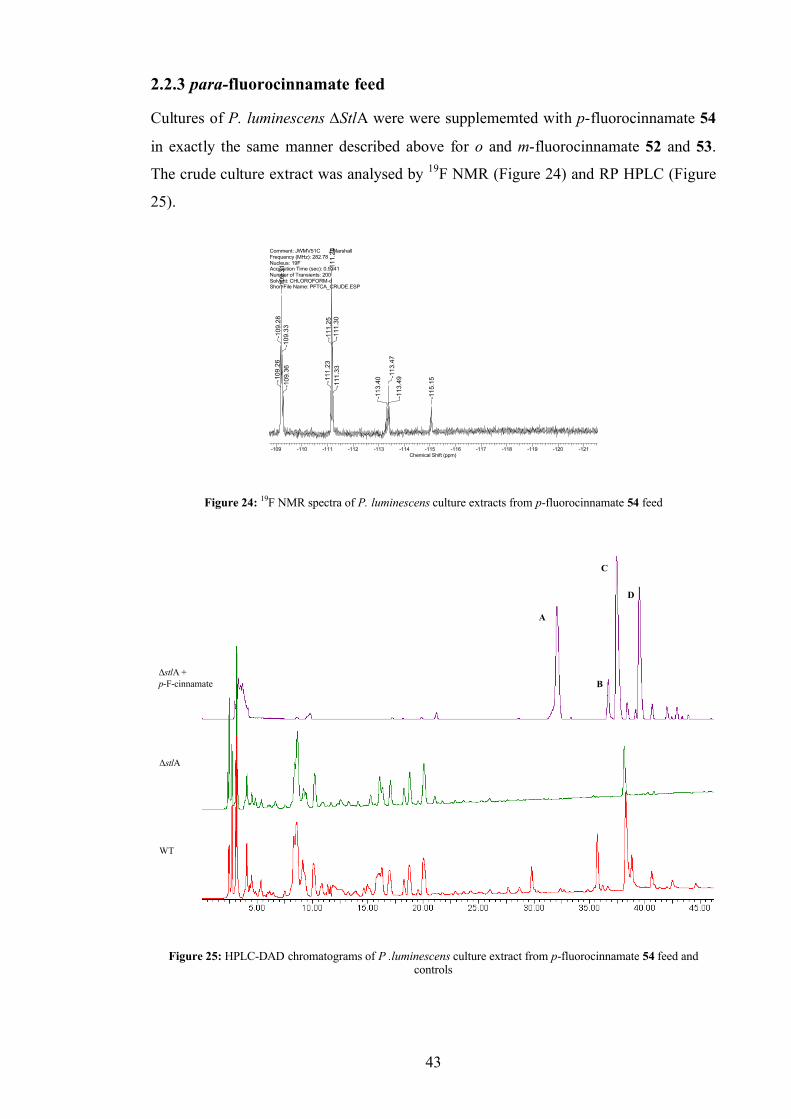
43
2.2.3 para-fluorocinnamate feed
Cultures of P. luminescens StlA were were supplememted with p-fluorocinnamate 54
in exactly the same manner described above for o and m-fluorocinnamate 52 and 53.
The crude culture extract was analysed by 19F NMR (Figure 24) and RP HPLC (Figure
25).
Comment: JWMV51C J.MarshallFrequency (MHz): 282.78Nucleus: 19FAcquisition Time (sec): 0.9241Number of Transients: 200Solvent: CHLOROFORM-dShort File Name: PFTCA_CRUDE.ESP
-109 -110 -111 -112 -113 -114 -115 -116 -117 -118 -119 -120 -121Chemical Shift (ppm)
-109
.26
-109
.28
-109
.31
-109
.33
-109
.36
-111
.23
-111
.25
-111
.28
-111
.30
-111
.33
-113
.40 -1
13.4
7-1
13.4
9
-115
.15
Figure 24: 19F NMR spectra of P. luminescens culture extracts from p-fluorocinnamate 54 feed
WT
ΔstlA +p-F-cinnamate
ΔstlA
A
B
C
D
Figure 25: HPLC-DAD chromatograms of P .luminescens culture extract from p-fluorocinnamate 54 feed and controls
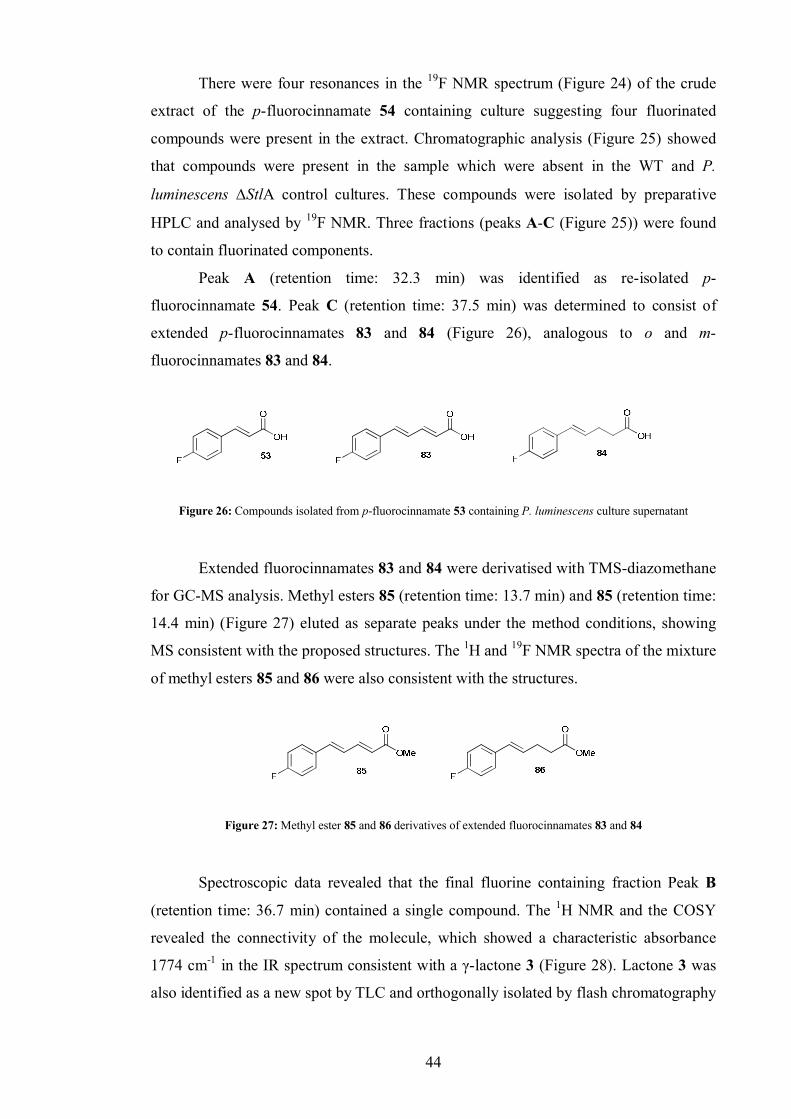
44
There were four resonances in the 19F NMR spectrum (Figure 24) of the crude
extract of the p-fluorocinnamate 54 containing culture suggesting four fluorinated
compounds were present in the extract. Chromatographic analysis (Figure 25) showed
that compounds were present in the sample which were absent in the WT and P.
luminescens StlA control cultures. These compounds were isolated by preparative
HPLC and analysed by 19F NMR. Three fractions (peaks A-C (Figure 25)) were found
to contain fluorinated components.
Peak A (retention time: 32.3 min) was identified as re-isolated p-
fluorocinnamate 54. Peak C (retention time: 37.5 min) was determined to consist of
extended p-fluorocinnamates 83 and 84 (Figure 26), analogous to o and m-
fluorocinnamates 83 and 84.
Figure 26: Compounds isolated from p-fluorocinnamate 53 containing P. luminescens culture supernatant
Extended fluorocinnamates 83 and 84 were derivatised with TMS-diazomethane
for GC-MS analysis. Methyl esters 85 (retention time: 13.7 min) and 85 (retention time:
14.4 min) (Figure 27) eluted as separate peaks under the method conditions, showing
MS consistent with the proposed structures. The 1H and 19F NMR spectra of the mixture
of methyl esters 85 and 86 were also consistent with the structures.
Figure 27: Methyl ester 85 and 86 derivatives of extended fluorocinnamates 83 and 84
Spectroscopic data revealed that the final fluorine containing fraction Peak B
(retention time: 36.7 min) contained a single compound. The 1H NMR and the COSY
revealed the connectivity of the molecule, which showed a characteristic absorbance
1774 cm-1 in the IR spectrum consistent with a γ-lactone 3 (Figure 28). Lactone 3 was
also identified as a new spot by TLC and orthogonally isolated by flash chromatography
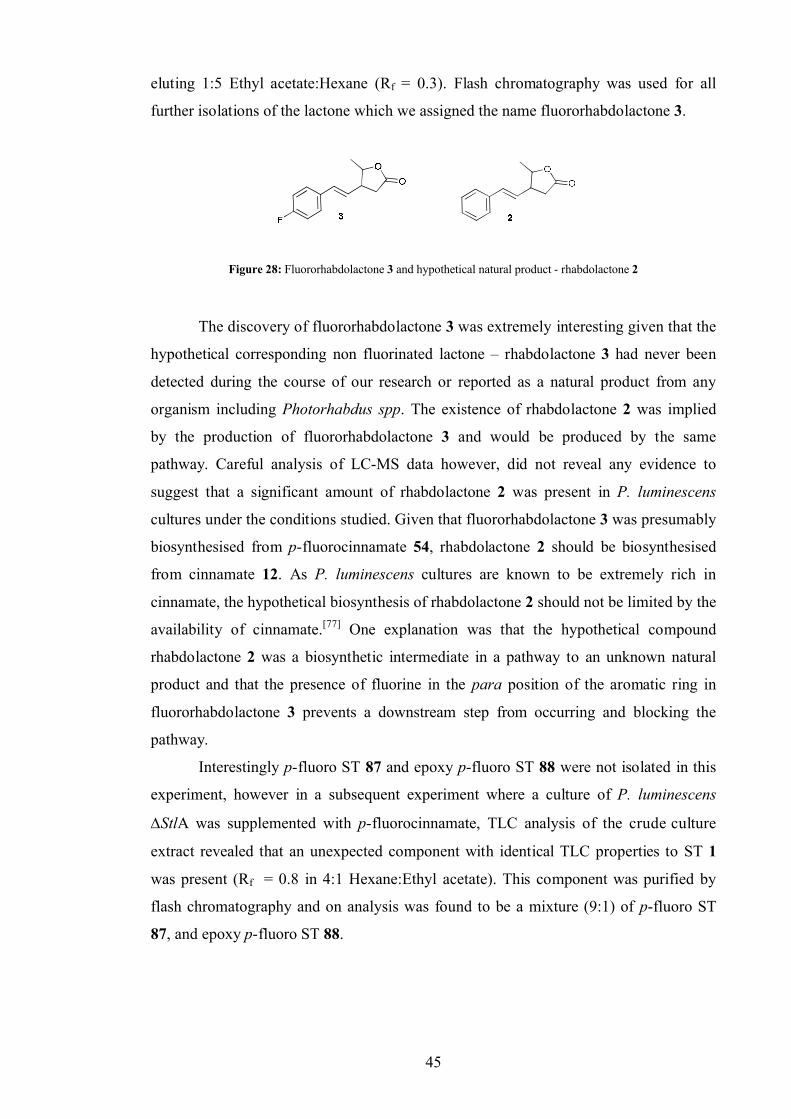
45
eluting 1:5 Ethyl acetate:Hexane (Rf = 0.3). Flash chromatography was used for all
further isolations of the lactone which we assigned the name fluororhabdolactone 3.
Figure 28: Fluororhabdolactone 3 and hypothetical natural product - rhabdolactone 2
The discovery of fluororhabdolactone 3 was extremely interesting given that the
hypothetical corresponding non fluorinated lactone – rhabdolactone 3 had never been
detected during the course of our research or reported as a natural product from any
organism including Photorhabdus spp. The existence of rhabdolactone 2 was implied
by the production of fluororhabdolactone 3 and would be produced by the same
pathway. Careful analysis of LC-MS data however, did not reveal any evidence to
suggest that a significant amount of rhabdolactone 2 was present in P. luminescens
cultures under the conditions studied. Given that fluororhabdolactone 3 was presumably
biosynthesised from p-fluorocinnamate 54, rhabdolactone 2 should be biosynthesised
from cinnamate 12. As P. luminescens cultures are known to be extremely rich in
cinnamate, the hypothetical biosynthesis of rhabdolactone 2 should not be limited by the
availability of cinnamate.[77] One explanation was that the hypothetical compound
rhabdolactone 2 was a biosynthetic intermediate in a pathway to an unknown natural
product and that the presence of fluorine in the para position of the aromatic ring in
fluororhabdolactone 3 prevents a downstream step from occurring and blocking the
pathway.
Interestingly p-fluoro ST 87 and epoxy p-fluoro ST 88 were not isolated in this
experiment, however in a subsequent experiment where a culture of P. luminescens
StlA was supplemented with p-fluorocinnamate, TLC analysis of the crude culture
extract revealed that an unexpected component with identical TLC properties to ST 1
was present (Rf = 0.8 in 4:1 Hexane:Ethyl acetate). This component was purified by
flash chromatography and on analysis was found to be a mixture (9:1) of p-fluoro ST
87, and epoxy p-fluoro ST 88.
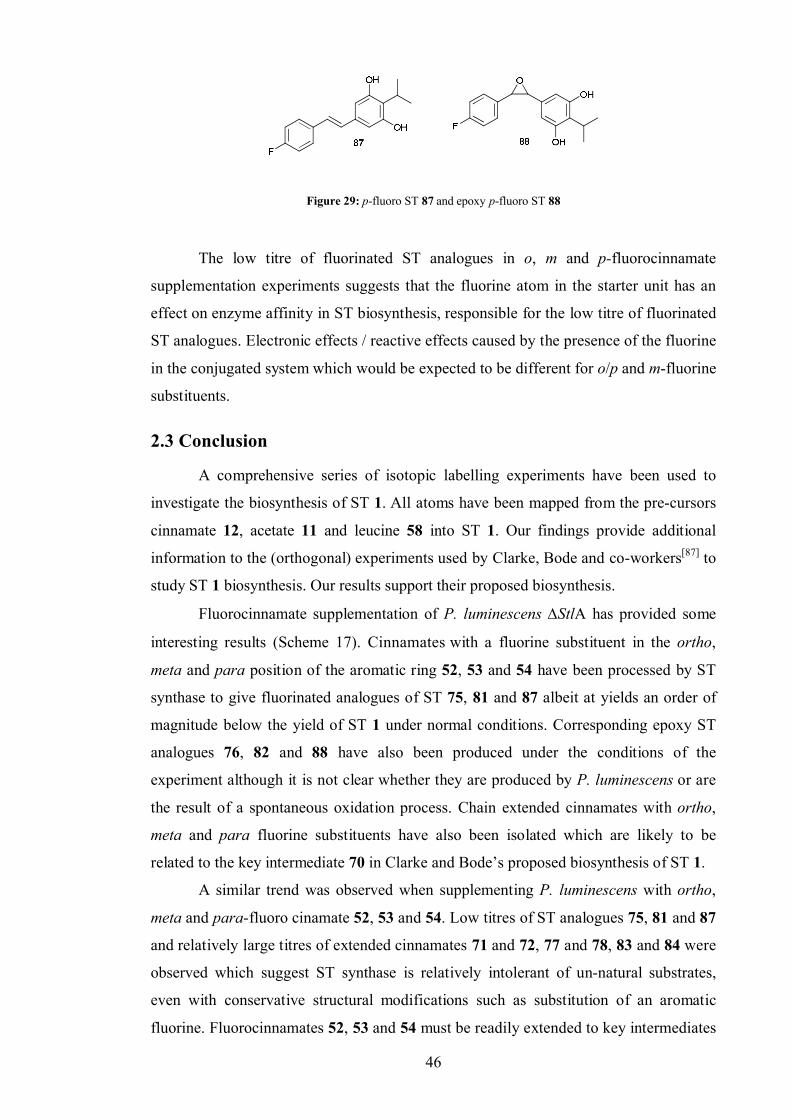
46
Figure 29: p-fluoro ST 87 and epoxy p-fluoro ST 88
The low titre of fluorinated ST analogues in o, m and p-fluorocinnamate
supplementation experiments suggests that the fluorine atom in the starter unit has an
effect on enzyme affinity in ST biosynthesis, responsible for the low titre of fluorinated
ST analogues. Electronic effects / reactive effects caused by the presence of the fluorine
in the conjugated system which would be expected to be different for o/p and m-fluorine
substituents.
2.3 Conclusion
A comprehensive series of isotopic labelling experiments have been used to
investigate the biosynthesis of ST 1. All atoms have been mapped from the pre-cursors
cinnamate 12, acetate 11 and leucine 58 into ST 1. Our findings provide additional
information to the (orthogonal) experiments used by Clarke, Bode and co-workers[87] to
study ST 1 biosynthesis. Our results support their proposed biosynthesis.
Fluorocinnamate supplementation of P. luminescens StlA has provided some
interesting results (Scheme 17). Cinnamates with a fluorine substituent in the ortho,
meta and para position of the aromatic ring 52, 53 and 54 have been processed by ST
synthase to give fluorinated analogues of ST 75, 81 and 87 albeit at yields an order of
magnitude below the yield of ST 1 under normal conditions. Corresponding epoxy ST
analogues 76, 82 and 88 have also been produced under the conditions of the
experiment although it is not clear whether they are produced by P. luminescens or are
the result of a spontaneous oxidation process. Chain extended cinnamates with ortho,
meta and para fluorine substituents have also been isolated which are likely to be
related to the key intermediate 70 in Clarke and Bode’s proposed biosynthesis of ST 1.
A similar trend was observed when supplementing P. luminescens with ortho,
meta and para-fluoro cinamate 52, 53 and 54. Low titres of ST analogues 75, 81 and 87
and relatively large titres of extended cinnamates 71 and 72, 77 and 78, 83 and 84 were
observed which suggest ST synthase is relatively intolerant of un-natural substrates,
even with conservative structural modifications such as substitution of an aromatic
fluorine. Fluorocinnamates 52, 53 and 54 must be readily extended to key intermediates
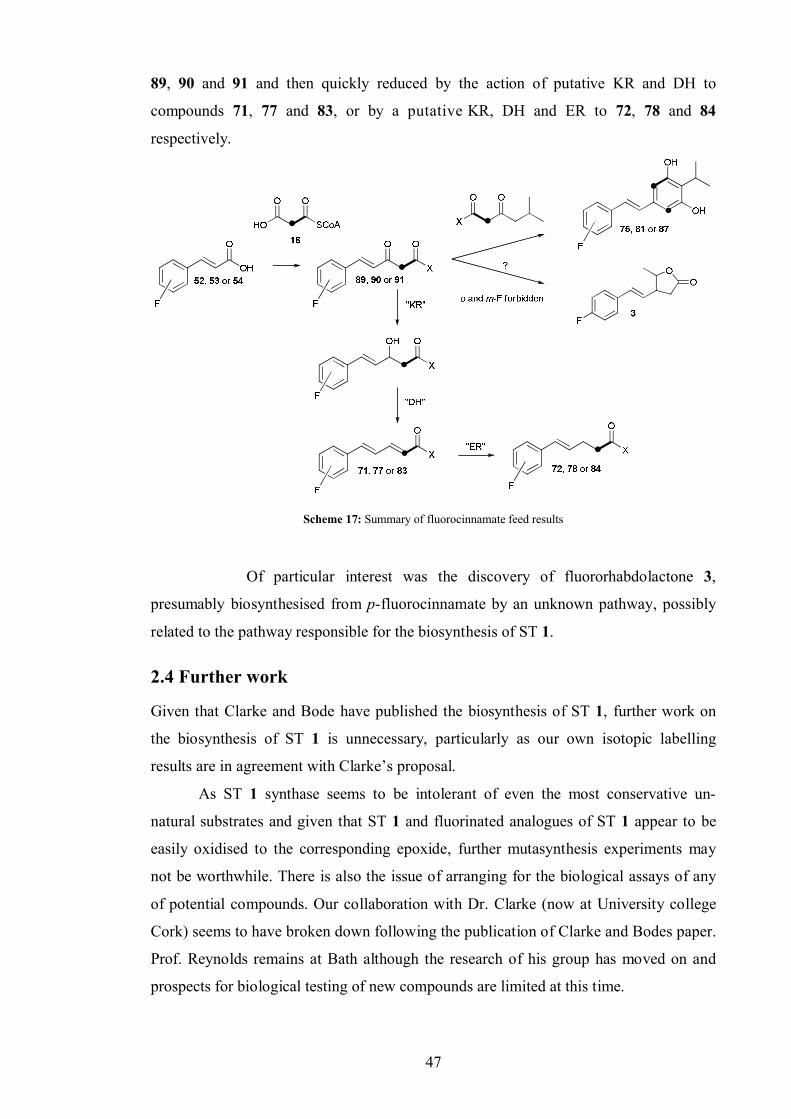
47
89, 90 and 91 and then quickly reduced by the action of putative KR and DH to
compounds 71, 77 and 83, or by a putative KR, DH and ER to 72, 78 and 84
respectively.
Scheme 17: Summary of fluorocinnamate feed results
Of particular interest was the discovery of fluororhabdolactone 3,
presumably biosynthesised from p-fluorocinnamate by an unknown pathway, possibly
related to the pathway responsible for the biosynthesis of ST 1.
2.4 Further work
Given that Clarke and Bode have published the biosynthesis of ST 1, further work on
the biosynthesis of ST 1 is unnecessary, particularly as our own isotopic labelling
results are in agreement with Clarke’s proposal.
As ST 1 synthase seems to be intolerant of even the most conservative un-
natural substrates and given that ST 1 and fluorinated analogues of ST 1 appear to be
easily oxidised to the corresponding epoxide, further mutasynthesis experiments may
not be worthwhile. There is also the issue of arranging for the biological assays of any
of potential compounds. Our collaboration with Dr. Clarke (now at University college
Cork) seems to have broken down following the publication of Clarke and Bodes paper.
Prof. Reynolds remains at Bath although the research of his group has moved on and
prospects for biological testing of new compounds are limited at this time.
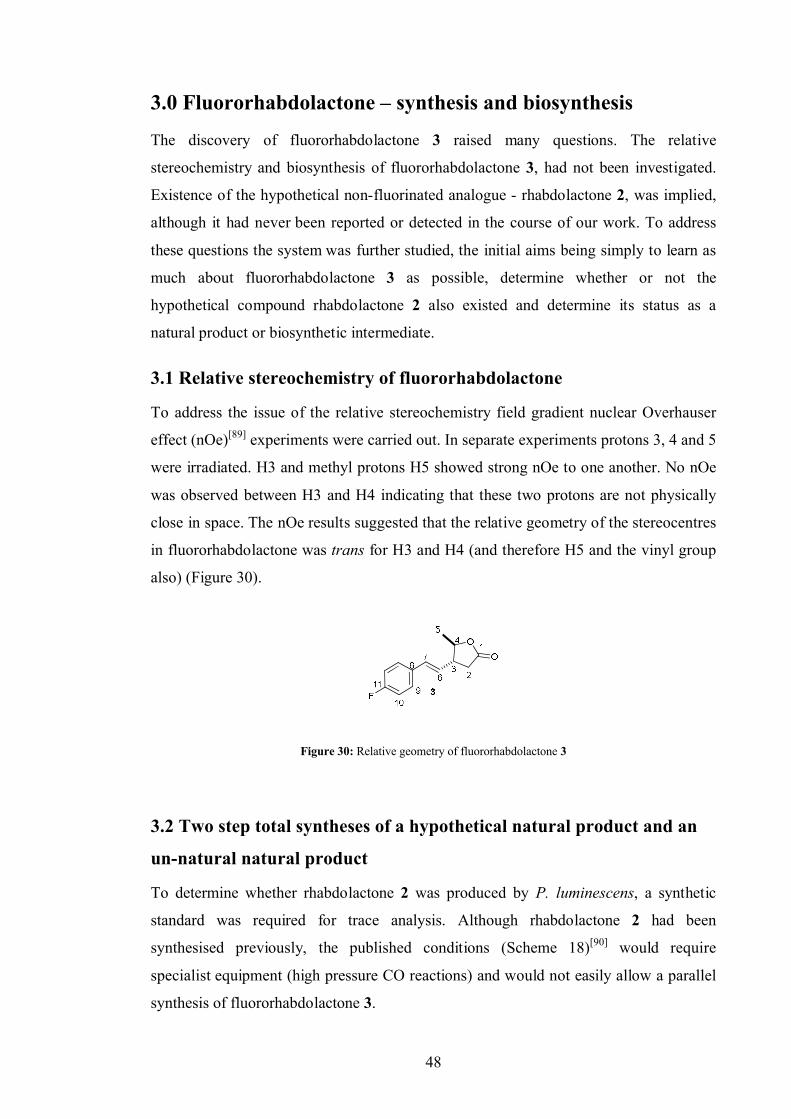
48
3.0 Fluororhabdolactone – synthesis and biosynthesis
The discovery of fluororhabdolactone 3 raised many questions. The relative
stereochemistry and biosynthesis of fluororhabdolactone 3, had not been investigated.
Existence of the hypothetical non-fluorinated analogue - rhabdolactone 2, was implied,
although it had never been reported or detected in the course of our work. To address
these questions the system was further studied, the initial aims being simply to learn as
much about fluororhabdolactone 3 as possible, determine whether or not the
hypothetical compound rhabdolactone 2 also existed and determine its status as a
natural product or biosynthetic intermediate.
3.1 Relative stereochemistry of fluororhabdolactone
To address the issue of the relative stereochemistry field gradient nuclear Overhauser
effect (nOe)[89] experiments were carried out. In separate experiments protons 3, 4 and 5
were irradiated. H3 and methyl protons H5 showed strong nOe to one another. No nOe
was observed between H3 and H4 indicating that these two protons are not physically
close in space. The nOe results suggested that the relative geometry of the stereocentres
in fluororhabdolactone was trans for H3 and H4 (and therefore H5 and the vinyl group
also) (Figure 30).
Figure 30: Relative geometry of fluororhabdolactone 3
3.2 Two step total syntheses of a hypothetical natural product and an
un-natural natural product
To determine whether rhabdolactone 2 was produced by P. luminescens, a synthetic
standard was required for trace analysis. Although rhabdolactone 2 had been
synthesised previously, the published conditions (Scheme 18)[90] would require
specialist equipment (high pressure CO reactions) and would not easily allow a parallel
synthesis of fluororhabdolactone 3.
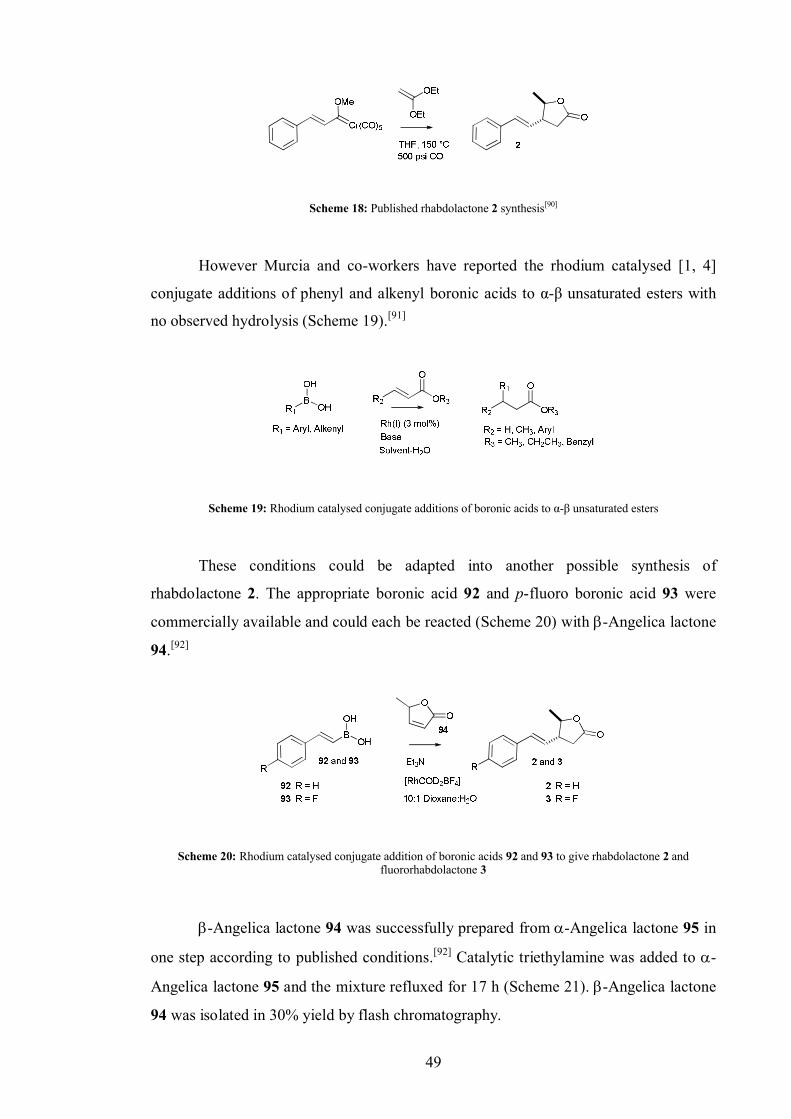
49
Scheme 18: Published rhabdolactone 2 synthesis[90]
However Murcia and co-workers have reported the rhodium catalysed [1, 4]
conjugate additions of phenyl and alkenyl boronic acids to α-β unsaturated esters with
no observed hydrolysis (Scheme 19).[91]
Scheme 19: Rhodium catalysed conjugate additions of boronic acids to α-β unsaturated esters
These conditions could be adapted into another possible synthesis of
rhabdolactone 2. The appropriate boronic acid 92 and p-fluoro boronic acid 93 were
commercially available and could each be reacted (Scheme 20) with -Angelica lactone
94.[92]
Scheme 20: Rhodium catalysed conjugate addition of boronic acids 92 and 93 to give rhabdolactone 2 and fluororhabdolactone 3
-Angelica lactone 94 was successfully prepared from -Angelica lactone 95 in
one step according to published conditions.[92] Catalytic triethylamine was added to -
Angelica lactone 95 and the mixture refluxed for 17 h (Scheme 21).-Angelica lactone
94 was isolated in 30% yield by flash chromatography.
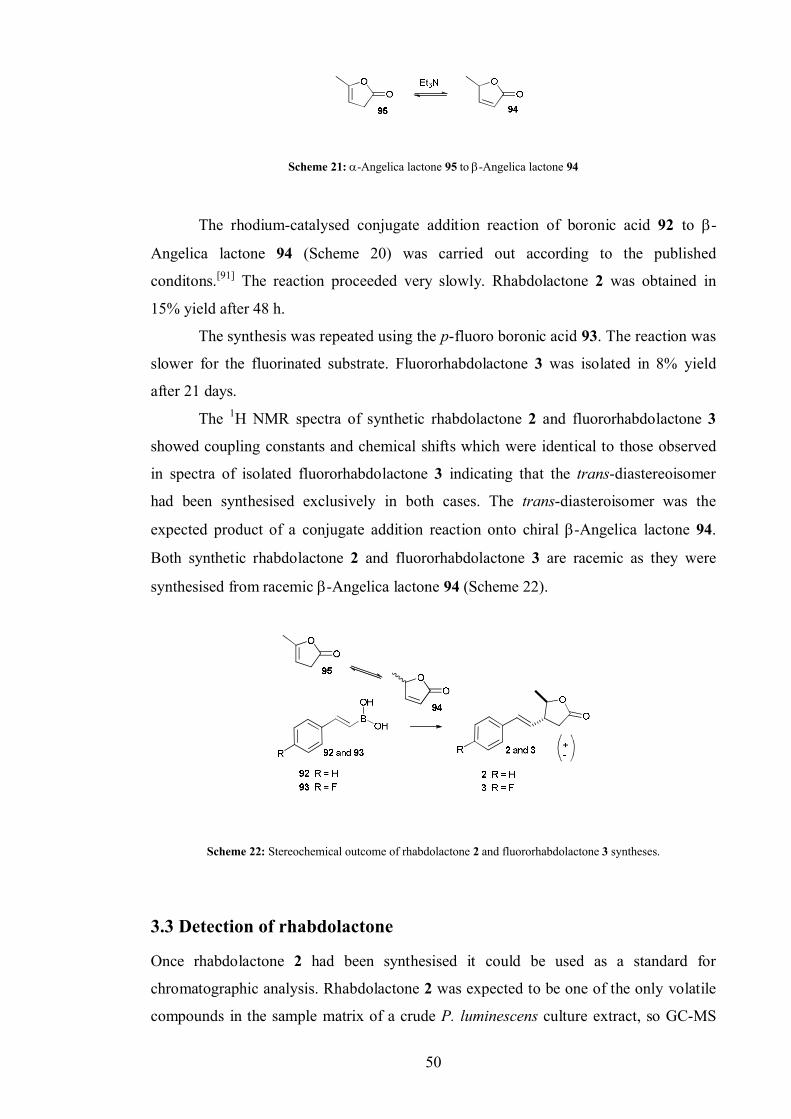
50
Scheme 21: -Angelica lactone 95 to -Angelica lactone 94
The rhodium-catalysed conjugate addition reaction of boronic acid 92 to -
Angelica lactone 94 (Scheme 20) was carried out according to the published
conditons.[91] The reaction proceeded very slowly. Rhabdolactone 2 was obtained in
15% yield after 48 h.
The synthesis was repeated using the p-fluoro boronic acid 93. The reaction was
slower for the fluorinated substrate. Fluororhabdolactone 3 was isolated in 8% yield
after 21 days.
The 1H NMR spectra of synthetic rhabdolactone 2 and fluororhabdolactone 3
showed coupling constants and chemical shifts which were identical to those observed
in spectra of isolated fluororhabdolactone 3 indicating that the trans-diastereoisomer
had been synthesised exclusively in both cases. The trans-diasteroisomer was the
expected product of a conjugate addition reaction onto chiral -Angelica lactone 94.
Both synthetic rhabdolactone 2 and fluororhabdolactone 3 are racemic as they were
synthesised from racemic -Angelica lactone 94 (Scheme 22).
Scheme 22: Stereochemical outcome of rhabdolactone 2 and fluororhabdolactone 3 syntheses.
3.3 Detection of rhabdolactone
Once rhabdolactone 2 had been synthesised it could be used as a standard for
chromatographic analysis. Rhabdolactone 2 was expected to be one of the only volatile
compounds in the sample matrix of a crude P. luminescens culture extract, so GC-MS
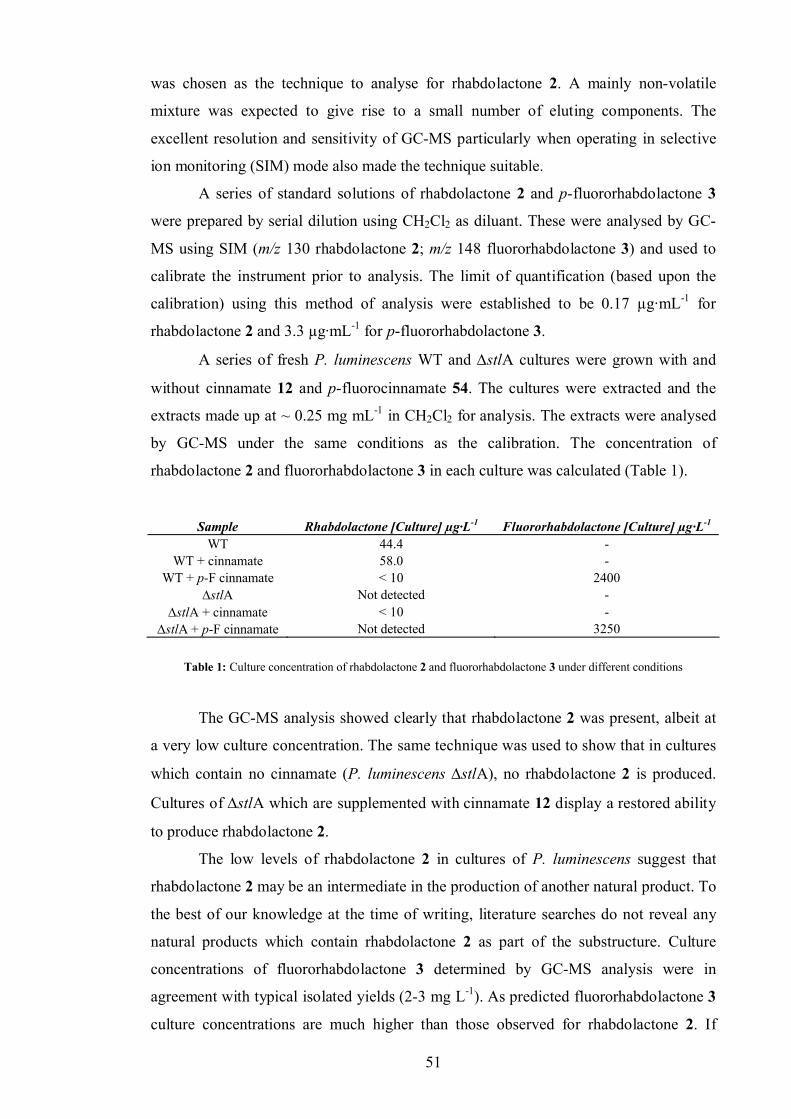
51
was chosen as the technique to analyse for rhabdolactone 2. A mainly non-volatile
mixture was expected to give rise to a small number of eluting components. The
excellent resolution and sensitivity of GC-MS particularly when operating in selective
ion monitoring (SIM) mode also made the technique suitable.
A series of standard solutions of rhabdolactone 2 and p-fluororhabdolactone 3
were prepared by serial dilution using CH2Cl2 as diluant. These were analysed by GC-
MS using SIM (m/z 130 rhabdolactone 2; m/z 148 fluororhabdolactone 3) and used to
calibrate the instrument prior to analysis. The limit of quantification (based upon the
calibration) using this method of analysis were established to be 0.17 µg·mL-1 for
rhabdolactone 2 and 3.3 µg·mL-1 for p-fluororhabdolactone 3.
A series of fresh P. luminescens WT and stlA cultures were grown with and
without cinnamate 12 and p-fluorocinnamate 54. The cultures were extracted and the
extracts made up at ~ 0.25 mg mL-1 in CH2Cl2 for analysis. The extracts were analysed
by GC-MS under the same conditions as the calibration. The concentration of
rhabdolactone 2 and fluororhabdolactone 3 in each culture was calculated (Table 1).
Sample Rhabdolactone [Culture] µg·L-1 Fluororhabdolactone [Culture] µg·L-1
WT 44.4 -WT + cinnamate 58.0 -
WT + p-F cinnamate < 10 2400stlA Not detected -
stlA + cinnamate < 10 -stlA + p-F cinnamate Not detected 3250
Table 1: Culture concentration of rhabdolactone 2 and fluororhabdolactone 3 under different conditions
The GC-MS analysis showed clearly that rhabdolactone 2 was present, albeit at
a very low culture concentration. The same technique was used to show that in cultures
which contain no cinnamate (P. luminescens stlA), no rhabdolactone 2 is produced.
Cultures of stlA which are supplemented with cinnamate 12 display a restored ability
to produce rhabdolactone 2.
The low levels of rhabdolactone 2 in cultures of P. luminescens suggest that
rhabdolactone 2 may be an intermediate in the production of another natural product. To
the best of our knowledge at the time of writing, literature searches do not reveal any
natural products which contain rhabdolactone 2 as part of the substructure. Culture
concentrations of fluororhabdolactone 3 determined by GC-MS analysis were in
agreement with typical isolated yields (2-3 mg L-1). As predicted fluororhabdolactone 3
culture concentrations are much higher than those observed for rhabdolactone 2. If
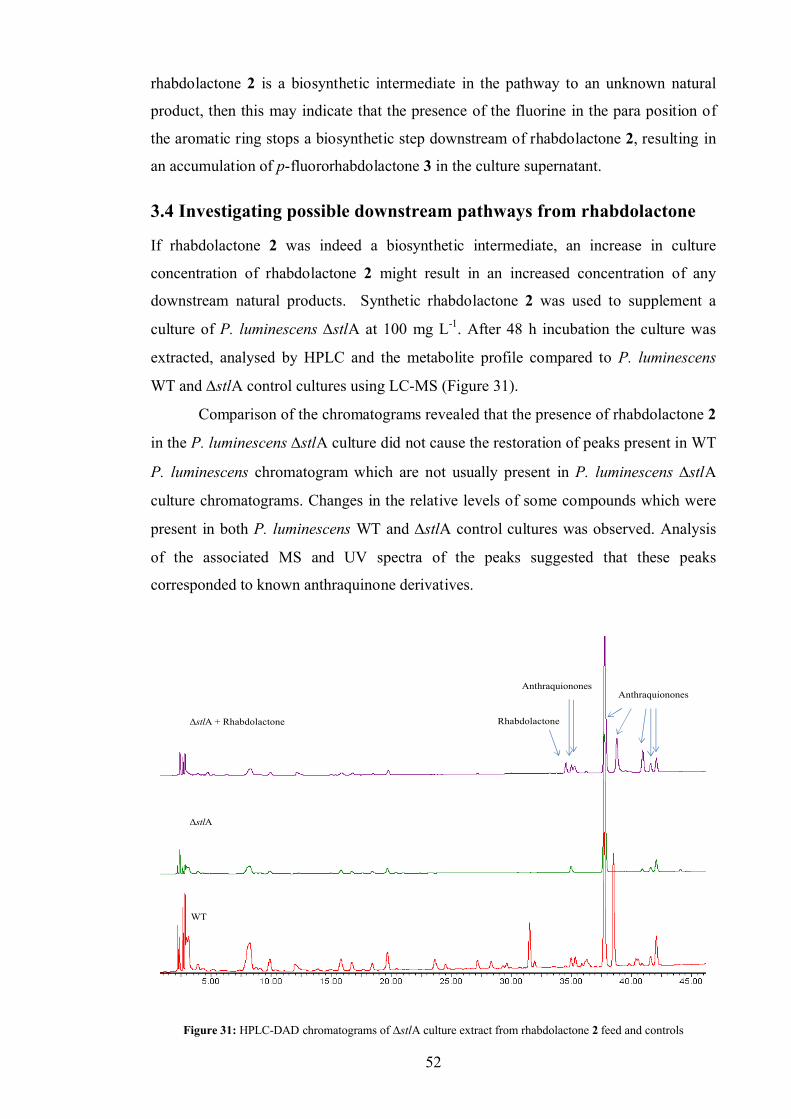
52
rhabdolactone 2 is a biosynthetic intermediate in the pathway to an unknown natural
product, then this may indicate that the presence of the fluorine in the para position of
the aromatic ring stops a biosynthetic step downstream of rhabdolactone 2, resulting in
an accumulation of p-fluororhabdolactone 3 in the culture supernatant.
3.4 Investigating possible downstream pathways from rhabdolactone
If rhabdolactone 2 was indeed a biosynthetic intermediate, an increase in culture
concentration of rhabdolactone 2 might result in an increased concentration of any
downstream natural products. Synthetic rhabdolactone 2 was used to supplement a
culture of P. luminescens stlA at 100 mg L-1. After 48 h incubation the culture was
extracted, analysed by HPLC and the metabolite profile compared to P. luminescens
WT and stlA control cultures using LC-MS (Figure 31).
Comparison of the chromatograms revealed that the presence of rhabdolactone 2
in the P. luminescens stlA culture did not cause the restoration of peaks present in WT
P. luminescens chromatogram which are not usually present in P. luminescens stlA
culture chromatograms. Changes in the relative levels of some compounds which were
present in both P. luminescens WT and stlA control cultures was observed. Analysis
of the associated MS and UV spectra of the peaks suggested that these peaks
corresponded to known anthraquinone derivatives.
ΔstlA + Rhabdolactone
ΔstlA
WT
Rhabdolactone
AnthraquiononesAnthraquionones
Figure 31: HPLC-DAD chromatograms of stlA culture extract from rhabdolactone 2 feed and controls
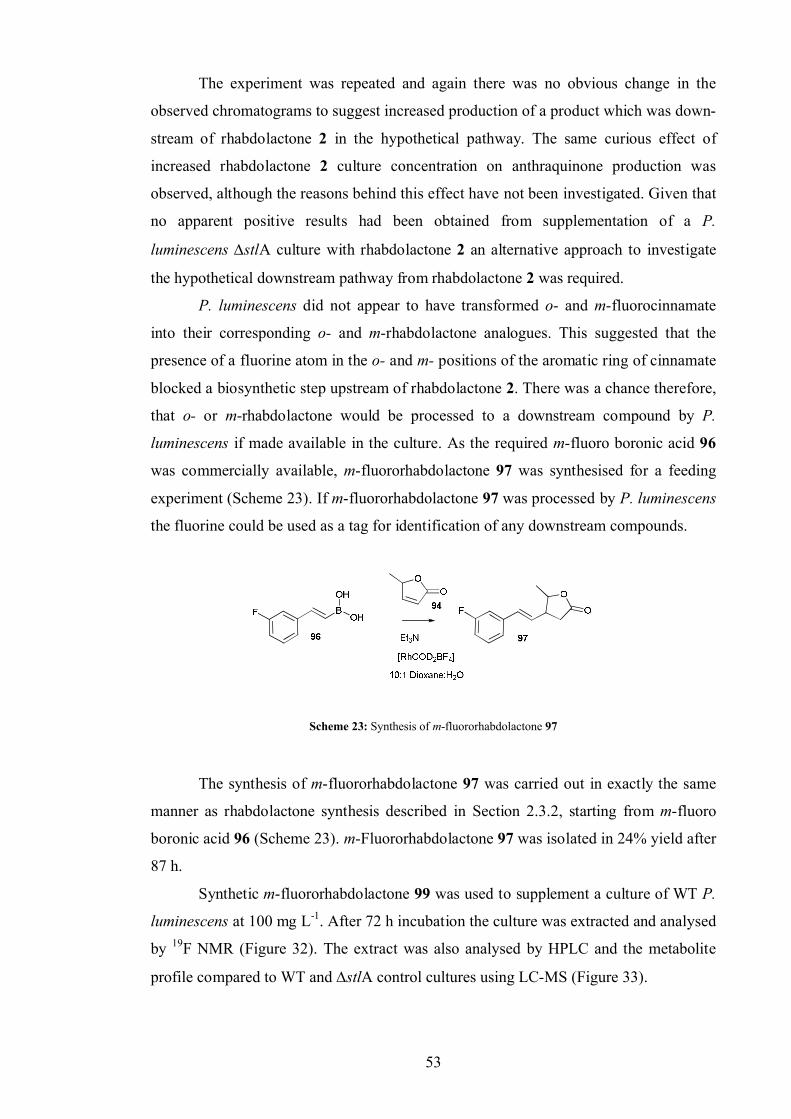
53
The experiment was repeated and again there was no obvious change in the
observed chromatograms to suggest increased production of a product which was down-
stream of rhabdolactone 2 in the hypothetical pathway. The same curious effect of
increased rhabdolactone 2 culture concentration on anthraquinone production was
observed, although the reasons behind this effect have not been investigated. Given that
no apparent positive results had been obtained from supplementation of a P.
luminescens stlA culture with rhabdolactone 2 an alternative approach to investigate
the hypothetical downstream pathway from rhabdolactone 2 was required.
P. luminescens did not appear to have transformed o- and m-fluorocinnamate
into their corresponding o- and m-rhabdolactone analogues. This suggested that the
presence of a fluorine atom in the o- and m- positions of the aromatic ring of cinnamate
blocked a biosynthetic step upstream of rhabdolactone 2. There was a chance therefore,
that o- or m-rhabdolactone would be processed to a downstream compound by P.
luminescens if made available in the culture. As the required m-fluoro boronic acid 96
was commercially available, m-fluororhabdolactone 97 was synthesised for a feeding
experiment (Scheme 23). If m-fluororhabdolactone 97 was processed by P. luminescens
the fluorine could be used as a tag for identification of any downstream compounds.
Scheme 23: Synthesis of m-fluororhabdolactone 97
The synthesis of m-fluororhabdolactone 97 was carried out in exactly the same
manner as rhabdolactone synthesis described in Section 2.3.2, starting from m-fluoro
boronic acid 96 (Scheme 23). m-Fluororhabdolactone 97 was isolated in 24% yield after
87 h.
Synthetic m-fluororhabdolactone 99 was used to supplement a culture of WT P.
luminescens at 100 mg L-1. After 72 h incubation the culture was extracted and analysed
by 19F NMR (Figure 32). The extract was also analysed by HPLC and the metabolite
profile compared to WT and stlA control cultures using LC-MS (Figure 33).
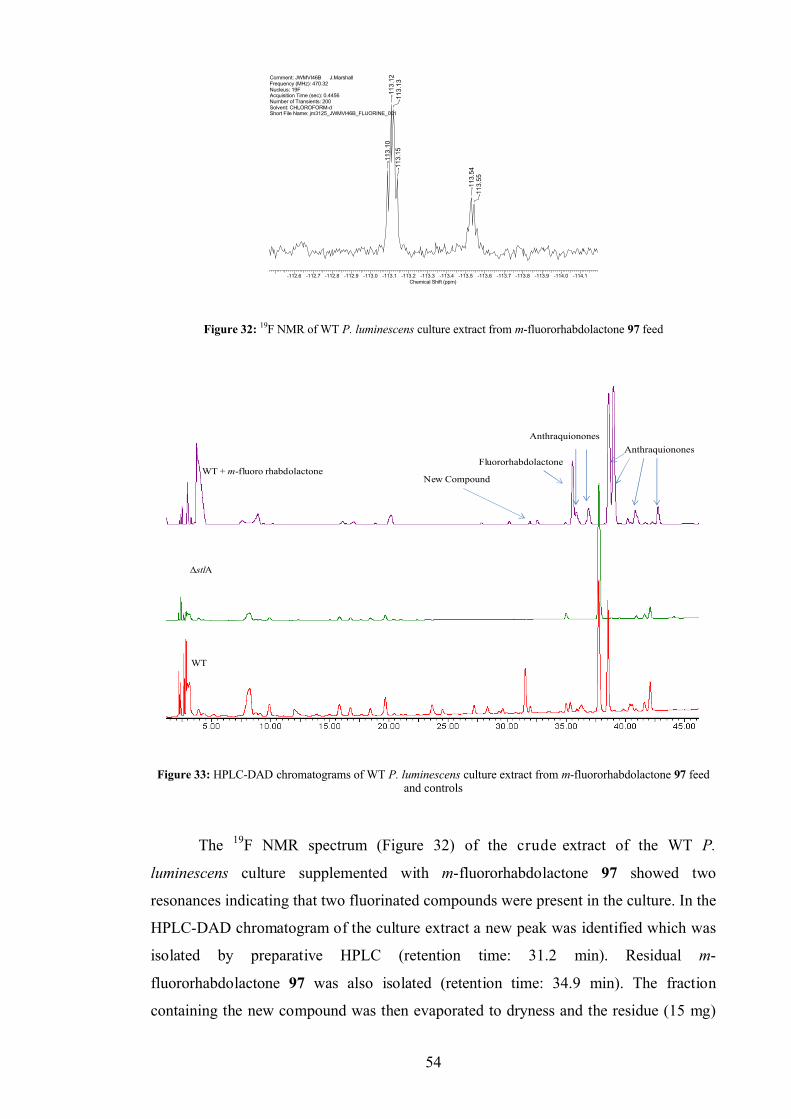
54
Comment: JWMVI46B J.MarshallFrequency (MHz): 470.32Nucleus: 19FAcquisition Time (sec): 0.4456Number of Transients: 200Solvent: CHLOROFORM-dShort File Name: jm3125_JWMVI46B_FLUORINE_001
-112.6 -112.7 -112.8 -112.9 -113.0 -113.1 -113.2 -113.3 -113.4 -113.5 -113.6 -113.7 -113.8 -113.9 -114.0 -114.1Chemical Shift (ppm)
-113
.55
-113
.54-1
13.1
5-1
13.1
3-1
13.1
2-1
13.1
0
Figure 32: 19F NMR of WT P. luminescens culture extract from m-fluororhabdolactone 97 feed
WT + m-fluoro rhabdolactone
ΔstlA
WT
FluororhabdolactoneAnthraquionones
Anthraquionones
New Compound
Figure 33: HPLC-DAD chromatograms of WT P. luminescens culture extract from m-fluororhabdolactone 97 feed and controls
The 19F NMR spectrum (Figure 32) of the crude extract of the WT P.
luminescens culture supplemented with m-fluororhabdolactone 97 showed two
resonances indicating that two fluorinated compounds were present in the culture. In the
HPLC-DAD chromatogram of the culture extract a new peak was identified which was
isolated by preparative HPLC (retention time: 31.2 min). Residual m-
fluororhabdolactone 97 was also isolated (retention time: 34.9 min). The fraction
containing the new compound was then evaporated to dryness and the residue (15 mg)
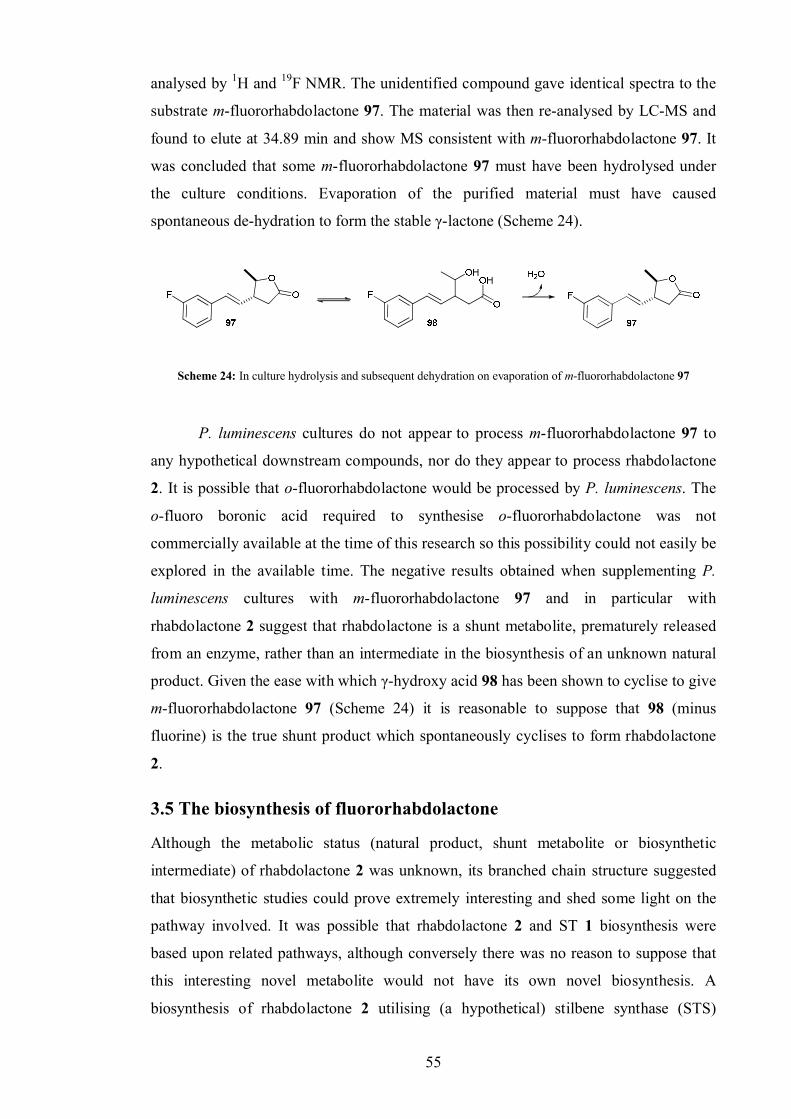
55
analysed by 1H and 19F NMR. The unidentified compound gave identical spectra to the
substrate m-fluororhabdolactone 97. The material was then re-analysed by LC-MS and
found to elute at 34.89 min and show MS consistent with m-fluororhabdolactone 97. It
was concluded that some m-fluororhabdolactone 97 must have been hydrolysed under
the culture conditions. Evaporation of the purified material must have caused
spontaneous de-hydration to form the stable γ-lactone (Scheme 24).
Scheme 24: In culture hydrolysis and subsequent dehydration on evaporation of m-fluororhabdolactone 97
P. luminescens cultures do not appear to process m-fluororhabdolactone 97 to
any hypothetical downstream compounds, nor do they appear to process rhabdolactone
2. It is possible that o-fluororhabdolactone would be processed by P. luminescens. The
o-fluoro boronic acid required to synthesise o-fluororhabdolactone was not
commercially available at the time of this research so this possibility could not easily be
explored in the available time. The negative results obtained when supplementing P.
luminescens cultures with m-fluororhabdolactone 97 and in particular with
rhabdolactone 2 suggest that rhabdolactone is a shunt metabolite, prematurely released
from an enzyme, rather than an intermediate in the biosynthesis of an unknown natural
product. Given the ease with which γ-hydroxy acid 98 has been shown to cyclise to give
m-fluororhabdolactone 97 (Scheme 24) it is reasonable to suppose that 98 (minus
fluorine) is the true shunt product which spontaneously cyclises to form rhabdolactone
2.
3.5 The biosynthesis of fluororhabdolactone
Although the metabolic status (natural product, shunt metabolite or biosynthetic
intermediate) of rhabdolactone 2 was unknown, its branched chain structure suggested
that biosynthetic studies could prove extremely interesting and shed some light on the
pathway involved. It was possible that rhabdolactone 2 and ST 1 biosynthesis were
based upon related pathways, although conversely there was no reason to suppose that
this interesting novel metabolite would not have its own novel biosynthesis. A
biosynthesis of rhabdolactone 2 utilising (a hypothetical) stilbene synthase (STS)
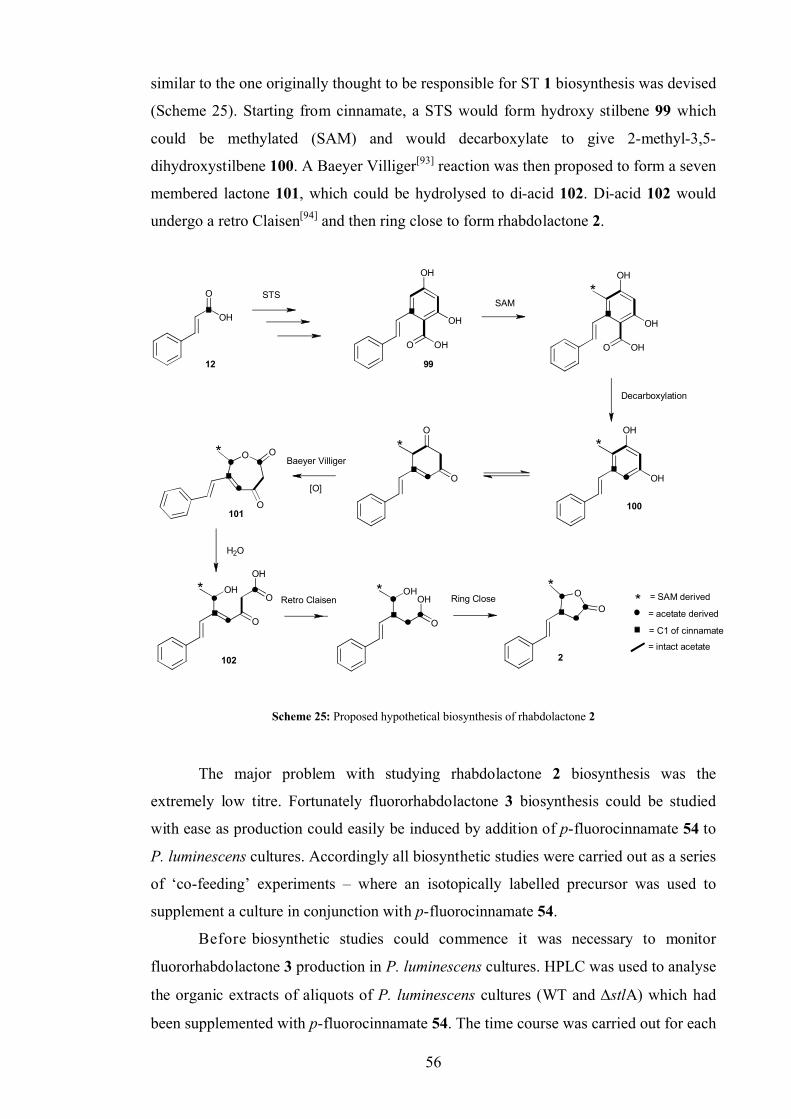
56
similar to the one originally thought to be responsible for ST 1 biosynthesis was devised
(Scheme 25). Starting from cinnamate, a STS would form hydroxy stilbene 99 which
could be methylated (SAM) and would decarboxylate to give 2-methyl-3,5-
dihydroxystilbene 100. A Baeyer Villiger[93] reaction was then proposed to form a seven
membered lactone 101, which could be hydrolysed to di-acid 102. Di-acid 102 would
undergo a retro Claisen[94] and then ring close to form rhabdolactone 2.
O
OH OH
OH
O OH
OH
OH
O OH
OH
OH
O
O
O O
O
OHO
O
OH
OHOH
O
O
O
2
STSSAM
Decarboxylation
Baeyer Villiger
Retro Claisen Ring Close
[O]
H2O
12 99
100101
102
*
***
* * ** = SAM derived
= acetate derived
= C1 of cinnamate
= intact acetate
Scheme 25: Proposed hypothetical biosynthesis of rhabdolactone 2
The major problem with studying rhabdolactone 2 biosynthesis was the
extremely low titre. Fortunately fluororhabdolactone 3 biosynthesis could be studied
with ease as production could easily be induced by addition of p-fluorocinnamate 54 to
P. luminescens cultures. Accordingly all biosynthetic studies were carried out as a series
of ‘co-feeding’ experiments – where an isotopically labelled precursor was used to
supplement a culture in conjunction with p-fluorocinnamate 54.
Before biosynthetic studies could commence it was necessary to monitor
fluororhabdolactone 3 production in P. luminescens cultures. HPLC was used to analyse
the organic extracts of aliquots of P. luminescens cultures (WT and stlA) which had
been supplemented with p-fluorocinnamate 54. The time course was carried out for each
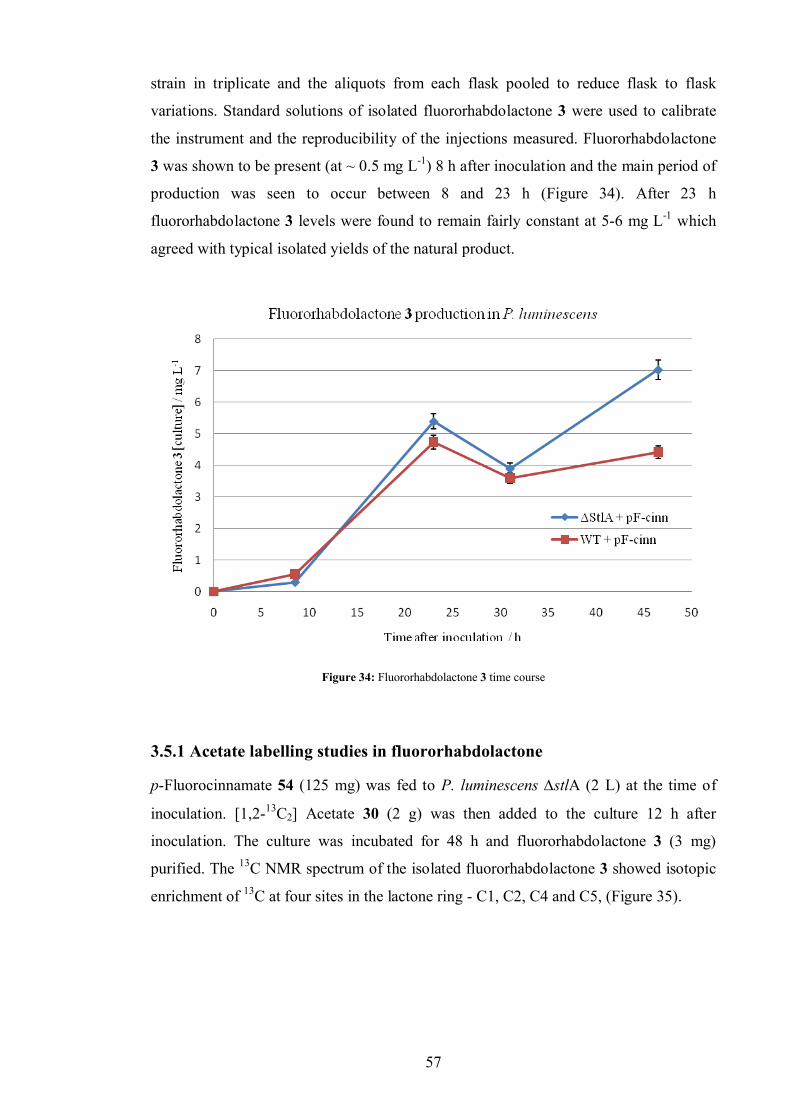
57
strain in triplicate and the aliquots from each flask pooled to reduce flask to flask
variations. Standard solutions of isolated fluororhabdolactone 3 were used to calibrate
the instrument and the reproducibility of the injections measured. Fluororhabdolactone
3 was shown to be present (at ~ 0.5 mg L-1) 8 h after inoculation and the main period of
production was seen to occur between 8 and 23 h (Figure 34). After 23 h
fluororhabdolactone 3 levels were found to remain fairly constant at 5-6 mg L-1 which
agreed with typical isolated yields of the natural product.
Figure 34: Fluororhabdolactone 3 time course
3.5.1 Acetate labelling studies in fluororhabdolactone
p-Fluorocinnamate 54 (125 mg) was fed to P. luminescens stlA (2 L) at the time of
inoculation. [1,2-13C2] Acetate 30 (2 g) was then added to the culture 12 h after
inoculation. The culture was incubated for 48 h and fluororhabdolactone 3 (3 mg)
purified. The 13C NMR spectrum of the isolated fluororhabdolactone 3 showed isotopic
enrichment of 13C at four sites in the lactone ring - C1, C2, C4 and C5, (Figure 35).
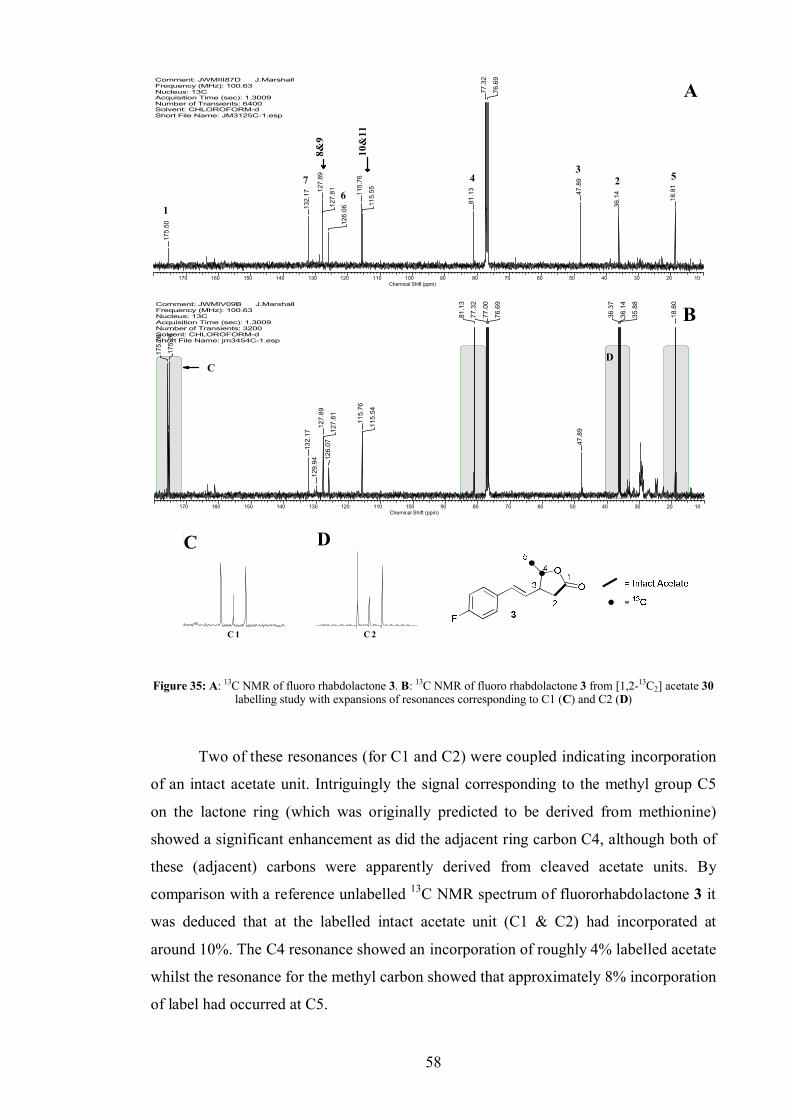
58
Comment: JWMIII87D J.MarshallFrequency (MHz): 100.63Nucleus: 13CAcquisition Time (sec): 1.3009Number of Transients: 6400Solvent: CHLOROFORM-dShort File Name: JM3125C-1.esp
170 160 150 140 130 120 110 100 90 80 70 60 50 40 30 20 10Chemical Shift (ppm)
175.
50
132.
17 127.
89
127.
81
126.
06
115.
76
115.
55
81.1
3
77.3
2
76.6
9
47.8
9
36.1
4
18.8
1
A
523
4
1
76
10&
11
8&9
Comment: JWMIV09B J.MarshallFrequency (MHz): 100.63Nucleus: 13CAcquisition Time (sec): 1.3009Number of Transients: 3200Solvent: CHLOROFORM-dShort File Name: jm3454C-1.esp
170 160 150 140 130 120 110 100 90 80 70 60 50 40 30 20 10Chemical Shift (ppm)
175.
76
175.
26
132.
1712
9.94
127.
89
127.
8112
6.07
115.
76
115.
54
81.1
3
77.3
2
77.0
0
76.6
9
47.8
9
36.3
7
36.1
4
35.8
8
18.8
0
B
CD
Comment: JWMIV09B J.MarshallFrequency (MHz): 100.63Nucleus: 13CAcquisition Time (sec): 1.3009Number of Transients: 3200Solvent: CHLOROFORM-d
C 1
C
Comment: JWMIV09B J.MarshallFrequency (MHz): 100.63Nucleus: 13CAcquisition Time (sec): 1.3009Number of Transients: 3200Solvent: CHLOROFORM-d
C 2
D
Figure 35: A: 13C NMR of fluoro rhabdolactone 3. B: 13C NMR of fluoro rhabdolactone 3 from [1,2-13C2] acetate 30labelling study with expansions of resonances corresponding to C1 (C) and C2 (D)
Two of these resonances (for C1 and C2) were coupled indicating incorporation
of an intact acetate unit. Intriguingly the signal corresponding to the methyl group C5
on the lactone ring (which was originally predicted to be derived from methionine)
showed a significant enhancement as did the adjacent ring carbon C4, although both of
these (adjacent) carbons were apparently derived from cleaved acetate units. By
comparison with a reference unlabelled 13C NMR spectrum of fluororhabdolactone 3 it
was deduced that at the labelled intact acetate unit (C1 & C2) had incorporated at
around 10%. The C4 resonance showed an incorporation of roughly 4% labelled acetate
whilst the resonance for the methyl carbon showed that approximately 8% incorporation
of label had occurred at C5.
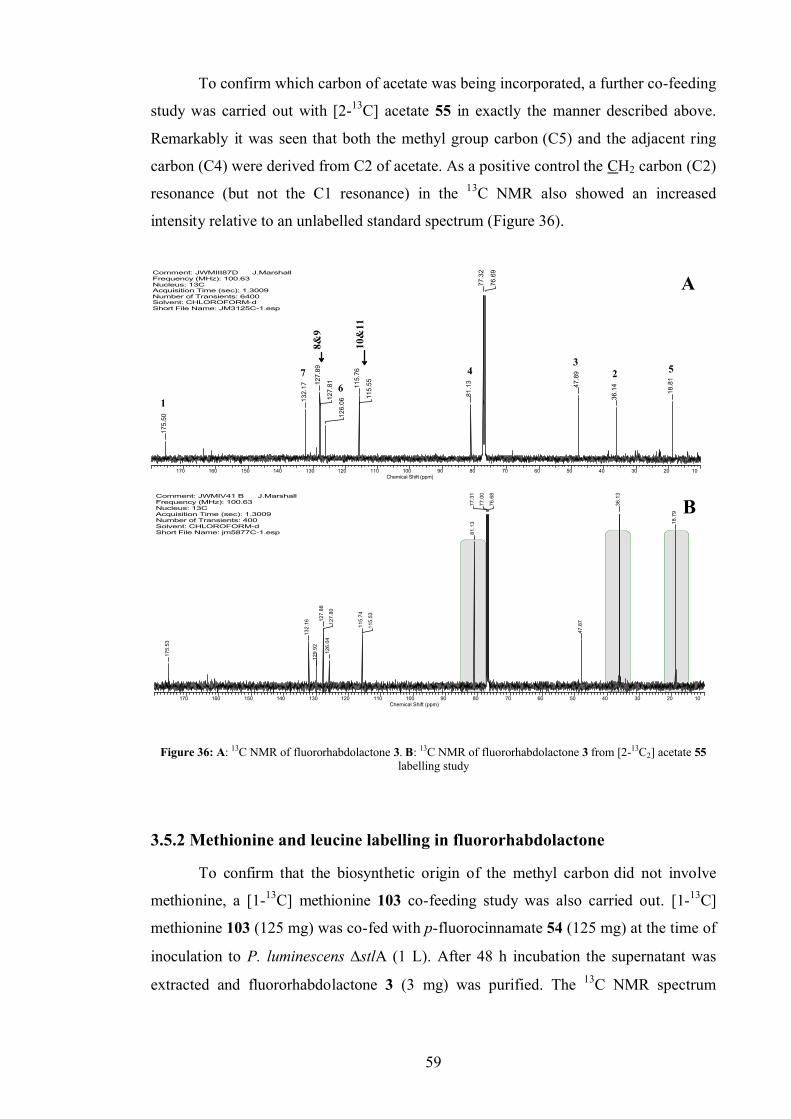
59
To confirm which carbon of acetate was being incorporated, a further co-feeding
study was carried out with [2-13C] acetate 55 in exactly the manner described above.
Remarkably it was seen that both the methyl group carbon (C5) and the adjacent ring
carbon (C4) were derived from C2 of acetate. As a positive control the CH2 carbon (C2)
resonance (but not the C1 resonance) in the 13C NMR also showed an increased
intensity relative to an unlabelled standard spectrum (Figure 36).
Comment: JWMIII87D J.MarshallFrequency (MHz): 100.63Nucleus: 13CAcquisition Time (sec): 1.3009Number of Transients: 6400Solvent: CHLOROFORM-dShort File Name: JM3125C-1.esp
170 160 150 140 130 120 110 100 90 80 70 60 50 40 30 20 10Chemical Shift (ppm)
175.
50
132.
17 127.
89
127.
81
126.
06
115.
76
115.
55
81.1
3
77.3
2
76.6
9
47.8
9
36.1
4
18.8
1
A
523
4
1
76
10&
11
8&9
Comment: JWMIV41 B J.MarshallFrequency (MHz): 100.63Nucleus: 13CAcquisition Time (sec): 1.3009Number of Transients: 400Solvent: CHLOROFORM-dShort File Name: jm5877C-1.esp
170 160 150 140 130 120 110 100 90 80 70 60 50 40 30 20 10Chemical Shift (ppm)
18.7
9
36.1
3
47.8
7
76.6
8
77.0
0
77.3
181
.13
115.
53
115.
74
126.
0412
7.80
127.
8812
9.92
132.
16
175.
53
B
Figure 36: A: 13C NMR of fluororhabdolactone 3. B: 13C NMR of fluororhabdolactone 3 from [2-13C2] acetate 55labelling study
3.5.2 Methionine and leucine labelling in fluororhabdolactone
To confirm that the biosynthetic origin of the methyl carbon did not involve
methionine, a [1-13C] methionine 103 co-feeding study was also carried out. [1-13C]
methionine 103 (125 mg) was co-fed with p-fluorocinnamate 54 (125 mg) at the time of
inoculation to P. luminescens stlA (1 L). After 48 h incubation the supernatant was
extracted and fluororhabdolactone 3 (3 mg) was purified. The 13C NMR spectrum
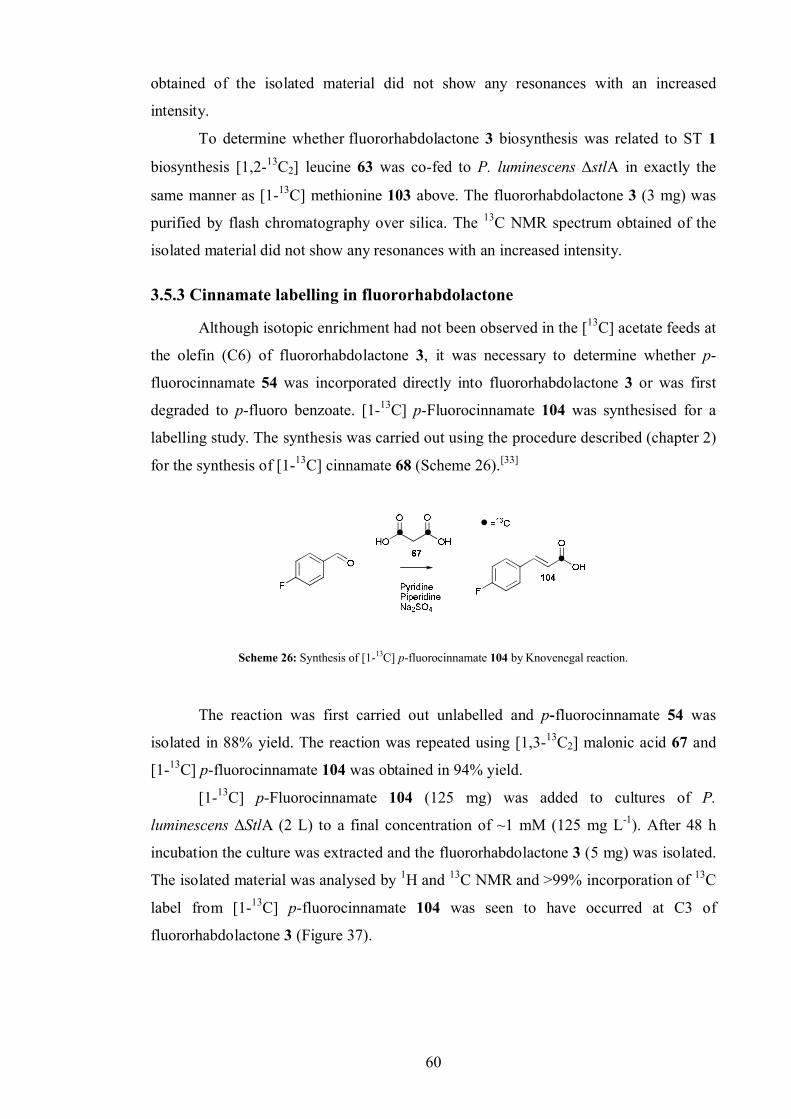
60
obtained of the isolated material did not show any resonances with an increased
intensity.
To determine whether fluororhabdolactone 3 biosynthesis was related to ST 1
biosynthesis [1,2-13C2] leucine 63 was co-fed to P. luminescens stlA in exactly the
same manner as [1-13C] methionine 103 above. The fluororhabdolactone 3 (3 mg) was
purified by flash chromatography over silica. The 13C NMR spectrum obtained of the
isolated material did not show any resonances with an increased intensity.
3.5.3 Cinnamate labelling in fluororhabdolactone
Although isotopic enrichment had not been observed in the [13C] acetate feeds at
the olefin (C6) of fluororhabdolactone 3, it was necessary to determine whether p-
fluorocinnamate 54 was incorporated directly into fluororhabdolactone 3 or was first
degraded to p-fluoro benzoate. [1-13C] p-Fluorocinnamate 104 was synthesised for a
labelling study. The synthesis was carried out using the procedure described (chapter 2)
for the synthesis of [1-13C] cinnamate 68 (Scheme 26).[33]
Scheme 26: Synthesis of [1-13C] p-fluorocinnamate 104 by Knovenegal reaction.
The reaction was first carried out unlabelled and p-fluorocinnamate 54 was
isolated in 88% yield. The reaction was repeated using [1,3-13C2] malonic acid 67 and
[1-13C] p-fluorocinnamate 104 was obtained in 94% yield.
[1-13C] p-Fluorocinnamate 104 (125 mg) was added to cultures of P.
luminescens ΔStlA (2 L) to a final concentration of ~1 mM (125 mg L-1). After 48 h
incubation the culture was extracted and the fluororhabdolactone 3 (5 mg) was isolated.
The isolated material was analysed by 1H and 13C NMR and >99% incorporation of 13C
label from [1-13C] p-fluorocinnamate 104 was seen to have occurred at C3 of
fluororhabdolactone 3 (Figure 37).
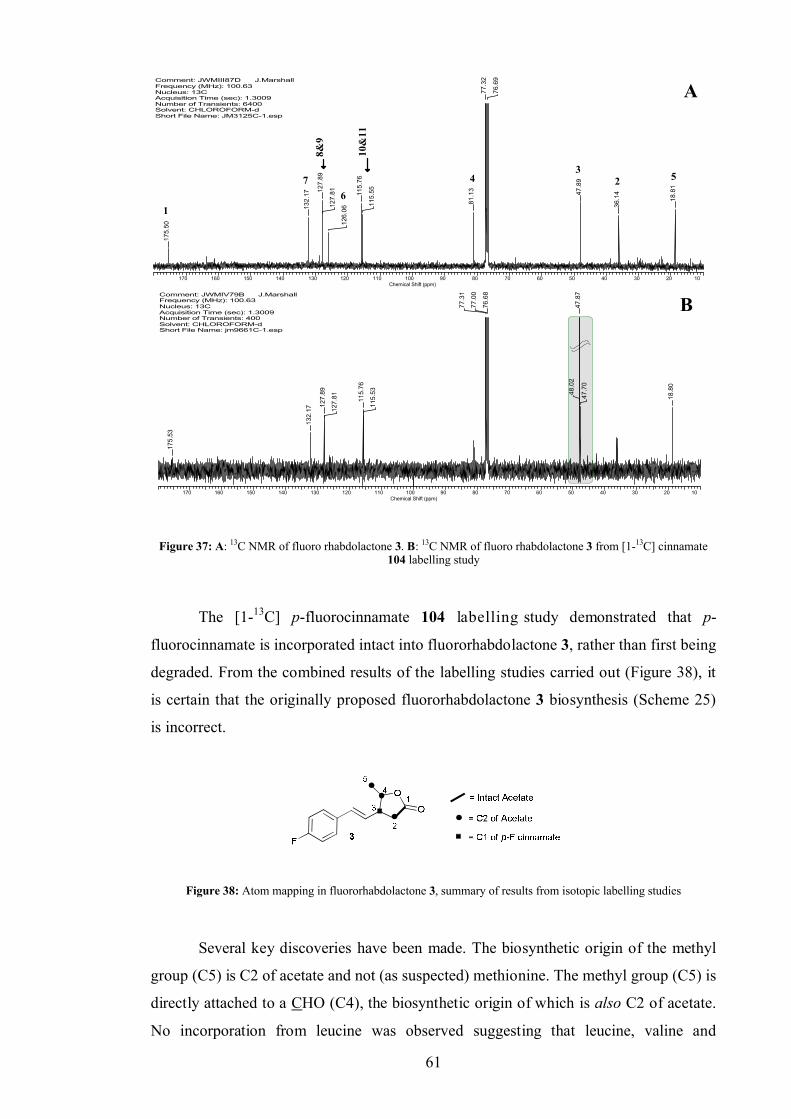
61
Comment: JWMIII87D J.MarshallFrequency (MHz): 100.63Nucleus: 13CAcquisition Time (sec): 1.3009Number of Transients: 6400Solvent: CHLOROFORM-dShort File Name: JM3125C-1.esp
170 160 150 140 130 120 110 100 90 80 70 60 50 40 30 20 10Chemical Shift (ppm)
175.
50
132.
17 127.
89
127.
81
126.
06
115.
76
115.
55
81.1
3
77.3
2
76.6
9
47.8
9
36.1
4
18.8
1
A
523
4
1
76
10&
11
8&9
Comment: JWMIV79B J.MarshallFrequency (MHz): 100.63Nucleus: 13CAcquisition Time (sec): 1.3009Number of Transients: 400Solvent: CHLOROFORM-dShort File Name: jm9661C-1.esp
170 160 150 140 130 120 110 100 90 80 70 60 50 40 30 20 10Chemical Shift (ppm)
175.
53
132.
17
127.
89
127.
81 115.
76
115.
53
77.3
1
77.0
0
76.6
8
48.0
247
.87
47.7
0
18.8
0
B
Figure 37: A: 13C NMR of fluoro rhabdolactone 3. B: 13C NMR of fluoro rhabdolactone 3 from [1-13C] cinnamate 104 labelling study
The [1-13C] p-fluorocinnamate 104 labelling study demonstrated that p-
fluorocinnamate is incorporated intact into fluororhabdolactone 3, rather than first being
degraded. From the combined results of the labelling studies carried out (Figure 38), it
is certain that the originally proposed fluororhabdolactone 3 biosynthesis (Scheme 25)
is incorrect.
Figure 38: Atom mapping in fluororhabdolactone 3, summary of results from isotopic labelling studies
Several key discoveries have been made. The biosynthetic origin of the methyl
group (C5) is C2 of acetate and not (as suspected) methionine. The methyl group (C5) is
directly attached to a CHO (C4), the biosynthetic origin of which is also C2 of acetate.
No incorporation from leucine was observed suggesting that leucine, valine and
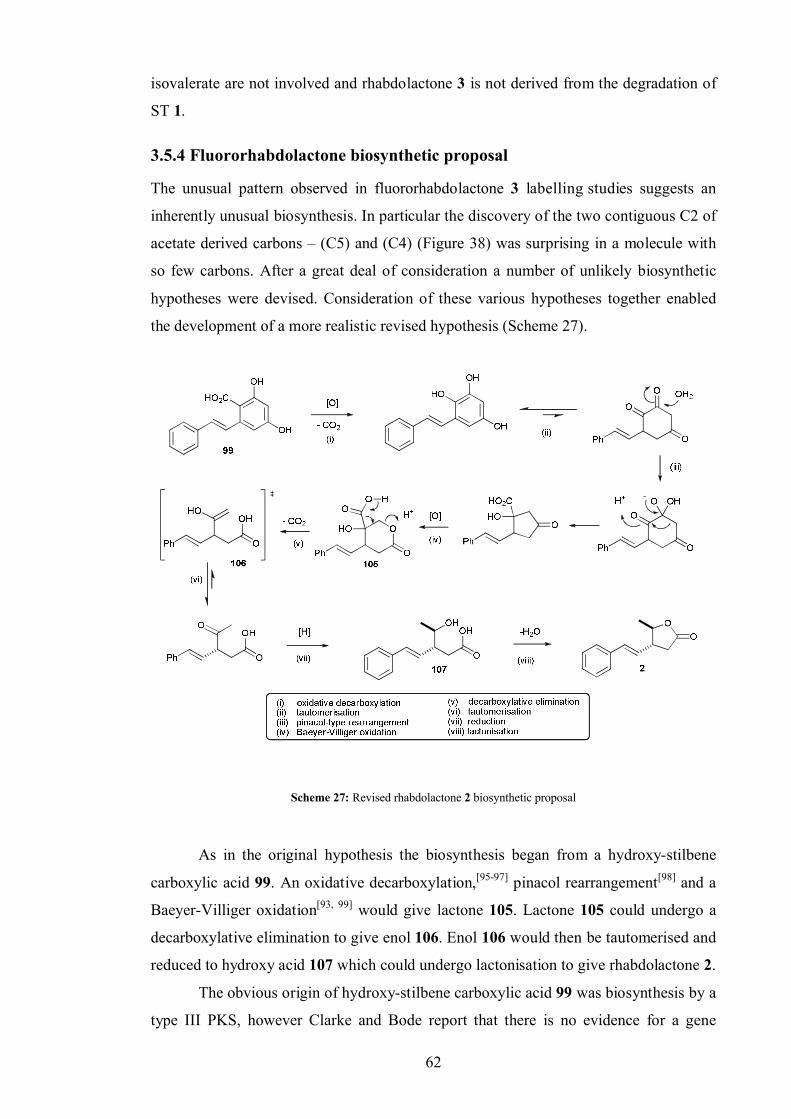
62
isovalerate are not involved and rhabdolactone 3 is not derived from the degradation of
ST 1.
3.5.4 Fluororhabdolactone biosynthetic proposal
The unusual pattern observed in fluororhabdolactone 3 labelling studies suggests an
inherently unusual biosynthesis. In particular the discovery of the two contiguous C2 of
acetate derived carbons – (C5) and (C4) (Figure 38) was surprising in a molecule with
so few carbons. After a great deal of consideration a number of unlikely biosynthetic
hypotheses were devised. Consideration of these various hypotheses together enabled
the development of a more realistic revised hypothesis (Scheme 27).
Scheme 27: Revised rhabdolactone 2 biosynthetic proposal
As in the original hypothesis the biosynthesis began from a hydroxy-stilbene
carboxylic acid 99. An oxidative decarboxylation,[95-97] pinacol rearrangement[98] and a
Baeyer-Villiger oxidation[93, 99] would give lactone 105. Lactone 105 could undergo a
decarboxylative elimination to give enol 106. Enol 106 would then be tautomerised and
reduced to hydroxy acid 107 which could undergo lactonisation to give rhabdolactone 2.
The obvious origin of hydroxy-stilbene carboxylic acid 99 was biosynthesis by a
type III PKS, however Clarke and Bode report that there is no evidence for a gene
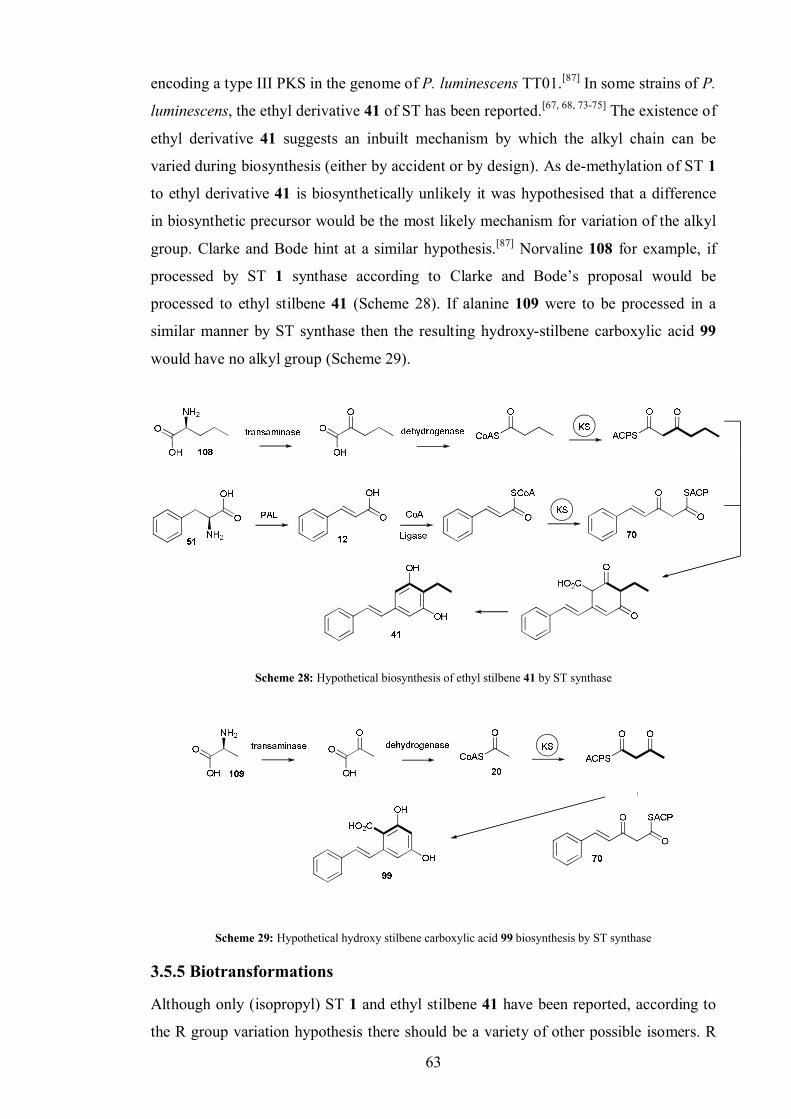
63
encoding a type III PKS in the genome of P. luminescens TT01.[87] In some strains of P.
luminescens, the ethyl derivative 41 of ST has been reported.[67, 68, 73-75] The existence of
ethyl derivative 41 suggests an inbuilt mechanism by which the alkyl chain can be
varied during biosynthesis (either by accident or by design). As de-methylation of ST 1
to ethyl derivative 41 is biosynthetically unlikely it was hypothesised that a difference
in biosynthetic precursor would be the most likely mechanism for variation of the alkyl
group. Clarke and Bode hint at a similar hypothesis.[87] Norvaline 108 for example, if
processed by ST 1 synthase according to Clarke and Bode’s proposal would be
processed to ethyl stilbene 41 (Scheme 28). If alanine 109 were to be processed in a
similar manner by ST synthase then the resulting hydroxy-stilbene carboxylic acid 99
would have no alkyl group (Scheme 29).
Scheme 28: Hypothetical biosynthesis of ethyl stilbene 41 by ST synthase
Scheme 29: Hypothetical hydroxy stilbene carboxylic acid 99 biosynthesis by ST synthase
3.5.5 Biotransformations
Although only (isopropyl) ST 1 and ethyl stilbene 41 have been reported, according to
the R group variation hypothesis there should be a variety of other possible isomers. R
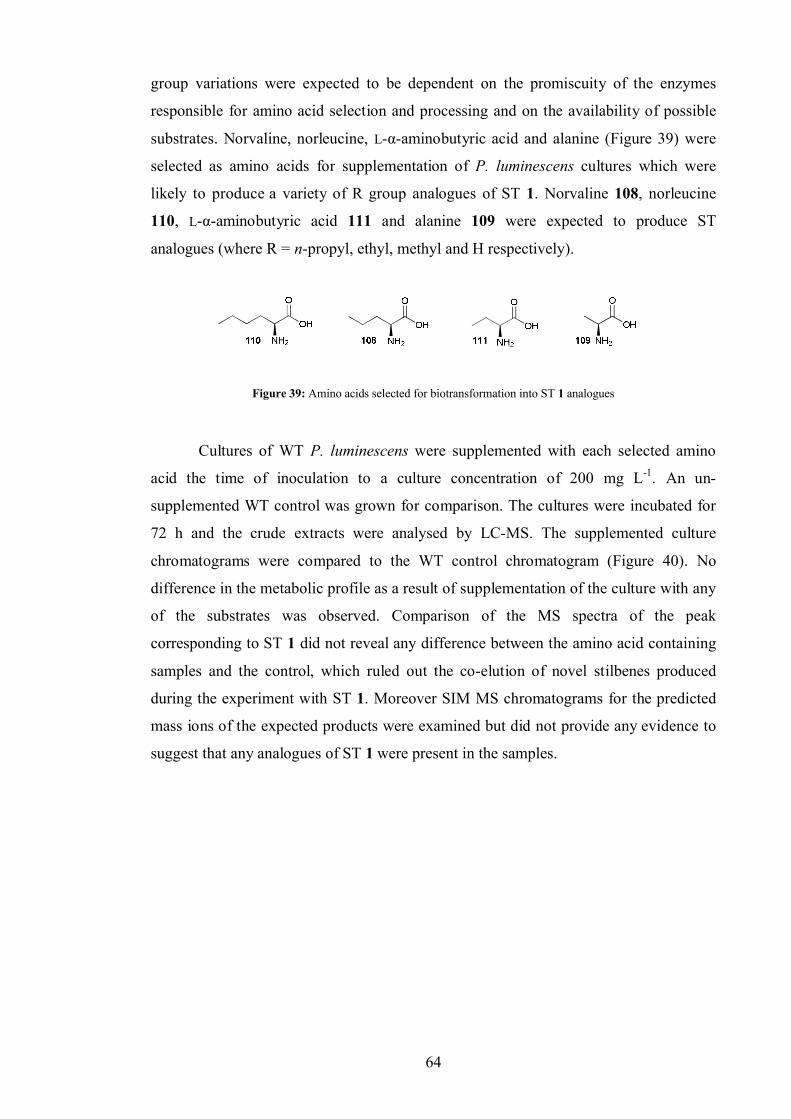
64
group variations were expected to be dependent on the promiscuity of the enzymes
responsible for amino acid selection and processing and on the availability of possible
substrates. Norvaline, norleucine, L-α-aminobutyric acid and alanine (Figure 39) were
selected as amino acids for supplementation of P. luminescens cultures which were
likely to produce a variety of R group analogues of ST 1. Norvaline 108, norleucine
110, L-α-aminobutyric acid 111 and alanine 109 were expected to produce ST
analogues (where R = n-propyl, ethyl, methyl and H respectively).
Figure 39: Amino acids selected for biotransformation into ST 1 analogues
Cultures of WT P. luminescens were supplemented with each selected amino
acid the time of inoculation to a culture concentration of 200 mg L-1. An un-
supplemented WT control was grown for comparison. The cultures were incubated for
72 h and the crude extracts were analysed by LC-MS. The supplemented culture
chromatograms were compared to the WT control chromatogram (Figure 40). No
difference in the metabolic profile as a result of supplementation of the culture with any
of the substrates was observed. Comparison of the MS spectra of the peak
corresponding to ST 1 did not reveal any difference between the amino acid containing
samples and the control, which ruled out the co-elution of novel stilbenes produced
during the experiment with ST 1. Moreover SIM MS chromatograms for the predicted
mass ions of the expected products were examined but did not provide any evidence to
suggest that any analogues of ST 1 were present in the samples.
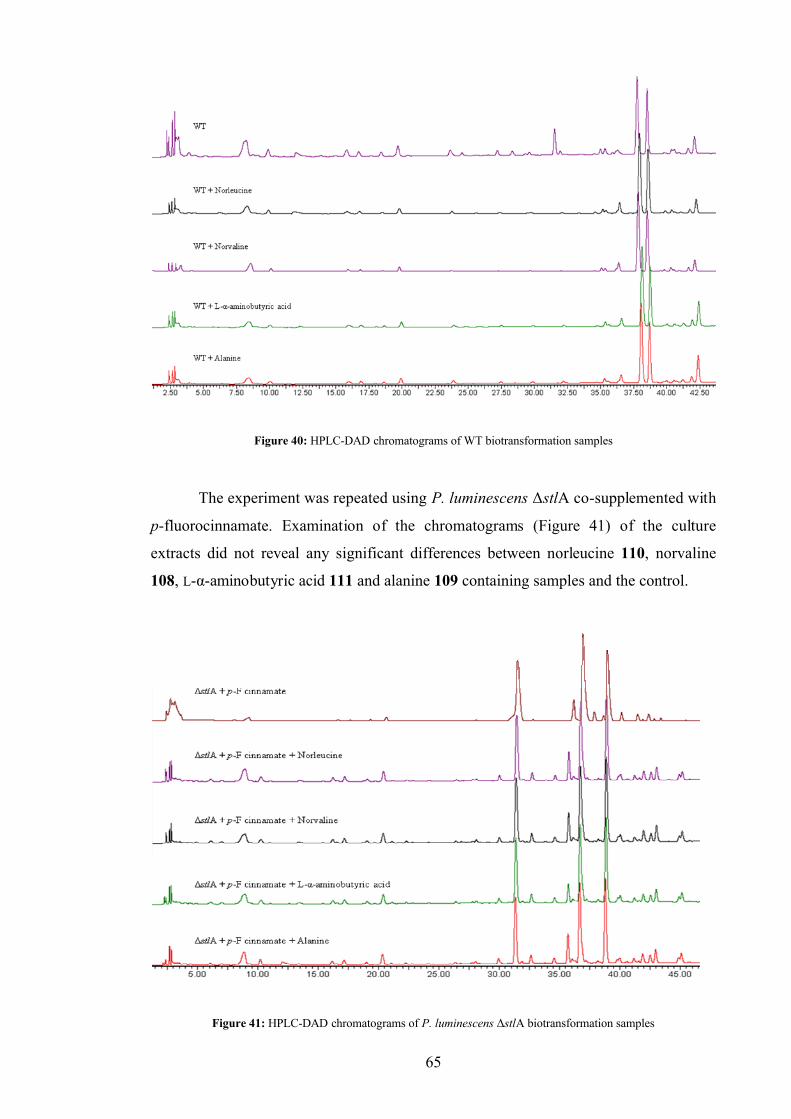
65
Figure 40: HPLC-DAD chromatograms of WT biotransformation samples
The experiment was repeated using P. luminescens ΔstlA co-supplemented with
p-fluorocinnamate. Examination of the chromatograms (Figure 41) of the culture
extracts did not reveal any significant differences between norleucine 110, norvaline
108, L-α-aminobutyric acid 111 and alanine 109 containing samples and the control.
Figure 41: HPLC-DAD chromatograms of P. luminescens ΔstlA biotransformation samples
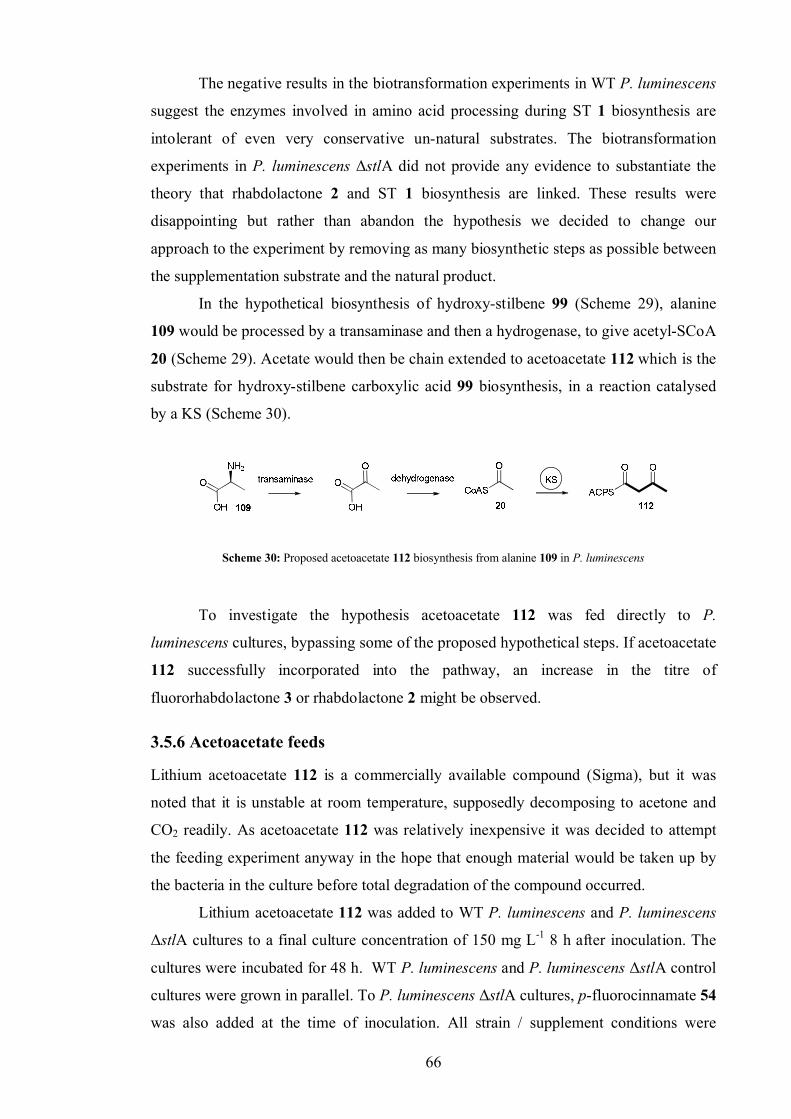
66
The negative results in the biotransformation experiments in WT P. luminescens
suggest the enzymes involved in amino acid processing during ST 1 biosynthesis are
intolerant of even very conservative un-natural substrates. The biotransformation
experiments in P. luminescens ΔstlA did not provide any evidence to substantiate the
theory that rhabdolactone 2 and ST 1 biosynthesis are linked. These results were
disappointing but rather than abandon the hypothesis we decided to change our
approach to the experiment by removing as many biosynthetic steps as possible between
the supplementation substrate and the natural product.
In the hypothetical biosynthesis of hydroxy-stilbene 99 (Scheme 29), alanine
109 would be processed by a transaminase and then a hydrogenase, to give acetyl-SCoA
20 (Scheme 29). Acetate would then be chain extended to acetoacetate 112 which is the
substrate for hydroxy-stilbene carboxylic acid 99 biosynthesis, in a reaction catalysed
by a KS (Scheme 30).
Scheme 30: Proposed acetoacetate 112 biosynthesis from alanine 109 in P. luminescens
To investigate the hypothesis acetoacetate 112 was fed directly to P.
luminescens cultures, bypassing some of the proposed hypothetical steps. If acetoacetate
112 successfully incorporated into the pathway, an increase in the titre of
fluororhabdolactone 3 or rhabdolactone 2 might be observed.
3.5.6 Acetoacetate feeds
Lithium acetoacetate 112 is a commercially available compound (Sigma), but it was
noted that it is unstable at room temperature, supposedly decomposing to acetone and
CO2 readily. As acetoacetate 112 was relatively inexpensive it was decided to attempt
the feeding experiment anyway in the hope that enough material would be taken up by
the bacteria in the culture before total degradation of the compound occurred.
Lithium acetoacetate 112 was added to WT P. luminescens and P. luminescens
ΔstlA cultures to a final culture concentration of 150 mg L-1 8 h after inoculation. The
cultures were incubated for 48 h. WT P. luminescens and P. luminescens ΔstlA control
cultures were grown in parallel. To P. luminescens ΔstlA cultures, p-fluorocinnamate 54
was also added at the time of inoculation. All strain / supplement conditions were
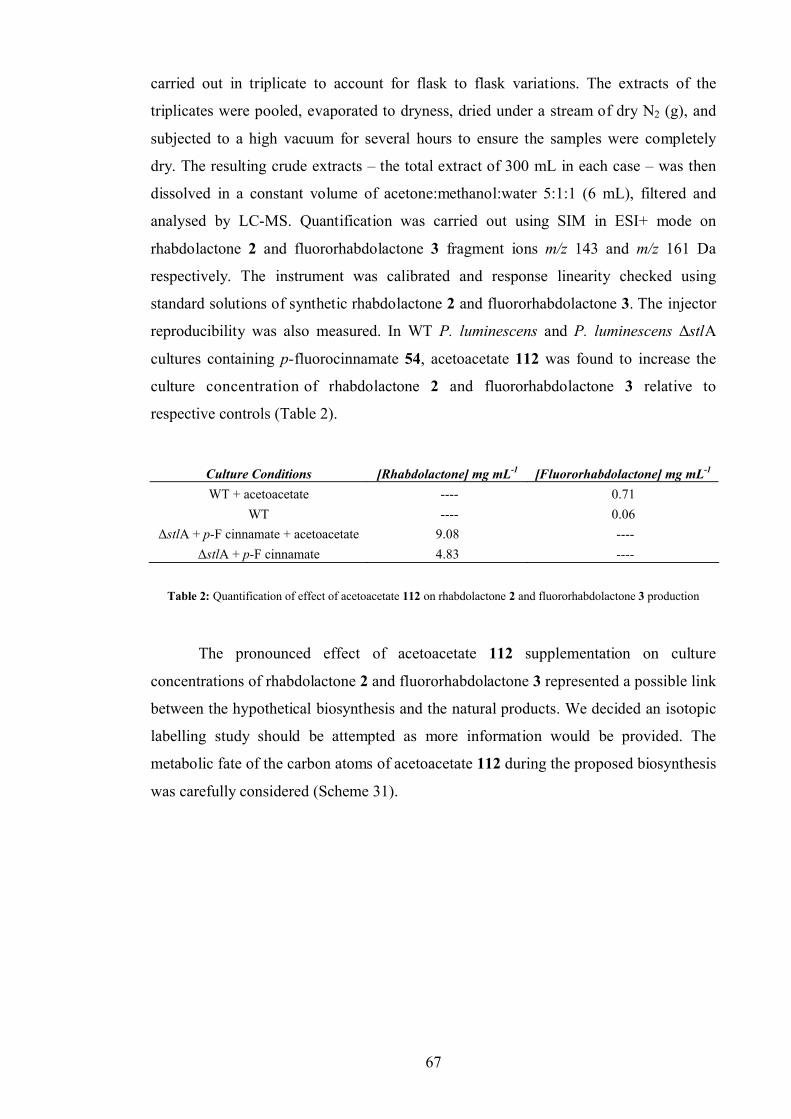
67
carried out in triplicate to account for flask to flask variations. The extracts of the
triplicates were pooled, evaporated to dryness, dried under a stream of dry N2 (g), and
subjected to a high vacuum for several hours to ensure the samples were completely
dry. The resulting crude extracts – the total extract of 300 mL in each case – was then
dissolved in a constant volume of acetone:methanol:water 5:1:1 (6 mL), filtered and
analysed by LC-MS. Quantification was carried out using SIM in ESI+ mode on
rhabdolactone 2 and fluororhabdolactone 3 fragment ions m/z 143 and m/z 161 Da
respectively. The instrument was calibrated and response linearity checked using
standard solutions of synthetic rhabdolactone 2 and fluororhabdolactone 3. The injector
reproducibility was also measured. In WT P. luminescens and P. luminescens ΔstlA
cultures containing p-fluorocinnamate 54, acetoacetate 112 was found to increase the
culture concentration of rhabdolactone 2 and fluororhabdolactone 3 relative to
respective controls (Table 2).
Culture Conditions [Rhabdolactone] mg mL-1 [Fluororhabdolactone] mg mL-1
WT + acetoacetate ---- 0.71WT ---- 0.06
ΔstlA + p-F cinnamate + acetoacetate 9.08 ----ΔstlA + p-F cinnamate 4.83 ----
Table 2: Quantification of effect of acetoacetate 112 on rhabdolactone 2 and fluororhabdolactone 3 production
The pronounced effect of acetoacetate 112 supplementation on culture
concentrations of rhabdolactone 2 and fluororhabdolactone 3 represented a possible link
between the hypothetical biosynthesis and the natural products. We decided an isotopic
labelling study should be attempted as more information would be provided. The
metabolic fate of the carbon atoms of acetoacetate 112 during the proposed biosynthesis
was carefully considered (Scheme 31).
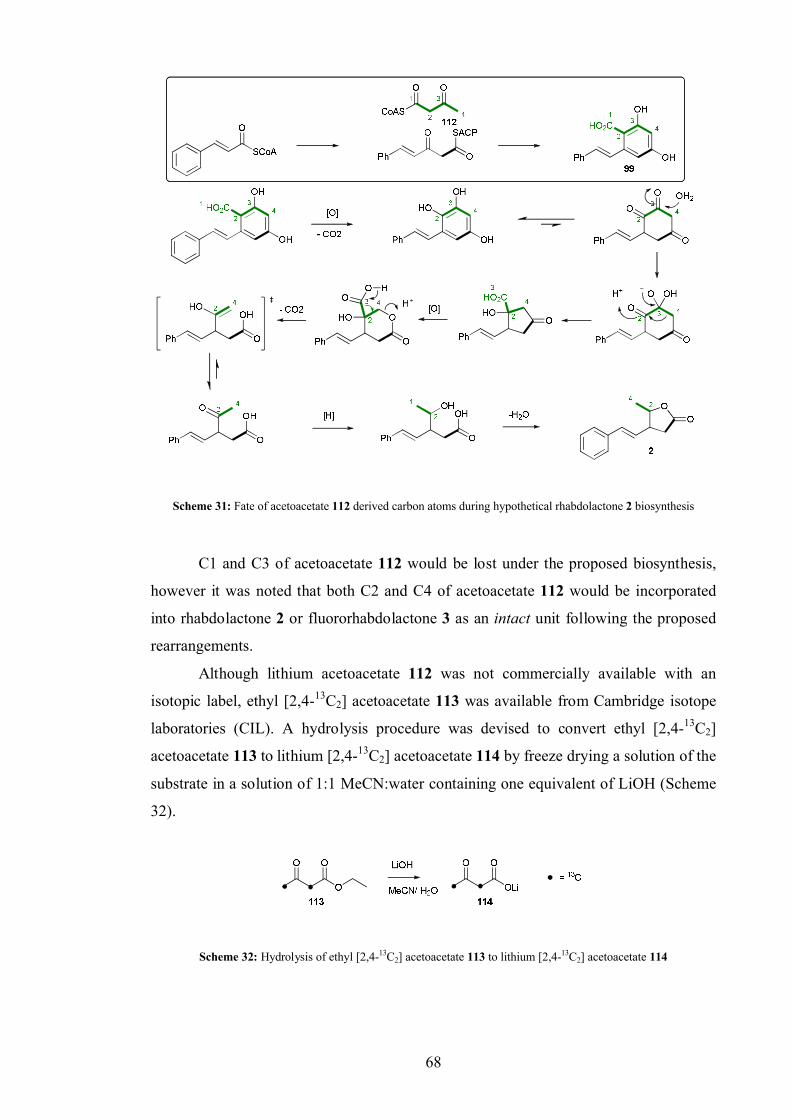
68
Scheme 31: Fate of acetoacetate 112 derived carbon atoms during hypothetical rhabdolactone 2 biosynthesis
C1 and C3 of acetoacetate 112 would be lost under the proposed biosynthesis,
however it was noted that both C2 and C4 of acetoacetate 112 would be incorporated
into rhabdolactone 2 or fluororhabdolactone 3 as an intact unit following the proposed
rearrangements.
Although lithium acetoacetate 112 was not commercially available with an
isotopic label, ethyl [2,4-13C2] acetoacetate 113 was available from Cambridge isotope
laboratories (CIL). A hydrolysis procedure was devised to convert ethyl [2,4-13C2]
acetoacetate 113 to lithium [2,4-13C2] acetoacetate 114 by freeze drying a solution of the
substrate in a solution of 1:1 MeCN:water containing one equivalent of LiOH (Scheme
32).
Scheme 32: Hydrolysis of ethyl [2,4-13C2] acetoacetate 113 to lithium [2,4-13C2] acetoacetate 114
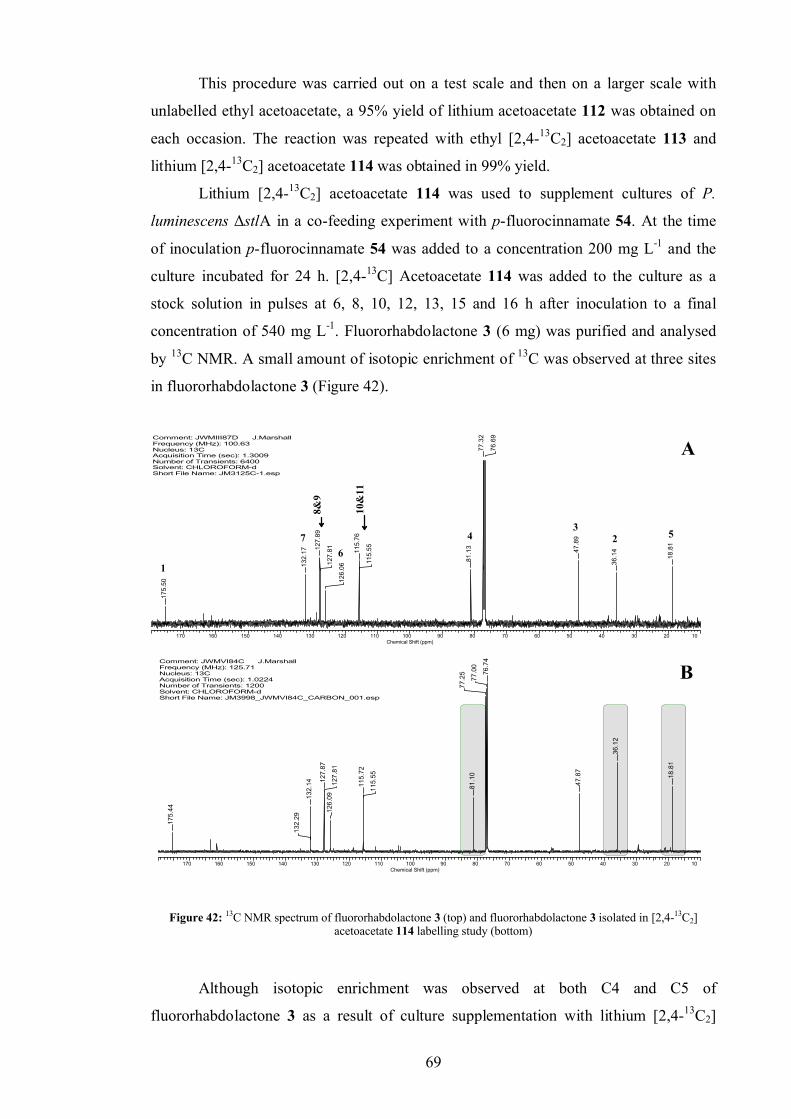
69
This procedure was carried out on a test scale and then on a larger scale with
unlabelled ethyl acetoacetate, a 95% yield of lithium acetoacetate 112 was obtained on
each occasion. The reaction was repeated with ethyl [2,4-13C2] acetoacetate 113 and
lithium [2,4-13C2] acetoacetate 114 was obtained in 99% yield.
Lithium [2,4-13C2] acetoacetate 114 was used to supplement cultures of P.
luminescens ΔstlA in a co-feeding experiment with p-fluorocinnamate 54. At the time
of inoculation p-fluorocinnamate 54 was added to a concentration 200 mg L-1 and the
culture incubated for 24 h. [2,4-13C] Acetoacetate 114 was added to the culture as a
stock solution in pulses at 6, 8, 10, 12, 13, 15 and 16 h after inoculation to a final
concentration of 540 mg L-1. Fluororhabdolactone 3 (6 mg) was purified and analysed
by 13C NMR. A small amount of isotopic enrichment of 13C was observed at three sites
in fluororhabdolactone 3 (Figure 42).
Comment: JWMIII87D J.MarshallFrequency (MHz): 100.63Nucleus: 13CAcquisition Time (sec): 1.3009Number of Transients: 6400Solvent: CHLOROFORM-dShort File Name: JM3125C-1.esp
170 160 150 140 130 120 110 100 90 80 70 60 50 40 30 20 10Chemical Shift (ppm)
175.
50
132.
17 127.
89
127.
81
126.
06
115.
76
115.
55
81.1
3
77.3
2
76.6
9
47.8
9
36.1
4
18.8
1
A
523
4
1
76
10&
11
8&9
Comment: JWMVI84C J.MarshallFrequency (MHz): 125.71Nucleus: 13CAcquisition Time (sec): 1.0224Number of Transients: 1200Solvent: CHLOROFORM-dShort File Name: JM3998_JWMVI84C_CARBON_001.esp
170 160 150 140 130 120 110 100 90 80 70 60 50 40 30 20 10Chemical Shift (ppm)
18.8
1
36.1
2
47.8
7
76.7
4
77.0
0
77.2
581
.10
115.
55
115.
72
126.
0912
7.81
127.
87
132.
14
132.
29
175.
44
B
Figure 42: 13C NMR spectrum of fluororhabdolactone 3 (top) and fluororhabdolactone 3 isolated in [2,4-13C2] acetoacetate 114 labelling study (bottom)
Although isotopic enrichment was observed at both C4 and C5 of
fluororhabdolactone 3 as a result of culture supplementation with lithium [2,4-13C2]
70
acetoacetate 114, the incorporation was non-intact. Furthermore incorporation at a
similar level was also observed at C2 of fluororhabdolactone 3, a position which is
known to be acetate derived. Overall the labelling pattern observed in
fluororhabdolactone 3 as a result of lithium [2,4-13C2] acetoacetate 114 supplementation
was identical to the labelling pattern observed when supplementing the culture with
sodium [2-13C] acetate 55. It was concluded that degradation of [2,4-13C2] acetoacetate
114 to [2-13C] acetate 55 must be occurring under the culture conditions, and that it was
[2-13C] acetate 55 which was incorporating into fluororhabdolactone 3, rather than [2,4-13C2] acetoacetate 224. [2,4-13C2] acetoacetate either did not incorporate into
fluororhabdolactone 3 as the hypothesis was incorrect; or was degraded to [2-13C]
acetate 55, rapidly under the culture conditions before incorporation could occur.
3.6 Rhabdolactone reported in the literature[100]
During the preparation of this thesis, Clardy and co-workers published a paper entitled
“Exploiting a Global Regulator for Small Molecule Discovery in Photorhabdus
luminescens”.[100] The paper outlines a number of metabolites produced by P.
luminescens, some of which, the authors propose are related to ST 1. The new
metabolites are proposed to have been produced after a global regulator hexA, which
encodes a transcriptional repressor, was knocked-out, resulting in ‘the dramatic
upregulation of biosynthesised small molecules’. The metabolites include ST analogues
and rhabdolactone 2. Rhabdolactone 2 production is likely to have been switched on by
a media component as no difference in rhabdolactone 2 culture levels between the
ΔhexA mutant and WT P. luminescens is reported by the authors, who used LB media
supplemented with proline and pyruvate.[100] Clardy and co-workers report
rhabdolactone 2 with no relative stereochemistry and do not indicate that the
biosynthesis is being investigated.
3.7 Conclusion
A novel trace compound (rhabdolactone 2), likely to be a tightly regulated metabolite
present at extremely low levels in the culture, was isolated and characterised and it’s
structure confirmed by total synthesis. An un-natural natural product,
fluororhabdolactone 3 has also been isolated and prepared by total synthesis as has the
analogue m-fluororhabdolactone 47, which has been used as a biosynthetic pathway

71
probe. The biosynthesis of rhabdolactone 2 has also been investigated extensively and
all atoms have been mapped from biosynthetic precursors.
Due to time constraints, no further experimentation could be carried out and the
fascinating biosynthesis of rhabdolactone 2 and fluororhabdolactone 3 remains for now
unsolved. Light has been shed on the status of rhabdolactone 2 by the work of Clardy
and co-workers.[100] Rather than a shunt metabolite or biosynthetic intermediate, it
seems likely that rhabdolactone is a very tightly regulated metabolite,[100] although its
possible hypothetical relationship to ST 1 cannot (for now) be confirmed one way or
another. The reasons behind the differences in titre of rhabdolactone 3 under normal
conditions and fluororhabdolactone 3 when cultures are supplemented with p-
fluorocinnamate 54 also will continue to remain a mystery until further experimentation
is carried out.
3.8 Suggested further work
The biosynthesis of rhabdolactone 2 and the apparent enhancement in activity of the
enzymes responsible for rhabdolactone 2 biosynthesis when p-fluorocinnamate 54 is
available as a substrate, both remain extremely puzzling and interesting. Although all
atoms in rhabdolactone 2 have been biosynthetically mapped back to their biological
precursors, the unusual biosynthesis remains a mystery. The ‘function’ of rhabdolactone
also remains a mystery, though the work of Clardy and co-workers suggests it is a
tightly regulated compound. Clardy’s experimental conditions should be reproduced in
our labs to determine whether rhabdolactone 2 production can be induced by the
addition of proline and pyruvate to cultures of P. luminescens.
Further experimentation to tie down the biosynthetic pathway (which shows an
extremely interesting isotopic labelling pattern for such a small molecule) would also be
desirable. One approach remaining open to investigation is to synthesise the putative
intermediates on the pathway to rhabdolactone 2. Synthesis of hydroxy-stilbene
carboxylic acid 99 in 6 steps starting from dehydroacetic acid 115 has been published
(Scheme 33) and might be a good starting point.[101, 102]
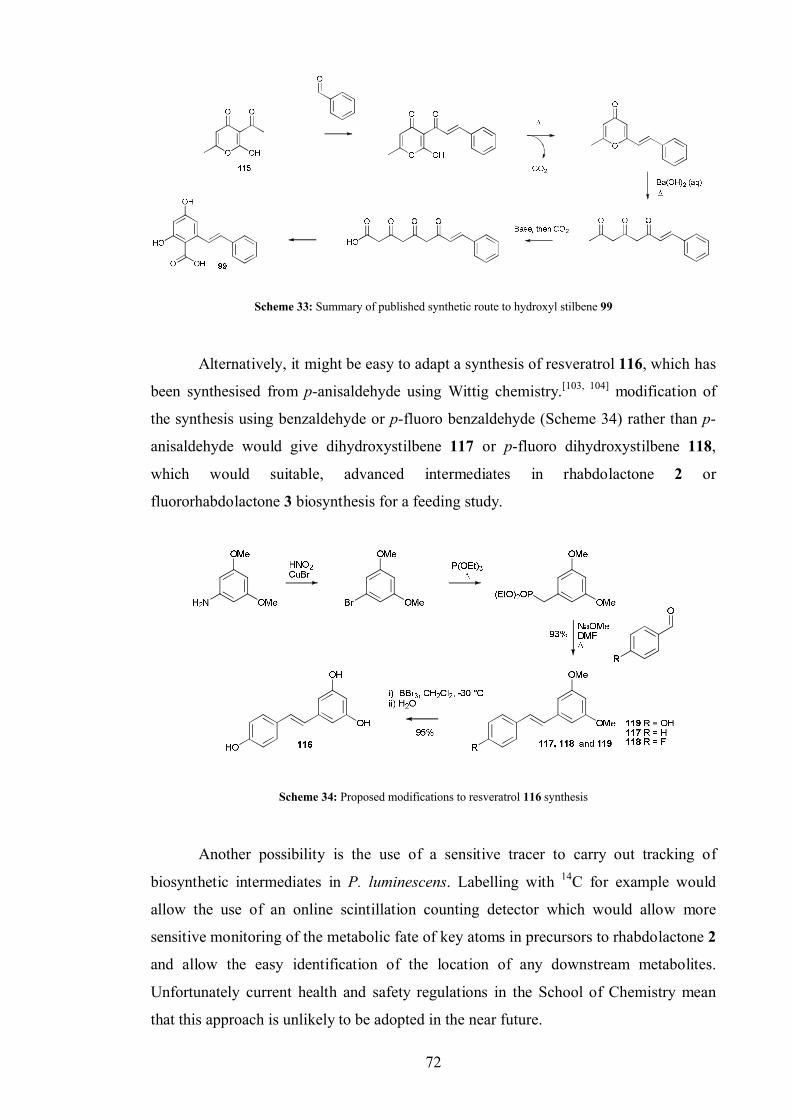
72
Scheme 33: Summary of published synthetic route to hydroxyl stilbene 99
Alternatively, it might be easy to adapt a synthesis of resveratrol 116, which has
been synthesised from p-anisaldehyde using Wittig chemistry.[103, 104] modification of
the synthesis using benzaldehyde or p-fluoro benzaldehyde (Scheme 34) rather than p-
anisaldehyde would give dihydroxystilbene 117 or p-fluoro dihydroxystilbene 118,
which would suitable, advanced intermediates in rhabdolactone 2 or
fluororhabdolactone 3 biosynthesis for a feeding study.
Scheme 34: Proposed modifications to resveratrol 116 synthesis
Another possibility is the use of a sensitive tracer to carry out tracking of
biosynthetic intermediates in P. luminescens. Labelling with 14C for example would
allow the use of an online scintillation counting detector which would allow more
sensitive monitoring of the metabolic fate of key atoms in precursors to rhabdolactone 2
and allow the easy identification of the location of any downstream metabolites.
Unfortunately current health and safety regulations in the School of Chemistry mean
that this approach is unlikely to be adopted in the near future.
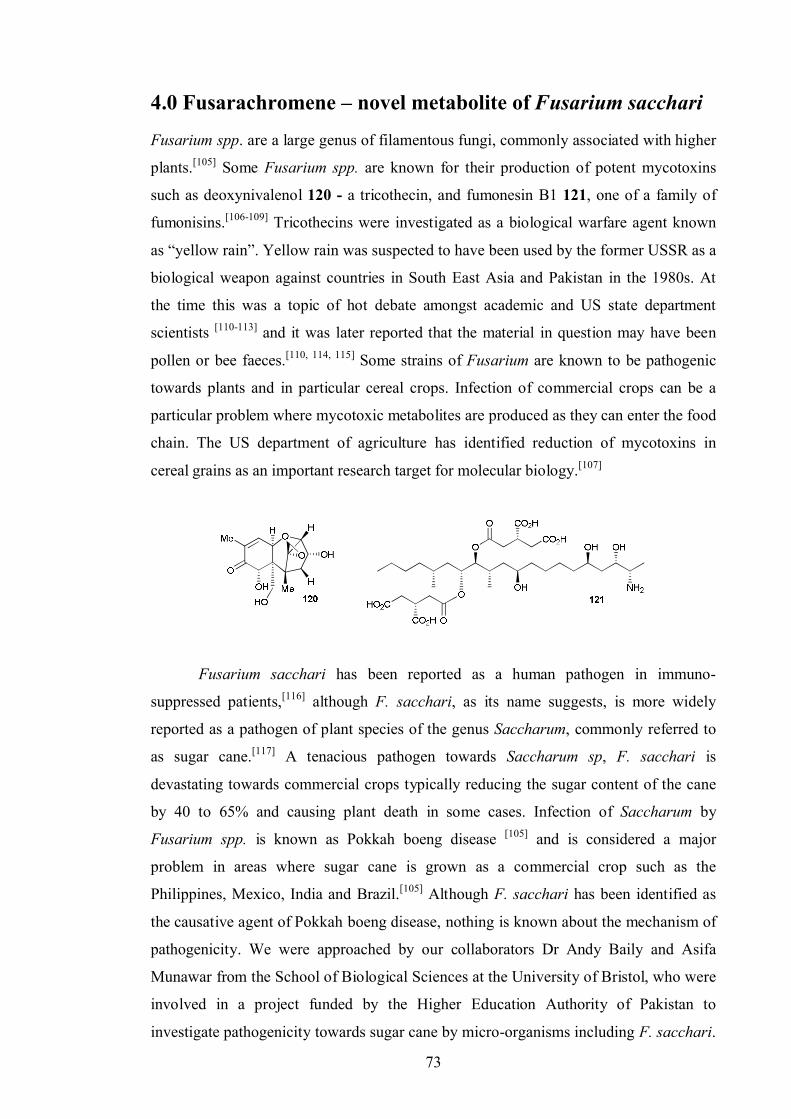
73
4.0 Fusarachromene – novel metabolite of Fusarium sacchariFusarium spp. are a large genus of filamentous fungi, commonly associated with higher
plants.[105] Some Fusarium spp. are known for their production of potent mycotoxins
such as deoxynivalenol 120 - a tricothecin, and fumonesin B1 121, one of a family of
fumonisins.[106-109] Tricothecins were investigated as a biological warfare agent known
as “yellow rain”. Yellow rain was suspected to have been used by the former USSR as a
biological weapon against countries in South East Asia and Pakistan in the 1980s. At
the time this was a topic of hot debate amongst academic and US state department
scientists [110-113] and it was later reported that the material in question may have been
pollen or bee faeces.[110, 114, 115] Some strains of Fusarium are known to be pathogenic
towards plants and in particular cereal crops. Infection of commercial crops can be a
particular problem where mycotoxic metabolites are produced as they can enter the food
chain. The US department of agriculture has identified reduction of mycotoxins in
cereal grains as an important research target for molecular biology.[107]
Fusarium sacchari has been reported as a human pathogen in immuno-
suppressed patients,[116] although F. sacchari, as its name suggests, is more widely
reported as a pathogen of plant species of the genus Saccharum, commonly referred to
as sugar cane.[117] A tenacious pathogen towards Saccharum sp, F. sacchari is
devastating towards commercial crops typically reducing the sugar content of the cane
by 40 to 65% and causing plant death in some cases. Infection of Saccharum by
Fusarium spp. is known as Pokkah boeng disease [105] and is considered a major
problem in areas where sugar cane is grown as a commercial crop such as the
Philippines, Mexico, India and Brazil.[105] Although F. sacchari has been identified as
the causative agent of Pokkah boeng disease, nothing is known about the mechanism of
pathogenicity. We were approached by our collaborators Dr Andy Baily and Asifa
Munawar from the School of Biological Sciences at the University of Bristol, who were
involved in a project funded by the Higher Education Authority of Pakistan to
investigate pathogenicity towards sugar cane by micro-organisms including F. sacchari.
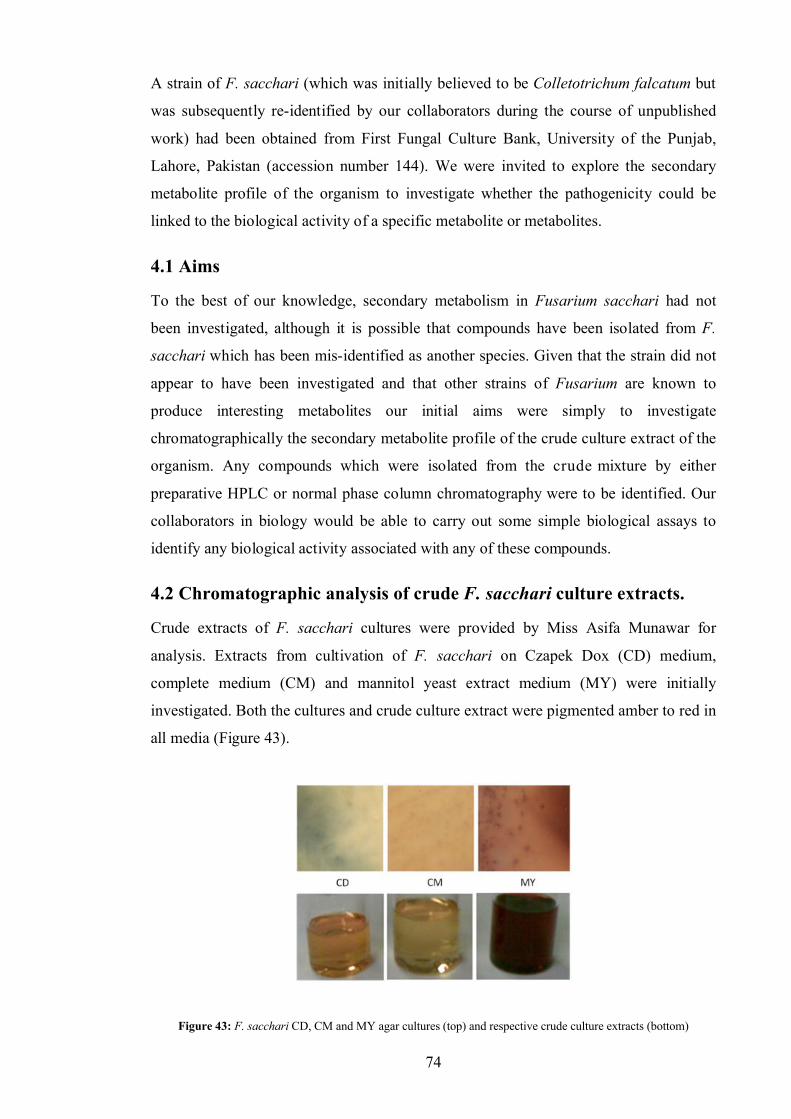
74
A strain of F. sacchari (which was initially believed to be Colletotrichum falcatum but
was subsequently re-identified by our collaborators during the course of unpublished
work) had been obtained from First Fungal Culture Bank, University of the Punjab,
Lahore, Pakistan (accession number 144). We were invited to explore the secondary
metabolite profile of the organism to investigate whether the pathogenicity could be
linked to the biological activity of a specific metabolite or metabolites.
4.1 Aims
To the best of our knowledge, secondary metabolism in Fusarium sacchari had not
been investigated, although it is possible that compounds have been isolated from F.
sacchari which has been mis-identified as another species. Given that the strain did not
appear to have been investigated and that other strains of Fusarium are known to
produce interesting metabolites our initial aims were simply to investigate
chromatographically the secondary metabolite profile of the crude culture extract of the
organism. Any compounds which were isolated from the crude mixture by either
preparative HPLC or normal phase column chromatography were to be identified. Our
collaborators in biology would be able to carry out some simple biological assays to
identify any biological activity associated with any of these compounds.
4.2 Chromatographic analysis of crude F. sacchari culture extracts.
Crude extracts of F. sacchari cultures were provided by Miss Asifa Munawar for
analysis. Extracts from cultivation of F. sacchari on Czapek Dox (CD) medium,
complete medium (CM) and mannitol yeast extract medium (MY) were initially
investigated. Both the cultures and crude culture extract were pigmented amber to red in
all media (Figure 43).
Figure 43: F. sacchari CD, CM and MY agar cultures (top) and respective crude culture extracts (bottom)
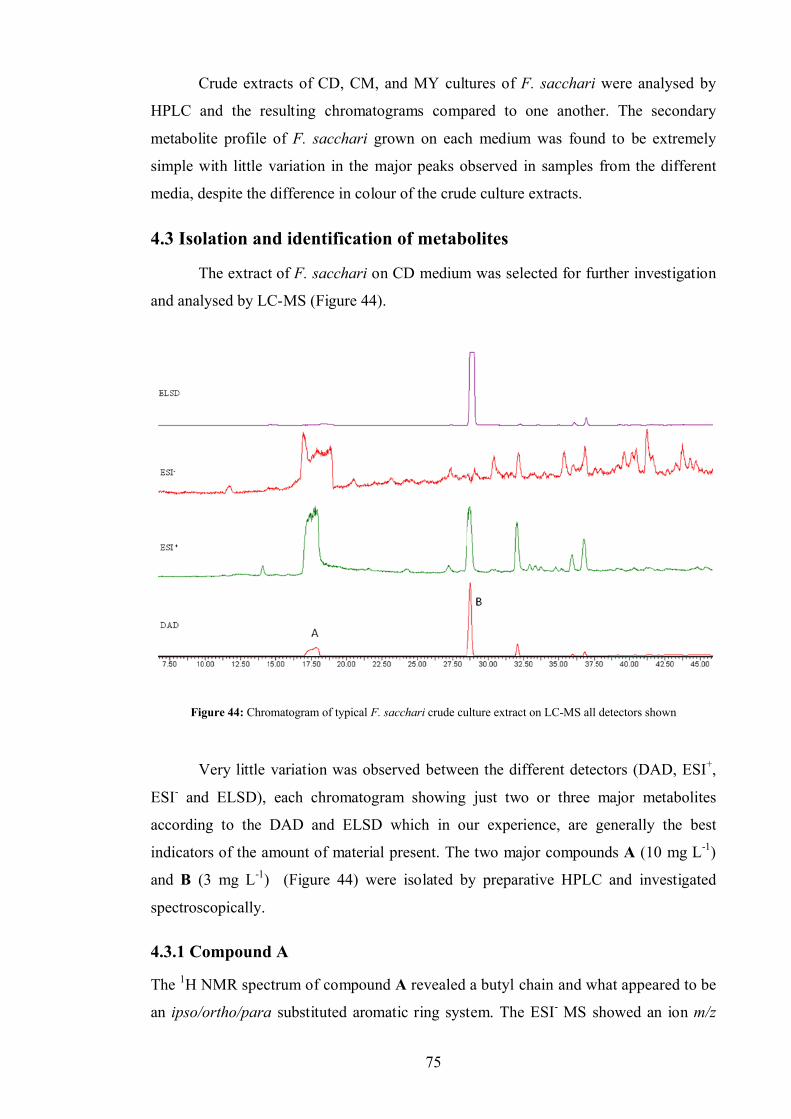
75
Crude extracts of CD, CM, and MY cultures of F. sacchari were analysed by
HPLC and the resulting chromatograms compared to one another. The secondary
metabolite profile of F. sacchari grown on each medium was found to be extremely
simple with little variation in the major peaks observed in samples from the different
media, despite the difference in colour of the crude culture extracts.
4.3 Isolation and identification of metabolites
The extract of F. sacchari on CD medium was selected for further investigation
and analysed by LC-MS (Figure 44).
Figure 44: Chromatogram of typical F. sacchari crude culture extract on LC-MS all detectors shown
Very little variation was observed between the different detectors (DAD, ESI+,
ESI- and ELSD), each chromatogram showing just two or three major metabolites
according to the DAD and ELSD which in our experience, are generally the best
indicators of the amount of material present. The two major compounds A (10 mg L-1)
and B (3 mg L-1) (Figure 44) were isolated by preparative HPLC and investigated
spectroscopically.
4.3.1 Compound A
The 1H NMR spectrum of compound A revealed a butyl chain and what appeared to be
an ipso/ortho/para substituted aromatic ring system. The ESI- MS showed an ion m/z
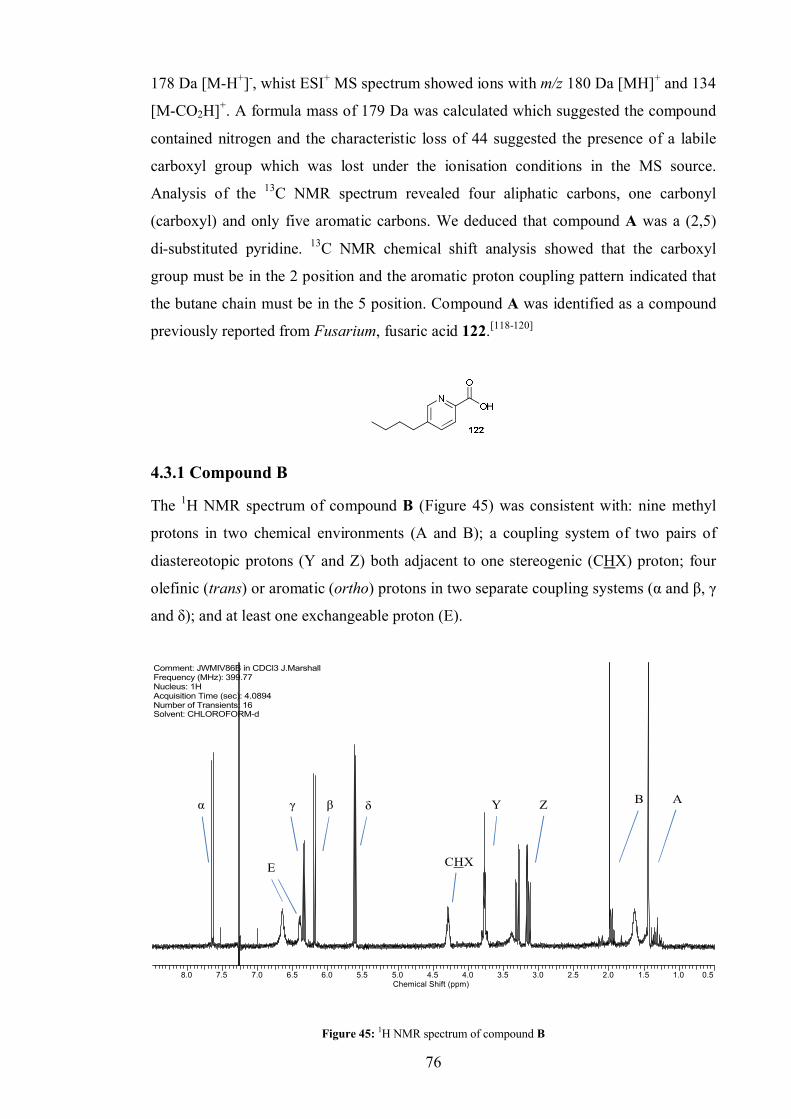
76
178 Da [M-H+]-, whist ESI+ MS spectrum showed ions with m/z 180 Da [MH]+ and 134
[M-CO2H]+. A formula mass of 179 Da was calculated which suggested the compound
contained nitrogen and the characteristic loss of 44 suggested the presence of a labile
carboxyl group which was lost under the ionisation conditions in the MS source.
Analysis of the 13C NMR spectrum revealed four aliphatic carbons, one carbonyl
(carboxyl) and only five aromatic carbons. We deduced that compound A was a (2,5)
di-substituted pyridine. 13C NMR chemical shift analysis showed that the carboxyl
group must be in the 2 position and the aromatic proton coupling pattern indicated that
the butane chain must be in the 5 position. Compound A was identified as a compound
previously reported from Fusarium, fusaric acid 122.[118-120]
4.3.1 Compound B
The 1H NMR spectrum of compound B (Figure 45) was consistent with: nine methyl
protons in two chemical environments (A and B); a coupling system of two pairs of
diastereotopic protons (Y and Z) both adjacent to one stereogenic (CHX) proton; four
olefinic (trans) or aromatic (ortho) protons in two separate coupling systems (α and β, γ
and δ); and at least one exchangeable proton (E).
Comment: JWMIV86B in CDCl3 J.MarshallFrequency (MHz): 399.77Nucleus: 1HAcquisition Time (sec): 4.0894Number of Transients: 16Solvent: CHLOROFORM-d
8.0 7.5 7.0 6.5 6.0 5.5 5.0 4.5 4.0 3.5 3.0 2.5 2.0 1.5 1.0 0.5Chemical Shift (ppm)
AB
CHX
α β δ Yγ Z
E
Figure 45: 1H NMR spectrum of compound B
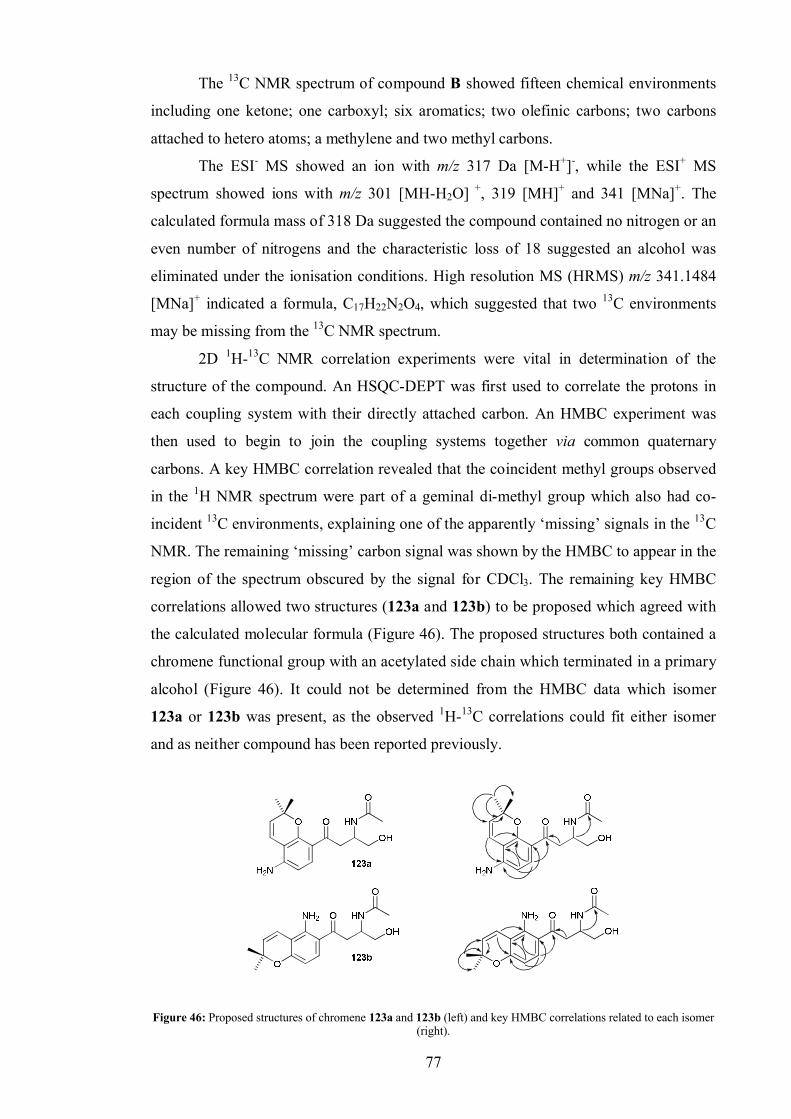
77
The 13C NMR spectrum of compound B showed fifteen chemical environments
including one ketone; one carboxyl; six aromatics; two olefinic carbons; two carbons
attached to hetero atoms; a methylene and two methyl carbons.
The ESI- MS showed an ion with m/z 317 Da [M-H+]-, while the ESI+ MS
spectrum showed ions with m/z 301 [MH-H2O] +, 319 [MH]+ and 341 [MNa]+. The
calculated formula mass of 318 Da suggested the compound contained no nitrogen or an
even number of nitrogens and the characteristic loss of 18 suggested an alcohol was
eliminated under the ionisation conditions. High resolution MS (HRMS) m/z 341.1484
[MNa]+ indicated a formula, C17H22N2O4, which suggested that two 13C environments
may be missing from the 13C NMR spectrum.
2D 1H-13C NMR correlation experiments were vital in determination of the
structure of the compound. An HSQC-DEPT was first used to correlate the protons in
each coupling system with their directly attached carbon. An HMBC experiment was
then used to begin to join the coupling systems together via common quaternary
carbons. A key HMBC correlation revealed that the coincident methyl groups observed
in the 1H NMR spectrum were part of a geminal di-methyl group which also had co-
incident 13C environments, explaining one of the apparently ‘missing’ signals in the 13C
NMR. The remaining ‘missing’ carbon signal was shown by the HMBC to appear in the
region of the spectrum obscured by the signal for CDCl3. The remaining key HMBC
correlations allowed two structures (123a and 123b) to be proposed which agreed with
the calculated molecular formula (Figure 46). The proposed structures both contained a
chromene functional group with an acetylated side chain which terminated in a primary
alcohol (Figure 46). It could not be determined from the HMBC data which isomer
123a or 123b was present, as the observed 1H-13C correlations could fit either isomer
and as neither compound has been reported previously.
Figure 46: Proposed structures of chromene 123a and 123b (left) and key HMBC correlations related to each isomer (right).
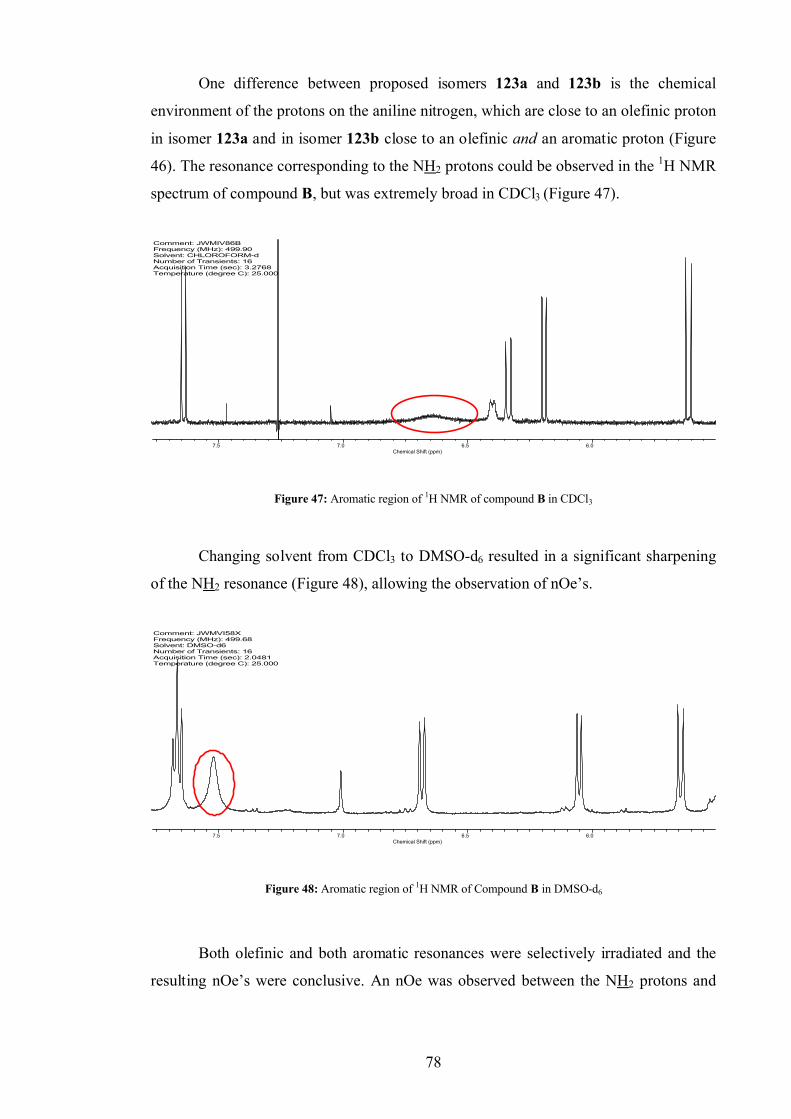
78
One difference between proposed isomers 123a and 123b is the chemical
environment of the protons on the aniline nitrogen, which are close to an olefinic proton
in isomer 123a and in isomer 123b close to an olefinic and an aromatic proton (Figure
46). The resonance corresponding to the NH2 protons could be observed in the 1H NMR
spectrum of compound B, but was extremely broad in CDCl3 (Figure 47).
Comment: JWMIV86BFrequency (MHz): 499.90Solvent: CHLOROFORM-dNumber of Transients: 16Acquisition Time (sec): 3.2768Temperature (degree C): 25.000
7.5 7.0 6.5 6.0Chemical Shift (ppm)
Figure 47: Aromatic region of 1H NMR of compound B in CDCl3
Changing solvent from CDCl3 to DMSO-d6 resulted in a significant sharpening
of the NH2 resonance (Figure 48), allowing the observation of nOe’s.
Comment: JWMVI58XFrequency (MHz): 499.68Solvent: DMSO-d6Number of Transients: 16Acquisition Time (sec): 2.0481Temperature (degree C): 25.000
7.5 7.0 6.5 6.0Chemical Shift (ppm)
Figure 48: Aromatic region of 1H NMR of Compound B in DMSO-d6
Both olefinic and both aromatic resonances were selectively irradiated and the
resulting nOe’s were conclusive. An nOe was observed between the NH2 protons and
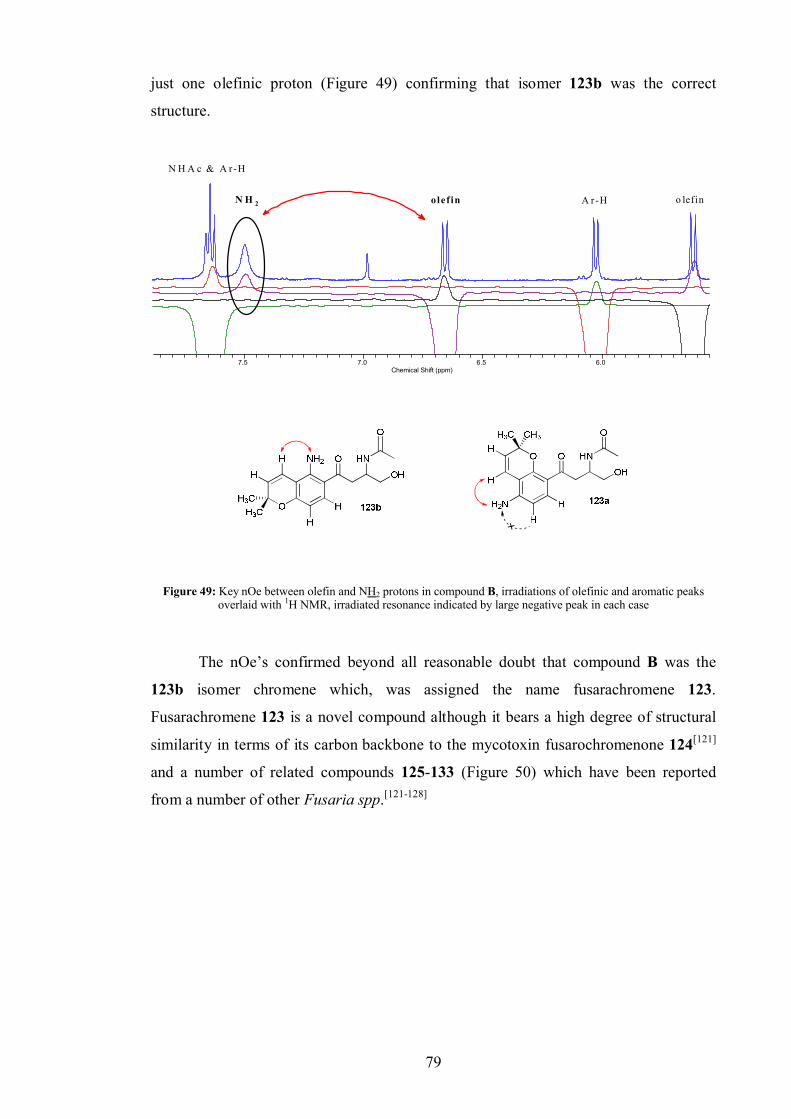
79
just one olefinic proton (Figure 49) confirming that isomer 123b was the correct
structure.
7.5 7.0 6.5 6.0Chemical Shift (ppm)
N H 2
N H A c & A r-H
A r-Holef in o lefin
Figure 49: Key nOe between olefin and NH2 protons in compound B, irradiations of olefinic and aromatic peaksoverlaid with 1H NMR, irradiated resonance indicated by large negative peak in each case
The nOe’s confirmed beyond all reasonable doubt that compound B was the
123b isomer chromene which, was assigned the name fusarachromene 123.
Fusarachromene 123 is a novel compound although it bears a high degree of structural
similarity in terms of its carbon backbone to the mycotoxin fusarochromenone 124[121]
and a number of related compounds 125-133 (Figure 50) which have been reported
from a number of other Fusaria spp.[121-128]
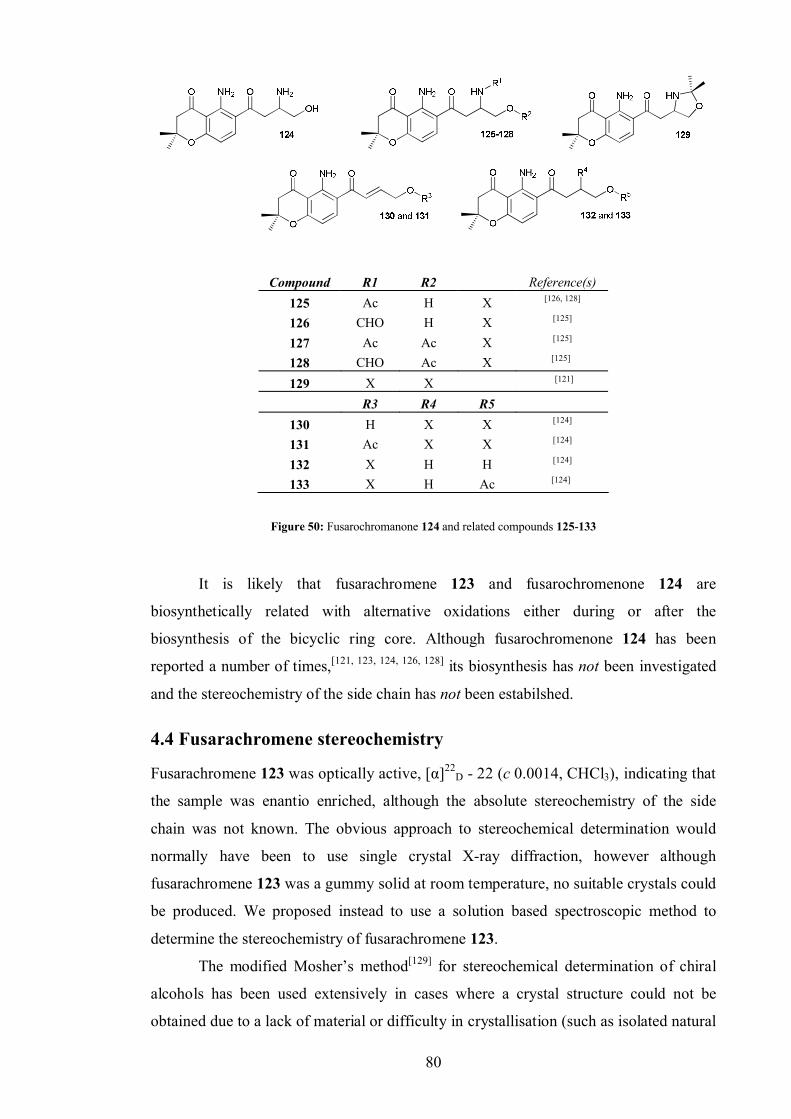
80
Compound R1 R2 Reference(s)125 Ac H X [126, 128]
126 CHO H X [125]
127 Ac Ac X [125]
128 CHO Ac X [125]
129 X X [121]
R3 R4 R5130 H X X [124]
131 Ac X X [124]
132 X H H [124]
133 X H Ac [124]
Figure 50: Fusarochromanone 124 and related compounds 125-133
It is likely that fusarachromene 123 and fusarochromenone 124 are
biosynthetically related with alternative oxidations either during or after the
biosynthesis of the bicyclic ring core. Although fusarochromenone 124 has been
reported a number of times,[121, 123, 124, 126, 128] its biosynthesis has not been investigated
and the stereochemistry of the side chain has not been estabilshed.
4.4 Fusarachromene stereochemistry
Fusarachromene 123 was optically active, [α]22D - 22 (c 0.0014, CHCl3), indicating that
the sample was enantio enriched, although the absolute stereochemistry of the side
chain was not known. The obvious approach to stereochemical determination would
normally have been to use single crystal X-ray diffraction, however although
fusarachromene 123 was a gummy solid at room temperature, no suitable crystals could
be produced. We proposed instead to use a solution based spectroscopic method to
determine the stereochemistry of fusarachromene 123.
The modified Mosher’s method[129] for stereochemical determination of chiral
alcohols has been used extensively in cases where a crystal structure could not be
obtained due to a lack of material or difficulty in crystallisation (such as isolated natural
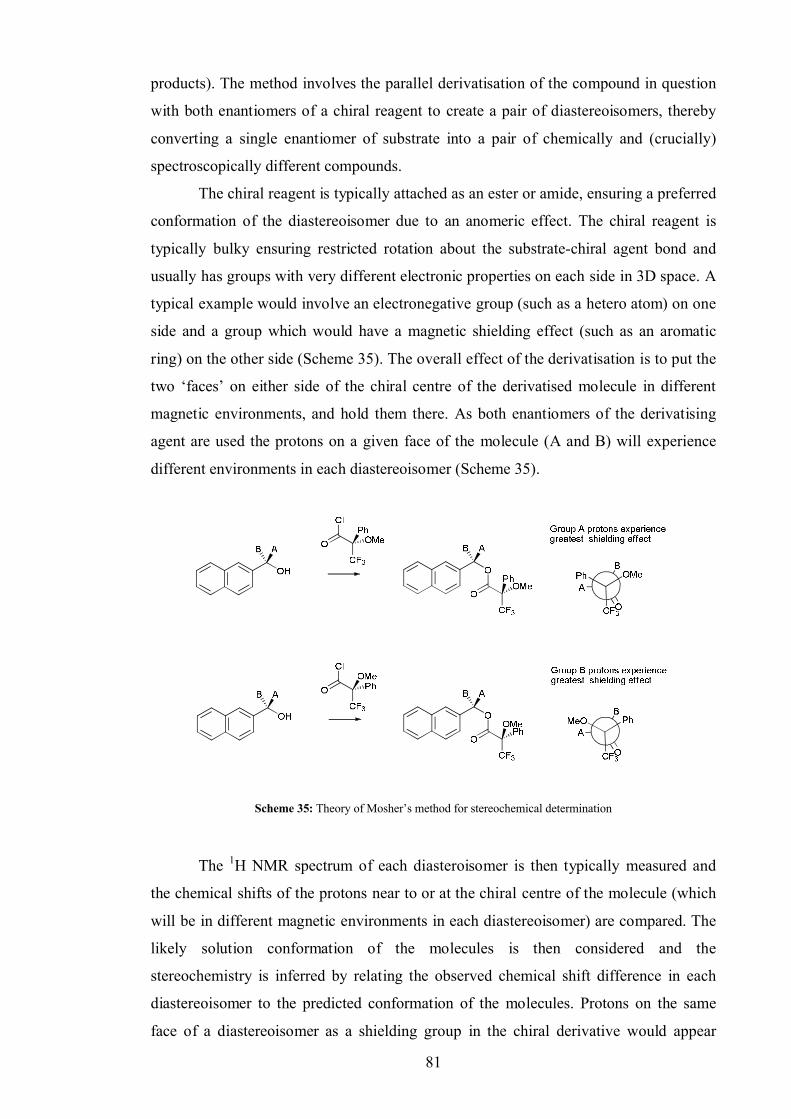
81
products). The method involves the parallel derivatisation of the compound in question
with both enantiomers of a chiral reagent to create a pair of diastereoisomers, thereby
converting a single enantiomer of substrate into a pair of chemically and (crucially)
spectroscopically different compounds.
The chiral reagent is typically attached as an ester or amide, ensuring a preferred
conformation of the diastereoisomer due to an anomeric effect. The chiral reagent is
typically bulky ensuring restricted rotation about the substrate-chiral agent bond and
usually has groups with very different electronic properties on each side in 3D space. A
typical example would involve an electronegative group (such as a hetero atom) on one
side and a group which would have a magnetic shielding effect (such as an aromatic
ring) on the other side (Scheme 35). The overall effect of the derivatisation is to put the
two ‘faces’ on either side of the chiral centre of the derivatised molecule in different
magnetic environments, and hold them there. As both enantiomers of the derivatising
agent are used the protons on a given face of the molecule (A and B) will experience
different environments in each diastereoisomer (Scheme 35).
Scheme 35: Theory of Mosher’s method for stereochemical determination
The 1H NMR spectrum of each diasteroisomer is then typically measured and
the chemical shifts of the protons near to or at the chiral centre of the molecule (which
will be in different magnetic environments in each diastereoisomer) are compared. The
likely solution conformation of the molecules is then considered and the
stereochemistry is inferred by relating the observed chemical shift difference in each
diastereoisomer to the predicted conformation of the molecules. Protons on the same
face of a diastereoisomer as a shielding group in the chiral derivative would appear
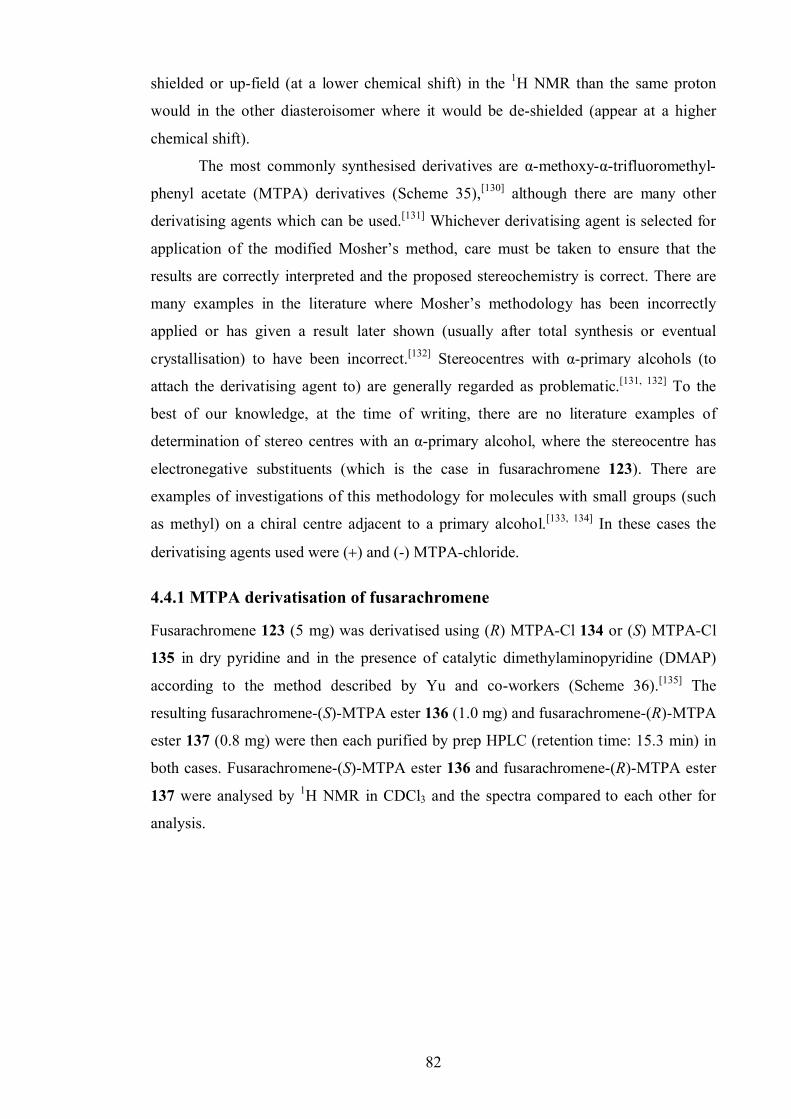
82
shielded or up-field (at a lower chemical shift) in the 1H NMR than the same proton
would in the other diasteroisomer where it would be de-shielded (appear at a higher
chemical shift).
The most commonly synthesised derivatives are α-methoxy-α-trifluoromethyl-
phenyl acetate (MTPA) derivatives (Scheme 35),[130] although there are many other
derivatising agents which can be used.[131] Whichever derivatising agent is selected for
application of the modified Mosher’s method, care must be taken to ensure that the
results are correctly interpreted and the proposed stereochemistry is correct. There are
many examples in the literature where Mosher’s methodology has been incorrectly
applied or has given a result later shown (usually after total synthesis or eventual
crystallisation) to have been incorrect.[132] Stereocentres with α-primary alcohols (to
attach the derivatising agent to) are generally regarded as problematic.[131, 132] To the
best of our knowledge, at the time of writing, there are no literature examples of
determination of stereo centres with an α-primary alcohol, where the stereocentre has
electronegative substituents (which is the case in fusarachromene 123). There are
examples of investigations of this methodology for molecules with small groups (such
as methyl) on a chiral centre adjacent to a primary alcohol.[133, 134] In these cases the
derivatising agents used were () and (-) MTPA-chloride.
4.4.1 MTPA derivatisation of fusarachromene
Fusarachromene 123 (5 mg) was derivatised using (R) MTPA-Cl 134 or (S) MTPA-Cl
135 in dry pyridine and in the presence of catalytic dimethylaminopyridine (DMAP)
according to the method described by Yu and co-workers (Scheme 36).[135] The
resulting fusarachromene-(S)-MTPA ester 136 (1.0 mg) and fusarachromene-(R)-MTPA
ester 137 (0.8 mg) were then each purified by prep HPLC (retention time: 15.3 min) in
both cases. Fusarachromene-(S)-MTPA ester 136 and fusarachromene-(R)-MTPA ester
137 were analysed by 1H NMR in CDCl3 and the spectra compared to each other for
analysis.
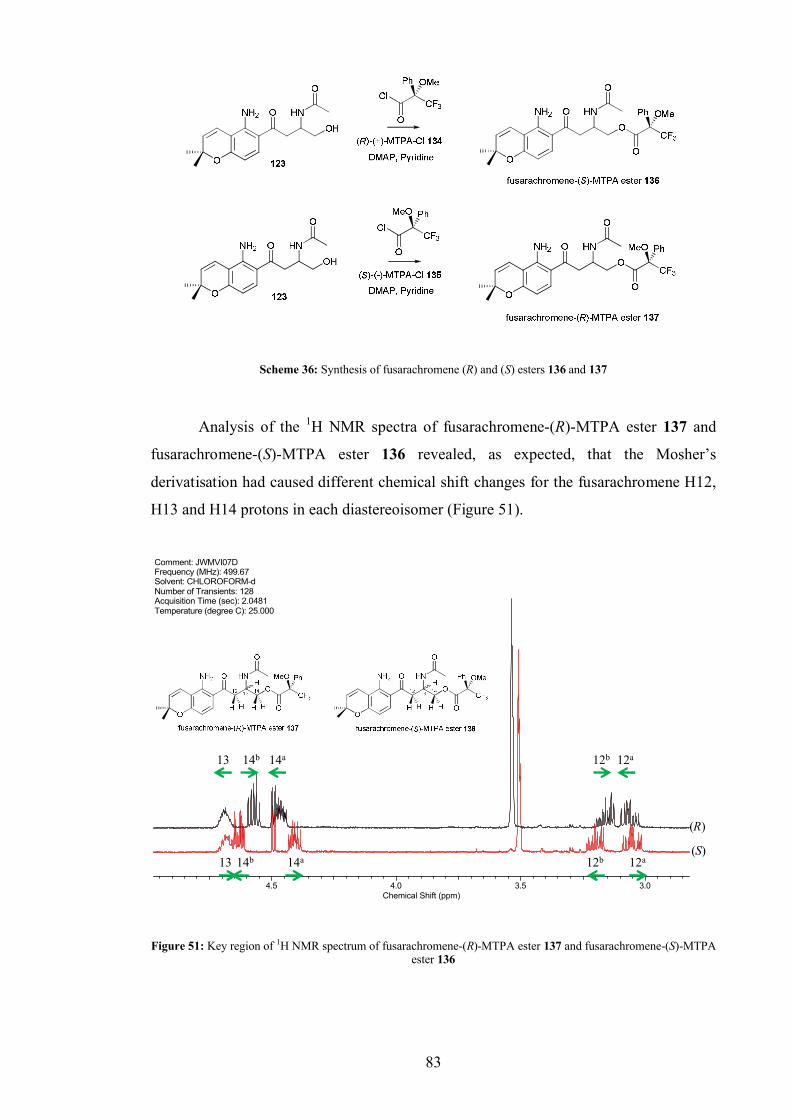
83
Scheme 36: Synthesis of fusarachromene (R) and (S) esters 136 and 137
Analysis of the 1H NMR spectra of fusarachromene-(R)-MTPA ester 137 and
fusarachromene-(S)-MTPA ester 136 revealed, as expected, that the Mosher’s
derivatisation had caused different chemical shift changes for the fusarachromene H12,
H13 and H14 protons in each diastereoisomer (Figure 51).
Comment: JWMVI07DFrequency (MHz): 499.67Solvent: CHLOROFORM-dNumber of Transients: 128Acquisition Time (sec): 2.0481Temperature (degree C): 25.000
4.5 4.0 3.5 3.0Chemical Shift (ppm)
(R)
(S)
13 12b 12a14b 14a
13 12b 12a14b 14a
Figure 51: Key region of 1H NMR spectrum of fusarachromene-(R)-MTPA ester 137 and fusarachromene-(S)-MTPA ester 136
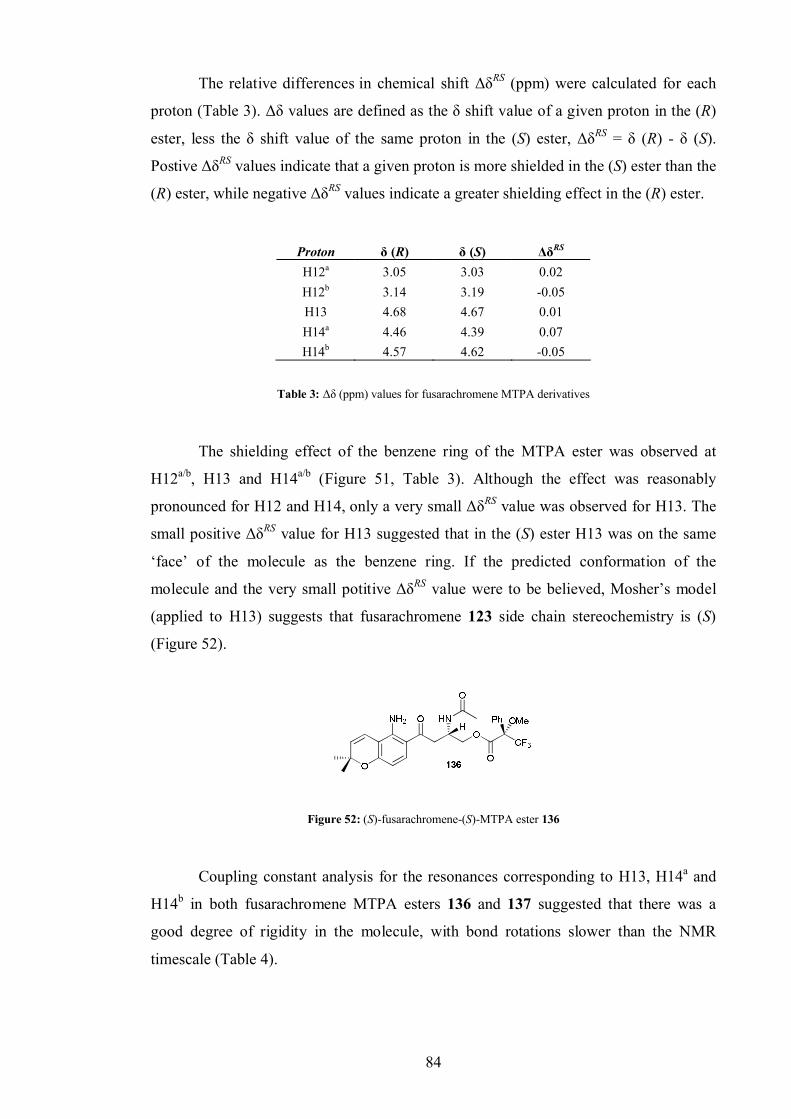
84
The relative differences in chemical shift ΔδRS (ppm) were calculated for each
proton (Table 3). Δδ values are defined as the δ shift value of a given proton in the (R)
ester, less the δ shift value of the same proton in the (S) ester, ΔδRS = δ (R) - δ (S).
Postive ΔδRS values indicate that a given proton is more shielded in the (S) ester than the
(R) ester, while negative ΔδRS values indicate a greater shielding effect in the (R) ester.
Proton δ (R) δ (S) ΔδRS
H12a 3.05 3.03 0.02H12b 3.14 3.19 -0.05H13 4.68 4.67 0.01H14a 4.46 4.39 0.07H14b 4.57 4.62 -0.05
Table 3: Δδ (ppm) values for fusarachromene MTPA derivatives
The shielding effect of the benzene ring of the MTPA ester was observed at
H12a/b, H13 and H14a/b (Figure 51, Table 3). Although the effect was reasonably
pronounced for H12 and H14, only a very small ΔδRS value was observed for H13. The
small positive ΔδRS value for H13 suggested that in the (S) ester H13 was on the same
‘face’ of the molecule as the benzene ring. If the predicted conformation of the
molecule and the very small potitive ΔδRS value were to be believed, Mosher’s model
(applied to H13) suggests that fusarachromene 123 side chain stereochemistry is (S)
(Figure 52).
Figure 52: (S)-fusarachromene-(S)-MTPA ester 136
Coupling constant analysis for the resonances corresponding to H13, H14a and
H14b in both fusarachromene MTPA esters 136 and 137 suggested that there was a
good degree of rigidity in the molecule, with bond rotations slower than the NMR
timescale (Table 4).

85
Fusarachromene (R)-MTPA ester 137 Fusarachromene (S)-MTPA ester 136J (Hz) H13 H14a H12b J (Hz) H13 H14a H12bH13 - 6.0 3.6 H13 - 4.3 5.1H14a 6.0 - 10.9 H14a 4.3 - 10.9H12b 3.6 10.9 - H12b 5.1 10.9 -
Table 4: Coupling constants for H13, H14a and H14b in fusarachromene MTPA esters 137 and 136
Given the fairly rigid nature of fusarachromene MTPA esters 137 and 136, nOes
could be used to investigate the conformation of each compound (Figure 53, Figure 54).
Comment: JWMVI07DFrequency (MHz): 499.67Nucleus: 1HAcquisition Time (sec): 2.0481Number of Transients: 128Solvent: CHLOROFORM-dShort File Name: CHROM_R_ester_NOEs.esp
4.5 4.0 3.5 3.0Chemical Shift (ppm)
H 1 3 H 1 4 b H 1 4 a H 1 2 b H 1 2 a
I r r a d i a t e - H 1 4 a
I r r a d i a t e - H 1 4 b
Figure 53: nOes between H13 and H14a/b in fusarachromene-(R)-MTPA ester 137
Comment: JWMVI07CFrequency (MHz): 499.67Nucleus: 1HAcquisition Time (sec): 4.0962Number of Transients: 128Solvent: CHLOROFORM-dShort File Name: CHROM_S_ester_NOEs.esp
4.5 4.0 3.5 3.0Chemical Shift (ppm)
H 1 3 H 1 4 b H 1 4 a H 1 2 b H 1 2 a
I r r a d i a t e - H 1 4 a
I r r a d i a t e - H 1 4 b
Figure 54: nOes between H13 and H14a/b in fusarachromene-(S)-MTPA ester 136
In both fusarachromene-(R)-MTPA ester 137 and fusarachromene-(S)-MTPA
ester 136 a strong nOe between H13 and H14a were observed (Figure 53, Figure 54). No
positive nOe was observed between H13 and H14b in either ester, which suggested that
H13 and H14a were close in space or on the same ‘face’ of the derivatised chromene in
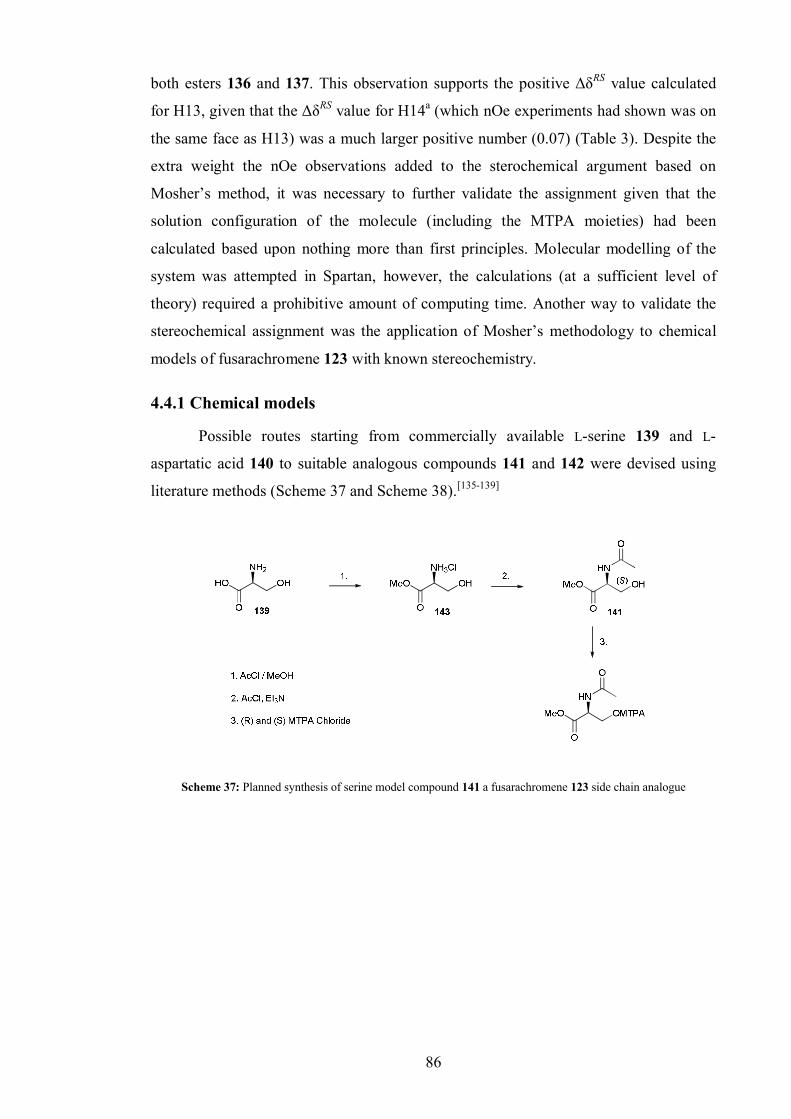
86
both esters 136 and 137. This observation supports the positive ΔδRS value calculated
for H13, given that the ΔδRS value for H14a (which nOe experiments had shown was on
the same face as H13) was a much larger positive number (0.07) (Table 3). Despite the
extra weight the nOe observations added to the sterochemical argument based on
Mosher’s method, it was necessary to further validate the assignment given that the
solution configuration of the molecule (including the MTPA moieties) had been
calculated based upon nothing more than first principles. Molecular modelling of the
system was attempted in Spartan, however, the calculations (at a sufficient level of
theory) required a prohibitive amount of computing time. Another way to validate the
stereochemical assignment was the application of Mosher’s methodology to chemical
models of fusarachromene 123 with known stereochemistry.
4.4.1 Chemical models
Possible routes starting from commercially available L-serine 139 and L-
aspartatic acid 140 to suitable analogous compounds 141 and 142 were devised using
literature methods (Scheme 37 and Scheme 38).[135-139]
Scheme 37: Planned synthesis of serine model compound 141 a fusarachromene 123 side chain analogue
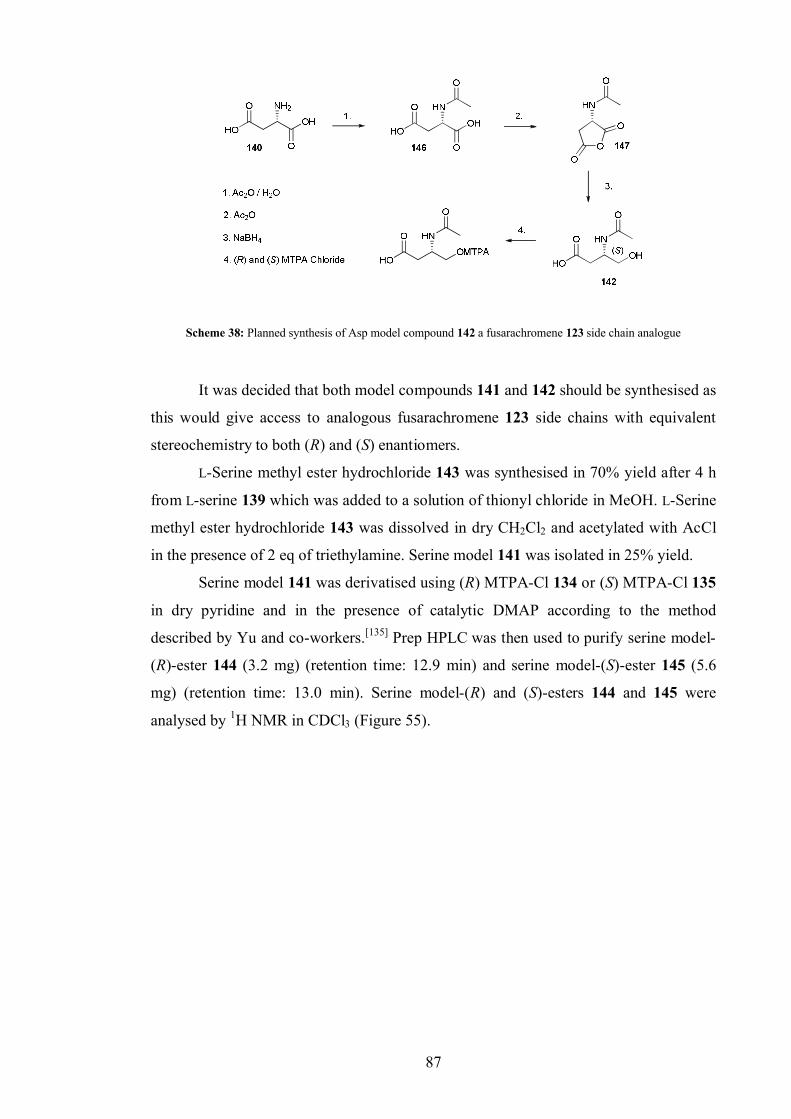
87
Scheme 38: Planned synthesis of Asp model compound 142 a fusarachromene 123 side chain analogue
It was decided that both model compounds 141 and 142 should be synthesised as
this would give access to analogous fusarachromene 123 side chains with equivalent
stereochemistry to both (R) and (S) enantiomers.
L-Serine methyl ester hydrochloride 143 was synthesised in 70% yield after 4 h
from L-serine 139 which was added to a solution of thionyl chloride in MeOH. L-Serine
methyl ester hydrochloride 143 was dissolved in dry CH2Cl2 and acetylated with AcCl
in the presence of 2 eq of triethylamine. Serine model 141 was isolated in 25% yield.
Serine model 141 was derivatised using (R) MTPA-Cl 134 or (S) MTPA-Cl 135
in dry pyridine and in the presence of catalytic DMAP according to the method
described by Yu and co-workers.[135] Prep HPLC was then used to purify serine model-
(R)-ester 144 (3.2 mg) (retention time: 12.9 min) and serine model-(S)-ester 145 (5.6
mg) (retention time: 13.0 min). Serine model-(R) and (S)-esters 144 and 145 were
analysed by 1H NMR in CDCl3 (Figure 55).
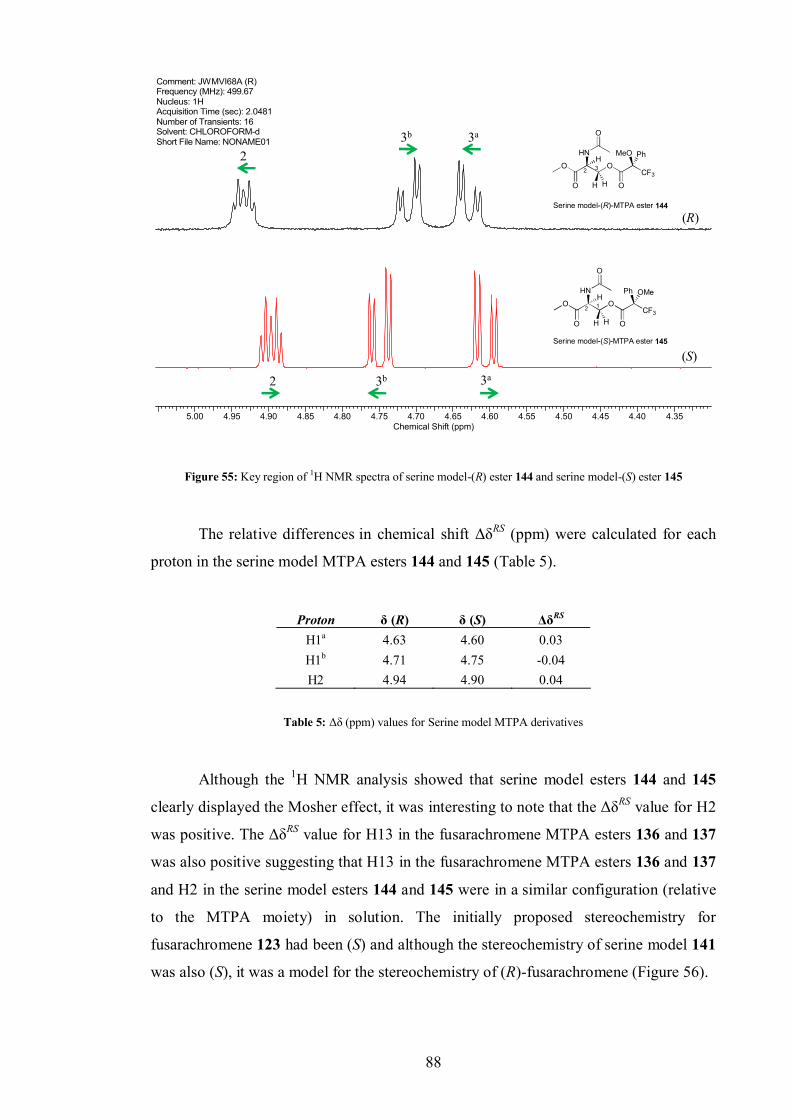
88
Comment: JWMVI68A (R)Frequency (MHz): 499.67Nucleus: 1HAcquisition Time (sec): 2.0481Number of Transients: 16Solvent: CHLOROFORM-dShort File Name: NONAME01
5.00 4.95 4.90 4.85 4.80 4.75 4.70 4.65 4.60 4.55 4.50 4.45 4.40 4.35Chemical Shift (ppm)
Serine model-(S)-MTPA ester 145
Serine model-(R)-MTPA ester 144
O O
HN
O
O
MeO
CF3
Ph
H
3H
2
H
O O
HN
O
O
Ph
CF3
OMe
H
1H
2
H
O
O
(R)
(S)
23b 3a
2 3b 3a
Figure 55: Key region of 1H NMR spectra of serine model-(R) ester 144 and serine model-(S) ester 145
The relative differences in chemical shift ΔδRS (ppm) were calculated for each
proton in the serine model MTPA esters 144 and 145 (Table 5).
Proton δ (R) δ (S) ΔδRS
H1a 4.63 4.60 0.03H1b 4.71 4.75 -0.04H2 4.94 4.90 0.04
Table 5: Δδ (ppm) values for Serine model MTPA derivatives
Although the 1H NMR analysis showed that serine model esters 144 and 145
clearly displayed the Mosher effect, it was interesting to note that the ΔδRS value for H2
was positive. The ΔδRS value for H13 in the fusarachromene MTPA esters 136 and 137
was also positive suggesting that H13 in the fusarachromene MTPA esters 136 and 137
and H2 in the serine model esters 144 and 145 were in a similar configuration (relative
to the MTPA moiety) in solution. The initially proposed stereochemistry for
fusarachromene 123 had been (S) and although the stereochemistry of serine model 141
was also (S), it was a model for the stereochemistry of (R)-fusarachromene (Figure 56).
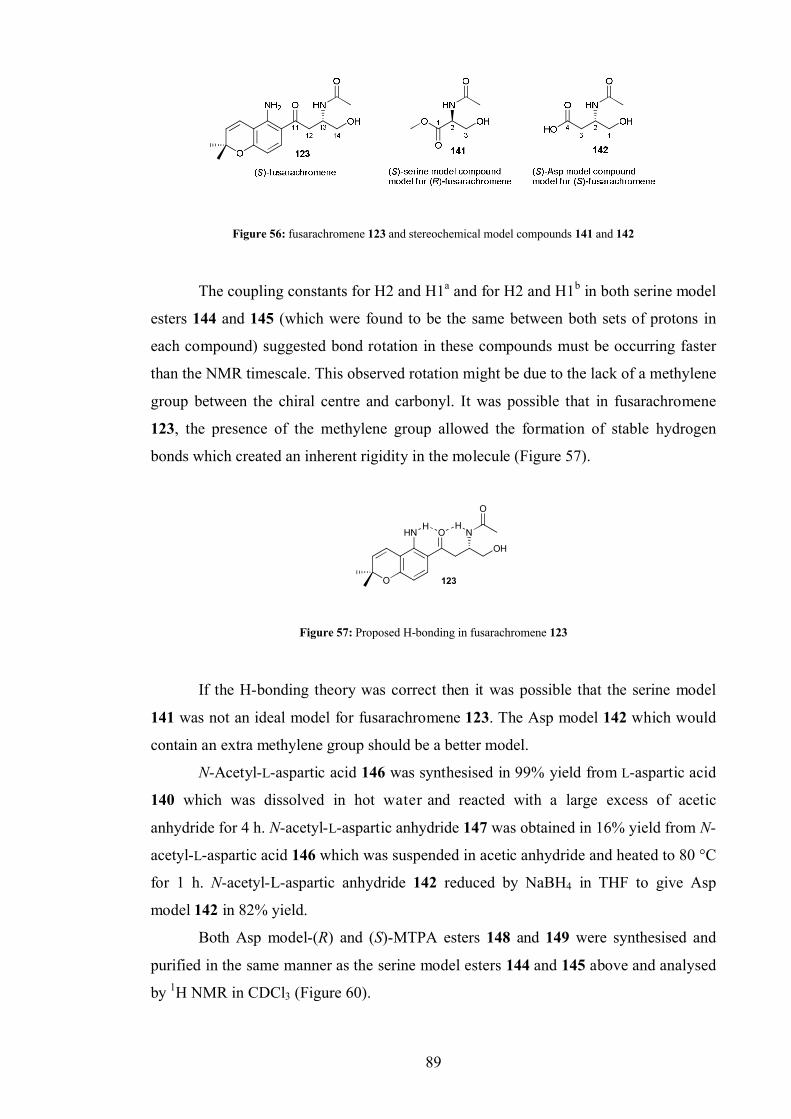
89
Figure 56: fusarachromene 123 and stereochemical model compounds 141 and 142
The coupling constants for H2 and H1a and for H2 and H1b in both serine model
esters 144 and 145 (which were found to be the same between both sets of protons in
each compound) suggested bond rotation in these compounds must be occurring faster
than the NMR timescale. This observed rotation might be due to the lack of a methylene
group between the chiral centre and carbonyl. It was possible that in fusarachromene
123, the presence of the methylene group allowed the formation of stable hydrogen
bonds which created an inherent rigidity in the molecule (Figure 57).
123O
HN O
OH
N
O
HH
Figure 57: Proposed H-bonding in fusarachromene 123
If the H-bonding theory was correct then it was possible that the serine model
141 was not an ideal model for fusarachromene 123. The Asp model 142 which would
contain an extra methylene group should be a better model.
N-Acetyl-L-aspartic acid 146 was synthesised in 99% yield from L-aspartic acid
140 which was dissolved in hot water and reacted with a large excess of acetic
anhydride for 4 h. N-acetyl-L-aspartic anhydride 147 was obtained in 16% yield from N-
acetyl-L-aspartic acid 146 which was suspended in acetic anhydride and heated to 80 °C
for 1 h. N-acetyl-L-aspartic anhydride 142 reduced by NaBH4 in THF to give Asp
model 142 in 82% yield.
Both Asp model-(R) and (S)-MTPA esters 148 and 149 were synthesised and
purified in the same manner as the serine model esters 144 and 145 above and analysed
by 1H NMR in CDCl3 (Figure 60).
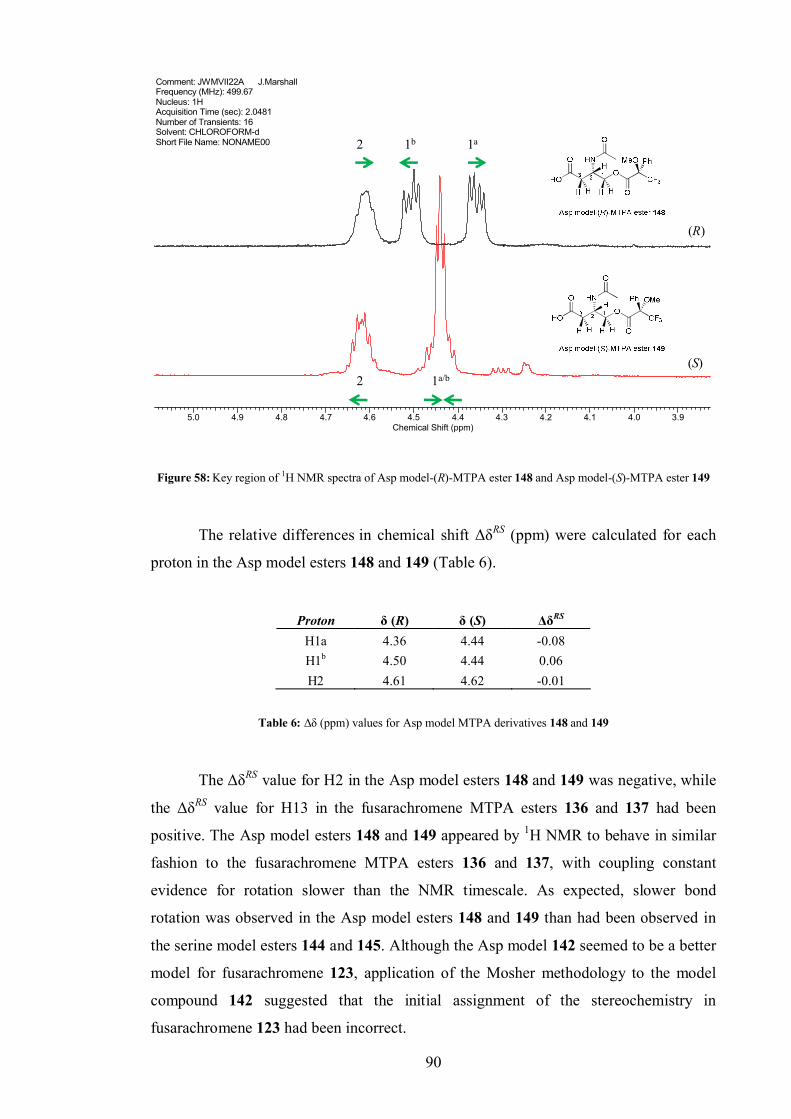
90
(R)
(S)
Comment: JWMVII22A J.MarshallFrequency (MHz): 499.67Nucleus: 1HAcquisition Time (sec): 2.0481Number of Transients: 16Solvent: CHLOROFORM-dShort File Name: NONAME00
5.0 4.9 4.8 4.7 4.6 4.5 4.4 4.3 4.2 4.1 4.0 3.9Chemical Shift (ppm)
2 1b 1a
2 1a/b
Figure 58: Key region of 1H NMR spectra of Asp model-(R)-MTPA ester 148 and Asp model-(S)-MTPA ester 149
The relative differences in chemical shift ΔδRS (ppm) were calculated for each
proton in the Asp model esters 148 and 149 (Table 6).
Proton δ (R) δ (S) ΔδRS
H1a 4.36 4.44 -0.08H1b 4.50 4.44 0.06H2 4.61 4.62 -0.01
Table 6: Δδ (ppm) values for Asp model MTPA derivatives 148 and 149
The ΔδRS value for H2 in the Asp model esters 148 and 149 was negative, while
the ΔδRS value for H13 in the fusarachromene MTPA esters 136 and 137 had been
positive. The Asp model esters 148 and 149 appeared by 1H NMR to behave in similar
fashion to the fusarachromene MTPA esters 136 and 137, with coupling constant
evidence for rotation slower than the NMR timescale. As expected, slower bond
rotation was observed in the Asp model esters 148 and 149 than had been observed in
the serine model esters 144 and 145. Although the Asp model 142 seemed to be a better
model for fusarachromene 123, application of the Mosher methodology to the model
compound 142 suggested that the initial assignment of the stereochemistry in
fusarachromene 123 had been incorrect.
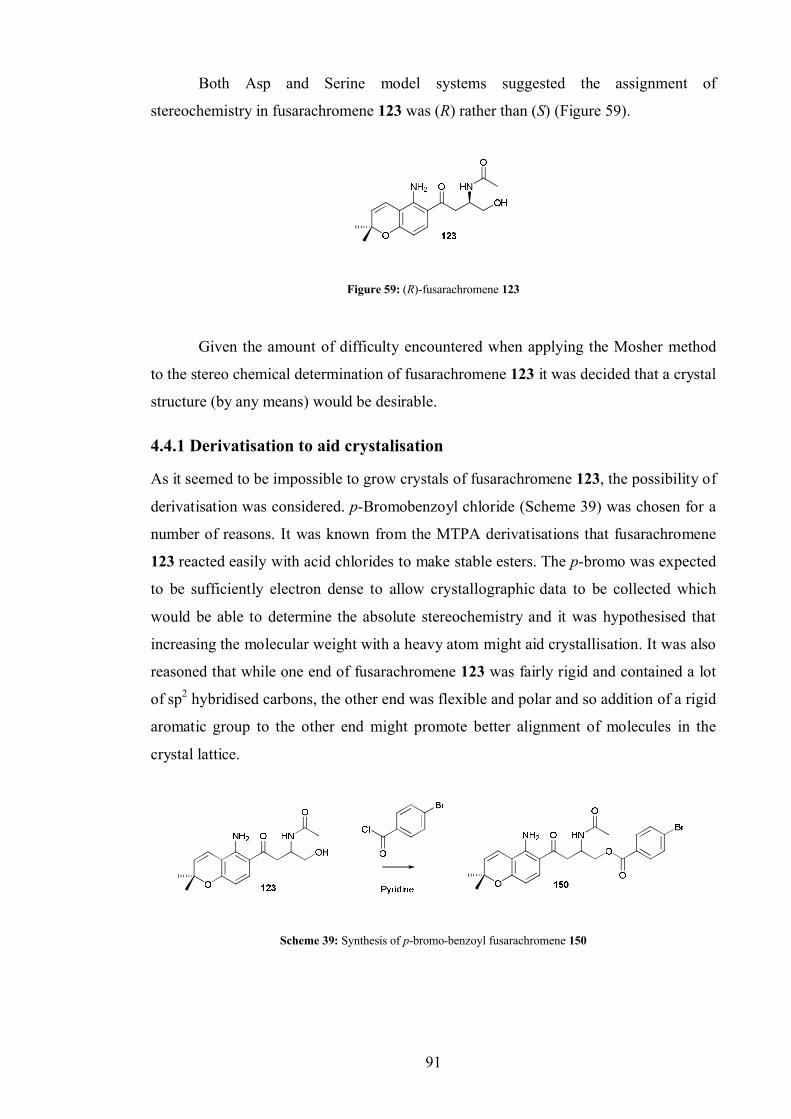
91
Both Asp and Serine model systems suggested the assignment of
stereochemistry in fusarachromene 123 was (R) rather than (S) (Figure 59).
Figure 59: (R)-fusarachromene 123
Given the amount of difficulty encountered when applying the Mosher method
to the stereo chemical determination of fusarachromene 123 it was decided that a crystal
structure (by any means) would be desirable.
4.4.1 Derivatisation to aid crystalisation
As it seemed to be impossible to grow crystals of fusarachromene 123, the possibility of
derivatisation was considered. p-Bromobenzoyl chloride (Scheme 39) was chosen for a
number of reasons. It was known from the MTPA derivatisations that fusarachromene
123 reacted easily with acid chlorides to make stable esters. The p-bromo was expected
to be sufficiently electron dense to allow crystallographic data to be collected which
would be able to determine the absolute stereochemistry and it was hypothesised that
increasing the molecular weight with a heavy atom might aid crystallisation. It was also
reasoned that while one end of fusarachromene 123 was fairly rigid and contained a lot
of sp2 hybridised carbons, the other end was flexible and polar and so addition of a rigid
aromatic group to the other end might promote better alignment of molecules in the
crystal lattice.
Scheme 39: Synthesis of p-bromo-benzoyl fusarachromene 150
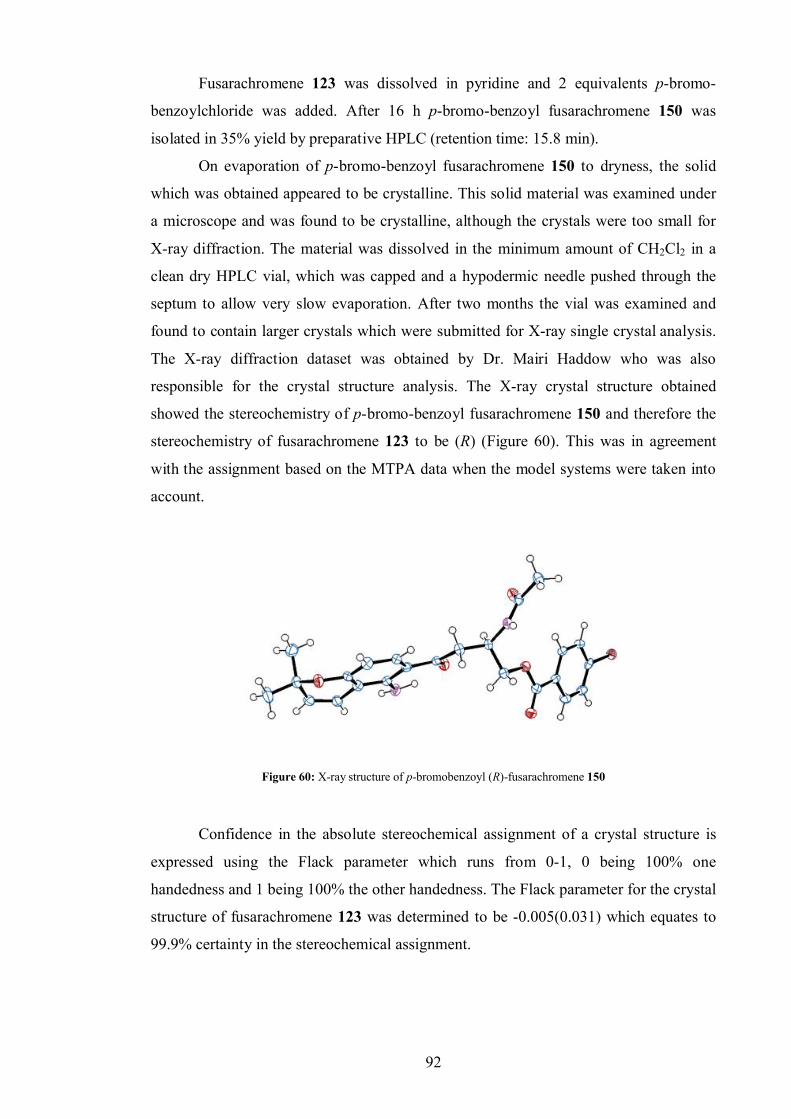
92
Fusarachromene 123 was dissolved in pyridine and 2 equivalents p-bromo-
benzoylchloride was added. After 16 h p-bromo-benzoyl fusarachromene 150 was
isolated in 35% yield by preparative HPLC (retention time: 15.8 min).
On evaporation of p-bromo-benzoyl fusarachromene 150 to dryness, the solid
which was obtained appeared to be crystalline. This solid material was examined under
a microscope and was found to be crystalline, although the crystals were too small for
X-ray diffraction. The material was dissolved in the minimum amount of CH2Cl2 in a
clean dry HPLC vial, which was capped and a hypodermic needle pushed through the
septum to allow very slow evaporation. After two months the vial was examined and
found to contain larger crystals which were submitted for X-ray single crystal analysis.
The X-ray diffraction dataset was obtained by Dr. Mairi Haddow who was also
responsible for the crystal structure analysis. The X-ray crystal structure obtained
showed the stereochemistry of p-bromo-benzoyl fusarachromene 150 and therefore the
stereochemistry of fusarachromene 123 to be (R) (Figure 60). This was in agreement
with the assignment based on the MTPA data when the model systems were taken into
account.
Figure 60: X-ray structure of p-bromobenzoyl (R)-fusarachromene 150
Confidence in the absolute stereochemical assignment of a crystal structure is
expressed using the Flack parameter which runs from 0-1, 0 being 100% one
handedness and 1 being 100% the other handedness. The Flack parameter for the crystal
structure of fusarachromene 123 was determined to be -0.005(0.031) which equates to
99.9% certainty in the stereochemical assignment.
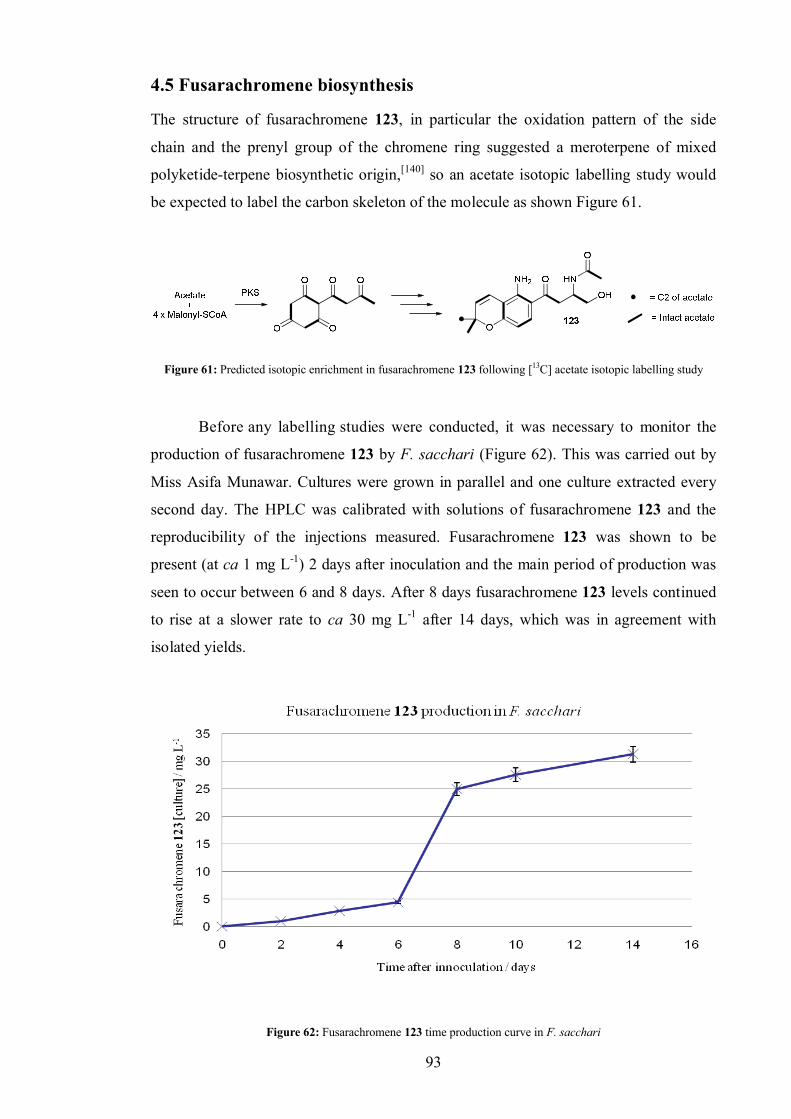
93
4.5 Fusarachromene biosynthesis
The structure of fusarachromene 123, in particular the oxidation pattern of the side
chain and the prenyl group of the chromene ring suggested a meroterpene of mixed
polyketide-terpene biosynthetic origin,[140] so an acetate isotopic labelling study would
be expected to label the carbon skeleton of the molecule as shown Figure 61.
Figure 61: Predicted isotopic enrichment in fusarachromene 123 following [13C] acetate isotopic labelling study
Before any labelling studies were conducted, it was necessary to monitor the
production of fusarachromene 123 by F. sacchari (Figure 62). This was carried out by
Miss Asifa Munawar. Cultures were grown in parallel and one culture extracted every
second day. The HPLC was calibrated with solutions of fusarachromene 123 and the
reproducibility of the injections measured. Fusarachromene 123 was shown to be
present (at ca 1 mg L-1) 2 days after inoculation and the main period of production was
seen to occur between 6 and 8 days. After 8 days fusarachromene 123 levels continued
to rise at a slower rate to ca 30 mg L-1 after 14 days, which was in agreement with
isolated yields.
Figure 62: Fusarachromene 123 time production curve in F. sacchari
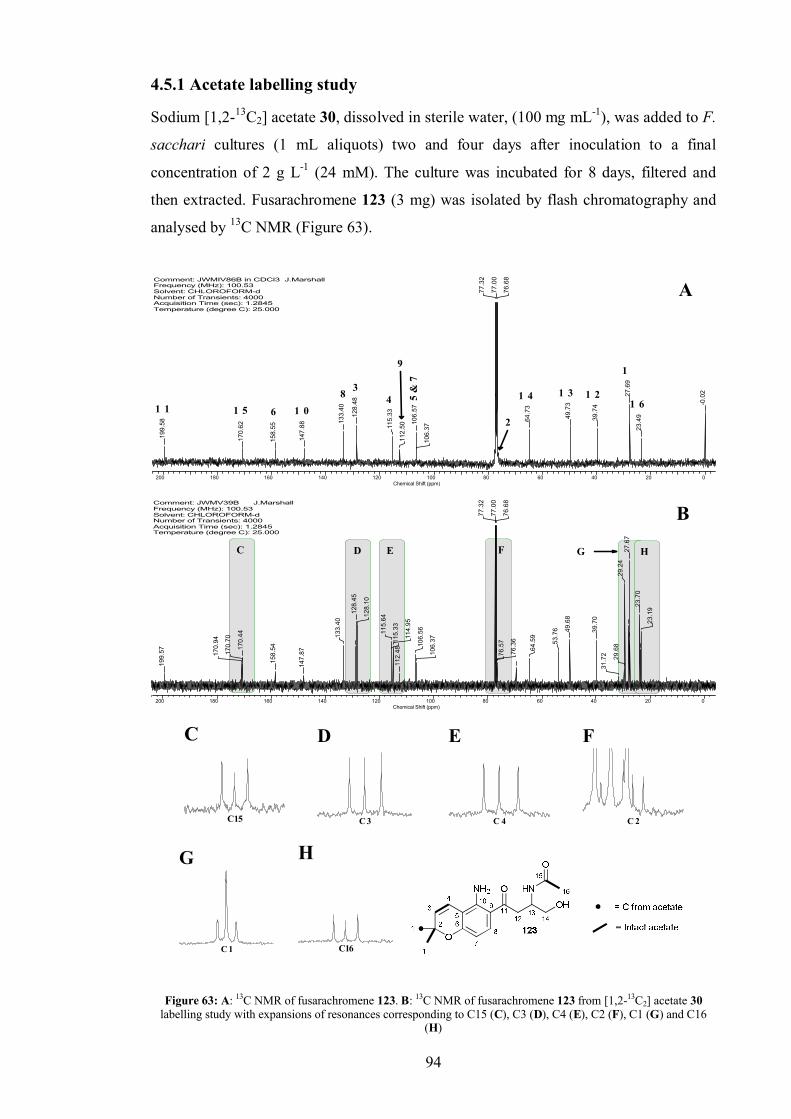
94
4.5.1 Acetate labelling study
Sodium [1,2-13C2] acetate 30, dissolved in sterile water, (100 mg mL-1), was added to F.
sacchari cultures (1 mL aliquots) two and four days after inoculation to a final
concentration of 2 g L-1 (24 mM). The culture was incubated for 8 days, filtered and
then extracted. Fusarachromene 123 (3 mg) was isolated by flash chromatography and
analysed by 13C NMR (Figure 63).
Comment: JWMIV86B in CDCl3 J.MarshallFrequency (MHz): 100.53Solvent: CHLOROFORM-dNumber of Transients: 4000Acquisition Time (sec): 1.2845Temperature (degree C): 25.000
200 180 160 140 120 100 80 60 40 20 0Chemical Shift (ppm)
-0.0
2
23.4
9
27.6
9
39.7
4
49.7
3
64.7
3
76.6
8
77.0
0
77.3
2
106.
37
106.
57
112.
50115.
33128.
48
133.
40
147.
88
158.
55
170.
62
199.
58
1
1 61 21 31 45
& 7
2
4
9
381 061 51 1
A
C D E F H
Comment: JWMV39B J.MarshallFrequency (MHz): 100.53Solvent: CHLOROFORM-dNumber of Transients: 4000Acquisition Time (sec): 1.2845Temperature (degree C): 25.000
200 180 160 140 120 100 80 60 40 20 0Chemical Shift (ppm)
23.1
923.7
027
.67
29.2
429
.68
31.7
239
.70
49.6
8
53.7
6
64.5
9
76.3
6
76.5
776
.68
77.0
0
77.3
2
106.
37
106.
56
112.
4811
4.95
115.
33115.
64128.
10
128.
45
133.
40
147.
87
158.
54170.
44
170.
70
170.
94
199.
57
B
G
Comment: JWMV39B J.MarshallFrequency (MHz): 100.53Nucleus: 13CAcquisition Time (sec): 1.2845Number of Transients: 604Solvent: CHLOROFORM-d
C 1 5
C
Comment: JWMV39B J.MarshallFrequency (MHz): 100.53Nucleus: 13CAcquisition Time (sec): 1.2845Number of Transients: 604Solvent: CHLOROFORM-d
C 3
D
Comment: JWMV39B J.MarshallFrequency (MHz): 100.53Nucleus: 13CAcquisition Time (sec): 1.2845Number of Transients: 604Solvent: CHLOROFORM-dE
C 4
Comment: JWMV39B J.MarshallFrequency (MHz): 100.53Nucleus: 13CAcquisition Time (sec): 1.2845Number of Transients: 604Solvent: CHLOROFORM-dF
C 2
Comment: JWMV39B J.MarshallFrequency (MHz): 100.53Nucleus: 13CAcquisition Time (sec): 1.2845Number of Transients: 604Solvent: CHLOROFORM-dG
C 1
Comment: JWMV39B J.MarshallFrequency (MHz): 100.53Nucleus: 13CAcquisition Time (sec): 1.2845Number of Transients: 604Solvent: CHLOROFORM-d
C 1 6
H
Figure 63: A: 13C NMR of fusarachromene 123. B: 13C NMR of fusarachromene 123 from [1,2-13C2] acetate 30labelling study with expansions of resonances corresponding to C15 (C), C3 (D), C4 (E), C2 (F), C1 (G) and C16
(H)
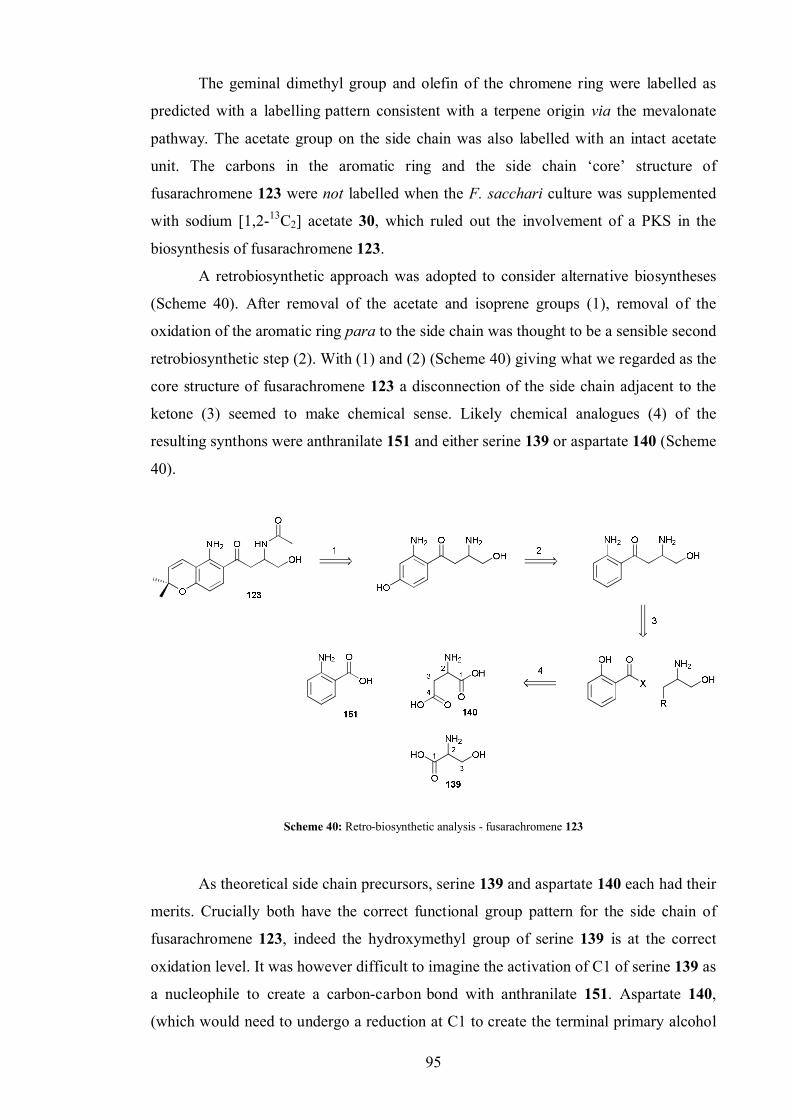
95
The geminal dimethyl group and olefin of the chromene ring were labelled as
predicted with a labelling pattern consistent with a terpene origin via the mevalonate
pathway. The acetate group on the side chain was also labelled with an intact acetate
unit. The carbons in the aromatic ring and the side chain ‘core’ structure of
fusarachromene 123 were not labelled when the F. sacchari culture was supplemented
with sodium [1,2-13C2] acetate 30, which ruled out the involvement of a PKS in the
biosynthesis of fusarachromene 123.
A retrobiosynthetic approach was adopted to consider alternative biosyntheses
(Scheme 40). After removal of the acetate and isoprene groups (1), removal of the
oxidation of the aromatic ring para to the side chain was thought to be a sensible second
retrobiosynthetic step (2). With (1) and (2) (Scheme 40) giving what we regarded as the
core structure of fusarachromene 123 a disconnection of the side chain adjacent to the
ketone (3) seemed to make chemical sense. Likely chemical analogues (4) of the
resulting synthons were anthranilate 151 and either serine 139 or aspartate 140 (Scheme
40).
Scheme 40: Retro-biosynthetic analysis - fusarachromene 123
As theoretical side chain precursors, serine 139 and aspartate 140 each had their
merits. Crucially both have the correct functional group pattern for the side chain of
fusarachromene 123, indeed the hydroxymethyl group of serine 139 is at the correct
oxidation level. It was however difficult to imagine the activation of C1 of serine 139 as
a nucleophile to create a carbon-carbon bond with anthranilate 151. Aspartate 140,
(which would need to undergo a reduction at C1 to create the terminal primary alcohol
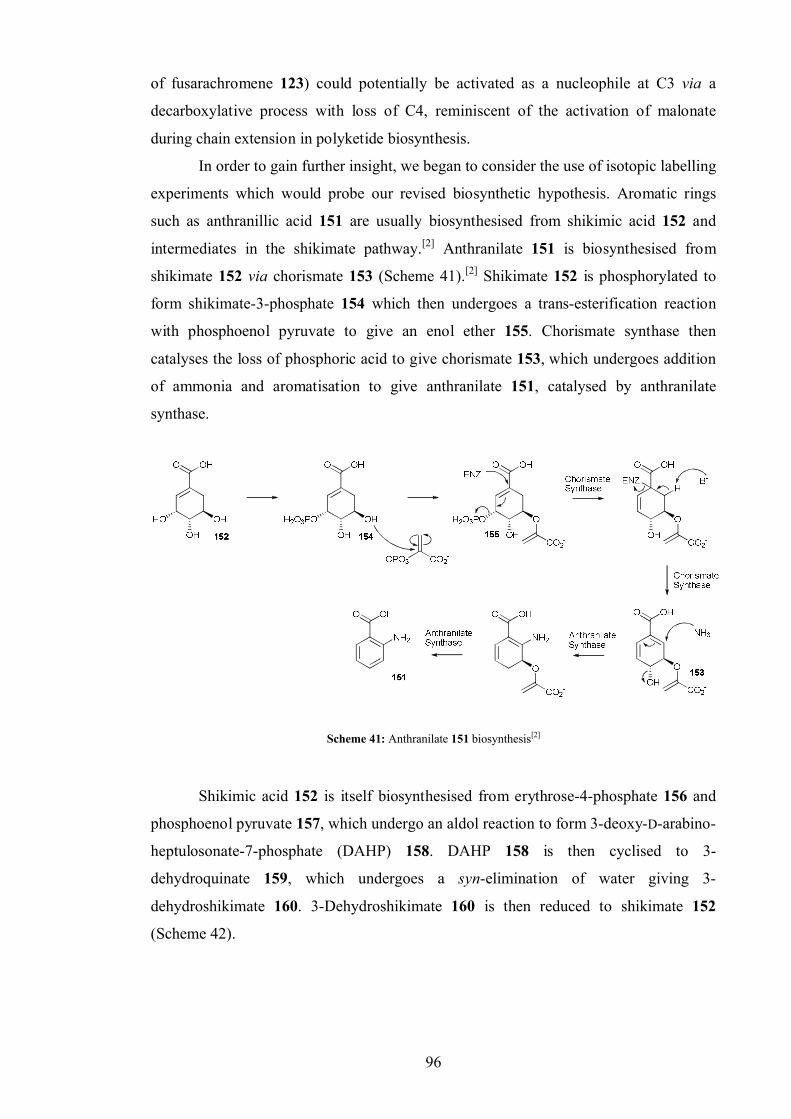
96
of fusarachromene 123) could potentially be activated as a nucleophile at C3 via a
decarboxylative process with loss of C4, reminiscent of the activation of malonate
during chain extension in polyketide biosynthesis.
In order to gain further insight, we began to consider the use of isotopic labelling
experiments which would probe our revised biosynthetic hypothesis. Aromatic rings
such as anthranillic acid 151 are usually biosynthesised from shikimic acid 152 and
intermediates in the shikimate pathway.[2] Anthranilate 151 is biosynthesised from
shikimate 152 via chorismate 153 (Scheme 41).[2] Shikimate 152 is phosphorylated to
form shikimate-3-phosphate 154 which then undergoes a trans-esterification reaction
with phosphoenol pyruvate to give an enol ether 155. Chorismate synthase then
catalyses the loss of phosphoric acid to give chorismate 153, which undergoes addition
of ammonia and aromatisation to give anthranilate 151, catalysed by anthranilate
synthase.
Scheme 41: Anthranilate 151 biosynthesis[2]
Shikimic acid 152 is itself biosynthesised from erythrose-4-phosphate 156 and
phosphoenol pyruvate 157, which undergo an aldol reaction to form 3-deoxy-D-arabino-
heptulosonate-7-phosphate (DAHP) 158. DAHP 158 is then cyclised to 3-
dehydroquinate 159, which undergoes a syn-elimination of water giving 3-
dehydroshikimate 160. 3-Dehydroshikimate 160 is then reduced to shikimate 152
(Scheme 42).

97
Scheme 42: Biosynthesis of shikimate 152
Since shikimate 152 and the intermediates of the shikimate pathway are
biosynthesised from erythrose-4-phosphate 156 and phosphoenol pyruvate 157 which
are products of primary metabolism, a labelling experiment designed to tap into primary
metabolism was needed. Classically this would be done using [U-13C6] glucose 161,[141]
which should also provide information on the amino acid involved, so the biosynthetic
origin of both the aromatic ring and side chain could be investigated in a single
experiment. Given that [U-13C6] glucose 161 supplementation would produce a
complicated labelling pattern, a detailed analysis of the hypothetically involved
metabolic pathways was conducted and the isotopic label from [U-13C6] glucose 161
tracked through to shikimate 152, aspartate 140 and serine 139 (Scheme 43, Scheme 44,
Scheme 45, Scheme 46, Scheme 47).[2, 142, 143]
Glucose-6-phosphate 162 (Scheme 43), is oxidised to 6-phosphoglucono-δ-
lactone 163. 6-Phosphoglucono-δ-lactone 163 is then hydrolysed to 6-phosphogluconate
164 which undergoes an oxidation followed by a decarboxylation giving ribulose-5-
phosphate 165. Ribulose-5-phosphate 165 is isomerised to ribose-5-phosphate 166
which can be further isomerised to xyulose-5-phosphate 167. Ribose-5-phosphate 267
and xyulose-5-phosphate 167 then enter the pentose phosphate pathway (PPP) which
shuffles carbon units between phosphorylated sugars giving first glyceraldehyde-3-
phosphate (GAP) 168 and seduheptulose-7-phosphate 169 and then fructose-6-
phosphate 170 and erythrose-4-phosphate 156 which contain an intact C3 unit and a
single isotopic enrichment at C1 (Scheme 43).
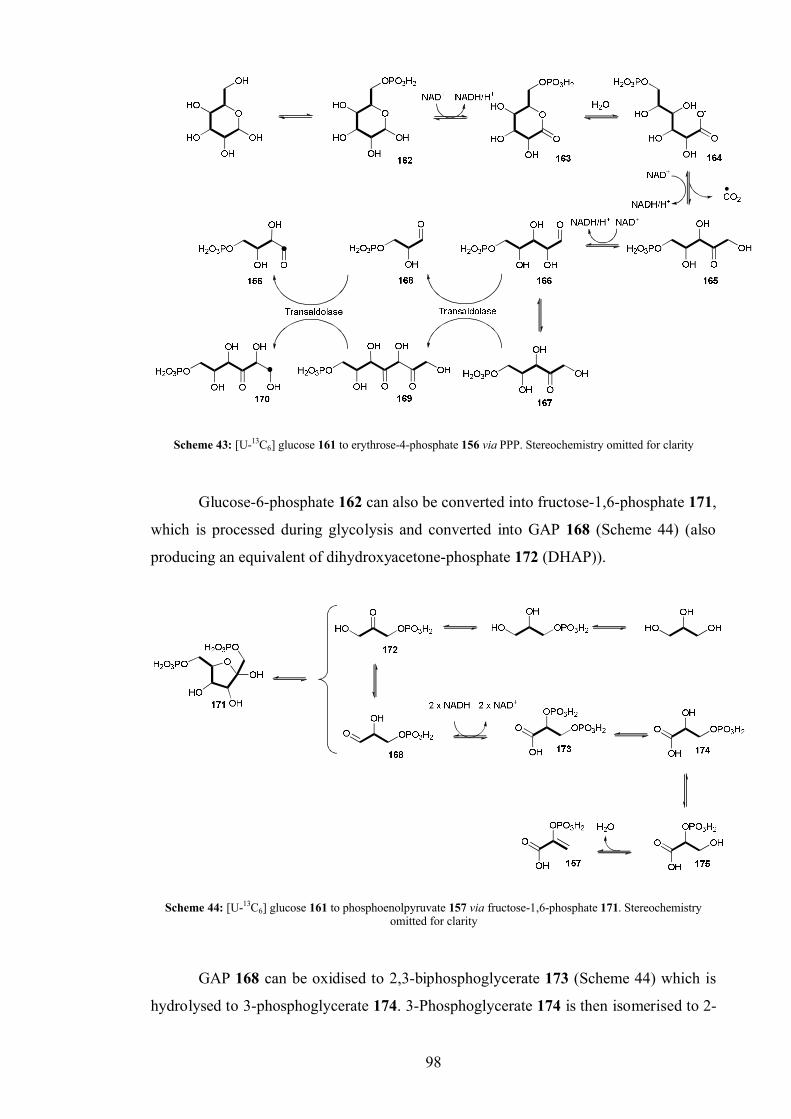
98
Scheme 43: [U-13C6] glucose 161 to erythrose-4-phosphate 156 via PPP. Stereochemistry omitted for clarity
Glucose-6-phosphate 162 can also be converted into fructose-1,6-phosphate 171,
which is processed during glycolysis and converted into GAP 168 (Scheme 44) (also
producing an equivalent of dihydroxyacetone-phosphate 172 (DHAP)).
Scheme 44: [U-13C6] glucose 161 to phosphoenolpyruvate 157 via fructose-1,6-phosphate 171. Stereochemistry omitted for clarity
GAP 168 can be oxidised to 2,3-biphosphoglycerate 173 (Scheme 44) which is
hydrolysed to 3-phosphoglycerate 174. 3-Phosphoglycerate 174 is then isomerised to 2-
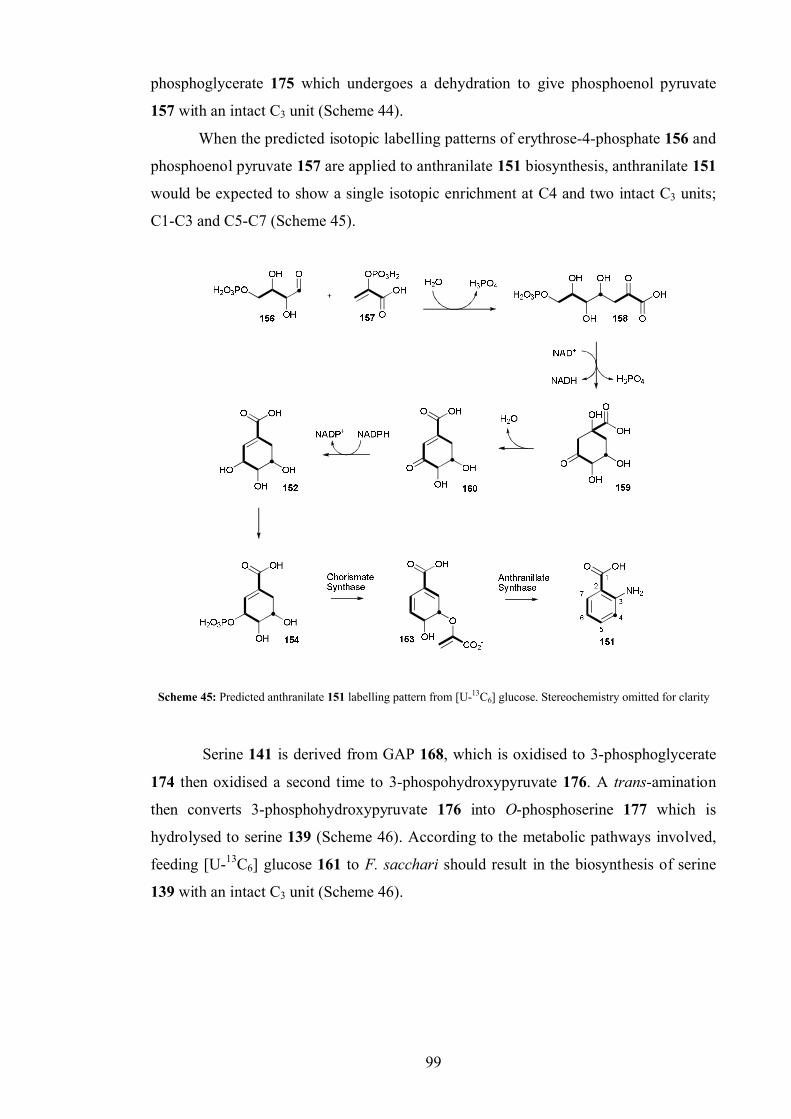
99
phosphoglycerate 175 which undergoes a dehydration to give phosphoenol pyruvate
157 with an intact C3 unit (Scheme 44).
When the predicted isotopic labelling patterns of erythrose-4-phosphate 156 and
phosphoenol pyruvate 157 are applied to anthranilate 151 biosynthesis, anthranilate 151
would be expected to show a single isotopic enrichment at C4 and two intact C3 units;
C1-C3 and C5-C7 (Scheme 45).
Scheme 45: Predicted anthranilate 151 labelling pattern from [U-13C6] glucose. Stereochemistry omitted for clarity
Serine 141 is derived from GAP 168, which is oxidised to 3-phosphoglycerate
174 then oxidised a second time to 3-phospohydroxypyruvate 176. A trans-amination
then converts 3-phosphohydroxypyruvate 176 into O-phosphoserine 177 which is
hydrolysed to serine 139 (Scheme 46). According to the metabolic pathways involved,
feeding [U-13C6] glucose 161 to F. sacchari should result in the biosynthesis of serine
139 with an intact C3 unit (Scheme 46).
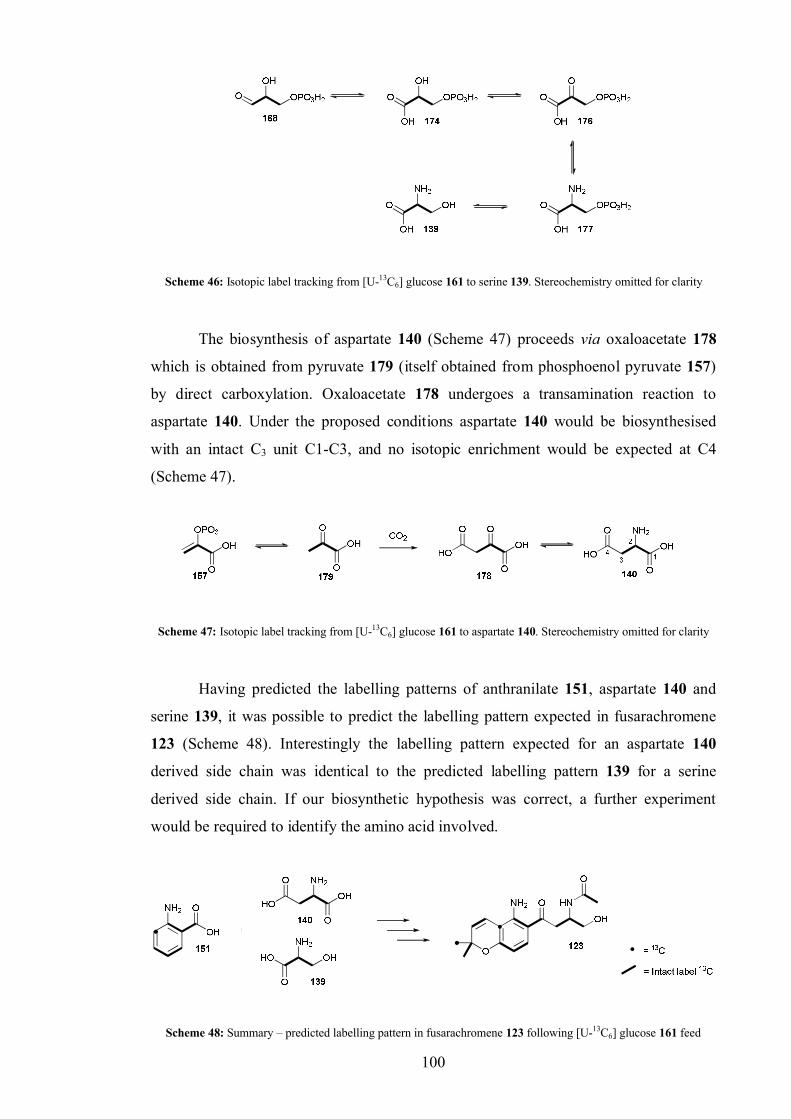
100
Scheme 46: Isotopic label tracking from [U-13C6] glucose 161 to serine 139. Stereochemistry omitted for clarity
The biosynthesis of aspartate 140 (Scheme 47) proceeds via oxaloacetate 178
which is obtained from pyruvate 179 (itself obtained from phosphoenol pyruvate 157)
by direct carboxylation. Oxaloacetate 178 undergoes a transamination reaction to
aspartate 140. Under the proposed conditions aspartate 140 would be biosynthesised
with an intact C3 unit C1-C3, and no isotopic enrichment would be expected at C4
(Scheme 47).
Scheme 47: Isotopic label tracking from [U-13C6] glucose 161 to aspartate 140. Stereochemistry omitted for clarity
Having predicted the labelling patterns of anthranilate 151, aspartate 140 and
serine 139, it was possible to predict the labelling pattern expected in fusarachromene
123 (Scheme 48). Interestingly the labelling pattern expected for an aspartate 140
derived side chain was identical to the predicted labelling pattern 139 for a serine
derived side chain. If our biosynthetic hypothesis was correct, a further experiment
would be required to identify the amino acid involved.
Scheme 48: Summary – predicted labelling pattern in fusarachromene 123 following [U-13C6] glucose 161 feed
101
4.5.2 [U-13C6]-Glucose labelling study
Given that an isotopically labelled sugar would have to be processed in primary
metabolic pathways before the carbon could be used in secondary metabolite
production, [U-13C6] Glucose 161 was added early in the fermentation to ensure the
greatest chance of incorporation at a detectable level, given relatively large quantities
(30 g L-1) of unlabelled sucrose (a disaccharide of glucose and fructose) which would
also be present as a component of the culture medium.
[U-13C6] Glucose 161, as a stock solution (50 mg mL-1 in sterile water) was
added (1 mL aliquots) to cultures of F. sacchari 4 and 20 h after inoculation to a final
concentration of 1 g L-1 (5.6 mM). The culture was incubated for 8 days, filtered and
then extracted. On analysis of the crude extract it was noticed that fusarachromene 123
production was much lower in the labelling study culture than in the control culture.
Fusarachromene 123 (0.1 mg) was isolated by preparative HPLC and analysed by 13C
NMR. Unfortunately under standard conditions no 13C NMR spectrum of the sample
could be obtained. The spectrum was re-acquired on a 600 MHz NMR spectrometer
equipped with a cryogenically cooled probe. After 32000 scans many of the resonances
(in particular those corresponding to the quaternary carbons in the chromene ring) were
still absent. The resulting spectrum was compared to a reference spectrum to see what
information could be obtained (Figure 64).
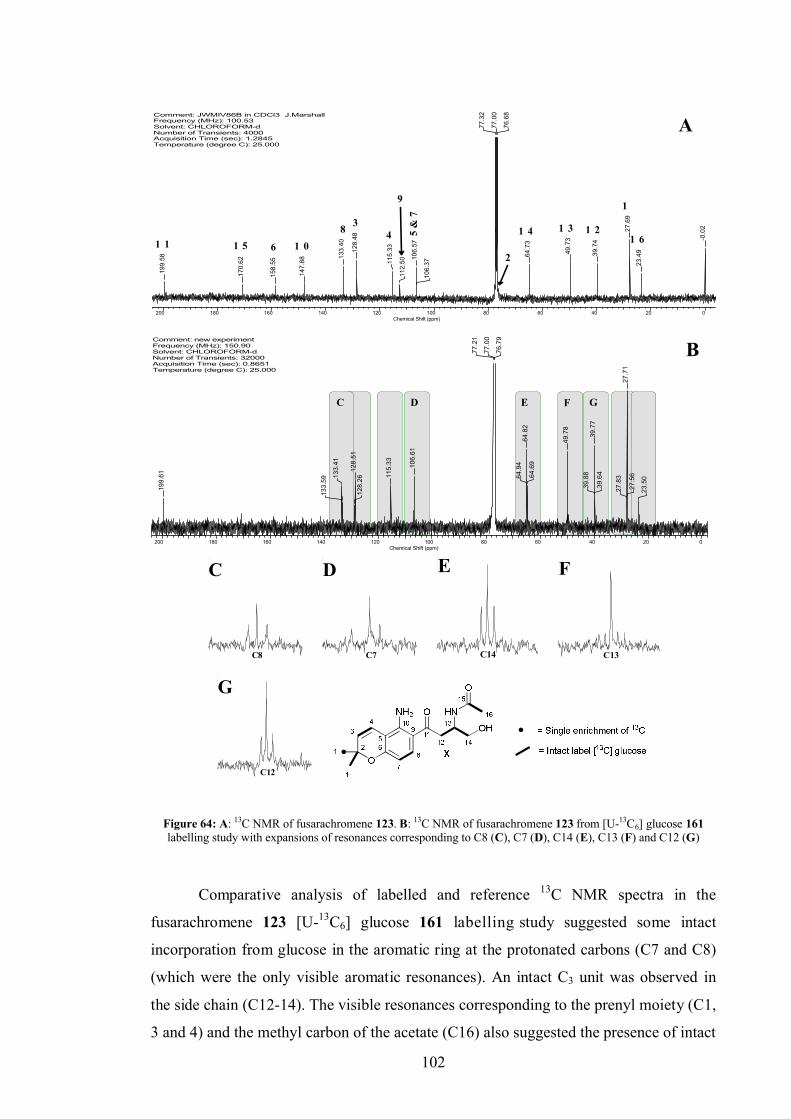
102
Comment: JWMIV86B in CDCl3 J.MarshallFrequency (MHz): 100.53Solvent: CHLOROFORM-dNumber of Transients: 4000Acquisition Time (sec): 1.2845Temperature (degree C): 25.000
200 180 160 140 120 100 80 60 40 20 0Chemical Shift (ppm)
-0.0
2
23.4
9
27.6
9
39.7
4
49.7
3
64.7
3
76.6
8
77.0
0
77.3
2
106.
37
106.
57
112.
50115.
33128.
48
133.
40
147.
88
158.
55
170.
62
199.
58
1
1 61 21 31 45
& 7
2
4
9
381 061 51 1
A
Comment: new experimentFrequency (MHz): 150.90Solvent: CHLOROFORM-dNumber of Transients: 32000Acquisition Time (sec): 0.8651Temperature (degree C): 25.000
200 180 160 140 120 100 80 60 40 20 0Chemical Shift (ppm)
23.5
0
27.5
627
.71
27.8
3
39.6
439
.77
39.8
8
49.7
8
64.6
964
.82
64.9
4
76.7
9
77.0
0
77.2
1
106.
61
115.
33
128.
2612
8.51
133.
41
133.
59
199.
61
B
C D E F G
Comment: new experimentFrequency (MHz): 150.90Nucleus: 13CAcquisition Time (sec): 0.8651Number of Transients: 32000Solvent: CHLOROFORM-d
C 8
C
Comment: new experimentFrequency (MHz): 150.90Nucleus: 13CAcquisition Time (sec): 0.8651Number of Transients: 32000Solvent: CHLOROFORM-d
C 7
D
Comment: new experimentFrequency (MHz): 150.90Nucleus: 13CAcquisition Time (sec): 0.8651Number of Transients: 32000Solvent: CHLOROFORM-d
C 1 4
E
Comment: new experimentFrequency (MHz): 150.90Nucleus: 13CAcquisition Time (sec): 0.8651Number of Transients: 32000Solvent: CHLOROFORM-d
C 1 3
F
Comment: new experimentFrequency (MHz): 150.90Nucleus: 13CAcquisition Time (sec): 0.8651Number of Transients: 32000Solvent: CHLOROFORM-d
C 1 2
G
Figure 64: A: 13C NMR of fusarachromene 123. B: 13C NMR of fusarachromene 123 from [U-13C6] glucose 161labelling study with expansions of resonances corresponding to C8 (C), C7 (D), C14 (E), C13 (F) and C12 (G)
Comparative analysis of labelled and reference 13C NMR spectra in the
fusarachromene 123 [U-13C6] glucose 161 labelling study suggested some intact
incorporation from glucose in the aromatic ring at the protonated carbons (C7 and C8)
(which were the only visible aromatic resonances). An intact C3 unit was observed in
the side chain (C12-14). The visible resonances corresponding to the prenyl moiety (C1,
3 and 4) and the methyl carbon of the acetate (C16) also suggested the presence of intact
103
labels with the same pattern as observed in the [1,2-13C2] acetate 30 labelling study
(expansions not shown).
Although the results of the [U-13C6] glucose 161 labelling study were
incomplete, the results obtained were consistent with the predicted labelling pattern for
a biosynthesis from anthranilate 151 (or other shikimate 152 derived intermediate) and
either aspartate 140 or serine 139.
The poor titre obtained in the [U-13C6] glucose 161 labelling study was
disappointing so the experiment was repeated. Given that the titre of fusarachromene
123 in the identical control flask had appeared to be normal by HPLC analysis it was
possible that presence of the substrate itself had caused the titre to be reduced. We
decided to feed the glucose to a lower overall culture concentration and at a single
(intermediate) time point in the second experiment and to extend the incubation period
by two days to try and reduce any effect of the substrate on secondary metabolism.
[U-13C6] Glucose 161, was added (1 mL aliquots) as a stock solution (25 mg mL-
1 in sterile water) to cultures of F. sacchari 10 h after inoculation to a final
concentration of 250 mg L-1 (1.4 mM). The culture was incubated for 10 days. On
analysis of the crude extract by HPLC it was noted that the titre was even lower relative
to an identical control culture in the second experiment. Although isolation of the
fusarachromene 123 was attempted no significant amount of material was obtained and
the experiment was abandoned.
[U-13C3] Glycerol 180 has been used as an alternative substrate to glucose.[141]
An experiment was conducted by Miss Asifa Munawar to verify that the addition of
unlabelled glycerol to a culture of F. sacchari had no effect on the production of
fusarachromene 123 relative to the production in a control culture. The pattern for [U-13C3] glycerol 180 labelling of fusarachromene 123 was predicted in a similar manner to
the pattern for [U-13C6] glucose 161, beginning with the biosynthesis of fructose-1,6-
phosphate 171 (with two intact C3 units) from glycerol via DHAP 172 and GAP 168
(Scheme 44).
Fructose-1,6-phosphate 171 would be converted into glucose-6-phosphate 162
which would be processed, ultimately via the PPP to erythrose-4-phosphate 156 with an
intact C3 unit (C2-C4) and a single isotopic enrichment at C1 (Scheme 43).
Phosphoenolpyruvate 157, would be biosynthesised from fructose-1,6-phosphate
171 would be expected to contain an intact C3 unit (Scheme 44) in the presence of [U-13C3] glycerol 180.
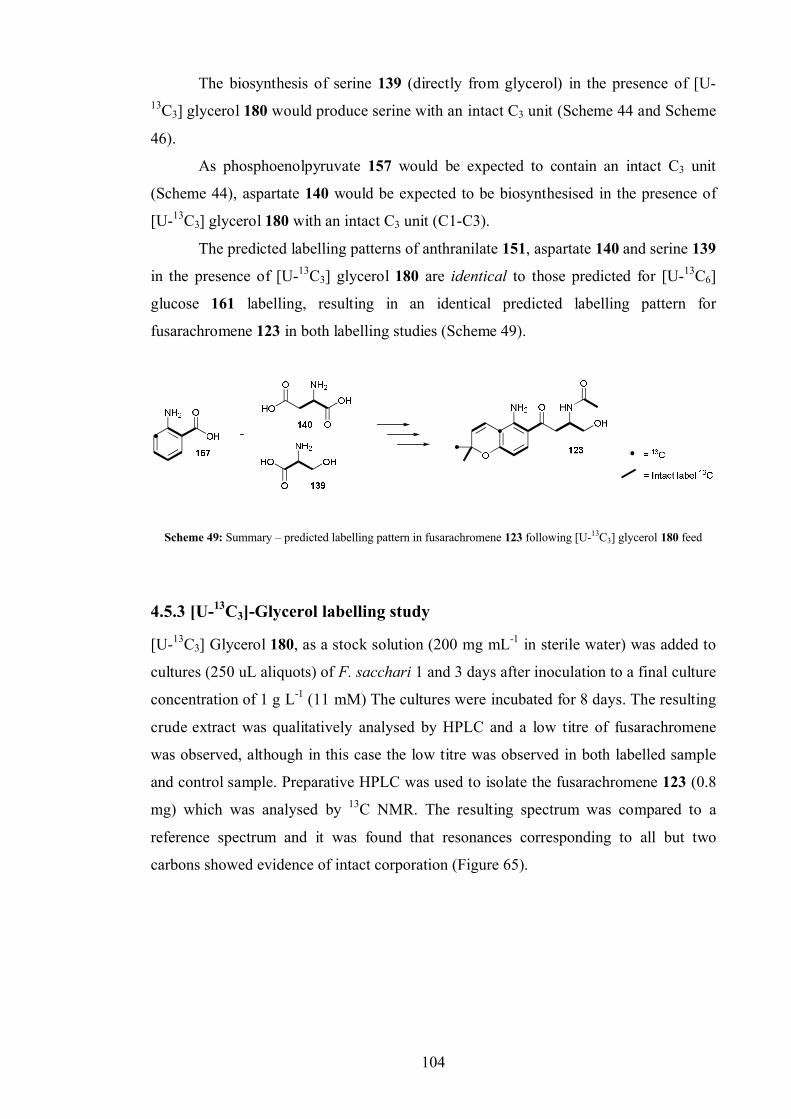
104
The biosynthesis of serine 139 (directly from glycerol) in the presence of [U-13C3] glycerol 180 would produce serine with an intact C3 unit (Scheme 44 and Scheme
46).
As phosphoenolpyruvate 157 would be expected to contain an intact C3 unit
(Scheme 44), aspartate 140 would be expected to be biosynthesised in the presence of
[U-13C3] glycerol 180 with an intact C3 unit (C1-C3).
The predicted labelling patterns of anthranilate 151, aspartate 140 and serine 139
in the presence of [U-13C3] glycerol 180 are identical to those predicted for [U-13C6]
glucose 161 labelling, resulting in an identical predicted labelling pattern for
fusarachromene 123 in both labelling studies (Scheme 49).
Scheme 49: Summary – predicted labelling pattern in fusarachromene 123 following [U-13C3] glycerol 180 feed
4.5.3 [U-13C3]-Glycerol labelling study
[U-13C3] Glycerol 180, as a stock solution (200 mg mL-1 in sterile water) was added to
cultures (250 uL aliquots) of F. sacchari 1 and 3 days after inoculation to a final culture
concentration of 1 g L-1 (11 mM) The cultures were incubated for 8 days. The resulting
crude extract was qualitatively analysed by HPLC and a low titre of fusarachromene
was observed, although in this case the low titre was observed in both labelled sample
and control sample. Preparative HPLC was used to isolate the fusarachromene 123 (0.8
mg) which was analysed by 13C NMR. The resulting spectrum was compared to a
reference spectrum and it was found that resonances corresponding to all but two
carbons showed evidence of intact corporation (Figure 65).
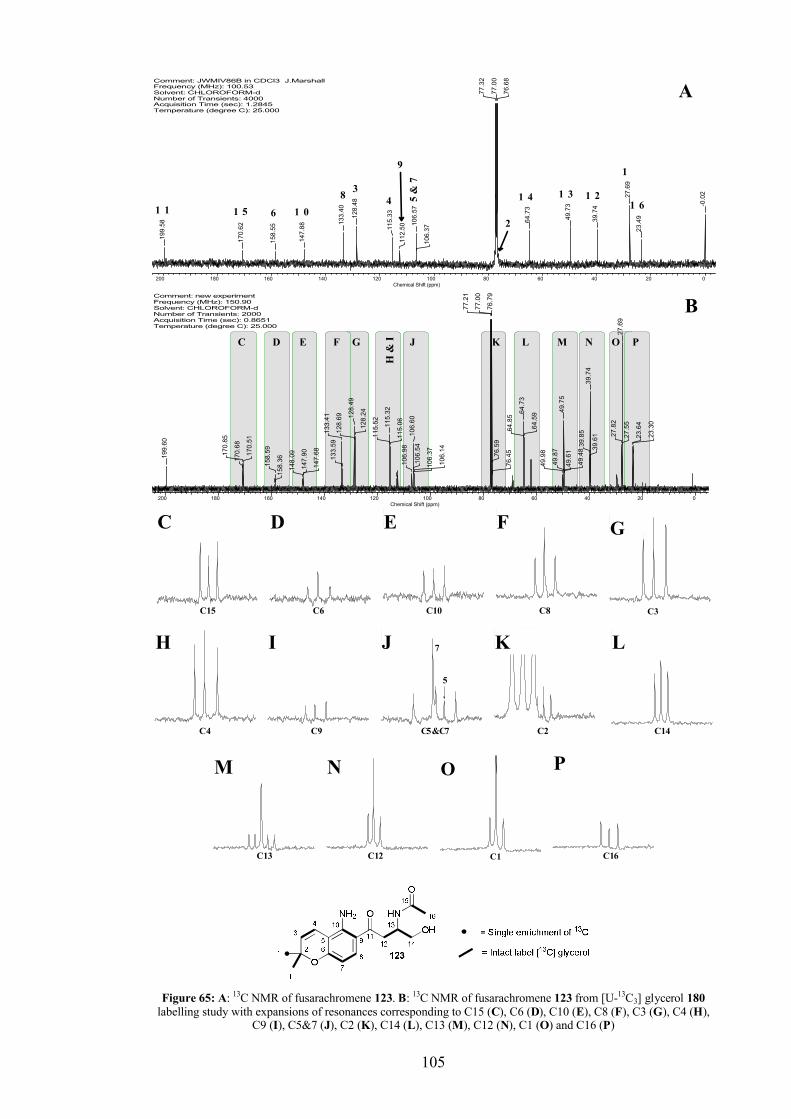
105
Comment: JWMIV86B in CDCl3 J.MarshallFrequency (MHz): 100.53Solvent: CHLOROFORM-dNumber of Transients: 4000Acquisition Time (sec): 1.2845Temperature (degree C): 25.000
200 180 160 140 120 100 80 60 40 20 0Chemical Shift (ppm)
-0.0
2
23.4
9
27.6
9
39.7
4
49.7
3
64.7
3
76.6
8
77.0
0
77.3
2
106.
37
106.
57
112.
50115.
33128.
48
133.
40
147.
88
158.
55
170.
62
199.
58
1
1 61 21 31 45
& 7
2
4
9
381 061 51 1
A
BC D E F G
H &
I J K L M N O P
Comment: new experimentFrequency (MHz): 150.90Solvent: CHLOROFORM-dNumber of Transients: 2000Acquisition Time (sec): 0.8651Temperature (degree C): 25.000
200 180 160 140 120 100 80 60 40 20 0Chemical Shift (ppm)
23.3
0
23.6
4
27.5
527
.69
27.8
2
39.6
139
.74
39.8
549
.48
49.6
149
.75
49.8
7
49.9
864
.5964
.73
64.8
576
.4576
.59
76.7
9
77.0
0
77.2
1
106.
14
106.
37
106.
5410
6.60
106.
9811
5.0611
5.32
115.
52128.
24128.
49
128.
69
133.
4113
3.59
147.
68
147.
90
148.
09
158.
36158.
59170.
51
170.
68
170.
85
199.
60
Comment: new experimentFrequency (MHz): 150.90Nucleus: 13CAcquisition Time (sec): 0.8651Number of Transients: 2000Solvent: CHLOROFORM-dC
C 1 5
Comment: new experimentFrequency (MHz): 150.90Nucleus: 13CAcquisition Time (sec): 0.8651Number of Transients: 2000Solvent: CHLOROFORM-dD
C 6
Comment: new experimentFrequency (MHz): 150.90Nucleus: 13CAcquisition Time (sec): 0.8651Number of Transients: 2000Solvent: CHLOROFORM-dE
C 1 0
Comment: new experimentFrequency (MHz): 150.90Nucleus: 13CAcquisition Time (sec): 0.8651Number of Transients: 2000Solvent: CHLOROFORM-dF
C 8
Comment: new experimentFrequency (MHz): 150.90Nucleus: 13CAcquisition Time (sec): 0.8651Number of Transients: 2000Solvent: CHLOROFORM-d
C 3
G
Comment: new experimentFrequency (MHz): 150.90Nucleus: 13CAcquisition Time (sec): 0.8651Number of Transients: 2000Solvent: CHLOROFORM-dH
C 4
Comment: new experimentFrequency (MHz): 150.90Nucleus: 13CAcquisition Time (sec): 0.8651Number of Transients: 2000Solvent: CHLOROFORM-dI
C 9
Comment: new experimentFrequency (MHz): 150.90Nucleus: 13CAcquisition Time (sec): 0.8651Number of Transients: 2000Solvent: CHLOROFORM-dJ
5
7
C 5 & C 7
Comment: new experimentFrequency (MHz): 150.90Nucleus: 13CAcquisition Time (sec): 0.8651Number of Transients: 2000Solvent: CHLOROFORM-d
C 2
K
Comment: new experimentFrequency (MHz): 150.90Nucleus: 13CAcquisition Time (sec): 0.8651Number of Transients: 2000Solvent: CHLOROFORM-dL
C 1 4 Comment: new experimentFrequency (MHz): 150.90Nucleus: 13CAcquisition Time (sec): 0.8651Number of Transients: 2000Solvent: CHLOROFORM-dM
C 1 3
Comment: new experimentFrequency (MHz): 150.90Nucleus: 13CAcquisition Time (sec): 0.8651Number of Transients: 2000Solvent: CHLOROFORM-dN
C 1 2
Comment: new experimentFrequency (MHz): 150.90Nucleus: 13CAcquisition Time (sec): 0.8651Number of Transients: 2000Solvent: CHLOROFORM-d
C 1
O
Comment: new experimentFrequency (MHz): 150.90Nucleus: 13CAcquisition Time (sec): 0.8651Number of Transients: 2000Solvent: CHLOROFORM-dP
C 1 6
Figure 65: A: 13C NMR of fusarachromene 123. B: 13C NMR of fusarachromene 123 from [U-13C3] glycerol 180labelling study with expansions of resonances corresponding to C15 (C), C6 (D), C10 (E), C8 (F), C3 (G), C4 (H),
C9 (I), C5&7 (J), C2 (K), C14 (L), C13 (M), C12 (N), C1 (O) and C16 (P)
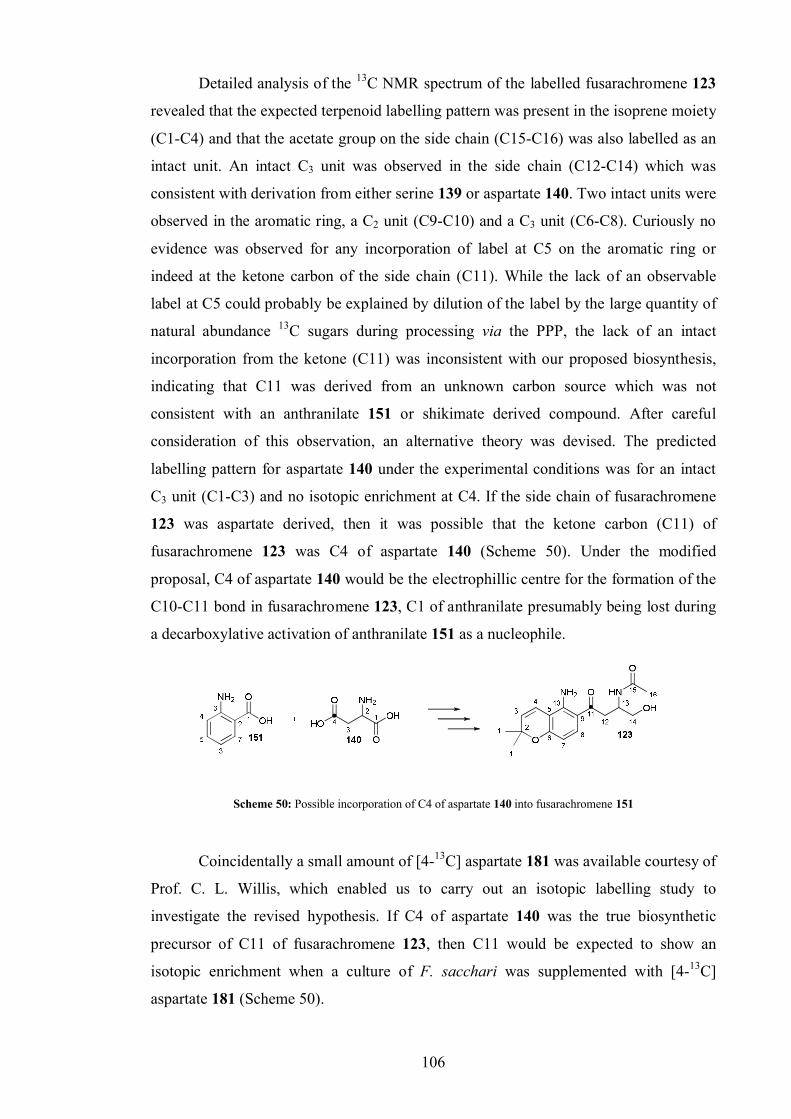
106
Detailed analysis of the 13C NMR spectrum of the labelled fusarachromene 123
revealed that the expected terpenoid labelling pattern was present in the isoprene moiety
(C1-C4) and that the acetate group on the side chain (C15-C16) was also labelled as an
intact unit. An intact C3 unit was observed in the side chain (C12-C14) which was
consistent with derivation from either serine 139 or aspartate 140. Two intact units were
observed in the aromatic ring, a C2 unit (C9-C10) and a C3 unit (C6-C8). Curiously no
evidence was observed for any incorporation of label at C5 on the aromatic ring or
indeed at the ketone carbon of the side chain (C11). While the lack of an observable
label at C5 could probably be explained by dilution of the label by the large quantity of
natural abundance 13C sugars during processing via the PPP, the lack of an intact
incorporation from the ketone (C11) was inconsistent with our proposed biosynthesis,
indicating that C11 was derived from an unknown carbon source which was not
consistent with an anthranilate 151 or shikimate derived compound. After careful
consideration of this observation, an alternative theory was devised. The predicted
labelling pattern for aspartate 140 under the experimental conditions was for an intact
C3 unit (C1-C3) and no isotopic enrichment at C4. If the side chain of fusarachromene
123 was aspartate derived, then it was possible that the ketone carbon (C11) of
fusarachromene 123 was C4 of aspartate 140 (Scheme 50). Under the modified
proposal, C4 of aspartate 140 would be the electrophillic centre for the formation of the
C10-C11 bond in fusarachromene 123, C1 of anthranilate presumably being lost during
a decarboxylative activation of anthranilate 151 as a nucleophile.
Scheme 50: Possible incorporation of C4 of aspartate 140 into fusarachromene 151
Coincidentally a small amount of [4-13C] aspartate 181 was available courtesy of
Prof. C. L. Willis, which enabled us to carry out an isotopic labelling study to
investigate the revised hypothesis. If C4 of aspartate 140 was the true biosynthetic
precursor of C11 of fusarachromene 123, then C11 would be expected to show an
isotopic enrichment when a culture of F. sacchari was supplemented with [4-13C]
aspartate 181 (Scheme 50).
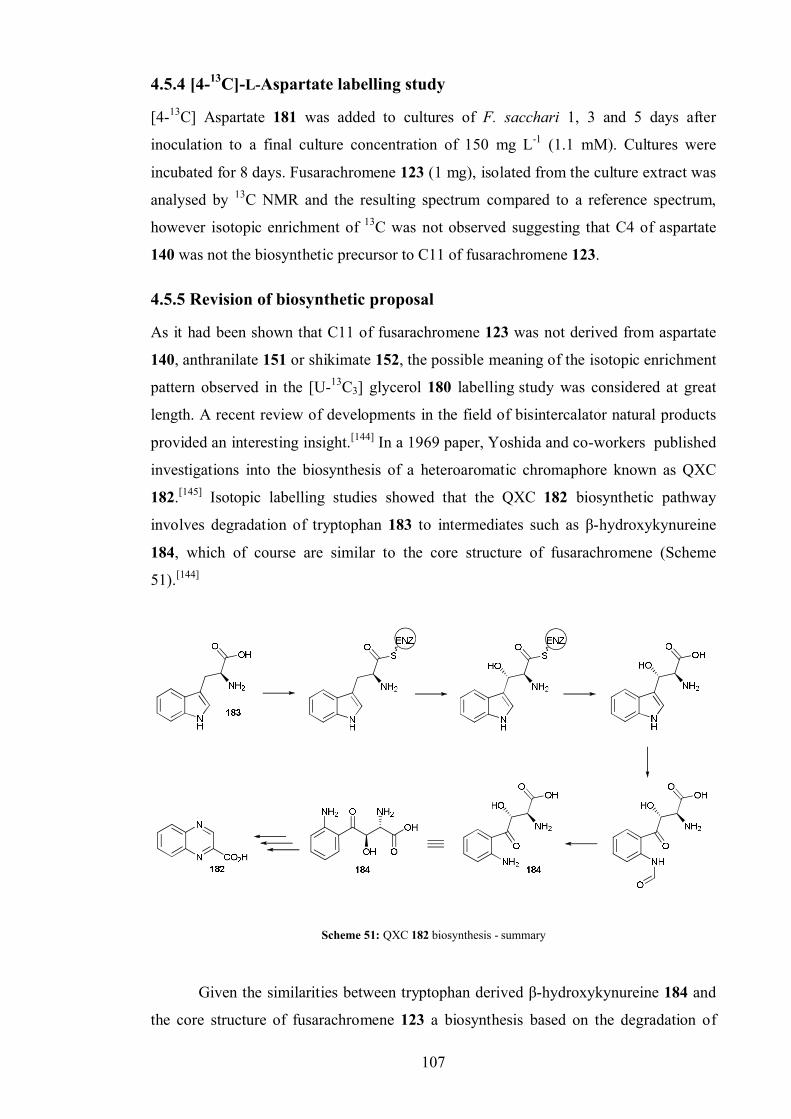
107
4.5.4 [4-13C]-L-Aspartate labelling study
[4-13C] Aspartate 181 was added to cultures of F. sacchari 1, 3 and 5 days after
inoculation to a final culture concentration of 150 mg L-1 (1.1 mM). Cultures were
incubated for 8 days. Fusarachromene 123 (1 mg), isolated from the culture extract was
analysed by 13C NMR and the resulting spectrum compared to a reference spectrum,
however isotopic enrichment of 13C was not observed suggesting that C4 of aspartate
140 was not the biosynthetic precursor to C11 of fusarachromene 123.
4.5.5 Revision of biosynthetic proposal
As it had been shown that C11 of fusarachromene 123 was not derived from aspartate
140, anthranilate 151 or shikimate 152, the possible meaning of the isotopic enrichment
pattern observed in the [U-13C3] glycerol 180 labelling study was considered at great
length. A recent review of developments in the field of bisintercalator natural products
provided an interesting insight.[144] In a 1969 paper, Yoshida and co-workers published
investigations into the biosynthesis of a heteroaromatic chromaphore known as QXC
182.[145] Isotopic labelling studies showed that the QXC 182 biosynthetic pathway
involves degradation of tryptophan 183 to intermediates such as β-hydroxykynureine
184, which of course are similar to the core structure of fusarachromene (Scheme
51).[144]
Scheme 51: QXC 182 biosynthesis - summary
Given the similarities between tryptophan derived β-hydroxykynureine 184 and
the core structure of fusarachromene 123 a biosynthesis based on the degradation of
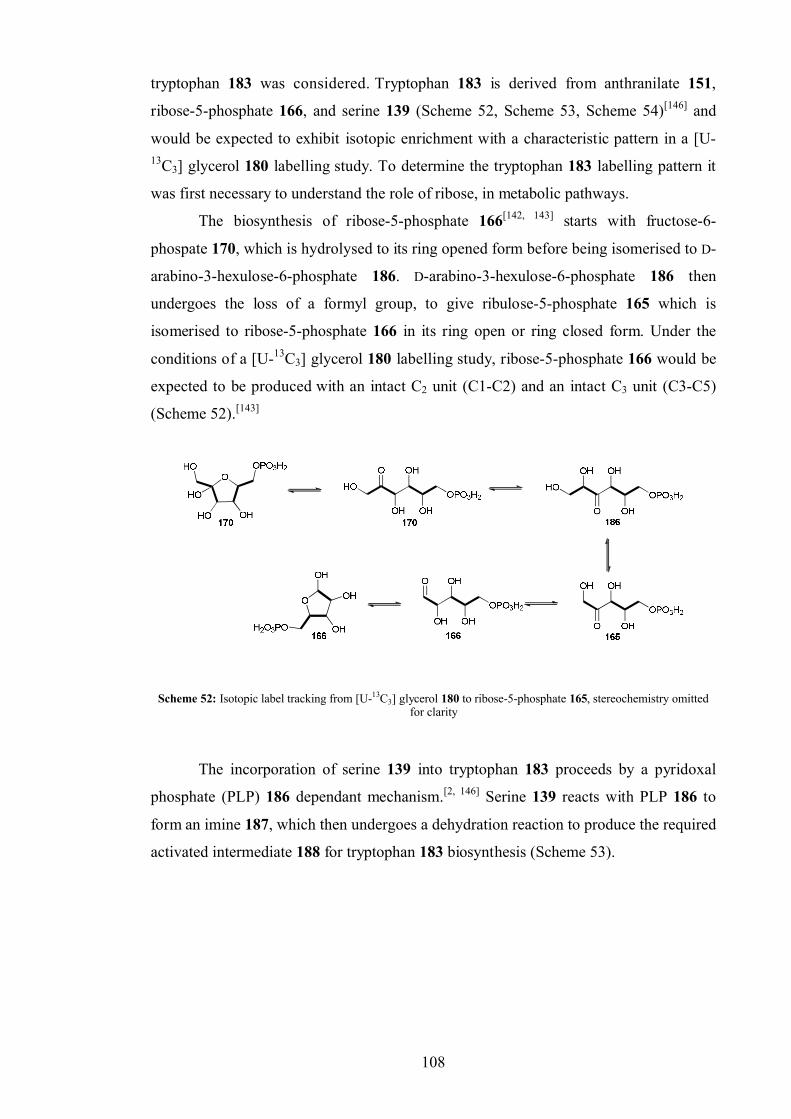
108
tryptophan 183 was considered. Tryptophan 183 is derived from anthranilate 151,
ribose-5-phosphate 166, and serine 139 (Scheme 52, Scheme 53, Scheme 54)[146] and
would be expected to exhibit isotopic enrichment with a characteristic pattern in a [U-13C3] glycerol 180 labelling study. To determine the tryptophan 183 labelling pattern it
was first necessary to understand the role of ribose, in metabolic pathways.
The biosynthesis of ribose-5-phosphate 166[142, 143] starts with fructose-6-
phospate 170, which is hydrolysed to its ring opened form before being isomerised to D-
arabino-3-hexulose-6-phosphate 186. D-arabino-3-hexulose-6-phosphate 186 then
undergoes the loss of a formyl group, to give ribulose-5-phosphate 165 which is
isomerised to ribose-5-phosphate 166 in its ring open or ring closed form. Under the
conditions of a [U-13C3] glycerol 180 labelling study, ribose-5-phosphate 166 would be
expected to be produced with an intact C2 unit (C1-C2) and an intact C3 unit (C3-C5)
(Scheme 52).[143]
Scheme 52: Isotopic label tracking from [U-13C3] glycerol 180 to ribose-5-phosphate 165, stereochemistry omitted for clarity
The incorporation of serine 139 into tryptophan 183 proceeds by a pyridoxal
phosphate (PLP) 186 dependant mechanism.[2, 146] Serine 139 reacts with PLP 186 to
form an imine 187, which then undergoes a dehydration reaction to produce the required
activated intermediate 188 for tryptophan 183 biosynthesis (Scheme 53).
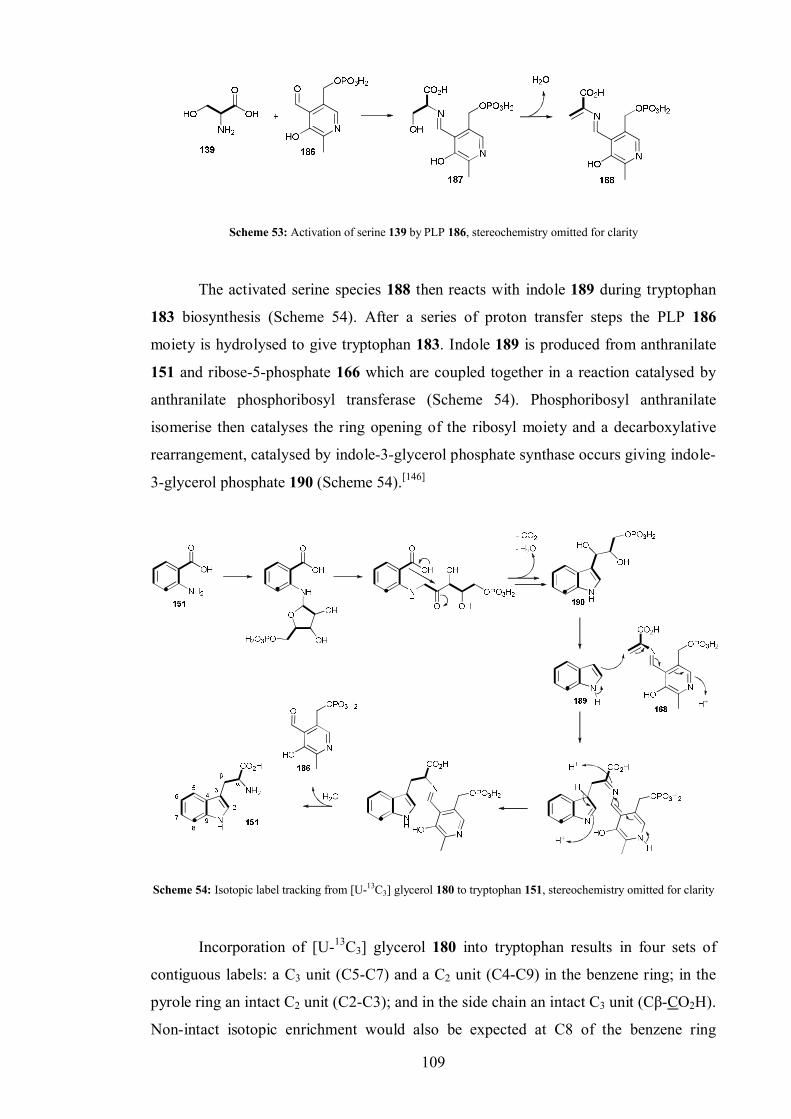
109
Scheme 53: Activation of serine 139 by PLP 186, stereochemistry omitted for clarity
The activated serine species 188 then reacts with indole 189 during tryptophan
183 biosynthesis (Scheme 54). After a series of proton transfer steps the PLP 186
moiety is hydrolysed to give tryptophan 183. Indole 189 is produced from anthranilate
151 and ribose-5-phosphate 166 which are coupled together in a reaction catalysed by
anthranilate phosphoribosyl transferase (Scheme 54). Phosphoribosyl anthranilate
isomerise then catalyses the ring opening of the ribosyl moiety and a decarboxylative
rearrangement, catalysed by indole-3-glycerol phosphate synthase occurs giving indole-
3-glycerol phosphate 190 (Scheme 54).[146]
Scheme 54: Isotopic label tracking from [U-13C3] glycerol 180 to tryptophan 151, stereochemistry omitted for clarity
Incorporation of [U-13C3] glycerol 180 into tryptophan results in four sets of
contiguous labels: a C3 unit (C5-C7) and a C2 unit (C4-C9) in the benzene ring; in the
pyrole ring an intact C2 unit (C2-C3); and in the side chain an intact C3 unit (Cβ-CO2H).
Non-intact isotopic enrichment would also be expected at C8 of the benzene ring
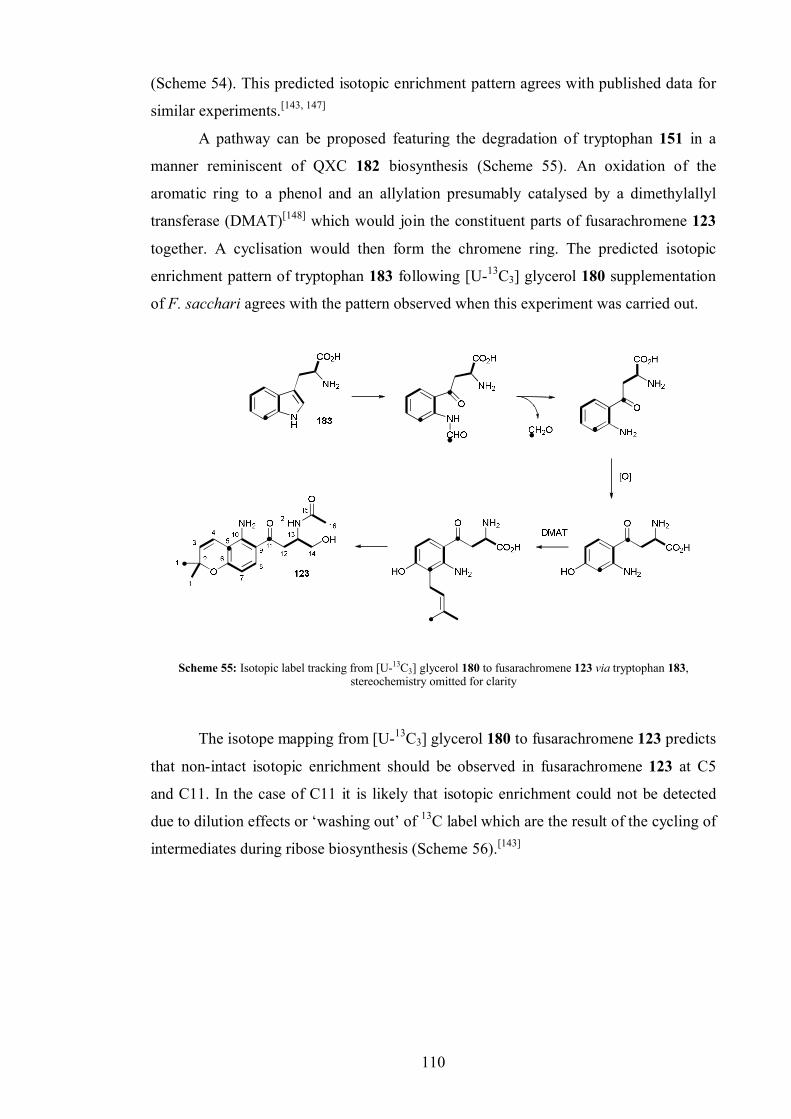
110
(Scheme 54). This predicted isotopic enrichment pattern agrees with published data for
similar experiments.[143, 147]
A pathway can be proposed featuring the degradation of tryptophan 151 in a
manner reminiscent of QXC 182 biosynthesis (Scheme 55). An oxidation of the
aromatic ring to a phenol and an allylation presumably catalysed by a dimethylallyl
transferase (DMAT)[148] which would join the constituent parts of fusarachromene 123
together. A cyclisation would then form the chromene ring. The predicted isotopic
enrichment pattern of tryptophan 183 following [U-13C3] glycerol 180 supplementation
of F. sacchari agrees with the pattern observed when this experiment was carried out.
Scheme 55: Isotopic label tracking from [U-13C3] glycerol 180 to fusarachromene 123 via tryptophan 183, stereochemistry omitted for clarity
The isotope mapping from [U-13C3] glycerol 180 to fusarachromene 123 predicts
that non-intact isotopic enrichment should be observed in fusarachromene 123 at C5
and C11. In the case of C11 it is likely that isotopic enrichment could not be detected
due to dilution effects or ‘washing out’ of 13C label which are the result of the cycling of
intermediates during ribose biosynthesis (Scheme 56).[143]
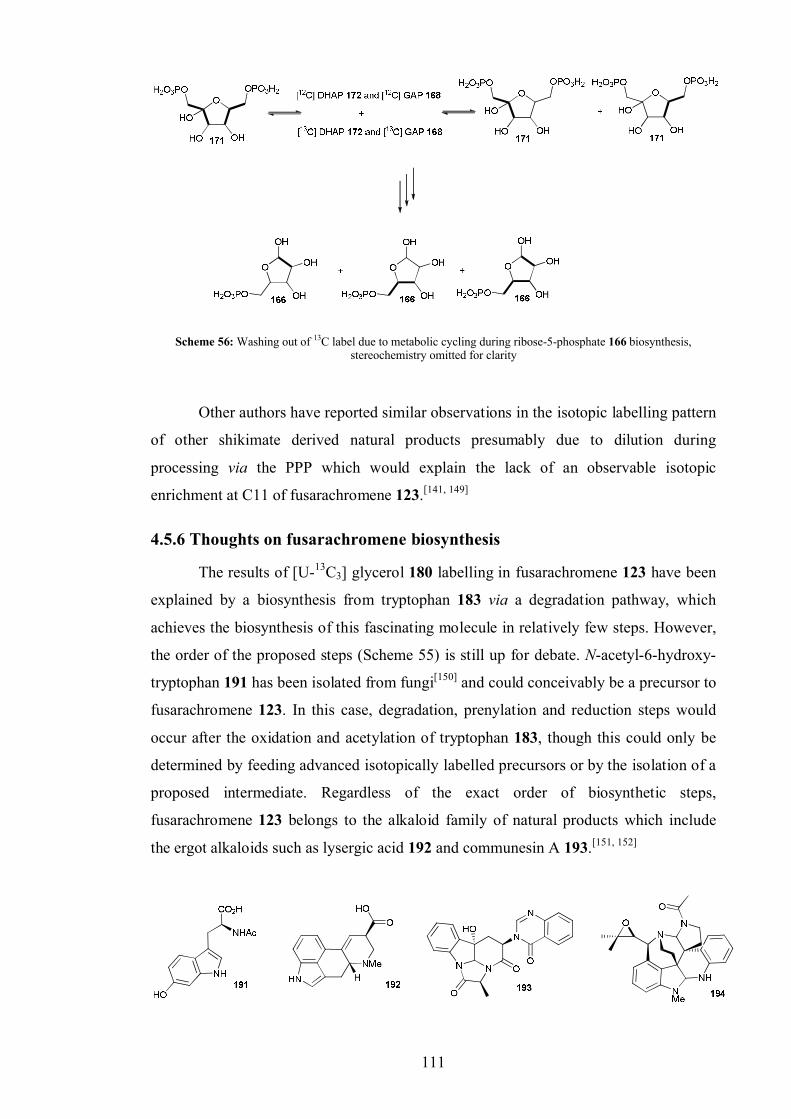
111
Scheme 56: Washing out of 13C label due to metabolic cycling during ribose-5-phosphate 166 biosynthesis, stereochemistry omitted for clarity
Other authors have reported similar observations in the isotopic labelling pattern
of other shikimate derived natural products presumably due to dilution during
processing via the PPP which would explain the lack of an observable isotopic
enrichment at C11 of fusarachromene 123.[141, 149]
4.5.6 Thoughts on fusarachromene biosynthesis
The results of [U-13C3] glycerol 180 labelling in fusarachromene 123 have been
explained by a biosynthesis from tryptophan 183 via a degradation pathway, which
achieves the biosynthesis of this fascinating molecule in relatively few steps. However,
the order of the proposed steps (Scheme 55) is still up for debate. N-acetyl-6-hydroxy-
tryptophan 191 has been isolated from fungi[150] and could conceivably be a precursor to
fusarachromene 123. In this case, degradation, prenylation and reduction steps would
occur after the oxidation and acetylation of tryptophan 183, though this could only be
determined by feeding advanced isotopically labelled precursors or by the isolation of a
proposed intermediate. Regardless of the exact order of biosynthetic steps,
fusarachromene 123 belongs to the alkaloid family of natural products which include
the ergot alkaloids such as lysergic acid 192 and communesin A 193.[151, 152]
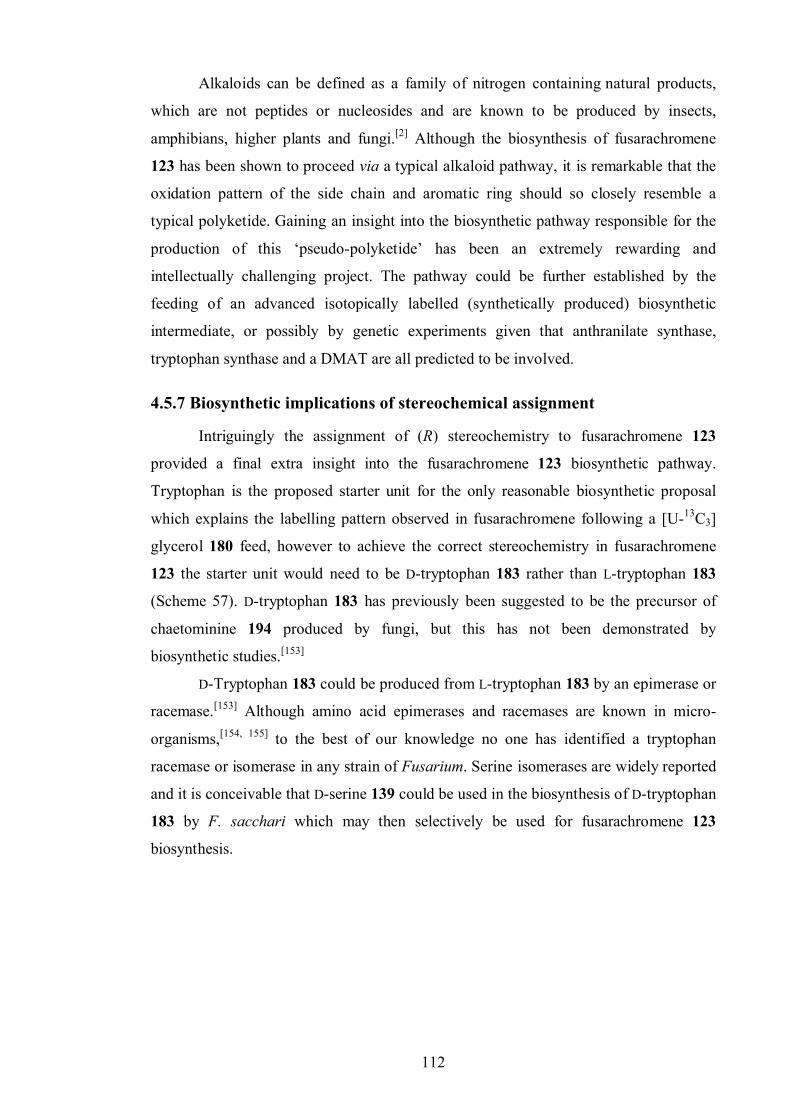
112
Alkaloids can be defined as a family of nitrogen containing natural products,
which are not peptides or nucleosides and are known to be produced by insects,
amphibians, higher plants and fungi.[2] Although the biosynthesis of fusarachromene
123 has been shown to proceed via a typical alkaloid pathway, it is remarkable that the
oxidation pattern of the side chain and aromatic ring should so closely resemble a
typical polyketide. Gaining an insight into the biosynthetic pathway responsible for the
production of this ‘pseudo-polyketide’ has been an extremely rewarding and
intellectually challenging project. The pathway could be further established by the
feeding of an advanced isotopically labelled (synthetically produced) biosynthetic
intermediate, or possibly by genetic experiments given that anthranilate synthase,
tryptophan synthase and a DMAT are all predicted to be involved.
4.5.7 Biosynthetic implications of stereochemical assignment
Intriguingly the assignment of (R) stereochemistry to fusarachromene 123
provided a final extra insight into the fusarachromene 123 biosynthetic pathway.
Tryptophan is the proposed starter unit for the only reasonable biosynthetic proposal
which explains the labelling pattern observed in fusarachromene following a [U-13C3]
glycerol 180 feed, however to achieve the correct stereochemistry in fusarachromene
123 the starter unit would need to be D-tryptophan 183 rather than L-tryptophan 183
(Scheme 57). D-tryptophan 183 has previously been suggested to be the precursor of
chaetominine 194 produced by fungi, but this has not been demonstrated by
biosynthetic studies.[153]
D-Tryptophan 183 could be produced from L-tryptophan 183 by an epimerase or
racemase.[153] Although amino acid epimerases and racemases are known in micro-
organisms,[154, 155] to the best of our knowledge no one has identified a tryptophan
racemase or isomerase in any strain of Fusarium. Serine isomerases are widely reported
and it is conceivable that D-serine 139 could be used in the biosynthesis of D-tryptophan
183 by F. sacchari which may then selectively be used for fusarachromene 123
biosynthesis.
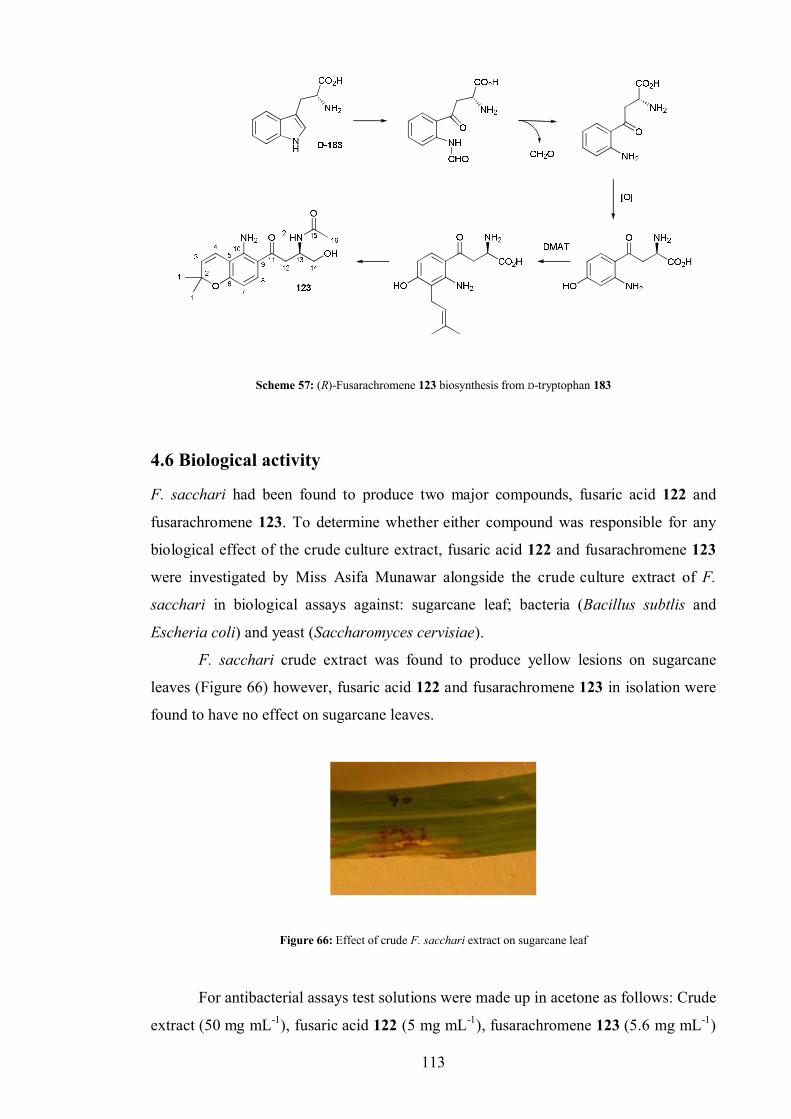
113
Scheme 57: (R)-Fusarachromene 123 biosynthesis from D-tryptophan 183
4.6 Biological activity
F. sacchari had been found to produce two major compounds, fusaric acid 122 and
fusarachromene 123. To determine whether either compound was responsible for any
biological effect of the crude culture extract, fusaric acid 122 and fusarachromene 123
were investigated by Miss Asifa Munawar alongside the crude culture extract of F.
sacchari in biological assays against: sugarcane leaf; bacteria (Bacillus subtlis and
Escheria coli) and yeast (Saccharomyces cervisiae).
F. sacchari crude extract was found to produce yellow lesions on sugarcane
leaves (Figure 66) however, fusaric acid 122 and fusarachromene 123 in isolation were
found to have no effect on sugarcane leaves.
Figure 66: Effect of crude F. sacchari extract on sugarcane leaf
For antibacterial assays test solutions were made up in acetone as follows: Crude
extract (50 mg mL-1), fusaric acid 122 (5 mg mL-1), fusarachromene 123 (5.6 mg mL-1)

114
and kanamycin (50 mg mL-1). Volumes of 25, 50 and 75 µL were then delivered to sites
on an LB agar plate which had been overlaid with cultures of either B. subtlis or E. coli
in soft top Agarose. Kanamycin was used as a positive control for growth inhibition and
acetone was used as a negative control. Fusaric acid 122 was shown to inhibit the
growth of B. subtlis and E. coli (Figure 67). B. subitilis are approximately twice as
sensitive to Fusaric acid 122 as E. coli cells (Table 7). Fusarachromene 123 does not
appear to have any antibacterial effect (Figure 67). Neither fusaric acid 122 nor
fusarachromene 123 were seen to have any activity against yeast (Saccharomyces
cervisiae) cells.
Figure 67: Effect of fusarachromene 123 fusaric acid 122 and kanamycin on growth of E. coli
B. subtilits Zone of inhibition
Volume (µL) Crude Extract Fusaric acid Kanamycin
25 31 35 110
50 45 55 130
75 52.5 70 150
E. coli Zone of inhibition
Volume (µL) Crude Extract Fusaric acid Kanamycin
25 15 25 52.5
50 20 32.5 65
75 25 45 72.5
Table 7: Inhibition of the growth of B. subtlis and E. coli by F. sacchari crude extract, fusaric acid 122 and kanamycin.
The results of the biological activity tests show that fusarachromene 123 appears
to have no observable biological activity against sugarcane, bacteria or yeast. Fusaric
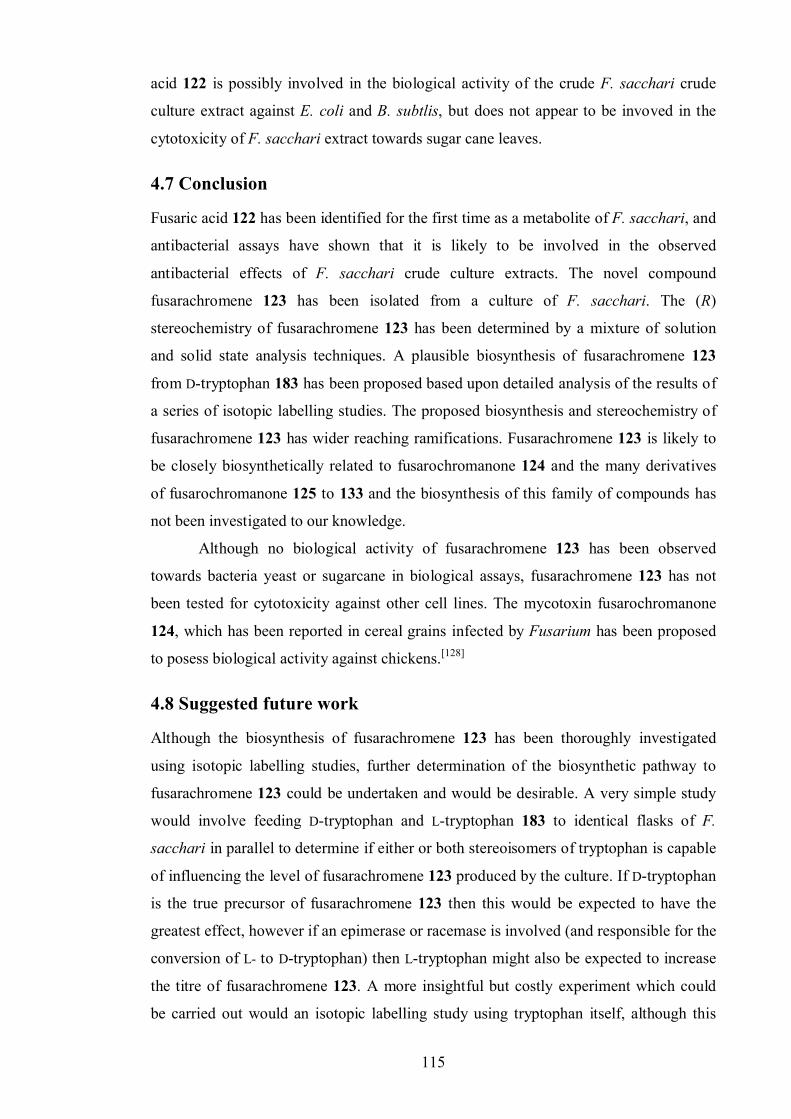
115
acid 122 is possibly involved in the biological activity of the crude F. sacchari crude
culture extract against E. coli and B. subtlis, but does not appear to be invoved in the
cytotoxicity of F. sacchari extract towards sugar cane leaves.
4.7 Conclusion
Fusaric acid 122 has been identified for the first time as a metabolite of F. sacchari, and
antibacterial assays have shown that it is likely to be involved in the observed
antibacterial effects of F. sacchari crude culture extracts. The novel compound
fusarachromene 123 has been isolated from a culture of F. sacchari. The (R)
stereochemistry of fusarachromene 123 has been determined by a mixture of solution
and solid state analysis techniques. A plausible biosynthesis of fusarachromene 123
from D-tryptophan 183 has been proposed based upon detailed analysis of the results of
a series of isotopic labelling studies. The proposed biosynthesis and stereochemistry of
fusarachromene 123 has wider reaching ramifications. Fusarachromene 123 is likely to
be closely biosynthetically related to fusarochromanone 124 and the many derivatives
of fusarochromanone 125 to 133 and the biosynthesis of this family of compounds has
not been investigated to our knowledge.
Although no biological activity of fusarachromene 123 has been observed
towards bacteria yeast or sugarcane in biological assays, fusarachromene 123 has not
been tested for cytotoxicity against other cell lines. The mycotoxin fusarochromanone
124, which has been reported in cereal grains infected by Fusarium has been proposed
to posess biological activity against chickens.[128]
4.8 Suggested future work
Although the biosynthesis of fusarachromene 123 has been thoroughly investigated
using isotopic labelling studies, further determination of the biosynthetic pathway to
fusarachromene 123 could be undertaken and would be desirable. A very simple study
would involve feeding D-tryptophan and L-tryptophan 183 to identical flasks of F.
sacchari in parallel to determine if either or both stereoisomers of tryptophan is capable
of influencing the level of fusarachromene 123 produced by the culture. If D-tryptophan
is the true precursor of fusarachromene 123 then this would be expected to have the
greatest effect, however if an epimerase or racemase is involved (and responsible for the
conversion of L- to D-tryptophan) then L-tryptophan might also be expected to increase
the titre of fusarachromene 123. A more insightful but costly experiment which could
be carried out would an isotopic labelling study using tryptophan itself, although this
116
should only be carried out either using DL-tryptophan 183 (which would confirm the
involvement of tryptophan 183 but not the stereoisomer) or an enantiomerically pure
sample only in the event that D-tryptophan or L-tryptophan can be identified as the
precursor of fusarachromene 123 by orthogonal means.
Given the large number of fusarochromanone 124 derivatives which are known,
it is curious that only a single compound, fusarachromene 123, has been isolated from
F. sacchari. An interesting experiment would be a culture condition screen or
optimisation. F. sacchari has already been shown to produce cultures of a variety of
colours on different media, suggesting subtle metabolic differences. Any hypothetical
fusarachromene 123 derivatives (which might be present at much lower culture
concentrations) would be interesting.
Regardless of any hypothetical fusarachromene 123 derivatives which might be
discovered in the future, biological assays which compare the observed activity of
fusarachromene 123 and fusarochromanone 124 might prove interesting, although this
would almost certainly require a collaborative effort with the research groups who first
assayed fusarochromanone 124 and should not be undertaken until such time that our
isolation of fusarachromene 123 has been published.
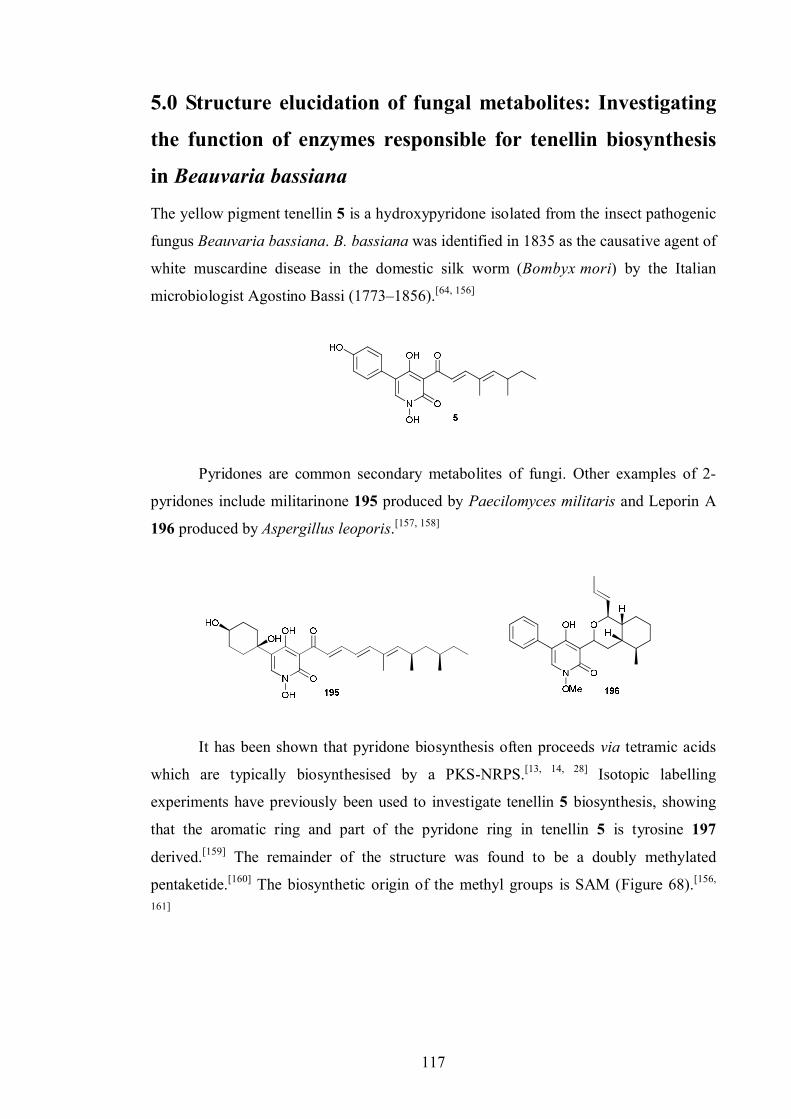
117
5.0 Structure elucidation of fungal metabolites: Investigating
the function of enzymes responsible for tenellin biosynthesis
in Beauvaria bassianaThe yellow pigment tenellin 5 is a hydroxypyridone isolated from the insect pathogenic
fungus Beauvaria bassiana. B. bassiana was identified in 1835 as the causative agent of
white muscardine disease in the domestic silk worm (Bombyx mori) by the Italian
microbiologist Agostino Bassi (1773–1856).[64, 156]
Pyridones are common secondary metabolites of fungi. Other examples of 2-
pyridones include militarinone 195 produced by Paecilomyces militaris and Leporin A
196 produced by Aspergillus leoporis.[157, 158]
It has been shown that pyridone biosynthesis often proceeds via tetramic acids
which are typically biosynthesised by a PKS-NRPS.[13, 14, 28] Isotopic labelling
experiments have previously been used to investigate tenellin 5 biosynthesis, showing
that the aromatic ring and part of the pyridone ring in tenellin 5 is tyrosine 197
derived.[159] The remainder of the structure was found to be a doubly methylated
pentaketide.[160] The biosynthetic origin of the methyl groups is SAM (Figure 68).[156,
161]
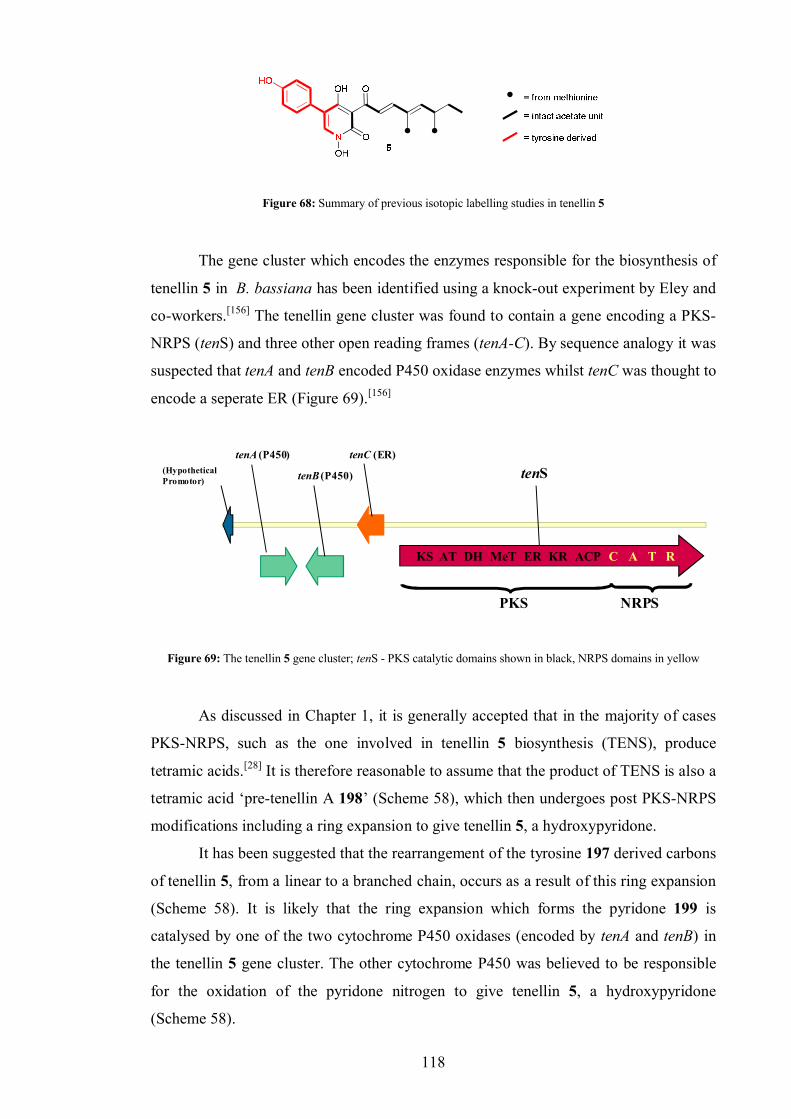
118
Figure 68: Summary of previous isotopic labelling studies in tenellin 5
The gene cluster which encodes the enzymes responsible for the biosynthesis of
tenellin 5 in B. bassiana has been identified using a knock-out experiment by Eley and
co-workers.[156] The tenellin gene cluster was found to contain a gene encoding a PKS-
NRPS (tenS) and three other open reading frames (tenA-C). By sequence analogy it was
suspected that tenA and tenB encoded P450 oxidase enzymes whilst tenC was thought to
encode a seperate ER (Figure 69).[156]
(HypotheticalPromotor)
tenA (P450)
tenStenC (ER)
tenB (P450)
KS AT DH MeT ER KR ACP C A T R
PKS NRPS
Figure 69: The tenellin 5 gene cluster; tenS - PKS catalytic domains shown in black, NRPS domains in yellow
As discussed in Chapter 1, it is generally accepted that in the majority of cases
PKS-NRPS, such as the one involved in tenellin 5 biosynthesis (TENS), produce
tetramic acids.[28] It is therefore reasonable to assume that the product of TENS is also a
tetramic acid ‘pre-tenellin A 198’ (Scheme 58), which then undergoes post PKS-NRPS
modifications including a ring expansion to give tenellin 5, a hydroxypyridone.
It has been suggested that the rearrangement of the tyrosine 197 derived carbons
of tenellin 5, from a linear to a branched chain, occurs as a result of this ring expansion
(Scheme 58). It is likely that the ring expansion which forms the pyridone 199 is
catalysed by one of the two cytochrome P450 oxidases (encoded by tenA and tenB) in
the tenellin 5 gene cluster. The other cytochrome P450 was believed to be responsible
for the oxidation of the pyridone nitrogen to give tenellin 5, a hydroxypyridone
(Scheme 58).
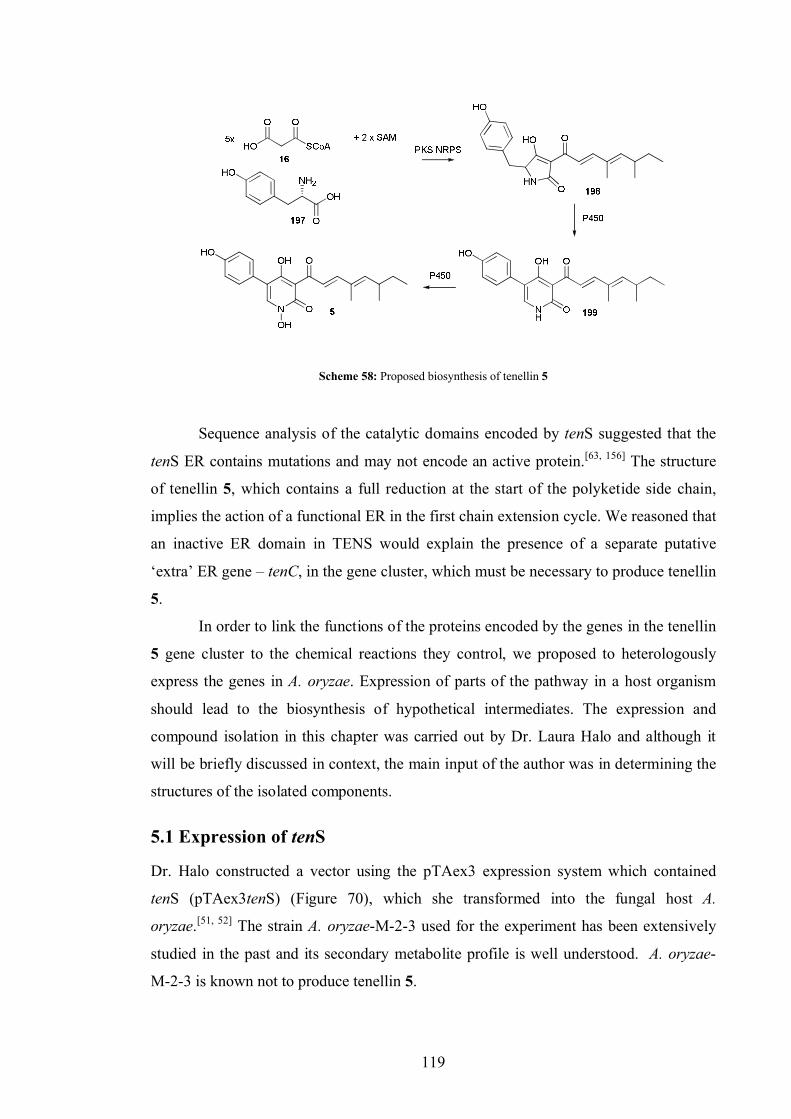
119
Scheme 58: Proposed biosynthesis of tenellin 5
Sequence analysis of the catalytic domains encoded by tenS suggested that the
tenS ER contains mutations and may not encode an active protein.[63, 156] The structure
of tenellin 5, which contains a full reduction at the start of the polyketide side chain,
implies the action of a functional ER in the first chain extension cycle. We reasoned that
an inactive ER domain in TENS would explain the presence of a separate putative
‘extra’ ER gene – tenC, in the gene cluster, which must be necessary to produce tenellin
5.
In order to link the functions of the proteins encoded by the genes in the tenellin
5 gene cluster to the chemical reactions they control, we proposed to heterologously
express the genes in A. oryzae. Expression of parts of the pathway in a host organism
should lead to the biosynthesis of hypothetical intermediates. The expression and
compound isolation in this chapter was carried out by Dr. Laura Halo and although it
will be briefly discussed in context, the main input of the author was in determining the
structures of the isolated components.
5.1 Expression of tenS
Dr. Halo constructed a vector using the pTAex3 expression system which contained
tenS (pTAex3tenS) (Figure 70), which she transformed into the fungal host A.
oryzae.[51, 52] The strain A. oryzae-M-2-3 used for the experiment has been extensively
studied in the past and its secondary metabolite profile is well understood. A. oryzae-
M-2-3 is known not to produce tenellin 5.
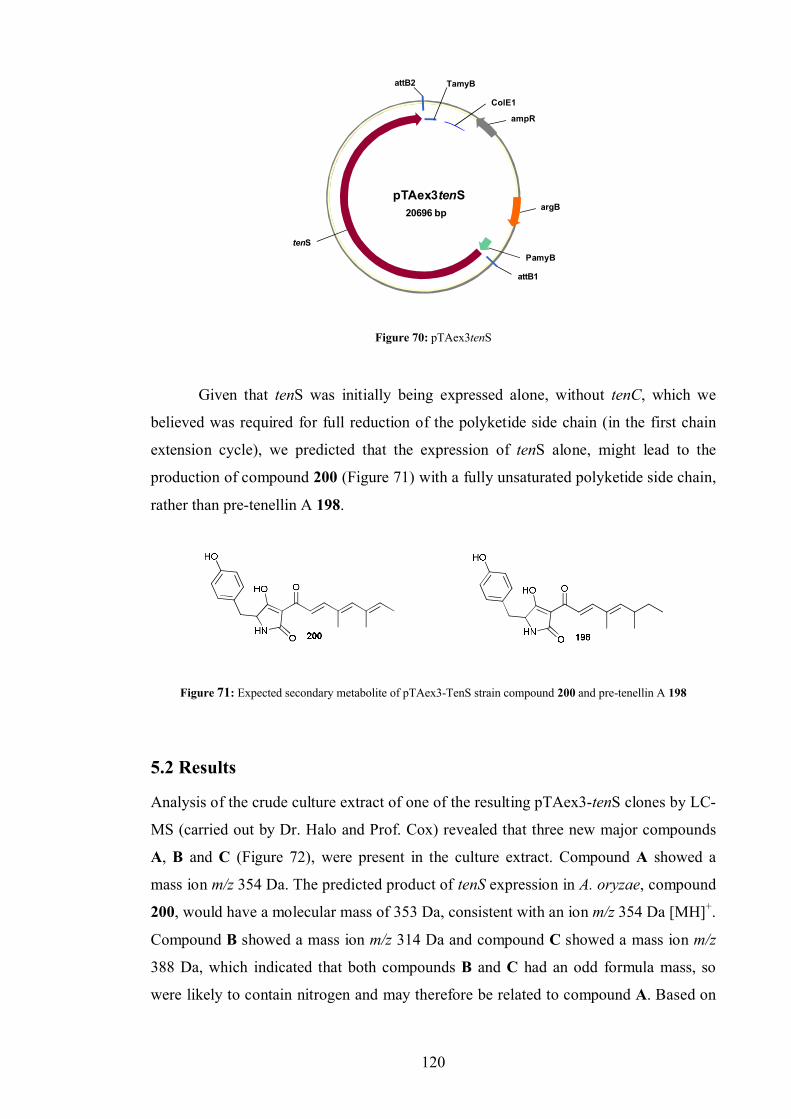
120
pTAex3tenS20696 bp
attB1
attB2
ampR
argB
PamyB
TamyB
ColE1
tenS
Figure 70: pTAex3tenS
Given that tenS was initially being expressed alone, without tenC, which we
believed was required for full reduction of the polyketide side chain (in the first chain
extension cycle), we predicted that the expression of tenS alone, might lead to the
production of compound 200 (Figure 71) with a fully unsaturated polyketide side chain,
rather than pre-tenellin A 198.
Figure 71: Expected secondary metabolite of pTAex3-TenS strain compound 200 and pre-tenellin A 198
5.2 Results
Analysis of the crude culture extract of one of the resulting pTAex3-tenS clones by LC-
MS (carried out by Dr. Halo and Prof. Cox) revealed that three new major compounds
A, B and C (Figure 72), were present in the culture extract. Compound A showed a
mass ion m/z 354 Da. The predicted product of tenS expression in A. oryzae, compound
200, would have a molecular mass of 353 Da, consistent with an ion m/z 354 Da [MH]+.
Compound B showed a mass ion m/z 314 Da and compound C showed a mass ion m/z
388 Da, which indicated that both compounds B and C had an odd formula mass, so
were likely to contain nitrogen and may therefore be related to compound A. Based on
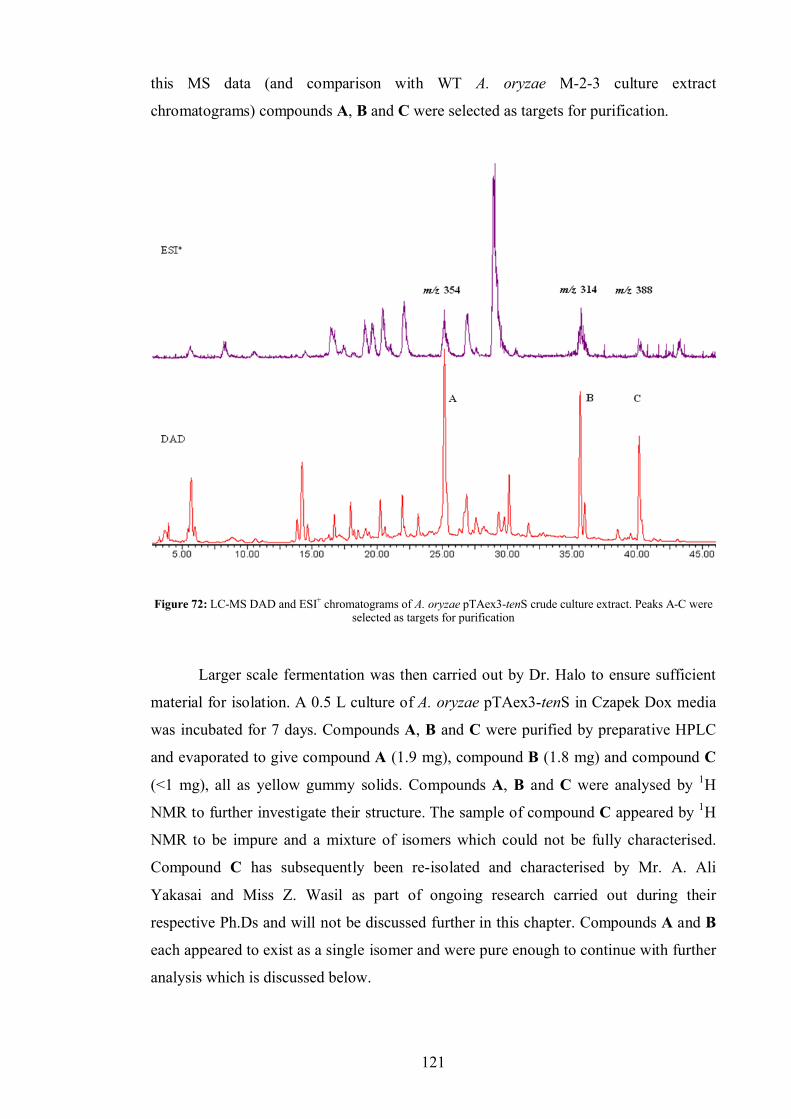
121
this MS data (and comparison with WT A. oryzae M-2-3 culture extract
chromatograms) compounds A, B and C were selected as targets for purification.
Figure 72: LC-MS DAD and ESI+ chromatograms of A. oryzae pTAex3-tenS crude culture extract. Peaks A-C were selected as targets for purification
Larger scale fermentation was then carried out by Dr. Halo to ensure sufficient
material for isolation. A 0.5 L culture of A. oryzae pTAex3-tenS in Czapek Dox media
was incubated for 7 days. Compounds A, B and C were purified by preparative HPLC
and evaporated to give compound A (1.9 mg), compound B (1.8 mg) and compound C
(<1 mg), all as yellow gummy solids. Compounds A, B and C were analysed by 1H
NMR to further investigate their structure. The sample of compound C appeared by 1H
NMR to be impure and a mixture of isomers which could not be fully characterised.
Compound C has subsequently been re-isolated and characterised by Mr. A. Ali
Yakasai and Miss Z. Wasil as part of ongoing research carried out during their
respective Ph.Ds and will not be discussed further in this chapter. Compounds A and B
each appeared to exist as a single isomer and were pure enough to continue with further
analysis which is discussed below.
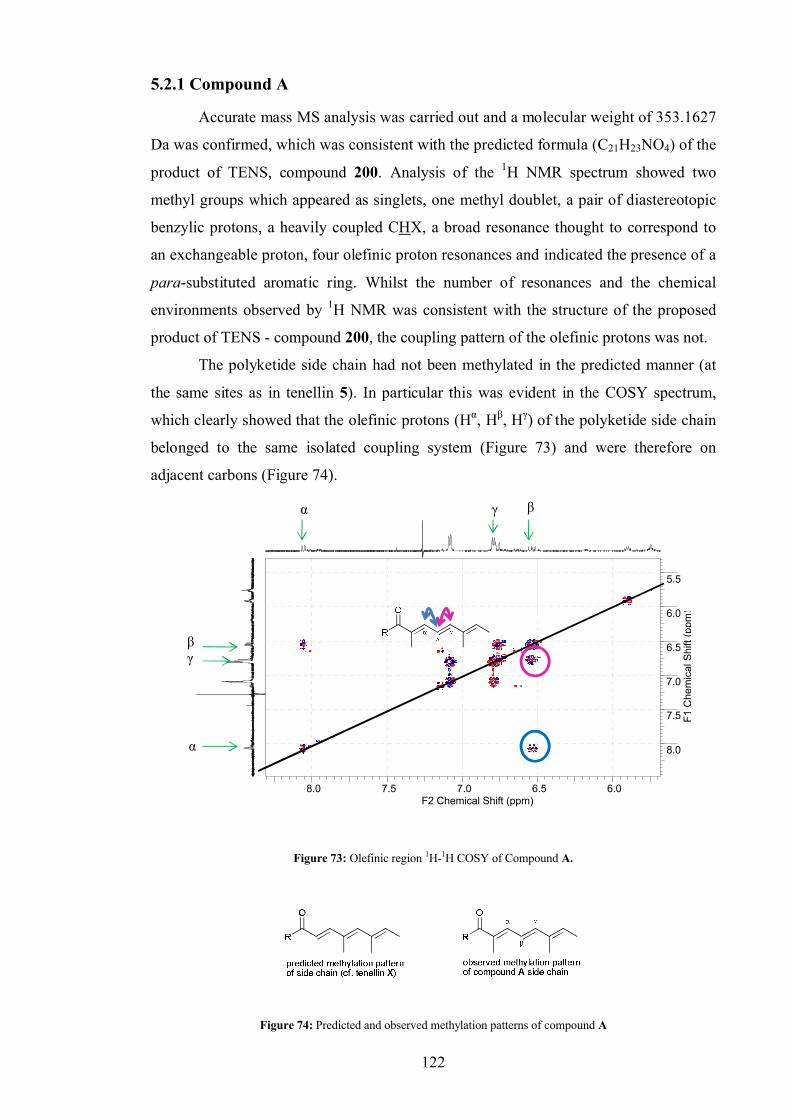
122
5.2.1 Compound A
Accurate mass MS analysis was carried out and a molecular weight of 353.1627
Da was confirmed, which was consistent with the predicted formula (C21H23NO4) of the
product of TENS, compound 200. Analysis of the 1H NMR spectrum showed two
methyl groups which appeared as singlets, one methyl doublet, a pair of diastereotopic
benzylic protons, a heavily coupled CHX, a broad resonance thought to correspond to
an exchangeable proton, four olefinic proton resonances and indicated the presence of a
para-substituted aromatic ring. Whilst the number of resonances and the chemical
environments observed by 1H NMR was consistent with the structure of the proposed
product of TENS - compound 200, the coupling pattern of the olefinic protons was not.
The polyketide side chain had not been methylated in the predicted manner (at
the same sites as in tenellin 5). In particular this was evident in the COSY spectrum,
which clearly showed that the olefinic protons (Hα, Hβ, Hγ) of the polyketide side chain
belonged to the same isolated coupling system (Figure 73) and were therefore on
adjacent carbons (Figure 74).
βγα
βγ
α
8.0 7.5 7.0 6.5 6.0F2 Chemical Shift (ppm)
5.5
6.0
6.5
7.0
7.5
8.0
F1 C
hem
ical
Shi
ft (p
pm)
Figure 73: Olefinic region 1H-1H COSY of Compound A.
Figure 74: Predicted and observed methylation patterns of compound A
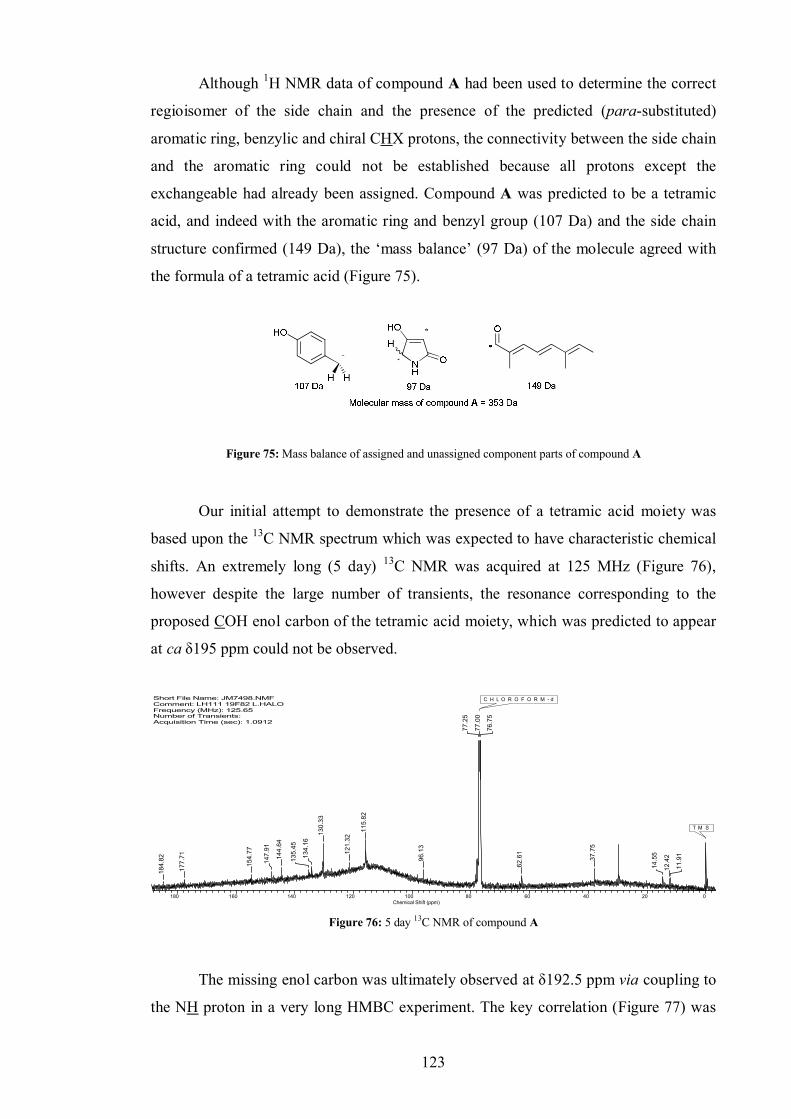
123
Although 1H NMR data of compound A had been used to determine the correct
regioisomer of the side chain and the presence of the predicted (para-substituted)
aromatic ring, benzylic and chiral CHX protons, the connectivity between the side chain
and the aromatic ring could not be established because all protons except the
exchangeable had already been assigned. Compound A was predicted to be a tetramic
acid, and indeed with the aromatic ring and benzyl group (107 Da) and the side chain
structure confirmed (149 Da), the ‘mass balance’ (97 Da) of the molecule agreed with
the formula of a tetramic acid (Figure 75).
Figure 75: Mass balance of assigned and unassigned component parts of compound A
Our initial attempt to demonstrate the presence of a tetramic acid moiety was
based upon the 13C NMR spectrum which was expected to have characteristic chemical
shifts. An extremely long (5 day) 13C NMR was acquired at 125 MHz (Figure 76),
however despite the large number of transients, the resonance corresponding to the
proposed COH enol carbon of the tetramic acid moiety, which was predicted to appear
at ca δ195 ppm could not be observed.
Short File Name: JM7498.NMFComment: LH111 19F82 L.HALOFrequency (MHz): 125.65Number of Transients: Acquisition Time (sec): 1.0912
180 160 140 120 100 80 60 40 20 0Chemical Shift (ppm)
T M S
C H L O R O F O R M - d
11.9
1
12.4
2
14.5
5
37.7
5
62.6
1
76.7
5
77.0
0
77.2
5
96.1
3
115.
82
121.
32
130.
33
134.
16
135.
45
144.
64
147.
91
154.
77
177.
71
184.
82
Figure 76: 5 day 13C NMR of compound A
The missing enol carbon was ultimately observed at δ192.5 ppm via coupling to
the NH proton in a very long HMBC experiment. The key correlation (Figure 77) was
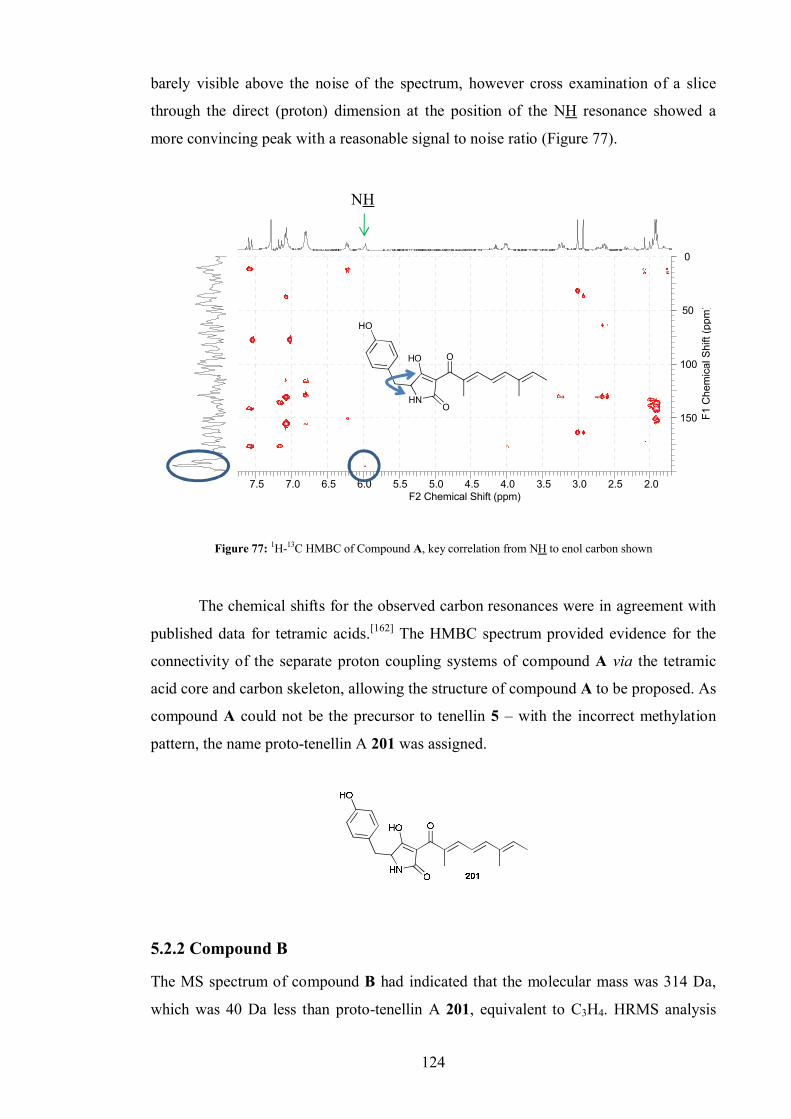
124
barely visible above the noise of the spectrum, however cross examination of a slice
through the direct (proton) dimension at the position of the NH resonance showed a
more convincing peak with a reasonable signal to noise ratio (Figure 77).
7.5 7.0 6.5 6.0 5.5 5.0 4.5 4.0 3.5 3.0 2.5 2.0F2 Chemical Shift (ppm)
0
50
100
150 F1 C
hem
ical
Shi
ft (p
pm)
NH
HN
O
HO
HO
O
Figure 77: 1H-13C HMBC of Compound A, key correlation from NH to enol carbon shown
The chemical shifts for the observed carbon resonances were in agreement with
published data for tetramic acids.[162] The HMBC spectrum provided evidence for the
connectivity of the separate proton coupling systems of compound A via the tetramic
acid core and carbon skeleton, allowing the structure of compound A to be proposed. As
compound A could not be the precursor to tenellin 5 – with the incorrect methylation
pattern, the name proto-tenellin A 201 was assigned.
5.2.2 Compound B
The MS spectrum of compound B had indicated that the molecular mass was 314 Da,
which was 40 Da less than proto-tenellin A 201, equivalent to C3H4. HRMS analysis
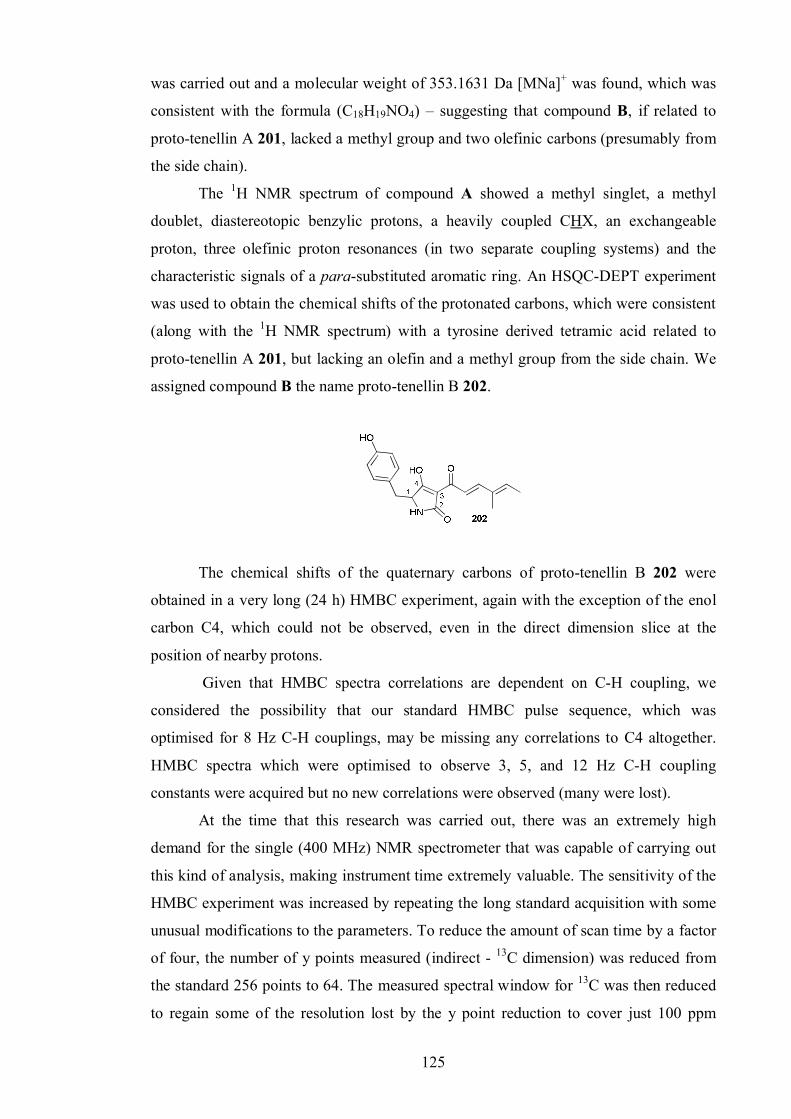
125
was carried out and a molecular weight of 353.1631 Da [MNa]+ was found, which was
consistent with the formula (C18H19NO4) – suggesting that compound B, if related to
proto-tenellin A 201, lacked a methyl group and two olefinic carbons (presumably from
the side chain).
The 1H NMR spectrum of compound A showed a methyl singlet, a methyl
doublet, diastereotopic benzylic protons, a heavily coupled CHX, an exchangeable
proton, three olefinic proton resonances (in two separate coupling systems) and the
characteristic signals of a para-substituted aromatic ring. An HSQC-DEPT experiment
was used to obtain the chemical shifts of the protonated carbons, which were consistent
(along with the 1H NMR spectrum) with a tyrosine derived tetramic acid related to
proto-tenellin A 201, but lacking an olefin and a methyl group from the side chain. We
assigned compound B the name proto-tenellin B 202.
The chemical shifts of the quaternary carbons of proto-tenellin B 202 were
obtained in a very long (24 h) HMBC experiment, again with the exception of the enol
carbon C4, which could not be observed, even in the direct dimension slice at the
position of nearby protons.
Given that HMBC spectra correlations are dependent on C-H coupling, we
considered the possibility that our standard HMBC pulse sequence, which was
optimised for 8 Hz C-H couplings, may be missing any correlations to C4 altogether.
HMBC spectra which were optimised to observe 3, 5, and 12 Hz C-H coupling
constants were acquired but no new correlations were observed (many were lost).
At the time that this research was carried out, there was an extremely high
demand for the single (400 MHz) NMR spectrometer that was capable of carrying out
this kind of analysis, making instrument time extremely valuable. The sensitivity of the
HMBC experiment was increased by repeating the long standard acquisition with some
unusual modifications to the parameters. To reduce the amount of scan time by a factor
of four, the number of y points measured (indirect - 13C dimension) was reduced from
the standard 256 points to 64. The measured spectral window for 13C was then reduced
to regain some of the resolution lost by the y point reduction to cover just 100 ppm
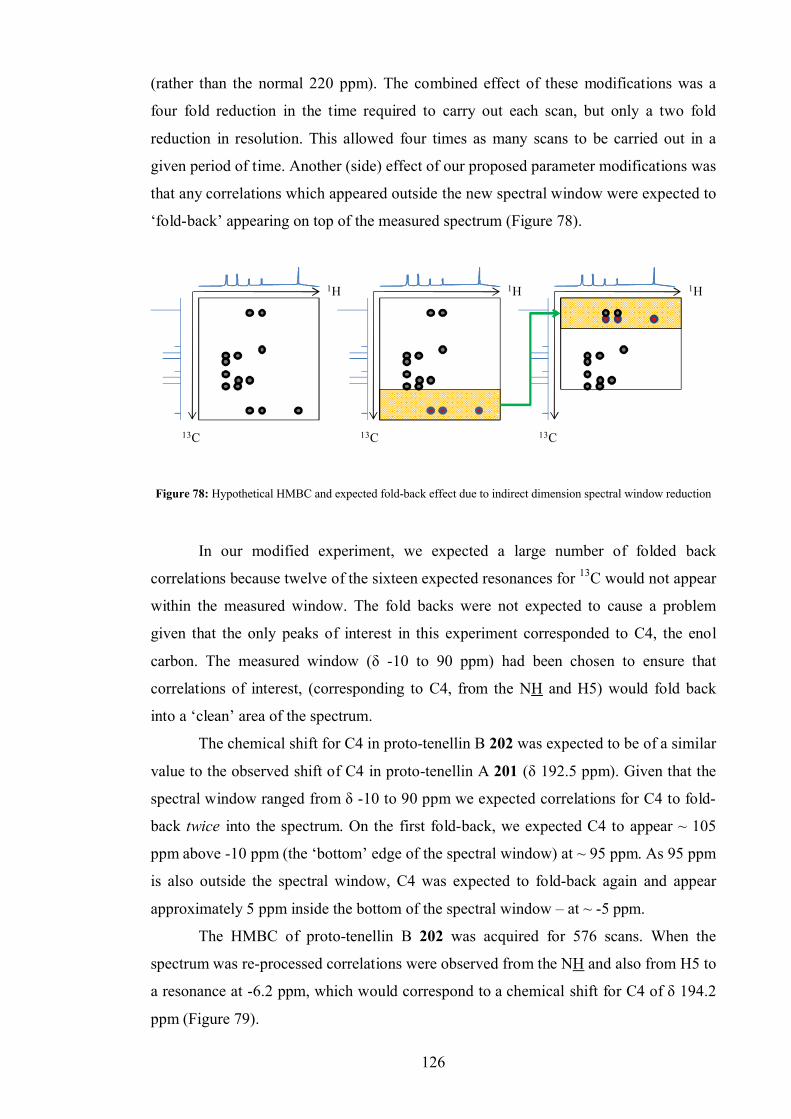
126
(rather than the normal 220 ppm). The combined effect of these modifications was a
four fold reduction in the time required to carry out each scan, but only a two fold
reduction in resolution. This allowed four times as many scans to be carried out in a
given period of time. Another (side) effect of our proposed parameter modifications was
that any correlations which appeared outside the new spectral window were expected to
‘fold-back’ appearing on top of the measured spectrum (Figure 78).
1H
13C 13C
1H
13C
1H
Figure 78: Hypothetical HMBC and expected fold-back effect due to indirect dimension spectral window reduction
In our modified experiment, we expected a large number of folded back
correlations because twelve of the sixteen expected resonances for 13C would not appear
within the measured window. The fold backs were not expected to cause a problem
given that the only peaks of interest in this experiment corresponded to C4, the enol
carbon. The measured window (δ -10 to 90 ppm) had been chosen to ensure that
correlations of interest, (corresponding to C4, from the NH and H5) would fold back
into a ‘clean’ area of the spectrum.
The chemical shift for C4 in proto-tenellin B 202 was expected to be of a similar
value to the observed shift of C4 in proto-tenellin A 201 (δ 192.5 ppm). Given that the
spectral window ranged from δ -10 to 90 ppm we expected correlations for C4 to fold-
back twice into the spectrum. On the first fold-back, we expected C4 to appear ~ 105
ppm above -10 ppm (the ‘bottom’ edge of the spectral window) at ~ 95 ppm. As 95 ppm
is also outside the spectral window, C4 was expected to fold-back again and appear
approximately 5 ppm inside the bottom of the spectral window – at ~ -5 ppm.
The HMBC of proto-tenellin B 202 was acquired for 576 scans. When the
spectrum was re-processed correlations were observed from the NH and also from H5 to
a resonance at -6.2 ppm, which would correspond to a chemical shift for C4 of δ 194.2
ppm (Figure 79).
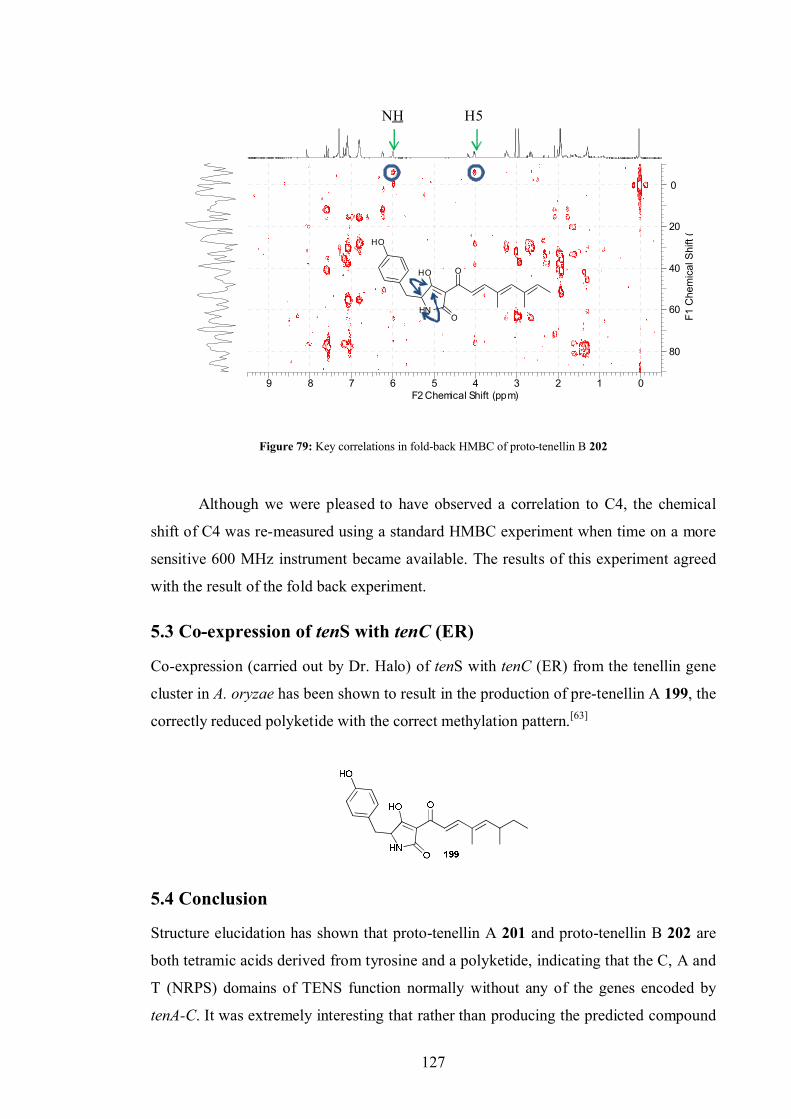
127
9 8 7 6 5 4 3 2 1 0F2 Chemical Shift (ppm)
0
20
40
60
80
F1 C
hem
ical
Shi
ft (p
pm)
HN
O
HO
HO
O
NH H5
Figure 79: Key correlations in fold-back HMBC of proto-tenellin B 202
Although we were pleased to have observed a correlation to C4, the chemical
shift of C4 was re-measured using a standard HMBC experiment when time on a more
sensitive 600 MHz instrument became available. The results of this experiment agreed
with the result of the fold back experiment.
5.3 Co-expression of tenS with tenC (ER)
Co-expression (carried out by Dr. Halo) of tenS with tenC (ER) from the tenellin gene
cluster in A. oryzae has been shown to result in the production of pre-tenellin A 199, the
correctly reduced polyketide with the correct methylation pattern.[63]
5.4 Conclusion
Structure elucidation has shown that proto-tenellin A 201 and proto-tenellin B 202 are
both tetramic acids derived from tyrosine and a polyketide, indicating that the C, A and
T (NRPS) domains of TENS function normally without any of the genes encoded by
tenA-C. It was extremely interesting that rather than producing the predicted compound
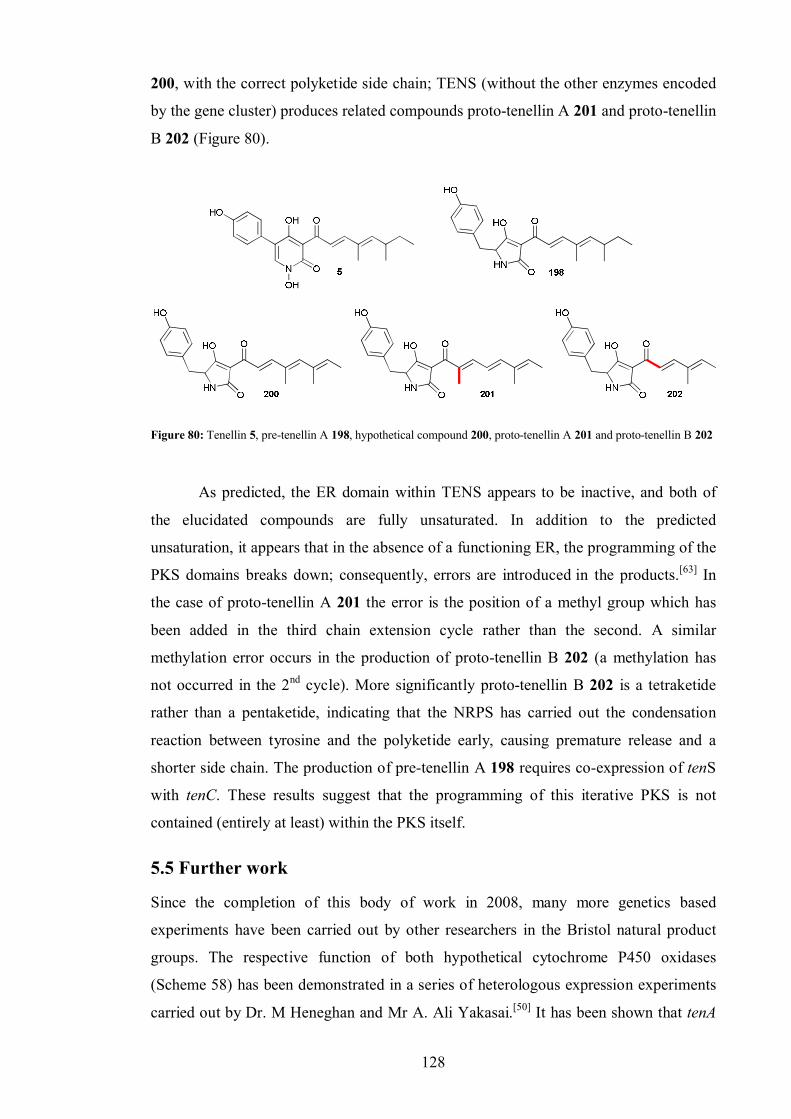
128
200, with the correct polyketide side chain; TENS (without the other enzymes encoded
by the gene cluster) produces related compounds proto-tenellin A 201 and proto-tenellin
B 202 (Figure 80).
Figure 80: Tenellin 5, pre-tenellin A 198, hypothetical compound 200, proto-tenellin A 201 and proto-tenellin B 202
As predicted, the ER domain within TENS appears to be inactive, and both of
the elucidated compounds are fully unsaturated. In addition to the predicted
unsaturation, it appears that in the absence of a functioning ER, the programming of the
PKS domains breaks down; consequently, errors are introduced in the products.[63] In
the case of proto-tenellin A 201 the error is the position of a methyl group which has
been added in the third chain extension cycle rather than the second. A similar
methylation error occurs in the production of proto-tenellin B 202 (a methylation has
not occurred in the 2nd cycle). More significantly proto-tenellin B 202 is a tetraketide
rather than a pentaketide, indicating that the NRPS has carried out the condensation
reaction between tyrosine and the polyketide early, causing premature release and a
shorter side chain. The production of pre-tenellin A 198 requires co-expression of tenS
with tenC. These results suggest that the programming of this iterative PKS is not
contained (entirely at least) within the PKS itself.
5.5 Further work
Since the completion of this body of work in 2008, many more genetics based
experiments have been carried out by other researchers in the Bristol natural product
groups. The respective function of both hypothetical cytochrome P450 oxidases
(Scheme 58) has been demonstrated in a series of heterologous expression experiments
carried out by Dr. M Heneghan and Mr A. Ali Yakasai.[50] It has been shown that tenA
129
encodes a cytochrome P450 oxidase, which catalyzes an unprecedented oxidative ring
expansion of pre-tenellin A 198 to form the pyridone core of tenellin – pre-tenellin B
199.[50] tenB encodes an unusual cytochrome P450 oxygenase required for the selective
N-hydroxylation of the pyridone which is incapable of N-hydroxylation of acyltetramic
acids. The whole pathway responsible for tenellin 5 biosynthesis has also subsequently
been successfully expressed in A. oryzae.[163] This is the first time that the heterologous
expression of a whole fungal pathway has been reported.
The results of these further experiments have far reaching implications in the
field of biosynthetic studies; similar genes appear to be associated with PKS-NRPS
genes in other fungi which are known to produce pyridones.[50] The heterologous
expression of the whole tenellin pathway in particular showcases the kind of
experiments which are possible. Other experiments to study the role of particular genes
(such as co-expression of the pathway with lovC (an ER from the lovastatin pathway)
rather than tenC are also being undertaken which, we hope, will shed light on the
programming of the iterative PKS.
However exciting genetic and bioinformatic approaches to study biosynthesis
have become, it is important to remember that the advances so far and future advances
are underpinned by structure elucidation as the key tool to determine the experimental
results.
130
6.0 Investigating the chemistry of Ace1, a gene encoding a
PKS-NRPS of unknown function in Magnaporthe griseaMagnaporthe grisea, is a filamentous fungus which is noted for its pathogenicity
towards crops. Dubbed the ‘cereal killer’,[164] M. grisea has been shown to infect wheat
and rye as the causative agent of blast disease, though it is perhaps best known as the
virulent pathogen responsible for rice blast.[164] Rice blast disease is the cause of an
annual 10-40% reduction in worldwide rice yield, depending on agronomy and on
environmental conditions.[47]
Studies have been conducted to investigate the pathogenicity of M. grisea in
various strains of rice.[165] A number of strains of rice were found to be resistant to
infection by some isolates of fungus (‘avirulent’ M. grisea), whilst other strains of M.
grisea were found to be virulent in the resistant rice. Analysis of the genomes of the
various strains of rice and M. grisea revealed that the resistant rice contained a gene
which, when switched on allowed the rice to respond to infection by M. grisea.[165]
Further studies have revealed that the response to fungal infection in resistant rice is
linked to the biosynthetic activity of a gene cluster in M. grisea, which encodes a
putative PKS-NRPS homologous to TENS which was discussed in chapter 5.[47] This
mystery hypothetical protein was aptly named avirulence conferring enzyme 1 (ACE1).
The genomes of virulent strains of M. grisea were found not to contain Ace1, the gene
which encodes ACE1.[28, 47, 165]
As Ace1 encodes a putative PKS-NRPS (ACE1), it is the biosynthetic product of
ACE1, rather than the protein or gene itself which must cause the response to infection
in resistant rice. The identity of the mysterious ACE1 compound is clearly of real
interest to industrial and academic researchers in the field of plant pathogenicity.[28]
In virulent M. grisea, it has been shown by reverse transcriptase-polymeric chain
reaction (RT-PCR) that Ace1 is only switched on for a short period in the fungal life
cycle in specific single cells (known as appressoria) during the infection of host leaves.
Although it is possible to culture M. grisea under laboratory conditions in a manner that
promotes Ace1 expression, the amount of compound biosynthesised (by single cells) in
such an experiment is insufficient for isolation.[165]
Our collaborators at Bayer crop science in France, Dr. Mark-Henri Lebrun and
co-workers, approached us to identify the ACE1 compound. As the product of ACE1
was unknown and might be difficult to identify, our collaborators proposed that we
heterologously express Ace1 in A. oryzae and monitor its expression using a reporter
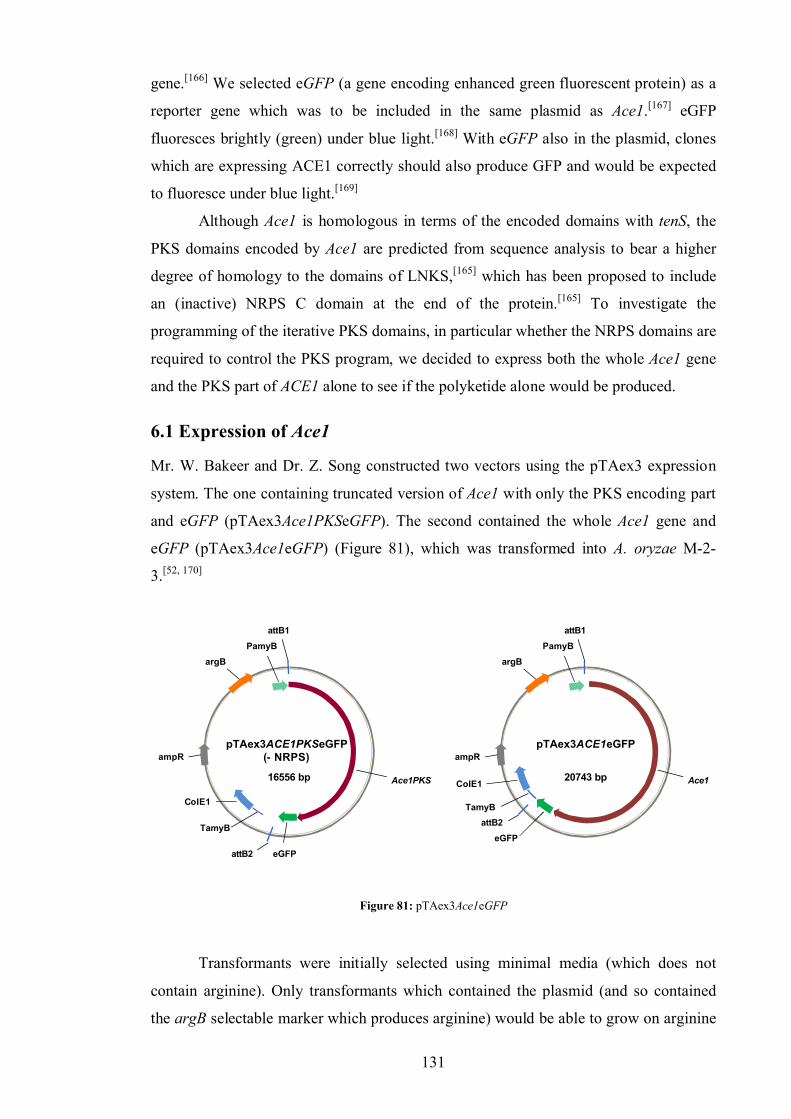
131
gene.[166] We selected eGFP (a gene encoding enhanced green fluorescent protein) as a
reporter gene which was to be included in the same plasmid as Ace1.[167] eGFP
fluoresces brightly (green) under blue light.[168] With eGFP also in the plasmid, clones
which are expressing ACE1 correctly should also produce GFP and would be expected
to fluoresce under blue light.[169]
Although Ace1 is homologous in terms of the encoded domains with tenS, the
PKS domains encoded by Ace1 are predicted from sequence analysis to bear a higher
degree of homology to the domains of LNKS,[165] which has been proposed to include
an (inactive) NRPS C domain at the end of the protein.[165] To investigate the
programming of the iterative PKS domains, in particular whether the NRPS domains are
required to control the PKS program, we decided to express both the whole Ace1 gene
and the PKS part of ACE1 alone to see if the polyketide alone would be produced.
6.1 Expression of Ace1
Mr. W. Bakeer and Dr. Z. Song constructed two vectors using the pTAex3 expression
system. The one containing truncated version of Ace1 with only the PKS encoding part
and eGFP (pTAex3Ace1PKSeGFP). The second contained the whole Ace1 gene and
eGFP (pTAex3Ace1eGFP) (Figure 81), which was transformed into A. oryzae M-2-
3.[52, 170]
pTAex3ACE1PKSeGFP(- NRPS)
16556 bp Ace1PKS
ampR
argB
PamyB
CoIE1
TamyB
attB1
pTAex3ACE1eGFP
20743 bp
eGFP
Ace1
ampR
argB
PamyB
CoIE1
TamyBattB2
attB1
eGFPattB2
Figure 81: pTAex3Ace1eGFP
Transformants were initially selected using minimal media (which does not
contain arginine). Only transformants which contained the plasmid (and so contained
the argB selectable marker which produces arginine) would be able to grow on arginine
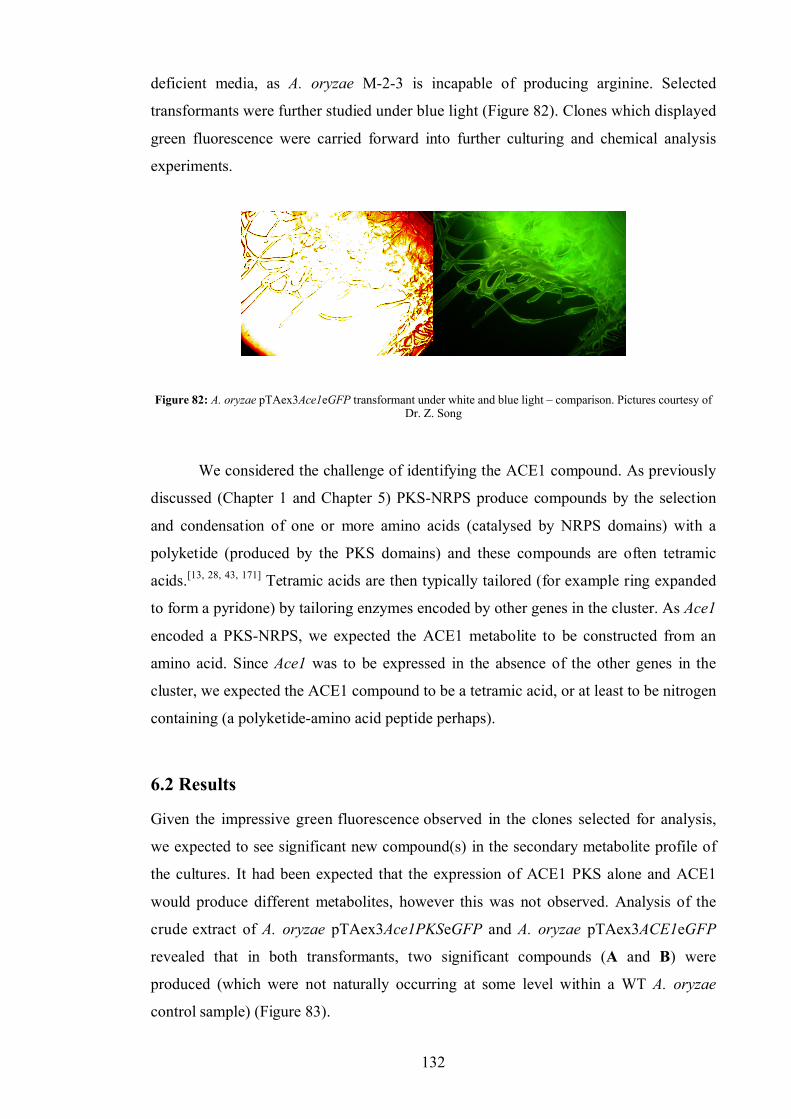
132
deficient media, as A. oryzae M-2-3 is incapable of producing arginine. Selected
transformants were further studied under blue light (Figure 82). Clones which displayed
green fluorescence were carried forward into further culturing and chemical analysis
experiments.
Figure 82: A. oryzae pTAex3Ace1eGFP transformant under white and blue light – comparison. Pictures courtesy of Dr. Z. Song
We considered the challenge of identifying the ACE1 compound. As previously
discussed (Chapter 1 and Chapter 5) PKS-NRPS produce compounds by the selection
and condensation of one or more amino acids (catalysed by NRPS domains) with a
polyketide (produced by the PKS domains) and these compounds are often tetramic
acids.[13, 28, 43, 171] Tetramic acids are then typically tailored (for example ring expanded
to form a pyridone) by tailoring enzymes encoded by other genes in the cluster. As Ace1
encoded a PKS-NRPS, we expected the ACE1 metabolite to be constructed from an
amino acid. Since Ace1 was to be expressed in the absence of the other genes in the
cluster, we expected the ACE1 compound to be a tetramic acid, or at least to be nitrogen
containing (a polyketide-amino acid peptide perhaps).
6.2 Results
Given the impressive green fluorescence observed in the clones selected for analysis,
we expected to see significant new compound(s) in the secondary metabolite profile of
the cultures. It had been expected that the expression of ACE1 PKS alone and ACE1
would produce different metabolites, however this was not observed. Analysis of the
crude extract of A. oryzae pTAex3Ace1PKSeGFP and A. oryzae pTAex3ACE1eGFP
revealed that in both transformants, two significant compounds (A and B) were
produced (which were not naturally occurring at some level within a WT A. oryzae
control sample) (Figure 83).
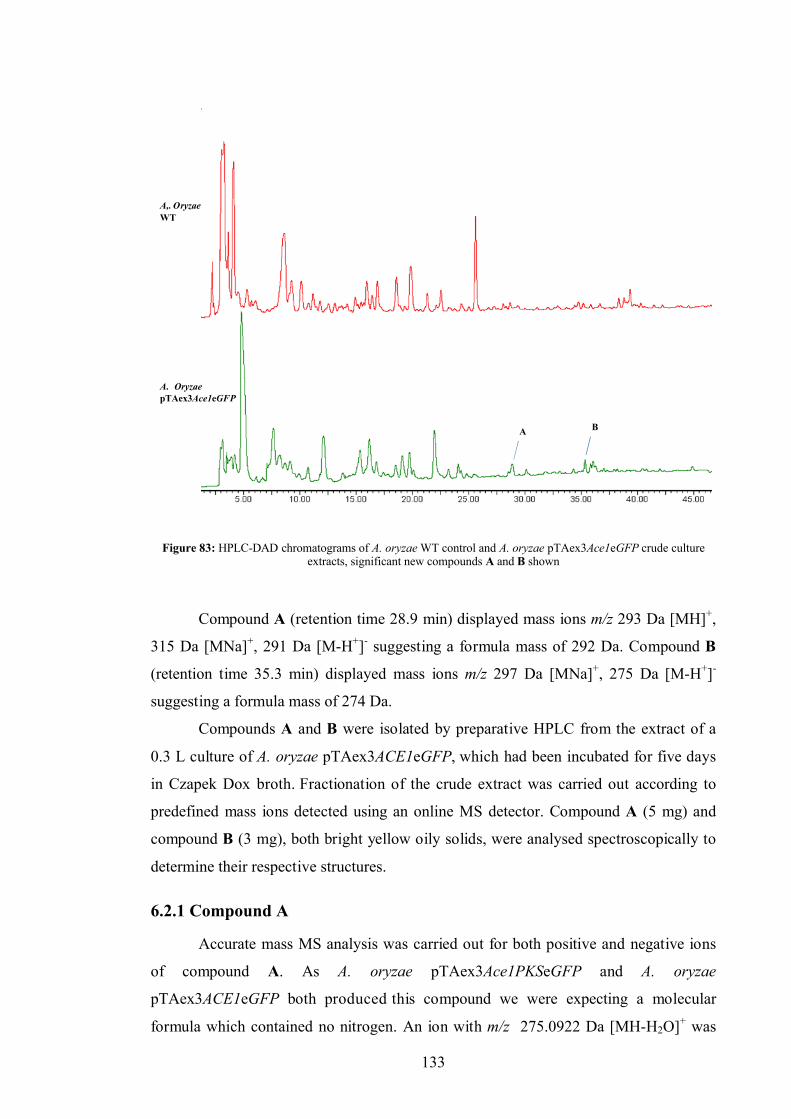
133
A. OryzaepTAex3Ace1eGFP
A,. OryzaeWT
A B
Figure 83: HPLC-DAD chromatograms of A. oryzae WT control and A. oryzae pTAex3Ace1eGFP crude culture extracts, significant new compounds A and B shown
Compound A (retention time 28.9 min) displayed mass ions m/z 293 Da [MH]+,
315 Da [MNa]+, 291 Da [M-H+]- suggesting a formula mass of 292 Da. Compound B
(retention time 35.3 min) displayed mass ions m/z 297 Da [MNa]+, 275 Da [M-H+]-
suggesting a formula mass of 274 Da.
Compounds A and B were isolated by preparative HPLC from the extract of a
0.3 L culture of A. oryzae pTAex3ACE1eGFP, which had been incubated for five days
in Czapek Dox broth. Fractionation of the crude extract was carried out according to
predefined mass ions detected using an online MS detector. Compound A (5 mg) and
compound B (3 mg), both bright yellow oily solids, were analysed spectroscopically to
determine their respective structures.
6.2.1 Compound A
Accurate mass MS analysis was carried out for both positive and negative ions
of compound A. As A. oryzae pTAex3Ace1PKSeGFP and A. oryzae
pTAex3ACE1eGFP both produced this compound we were expecting a molecular
formula which contained no nitrogen. An ion with m/z 275.0922 Da [MH-H2O]+ was
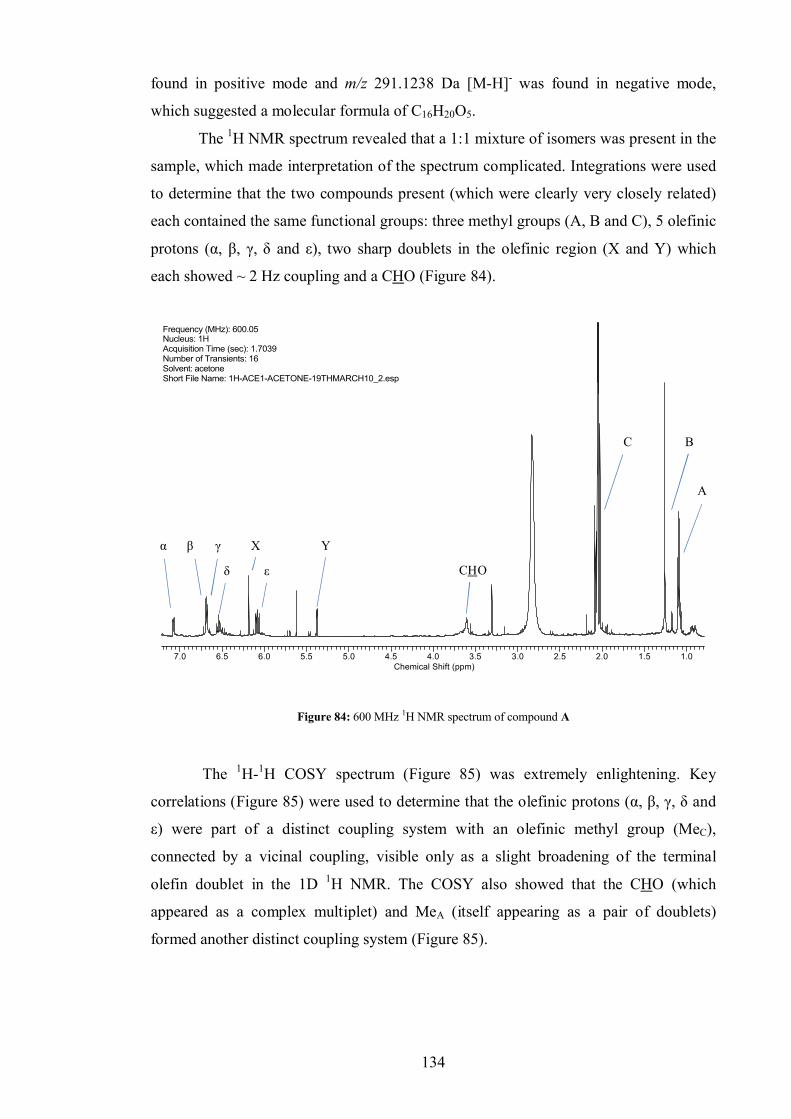
134
found in positive mode and m/z 291.1238 Da [M-H]- was found in negative mode,
which suggested a molecular formula of C16H20O5.
The 1H NMR spectrum revealed that a 1:1 mixture of isomers was present in the
sample, which made interpretation of the spectrum complicated. Integrations were used
to determine that the two compounds present (which were clearly very closely related)
each contained the same functional groups: three methyl groups (A, B and C), 5 olefinic
protons (α, β, γ, δ and ε), two sharp doublets in the olefinic region (X and Y) which
each showed ~ 2 Hz coupling and a CHO (Figure 84).
Frequency (MHz): 600.05Nucleus: 1HAcquisition Time (sec): 1.7039Number of Transients: 16Solvent: acetoneShort File Name: 1H-ACE1-ACETONE-19THMARCH10_2.esp
7.0 6.5 6.0 5.5 5.0 4.5 4.0 3.5 3.0 2.5 2.0 1.5 1.0Chemical Shift (ppm)
A
BC
CHO
α β
δ
Xγ Y
ε
Figure 84: 600 MHz 1H NMR spectrum of compound A
The 1H-1H COSY spectrum (Figure 85) was extremely enlightening. Key
correlations (Figure 85) were used to determine that the olefinic protons (α, β, γ, δ and
ε) were part of a distinct coupling system with an olefinic methyl group (MeC),
connected by a vicinal coupling, visible only as a slight broadening of the terminal
olefin doublet in the 1D 1H NMR. The COSY also showed that the CHO (which
appeared as a complex multiplet) and MeA (itself appearing as a pair of doublets)
formed another distinct coupling system (Figure 85).
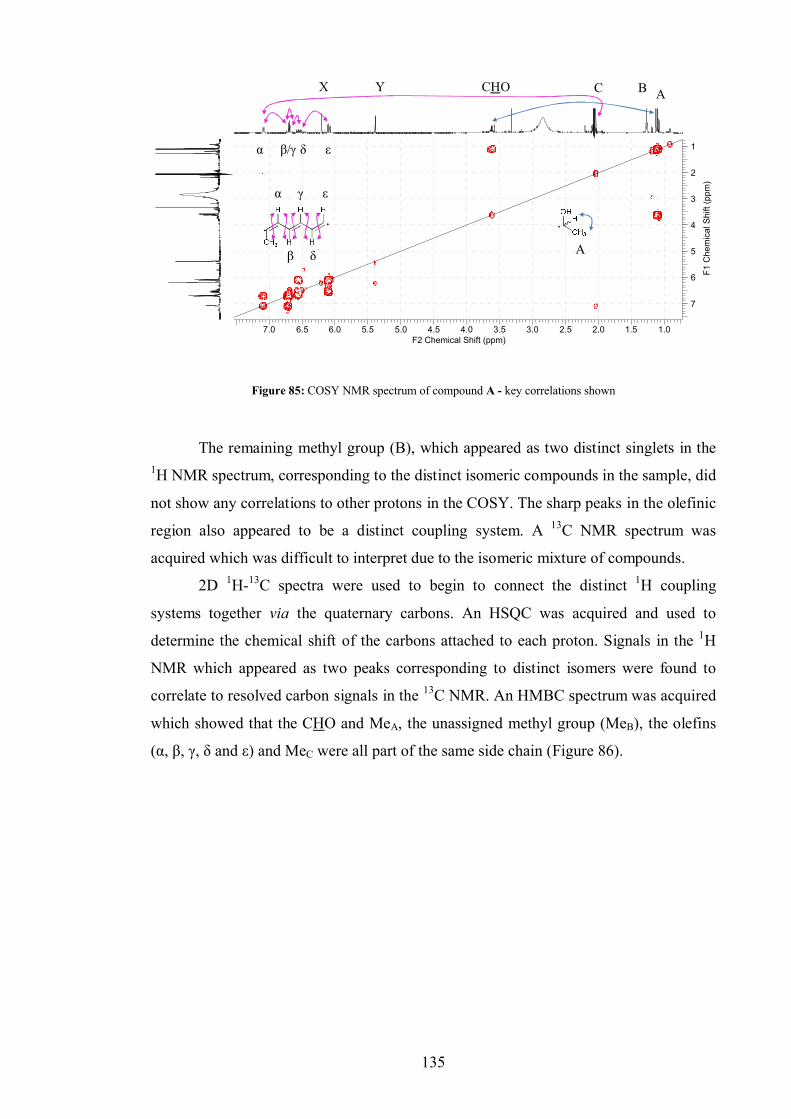
135
7.0 6.5 6.0 5.5 5.0 4.5 4.0 3.5 3.0 2.5 2.0 1.5 1.0F2 Chemical Shift (ppm)
1
2
3
4
5
6
7
F1 C
hem
ical
Shi
ft (p
pm)
ABCCHO
α β/γ δ
X Y
ε
β
γα
δ
ε
A
Figure 85: COSY NMR spectrum of compound A - key correlations shown
The remaining methyl group (B), which appeared as two distinct singlets in the 1H NMR spectrum, corresponding to the distinct isomeric compounds in the sample, did
not show any correlations to other protons in the COSY. The sharp peaks in the olefinic
region also appeared to be a distinct coupling system. A 13C NMR spectrum was
acquired which was difficult to interpret due to the isomeric mixture of compounds.
2D 1H-13C spectra were used to begin to connect the distinct 1H coupling
systems together via the quaternary carbons. An HSQC was acquired and used to
determine the chemical shift of the carbons attached to each proton. Signals in the 1H
NMR which appeared as two peaks corresponding to distinct isomers were found to
correlate to resolved carbon signals in the 13C NMR. An HMBC spectrum was acquired
which showed that the CHO and MeA, the unassigned methyl group (MeB), the olefins
(α, β, γ, δ and ε) and MeC were all part of the same side chain (Figure 86).
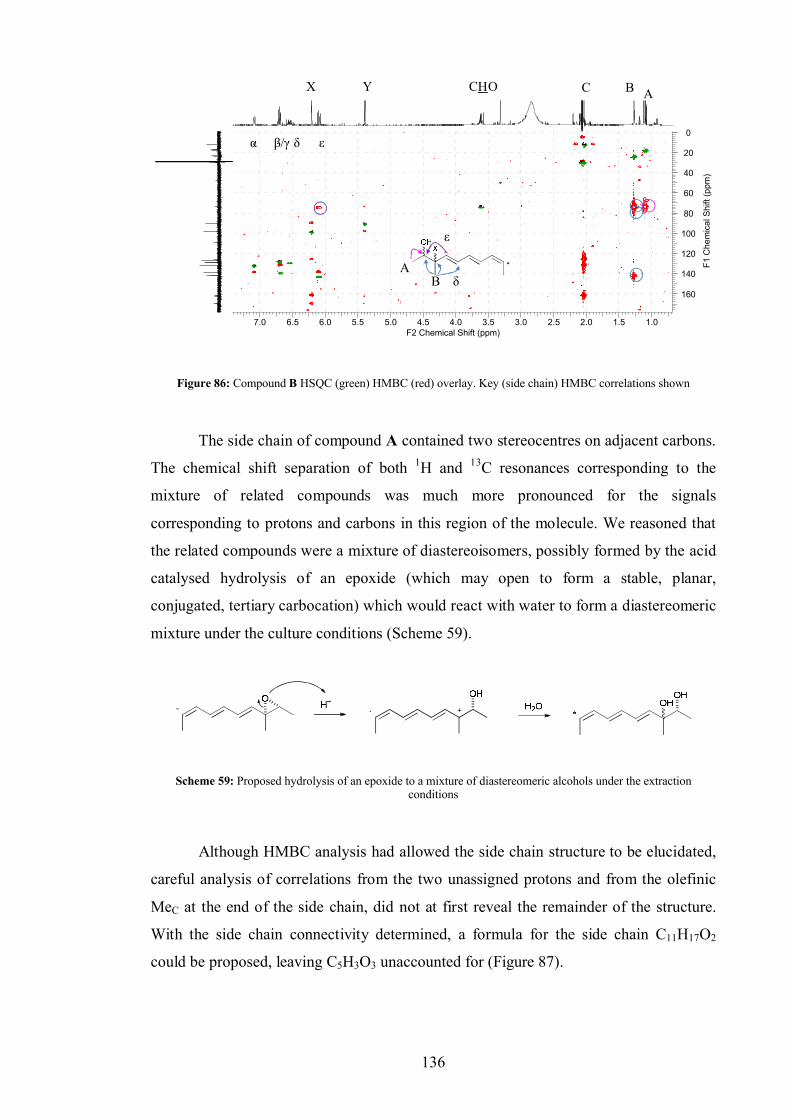
136
7.0 6.5 6.0 5.5 5.0 4.5 4.0 3.5 3.0 2.5 2.0 1.5 1.0F2 Chemical Shift (ppm)
0
20
40
60
80
100
120
140
160
F1 C
hem
ical
Shi
ft (p
pm)
ABCCHO
α β/γ δ
X Y
ε
ε
δA
B
Figure 86: Compound B HSQC (green) HMBC (red) overlay. Key (side chain) HMBC correlations shown
The side chain of compound A contained two stereocentres on adjacent carbons.
The chemical shift separation of both 1H and 13C resonances corresponding to the
mixture of related compounds was much more pronounced for the signals
corresponding to protons and carbons in this region of the molecule. We reasoned that
the related compounds were a mixture of diastereoisomers, possibly formed by the acid
catalysed hydrolysis of an epoxide (which may open to form a stable, planar,
conjugated, tertiary carbocation) which would react with water to form a diastereomeric
mixture under the culture conditions (Scheme 59).
Scheme 59: Proposed hydrolysis of an epoxide to a mixture of diastereomeric alcohols under the extraction conditions
Although HMBC analysis had allowed the side chain structure to be elucidated,
careful analysis of correlations from the two unassigned protons and from the olefinic
MeC at the end of the side chain, did not at first reveal the remainder of the structure.
With the side chain connectivity determined, a formula for the side chain C11H17O2
could be proposed, leaving C5H3O3 unaccounted for (Figure 87).
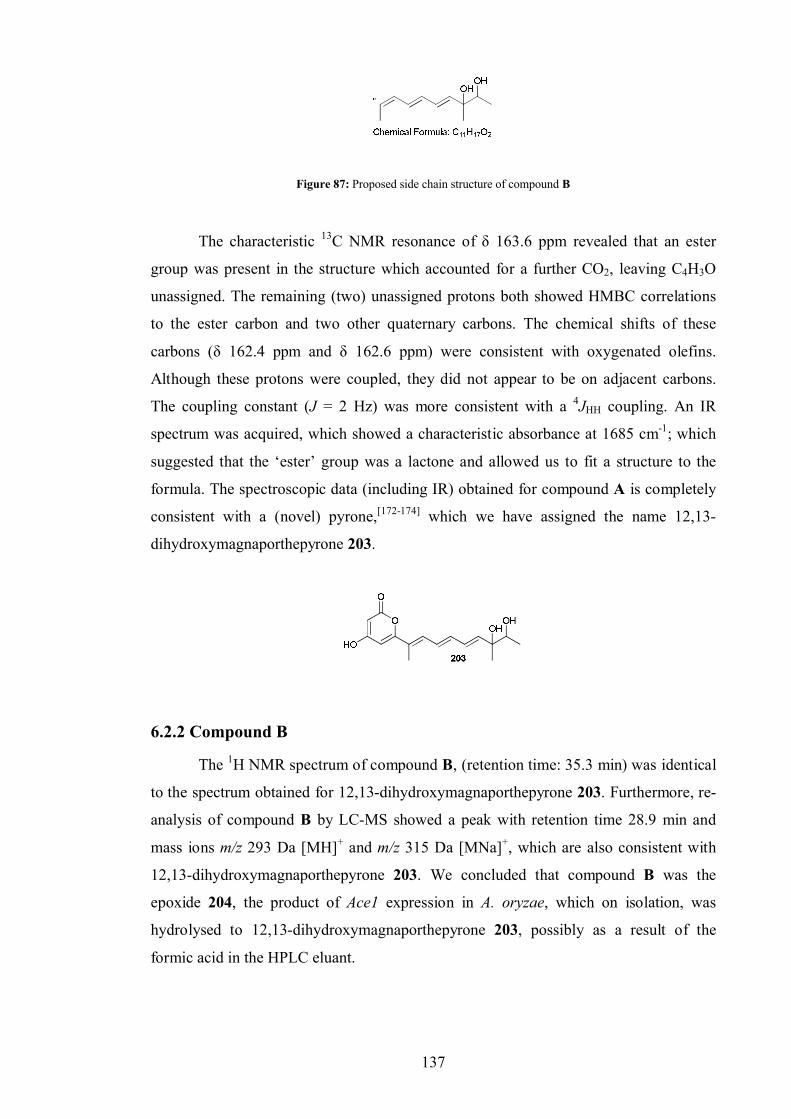
137
Figure 87: Proposed side chain structure of compound B
The characteristic 13C NMR resonance of δ 163.6 ppm revealed that an ester
group was present in the structure which accounted for a further CO2, leaving C4H3O
unassigned. The remaining (two) unassigned protons both showed HMBC correlations
to the ester carbon and two other quaternary carbons. The chemical shifts of these
carbons (δ 162.4 ppm and δ 162.6 ppm) were consistent with oxygenated olefins.
Although these protons were coupled, they did not appear to be on adjacent carbons.
The coupling constant (J = 2 Hz) was more consistent with a 4JHH coupling. An IR
spectrum was acquired, which showed a characteristic absorbance at 1685 cm-1; which
suggested that the ‘ester’ group was a lactone and allowed us to fit a structure to the
formula. The spectroscopic data (including IR) obtained for compound A is completely
consistent with a (novel) pyrone,[172-174] which we have assigned the name 12,13-
dihydroxymagnaporthepyrone 203.
6.2.2 Compound B
The 1H NMR spectrum of compound B, (retention time: 35.3 min) was identical
to the spectrum obtained for 12,13-dihydroxymagnaporthepyrone 203. Furthermore, re-
analysis of compound B by LC-MS showed a peak with retention time 28.9 min and
mass ions m/z 293 Da [MH]+ and m/z 315 Da [MNa]+, which are also consistent with
12,13-dihydroxymagnaporthepyrone 203. We concluded that compound B was the
epoxide 204, the product of Ace1 expression in A. oryzae, which on isolation, was
hydrolysed to 12,13-dihydroxymagnaporthepyrone 203, possibly as a result of the
formic acid in the HPLC eluant.
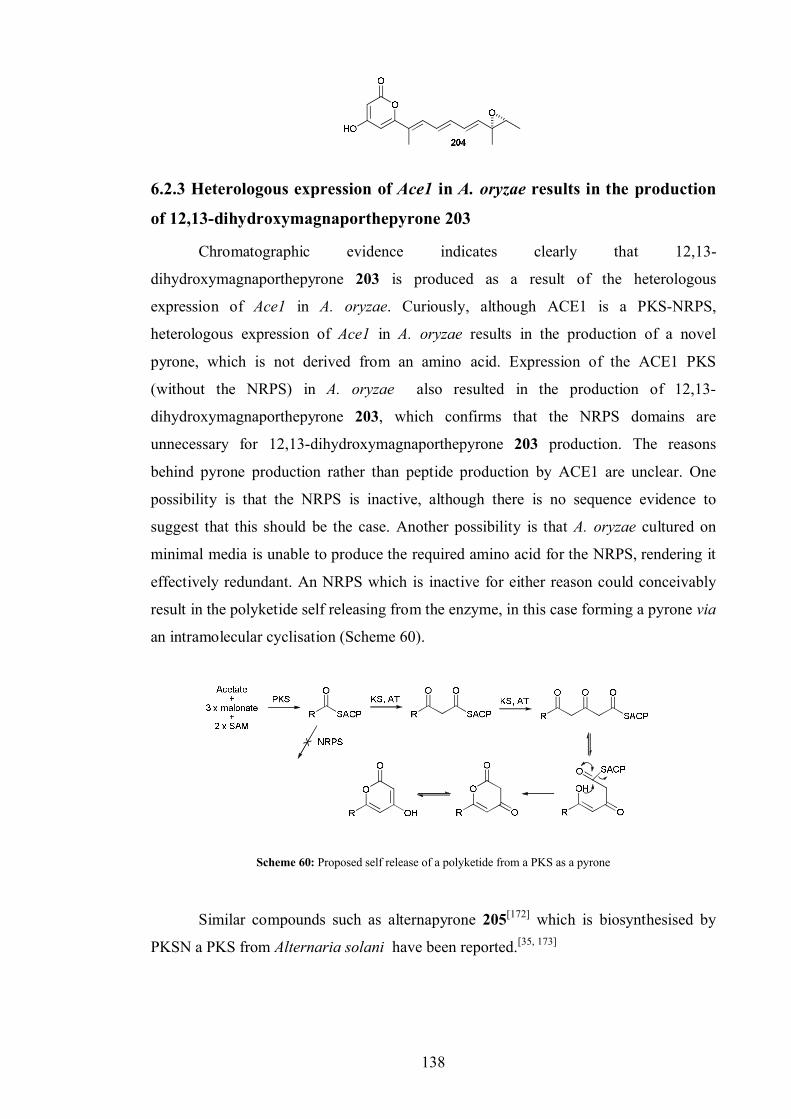
138
6.2.3 Heterologous expression of Ace1 in A. oryzae results in the production
of 12,13-dihydroxymagnaporthepyrone 203
Chromatographic evidence indicates clearly that 12,13-
dihydroxymagnaporthepyrone 203 is produced as a result of the heterologous
expression of Ace1 in A. oryzae. Curiously, although ACE1 is a PKS-NRPS,
heterologous expression of Ace1 in A. oryzae results in the production of a novel
pyrone, which is not derived from an amino acid. Expression of the ACE1 PKS
(without the NRPS) in A. oryzae also resulted in the production of 12,13-
dihydroxymagnaporthepyrone 203, which confirms that the NRPS domains are
unnecessary for 12,13-dihydroxymagnaporthepyrone 203 production. The reasons
behind pyrone production rather than peptide production by ACE1 are unclear. One
possibility is that the NRPS is inactive, although there is no sequence evidence to
suggest that this should be the case. Another possibility is that A. oryzae cultured on
minimal media is unable to produce the required amino acid for the NRPS, rendering it
effectively redundant. An NRPS which is inactive for either reason could conceivably
result in the polyketide self releasing from the enzyme, in this case forming a pyrone via
an intramolecular cyclisation (Scheme 60).
Scheme 60: Proposed self release of a polyketide from a PKS as a pyrone
Similar compounds such as alternapyrone 205[172] which is biosynthesised by
PKSN a PKS from Alternaria solani have been reported.[35, 173]
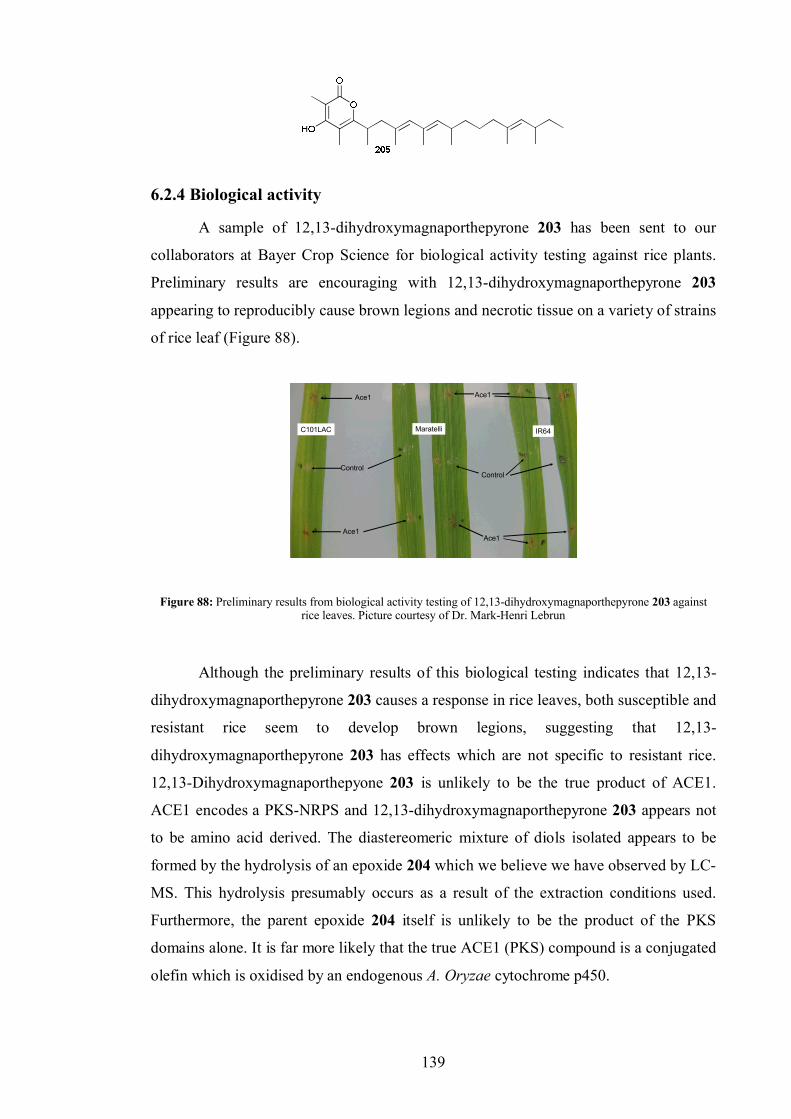
139
6.2.4 Biological activity
A sample of 12,13-dihydroxymagnaporthepyrone 203 has been sent to our
collaborators at Bayer Crop Science for biological activity testing against rice plants.
Preliminary results are encouraging with 12,13-dihydroxymagnaporthepyrone 203
appearing to reproducibly cause brown legions and necrotic tissue on a variety of strains
of rice leaf (Figure 88).
Ace1
Control
Ace1
Ace1
Control
Ace1
C101LAC Maratelli IR64
Figure 88: Preliminary results from biological activity testing of 12,13-dihydroxymagnaporthepyrone 203 against rice leaves. Picture courtesy of Dr. Mark-Henri Lebrun
Although the preliminary results of this biological testing indicates that 12,13-
dihydroxymagnaporthepyrone 203 causes a response in rice leaves, both susceptible and
resistant rice seem to develop brown legions, suggesting that 12,13-
dihydroxymagnaporthepyrone 203 has effects which are not specific to resistant rice.
12,13-Dihydroxymagnaporthepyone 203 is unlikely to be the true product of ACE1.
ACE1 encodes a PKS-NRPS and 12,13-dihydroxymagnaporthepyrone 203 appears not
to be amino acid derived. The diastereomeric mixture of diols isolated appears to be
formed by the hydrolysis of an epoxide 204 which we believe we have observed by LC-
MS. This hydrolysis presumably occurs as a result of the extraction conditions used.
Furthermore, the parent epoxide 204 itself is unlikely to be the product of the PKS
domains alone. It is far more likely that the true ACE1 (PKS) compound is a conjugated
olefin which is oxidised by an endogenous A. Oryzae cytochrome p450.
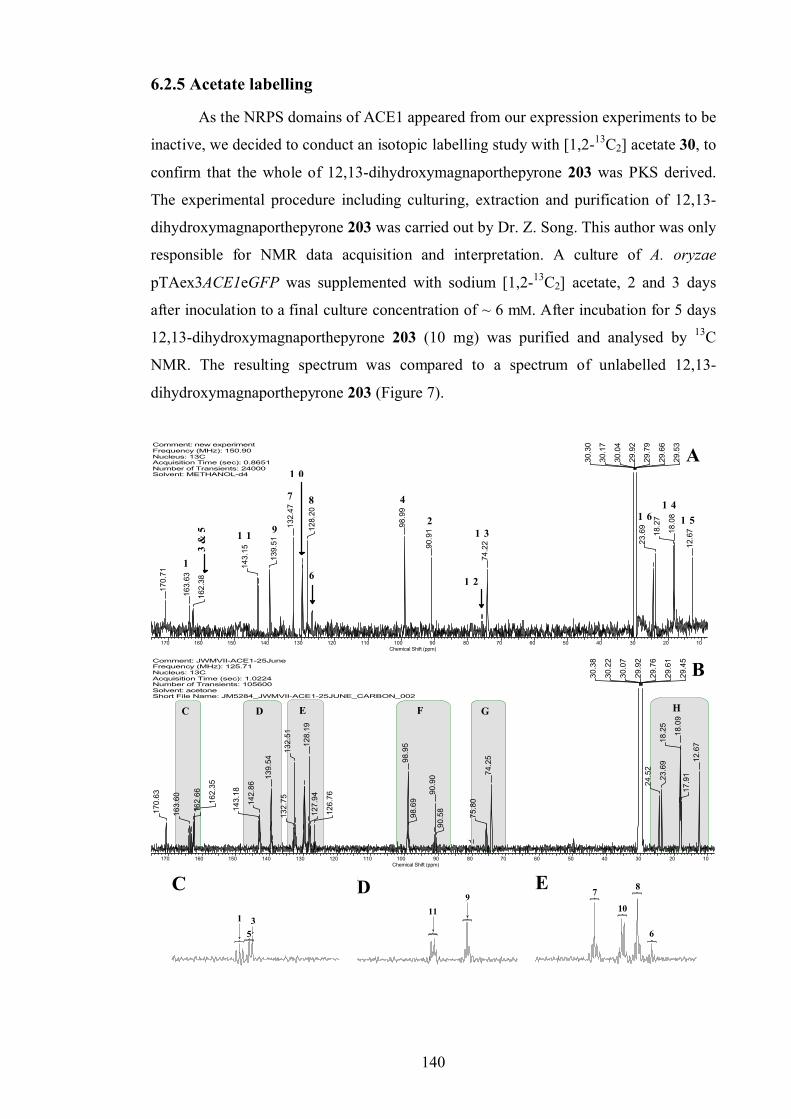
140
6.2.5 Acetate labelling
As the NRPS domains of ACE1 appeared from our expression experiments to be
inactive, we decided to conduct an isotopic labelling study with [1,2-13C2] acetate 30, to
confirm that the whole of 12,13-dihydroxymagnaporthepyrone 203 was PKS derived.
The experimental procedure including culturing, extraction and purification of 12,13-
dihydroxymagnaporthepyrone 203 was carried out by Dr. Z. Song. This author was only
responsible for NMR data acquisition and interpretation. A culture of A. oryzae
pTAex3ACE1eGFP was supplemented with sodium [1,2-13C2] acetate, 2 and 3 days
after inoculation to a final culture concentration of ~ 6 mM. After incubation for 5 days
12,13-dihydroxymagnaporthepyrone 203 (10 mg) was purified and analysed by 13C
NMR. The resulting spectrum was compared to a spectrum of unlabelled 12,13-
dihydroxymagnaporthepyrone 203 (Figure 7).
Comment: new experimentFrequency (MHz): 150.90Nucleus: 13CAcquisition Time (sec): 0.8651Number of Transients: 24000Solvent: METHANOL-d4Short File Name: 13C-ACE1-ACETONE-18THMARCH10
170 160 150 140 130 120 110 100 90 80 70 60 50 40 30 20 10Chemical Shift (ppm)
170.
71
163.
63
162.
38
143.
15
139.
51
132.
47
128.
20
98.9
9
90.9
1
79.3
1
74.2
2
30.3
0
30.1
7
30.0
4
29.9
2
29.7
9
29.6
6
29.5
3
23.6
9
18.2
7
18.0
8
12.6
7
1 5
A
1 41 6
1 3
1 2
2
48
1
3 &
5 1 1 9
7
1 0
6
Comment: JWMVII-ACE1-25JuneFrequency (MHz): 125.71Nucleus: 13CAcquisition Time (sec): 1.0224Number of Transients: 105600Solvent: acetoneShort File Name: JM5284_JWMVII-ACE1-25JUNE_CARBON_002
170 160 150 140 130 120 110 100 90 80 70 60 50 40 30 20 10Chemical Shift (ppm)
12.6
717
.91
18.0
9
18.2
523
.69
24.5
2
29.4
5
29.6
1
29.7
6
29.9
2
30.0
7
30.2
2
30.3
8
74.2
5
75.8
0
80.5
7
90.5
890
.90
98.6
998
.95
126.
76
127.
9412
8.19
132.
5113
2.75
139.
54
142.
86
143.
18
162.
35
162.
66
163.
60
170.
63
B
C D E F G H
Comment: JWMVII-ACE1-25JuneFrequency (MHz): 125.71Nucleus: 13CAcquisition Time (sec): 1.0224Number of Transients: Solvent: acetone
1
C
53
Comment: JWMVII-ACE1-25JuneFrequency (MHz): 125.71Nucleus: 13CAcquisition Time (sec): 1.0224Number of Transients: Solvent: acetone
119
D
Comment: JWMVII-ACE1-25JuneFrequency (MHz): 125.71Nucleus: 13CAcquisition Time (sec): 1.0224Number of Transients: Solvent: acetone
7E 8
10
6
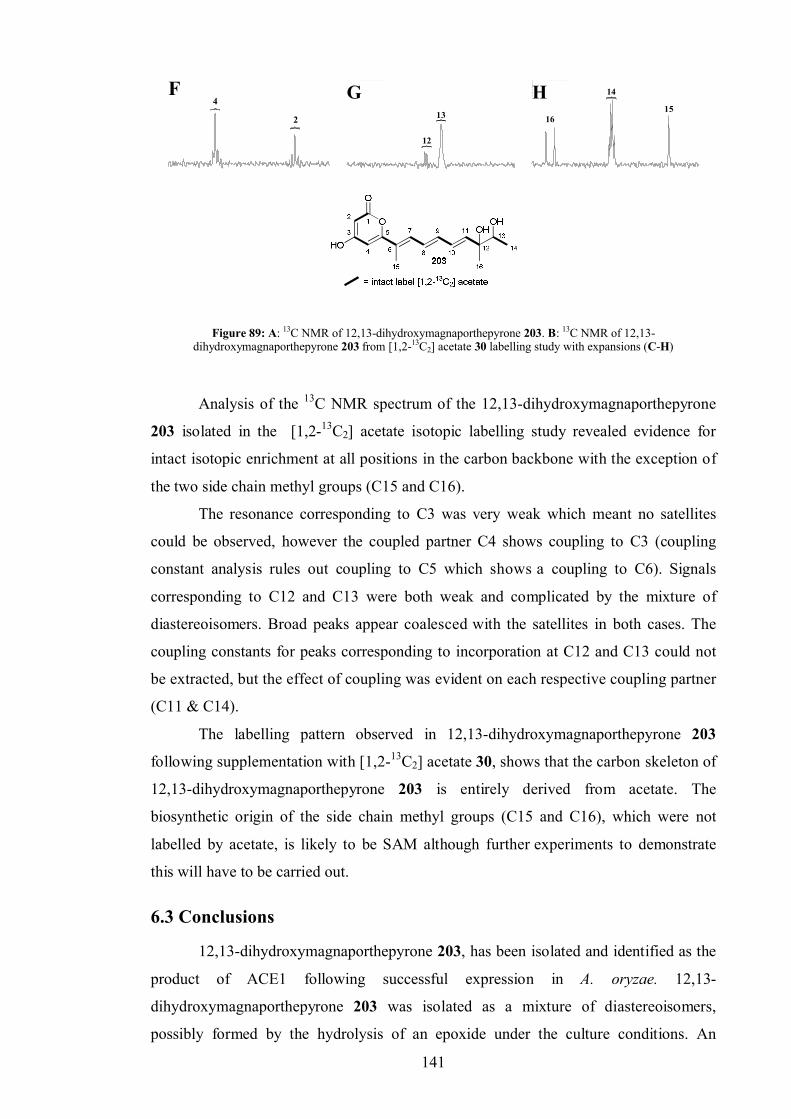
141
Comment: JWMVII-ACE1-25JuneFrequency (MHz): 125.71Nucleus: 13CAcquisition Time (sec): 1.0224Number of Transients: Solvent: acetone
4F
2
Comment: JWMVII-ACE1-25JuneFrequency (MHz): 125.71Nucleus: 13CAcquisition Time (sec): 1.0224Number of Transients: Solvent: acetone
13
12
G
Comment: JWMVII-ACE1-25JuneFrequency (MHz): 125.71Nucleus: 13CAcquisition Time (sec): 1.0224Number of Transients: Solvent: acetone
16
H 14
15
Figure 89: A: 13C NMR of 12,13-dihydroxymagnaporthepyrone 203. B: 13C NMR of 12,13-dihydroxymagnaporthepyrone 203 from [1,2-13C2] acetate 30 labelling study with expansions (C-H)
Analysis of the 13C NMR spectrum of the 12,13-dihydroxymagnaporthepyrone
203 isolated in the [1,2-13C2] acetate isotopic labelling study revealed evidence for
intact isotopic enrichment at all positions in the carbon backbone with the exception of
the two side chain methyl groups (C15 and C16).
The resonance corresponding to C3 was very weak which meant no satellites
could be observed, however the coupled partner C4 shows coupling to C3 (coupling
constant analysis rules out coupling to C5 which shows a coupling to C6). Signals
corresponding to C12 and C13 were both weak and complicated by the mixture of
diastereoisomers. Broad peaks appear coalesced with the satellites in both cases. The
coupling constants for peaks corresponding to incorporation at C12 and C13 could not
be extracted, but the effect of coupling was evident on each respective coupling partner
(C11 & C14).
The labelling pattern observed in 12,13-dihydroxymagnaporthepyrone 203
following supplementation with [1,2-13C2] acetate 30, shows that the carbon skeleton of
12,13-dihydroxymagnaporthepyrone 203 is entirely derived from acetate. The
biosynthetic origin of the side chain methyl groups (C15 and C16), which were not
labelled by acetate, is likely to be SAM although further experiments to demonstrate
this will have to be carried out.
6.3 Conclusions
12,13-dihydroxymagnaporthepyrone 203, has been isolated and identified as the
product of ACE1 following successful expression in A. oryzae. 12,13-
dihydroxymagnaporthepyrone 203 was isolated as a mixture of diastereoisomers,
possibly formed by the hydrolysis of an epoxide under the culture conditions. An
142
isotopic labelling experiment using [1,2-13C2] acetate 30 has been conducted which
demonstrates that the backbone of 12,13-dihydroxymagnaporthepyrone 203 is entirely
derived from acetate, suggesting that the NRPS section of ACE1 is inactive for some
reason. This could either be due to inactivity of one of the NRPS domains, or perhaps
indicates that A. oryzae cultured on Czapek Dox medium is unable to produce the
required amino acid for the NRPS, which may be unusual. Further experiments are
expected to be performed in due course to investigate this further. Interestingly 12,13-
dihydroxymagnaporthepyrone 203 itself appears to have an observable effect on rice
leaves, suggesting that the PKS product alone may be sufficient to trigger a response to
avirulent M. grisea infection in resistant rice.
6.4 Further work
A [1-13C] methionine 103 feed to confirm the biosynthetic origin of the side
chain methyl group carbons (C-15 and C-16) is planned for the near future.
To probe the apparent inactivity of the NRPS section of ACE1 further, work is
also being carried out to study the expression if Ace1 under a controllable promoter in
M. grisea. There are also plans to cultivate A. oryzae pTAex3Ace1eGFP and hopefully
M. grisea pTAex3Ace1eGFP in the presence of rice leaves as it is possible that an
unusual amino acid is involved in the biosynthesis of the ACE1 compound. This amino
acid may be obtained by avirulent M. grisea from the rice leaves rather than from M.
grisea itself.
143
Experimental
General Methods
Culturing strains of P. luminescens TT01 and StlA
Strains of wild type P. luminescens, StlA and plu1884 were cultured in Luria-Bertani
(LB) aqueous media (10 g tryptone, 5 g NaCl & 5 g yeast extract L-1) or on LB agar
(LB media containing 1.5% w/w agar). All media, flasks and equipment used were
sterilised in an autoclave or flame before use.
Agar plates were inoculated using a sterile wire loop and incubated for 48 h at
~30 ˚C. Following this incubation the plates of bacteria were stored at room temperature
until required or until fresh plates were made. Plates of all strains were typically re-
inoculated onto fresh agar each week, as it was found that the culture lifetime of the
bacteria was short (often < 2 weeks) at room temperature and even shorter when
refrigerated. Aqueous broths of all strains of Photorhabdus were prepared by
inoculation of liquid (seed) culture (1 mL into 100 mL) into a flask of LB media, and
incubated for 48 h (30 ˚C 200 rpm) unless otherwise stated. Seed cultures were
prepared by inoculation of single pigmented colonies of bacteria using a toothpick into
aqueous media (3 mL) which was incubated overnight (30 ˚C 200 rpm).
For storage (>1 week) stocks of the bacteria were prepared by introducing
sterilised glycerol solution (final concentration 20% v/v glycerol) to the cultures and
storing at -80 ˚C.
Labelled compounds and p-fluorocinnamates were added to cultures of StlA
and plu1884 as required (typically ~40 mM). Solutions were prepared in EtOH,
MeOH, de-ionised H2O or 50:50 EtOH:MeOH and sterilised by micro filtration using a
biological filter with pore size 0.25 m.
Extraction of secondary metabolites from cultures of P. luminescens
The bacterial cells were removed from their supernatant solutions by centrifugation
(8000 rpm, 20 min) using an F10-SLA rotor in a (Thermo) RC6 centrifuge. The culture
supernatant (typically 1 L) was then extracted into EtOAc (3 x 1.5 L). The crude extract
was then evaporated to dryness using a rotary evaporator (25 ˚C). Finally to remove the
remaining solvent, the crude extract was put under high vacuum for a few hours.
144
Culturing F. sacchari
F. sacchari was cultured in Czapek dox broth (100 mL per 250 mL flask) at 28 °C,
shaking at 200 rpm on an orbital gyratory shaker for a typical incubation period of 10
days. All broth cultures were inoculated with 300 μL of spore suspension and all agar
cultures were inoculated with 80 μL of spore suspension containing 1010 spores mL-1
per 100 mL of medium
Culturing A. oryzae transformants
A. oryzae transformants were cultured in Czapek Dox broth containing 1% polypeptone
and 2% glucose (seed culture) or 2% starch (production medium). After inoculation
cultures were incubated at 30 °C, shaking at 200 rpm. Seed cultures were incubated for
for 72 h, production cultures for 96 h.
Extraction of secondary metabolites from A. oryzae transformants and
cultures of F. sacchari
The whole broth culture of F. sacchari (100 mL) was homogenised then filtered. The
filtrate was acidified (pH 4) by addition of cHCl (aq), then extracted into EtOAc (2 ×
100 mL) and the organic solvent was evaporated under vacuum to afford a crude extract
(400 mg L-1). The extract was re-dissolved in acetone (at 100 mg mL-1) for HPLC
analysis.
F. sacchari biological assays
Antibacterial bioassays were carried out using crude extract (50 mg mL-1), Fusaric acid
122 (5 mg mL-1) and Fusarachromene 123 (5.6 mg mL-1) along with kanamycin (10 mg
mL-1) as positive control and solvent (acetone) as negative control. 100 mL cultures of
bacterial cells (Escherichia coli and Bacillus subtilis) were grown overnight,
centrifuged and the cells resuspended in 25 mL of 10 mM MgSO4. 300 µL of this
bacterial suspension was plated onto LB agar plates using top agarose to form a uniform
layer. 25, 50, and 75 µL of the test solutions was added in small holes made on the plate
after the top agarose had set. The plates were incubated at 37 oC overnight and the area
of growth inhibition was recorded. The same concentrations of test solutions were also
applied directly to sugarcane leaves and the effects were observed after 24 h for any
cytotoxic activity.
145
Antifungal bioassays against Saccharomyces cervisiae was conducted in the
same manner as the antibacterial bioassays. Basta (Glufosinate ammonium, 25 mg mL-
1) and acetone were used as controls.
Analysis of compounds and mixtures by TLC
Unless otherwise stated all TLC analysis was carried as follows. The analytes (typically
in CH2Cl2 solution) were applied to a glass backed silica TLC plate [60 F254 (Merck)],
using a drawn capillary. The TLC was then developed using EtOAc:Hexane as the
solvent system. For analysis of crude P. luminescens extract this was a 50:50 mixture.
For analysis of reaction mixtures this was a 20:80 mixture. TLC plates were visualised
using UV light, typically with both the LW (365 nm) and SW (254 nm) lamps.
Synthetically produced compounds and crude reaction mixtures plates were also
typically visualised using a permanganate dip [KMnO4 (3 g), K2CO3 (20 g), 5%
NaOH(aq) (5 mL) and H2O (300 mL)], ammonium molybdate dip [Ammonium
molybdate (5 g), ceric sulphate (0.2 g) and 5% H2SO4 (aq) (100 mL)], or anisaldehyde
dip [cH2SO4 (2.5 mL) is added to anisaldehyde (15 g) in EtOH (250 mL)] (with
heating).
Separation of components of crude P. luminescens and F. sacchari extracts
by flash chromatography
Crude extract was dry loaded onto a column packed with silica gel (particle size 80
m). The column was eluted at a rate 4-5 x faster than gravity (under N2) with 9:1
Hexane:EtOAc
The fractions were then analysed by TLC, and pure fractions containing analytes
of interest were combined, evaporated to dryness on a rotary evaporator and then re-
dissolved and evaporated from CH2Cl2 several times. Samples were then dried in vacuo
and weighed.
GCMS method
Injection volume: 1 L.
Inlet temp: 300°C.
Injection mode: Split
Split ratio: 1
Mobile Phase: Helium.
Flow control: Constant pressure.
146
Column: Varian CP-SIL 5CB 30 m x 0.25 mm, 0.25 µm
Pressure: 66.8 KPa
Oven program:
Rate Temp / °C Hold / min
------ 50 1
10 300 0
Equilibration time: 1 min.
GCMS-QP20103
Interface temp: 200 °C.
IonSource temp: 300 °C.
Scan: m/z 50 to 650 Da.
HPLC methods
Method: SQTKS
Injection volume 20 µL
Column: Phenomenex Luna C18(2) 250 x 4.5 mm, 5 µ particle size
Column temperature: Ambient
Mobile phase A: Water containing 0.05% v/v Formic Acid
Mobile phase B: MeCN containing 0.05% v/v Formic Acid
Flow rate: 1 mL min-1
Gradient program: 5% B, hold for 5 min. 5% B to 75% B over 37 min, then 75% B to
90% B over 3 min. Hold for 5 min. 90% B to 5% B over 5 min, hold for 5 min.
Diode array detector: 210 – 400 nm.
Method: 20 minute ramp
Injection volume 20 µL
Column: Phenomenex Luna C18(2) 250 x 4.5 mm, 5 µ particle size
Column temperature: Ambient
Mobile phase A: Water containing 0.05% v/v Formic Acid
Mobile phase B: MeOH containing 0.05% v/v Formic Acid
Flow rate: 1 mL min-1
Gradient program: 25% B to 95% B over 13 min. Hold for 2 min. 95% B to 25% B over
2 min, hold for 2 min.
Diode array detector: 210 – 400 nm.
147
ELSD: Gas Pressure: 50.0 psi
Gain: 500.0
Nebulizer Heating: 60% power
Drift Tube Temperature: 80.0 °C
ESI+ MS scan: m/z 150 – 650 Da
ESI- MS scan: m/z 150 – 650 Da
Method: 20 minute ramp PREP
Injection volume 50 - 800 µL
Column: Phenomenex Luna C18(2) 250 x 10 mm, 5 µ particle size
Column temperature: Ambient
Mobile phase A: Water containing 0.05% v/v Formic Acid
Mobile phase B: MeOH containing 0.05% v/v Formic Acid
Flow rate: 4 mL min-1
Gradient program: 25% B to 95% B over 13 min. Hold for 2 min. 95% B to 25% B over
2 min, hold for 2 min.
Diode array detector: 210 – 400 nm.
ELSD: Gas Pressure: 50.0 psi
Gain: 500.0
Nebulizer Heating: 20% power
Drift Tube Temperature: 80.0 °C
ESI+ MS scan: m/z 150 – 650 Da
ESI- MS scan: m/z 150 – 650 Da
Method: 60 minute ramp
Injection volume 20 µL
Column: Phenomenex Luna C18(2) 250 x 4.5 mm, 5 µ particle size
Column temperature: Ambient
Mobile phase A: Water containing 0.05% v/v Formic Acid
Mobile phase B: MeOH containing 0.05% v/v Formic Acid
Flow rate: 1 mL min-1
Gradient program: 25% B to 95% B over 51 min. Hold for 2 min. 95% B to 25% B over
2 min, hold for 5 min.
Diode array detector: 210 – 400 nm.
ELSD: Gas Pressure: 50.0 psi
148
Gain: 500.0
Nebulizer Heating: 60% power
Drift Tube Temperature: 80.0 °C
ESI+ MS scan: m/z 150 – 650 Da
ESI- MS scan: m/z 150 – 650 Da
Method: 60 minute ramp PREP
Injection volume 50 - 800 µL
Column: Phenomenex Luna C18(2) 250 x 10 mm, 5 µ particle size
Column temperature: Ambient
Mobile phase A: Water containing 0.05% v/v Formic Acid
Mobile phase B: MeOH containing 0.05% v/v Formic Acid
Flow rate: 4 mL min-1
Gradient program: 25% B to 95% B over 51 min. Hold for 2 min. 95% B to 25% B over
2 min, hold for 5 min.
Diode array detector: 210 – 400 nm.
ELSD: Gas Pressure: 50.0 psi
Gain: 500.0
Nebulizer Heating: 20% power
Drift Tube Temperature: 80.0 °C
ESI+ MS scan: m/z 150 – 650 Da
ESI- MS scan: m/z 150 – 650 Da
General MS source parameters (LC-MS)
ESI+ MS scan:
Capillary (kV): 3.30
Cone (V): 35.00
Source Temperature (°C): 120
De-solvation Temperature (°C): 350
Cone Gas Flow (L h-1): 50
De-solvation Gas Flow (L h-1): 600
ESI- MS scan:
Capillary (kV): 3.00
Cone (V): 35.00
Source Temperature (°C): 120
149
De-solvation Temperature (°C): 350
Cone Gas Flow (L h-1): 50
De-solvation Gas Flow (L h-1): 600
Instrumentation
NMR spectra of compounds were obtained using JEOL: Delta GX 270, lambda 300,
Eclipse 300, Delta GX 400, Eclipse 400, or Varian: VNMR 600, iNOVA 600, VNMR
500 or VNMR 400 spectrometers. Unless otherwise stated NMR spectra were acquired
in CDCl3 with the residual CHCl3 (δH 7.27/δC 77.0) signal as a reference. ESIMS were
obtained using a Waters Platform II ESI MS detector, a Waters ZQ MS or a Waters
Quattro Micro triple quad ESI MS. HRESIMS data were obtained using a Bruker
daltonics FT-ICR mass spectrometer. HRMS were obtained using a VG Autospec. IR
spectra were determined on a Perkin Elmer Spectum 400 FT-IR equipped with a
diamond cell. UV absorption was recorded on a Waters 996 Diode Array Detector.
Melting points were determined using a Gallenkamp electro thermal apparatus
and are uncorrected.
GCMS analysis was carried out using a Shimatzu GC-2010 with a GCMS-
QP20103 detector. HPLC and LC-MS analysis was carried out on: a HP 1050 HPLC
system; A dionex summit HPLC system equipped with a Polymer labs ELS2000
evaporative light scattering detector; a waters 600 HPLC system equipped with a PDA
998 diode array detector and a micromass platform II MS detector, or a waters ZQ MS
detector with an ESCi probe, or a Waters system comprising a 2767 sample manager, a
2545 Binary gradient module, a 2998 Photodiode array detector, a waters 2424
Evaporative light scattering detector and a waters Quattro Micro triple quad ESI MS
with a Z spray ESCi MS probe.
Preparative HPLC was carried out using a Dionex Summit HPLC system
equipped with an ISCO foxy jr fraction collector and a Polymer labs ELS2000
evaporative light scattering detector, or on a Waters system comprising a 2767 sample
manager, a 2545 Binary gradient module, a 515 make up pump, a system fluidics
organizer, a 2998 Photodiode array detector, a waters 2424 Evaporative light scattering
detector and a waters Quattro Micro triple quad ESI MS with a Z spray ESCi MS probe.

150
Characteristic data and compound origin.
ST 1[67]
The crude extract was evaporated to dryness. ST 1 (8 mg, 31 mmol) was isolated from
the crude extract of P. luminescens culture supernatant by flash chromatography eluting
1:9 EtOAc:Hexane. ST 1 was isolated as a white crystalline solid.1H NMR (400 MHz CDCl3) 1.37 ppm (6H, d, 3JHH 8, H1’), 3.45 (1H, h, H2’), 6.49 (2H,
s, H2/6), 6.89 (1H, d, 3JHH 16, H8), 6.98 (1H, d, 3JHH 16, H7), 7.25 (2H, d, 3JHH 8, H10/14),
7.34 (1H, t, 3JHH 1, H12), 7.56 (2H, dt, 3JHH 8 3JHH 1, H11/13); 13C NMR (100 MHz
CDCl3) 20.72 ppm (C1’), 24.61 (C2’), 106.82 (C2/6), 120.40 (C4), 126.47 (C12), 127.65
(C7), 127.70 (C10/14), 128.35 (C8), 128.67 (C11/13), 136.14 (C1), 137.14 (C9), 155.08
(C3/5); MS (EI+) m/z (%): 254 (60); 239 (100); 105 (30); MS (CI+) m/z (%): 255 (100)
[MH+]; 239 (50); 213 (30); 107 (25).
-Angelica lactone 94[91]
-Angelica lactone 95 (10.0 g, 0.102 mmol) and Et3N (1 mL, 1.0 g, 1.1 mmol, 10 mol
%) were added to a clean dry round bottomed flask. The mixture was heated to reflux
for 17 h. The reaction mixture was columned directly over silica gel eluting 9:1
Hexane:EtOAc. -Angelica lactone 94 (4.15 g, 4.2 mmol, 38%) was obtained as a
colourless oil. 1H NMR (400 MHz CDCl3) 1.46 ppm (3H, d, 3JHH 18.15, H5), 5.15 (2H, m, H4), 6.10
(1H, dd, 3JHH 7.6, 4JHH 1.3, H2), 7.46 (1H, d, 3JHH 18.15, H3); IR max (neat) 2972, 2903,
1676, 1601, 1560 cm-1; MS (CI+) m/z (%): 98 (100) [M]+.

151
Rhabdolactone 2 (synthetic)[90]
To the clean dry weaton vial was added; Boronic acid 92 (200 mg, 1.6 mmol),
[Rh(COD)2BF4].H2O (10 mg, 0.02 mmol, 1 mol%) Dioxane:H2O 10:1 (2 mL) Et3N
(0.12 mL, 0.08 g, 0.8 mmol), -Angelica lactone 94 (0.072 mL, 0.078g, 0.8 mmol). The
mixture was stirred at RT under N2 (g) for 24 h. Rhabdolactone 2 (80 mg, 0.4 mmol
40%) was isolated by flash chromatography eluting 1:9 EtOAc:Hexane as a white solid.
50% unreacted -lactone 94 was also recovered from the column.1H NMR (400 MHz CDCl3) 1.46 ppm (3H, d, 3JHH 6.3, H5), 2.25 (1H, dd, 2JHH 17.7, 3JHH 10.9, H2), 2.77 (1H, dd, 2JHH 17.7, 3JHH 7.9, H2), 2.87 (1H, m, 3JHH 10.9, 3JHH 8.8, 3JHH 8.3, 3JHH 7.9, H3), 4.36 (1H, dq, 3JHH 8.8, 3JHH 6.3, H4), 6.05 (1H, dd, 3JHH 15.9, 3JHH 8.3, H6), 6.53 (1H, d, 3JHH 15.9, H7), 7.36 (5H, m, H9/10/11); 13C NMR (100 MHz
CDCl3) 18.82 ppm (C5), 36.19 (C2), 47.97 (C3), 81.19 (C4), 126.31 (C6), 126.34 (C10),
128.07 (C8), 128.72 (C9), 133.37 (C11), 136.13 (C7), 175.54 (C1); IR max (neat) 3059,
1763, 1599 cm-1; HRMS (EI+) calculated [M]+ 220.0900 found 220.0909.
Fluororhabdolactone 3 (synthetic)
To a clean dry round bottomed flask was added; para-fluoro boronic acid 93 (1.07 g, 6
mmol), [Rh(COD)2BF4].H2O (40 mg, 0.08 mmol, 2 mol%) Dioxane:water 10:1 (2 mL)
Et3N (0.34 mL, 0.34 g, 3.4 mmol), -Angelica lactone 94 (0.31 mL, 0.33 g, 3.4 mmol).
The mixture was stirred at RT under N2 (g) for 504 h. Fluororhabdolactone 3 (60 mg,
0.27 mmol, 5%) was isolated by flash chromatography eluting 1:9 EtOAc:Hexane as a
white solid. 1H NMR (400 MHz CDCl3) 1.45 ppm (3H, d, 3JHH 6.4, H5), 2.55 (1H, dd, 2JHH 17.7, 3JHH 11.0, H2), 2.77 (1H, dd, 2JHH 17.7, 3JHH 8, H2), 2.87 (1H, m, 3JHH 11.0, 3JHH 17.7,
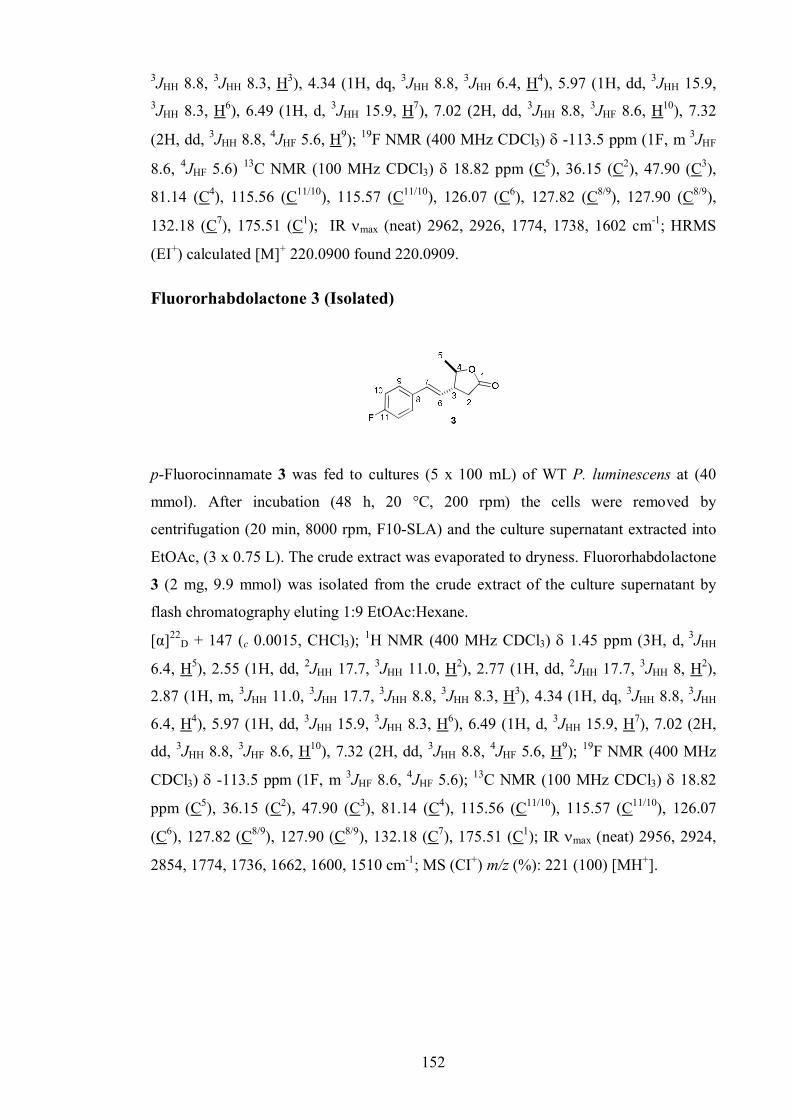
152
3JHH 8.8, 3JHH 8.3, H3), 4.34 (1H, dq, 3JHH 8.8, 3JHH 6.4, H4), 5.97 (1H, dd, 3JHH 15.9, 3JHH 8.3, H6), 6.49 (1H, d, 3JHH 15.9, H7), 7.02 (2H, dd, 3JHH 8.8, 3JHF 8.6, H10), 7.32
(2H, dd, 3JHH 8.8, 4JHF 5.6, H9); 19F NMR (400 MHz CDCl3) -113.5 ppm (1F, m 3JHF
8.6, 4JHF 5.6) 13C NMR (100 MHz CDCl3) 18.82 ppm (C5), 36.15 (C2), 47.90 (C3),
81.14 (C4), 115.56 (C11/10), 115.57 (C11/10), 126.07 (C6), 127.82 (C8/9), 127.90 (C8/9),
132.18 (C7), 175.51 (C1); IR max (neat) 2962, 2926, 1774, 1738, 1602 cm-1; HRMS
(EI+) calculated [M]+ 220.0900 found 220.0909.
Fluororhabdolactone 3 (Isolated)
p-Fluorocinnamate 3 was fed to cultures (5 x 100 mL) of WT P. luminescens at (40
mmol). After incubation (48 h, 20 °C, 200 rpm) the cells were removed by
centrifugation (20 min, 8000 rpm, F10-SLA) and the culture supernatant extracted into
EtOAc, (3 x 0.75 L). The crude extract was evaporated to dryness. Fluororhabdolactone
3 (2 mg, 9.9 mmol) was isolated from the crude extract of the culture supernatant by
flash chromatography eluting 1:9 EtOAc:Hexane.
[α]22D + 147 (c 0.0015, CHCl3); 1H NMR (400 MHz CDCl3) 1.45 ppm (3H, d, 3JHH
6.4, H5), 2.55 (1H, dd, 2JHH 17.7, 3JHH 11.0, H2), 2.77 (1H, dd, 2JHH 17.7, 3JHH 8, H2),
2.87 (1H, m, 3JHH 11.0, 3JHH 17.7, 3JHH 8.8, 3JHH 8.3, H3), 4.34 (1H, dq, 3JHH 8.8, 3JHH
6.4, H4), 5.97 (1H, dd, 3JHH 15.9, 3JHH 8.3, H6), 6.49 (1H, d, 3JHH 15.9, H7), 7.02 (2H,
dd, 3JHH 8.8, 3JHF 8.6, H10), 7.32 (2H, dd, 3JHH 8.8, 4JHF 5.6, H9); 19F NMR (400 MHz
CDCl3) -113.5 ppm (1F, m 3JHF 8.6, 4JHF 5.6); 13C NMR (100 MHz CDCl3) 18.82
ppm (C5), 36.15 (C2), 47.90 (C3), 81.14 (C4), 115.56 (C11/10), 115.57 (C11/10), 126.07
(C6), 127.82 (C8/9), 127.90 (C8/9), 132.18 (C7), 175.51 (C1); IR max (neat) 2956, 2924,
2854, 1774, 1736, 1662, 1600, 1510 cm-1; MS (CI+) m/z (%): 221 (100) [MH+].
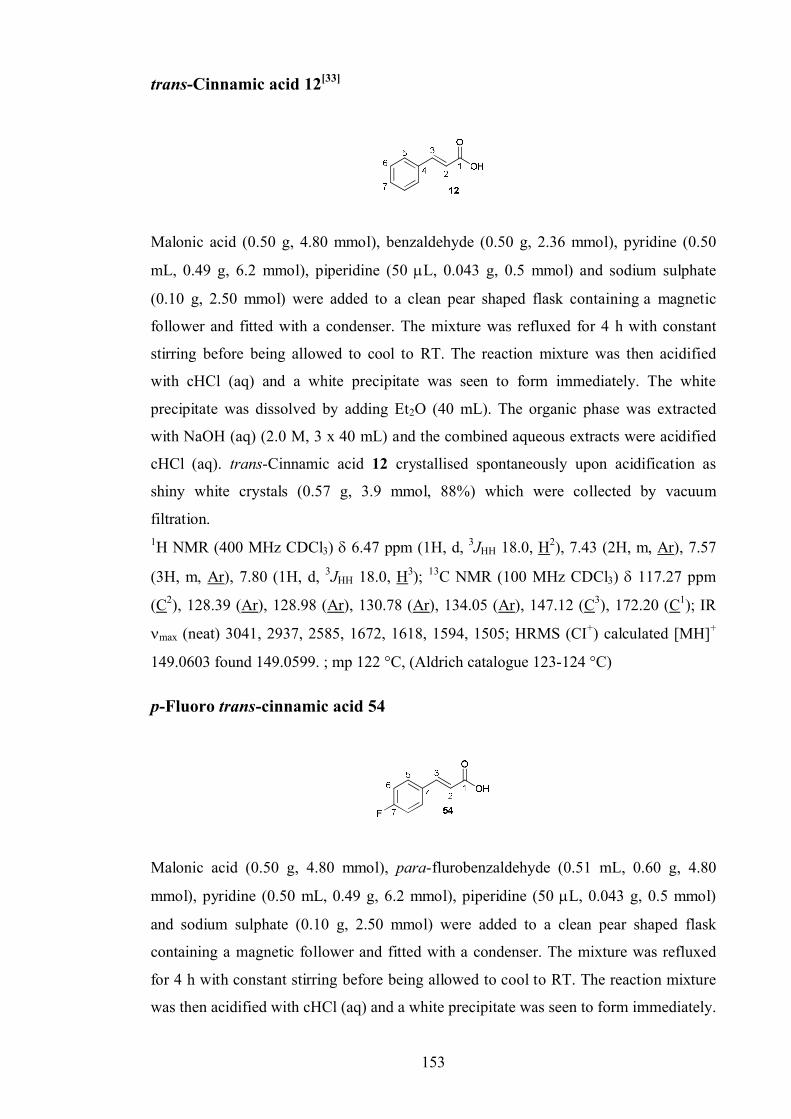
153
trans-Cinnamic acid 12[33]
Malonic acid (0.50 g, 4.80 mmol), benzaldehyde (0.50 g, 2.36 mmol), pyridine (0.50
mL, 0.49 g, 6.2 mmol), piperidine (50 L, 0.043 g, 0.5 mmol) and sodium sulphate
(0.10 g, 2.50 mmol) were added to a clean pear shaped flask containing a magnetic
follower and fitted with a condenser. The mixture was refluxed for 4 h with constant
stirring before being allowed to cool to RT. The reaction mixture was then acidified
with cHCl (aq) and a white precipitate was seen to form immediately. The white
precipitate was dissolved by adding Et2O (40 mL). The organic phase was extracted
with NaOH (aq) (2.0 M, 3 x 40 mL) and the combined aqueous extracts were acidified
cHCl (aq). trans-Cinnamic acid 12 crystallised spontaneously upon acidification as
shiny white crystals (0.57 g, 3.9 mmol, 88%) which were collected by vacuum
filtration.1H NMR (400 MHz CDCl3) 6.47 ppm (1H, d, 3JHH 18.0, H2), 7.43 (2H, m, Ar), 7.57
(3H, m, Ar), 7.80 (1H, d, 3JHH 18.0, H3); 13C NMR (100 MHz CDCl3) 117.27 ppm
(C2), 128.39 (Ar), 128.98 (Ar), 130.78 (Ar), 134.05 (Ar), 147.12 (C3), 172.20 (C1); IR
max (neat) 3041, 2937, 2585, 1672, 1618, 1594, 1505; HRMS (CI+) calculated [MH]+
149.0603 found 149.0599. ; mp 122 °C, (Aldrich catalogue 123-124 °C)
p-Fluoro trans-cinnamic acid 54
Malonic acid (0.50 g, 4.80 mmol), para-flurobenzaldehyde (0.51 mL, 0.60 g, 4.80
mmol), pyridine (0.50 mL, 0.49 g, 6.2 mmol), piperidine (50 L, 0.043 g, 0.5 mmol)
and sodium sulphate (0.10 g, 2.50 mmol) were added to a clean pear shaped flask
containing a magnetic follower and fitted with a condenser. The mixture was refluxed
for 4 h with constant stirring before being allowed to cool to RT. The reaction mixture
was then acidified with cHCl (aq) and a white precipitate was seen to form immediately.
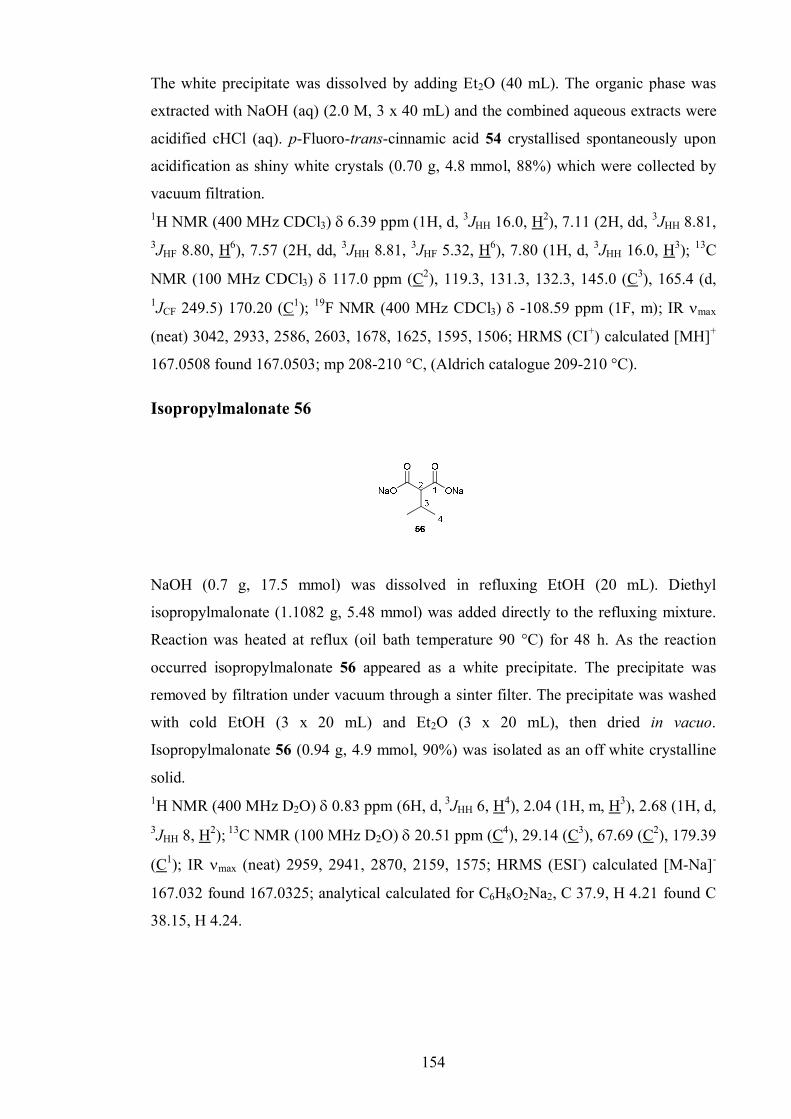
154
The white precipitate was dissolved by adding Et2O (40 mL). The organic phase was
extracted with NaOH (aq) (2.0 M, 3 x 40 mL) and the combined aqueous extracts were
acidified cHCl (aq). p-Fluoro-trans-cinnamic acid 54 crystallised spontaneously upon
acidification as shiny white crystals (0.70 g, 4.8 mmol, 88%) which were collected by
vacuum filtration.1H NMR (400 MHz CDCl3) 6.39 ppm (1H, d, 3JHH 16.0, H2), 7.11 (2H, dd, 3JHH 8.81, 3JHF 8.80, H6), 7.57 (2H, dd, 3JHH 8.81, 3JHF 5.32, H6), 7.80 (1H, d, 3JHH 16.0, H3); 13C
NMR (100 MHz CDCl3) 117.0 ppm (C2), 119.3, 131.3, 132.3, 145.0 (C3), 165.4 (d, 1JCF 249.5) 170.20 (C1); 19F NMR (400 MHz CDCl3) -108.59 ppm (1F, m); IR max
(neat) 3042, 2933, 2586, 2603, 1678, 1625, 1595, 1506; HRMS (CI+) calculated [MH]+
167.0508 found 167.0503; mp 208-210 °C, (Aldrich catalogue 209-210 °C).
Isopropylmalonate 56
NaOH (0.7 g, 17.5 mmol) was dissolved in refluxing EtOH (20 mL). Diethyl
isopropylmalonate (1.1082 g, 5.48 mmol) was added directly to the refluxing mixture.
Reaction was heated at reflux (oil bath temperature 90 °C) for 48 h. As the reaction
occurred isopropylmalonate 56 appeared as a white precipitate. The precipitate was
removed by filtration under vacuum through a sinter filter. The precipitate was washed
with cold EtOH (3 x 20 mL) and Et2O (3 x 20 mL), then dried in vacuo.
Isopropylmalonate 56 (0.94 g, 4.9 mmol, 90%) was isolated as an off white crystalline
solid.1H NMR (400 MHz D2O) 0.83 ppm (6H, d, 3JHH 6, H4), 2.04 (1H, m, H3), 2.68 (1H, d, 3JHH 8, H2); 13C NMR (100 MHz D2O) 20.51 ppm (C4), 29.14 (C3), 67.69 (C2), 179.39
(C1); IR max (neat) 2959, 2941, 2870, 2159, 1575; HRMS (ESI-) calculated [M-Na]-
167.032 found 167.0325; analytical calculated for C6H8O2Na2, C 37.9, H 4.21 found C
38.15, H 4.24.
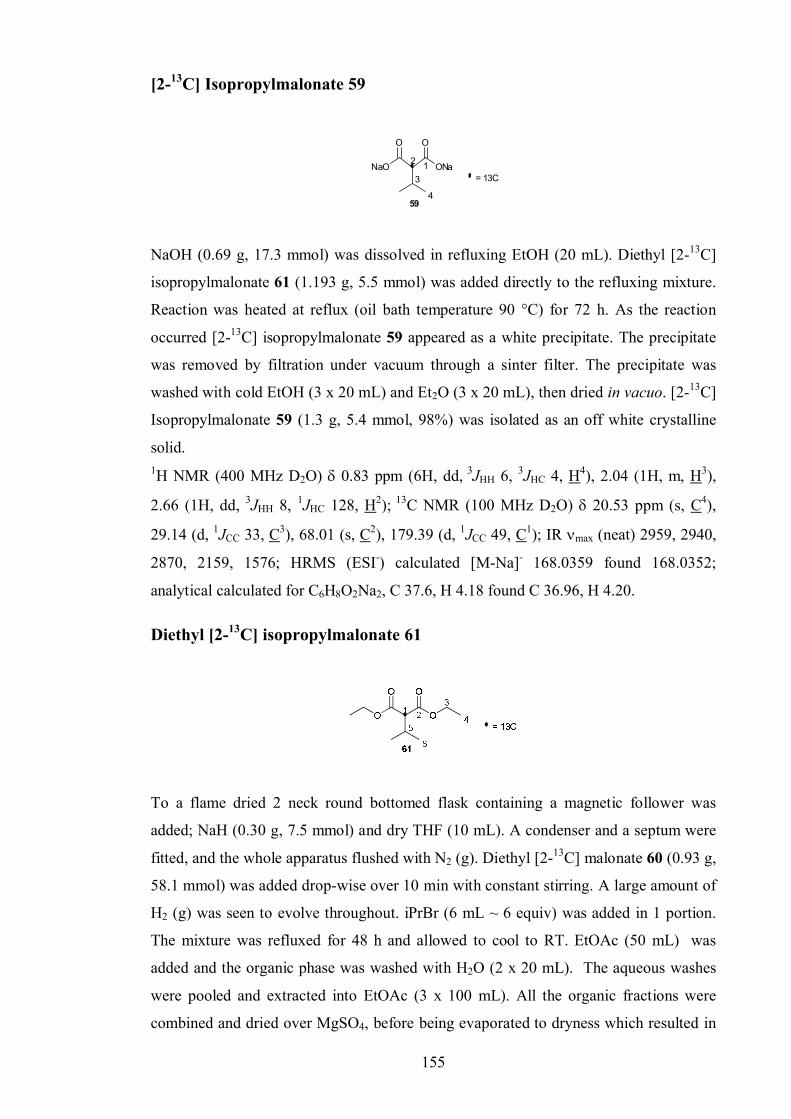
155
[2-13C] Isopropylmalonate 59
NaOH (0.69 g, 17.3 mmol) was dissolved in refluxing EtOH (20 mL). Diethyl [2-13C]
isopropylmalonate 61 (1.193 g, 5.5 mmol) was added directly to the refluxing mixture.
Reaction was heated at reflux (oil bath temperature 90 °C) for 72 h. As the reaction
occurred [2-13C] isopropylmalonate 59 appeared as a white precipitate. The precipitate
was removed by filtration under vacuum through a sinter filter. The precipitate was
washed with cold EtOH (3 x 20 mL) and Et2O (3 x 20 mL), then dried in vacuo. [2-13C]
Isopropylmalonate 59 (1.3 g, 5.4 mmol, 98%) was isolated as an off white crystalline
solid.1H NMR (400 MHz D2O) 0.83 ppm (6H, dd, 3JHH 6, 3JHC 4, H4), 2.04 (1H, m, H3),
2.66 (1H, dd, 3JHH 8, 1JHC 128, H2); 13C NMR (100 MHz D2O) 20.53 ppm (s, C4),
29.14 (d, 1JCC 33, C3), 68.01 (s, C2), 179.39 (d, 1JCC 49, C1); IR max (neat) 2959, 2940,
2870, 2159, 1576; HRMS (ESI-) calculated [M-Na]- 168.0359 found 168.0352;
analytical calculated for C6H8O2Na2, C 37.6, H 4.18 found C 36.96, H 4.20.
Diethyl [2-13C] isopropylmalonate 61
To a flame dried 2 neck round bottomed flask containing a magnetic follower was
added; NaH (0.30 g, 7.5 mmol) and dry THF (10 mL). A condenser and a septum were
fitted, and the whole apparatus flushed with N2 (g). Diethyl [2-13C] malonate 60 (0.93 g,
58.1 mmol) was added drop-wise over 10 min with constant stirring. A large amount of
H2 (g) was seen to evolve throughout. iPrBr (6 mL ~ 6 equiv) was added in 1 portion.
The mixture was refluxed for 48 h and allowed to cool to RT. EtOAc (50 mL) was
added and the organic phase was washed with H2O (2 x 20 mL). The aqueous washes
were pooled and extracted into EtOAc (3 x 100 mL). All the organic fractions were
combined and dried over MgSO4, before being evaporated to dryness which resulted in
NaO 2 1 ONa
O O
3
4
= 13C
59
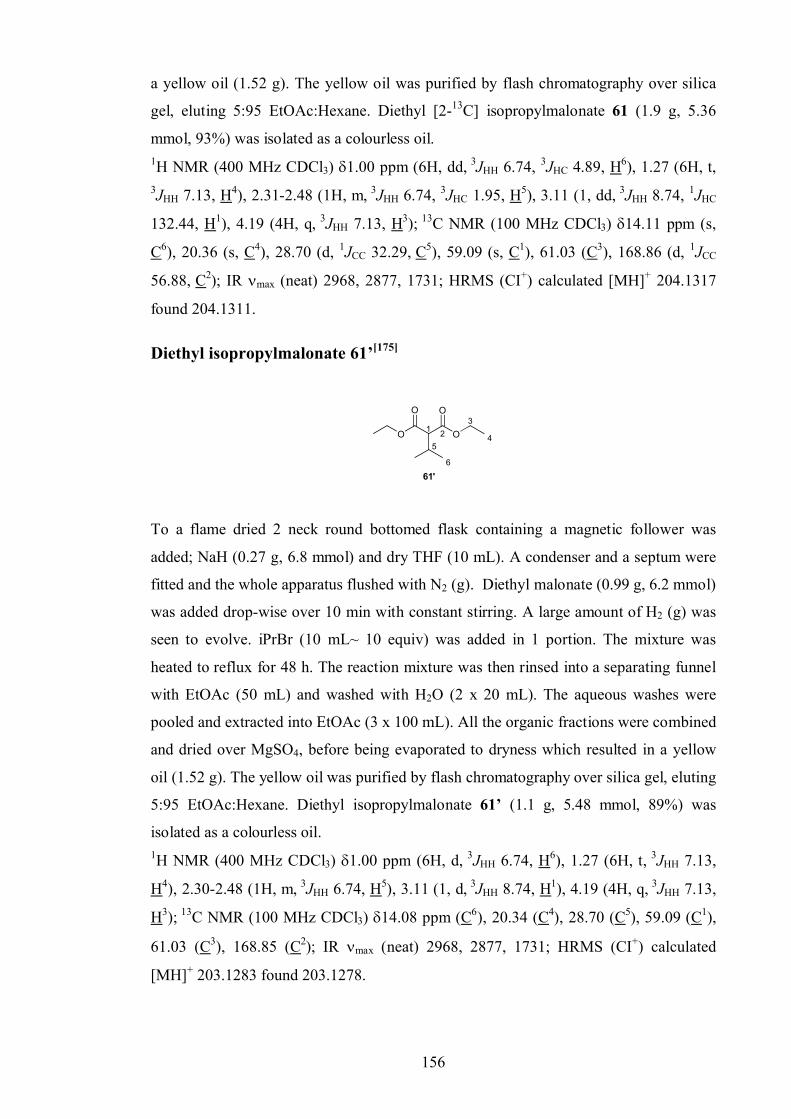
156
a yellow oil (1.52 g). The yellow oil was purified by flash chromatography over silica
gel, eluting 5:95 EtOAc:Hexane. Diethyl [2-13C] isopropylmalonate 61 (1.9 g, 5.36
mmol, 93%) was isolated as a colourless oil.1H NMR (400 MHz CDCl3) 1.00 ppm (6H, dd, 3JHH 6.74, 3JHC 4.89, H6), 1.27 (6H, t,3JHH 7.13, H4), 2.31-2.48 (1H, m, 3JHH 6.74, 3JHC 1.95, H5), 3.11 (1, dd, 3JHH 8.74, 1JHC
132.44, H1), 4.19 (4H, q, 3JHH 7.13, H3); 13C NMR (100 MHz CDCl3) 14.11 ppm (s,
C6), 20.36 (s, C4), 28.70 (d, 1JCC 32.29, C5), 59.09 (s, C1), 61.03 (C3), 168.86 (d, 1JCC
56.88, C2); IR max (neat) 2968, 2877, 1731; HRMS (CI+) calculated [MH]+ 204.1317
found 204.1311.
Diethyl isopropylmalonate 61’[175]
61'
O 1 2 O
O O
5
6
3
4
To a flame dried 2 neck round bottomed flask containing a magnetic follower was
added; NaH (0.27 g, 6.8 mmol) and dry THF (10 mL). A condenser and a septum were
fitted and the whole apparatus flushed with N2 (g). Diethyl malonate (0.99 g, 6.2 mmol)
was added drop-wise over 10 min with constant stirring. A large amount of H2 (g) was
seen to evolve. iPrBr (10 mL~ 10 equiv) was added in 1 portion. The mixture was
heated to reflux for 48 h. The reaction mixture was then rinsed into a separating funnel
with EtOAc (50 mL) and washed with H2O (2 x 20 mL). The aqueous washes were
pooled and extracted into EtOAc (3 x 100 mL). All the organic fractions were combined
and dried over MgSO4, before being evaporated to dryness which resulted in a yellow
oil (1.52 g). The yellow oil was purified by flash chromatography over silica gel, eluting
5:95 EtOAc:Hexane. Diethyl isopropylmalonate 61’ (1.1 g, 5.48 mmol, 89%) was
isolated as a colourless oil.1H NMR (400 MHz CDCl3) 1.00 ppm (6H, d, 3JHH 6.74, H6), 1.27 (6H, t, 3JHH 7.13,
H4), 2.30-2.48 (1H, m, 3JHH 6.74, H5), 3.11 (1, d, 3JHH 8.74, H1), 4.19 (4H, q, 3JHH 7.13,
H3); 13C NMR (100 MHz CDCl3) 14.08 ppm (C6), 20.34 (C4), 28.70 (C5), 59.09 (C1),
61.03 (C3), 168.85 (C2); IR max (neat) 2968, 2877, 1731; HRMS (CI+) calculated
[MH]+ 203.1283 found 203.1278.
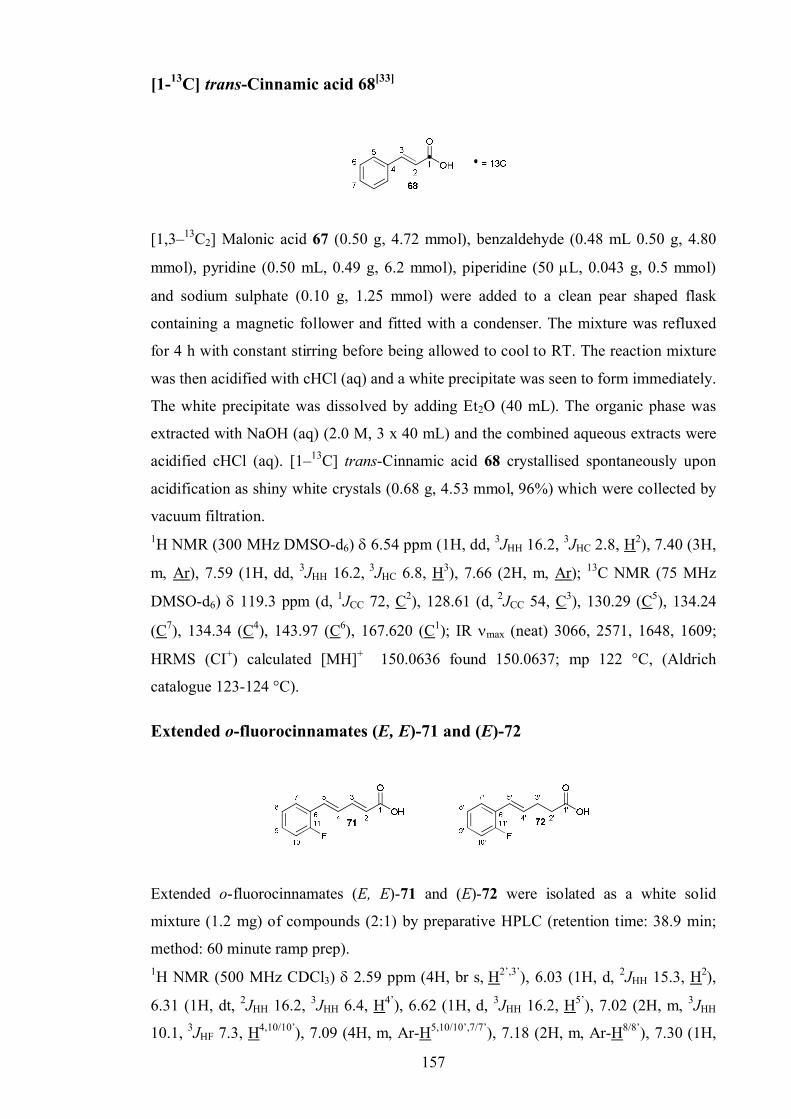
157
[1-13C] trans-Cinnamic acid 68[33]
[1,3–13C2] Malonic acid 67 (0.50 g, 4.72 mmol), benzaldehyde (0.48 mL 0.50 g, 4.80
mmol), pyridine (0.50 mL, 0.49 g, 6.2 mmol), piperidine (50 L, 0.043 g, 0.5 mmol)
and sodium sulphate (0.10 g, 1.25 mmol) were added to a clean pear shaped flask
containing a magnetic follower and fitted with a condenser. The mixture was refluxed
for 4 h with constant stirring before being allowed to cool to RT. The reaction mixture
was then acidified with cHCl (aq) and a white precipitate was seen to form immediately.
The white precipitate was dissolved by adding Et2O (40 mL). The organic phase was
extracted with NaOH (aq) (2.0 M, 3 x 40 mL) and the combined aqueous extracts were
acidified cHCl (aq). [1–13C] trans-Cinnamic acid 68 crystallised spontaneously upon
acidification as shiny white crystals (0.68 g, 4.53 mmol, 96%) which were collected by
vacuum filtration. 1H NMR (300 MHz DMSO-d6) 6.54 ppm (1H, dd, 3JHH 16.2, 3JHC 2.8, H2), 7.40 (3H,
m, Ar), 7.59 (1H, dd, 3JHH 16.2, 3JHC 6.8, H3), 7.66 (2H, m, Ar); 13C NMR (75 MHz
DMSO-d6) 119.3 ppm (d, 1JCC 72, C2), 128.61 (d, 2JCC 54, C3), 130.29 (C5), 134.24
(C7), 134.34 (C4), 143.97 (C6), 167.620 (C1); IR max (neat) 3066, 2571, 1648, 1609;
HRMS (CI+) calculated [MH]+ 150.0636 found 150.0637; mp 122 °C, (Aldrich
catalogue 123-124 °C).
Extended o-fluorocinnamates (E, E)-71 and (E)-72
Extended o-fluorocinnamates (E, E)-71 and (E)-72 were isolated as a white solid
mixture (1.2 mg) of compounds (2:1) by preparative HPLC (retention time: 38.9 min;
method: 60 minute ramp prep).1H NMR (500 MHz CDCl3) 2.59 ppm (4H, br s, H2’,3’), 6.03 (1H, d, 2JHH 15.3, H2),
6.31 (1H, dt, 2JHH 16.2, 3JHH 6.4, H4’), 6.62 (1H, d, 3JHH 16.2, H5’), 7.02 (2H, m, 3JHH
10.1, 3JHF 7.3, H4,10/10’), 7.09 (4H, m, Ar-H5,10/10’,7/7’), 7.18 (2H, m, Ar-H8/8’), 7.30 (1H,
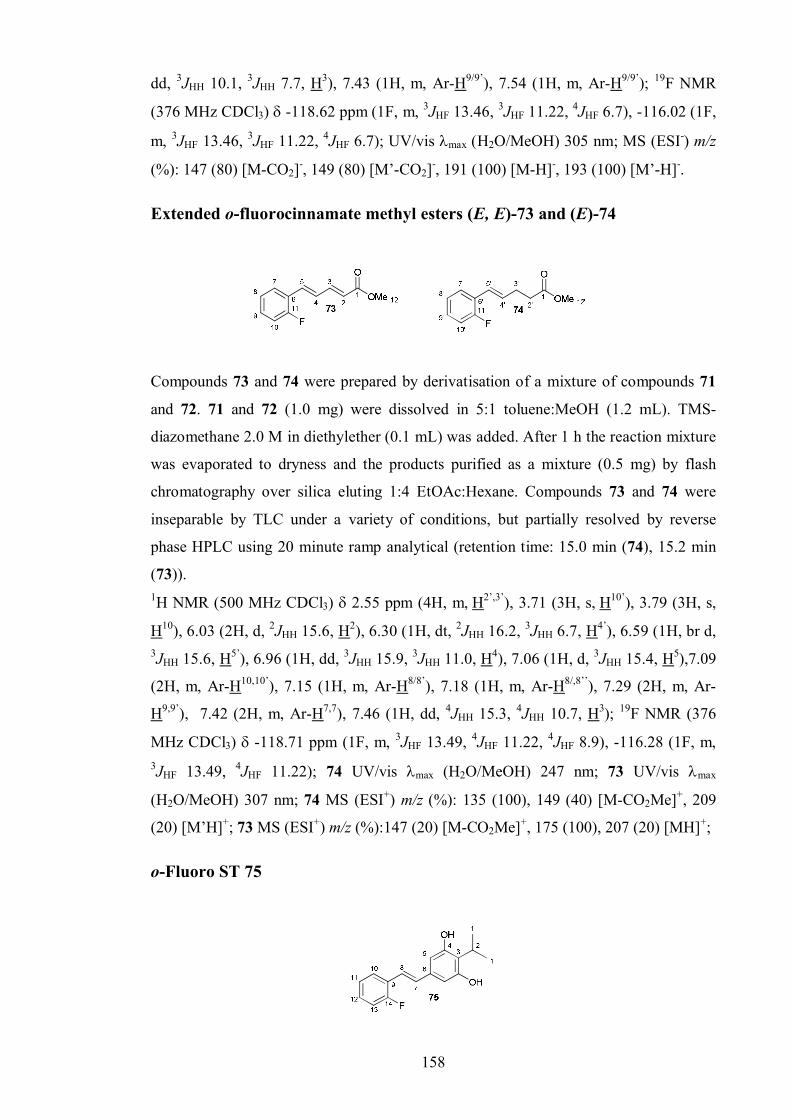
158
dd, 3JHH 10.1, 3JHH 7.7, H3), 7.43 (1H, m, Ar-H9/9’), 7.54 (1H, m, Ar-H9/9’); 19F NMR
(376 MHz CDCl3) -118.62 ppm (1F, m, 3JHF 13.46, 3JHF 11.22, 4JHF 6.7), -116.02 (1F,
m, 3JHF 13.46, 3JHF 11.22, 4JHF 6.7); UV/vis max (H2O/MeOH) 305 nm; MS (ESI-) m/z
(%): 147 (80) [M-CO2]-, 149 (80) [M’-CO2]-, 191 (100) [M-H]-, 193 (100) [M’-H]-.
Extended o-fluorocinnamate methyl esters (E, E)-73 and (E)-74
Compounds 73 and 74 were prepared by derivatisation of a mixture of compounds 71
and 72. 71 and 72 (1.0 mg) were dissolved in 5:1 toluene:MeOH (1.2 mL). TMS-
diazomethane 2.0 M in diethylether (0.1 mL) was added. After 1 h the reaction mixture
was evaporated to dryness and the products purified as a mixture (0.5 mg) by flash
chromatography over silica eluting 1:4 EtOAc:Hexane. Compounds 73 and 74 were
inseparable by TLC under a variety of conditions, but partially resolved by reverse
phase HPLC using 20 minute ramp analytical (retention time: 15.0 min (74), 15.2 min
(73)).1H NMR (500 MHz CDCl3) 2.55 ppm (4H, m, H2’,3’), 3.71 (3H, s, H10’), 3.79 (3H, s,
H10), 6.03 (2H, d, 2JHH 15.6, H2), 6.30 (1H, dt, 2JHH 16.2, 3JHH 6.7, H4’), 6.59 (1H, br d, 3JHH 15.6, H5’), 6.96 (1H, dd, 3JHH 15.9, 3JHH 11.0, H4), 7.06 (1H, d, 3JHH 15.4, H5),7.09
(2H, m, Ar-H10,10’), 7.15 (1H, m, Ar-H8/8’), 7.18 (1H, m, Ar-H8/,8’’), 7.29 (2H, m, Ar-
H9,9’), 7.42 (2H, m, Ar-H7,7), 7.46 (1H, dd, 4JHH 15.3, 4JHH 10.7, H3); 19F NMR (376
MHz CDCl3) -118.71 ppm (1F, m, 3JHF 13.49, 4JHF 11.22, 4JHF 8.9), -116.28 (1F, m, 3JHF 13.49, 4JHF 11.22); 74 UV/vis max (H2O/MeOH) 247 nm; 73 UV/vis max
(H2O/MeOH) 307 nm; 74 MS (ESI+) m/z (%): 135 (100), 149 (40) [M-CO2Me]+, 209
(20) [M’H]+; 73 MS (ESI+) m/z (%):147 (20) [M-CO2Me]+, 175 (100), 207 (20) [MH]+;
o-Fluoro ST 75
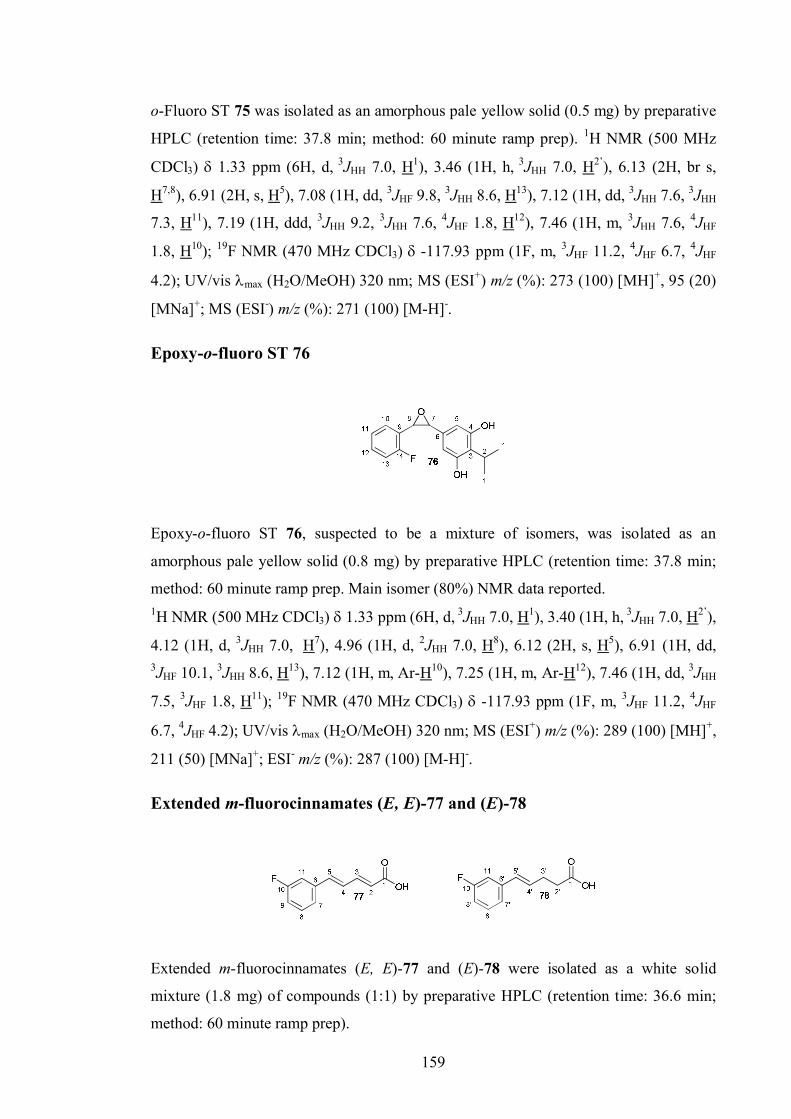
159
o-Fluoro ST 75 was isolated as an amorphous pale yellow solid (0.5 mg) by preparative
HPLC (retention time: 37.8 min; method: 60 minute ramp prep). 1H NMR (500 MHz
CDCl3) 1.33 ppm (6H, d, 3JHH 7.0, H1), 3.46 (1H, h, 3JHH 7.0, H2’), 6.13 (2H, br s,
H7,8), 6.91 (2H, s, H5), 7.08 (1H, dd, 3JHF 9.8, 3JHH 8.6, H13), 7.12 (1H, dd, 3JHH 7.6, 3JHH
7.3, H11), 7.19 (1H, ddd, 3JHH 9.2, 3JHH 7.6, 4JHF 1.8, H12), 7.46 (1H, m, 3JHH 7.6, 4JHF
1.8, H10); 19F NMR (470 MHz CDCl3) -117.93 ppm (1F, m, 3JHF 11.2, 4JHF 6.7, 4JHF
4.2); UV/vis max (H2O/MeOH) 320 nm; MS (ESI+) m/z (%): 273 (100) [MH]+, 95 (20)
[MNa]+; MS (ESI-) m/z (%): 271 (100) [M-H]-.
Epoxy-o-fluoro ST 76
Epoxy-o-fluoro ST 76, suspected to be a mixture of isomers, was isolated as an
amorphous pale yellow solid (0.8 mg) by preparative HPLC (retention time: 37.8 min;
method: 60 minute ramp prep. Main isomer (80%) NMR data reported.1H NMR (500 MHz CDCl3) 1.33 ppm (6H, d, 3JHH 7.0, H1), 3.40 (1H, h, 3JHH 7.0, H2’),
4.12 (1H, d, 3JHH 7.0, H7), 4.96 (1H, d, 2JHH 7.0, H8), 6.12 (2H, s, H5), 6.91 (1H, dd, 3JHF 10.1, 3JHH 8.6, H13), 7.12 (1H, m, Ar-H10), 7.25 (1H, m, Ar-H12), 7.46 (1H, dd, 3JHH
7.5, 3JHF 1.8, H11); 19F NMR (470 MHz CDCl3) -117.93 ppm (1F, m, 3JHF 11.2, 4JHF
6.7, 4JHF 4.2); UV/vis max (H2O/MeOH) 320 nm; MS (ESI+) m/z (%): 289 (100) [MH]+,
211 (50) [MNa]+; ESI- m/z (%): 287 (100) [M-H]-.
Extended m-fluorocinnamates (E, E)-77 and (E)-78
Extended m-fluorocinnamates (E, E)-77 and (E)-78 were isolated as a white solid
mixture (1.8 mg) of compounds (1:1) by preparative HPLC (retention time: 36.6 min;
method: 60 minute ramp prep).
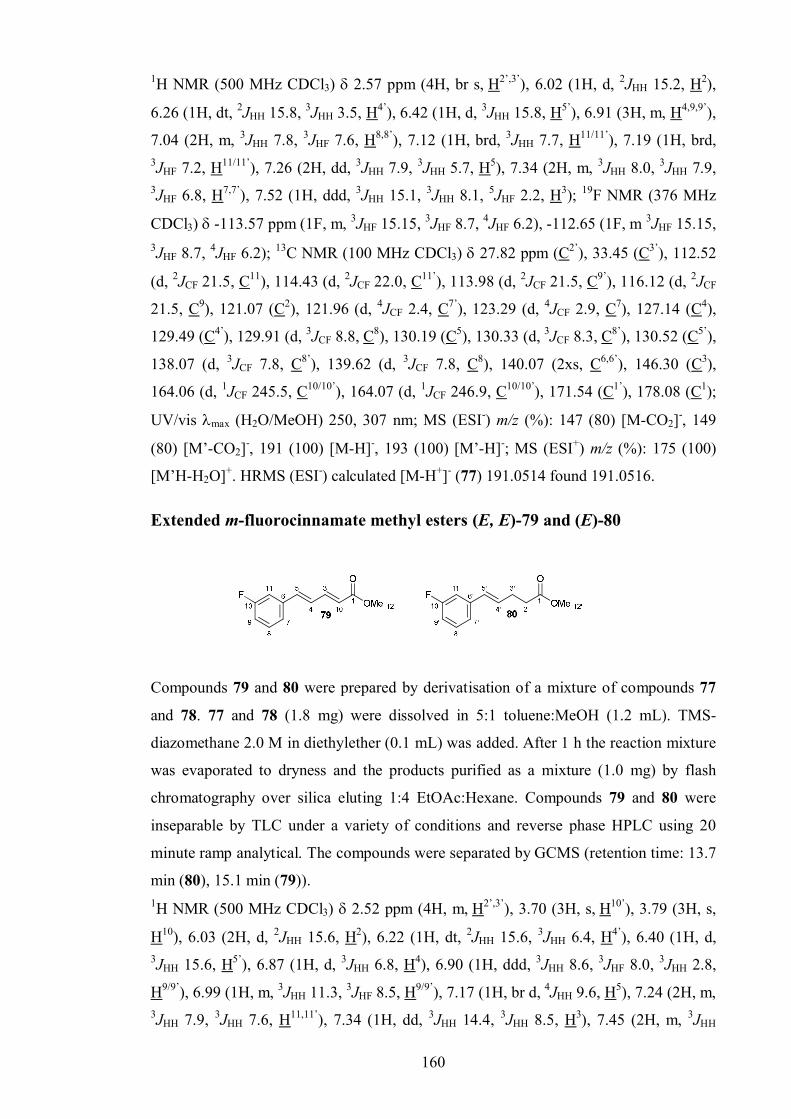
160
1H NMR (500 MHz CDCl3) 2.57 ppm (4H, br s, H2’,3’), 6.02 (1H, d, 2JHH 15.2, H2),
6.26 (1H, dt, 2JHH 15.8, 3JHH 3.5, H4’), 6.42 (1H, d, 3JHH 15.8, H5’), 6.91 (3H, m, H4,9,9’),
7.04 (2H, m, 3JHH 7.8, 3JHF 7.6, H8,8’), 7.12 (1H, brd, 3JHH 7.7, H11/11’), 7.19 (1H, brd, 3JHF 7.2, H11/11’), 7.26 (2H, dd, 3JHH 7.9, 3JHH 5.7, H5), 7.34 (2H, m, 3JHH 8.0, 3JHH 7.9, 3JHF 6.8, H7,7’), 7.52 (1H, ddd, 3JHH 15.1, 3JHH 8.1, 5JHF 2.2, H3); 19F NMR (376 MHz
CDCl3) -113.57 ppm (1F, m, 3JHF 15.15, 3JHF 8.7, 4JHF 6.2), -112.65 (1F, m 3JHF 15.15, 3JHF 8.7, 4JHF 6.2); 13C NMR (100 MHz CDCl3) 27.82 ppm (C2’), 33.45 (C3’), 112.52
(d, 2JCF 21.5, C11), 114.43 (d, 2JCF 22.0, C11’), 113.98 (d, 2JCF 21.5, C9’), 116.12 (d, 2JCF
21.5, C9), 121.07 (C2), 121.96 (d, 4JCF 2.4, C7’), 123.29 (d, 4JCF 2.9, C7), 127.14 (C4),
129.49 (C4’), 129.91 (d, 3JCF 8.8, C8), 130.19 (C5), 130.33 (d, 3JCF 8.3, C8’), 130.52 (C5’),
138.07 (d, 3JCF 7.8, C8’), 139.62 (d, 3JCF 7.8, C8), 140.07 (2xs, C6,6’), 146.30 (C3),
164.06 (d, 1JCF 245.5, C10/10’), 164.07 (d, 1JCF 246.9, C10/10’), 171.54 (C1’), 178.08 (C1);
UV/vis max (H2O/MeOH) 250, 307 nm; MS (ESI-) m/z (%): 147 (80) [M-CO2]-, 149
(80) [M’-CO2]-, 191 (100) [M-H]-, 193 (100) [M’-H]-; MS (ESI+) m/z (%): 175 (100)
[M’H-H2O]+. HRMS (ESI-) calculated [M-H+]- (77) 191.0514 found 191.0516.
Extended m-fluorocinnamate methyl esters (E, E)-79 and (E)-80
Compounds 79 and 80 were prepared by derivatisation of a mixture of compounds 77
and 78. 77 and 78 (1.8 mg) were dissolved in 5:1 toluene:MeOH (1.2 mL). TMS-
diazomethane 2.0 M in diethylether (0.1 mL) was added. After 1 h the reaction mixture
was evaporated to dryness and the products purified as a mixture (1.0 mg) by flash
chromatography over silica eluting 1:4 EtOAc:Hexane. Compounds 79 and 80 were
inseparable by TLC under a variety of conditions and reverse phase HPLC using 20
minute ramp analytical. The compounds were separated by GCMS (retention time: 13.7
min (80), 15.1 min (79)).1H NMR (500 MHz CDCl3) 2.52 ppm (4H, m, H2’,3’), 3.70 (3H, s, H10’), 3.79 (3H, s,
H10), 6.03 (2H, d, 2JHH 15.6, H2), 6.22 (1H, dt, 2JHH 15.6, 3JHH 6.4, H4’), 6.40 (1H, d, 3JHH 15.6, H5’), 6.87 (1H, d, 3JHH 6.8, H4), 6.90 (1H, ddd, 3JHH 8.6, 3JHF 8.0, 3JHH 2.8,
H9/9’), 6.99 (1H, m, 3JHH 11.3, 3JHF 8.5, H9/9’), 7.17 (1H, br d, 4JHH 9.6, H5), 7.24 (2H, m, 3JHH 7.9, 3JHH 7.6, H11,11’), 7.34 (1H, dd, 3JHH 14.4, 3JHH 8.5, H3), 7.45 (2H, m, 3JHH
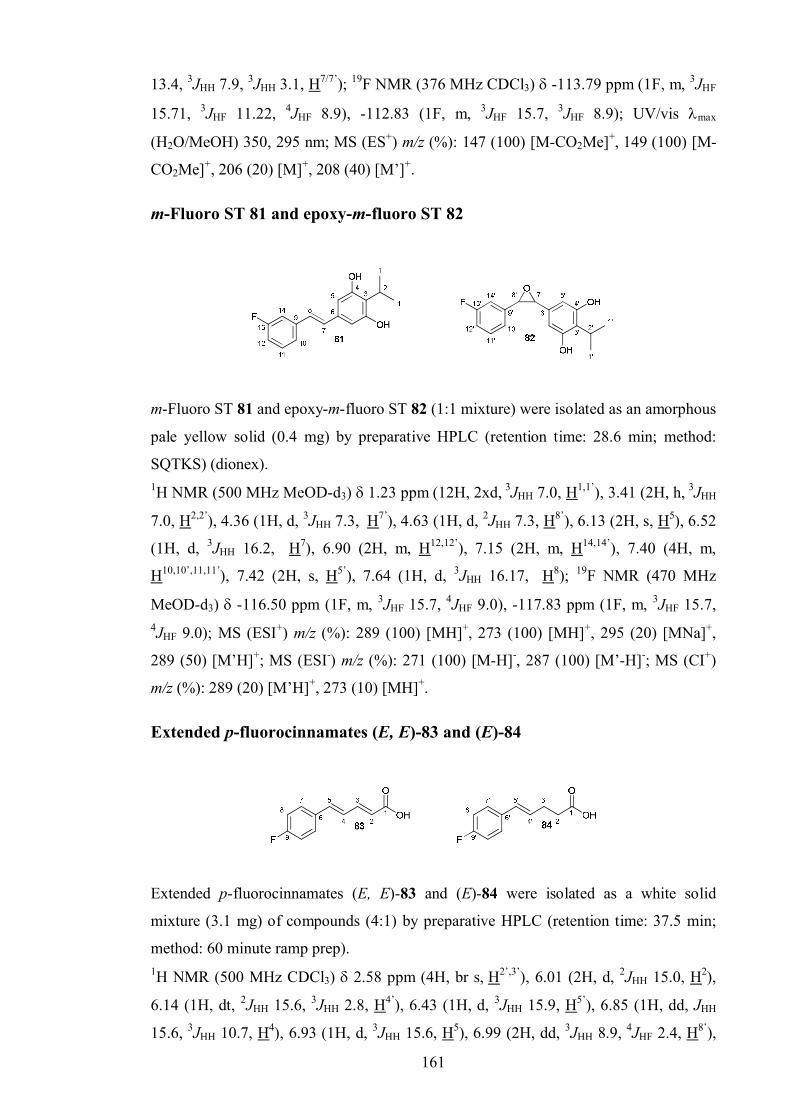
161
13.4, 3JHH 7.9, 3JHH 3.1, H7/7’); 19F NMR (376 MHz CDCl3) -113.79 ppm (1F, m, 3JHF
15.71, 3JHF 11.22, 4JHF 8.9), -112.83 (1F, m, 3JHF 15.7, 3JHF 8.9); UV/vis max
(H2O/MeOH) 350, 295 nm; MS (ES+) m/z (%): 147 (100) [M-CO2Me]+, 149 (100) [M-
CO2Me]+, 206 (20) [M]+, 208 (40) [M’]+.
m-Fluoro ST 81 and epoxy-m-fluoro ST 82
m-Fluoro ST 81 and epoxy-m-fluoro ST 82 (1:1 mixture) were isolated as an amorphous
pale yellow solid (0.4 mg) by preparative HPLC (retention time: 28.6 min; method:
SQTKS) (dionex).1H NMR (500 MHz MeOD-d3) 1.23 ppm (12H, 2xd, 3JHH 7.0, H1,1’), 3.41 (2H, h, 3JHH
7.0, H2,2’), 4.36 (1H, d, 3JHH 7.3, H7’), 4.63 (1H, d, 2JHH 7.3, H8’), 6.13 (2H, s, H5), 6.52
(1H, d, 3JHH 16.2, H7), 6.90 (2H, m, H12,12’), 7.15 (2H, m, H14,14’), 7.40 (4H, m,
H10,10’,11,11’), 7.42 (2H, s, H5’), 7.64 (1H, d, 3JHH 16.17, H8); 19F NMR (470 MHz
MeOD-d3) -116.50 ppm (1F, m, 3JHF 15.7, 4JHF 9.0), -117.83 ppm (1F, m, 3JHF 15.7, 4JHF 9.0); MS (ESI+) m/z (%): 289 (100) [MH]+, 273 (100) [MH]+, 295 (20) [MNa]+,
289 (50) [M’H]+; MS (ESI-) m/z (%): 271 (100) [M-H]-, 287 (100) [M’-H]-; MS (CI+)
m/z (%): 289 (20) [M’H]+, 273 (10) [MH]+.
Extended p-fluorocinnamates (E, E)-83 and (E)-84
Extended p-fluorocinnamates (E, E)-83 and (E)-84 were isolated as a white solid
mixture (3.1 mg) of compounds (4:1) by preparative HPLC (retention time: 37.5 min;
method: 60 minute ramp prep).1H NMR (500 MHz CDCl3) 2.58 ppm (4H, br s, H2’,3’), 6.01 (2H, d, 2JHH 15.0, H2),
6.14 (1H, dt, 2JHH 15.6, 3JHH 2.8, H4’), 6.43 (1H, d, 3JHH 15.9, H5’), 6.85 (1H, dd, JHH
15.6, 3JHH 10.7, H4), 6.93 (1H, d, 3JHH 15.6, H5), 6.99 (2H, dd, 3JHH 8.9, 4JHF 2.4, H8’),

162
7.07 (2H, ddd, 4JHH 8.9, 3JHF 2.4, H8), 7.31 (2H, dd, 3JHH 8.6, 3JHF 5.5, H7’), 7.47 (2H,
dd, 3JHH 8.6, 3JHF 5.5, H7), 7.53 (1H, dd, 3JHH 15.3, 3JHH 11.0, H3); 19F NMR (376 MHz
CDCl3) -115.23 ppm (1F, m 3JHF 8.7, 4JHF 5.2), -111.05 (1F, m 3JHF 8.7, 4JHF 5.2); 13C
NMR (100 MHz CDCl3) 27.87 ppm (C2’), 37.61 (C3’), 115.36 (d, 3JCF 21.3, C8),
115.96 (d, 3JCF 22.0, C8’), 120.13 (C2), 125.68 (C4), 127.53 (d, 3JCF 7.8, C7’), 129.05 (d, 3JCF 8.3, C7), 129.05 (C5’), 131.29 (C4’), 132.05 (d, 4JCF 3.4, C6), 133.41 (d, 4JCF 3.4,
C6’), 140.28 (C3), 146.79 (C5), 163.28 (2 x d, 1JCF 245.4, C9,9’), 175.36 (C1’), 178.24
(C1); UV/vis max (H2O/MeOH) 230, 311 nm; MS (ESI-) m/z (%): 191 (100) [M-H]-,
193 (100) [M’-H]-; MS (ESI+) m/z (%): 175 (100) [M’H-H2O]+.
Extended p-fluorocinnamate methyl esters (E, E)-85 and (E)-86
Compounds 85 and 86 were prepared by derivatisation of a mixture of compounds 83
and 84. 83 and 84 (2.0 mg) were dissolved in 5:1 toluene:MeOH (1.2 mL). TMS-
diazomethane 2.0 M in diethylether (0.1 mL) was added. After 1 h the reaction mixture
was evaporated to dryness and the products purified as a mixture (1.2 mg) by flash
chromatography over silica eluting 1:4 EtOAc:Hexane. Compounds 85 and 86 were
inseparable by TLC under a variety of conditions and reverse phase HPLC using 20
minute ramp analytical. The compounds were separated by GCMS (retention time: 13.7
min (86), 14.4 min (85)).1H NMR (500 MHz CDCl3) 2.51 ppm (4H, m, H2’,3’), 3.74 (3H, s, H10’), 3.78 (3H, s,
H10), 6.00 (2H, d, 2JHH 15.2, H2), 6.18 (1H, ddd, 2JHH 15.7, 3JHH 7.8, 3JHH 2.2, H4’), 6.46
(1H, d, 3JHH 15.9, H5’), 6.83 (1H, dd, 3JHH 15.7, 3JHH 10.5, H4), 6.88 (1H, d, 3JHH 15.7,
H8/8’), 6.98 (1H, dd, 3JHH 8.8, 3JHF 8.8, H8’), 7.06 (1H, dd, 3JHH 8.8, 3JHF 8.8, H8), 7.30
(1H, dd, 3JHH 8.6, 3JHF 5.3, H7’), 7.44 (1H, dd, 3JHH 15.4, 3JHH 10.5, H3), 7.45 (1H, dd, 3JHH 8.6, 3JHF 5.3, H7); 19F NMR (376 MHz CDCl3) -113.79 ppm (1F, m, 3JHF 15.71, 3JHF 11.22, 4JHF 8.9), -112.83 (1F, m, 3JHF 15.7, 3JHF 8.9); UV/vis max (H2O/MeOH)
313 nm; MS (ES+) m/z (%): 147 (100) [M-CO2Me]+, 149 (100) [M-CO2Me]+, 206 (40)
[M]+, 208 (40) [M’]+.

163
p-Fluoro ST 87 and epoxy-p-fluoro ST 88
p-Fluoro ST 87 and epoxy-p-fluoro ST 88 (9:1) were isolated as an off white solid
mixture (1.1 mg) by flash chromatography eluting 1:4 EtOAc:Hexane, Rf – 0.8.1H NMR (500 MHz CDCl3) 1.36 ppm (6H, 2, 3JHH 7.0, H1), 1.37 ppm (6H, 2, 3JHH 7.0,
H1’), 3.36 (1H, h, 3JHH 7.0, H2’), 3.46 (1H, h, 3JHH 7.0, H2), 4.14 (1H, d, 3JHH 6.7, H7’),
5.65 (1H, d, 2JHH 7.3, H8’), 6.49 (2H, s, H5), 6.52 (1H, d, 3JHH 16.2, H7), 6.80 (2H, d, 3JHH 16.17, H8), 6.91 (2H, d, 3JHH 16.17, H7), 6.93 (2H, s, H5’), 7.44 (2H, dd, 3JHH 9.2,3JHH 8.6, H11’), 7.07 (1H, dd, 3JHH 8.6, 3JHH 8.6, H11), 7.28 (1H, dd, 3JHH 8.5, 3JHH 5.2,
H10), 7.43 (1H, d, 3JHH 8.6, 3JHH 5.5, H10’); 19F NMR (470 MHz CDCl3) -114.16 ppm
(1F, m, 3JHF 13.5, 4JHF 8.2), -113.40 ppm (1F, m, 3JHF 13.5, 4JHF 8.2); 13C NMR (125
MHz CDCl3) 20.61 ppm (C1), 20.74 (C1’), 24.53 (C2), 24.70 (C2’), 62.08 (C7’/8’), 62.40
(C7’/8’), 106.80 (C5), 107.42 (C5’), 115.05 (d, 2JCF 21.5, C11’), 115.60 (d, 2JCF 21.5, C11),
120.37 (C3’), 120.78 (C3), 127.13 (d, 3JCF 7.8, C10), 127.42 (C7/8), 127.92 (C7/8), 128.54
(d, 3JCF 7.8, C10’), 135.54 (d, 3JCF 2.0, C9), 133.32 (d, 3JCF 2.0, C9’), 135.14 (C6’), 136.07
(C6), 154.98 (C4’), 155.18 (C4), 162.81 (2xd, 1JCF 246.5, C12/12’); MS (CI+) m/z (%): 289
(20) [M’H]+, 273 (10) [MH]+; HRMS (ESI-) calculated [M’-H+]- (88) 287.1085 found
287.1089; calculated [M-H+]- 271.1136 found 271.1139.
m-Fluororhabdolactone 97
To a clean dry wheaton vial was added; m-fluoro boronic acid 96 (0.53 g, 3.4 mmol),
[Rh(COD)2BF4].H2O (42 mg, 0.08 mmol, 3 mol%) Dioxane:H2O 10:1 (6 mL) Et3N
(0.34 mL, 0.34 g, 3.4 mmol), -Angelica lactone 94 (0.4 g, 4.1 mmol). The mixture was
stirred at RT under N2 (g) for 87 h. m-Fluororhabdolactone 97 (160 mg, 0.79 mmol,
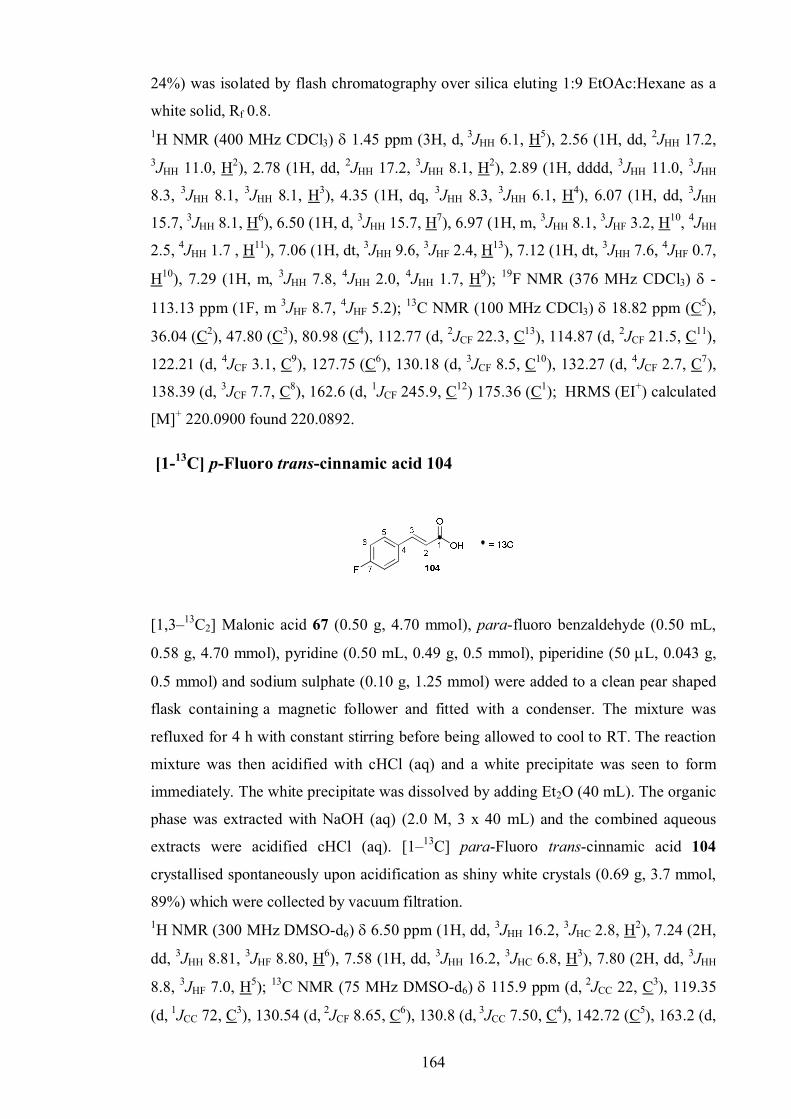
164
24%) was isolated by flash chromatography over silica eluting 1:9 EtOAc:Hexane as a
white solid, Rf 0.8.1H NMR (400 MHz CDCl3) 1.45 ppm (3H, d, 3JHH 6.1, H5), 2.56 (1H, dd, 2JHH 17.2, 3JHH 11.0, H2), 2.78 (1H, dd, 2JHH 17.2, 3JHH 8.1, H2), 2.89 (1H, dddd, 3JHH 11.0, 3JHH
8.3, 3JHH 8.1, 3JHH 8.1, H3), 4.35 (1H, dq, 3JHH 8.3, 3JHH 6.1, H4), 6.07 (1H, dd, 3JHH
15.7, 3JHH 8.1, H6), 6.50 (1H, d, 3JHH 15.7, H7), 6.97 (1H, m, 3JHH 8.1, 3JHF 3.2, H10, 4JHH
2.5, 4JHH 1.7 , H11), 7.06 (1H, dt, 3JHH 9.6, 3JHF 2.4, H13), 7.12 (1H, dt, 3JHH 7.6, 4JHF 0.7,
H10), 7.29 (1H, m, 3JHH 7.8, 4JHH 2.0, 4JHH 1.7, H9); 19F NMR (376 MHz CDCl3) -
113.13 ppm (1F, m 3JHF 8.7, 4JHF 5.2); 13C NMR (100 MHz CDCl3) 18.82 ppm (C5),
36.04 (C2), 47.80 (C3), 80.98 (C4), 112.77 (d, 2JCF 22.3, C13), 114.87 (d, 2JCF 21.5, C11),
122.21 (d, 4JCF 3.1, C9), 127.75 (C6), 130.18 (d, 3JCF 8.5, C10), 132.27 (d, 4JCF 2.7, C7),
138.39 (d, 3JCF 7.7, C8), 162.6 (d, 1JCF 245.9, C12) 175.36 (C1); HRMS (EI+) calculated
[M]+ 220.0900 found 220.0892.
[1-13C] p-Fluoro trans-cinnamic acid 104
[1,3–13C2] Malonic acid 67 (0.50 g, 4.70 mmol), para-fluoro benzaldehyde (0.50 mL,
0.58 g, 4.70 mmol), pyridine (0.50 mL, 0.49 g, 0.5 mmol), piperidine (50 L, 0.043 g,
0.5 mmol) and sodium sulphate (0.10 g, 1.25 mmol) were added to a clean pear shaped
flask containing a magnetic follower and fitted with a condenser. The mixture was
refluxed for 4 h with constant stirring before being allowed to cool to RT. The reaction
mixture was then acidified with cHCl (aq) and a white precipitate was seen to form
immediately. The white precipitate was dissolved by adding Et2O (40 mL). The organic
phase was extracted with NaOH (aq) (2.0 M, 3 x 40 mL) and the combined aqueous
extracts were acidified cHCl (aq). [1–13C] para-Fluoro trans-cinnamic acid 104
crystallised spontaneously upon acidification as shiny white crystals (0.69 g, 3.7 mmol,
89%) which were collected by vacuum filtration.1H NMR (300 MHz DMSO-d6) 6.50 ppm (1H, dd, 3JHH 16.2, 3JHC 2.8, H2), 7.24 (2H,
dd, 3JHH 8.81, 3JHF 8.80, H6), 7.58 (1H, dd, 3JHH 16.2, 3JHC 6.8, H3), 7.80 (2H, dd, 3JHH
8.8, 3JHF 7.0, H5); 13C NMR (75 MHz DMSO-d6) 115.9 ppm (d, 2JCC 22, C3), 119.35
(d, 1JCC 72, C3), 130.54 (d, 2JCF 8.65, C6), 130.8 (d, 3JCC 7.50, C4), 142.72 (C5), 163.2 (d,
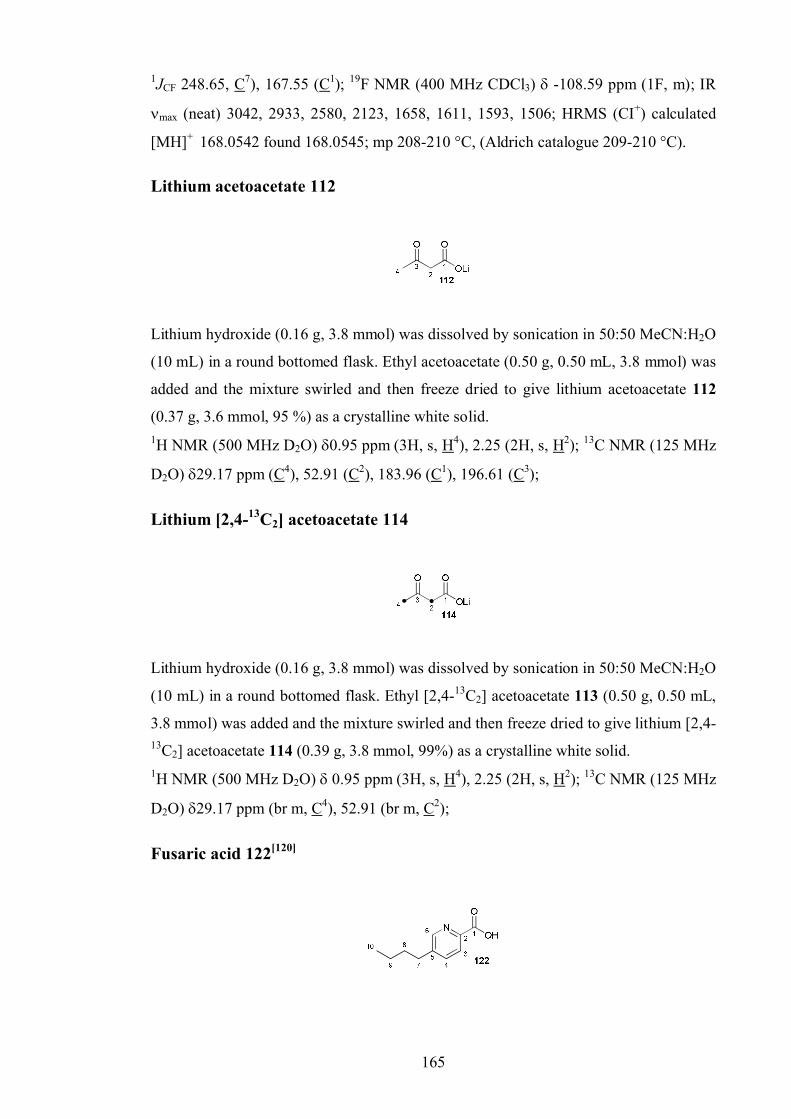
165
1JCF 248.65, C7), 167.55 (C1); 19F NMR (400 MHz CDCl3) -108.59 ppm (1F, m); IR
max (neat) 3042, 2933, 2580, 2123, 1658, 1611, 1593, 1506; HRMS (CI+) calculated
[MH]+ 168.0542 found 168.0545; mp 208-210 °C, (Aldrich catalogue 209-210 °C).
Lithium acetoacetate 112
Lithium hydroxide (0.16 g, 3.8 mmol) was dissolved by sonication in 50:50 MeCN:H2O
(10 mL) in a round bottomed flask. Ethyl acetoacetate (0.50 g, 0.50 mL, 3.8 mmol) was
added and the mixture swirled and then freeze dried to give lithium acetoacetate 112
(0.37 g, 3.6 mmol, 95 %) as a crystalline white solid. 1H NMR (500 MHz D2O) 0.95 ppm (3H, s, H4), 2.25 (2H, s, H2); 13C NMR (125 MHz
D2O) 29.17 ppm (C4), 52.91 (C2), 183.96 (C1), 196.61 (C3);
Lithium [2,4-13C2] acetoacetate 114
Lithium hydroxide (0.16 g, 3.8 mmol) was dissolved by sonication in 50:50 MeCN:H2O
(10 mL) in a round bottomed flask. Ethyl [2,4-13C2] acetoacetate 113 (0.50 g, 0.50 mL,
3.8 mmol) was added and the mixture swirled and then freeze dried to give lithium [2,4-13C2] acetoacetate 114 (0.39 g, 3.8 mmol, 99%) as a crystalline white solid.1H NMR (500 MHz D2O) 0.95 ppm (3H, s, H4), 2.25 (2H, s, H2); 13C NMR (125 MHz
D2O) 29.17 ppm (br m, C4), 52.91 (br m, C2);
Fusaric acid 122[120]
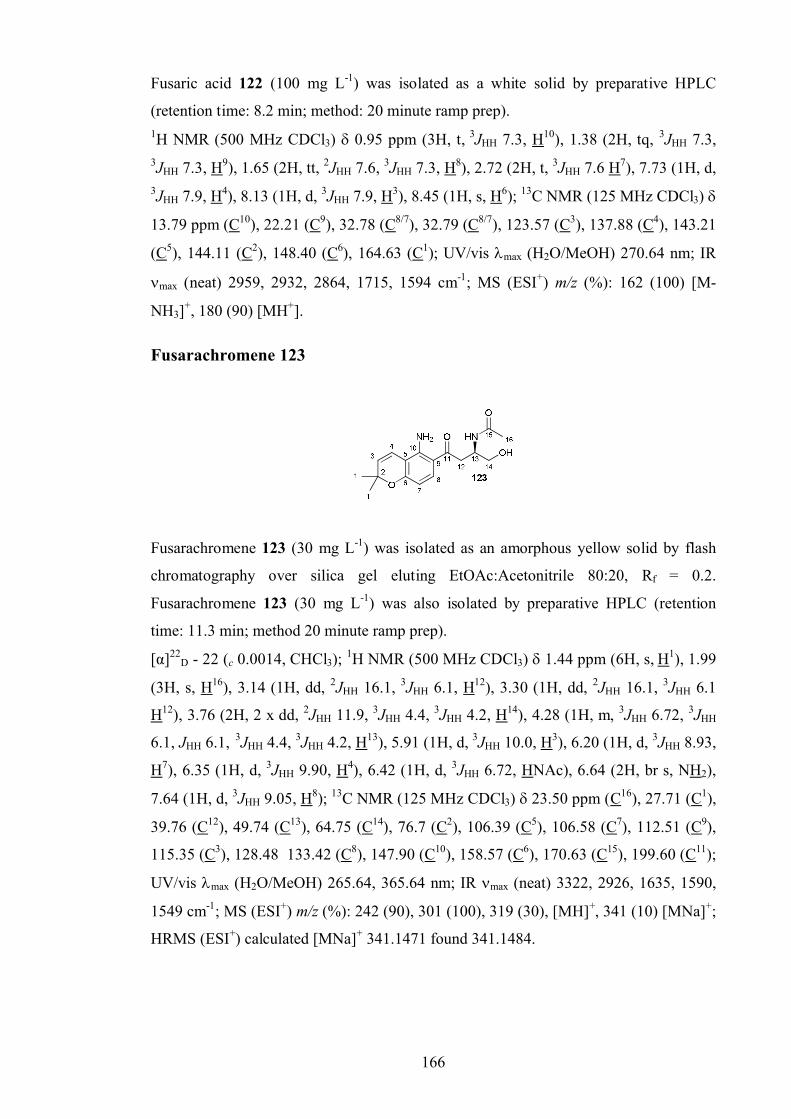
166
Fusaric acid 122 (100 mg L-1) was isolated as a white solid by preparative HPLC
(retention time: 8.2 min; method: 20 minute ramp prep).1H NMR (500 MHz CDCl3) 0.95 ppm (3H, t, 3JHH 7.3, H10), 1.38 (2H, tq, 3JHH 7.3, 3JHH 7.3, H9), 1.65 (2H, tt, 2JHH 7.6, 3JHH 7.3, H8), 2.72 (2H, t, 3JHH 7.6 H7), 7.73 (1H, d, 3JHH 7.9, H4), 8.13 (1H, d, 3JHH 7.9, H3), 8.45 (1H, s, H6); 13C NMR (125 MHz CDCl3)
13.79 ppm (C10), 22.21 (C9), 32.78 (C8/7), 32.79 (C8/7), 123.57 (C3), 137.88 (C4), 143.21
(C5), 144.11 (C2), 148.40 (C6), 164.63 (C1); UV/vis max (H2O/MeOH) 270.64 nm; IR
max (neat) 2959, 2932, 2864, 1715, 1594 cm-1; MS (ESI+) m/z (%): 162 (100) [M-
NH3]+, 180 (90) [MH+].
Fusarachromene 123
Fusarachromene 123 (30 mg L-1) was isolated as an amorphous yellow solid by flash
chromatography over silica gel eluting EtOAc:Acetonitrile 80:20, Rf = 0.2.
Fusarachromene 123 (30 mg L-1) was also isolated by preparative HPLC (retention
time: 11.3 min; method 20 minute ramp prep).
[α]22D - 22 (c 0.0014, CHCl3); 1H NMR (500 MHz CDCl3) 1.44 ppm (6H, s, H1), 1.99
(3H, s, H16), 3.14 (1H, dd, 2JHH 16.1, 3JHH 6.1, H12), 3.30 (1H, dd, 2JHH 16.1, 3JHH 6.1
H12), 3.76 (2H, 2 x dd, 2JHH 11.9, 3JHH 4.4, 3JHH 4.2, H14), 4.28 (1H, m, 3JHH 6.72, 3JHH
6.1, JHH 6.1, 3JHH 4.4, 3JHH 4.2, H13), 5.91 (1H, d, 3JHH 10.0, H3), 6.20 (1H, d, 3JHH 8.93,
H7), 6.35 (1H, d, 3JHH 9.90, H4), 6.42 (1H, d, 3JHH 6.72, HNAc), 6.64 (2H, br s, NH2),
7.64 (1H, d, 3JHH 9.05, H8); 13C NMR (125 MHz CDCl3) 23.50 ppm (C16), 27.71 (C1),
39.76 (C12), 49.74 (C13), 64.75 (C14), 76.7 (C2), 106.39 (C5), 106.58 (C7), 112.51 (C9),
115.35 (C3), 128.48 133.42 (C8), 147.90 (C10), 158.57 (C6), 170.63 (C15), 199.60 (C11);
UV/vis max (H2O/MeOH) 265.64, 365.64 nm; IR max (neat) 3322, 2926, 1635, 1590,
1549 cm-1; MS (ESI+) m/z (%): 242 (90), 301 (100), 319 (30), [MH]+, 341 (10) [MNa]+;
HRMS (ESI+) calculated [MNa]+ 341.1471 found 341.1484.
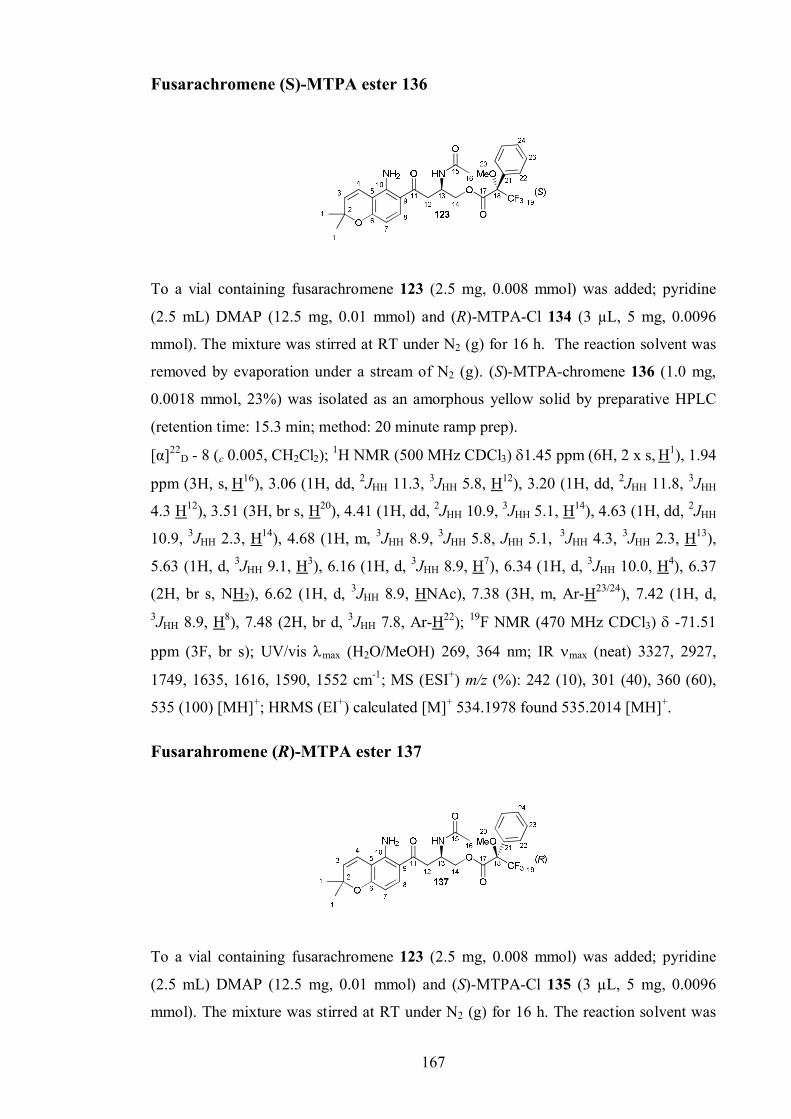
167
Fusarachromene (S)-MTPA ester 136
To a vial containing fusarachromene 123 (2.5 mg, 0.008 mmol) was added; pyridine
(2.5 mL) DMAP (12.5 mg, 0.01 mmol) and (R)-MTPA-Cl 134 (3 µL, 5 mg, 0.0096
mmol). The mixture was stirred at RT under N2 (g) for 16 h. The reaction solvent was
removed by evaporation under a stream of N2 (g). (S)-MTPA-chromene 136 (1.0 mg,
0.0018 mmol, 23%) was isolated as an amorphous yellow solid by preparative HPLC
(retention time: 15.3 min; method: 20 minute ramp prep).
[α]22D - 8 (c 0.005, CH2Cl2); 1H NMR (500 MHz CDCl3) 1.45 ppm (6H, 2 x s, H1), 1.94
ppm (3H, s, H16), 3.06 (1H, dd, 2JHH 11.3, 3JHH 5.8, H12), 3.20 (1H, dd, 2JHH 11.8, 3JHH
4.3 H12), 3.51 (3H, br s, H20), 4.41 (1H, dd, 2JHH 10.9, 3JHH 5.1, H14), 4.63 (1H, dd, 2JHH
10.9, 3JHH 2.3, H14), 4.68 (1H, m, 3JHH 8.9, 3JHH 5.8, JHH 5.1, 3JHH 4.3, 3JHH 2.3, H13),
5.63 (1H, d, 3JHH 9.1, H3), 6.16 (1H, d, 3JHH 8.9, H7), 6.34 (1H, d, 3JHH 10.0, H4), 6.37
(2H, br s, NH2), 6.62 (1H, d, 3JHH 8.9, HNAc), 7.38 (3H, m, Ar-H23/24), 7.42 (1H, d, 3JHH 8.9, H8), 7.48 (2H, br d, 3JHH 7.8, Ar-H22); 19F NMR (470 MHz CDCl3) -71.51
ppm (3F, br s); UV/vis max (H2O/MeOH) 269, 364 nm; IR max (neat) 3327, 2927,
1749, 1635, 1616, 1590, 1552 cm-1; MS (ESI+) m/z (%): 242 (10), 301 (40), 360 (60),
535 (100) [MH]+; HRMS (EI+) calculated [M]+ 534.1978 found 535.2014 [MH]+.
Fusarahromene (R)-MTPA ester 137
To a vial containing fusarachromene 123 (2.5 mg, 0.008 mmol) was added; pyridine
(2.5 mL) DMAP (12.5 mg, 0.01 mmol) and (S)-MTPA-Cl 135 (3 µL, 5 mg, 0.0096
mmol). The mixture was stirred at RT under N2 (g) for 16 h. The reaction solvent was
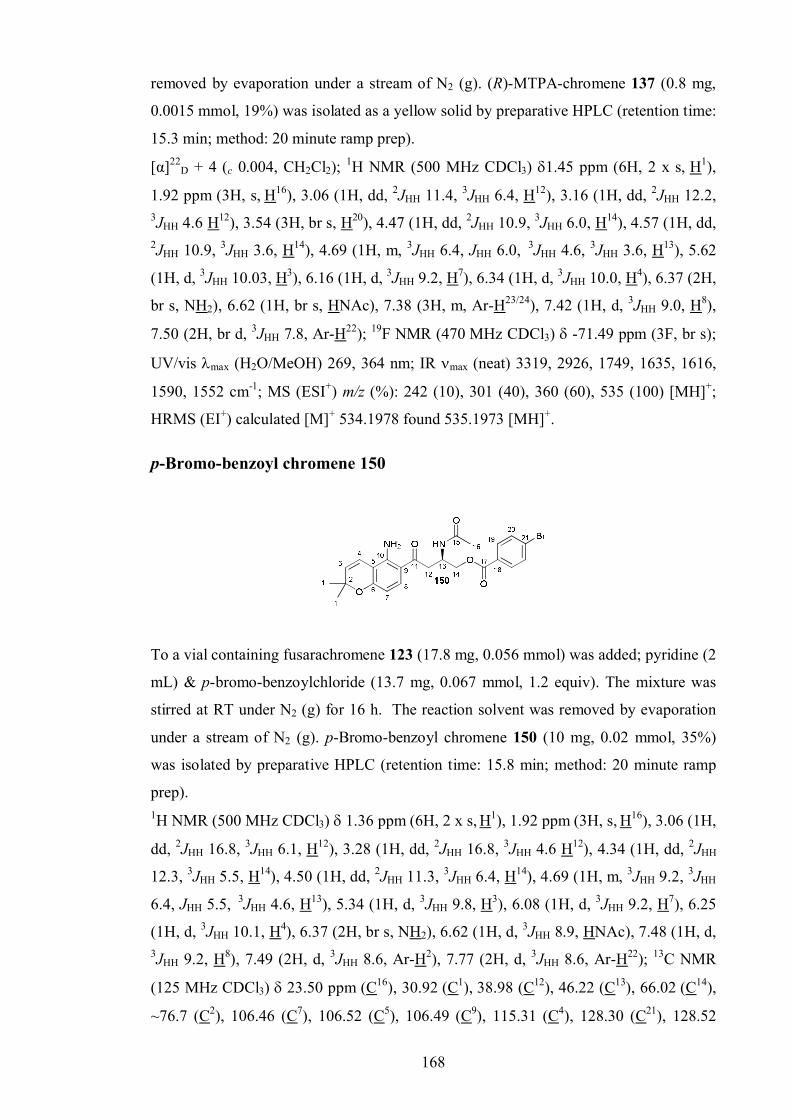
168
removed by evaporation under a stream of N2 (g). (R)-MTPA-chromene 137 (0.8 mg,
0.0015 mmol, 19%) was isolated as a yellow solid by preparative HPLC (retention time:
15.3 min; method: 20 minute ramp prep).
[α]22D + 4 (c 0.004, CH2Cl2); 1H NMR (500 MHz CDCl3) 1.45 ppm (6H, 2 x s, H1),
1.92 ppm (3H, s, H16), 3.06 (1H, dd, 2JHH 11.4, 3JHH 6.4, H12), 3.16 (1H, dd, 2JHH 12.2, 3JHH 4.6 H12), 3.54 (3H, br s, H20), 4.47 (1H, dd, 2JHH 10.9, 3JHH 6.0, H14), 4.57 (1H, dd, 2JHH 10.9, 3JHH 3.6, H14), 4.69 (1H, m, 3JHH 6.4, JHH 6.0, 3JHH 4.6, 3JHH 3.6, H13), 5.62
(1H, d, 3JHH 10.03, H3), 6.16 (1H, d, 3JHH 9.2, H7), 6.34 (1H, d, 3JHH 10.0, H4), 6.37 (2H,
br s, NH2), 6.62 (1H, br s, HNAc), 7.38 (3H, m, Ar-H23/24), 7.42 (1H, d, 3JHH 9.0, H8),
7.50 (2H, br d, 3JHH 7.8, Ar-H22); 19F NMR (470 MHz CDCl3) -71.49 ppm (3F, br s);
UV/vis max (H2O/MeOH) 269, 364 nm; IR max (neat) 3319, 2926, 1749, 1635, 1616,
1590, 1552 cm-1; MS (ESI+) m/z (%): 242 (10), 301 (40), 360 (60), 535 (100) [MH]+;
HRMS (EI+) calculated [M]+ 534.1978 found 535.1973 [MH]+.
p-Bromo-benzoyl chromene 150
To a vial containing fusarachromene 123 (17.8 mg, 0.056 mmol) was added; pyridine (2
mL) & p-bromo-benzoylchloride (13.7 mg, 0.067 mmol, 1.2 equiv). The mixture was
stirred at RT under N2 (g) for 16 h. The reaction solvent was removed by evaporation
under a stream of N2 (g). p-Bromo-benzoyl chromene 150 (10 mg, 0.02 mmol, 35%)
was isolated by preparative HPLC (retention time: 15.8 min; method: 20 minute ramp
prep).1H NMR (500 MHz CDCl3) 1.36 ppm (6H, 2 x s, H1), 1.92 ppm (3H, s, H16), 3.06 (1H,
dd, 2JHH 16.8, 3JHH 6.1, H12), 3.28 (1H, dd, 2JHH 16.8, 3JHH 4.6 H12), 4.34 (1H, dd, 2JHH
12.3, 3JHH 5.5, H14), 4.50 (1H, dd, 2JHH 11.3, 3JHH 6.4, H14), 4.69 (1H, m, 3JHH 9.2, 3JHH
6.4, JHH 5.5, 3JHH 4.6, H13), 5.34 (1H, d, 3JHH 9.8, H3), 6.08 (1H, d, 3JHH 9.2, H7), 6.25
(1H, d, 3JHH 10.1, H4), 6.37 (2H, br s, NH2), 6.62 (1H, d, 3JHH 8.9, HNAc), 7.48 (1H, d, 3JHH 9.2, H8), 7.49 (2H, d, 3JHH 8.6, Ar-H2), 7.77 (2H, d, 3JHH 8.6, Ar-H22); 13C NMR
(125 MHz CDCl3) 23.50 ppm (C16), 30.92 (C1), 38.98 (C12), 46.22 (C13), 66.02 (C14),
~76.7 (C2), 106.46 (C7), 106.52 (C5), 106.49 (C9), 115.31 (C4), 128.30 (C21), 128.52
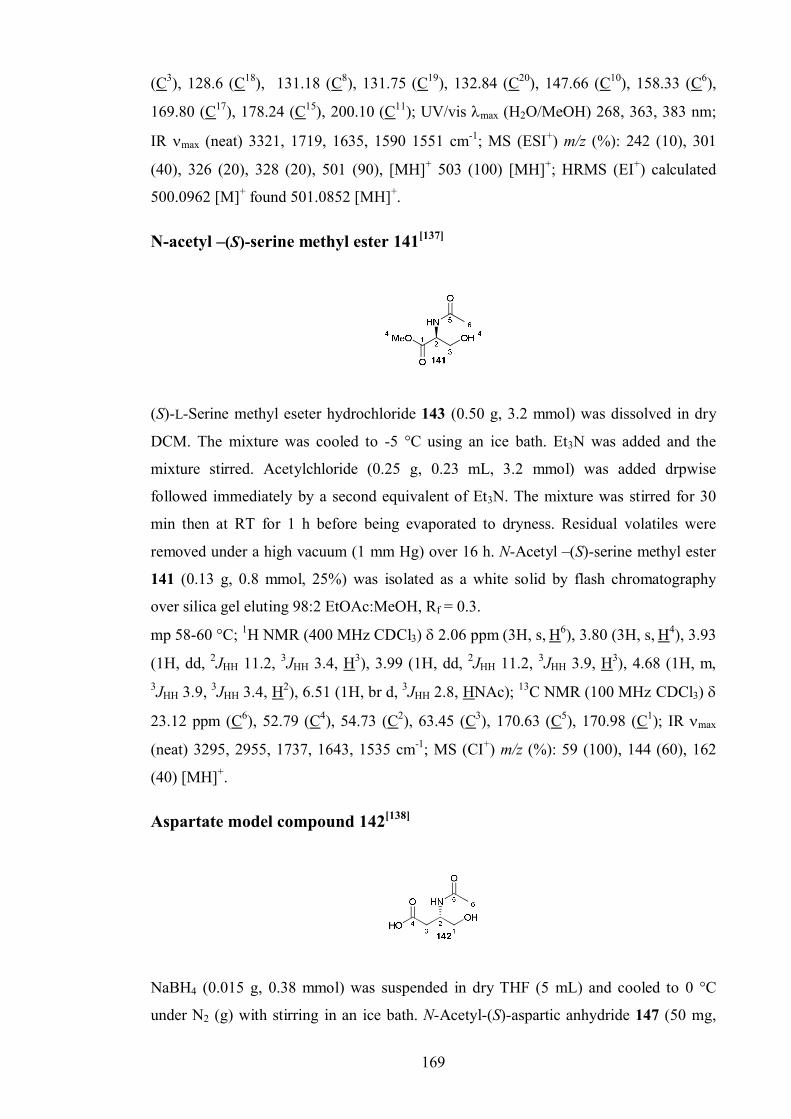
169
(C3), 128.6 (C18), 131.18 (C8), 131.75 (C19), 132.84 (C20), 147.66 (C10), 158.33 (C6),
169.80 (C17), 178.24 (C15), 200.10 (C11); UV/vis max (H2O/MeOH) 268, 363, 383 nm;
IR max (neat) 3321, 1719, 1635, 1590 1551 cm-1; MS (ESI+) m/z (%): 242 (10), 301
(40), 326 (20), 328 (20), 501 (90), [MH]+ 503 (100) [MH]+; HRMS (EI+) calculated
500.0962 [M]+ found 501.0852 [MH]+.
N-acetyl –(S)-serine methyl ester 141[137]
(S)-L-Serine methyl eseter hydrochloride 143 (0.50 g, 3.2 mmol) was dissolved in dry
DCM. The mixture was cooled to -5 °C using an ice bath. Et3N was added and the
mixture stirred. Acetylchloride (0.25 g, 0.23 mL, 3.2 mmol) was added drpwise
followed immediately by a second equivalent of Et3N. The mixture was stirred for 30
min then at RT for 1 h before being evaporated to dryness. Residual volatiles were
removed under a high vacuum (1 mm Hg) over 16 h. N-Acetyl –(S)-serine methyl ester
141 (0.13 g, 0.8 mmol, 25%) was isolated as a white solid by flash chromatography
over silica gel eluting 98:2 EtOAc:MeOH, Rf = 0.3.
mp 58-60 °C; 1H NMR (400 MHz CDCl3) 2.06 ppm (3H, s, H6), 3.80 (3H, s, H4), 3.93
(1H, dd, 2JHH 11.2, 3JHH 3.4, H3), 3.99 (1H, dd, 2JHH 11.2, 3JHH 3.9, H3), 4.68 (1H, m, 3JHH 3.9, 3JHH 3.4, H2), 6.51 (1H, br d, 3JHH 2.8, HNAc); 13C NMR (100 MHz CDCl3)
23.12 ppm (C6), 52.79 (C4), 54.73 (C2), 63.45 (C3), 170.63 (C5), 170.98 (C1); IR max
(neat) 3295, 2955, 1737, 1643, 1535 cm-1; MS (CI+) m/z (%): 59 (100), 144 (60), 162
(40) [MH]+.
Aspartate model compound 142[138]
NaBH4 (0.015 g, 0.38 mmol) was suspended in dry THF (5 mL) and cooled to 0 °C
under N2 (g) with stirring in an ice bath. N-Acetyl-(S)-aspartic anhydride 147 (50 mg,
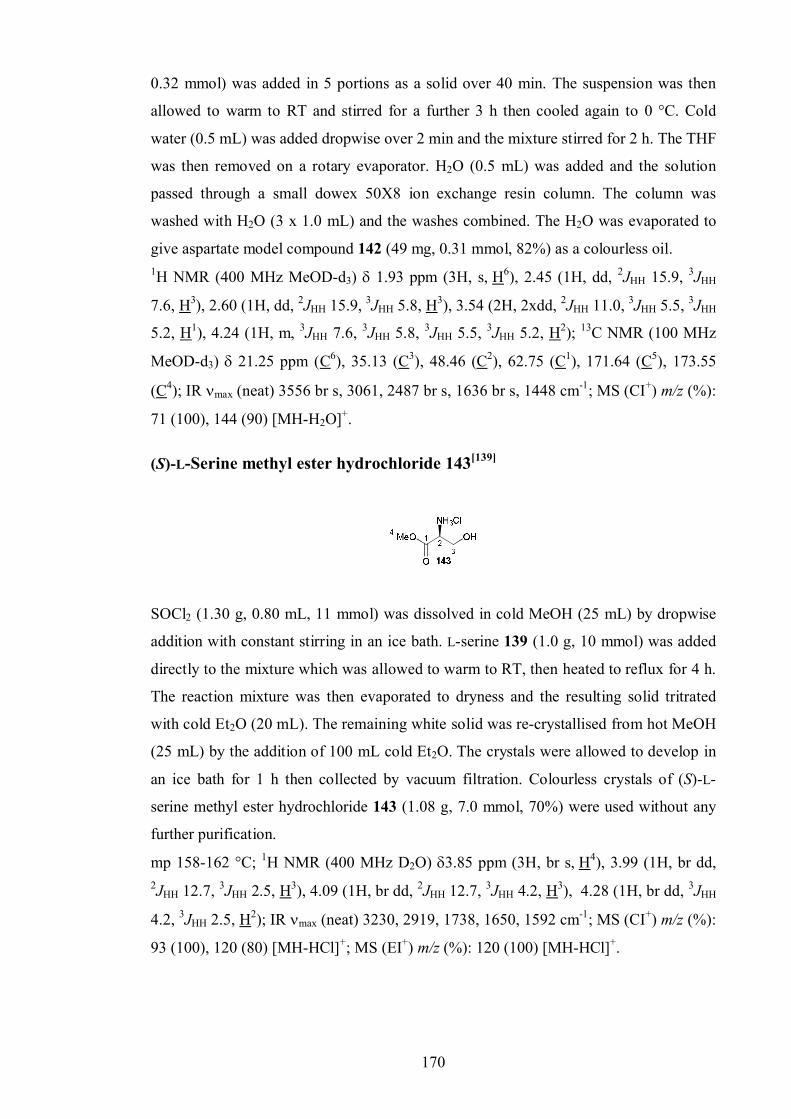
170
0.32 mmol) was added in 5 portions as a solid over 40 min. The suspension was then
allowed to warm to RT and stirred for a further 3 h then cooled again to 0 °C. Cold
water (0.5 mL) was added dropwise over 2 min and the mixture stirred for 2 h. The THF
was then removed on a rotary evaporator. H2O (0.5 mL) was added and the solution
passed through a small dowex 50X8 ion exchange resin column. The column was
washed with H2O (3 x 1.0 mL) and the washes combined. The H2O was evaporated to
give aspartate model compound 142 (49 mg, 0.31 mmol, 82%) as a colourless oil.1H NMR (400 MHz MeOD-d3) 1.93 ppm (3H, s, H6), 2.45 (1H, dd, 2JHH 15.9, 3JHH
7.6, H3), 2.60 (1H, dd, 2JHH 15.9, 3JHH 5.8, H3), 3.54 (2H, 2xdd, 2JHH 11.0, 3JHH 5.5, 3JHH
5.2, H1), 4.24 (1H, m, 3JHH 7.6, 3JHH 5.8, 3JHH 5.5, 3JHH 5.2, H2); 13C NMR (100 MHz
MeOD-d3) 21.25 ppm (C6), 35.13 (C3), 48.46 (C2), 62.75 (C1), 171.64 (C5), 173.55
(C4); IR max (neat) 3556 br s, 3061, 2487 br s, 1636 br s, 1448 cm-1; MS (CI+) m/z (%):
71 (100), 144 (90) [MH-H2O]+.
(S)-L-Serine methyl ester hydrochloride 143[139]
SOCl2 (1.30 g, 0.80 mL, 11 mmol) was dissolved in cold MeOH (25 mL) by dropwise
addition with constant stirring in an ice bath. L-serine 139 (1.0 g, 10 mmol) was added
directly to the mixture which was allowed to warm to RT, then heated to reflux for 4 h.
The reaction mixture was then evaporated to dryness and the resulting solid tritrated
with cold Et2O (20 mL). The remaining white solid was re-crystallised from hot MeOH
(25 mL) by the addition of 100 mL cold Et2O. The crystals were allowed to develop in
an ice bath for 1 h then collected by vacuum filtration. Colourless crystals of (S)-L-
serine methyl ester hydrochloride 143 (1.08 g, 7.0 mmol, 70%) were used without any
further purification.
mp 158-162 °C; 1H NMR (400 MHz D2O) 3.85 ppm (3H, br s, H4), 3.99 (1H, br dd, 2JHH 12.7, 3JHH 2.5, H3), 4.09 (1H, br dd, 2JHH 12.7, 3JHH 4.2, H3), 4.28 (1H, br dd, 3JHH
4.2, 3JHH 2.5, H2); IR max (neat) 3230, 2919, 1738, 1650, 1592 cm-1; MS (CI+) m/z (%):
93 (100), 120 (80) [MH-HCl]+; MS (EI+) m/z (%): 120 (100) [MH-HCl]+.
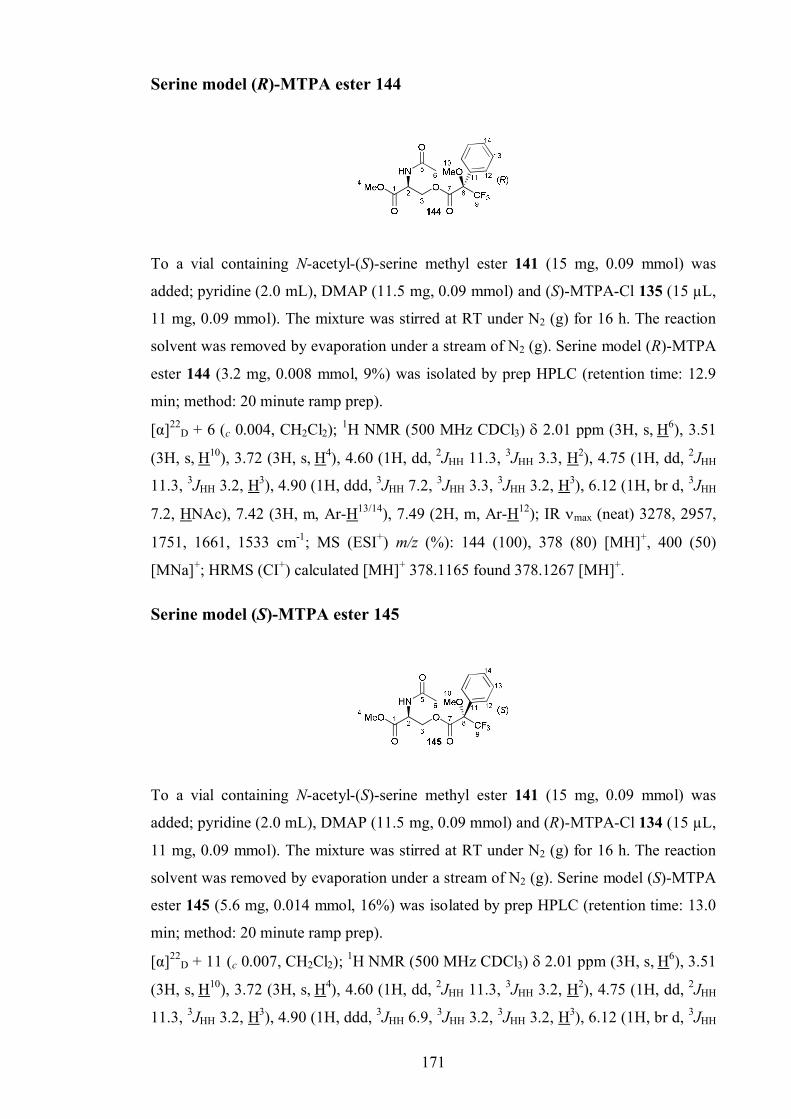
171
Serine model (R)-MTPA ester 144
To a vial containing N-acetyl-(S)-serine methyl ester 141 (15 mg, 0.09 mmol) was
added; pyridine (2.0 mL), DMAP (11.5 mg, 0.09 mmol) and (S)-MTPA-Cl 135 (15 µL,
11 mg, 0.09 mmol). The mixture was stirred at RT under N2 (g) for 16 h. The reaction
solvent was removed by evaporation under a stream of N2 (g). Serine model (R)-MTPA
ester 144 (3.2 mg, 0.008 mmol, 9%) was isolated by prep HPLC (retention time: 12.9
min; method: 20 minute ramp prep).
[α]22D + 6 (c 0.004, CH2Cl2); 1H NMR (500 MHz CDCl3) 2.01 ppm (3H, s, H6), 3.51
(3H, s, H10), 3.72 (3H, s, H4), 4.60 (1H, dd, 2JHH 11.3, 3JHH 3.3, H2), 4.75 (1H, dd, 2JHH
11.3, 3JHH 3.2, H3), 4.90 (1H, ddd, 3JHH 7.2, 3JHH 3.3, 3JHH 3.2, H3), 6.12 (1H, br d, 3JHH
7.2, HNAc), 7.42 (3H, m, Ar-H13/14), 7.49 (2H, m, Ar-H12); IR max (neat) 3278, 2957,
1751, 1661, 1533 cm-1; MS (ESI+) m/z (%): 144 (100), 378 (80) [MH]+, 400 (50)
[MNa]+; HRMS (CI+) calculated [MH]+ 378.1165 found 378.1267 [MH]+.
Serine model (S)-MTPA ester 145
To a vial containing N-acetyl-(S)-serine methyl ester 141 (15 mg, 0.09 mmol) was
added; pyridine (2.0 mL), DMAP (11.5 mg, 0.09 mmol) and (R)-MTPA-Cl 134 (15 µL,
11 mg, 0.09 mmol). The mixture was stirred at RT under N2 (g) for 16 h. The reaction
solvent was removed by evaporation under a stream of N2 (g). Serine model (S)-MTPA
ester 145 (5.6 mg, 0.014 mmol, 16%) was isolated by prep HPLC (retention time: 13.0
min; method: 20 minute ramp prep).
[α]22D + 11 (c 0.007, CH2Cl2); 1H NMR (500 MHz CDCl3) 2.01 ppm (3H, s, H6), 3.51
(3H, s, H10), 3.72 (3H, s, H4), 4.60 (1H, dd, 2JHH 11.3, 3JHH 3.2, H2), 4.75 (1H, dd, 2JHH
11.3, 3JHH 3.2, H3), 4.90 (1H, ddd, 3JHH 6.9, 3JHH 3.2, 3JHH 3.2, H3), 6.12 (1H, br d, 3JHH
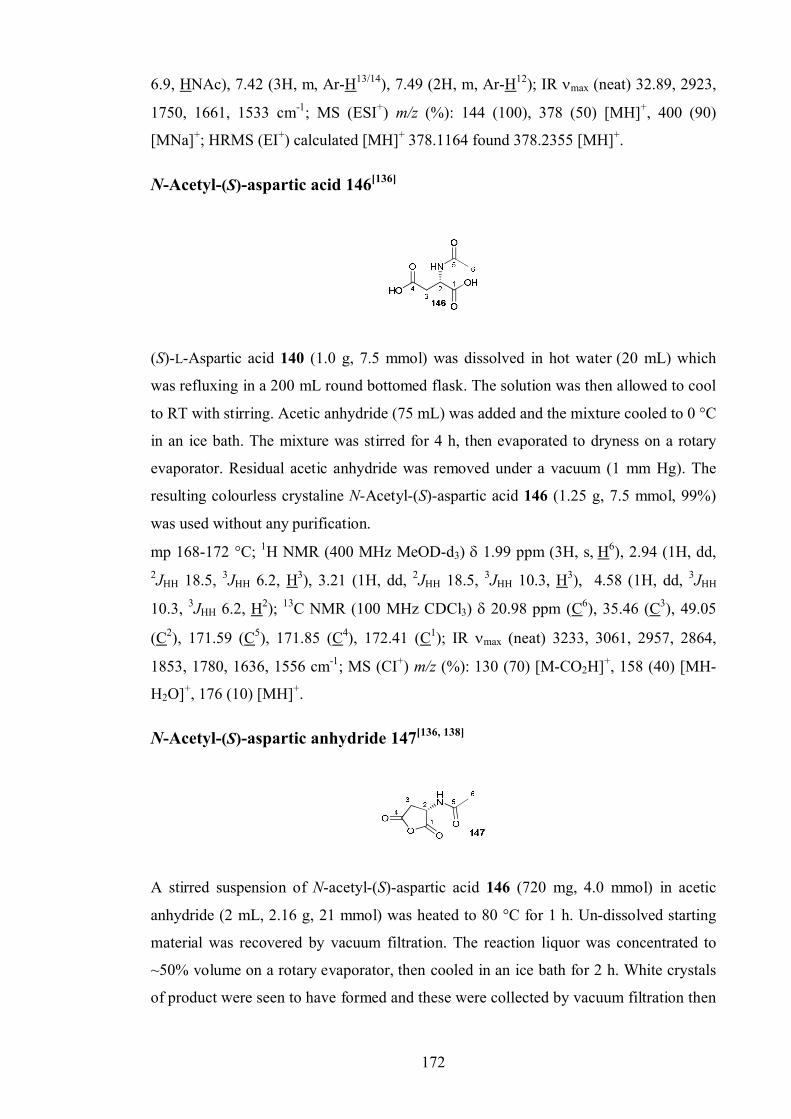
172
6.9, HNAc), 7.42 (3H, m, Ar-H13/14), 7.49 (2H, m, Ar-H12); IR max (neat) 32.89, 2923,
1750, 1661, 1533 cm-1; MS (ESI+) m/z (%): 144 (100), 378 (50) [MH]+, 400 (90)
[MNa]+; HRMS (EI+) calculated [MH]+ 378.1164 found 378.2355 [MH]+.
N-Acetyl-(S)-aspartic acid 146[136]
(S)-L-Aspartic acid 140 (1.0 g, 7.5 mmol) was dissolved in hot water (20 mL) which
was refluxing in a 200 mL round bottomed flask. The solution was then allowed to cool
to RT with stirring. Acetic anhydride (75 mL) was added and the mixture cooled to 0 °C
in an ice bath. The mixture was stirred for 4 h, then evaporated to dryness on a rotary
evaporator. Residual acetic anhydride was removed under a vacuum (1 mm Hg). The
resulting colourless crystaline N-Acetyl-(S)-aspartic acid 146 (1.25 g, 7.5 mmol, 99%)
was used without any purification.
mp 168-172 °C; 1H NMR (400 MHz MeOD-d3) 1.99 ppm (3H, s, H6), 2.94 (1H, dd, 2JHH 18.5, 3JHH 6.2, H3), 3.21 (1H, dd, 2JHH 18.5, 3JHH 10.3, H3), 4.58 (1H, dd, 3JHH
10.3, 3JHH 6.2, H2); 13C NMR (100 MHz CDCl3) 20.98 ppm (C6), 35.46 (C3), 49.05
(C2), 171.59 (C5), 171.85 (C4), 172.41 (C1); IR max (neat) 3233, 3061, 2957, 2864,
1853, 1780, 1636, 1556 cm-1; MS (CI+) m/z (%): 130 (70) [M-CO2H]+, 158 (40) [MH-
H2O]+, 176 (10) [MH]+.
N-Acetyl-(S)-aspartic anhydride 147[136, 138]
A stirred suspension of N-acetyl-(S)-aspartic acid 146 (720 mg, 4.0 mmol) in acetic
anhydride (2 mL, 2.16 g, 21 mmol) was heated to 80 °C for 1 h. Un-dissolved starting
material was recovered by vacuum filtration. The reaction liquor was concentrated to
~50% volume on a rotary evaporator, then cooled in an ice bath for 2 h. White crystals
of product were seen to have formed and these were collected by vacuum filtration then
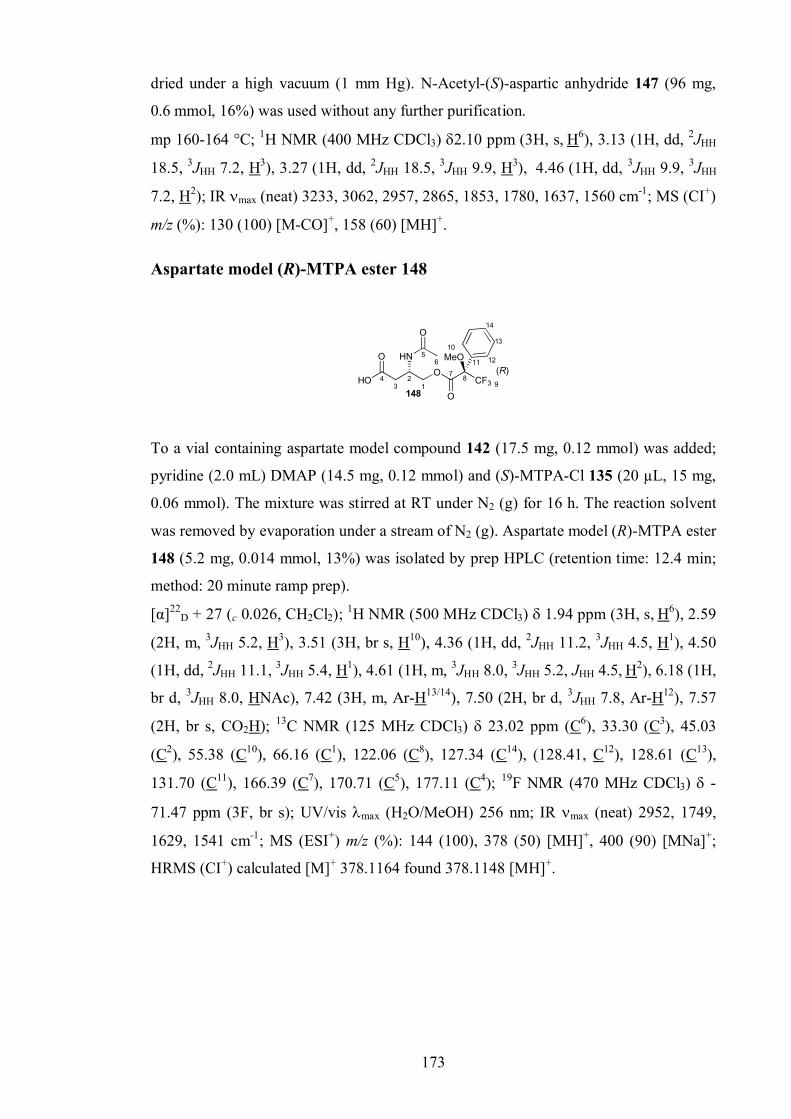
173
dried under a high vacuum (1 mm Hg). N-Acetyl-(S)-aspartic anhydride 147 (96 mg,
0.6 mmol, 16%) was used without any further purification.
mp 160-164 °C; 1H NMR (400 MHz CDCl3) 2.10 ppm (3H, s, H6), 3.13 (1H, dd, 2JHH
18.5, 3JHH 7.2, H3), 3.27 (1H, dd, 2JHH 18.5, 3JHH 9.9, H3), 4.46 (1H, dd, 3JHH 9.9, 3JHH
7.2, H2); IR max (neat) 3233, 3062, 2957, 2865, 1853, 1780, 1637, 1560 cm-1; MS (CI+)
m/z (%): 130 (100) [M-CO]+, 158 (60) [MH]+.
Aspartate model (R)-MTPA ester 148
43
O
21
O
HN 56
O
7
O
8
MeO10
CF3 9
11
HO148
(R)12
13
14
To a vial containing aspartate model compound 142 (17.5 mg, 0.12 mmol) was added;
pyridine (2.0 mL) DMAP (14.5 mg, 0.12 mmol) and (S)-MTPA-Cl 135 (20 µL, 15 mg,
0.06 mmol). The mixture was stirred at RT under N2 (g) for 16 h. The reaction solvent
was removed by evaporation under a stream of N2 (g). Aspartate model (R)-MTPA ester
148 (5.2 mg, 0.014 mmol, 13%) was isolated by prep HPLC (retention time: 12.4 min;
method: 20 minute ramp prep).
[α]22D + 27 (c 0.026, CH2Cl2); 1H NMR (500 MHz CDCl3) 1.94 ppm (3H, s, H6), 2.59
(2H, m, 3JHH 5.2, H3), 3.51 (3H, br s, H10), 4.36 (1H, dd, 2JHH 11.2, 3JHH 4.5, H1), 4.50
(1H, dd, 2JHH 11.1, 3JHH 5.4, H1), 4.61 (1H, m, 3JHH 8.0, 3JHH 5.2, JHH 4.5, H2), 6.18 (1H,
br d, 3JHH 8.0, HNAc), 7.42 (3H, m, Ar-H13/14), 7.50 (2H, br d, 3JHH 7.8, Ar-H12), 7.57
(2H, br s, CO2H); 13C NMR (125 MHz CDCl3) 23.02 ppm (C6), 33.30 (C3), 45.03
(C2), 55.38 (C10), 66.16 (C1), 122.06 (C8), 127.34 (C14), (128.41, C12), 128.61 (C13),
131.70 (C11), 166.39 (C7), 170.71 (C5), 177.11 (C4); 19F NMR (470 MHz CDCl3) -
71.47 ppm (3F, br s); UV/vis max (H2O/MeOH) 256 nm; IR max (neat) 2952, 1749,
1629, 1541 cm-1; MS (ESI+) m/z (%): 144 (100), 378 (50) [MH]+, 400 (90) [MNa]+;
HRMS (CI+) calculated [M]+ 378.1164 found 378.1148 [MH]+.

174
Aspartate model (S)-MTPA ester 149
To a vial containing aspartate model compound 149 (17.5 mg, 0.12 mmol) was added;
pyridine (2.0 mL), DMAP (14.5 mg, 0.12 mmol) and (R)-MTPA-Cl 134 (40 µL, 30 mg,
0.12 mmol). The mixture was stirred at RT under N2 (g) for 16 h. The reaction solvent
was removed by evaporation under a stream of N2 (g). Aspartate model (S)-MTPA ester
149 (3.7 mg, 0.009 mmol, 8%) was isolated by prep HPLC (retention time: 12.3 min;
method: 20 minute ramp prep).
[α]22D - 37 (c 0.019, CH2Cl2); 1H NMR (500 MHz CDCl3) 1.92 ppm (3H, s, H6), 2.59
(2H, m, 3JHH 5.8, H3), 3.53 (3H, br s, H10), 4.44 (2H, ABX, 2JHH 14.9, 3JHH 5.6, 3JHH 5.3,
H1), 4.62 (1H, m, 3JHH 8.7, 3JHH 5.8, 3JHH 5.6, JHH 5.3, H2), 6.08 (1H, br d, 3JHH 8.7,
HNAc), 7.42 (3H, m, Ar-H13/14), 7.49 (2H, br d, 3JHH 7.8, Ar-H12), 7.58 (2H, br s,
CO2H); 13C NMR (125 MHz CDCl3) 23.06 ppm (C6), 33.30 (C3), 44.95 (C2), 59.60
(C10), 66.08 (C1), 122.06 (C8), 127.23 (C14), (128.62, C12), 129.86 (C13), 131.83 (C11),
166.43 (C7), 170.49 (C5), 174.14 (C1); 19F NMR (470 MHz CDCl3) -71.43 ppm (3F,
br s); UV/vis max (H2O/MeOH) 256 nm; IR max (neat) 2955, 1749, 1639, 1541 cm-1;
MS (ESI+) m/z (%): 144 (100), 378 (60) [MH]+, 400 (30) [MNa]+; HRMS (CI+)
calculated [M]+ 378.1164 found 378.1149 [MH]+.
Pre-tenellin A 198
NMR data (Table 8).
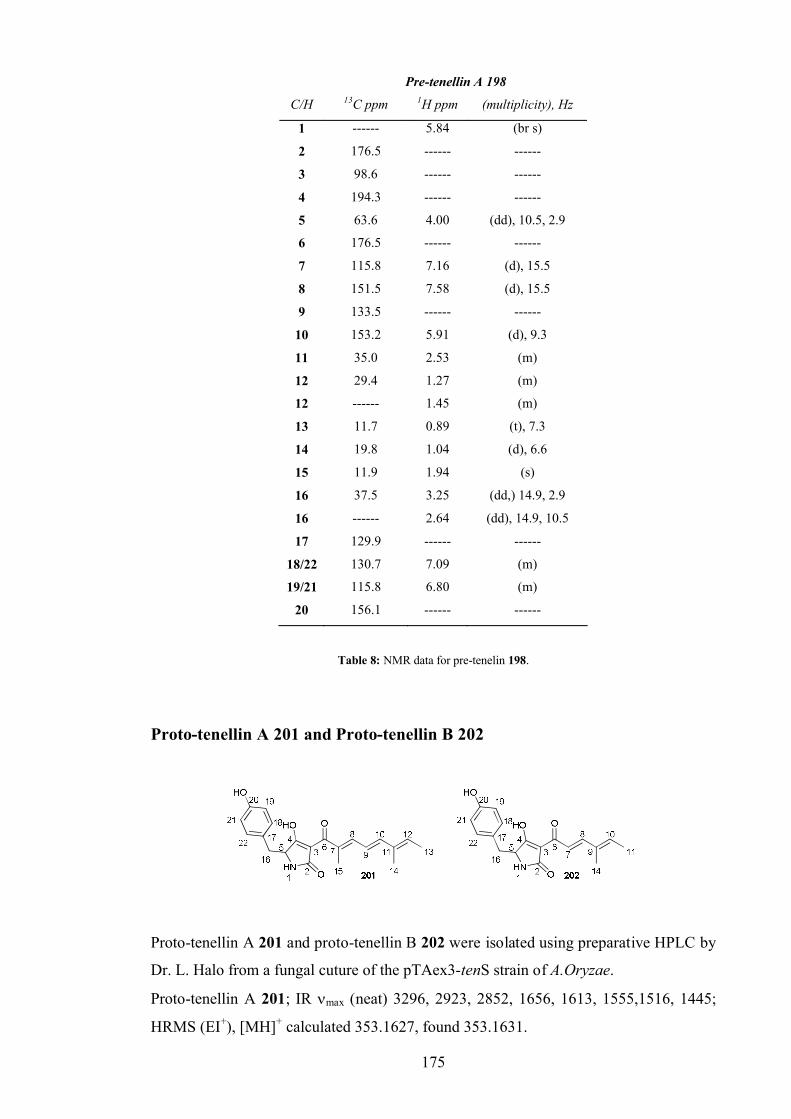
175
Pre-tenellin A 198
C/H 13C ppm 1H ppm (multiplicity), Hz
1 ------ 5.84 (br s)
2 176.5 ------ ------
3 98.6 ------ ------
4 194.3 ------ ------
5 63.6 4.00 (dd), 10.5, 2.9
6 176.5 ------ ------
7 115.8 7.16 (d), 15.5
8 151.5 7.58 (d), 15.5
9 133.5 ------ ------
10 153.2 5.91 (d), 9.3
11 35.0 2.53 (m)
12 29.4 1.27 (m)
12 ------ 1.45 (m)
13 11.7 0.89 (t), 7.3
14 19.8 1.04 (d), 6.6
15 11.9 1.94 (s)
16 37.5 3.25 (dd,) 14.9, 2.9
16 ------ 2.64 (dd), 14.9, 10.5
17 129.9 ------ ------
18/22 130.7 7.09 (m)
19/21 115.8 6.80 (m)
20 156.1 ------ ------
Table 8: NMR data for pre-tenelin 198.
Proto-tenellin A 201 and Proto-tenellin B 202
Proto-tenellin A 201 and proto-tenellin B 202 were isolated using preparative HPLC by
Dr. L. Halo from a fungal cuture of the pTAex3-tenS strain of A.Oryzae.
Proto-tenellin A 201; IR max (neat) 3296, 2923, 2852, 1656, 1613, 1555,1516, 1445;
HRMS (EI+), [MH]+ calculated 353.1627, found 353.1631.
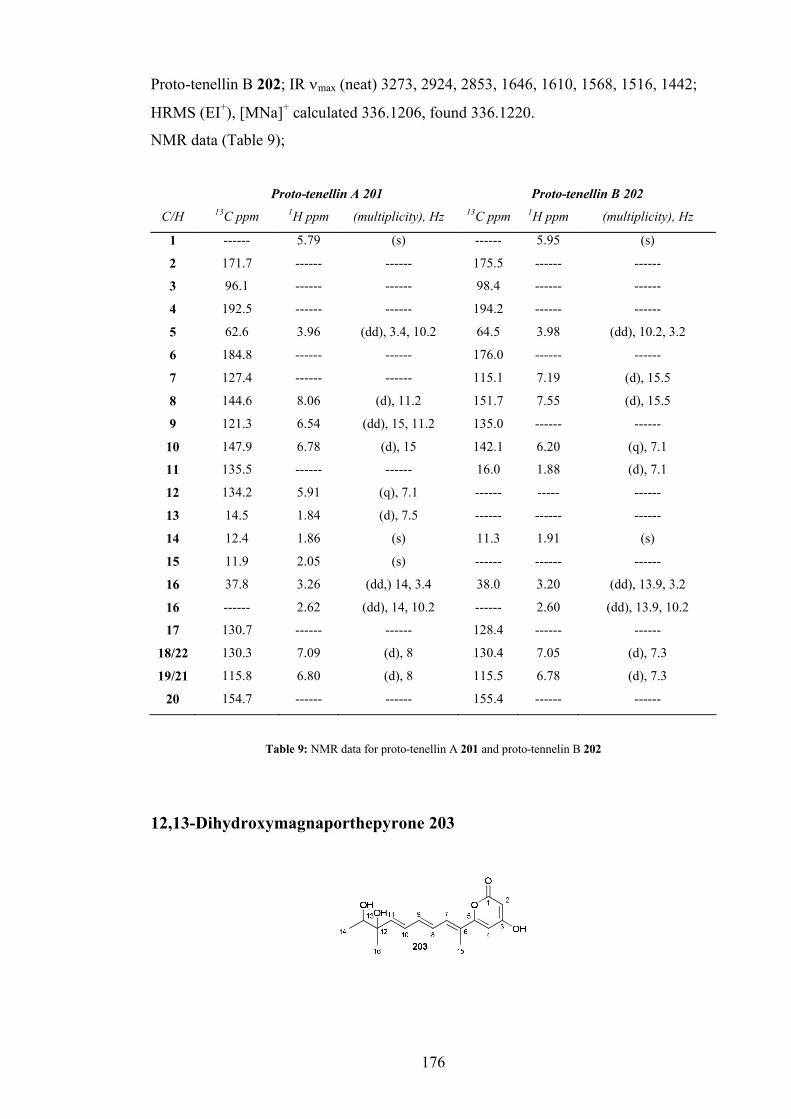
176
Proto-tenellin B 202; IR max (neat) 3273, 2924, 2853, 1646, 1610, 1568, 1516, 1442;
HRMS (EI+), [MNa]+ calculated 336.1206, found 336.1220.
NMR data (Table 9);
Proto-tenellin A 201 Proto-tenellin B 202
C/H 13C ppm 1H ppm (multiplicity), Hz 13C ppm 1H ppm (multiplicity), Hz
1 ------ 5.79 (s) ------ 5.95 (s)
2 171.7 ------ ------ 175.5 ------ ------
3 96.1 ------ ------ 98.4 ------ ------
4 192.5 ------ ------ 194.2 ------ ------
5 62.6 3.96 (dd), 3.4, 10.2 64.5 3.98 (dd), 10.2, 3.2
6 184.8 ------ ------ 176.0 ------ ------
7 127.4 ------ ------ 115.1 7.19 (d), 15.5
8 144.6 8.06 (d), 11.2 151.7 7.55 (d), 15.5
9 121.3 6.54 (dd), 15, 11.2 135.0 ------ ------
10 147.9 6.78 (d), 15 142.1 6.20 (q), 7.1
11 135.5 ------ ------ 16.0 1.88 (d), 7.1
12 134.2 5.91 (q), 7.1 ------ ----- ------
13 14.5 1.84 (d), 7.5 ------ ------ ------
14 12.4 1.86 (s) 11.3 1.91 (s)
15 11.9 2.05 (s) ------ ------ ------
16 37.8 3.26 (dd,) 14, 3.4 38.0 3.20 (dd), 13.9, 3.2
16 ------ 2.62 (dd), 14, 10.2 ------ 2.60 (dd), 13.9, 10.2
17 130.7 ------ ------ 128.4 ------ ------
18/22 130.3 7.09 (d), 8 130.4 7.05 (d), 7.3
19/21 115.8 6.80 (d), 8 115.5 6.78 (d), 7.3
20 154.7 ------ ------ 155.4 ------ ------
Table 9: NMR data for proto-tenellin A 201 and proto-tennelin B 202
12,13-Dihydroxymagnaporthepyrone 203
177
12,13-Dihydroxymagnaporthepyrone 203, a mixture of diasteroisomers, was isolated as
an amorphous yellow solid (15 mg) by preparative HPLC (retention time: 28.9 min;
method: 60 minute ramp prep).1H NMR (500 MHz Acetone-d6) 1.11 ppm (3H, 2xd, 3JHH 6.5, 3JHH 6.4, H14), 1.75
(3H, 2xs, H16), 2.04 (3H, 2xs, H15), 3.62 (1H, 2xq, 3JHH 6.5, 3JHH 6.4, H13), 5.39 (1H, d, 3JHH 2.0, H2), 6.09 (1H, 2xd, 3JHH 15.4, 3JHH 15.2, H11), 6.20 (1H, d, 3JHH 2.0, H4), 6.55
(1H, 2xdd, 3JHH 15.4, 3JHH 15.2, 3JHH 6.4,3JHH 6.0, H10), 6.69 (2H, 4xdd, 3JHH 15.4, 3JHH
15.4, 3JHH 7.1, 3JHH 6.0, 3JHH 10.6, 3JHH 10.6, H8/9), 7.09 (1H, br d, 3JHH 10.6, H7); 13C
NMR (151 MHz Acetone-d6) 12.66 ppm (C15), 18.08 & 19.26 (C14), 24.52 & 23.69
(C16), 74.23 (C13), 75.75 (C12), 90.09 (C2), 98.99 (C4), 126.78 (C6), 128.20 (C8), 129.51
& 129.77 (C10), 132.46 (C7), 139.55 & 139.55 (C9), 142.84 & 143.16 (C11), 162.37
(C3/5), 162.60 (C3/5), 163.63 (C1); UV/vis max (H2O/MeOH) 273, 362 nm; IR max
(neat) 3375 br s, 2926, 1685 br s, 1530 cm-1; MS (ESI+) m/z (%): 293 (100) [MH]+, 315
(50) [MNa]+; MS (ESI-) m/z (%): 291 (100) [M-H]-; HRMS (ESI+) calculated [MH-
H2O]+ 275.1277 found 275.0922; HRMS (ESI-) calculated [M-H]- 291.1033 found
291.1238.
178
References
[1] J. R. Hanson, Natural products: the secondary metabolites, Royal Society of Chemistry, Cambridge, 2003.
[2] J. Mann, Chemical Aspects of Biosynthesis, Oxford University Press, 1994.[3] H. Balba, J. Environ. Sci. Health Part B-Pestic. Contam. Agric. Wastes 2007,
42, 441.[4] A. M. Rimando, S. O. Duke, in Natural Products for Pest Management, Vol.
927, ACS, 2006, pp. 2.[5] S. Gaisser, R. Lill, G. Wirtz, F. Grolle, J. Staunton, P. F. Leadlay, Mol.
Microbiol. 2001, 41, 1223.[6] D. J. Newman, G. M. Cragg, J. Nat. Prod. 2007, 70, 461.[7] A. M. Rosenthal, NIBR Science 2004, Spring, 27.[8] S. V. Ley, A. A. Denholm, A. Wood, Nat. Prod. Rep. 1993, 10, 109.[9] G. E. Veitch, E. Beckmann, B. J. Burke, A. Boyer, S. L. Maslen, S. V. Ley,
Angew. Chem., Int. Ed. 2007, 46, 7629.[10] J. Staunton, K. J. Weissman, Nat. Prod. Rep. 2001, 18, 380.[11] S. Donadio, M. J. Staver, J. B. McAlpine, S. J. Swanson, Gene 1992, 115, 97.[12] S. Donadio, J. B. McAlpine, P. J. Sheldon, M. Jackson, Proc. Natl. Acad. Sci. U.
S. A. 1993, 90, 7119.[13] C. Hertweck, A. Luzhetskyy, Y. Rebets, A. Bechthold, Natural Product Reports
2007, 24, 162.[14] R. J. Cox, Org. Biomol. Chem. 2007, 5, 2010.[15] C. J. Arthur, A. Szafranska, S. E. Evans, S. C. Findlow, S. G. Burston, P. Owen,
I. Clark-Lewis, T. J. Simpson, J. Crosby, M. P. Crump, Biochemistry 2005, 44, 15414.
[16] R. McDaniel, S. Ebert-Khosla, H. Fu, D. A. Hopwood, Proc. Natl. Acad. Sci. U. S. A. 1994, 91, 11542.
[17] B. J. Rawlings, Nat. Prod. Rep. 2001, 18, 190.[18] P. Beltran-Alvarez, R. J. Cox, J. Crosby, T. J. Simpson, Biochemistry 2007, 46,
14672.[19] C. Bisang, P. F. Long, J. Cortes, J. Westcott, J. Crosby, A. L. Matharu, R. J.
Cox, T. J. Simpson, J. Staunton, P. F. Leadlay, Nature 1999, 502.[20] N. Funa, T. Awakawa, S. Horinouchi, J. Biol. Chem. 2007, 282, 14476.[21] S. Gruschow, T. J. Buchholz, W. Seufert, J. S. Dordick, D. H. Sherman,
ChemBioChem 2007, 8, 863.[22] I. Abe, T. Abe, K. Wanibuchi, H. Noguchi, Org. Lett. 2006, 8, 6063.[23] N. Funa, H. Ozawa, A. Hirata, S. Horinouchi, Proc. Natl. Acad. Sci. U. S. A.
2006, 103, 6356.[24] M. A. Marahiel, T. Stachelhaus, H. D. Mootz, Chem. Rev. 1997, 97, 2651.[25] D. Schwarzer, R. Finking, M. A. Marahiel, Nat. Prod. Rep. 2003, 20, 275.[26] M. A. Marahiel, L. O. Essen, in Complex Enzymes in Microbial Natural Product
Biosynthesis, Part A: Overview Articles and Peptides, Vol. 458, Elsevier Academic Press Inc, San Diego, 2009, pp. 337.
[27] R. Finking, M. A. Marahiel, Annu. Rev. Microbiol. 2004, 58, 453.[28] J. Collemare, A. Billard, H. U. Bohnert, M. H. Lebrun, Mycological Research
2008, 112, 207.[29] Z. Song, R. J. Cox, C. M. Lazarus, T. J. Simpson, ChemBioChem 2004, 5, 1196.[30] M. Rohmer, Nat. Prod. Rep. 1999, 16, 565.[31] J. N. Peng, X. Y. Shen, K. A. El Sayed, D. C. Dunbar, T. L. Perry, S. P. Wilkins,
M. T. Hamann, J. Agric. Food Chem. 2003, 51, 2246.
179
[32] A. Oliva, K. M. Meepagala, D. E. Wedge, D. Harries, A. L. Hale, G. Aliotta, S. O. Duke, J. Agric. Food Chem. 2003, 51, 890.
[33] Y. O'Connell, PhD thesis, University of Bristol 2007.[34] L. Hendrickson, C. R. Davis, C. Roach, D. K. Nguyen, T. Aldrich, P. C. McAda,
C. D. Reeves, Chem. Biol. 1999, 6, 429.[35] C. D. Campbell, J. C. Vederas, Biopolymers, 93, 755.[36] B. Schneider, Progress in Nuclear Magnetic Resonance Spectroscopy 2007, 51,
155.[37] H. F. Linskens, J. F. Jackson, Modern Methods of Plant Analysis II, Nuclear
Magnetic Resonance, Springer-Verlag, 1986.[38] A. M. Saores-Sello, University of Bristol (Bristol), 1997.[39] J. A. K. Howard, V. J. Hoy, D. O'Hagan, G. T. Smith, Tetrahedron 1996, 52,
12613.[40] M. Schlosser, D. Michel, Tetrahedron 1996, 52, 99.[41] J. M. Crawford, A. L. Vagstad, K. C. Ehrlich, C. A. Townsend, Bioorg. Chem.
2008, 36, 16.[42] H. B. Bode, R. Muller, Angew. Chem. 2005, 44, 6828.[43] S. Bergmann, J. Schumann, K. Scherlach, C. Lange, A. A. Brakhage, C.
Hertweck, Nat. Chem. Biol. 2007, 3, 213.[44] D. M. Dobson, J. A. Gerrard, A. J. Prat, Foundations of Chemical Biology,
Oxford University Press, 2001.[45] J. S. Williams, M. Thomas, D. J. Clarke, Microbiology 2005, 151, 2543.[46] C. Olano, C. Mendez, J. A. Salas, Nat. Prod. Rep., 27, 571.[47] J. Collemare, M. Pianfetti, A. E. Houlle, D. Morin, L. Camborde, M. J. Gagey,
C. Barbisan, I. Fudal, M. H. Lebrun, H. U. Boehnert, New Phytol. 2008, 179, 196.
[48] J. Schumann, C. Hertweck, J. Am. Chem. Soc. 2007, 129, 9564.[49] H. Nakayashiki, S. Hanada, N. B. Quoc, N. Kadotani, Y. Tosa, S. Mayama,
Fungal Genet. Biol. 2005, 42, 275.[50] L. M. Halo, M. N. Heneghan, A. A. Yakasai, Z. Song, K. Williams, A. M.
Bailey, R. J. Cox, C. M. Lazarus, T. J. Simpson, J. Am. Chem. Soc. 2008, 130, 17988.
[51] A. Watanabe, Y. Ono, I. Fujii, U. Sankawa, M. E. Mayorga, W. E. Timberlake, Y. Ebizuka, Tetrahedron Lett. 1998, 39, 7733.
[52] Y. Sugano, R. Nakano, K. Sasaki, M. Shoda, Appl. Environ. Microbiol. 2000, 66, 1754.
[53] K. C. Nicolaou, E. J. Sorensen, Classics in Total Synthesis, Wiley-VCH, Weinheim, 1996.
[54] O. Exposito, M. Bonfill, E. Moyano, M. Onrubia, M. H. Mirjalili, R. M. Cusido, J. Palazon, Anti-Cancer Agents Med. Chem. 2009, 9, 109.
[55] R. N. Patel, in Annual Review of Microbiology, Annual Reviews Inc, 1998, pp. 361.
[56] J. Pezzuto, Nat. Biotechnol. 1996, 14, 1083.[57] S. R. Park, A. R. Han, Y. H. Ban, Y. J. Yoo, E. J. Kim, Y. J. Yoon, Appl.
Microbiol. Biotechnol., 85, 1227.[58] M. A. Fischbach, C. T. Walsh, Science 2006, 314, 603.[59] A. N. Appleyard, ChemBioChem 2007, 8, 141.[60] A. S. Eustaquio, D. O'Hagan, B. S. Moore, J. Nat. Prod. 2010, 73, 378.[61] J. Hothersall, J. Wu, A. S. Rahman, J. A. Shields, J. Haddock, N. Johnson, S. M.
Cooper, E. R. Stephens, R. J. Cox, J. Crosby, J. Biol. Chem. 2007, 282, 15451.
180
[62] J. Wu, J. Hothersall, C. Mazzetti, Y. O'Connell, J. A. Shields, A. S. Rahman, R. J. Cox, J. Crosby, T. J. Simpson, C. M. Thomas, C. L. Willis, ChemBioChem 2008, 9, 1500.
[63] L. M. Halo, J. W. Marshall, A. A. Yakasai, Z. Song, C. P. Butts, M. P. Crump, M. Heneghan, A. M. Bailey, T. J. Simpson, C. M. Lazarus, Chembiochem 2008, 9, 585.
[64] G. C. Ainsworth, Nature 1956, 177, 255.[65] S. A. Forst, N. Tabatabai, Appl. Environ. Microbiol. 1997, 63, 962.[66] R. Ffrench-Constant, N. Waterfield, P. Daborn, S. Joyce, H. Bennett, C. Au, A.
Dowling, S. Boundy, S. Reynolds, D. Clarke, FEMS Microbiol. Rev. 2003, 26, 433.
[67] J. Li, G. Chen, H. Wu, J. M. Webster, Appl. Environ. Microbiol. 1995, 61, 4329.[68] W. H. Richardson, T. M. Schmidt, K. H. Nealson, Applied and Environmental
Microbiology 1988, 54, 1602.[69] S. Derzelle, E. Duchaud, F. Kunst, A. Danchin, P. Bertin, Appl. Environ.
Microbiol. 2002, 68, 3780.[70] S. Sharma, N. Waterfield, D. Bowen, T. Rocheleau, L. Holland, R. James, R.
ffrench-Constant, FEMS Microbiol. Lett. 2002, 214, 241.[71] T. A. Ciche, M. Blackburn, J. R. Carney, J. C. Ensign, Appl. Environ. Microbiol.
2003, 69, 4706.[72] K. Hu, J. Li, B. Li, J. M. Webster, G. Chen, Bioorg. Med. Chem. 2006, 14, 4677.[73] R. Han, R. U. Ehlers, Nematology 1999, 1, 687.[74] K. Hu, J. Li, J. M. Webster, J. Chromatogr. B 1997, 703, 177.[75] K. Hu, J. Li, J. M. Webster, Nematology 1999, 1, 457.[76] V. J. Paul, S. Frautschy, W. Fenical, K. H. Nealson, J. Chem. Ecol. 1981, 7, 589.[77] S. Paik, G. H. Kim, J. S. Park, J. Ind. Eng. Chem. (Seoul, Repub. Korea) 2005,
11, 475.[78] K. Hu, J. M. Webster, Fems Microbiology Letters 2000, 189, 219.[79] I. Eleftherianos, S. Boundy, S. A. Joyce, S. Aslam, J. W. Marshall, R. J. Cox, T.
J. Simpson, D. J. Clarke, R. H. ffrench-Constant, S. E. Reynolds, Proc. Natl. Acad. Sci. U. S. A. 2007, 104, 2419.
[80] K. Ohguchi, T. Tanaka, T. Kido, K. Baba, M. Iinuma, K. Matsumoto, Y. Akao, Y. Nozawa, Biochem. Biophys. Res. Commun. 2003, 307, 861.
[81] T. L. Li, D. Spiteller, J. B. Spencer, ChemBioChem 2009, 10, 896.[82] T. A. Ciche, S. B. Bintrim, A. R. Horswill, J. C. Ensign, J. Bacteriol. 2001, 183,
3117.[83] S. L. MacKinnon, A. D. Cembella, I. W. Burton, N. Lewis, P. LeBlanc, J. A.
Walter, J. Org. Chem. 2006, 71, 8724.[84] R. Dumas, V. Biou, F. Halgand, R. Douce, R. G. Duggleby, Acc. Chem. Res.
2001, 34, 399.[85] T. Mahmud, S. C. Wenzel, E. Wan, K. W. Wen, H. B. Bode, N. Gaitatzis, R.
Muller, ChemBioChem 2005, 6, 322.[86] A. O. Brachmann, S. A. Joyce, H. Jenke-Kodama, G. Schwar, D. J. Clarke, H.
B. Bode, ChemBioChem 2007, 8, 1721.[87] S. A. Joyce, A. O. Brachmann, I. Glazer, L. Lango, G. Schwar, D. J. Clarke, H.
B. Bode, Angew. Chem. 2008, 47, 1942.[88] A. O. Brachmann, S. Forst, G. M. Furgani, A. Fodor, H. B. Bode, J. Nat. Prod.
2006, 69, 1830.[89] E. E. Kwan, S. G. Huang, Eur. J. Org. Chem. 2008.[90] S. L. Wang, X. Liu, M. C. Ruiz, V. Gopalsamuthiram, W. D. Wulff, Eur. J. Org.
Chem. 2006, 2006, 5219.[91] G. de la Herran, C. Murcia, A. G. Csaky, Org. Lett. 2005, 7, 5629.
181
[92] M. Lindstrom, E. Hedenstrom, S. Bouilly, K. Velonia, I. Smonou, Tetrahedron: Asymmetry 2005, 16, 1355.
[93] M. Gibson, M. Nur-e-alam, F. Lipata, M. A. Oliveira, J. Rohr, J. Am. Chem. Soc. 2005, 127, 17594.
[94] G. Grogan, G. A. Roberts, D. Bougioukou, N. J. Turner, S. L. Flitsch, J. Biol. Chem. 2001, 276, 12565.
[95] S. Rachid, O. Revermann, C. Dauth, U. Kazmaier, R. Muller, J. Biol. Chem., 285, 12482.
[96] S. Opitz, B. Schneider, Phytochemistry 2003, 62, 307.[97] M. H. M. Eppink, S. A. Boeren, J. Vervoort, W. J. H. VanBerkel, J. Bacteriol.
1997, 179, 6680.[98] M. E. Raggatt, T. J. Simpson, M. I. Chicarelli-Robinson, Chem. Commun. 1997,
2245.[99] B. Frank, S. C. Wenzel, H. B. Bode, M. Scharfe, H. Blocker, R. Muller, J. Mol.
Biol. 2007, 374, 24.[100] R. Kontnik, J. M. Crawford, J. Clardy, ACS Chem. Biol. 2010, 5, 659.[101] T. M. Harris, R. L. Carney, J. Am. Chem. Soc. 1967, 89, 6734.[102] A. J. Birch, D. W. Cameron, R. W. Rickards, J. Chem. Soc. 1960, 4395.[103] C. Privat, J. P. Telo, V. Bernardes-Genisson, A. Vieira, J. P. Souchard, F.
Nepveu, J. Agric. Food Chem. 2002, 50, 1213.[104] J. C. Roberts, J. A. Pincock, Can. J. Chem. 2003, 81, 709.[105] R. C. Ploetz, Phytopathology 2006, 96, 648.[106] C. L. Pereira, Y. H. Chen, F. E. McDonald, J. Am. Chem. Soc. 2009, 131, 6066.[107] A. E. Desjardins, R. H. Proctor, Int. J. Food Microbiol. 2007, 119, 47.[108] T. R. Hoye, J. I. Jimenez, W. T. Shier, J. Am. Chem. Soc. 1994, 116, 9409.[109] W. C. A. Gelderblom, K. Jaskiewicz, W. F. O. Marasas, P. G. Thiel, R. M.
Horak, R. Vleggaar, N. P. J. Kriek, Appl. Environ. Microbiol. 1988, 54, 1806.[110] C. Earl, S. Budiansky, Nature 1984, 308, 485.[111] S. Budiansky, Nature 1983, 304, 575.[112] T. Beardsley, Nature 1986, 320, 669.[113] H. B. Schiefer, Nature 1983, 304, 10.[114] M. Mardan, P. G. Kevan, Nature 1989, 341, 191.[115] S. Budiansky, Nature 1983, 303, 3.[116] J. Guarro, M. Nucci, T. Akiti, J. Gene, M. D. C. Barreiro, R. T. Goncalves, J.
Clin. Microbiol. 2000, 38, 419.[117] J. F. Leslie, B. A. Summerell, S. Bullock, F. J. Doe, Mycologia 2005, 97, 718.[118] C. W. Bacon, J. K. Porter, W. P. Norred, J. F. Leslie, Appl. Environ. Microbiol.
1996, 62, 4039.[119] H. X. Wang, T. B. Ng, Life Sci. 1999, 65, 849.[120] P. A. Plattner, W. Keller, A. Boller, Helv. Chim. Acta 1954, 37, 1379.[121] S. V. Pathre, W. B. Gleason, Y. W. Lee, C. J. Mirocha, Can. J. Chem. 1986, 64,
1308.[122] W. P. Xie, C. J. Mirocha, Y. C. Wen, R. J. Pawlosky, Appl. Environ. Microbiol.
1990, 56, 2946.[123] W. P. Xie, C. J. Mirocha, Y. C. Wen, W. J. Cheong, R. J. Pawlosky, J. Agric.
Food Chem. 1991, 39, 1757.[124] W. P. Xie, C. J. Mirocha, Y. C. Wen, J. Nat. Prod. (lloydia). 1995, 58, 124.[125] W. P. Xie, C. J. Mirocha, Y. C. Wen, J. Nat. Prod. 1991, 54, 1165.[126] W. P. Xie, C. J. Mirocha, R. J. Pawlosky, Y. C. Wen, X. G. Xu, Appl. Environ.
Microbiol. 1989, 55, 794.[127] W. D. Wu, P. E. Nelson, M. E. Cook, E. B. Smalley, Appl. Environ. Microbiol.
1990, 56, 2989.
182
[128] P. Krogh, D. H. Christensen, B. Hald, B. Harlou, C. Larsen, E. J. Pedersen, U. Thrane, Appl. Environ. Microbiol. 1989, 55, 3184.
[129] J. A. Dale, H. S. Mosher, J. Am. Chem. Soc. 1973, 95, 512.[130] J. A. Dale, D. L. Dull, H. S. Mosher, J. Org. Chem. 1969, 34, 2543.[131] J. M. Seco, E. Quinoa, R. Riguera, Tetrahedron: Asymmetry 2001, 12, 2915.[132] J. M. Seco, E. Quinoa, R. Riguera, Tetrahedron: Asymmetry 2000, 11, 2781.[133] M. Tsuda, Y. Toriyabe, T. Endo, J. Kobayashi, Chem. Pharm. Bull. 2003, 51,
448.[134] H. Fukui, Y. Fukushi, S. Tahara, Tetrahedron Lett. 2005, 46, 5089.[135] Y. M. Yu, J. S. Yang, C. Z. Peng, V. Caer, P. Z. Cong, Z. M. Zou, Y. Lu, S. Y.
Yang, Y. C. Gu, J. Nat. Prod. 2009, 72, 921.[136] C. C. Barker, J. Chem. Soc. 1953, 453.[137] N. Pemberton, J. S. Pinkner, S. Edvinsson, S. J. Hultgren, F. Almqvist,
Tetrahedron 2008, 64, 9368.[138] B. Lohri, Lohri B; Hoffmann La Roche & Co Ag F; Hoffmann La Roche Inc;
Hoffmann La Roche&Co Ag F, 2006.[139] A. C. Pinheiro, C. R. Kaiser, M. C. S. Lourenco, M. V. N. de Souzaa, S.
Wardell, J. L. Wardell, Synthesis and in vitro activity towards Mycobacterium tuberculosis of L-serinyl ester and amino derivatives of pyrazinoic acid 2007, 180.
[140] R. Geris, T. J. Simpson, Nat. Prod. Rep. 2009, 26, 1063.[141] H. G. Floss, P. J. Keller, J. M. Beale, J. Nat. Prod. 1986, 49, 957.[142] L. Stryer, Biochemistry, 3rd ed., Freeman, W. H., New York, 1988.[143] L. L. Grochowski, H. M. Xu, R. H. White, J. Bacteriol. 2005, 187, 7382.[144] O. E. Zolova, A. S. A. Mady, S. Garneau-Tsodikova, Biopolymers, 93, 777.[145] T. Yoshida, K. Katagiri, Biochemistry 1969, 8, 2645.[146] E. R. Radwanski, R. L. Last, Plant Cell 1995, 7, 921.[147] V. A. Higman, J. Flinders, M. Hiller, S. Jehle, S. Markovic, S. Fiedler, B. J. van
Rossum, H. Oschkinat, J. Biomol. NMR 2009, 44, 245.[148] E. Haug-Schifferdecker, D. Arican, R. Brueckner, L. Heide, J. Biol. Chem.
2010, 285, 16487.[149] V. Friese, A. Boos, H. J. Bauch, E. Leistner, Phytochemistry 1993, 32, 613.[150] N. J. McCorkindale, D. Hayes, G. A. Johnston, A. J. Clutterbuck,
Phytochemistry 1983, 22, 1026.[151] L. J. Wigley, P. G. Mantle, D. A. Perry, Phytochemistry 2006, 67, 561.[152] X. Q. Liu, L. Wang, N. Steffan, W. B. Yin, S. M. Li, ChemBioChem 2009, 10,
2325.[153] R. H. Jiao, S. Xu, J. Y. Liu, H. M. Ge, H. Ding, C. Xu, H. L. Zhu, R. X. Tan,
Org. Lett. 2006, 8, 5709.[154] T. Stein, B. Kluge, J. Vater, P. Franke, A. Otto, B. Wittmannliebold,
Biochemistry 1995, 34, 4633.[155] T. Yoshimura, N. Esaki, J. Biosci. Bioeng. 2003, 96, 103.[156] K. L. Eley, L. M. Halo, Z. Song, H. Powles, R. J. Cox, A. M. Bailey, C. M.
Lazarus, T. J. Simpson, ChemBioChem 2007, 8, 289.[157] M. R. Tepaske, J. B. Gloer, D. T. Wicklow, P. F. Dowd, Tetrahedron Lett. 1991,
32, 5687.[158] K. Schmidt, U. Riese, Z. Z. Li, M. Hamburger, J. Nat. Prod. 2003, 66, 378.[159] M. C. Moore, R. J. Cox, G. R. Duffin, D. O'Hagan, Tetrahedron 1998, 54, 9195.[160] C. K. Wat, A. G. McInnes, D. G. Smith, J. L. C. Wright, L. C. Vining, Can. J.
Chem. 1977, 55, 4090.[161] J. L. C. Wright, L. C. Vining, A. G. McInnes, D. G. Smith, J. A. Walter, Can. J.
Biochem. 1977, 55, 678.
183
[162] P. S. Steyn, P. L. Wessels, Tetrahedron Lett. 1978, 4707.[163] M. N. Heneghan, A. A. Yakasai, L. M. Halo, Z. Song, A. M. Bailey, T. J.
Simpson, R. J. Cox, C. M. Lazarus, ChemBioChem 2010, 11, 1508.[164] N. J. Talbot, Annu. Rev. Microbiol. 2003, 57, 177.[165] H. U. Bohnert, I. Fudal, W. Dioh, D. Tharreau, J. L. Notteghem, M. H. Lebrun,
Plant Cell 2004, 16, 2499.[166] J. Marui, A. Yoshimi, D. Hagiwara, Y. Fujii-Watanabe, K. Oda, H. Koike, K.
Tamano, T. Ishii, M. Sano, M. Machida, K. Abe, Appl. Microbiol. Biotechnol., 87, 1829.
[167] R. Y. Tsien, Annu. Rev. Biochem. 1998, 67, 509.[168] F. G. Prendergast, K. G. Mann, Biochemistry 1978, 17, 3448.[169] G. J. Phillips, FEMS Microbiol. Lett. 2001, 204, 9.[170] C. M. H. Watanabe, C. A. Townsend, J. Am. Chem. Soc. 1998, 120, 6231.[171] R. J. Cox, in Polyketides: biosynthesis, biological activity, and genetic
engineering (Eds.: A. M. Rimando, S. R. Baerson), Washington DC, San Diego, Calif., 2005, pp. 33.
[172] I. Fujii, N. Yoshida, S. Shimomaki, H. Oikawa, Y. Ebizuka, Chem. Biol. 2005, 12, 1301.
[173] P. W. Perrin, G. H. N. Towers, Phytochemistry 1973, 12, 589.[174] R. L. Edwards, D. V. Wilson, D. G. Lewis, J. Chem. Soc. 1961, 4995.[175] S. A. Hewlins, J. A. Murphy, J. Lin, D. E. Hibbs, M. B. Hursthouse, J. Chem.
Soc., Perkin Trans. 1 1997, 1559.