j. lauritzen a/s 2013 h1 updatestatic.j-l.com/imce/investorrelations/jl_-_h1_2013_update_(15... ·...
TRANSCRIPT

www.j-l.com | Oceans of know-how
J. Lauritzen A/S
2013 H1 update
August 2013

Disclaimer
• This presentation contains forward-looking statements concerning J. Lauritzen A/S (“J. Lauritzen”, “JL” or the “Group”) and its financial condition, results of
operations and business. All statements other than statements of historical fact are, or may be deemed to be, forward-looking statements. Forward-looking
statements are statements of future expectations that are based on management’s current expectations and assumptions and involve known and unknown
risks and uncertainties that could cause actual results, performance or events to differ materially from those expressed or implied in these statements.
• Forward-looking statements include, among other things, statements concerning J. Lauritzen’s potential exposure to market risks and statements expressing
management’s expectations, beliefs, estimates, forecasts, projections and assumptions. There are numerous factors that could affect J. Lauritzen A/S’ future
operations and could cause J. Lauritzen A/S’ results to differ materially from those expressed in the forward-looking statements included in this presentation.
• All forward-looking statements contained in this presentation are expressly qualified by the cautionary statements contained or referenced to in this statement.
Undue reliance should not be placed on forward-looking statements.
• Each forward-looking statement speaks only as of the date of this presentation. J. Lauritzen does not undertake any obligation to publicly update or revise
any forward-looking statement as a result of new information or future events other than required by applicable law. In light of these risks, results could differ
materially from those stated, implied or inferred from the forward-looking statements contained in this presentation.
• Some of the statistical and graphical information contained in the presentation is supplied from the Clarkson Research Services Limited (“CRSL”) database
and other sources. CRSL has advised that (i) some information in CRSL’s database is derived from estimates or subjective judgments, (ii) the information in
the databases of other maritime data collection agencies may differ from the information in CRSL’s database, (iii) whilst CRSL has taken reasonable care in
the compilation of the statistical and graphical information and believes it to be accurate and correct, data compilation is subject to limited audit and validation
procedures and may accordingly contain errors, (iv) CRSL, its agents, officers and employees cannot accept liability for any loss suffered in consequence of
reliance on such information or in any other manner, and (v) the provision of such information does not obviate any need to make appropriate further
enquiries. Any use of such data and graphical information appear with reference to Clarkson Research Services Limited
• While the information in the presentation is believed to be accurate, no representation or warranty, express or implied, is or will be made in relation to the
accuracy or completeness of this presentation or any other written or oral information transmitted or made available to any person or its advisors in connection
with any investigation of the Group and no responsibility or liability is or will be accepted by the Group or any of their respective affiliates and representatives.
In particular, no representation or warranty, express or implied, is or will be given as to the achievement or reasonableness of any statements, estimates and
projections with respect to the anticipated future performance of the Group and the market for the Group’s products and services.
August 2013 2

www.j-l.com | Oceans of know-how
AGENDA
• First half of 2013
• Outlook for FY 2013
• Strategy update
• Financing
• Summary
3 August 2013

Impairments
• STX Pan Ocean default (ref. announcement no. 4) and subsequent untimely redelivery of two Capesize vessels on long-term
charter will affect earnings going forward write-down of vessels
• In general, vessel values reported by brokers at end 2013-Q2 confirm that values have stabilized but not within the shuttle tanker
segment write-down of older unit
• Continuously ordering of fuel efficient bulk carriers will affect the longer term earnings potential for vessels of older designs
write-down of fleet
• Sale of selected assets to trim balance sheet write-down of product tankers
August 2013 4
• All covenants satisfied
• Accountability is key for JL
Strategic decision to trim balance sheet and reduce leverage:
• Ensure continued ability to fulfil commitments
• Ensure ability to repay 2015-maturing bond without issuing new bonds and without asking owner for new equity
• Gradual exit of MR product tankers
• Will strengthen cash position
• Provides basis for future investments
Other key messages Key financials
• 2013 H1 EBITDA of USD 25.7m in line with expectations
• Solvency ratio 38% at end June 2013
• Cash available USD 179m at end June 2013
• Vessel values reported by brokers in general stabilized
• LTV reduced to 72% at end June 2013
• Impairment of USD (207)m
• 2013 FY EBITDA expectation reduced to USD 40m-60m
• Due to STX default and continued uncertainty as to
the recovery in dry bulk
First half of 2013: EBITDA as expected; Net result affected by write-downs Book value of vessels impaired primarily due to STX Pan Ocean default and strategic decisions
5
Income statement Comments
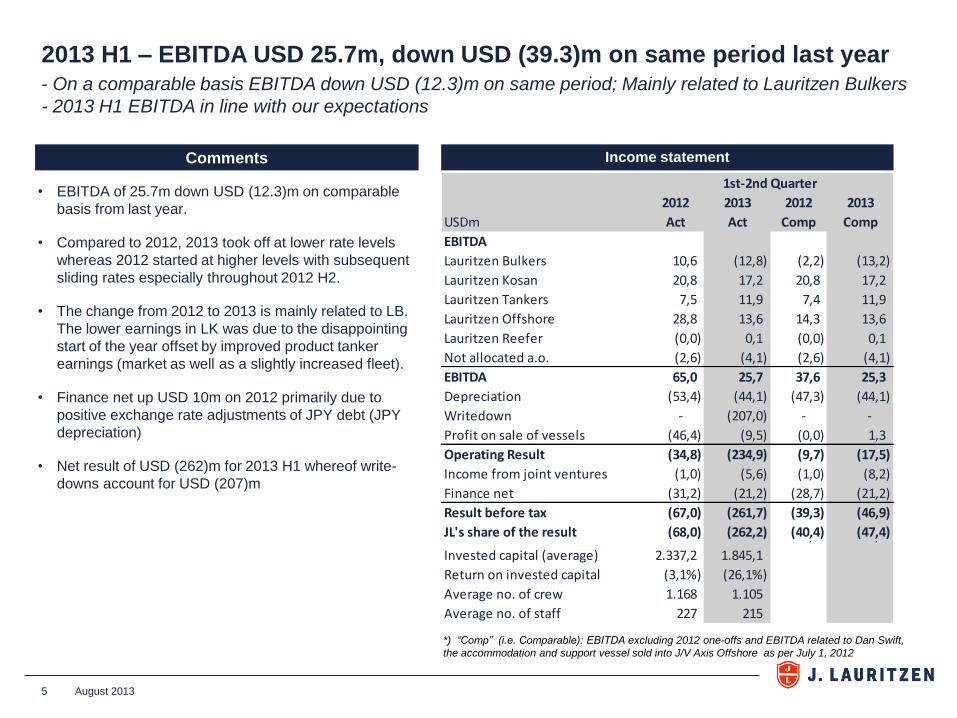
• EBITDA of 25.7m down USD (12.3)m on comparable
basis from last year.
• Compared to 2012, 2013 took off at lower rate levels
whereas 2012 started at higher levels with subsequent
sliding rates especially throughout 2012 H2.
• The change from 2012 to 2013 is mainly related to LB.
The lower earnings in LK was due to the disappointing
start of the year offset by improved product tanker
earnings (market as well as a slightly increased fleet).
• Finance net up USD 10m on 2012 primarily due to
positive exchange rate adjustments of JPY debt (JPY
depreciation)
• Net result of USD (262)m for 2013 H1 whereof write-
downs account for USD (207)m
August 2013
2013 H1 – EBITDA USD 25.7m, down USD (39.3)m on same period last year - On a comparable basis EBITDA down USD (12.3)m on same period; Mainly related to Lauritzen Bulkers
- 2013 H1 EBITDA in line with our expectations
2012 2013 2012 2013
USDm Act Act Comp Comp
EBITDA
Lauritzen Bulkers 10,6 (12,8) (2,2) (13,2)
Lauritzen Kosan 20,8 17,2 20,8 17,2
Lauritzen Tankers 7,5 11,9 7,4 11,9
Lauritzen Offshore 28,8 13,6 14,3 13,6
Lauritzen Reefer (0,0) 0,1 (0,0) 0,1
Not allocated a.o. (2,6) (4,1) (2,6) (4,1)
EBITDA 65,0 25,7 37,6 25,3
Depreciation (53,4) (44,1) (47,3) (44,1)
Writedown - (207,0) - -
Profit on sale of vessels (46,4) (9,5) (0,0) 1,3
Operating Result (34,8) (234,9) (9,7) (17,5)
Income from joint ventures (1,0) (5,6) (1,0) (8,2)
Finance net (31,2) (21,2) (28,7) (21,2)
Result before tax (67,0) (261,7) (39,3) (46,9)
JL's share of the result (68,0) (262,2) (40,4) (47,4)0,0 0,0
Invested capital (average) 2.337,2 1.845,1
Return on invested capital (3,1%) (26,1%)
Average no. of crew 1.168 1.105
Average no. of staff 227 215
1st-2nd Quarter
*) “Comp” (i.e. Comparable): EBITDA excluding 2012 one-offs and EBITDA related to Dan Swift,
the accommodation and support vessel sold into J/V Axis Offshore as per July 1, 2012
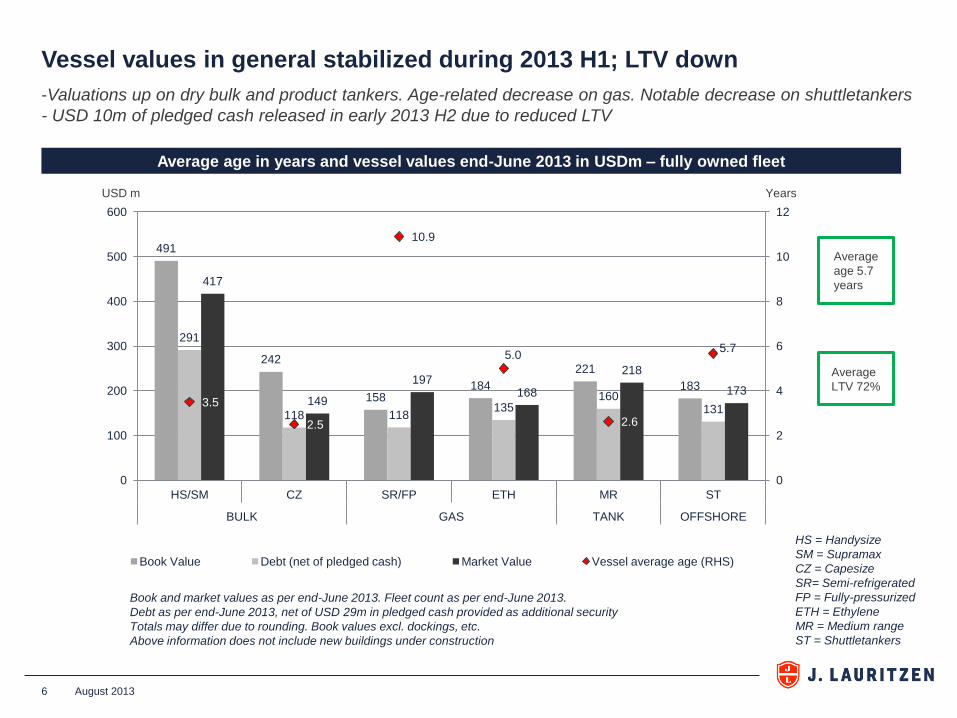
Vessel values in general stabilized during 2013 H1; LTV down
August 2013 6
-Valuations up on dry bulk and product tankers. Age-related decrease on gas. Notable decrease on shuttletankers
- USD 10m of pledged cash released in early 2013 H2 due to reduced LTV
Average age in years and vessel values end-June 2013 in USDm – fully owned fleet
491
242
158 184
221
183
291
118 118 135
160 131
417
149
197 168
218
173 3.5
2.5
10.9
5.0
2.6
5.7
0
2
4
6
8
10
12
0
100
200
300
400
500
600
HS/SM CZ SR/FP ETH MR ST
BULK GAS TANK OFFSHORE
Book Value Debt (net of pledged cash) Market Value Vessel average age (RHS)
USD m Years
Book and market values as per end-June 2013. Fleet count as per end-June 2013.
Debt as per end-June 2013, net of USD 29m in pledged cash provided as additional security
Totals may differ due to rounding. Book values excl. dockings, etc.
Above information does not include new buildings under construction
HS = Handysize
SM = Supramax
CZ = Capesize
SR= Semi-refrigerated
FP = Fully-pressurized
ETH = Ethylene
MR = Medium range
ST = Shuttletankers
Average
age 5.7
years
Average
LTV 72%

Balance sheet
7
Key messages
August 2013
2013 H1 - Total assets USD 2.0bn
- A USD 549m decrease since 2012 H1caused by sale of assets and write-downs
• Solvency at 38%
• ROIC of (26.1)% impacted negatively by write-downs
• Capital expenditures on newbuildings amounted to
USD 64m • Remaining CAPEX on fully-owned new buildings USD
43m
• Deliveries in 2013 H1: • One MR product tanker
• Sales in 2013 H1: • 50% part-ownership in a MR product tanker
• One fully-owned S/R gas carrier
• One bulk carrier for delivery in Q3 sold and leased back at
delivery
• Outstanding deliveries: • Two MR product tankers (in 2013 Q3)
• One handysize bulk carrier (is sold and leased back ref.
above, delivery 2013 Q4)
• Financing (USD 70m) secured for remaining fully-owned
deliveries

2013 H1 - Cash flow from operations USD (10)m
Cash flow
August 2013 8
Key messages
• Cash flow from operations down USD 13.4m
• Lower EBITDA including the effect of AXIS J/V (as from
July 2012) offset by improved working capital
• Cash flow from investments down USD 129.6m
• CAPEX for new building programme tailing off
(3 vessels, all for delivery in 2013 H2)
• Release of cash pledged as security
• Cash flow from financing down USD 104.9m
• Financing disbursed after delivery of new buildings
• One vessel delivered in 2013 H1 (seven in 2012 H1)
• Committed financing secured for remaining deliveries
• Cash and unused credit facilities amounts to USD 179m,
down USD (89)m from USD 267m at 2012 YE
• Does not include DKK 100m overdraft facilities
• Does not include USD 29m cash pledged as additional
security in loan facilities at end June 2013
• Approx USD 10m of pledged cash released in early 2013
H2 due to reduced LTV
- Free cash at end June 2013 USD 179m
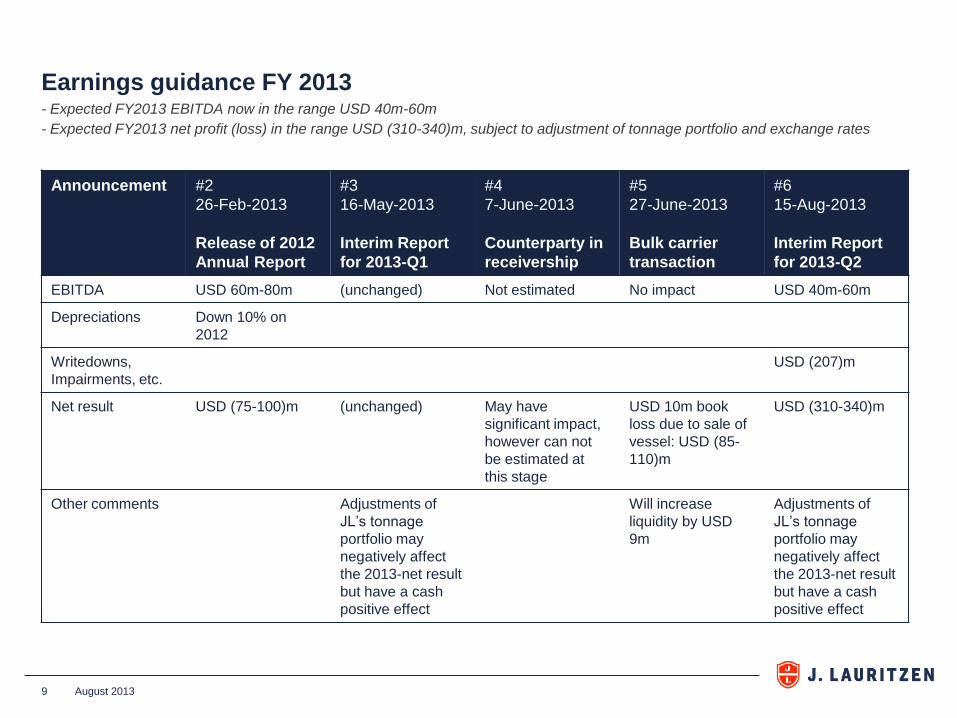
Earnings guidance FY 2013 - Expected FY2013 EBITDA now in the range USD 40m-60m
- Expected FY2013 net profit (loss) in the range USD (310-340)m, subject to adjustment of tonnage portfolio and exchange rates
9 August 2013
Announcement #2
26-Feb-2013
Release of 2012
Annual Report
#3
16-May-2013
Interim Report
for 2013-Q1
#4
7-June-2013
Counterparty in
receivership
#5
27-June-2013
Bulk carrier
transaction
#6
15-Aug-2013
Interim Report
for 2013-Q2
EBITDA USD 60m-80m (unchanged) Not estimated No impact USD 40m-60m
Depreciations Down 10% on
2012
Writedowns,
Impairments, etc.
USD (207)m
Net result USD (75-100)m (unchanged) May have
significant impact,
however can not
be estimated at
this stage
USD 10m book
loss due to sale of
vessel: USD (85-
110)m
USD (310-340)m
Other comments Adjustments of
JL’s tonnage
portfolio may
negatively affect
the 2013-net result
but have a cash
positive effect
Will increase
liquidity by USD
9m
Adjustments of
JL’s tonnage
portfolio may
negatively affect
the 2013-net result
but have a cash
positive effect
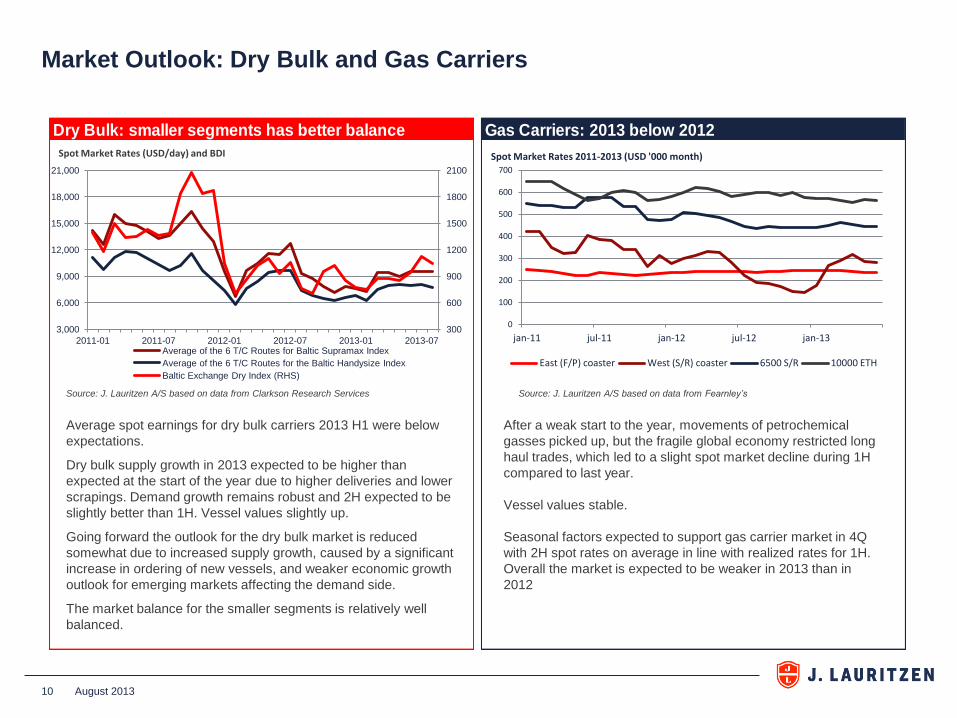
Dry Bulk: smaller segments has better balance Gas Carriers: 2013 below 2012
Average spot earnings for dry bulk carriers 2013 H1 were below
expectations.
Dry bulk supply growth in 2013 expected to be higher than
expected at the start of the year due to higher deliveries and lower
scrapings. Demand growth remains robust and 2H expected to be
slightly better than 1H. Vessel values slightly up.
Going forward the outlook for the dry bulk market is reduced
somewhat due to increased supply growth, caused by a significant
increase in ordering of new vessels, and weaker economic growth
outlook for emerging markets affecting the demand side.
The market balance for the smaller segments is relatively well
balanced.
After a weak start to the year, movements of petrochemical
gasses picked up, but the fragile global economy restricted long
haul trades, which led to a slight spot market decline during 1H
compared to last year.
Vessel values stable.
Seasonal factors expected to support gas carrier market in 4Q
with 2H spot rates on average in line with realized rates for 1H.
Overall the market is expected to be weaker in 2013 than in
2012
Source: J. Lauritzen A/S based on data from Clarkson Research Services Source: J. Lauritzen A/S based on data from Fearnley’s
10
Market Outlook: Dry Bulk and Gas Carriers
August 2013
300
600
900
1200
1500
1800
2100
3,000
6,000
9,000
12,000
15,000
18,000
21,000
2011-01 2011-07 2012-01 2012-07 2013-01 2013-07 Average of the 6 T/C Routes for Baltic Supramax Index
Average of the 6 T/C Routes for the Baltic Handysize Index
Baltic Exchange Dry Index (RHS)
Spot Market Rates (USD/day) and BDI
0
100
200
300
400
500
600
700
jan-11 jul-11 jan-12 jul-12 jan-13
Spot Market Rates 2011-2013 (USD '000 month)
East (F/P) coaster West (S/R) coaster 6500 S/R 10000 ETH
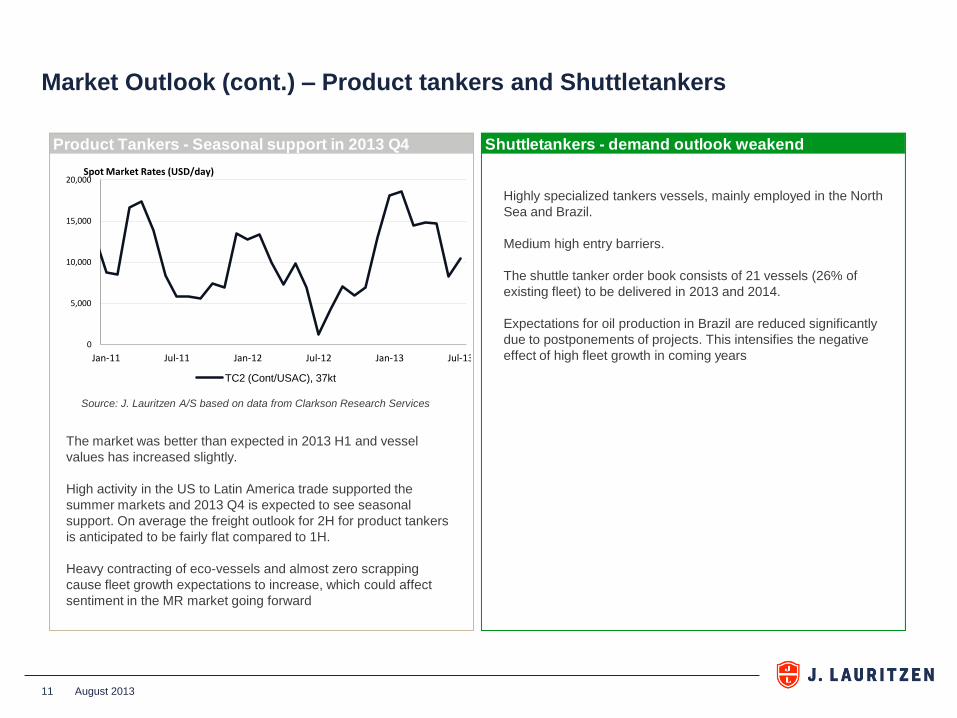
Product Tankers - Seasonal support in 2013 Q4 Shuttletankers - demand outlook weakend
11
The market was better than expected in 2013 H1 and vessel
values has increased slightly.
High activity in the US to Latin America trade supported the
summer markets and 2013 Q4 is expected to see seasonal
support. On average the freight outlook for 2H for product tankers
is anticipated to be fairly flat compared to 1H.
Heavy contracting of eco-vessels and almost zero scrapping
cause fleet growth expectations to increase, which could affect
sentiment in the MR market going forward
Highly specialized tankers vessels, mainly employed in the North
Sea and Brazil.
Medium high entry barriers.
The shuttle tanker order book consists of 21 vessels (26% of
existing fleet) to be delivered in 2013 and 2014.
Expectations for oil production in Brazil are reduced significantly
due to postponements of projects. This intensifies the negative
effect of high fleet growth in coming years
Source: J. Lauritzen A/S based on data from Clarkson Research Services
Market Outlook (cont.) – Product tankers and Shuttletankers
August 2013
0
5,000
10,000
15,000
20,000
Jan-11 Jul-11 Jan-12 Jul-12 Jan-13 Jul-13
Spot Market Rates (USD/day)
TC2 (Cont/USAC), 37kt
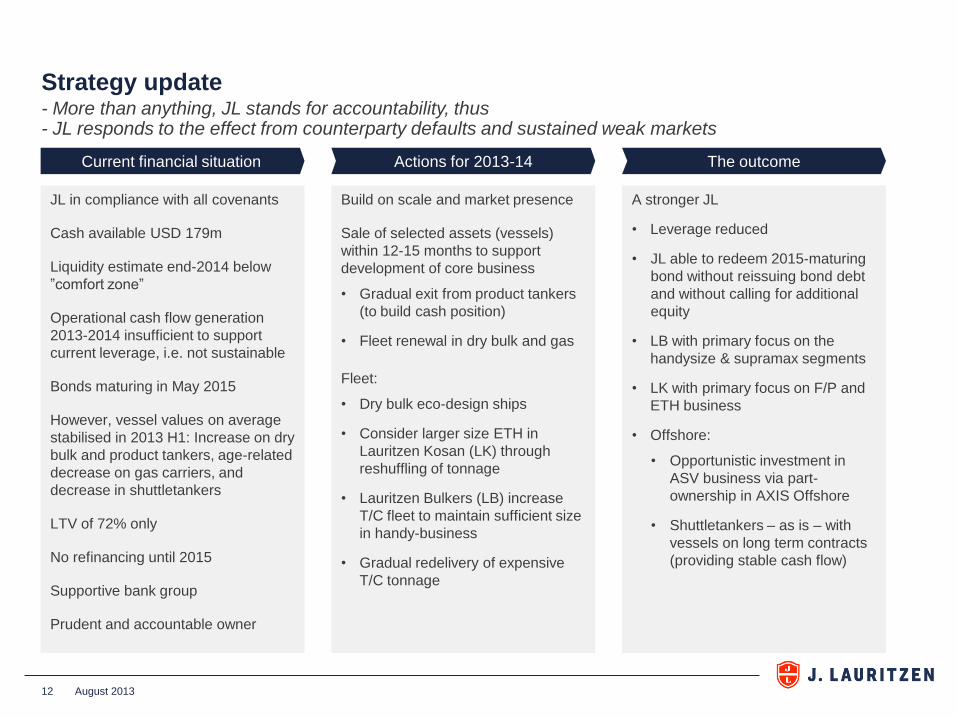
Strategy update - More than anything, JL stands for accountability, thus - JL responds to the effect from counterparty defaults and sustained weak markets
August 2013 12
Current financial situation
JL in compliance with all covenants
Cash available USD 179m
Liquidity estimate end-2014 below
”comfort zone”
Operational cash flow generation
2013-2014 insufficient to support
current leverage, i.e. not sustainable
Bonds maturing in May 2015
However, vessel values on average
stabilised in 2013 H1: Increase on dry
bulk and product tankers, age-related
decrease on gas carriers, and
decrease in shuttletankers
LTV of 72% only
No refinancing until 2015
Supportive bank group
Prudent and accountable owner
Actions for 2013-14
Build on scale and market presence
Sale of selected assets (vessels)
within 12-15 months to support
development of core business
• Gradual exit from product tankers
(to build cash position)
• Fleet renewal in dry bulk and gas
Fleet:
• Dry bulk eco-design ships
• Consider larger size ETH in
Lauritzen Kosan (LK) through
reshuffling of tonnage
• Lauritzen Bulkers (LB) increase
T/C fleet to maintain sufficient size
in handy-business
• Gradual redelivery of expensive
T/C tonnage
The outcome
A stronger JL
• Leverage reduced
• JL able to redeem 2015-maturing
bond without reissuing bond debt
and without calling for additional
equity
• LB with primary focus on the
handysize & supramax segments
• LK with primary focus on F/P and
ETH business
• Offshore:
• Opportunistic investment in
ASV business via part-
ownership in AXIS Offshore
• Shuttletankers – as is – with
vessels on long term contracts
(providing stable cash flow)
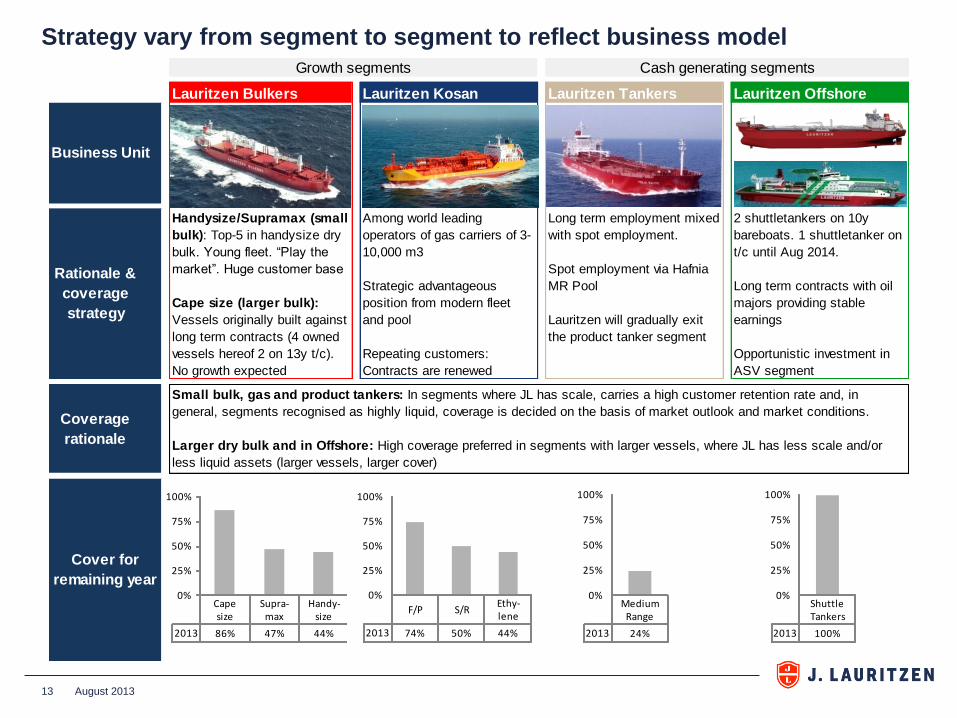
Strategy vary from segment to segment to reflect business model
August 2013 13
Lauritzen Bulkers Lauritzen Kosan Lauritzen Tankers Lauritzen Offshore
Growth segments Cash generating segments
Business Unit
Rationale &
coverage
strategy
Handysize/Supramax (small
bulk): Top-5 in handysize dry
bulk. Young fleet. “Play the
market”. Huge customer base
Cape size (larger bulk):
Vessels originally built against
long term contracts (4 owned
vessels hereof 2 on 13y t/c).
No growth expected
Among world leading
operators of gas carriers of 3-
10,000 m3
Strategic advantageous
position from modern fleet
and pool
Repeating customers:
Contracts are renewed
Long term employment mixed
with spot employment.
Spot employment via Hafnia
MR Pool
Lauritzen will gradually exit
the product tanker segment
2 shuttletankers on 10y
bareboats. 1 shuttletanker on
t/c until Aug 2014.
Long term contracts with oil
majors providing stable
earnings
Opportunistic investment in
ASV segment
Coverage
rationale
Small bulk, gas and product tankers: In segments where JL has scale, carries a high customer retention rate and, in
general, segments recognised as highly liquid, coverage is decided on the basis of market outlook and market conditions.
Larger dry bulk and in Offshore: High coverage preferred in segments with larger vessels, where JL has less scale and/or
less liquid assets (larger vessels, larger cover)
Cover for
remaining year
Cape size
Supra-max
Handy-size
2013 86% 47% 44%
0%
25%
50%
75%
100%
F/P S/REthy-lene
2013 74% 50% 44%
0%
25%
50%
75%
100%
Medium Range
2013 24%
0%
25%
50%
75%
100%
Shuttle Tankers
2013 100%
0%
25%
50%
75%
100%
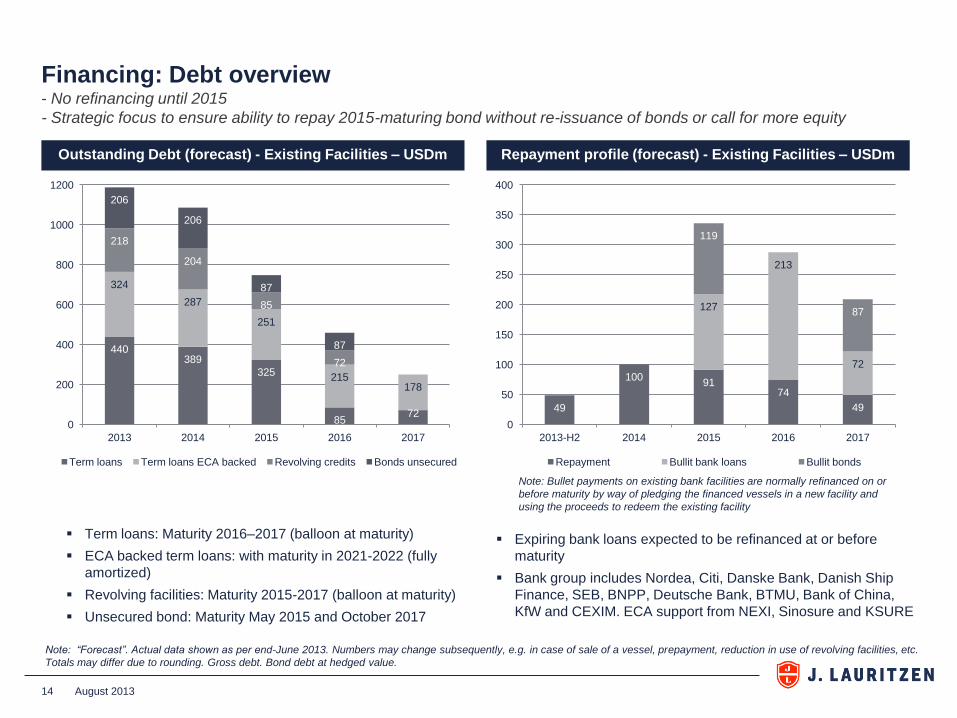
Financing: Debt overview - No refinancing until 2015
- Strategic focus to ensure ability to repay 2015-maturing bond without re-issuance of bonds or call for more equity
August 2013 14
Outstanding Debt (forecast) - Existing Facilities – USDm Repayment profile (forecast) - Existing Facilities – USDm
Expiring bank loans expected to be refinanced at or before
maturity
Bank group includes Nordea, Citi, Danske Bank, Danish Ship
Finance, SEB, BNPP, Deutsche Bank, BTMU, Bank of China,
KfW and CEXIM. ECA support from NEXI, Sinosure and KSURE
Term loans: Maturity 2016–2017 (balloon at maturity)
ECA backed term loans: with maturity in 2021-2022 (fully
amortized)
Revolving facilities: Maturity 2015-2017 (balloon at maturity)
Unsecured bond: Maturity May 2015 and October 2017
Note: Bullet payments on existing bank facilities are normally refinanced on or
before maturity by way of pledging the financed vessels in a new facility and
using the proceeds to redeem the existing facility
Note: “Forecast”. Actual data shown as per end-June 2013. Numbers may change subsequently, e.g. in case of sale of a vessel, prepayment, reduction in use of revolving facilities, etc.
Totals may differ due to rounding. Gross debt. Bond debt at hedged value.
49
100 91
74
49
127
213
72
119
87
0
50
100
150
200
250
300
350
400
2013-H2 2014 2015 2016 2017
Repayment Bullit bank loans Bullit bonds
440 389
325
85 72
324
287
251
215 178
218
204
85
72
206
206
87
87
0
200
400
600
800
1000
1200
2013 2014 2015 2016 2017
Term loans Term loans ECA backed Revolving credits Bonds unsecured
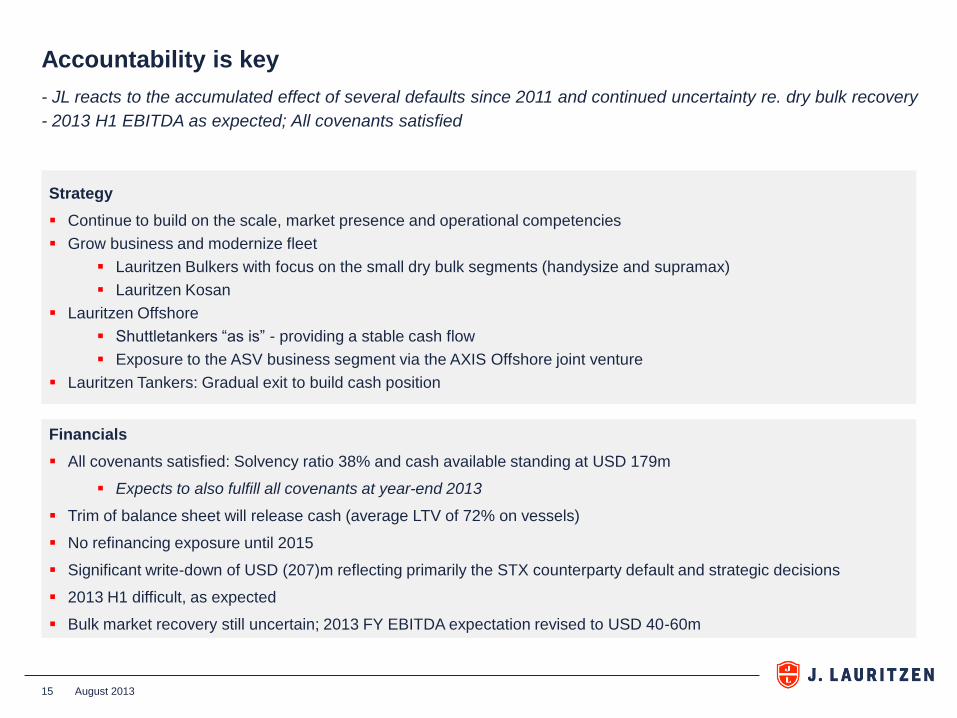
Accountability is key
August 2013 15
Financials
All covenants satisfied: Solvency ratio 38% and cash available standing at USD 179m
Expects to also fulfill all covenants at year-end 2013
Trim of balance sheet will release cash (average LTV of 72% on vessels)
No refinancing exposure until 2015
Significant write-down of USD (207)m reflecting primarily the STX counterparty default and strategic decisions
2013 H1 difficult, as expected
Bulk market recovery still uncertain; 2013 FY EBITDA expectation revised to USD 40-60m
Strategy
Continue to build on the scale, market presence and operational competencies
Grow business and modernize fleet
Lauritzen Bulkers with focus on the small dry bulk segments (handysize and supramax)
Lauritzen Kosan
Lauritzen Offshore
Shuttletankers “as is” - providing a stable cash flow
Exposure to the ASV business segment via the AXIS Offshore joint venture
Lauritzen Tankers: Gradual exit to build cash position
- JL reacts to the accumulated effect of several defaults since 2011 and continued uncertainty re. dry bulk recovery
- 2013 H1 EBITDA as expected; All covenants satisfied
www.j-l.com | Oceans of know-how
Appendix • Fleet overview
• Management
• Group Structure
• Ownership
• Lauritzen Fonden
• Glossary
• Contact details
• Vessel list
August 2013 16
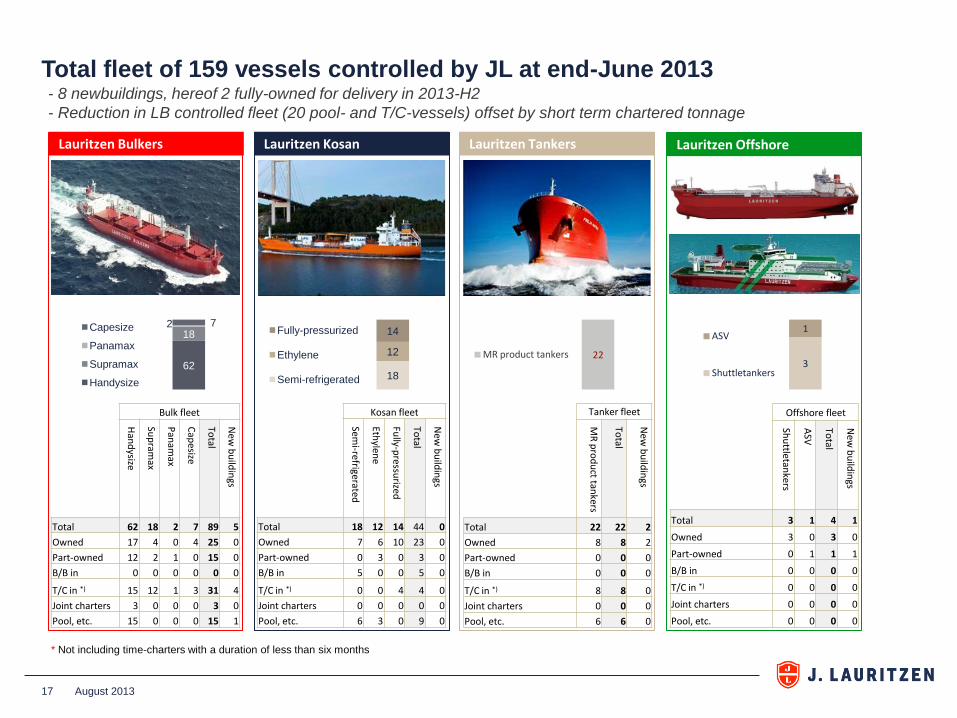
Total fleet of 159 vessels controlled by JL at end-June 2013
17
Lauritzen Bulkers Lauritzen Kosan Lauritzen Tankers Lauritzen Offshore
* Not including time-charters with a duration of less than six months
- 8 newbuildings, hereof 2 fully-owned for delivery in 2013-H2
- Reduction in LB controlled fleet (20 pool- and T/C-vessels) offset by short term chartered tonnage
Bulk fleet
Han
dysize
Sup
ramax
Pan
amax
Cap
esize
Total
New
bu
ildin
gs
Total 62 18 2 7 89 5
Owned 17 4 0 4 25 0
Part-owned 12 2 1 0 15 0
B/B in 0 0 0 0 0 0
T/C in *) 15 12 1 3 31 4
Joint charters 3 0 0 0 3 0
Pool, etc. 15 0 0 0 15 1
Kosan fleet
Semi-refrigerated
Ethylen
e
Fully-p
ressurized
Total
New
bu
ildin
gs Total 18 12 14 44 0
Owned 7 6 10 23 0
Part-owned 0 3 0 3 0
B/B in 5 0 0 5 0
T/C in *) 0 0 4 4 0
Joint charters 0 0 0 0 0
Pool, etc. 6 3 0 9 0
Offshore fleet
Shu
ttletankers
ASV
Total
New
bu
ildin
gs
Total 3 1 4 1
Owned 3 0 3 0
Part-owned 0 1 1 1
B/B in 0 0 0 0
T/C in *) 0 0 0 0
Joint charters 0 0 0 0
Pool, etc. 0 0 0 0
Tanker fleet
MR
pro
du
ct tankers
Total
New
bu
ildin
gs
Total 22 22 2
Owned 8 8 2
Part-owned 0 0 0
B/B in 0 0 0
T/C in *) 8 8 0
Joint charters 0 0 0
Pool, etc. 6 6 0
62
18 2 7 Capesize
Panamax
Supramax
Handysize 18
12
14 Fully-pressurized
Ethylene
Semi-refrigerated
22 MR product tankers 3
1 ASV
Shuttletankers
August 2013
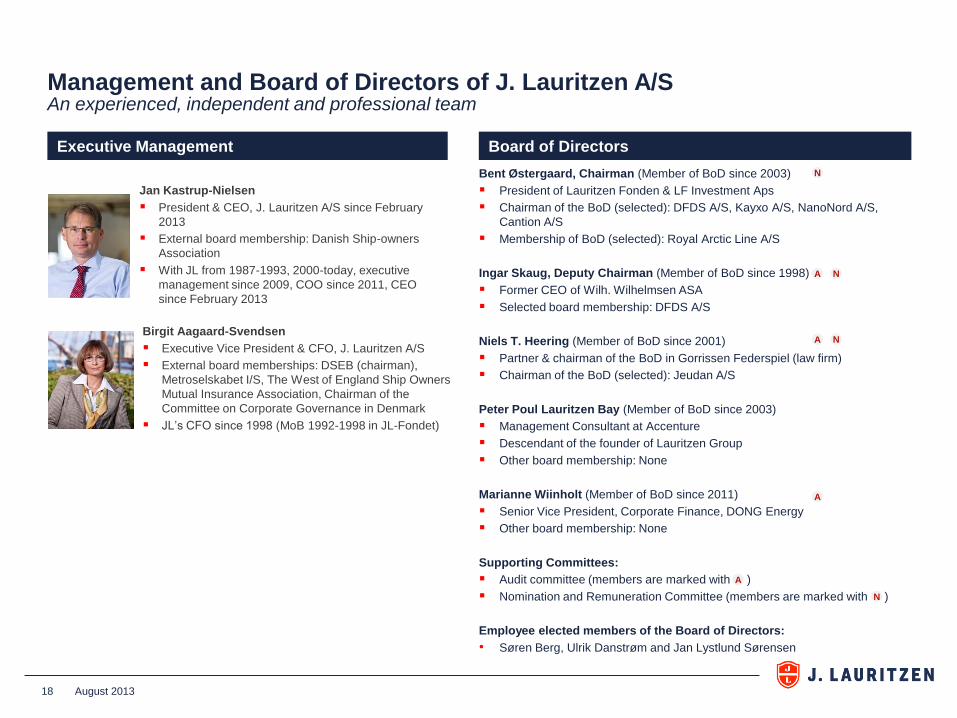
Bent Østergaard, Chairman (Member of BoD since 2003)
President of Lauritzen Fonden & LF Investment Aps
Chairman of the BoD (selected): DFDS A/S, Kayxo A/S, NanoNord A/S,
Cantion A/S
Membership of BoD (selected): Royal Arctic Line A/S
Ingar Skaug, Deputy Chairman (Member of BoD since 1998)
Former CEO of Wilh. Wilhelmsen ASA
Selected board membership: DFDS A/S
Niels T. Heering (Member of BoD since 2001)
Partner & chairman of the BoD in Gorrissen Federspiel (law firm)
Chairman of the BoD (selected): Jeudan A/S
Peter Poul Lauritzen Bay (Member of BoD since 2003)
Management Consultant at Accenture
Descendant of the founder of Lauritzen Group
Other board membership: None
Marianne Wiinholt (Member of BoD since 2011)
Senior Vice President, Corporate Finance, DONG Energy
Other board membership: None
Supporting Committees:
Audit committee (members are marked with )
Nomination and Remuneration Committee (members are marked with )
Employee elected members of the Board of Directors:
• Søren Berg, Ulrik Danstrøm and Jan Lystlund Sørensen
18
Executive Management Board of Directors
Birgit Aagaard-Svendsen
Executive Vice President & CFO, J. Lauritzen A/S
External board memberships: DSEB (chairman),
Metroselskabet I/S, The West of England Ship Owners
Mutual Insurance Association, Chairman of the
Committee on Corporate Governance in Denmark
JL’s CFO since 1998 (MoB 1992-1998 in JL-Fondet)
Jan Kastrup-Nielsen
President & CEO, J. Lauritzen A/S since February
2013
External board membership: Danish Ship-owners
Association
With JL from 1987-1993, 2000-today, executive
management since 2009, COO since 2011, CEO
since February 2013
N
N A
N A
A
A
N
August 2013
Management and Board of Directors of J. Lauritzen A/S An experienced, independent and professional team
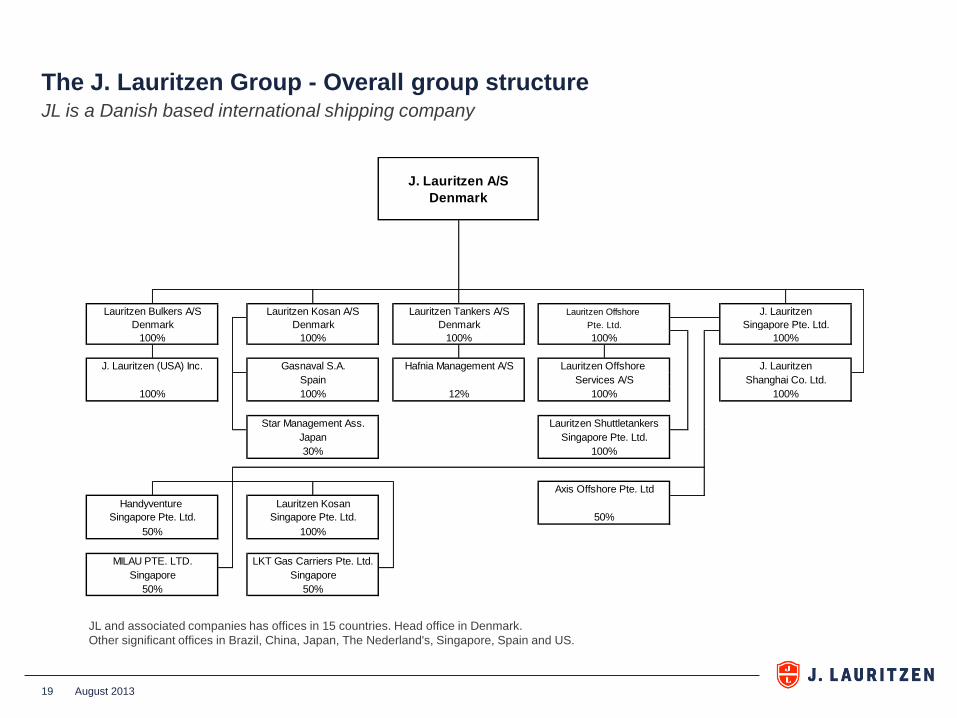
The J. Lauritzen Group - Overall group structure
August 2013 19
J. Lauritzen
Singapore Pte. Ltd.
100%
Axis Offshore Pte. Ltd
100%
100%
J. Lauritzen
Shanghai Co. Ltd.
100%100%
Services A/S
Singapore Pte. Ltd.
Lauritzen Shuttletankers
50%
Handyventure Lauritzen Kosan
Singapore Pte. Ltd. Singapore Pte. Ltd.
50% 100%
Lauritzen Bulkers A/S Lauritzen Tankers A/S
Denmark Denmark
Gasnaval S.A.
100% 100%
J. Lauritzen A/S
Denmark
Lauritzen Kosan A/S
Lauritzen Offshore
Denmark
100%
Lauritzen Offshore
Pte. Ltd.
50%
J. Lauritzen (USA) Inc. Hafnia Management A/S
LKT Gas Carriers Pte. Ltd.
Singapore
100%
Star Management Ass.
100% 12%
Japan
30%
MILAU PTE. LTD.
Singapore
50%
Spain
JL and associated companies has offices in 15 countries. Head office in Denmark.
Other significant offices in Brazil, China, Japan, The Nederland's, Singapore, Spain and US.
JL is a Danish based international shipping company
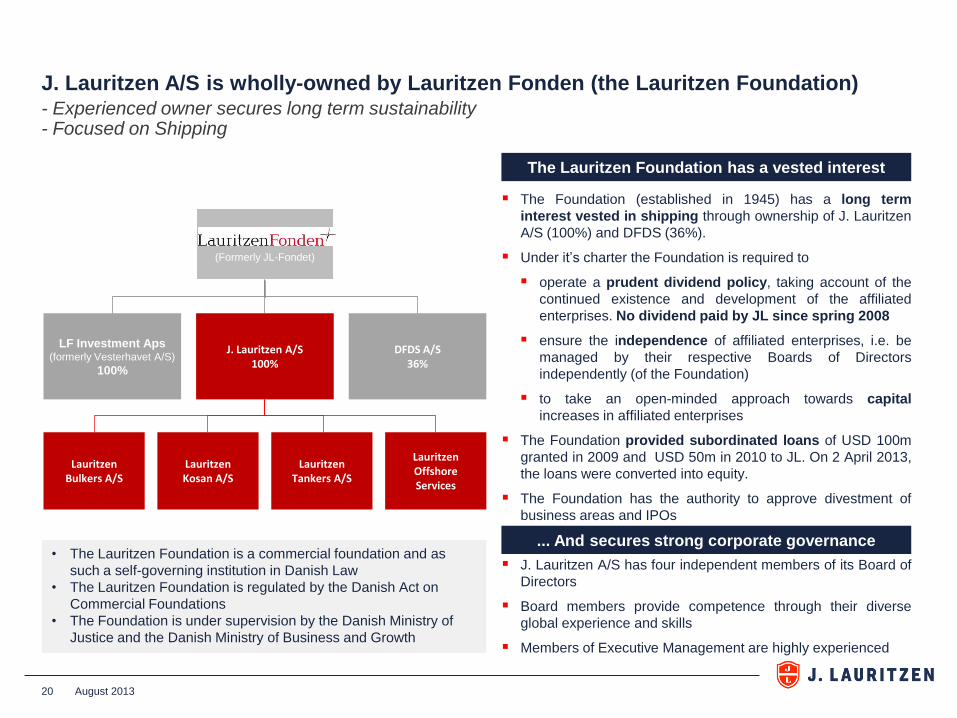
J. Lauritzen A/S is wholly-owned by Lauritzen Fonden (the Lauritzen Foundation) - Experienced owner secures long term sustainability - Focused on Shipping
20
LF Investment Aps (formerly Vesterhavet A/S)
100%
J. Lauritzen A/S 100%
DFDS A/S 36%
(Formerly JL-Fondet)
Lauritzen Bulkers A/S
Lauritzen Kosan A/S
Lauritzen Tankers A/S
Lauritzen Offshore Services
The Foundation (established in 1945) has a long term
interest vested in shipping through ownership of J. Lauritzen
A/S (100%) and DFDS (36%).
Under it’s charter the Foundation is required to
operate a prudent dividend policy, taking account of the
continued existence and development of the affiliated
enterprises. No dividend paid by JL since spring 2008
ensure the independence of affiliated enterprises, i.e. be
managed by their respective Boards of Directors
independently (of the Foundation)
to take an open-minded approach towards capital
increases in affiliated enterprises
The Foundation provided subordinated loans of USD 100m
granted in 2009 and USD 50m in 2010 to JL. On 2 April 2013,
the loans were converted into equity.
The Foundation has the authority to approve divestment of
business areas and IPOs
J. Lauritzen A/S has four independent members of its Board of
Directors
Board members provide competence through their diverse
global experience and skills
Members of Executive Management are highly experienced
The Lauritzen Foundation has a vested interest
... And secures strong corporate governance • The Lauritzen Foundation is a commercial foundation and as
such a self-governing institution in Danish Law
• The Lauritzen Foundation is regulated by the Danish Act on
Commercial Foundations
• The Foundation is under supervision by the Danish Ministry of
Justice and the Danish Ministry of Business and Growth
August 2013
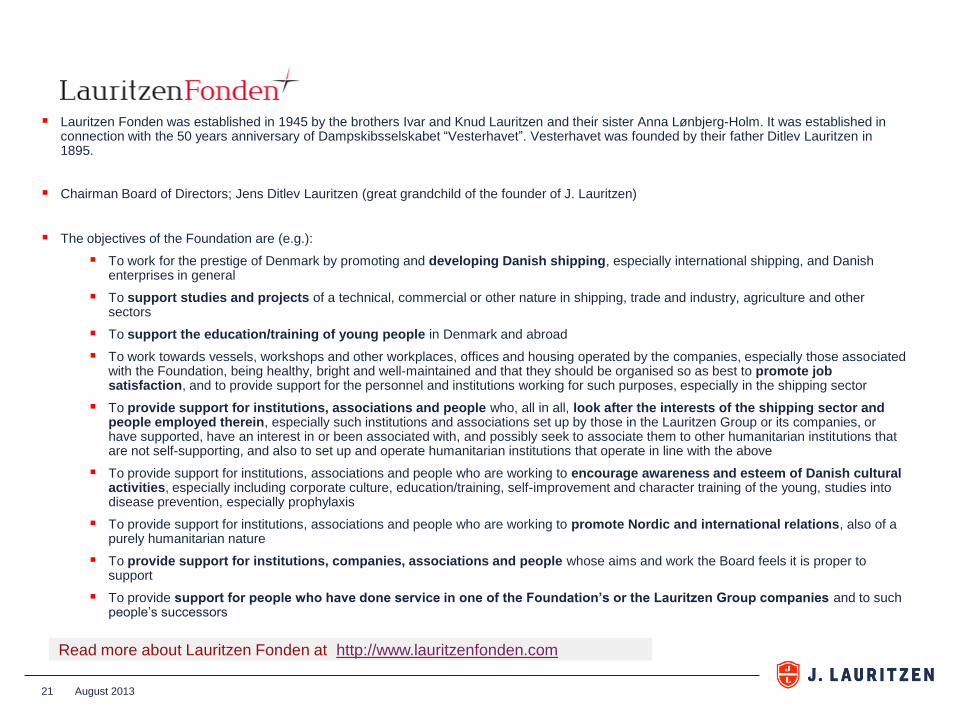
Lauritzen Fonden was established in 1945 by the brothers Ivar and Knud Lauritzen and their sister Anna Lønbjerg-Holm. It was established in connection with the 50 years anniversary of Dampskibsselskabet “Vesterhavet”. Vesterhavet was founded by their father Ditlev Lauritzen in 1895.
Chairman Board of Directors; Jens Ditlev Lauritzen (great grandchild of the founder of J. Lauritzen)
The objectives of the Foundation are (e.g.):
To work for the prestige of Denmark by promoting and developing Danish shipping, especially international shipping, and Danish enterprises in general
To support studies and projects of a technical, commercial or other nature in shipping, trade and industry, agriculture and other sectors
To support the education/training of young people in Denmark and abroad
To work towards vessels, workshops and other workplaces, offices and housing operated by the companies, especially those associated with the Foundation, being healthy, bright and well-maintained and that they should be organised so as best to promote job satisfaction, and to provide support for the personnel and institutions working for such purposes, especially in the shipping sector
To provide support for institutions, associations and people who, all in all, look after the interests of the shipping sector and people employed therein, especially such institutions and associations set up by those in the Lauritzen Group or its companies, or have supported, have an interest in or been associated with, and possibly seek to associate them to other humanitarian institutions that are not self-supporting, and also to set up and operate humanitarian institutions that operate in line with the above
To provide support for institutions, associations and people who are working to encourage awareness and esteem of Danish cultural activities, especially including corporate culture, education/training, self-improvement and character training of the young, studies into disease prevention, especially prophylaxis
To provide support for institutions, associations and people who are working to promote Nordic and international relations, also of a purely humanitarian nature
To provide support for institutions, companies, associations and people whose aims and work the Board feels it is proper to support
To provide support for people who have done service in one of the Foundation’s or the Lauritzen Group companies and to such people’s successors
21
Read more about Lauritzen Fonden at http://www.lauritzenfonden.com
August 2013

Glossary
Aframax: Crude oil tanker or product tanker too large to pass through the Panama Canal and below 120,000 dwt.
Bulk vessel: Vessels transporting large cargo quantities, e.g. coal, iron ore, steel, grain, gravel, oil, etc.
Bunker: Fuel for vessels.
Capesize: Dry bulk carrier of more than approximately 80,000 dwt; too large to pass through the Panama Canal.
Cbm: Cubic meter.
Clean products: Refers to light, refined oil products such as jet fuel, gasoline, diesel oil and naphtha.
CoA: Contract of Affreightment. Contract between shipping company and charterer concerning the freight of a predetermined volume of goods within a given period of time and/or at given intervals.
Coating: The internal coatings applied to the tanks of a product or chemical tanker. Coated tanks enable the ship to transport corrosive refined oil products or chemicals and it facilitates extensive cleaning of the tanks, which may be required in the transportation of certain cargoes.
Dirty products: Heavy oils such as crude oil or refined oil products such as fuel oil or bunker oil.
DP: Dynamic Positioning. Special equipment on board that in conjunction with bow thrusters and main propellers enable the ship to position itself in a fixed position in relation to the seabed.
Dwt: Dead Weight Tons. International unit of measurement that indicates the loading capabilities in metric tonnes of the particular vessel, including the weight of crew, passengers, stores, bunkers etc.
F(P)SO: Floating (Production) Storage Offloading Unit. Crude oil tanker used as substitute for a conventional oil platform at oil fields that are either too deep in the ground or too small to justify the use of a conventional oil platform. If the ship is an FPSO the ship has oil (or gas) processing capabilities on board.
Handy, tank: Crude oil tanker, product tanker or chemical tanker of between 10,000 and 25,000 dwt
Supramax (Handymax), dry cargo: Dry bulk carrier of between approximately 40,000 and 60,000 dwt.
Handysize, dry cargo: Dry bulk carrier of between approximately 10,000 and 40,000 dwt.
IMO: International Maritime Organization A maritime organization under the UN, www.imo.org .
LPG vessels: Liquefied Petroleum Gas. Vessels used to transport ammonia and liquid gases (ethane, ethylene, propane, propylene, butane, butylenes, isobutene and isobutylene).The gases are transported under pressure and/or refrigerated.
LR1, product tanker: Long Range 1. Product tanker with the maximum dimensions for passing through the Panama Canal (width of 32.21 meters and length of 289.5 meters) of approximately 50,000—80,000 dwt.
LR2, product tanker: Long Range 2. Product tanker too large to pass through the Panama Canal of approximately 80,000 dwt.
Medium Range, tanker (MR): Product tanker of between 25,000 and 50,000 dwt.
Nautical Mile: Distance unit measure of 1,852 meters.
Offshore vessel: Vessel serving the offshore oil industry.
OPEC: Organization of Petroleum Exporting Countries.
Panamax, tanker: Crude oil tanker or product tanker with the maximum dimensions for passing through the Panama Canal (width of 32.21 metres and length of 289.5 metres) of approximately 50,000—80,000 dwt.
Panamax, dry cargo: Dry bulk vessel with the maximum dimensions for passing through the Panama Canal (width of 32.21 metres and length of 289.5 metres) of approximately 60,000—80,000 dwt.
Petrochemical gases: Industrial processed gases such as ethylene, propylene, butadiene and VCM.
Product tanker: Tanker vessel with coated tanks used to transport refined oil products.
Suezmax: Crude oil tanker with the maximum dimensions for passing through the Suez Canal (approximately 120,000—200,000 dwt.).
Time Charter (TC): Under time charters, vessels are chartered to customers for fixed periods of time at rates that are generally fixed. The charterer pays all voyage costs. The owner is responsible for payment of all vessel operating expenses (manning, maintenance, repair, docking) and capital costs of the vessel.
Time Charter Equivalent (TCE): Gross freight income less voyage-related costs (bunkers, harbor fees, etc.)
Ton-nautical mile: Unit of measurement indicating the volume of cargo and how far it has been transported.
VLCC: Very Large Crude Carrier. Crude oil tanker of between approximately 200,000 and 320,000 dwt.
VLGC: Very Large Gas Carrier. LPG ship with capacity above 60,000 cbm.
August 2013 22

Contact details
Investor relations
Jacob Winthereik Financial Investor Relationship Manager, Group Treasury
E-mail: [email protected]
Phone: +45 3396 8384
Web: http://www.j-l.com
Press & Media
Jens Søndergaard Senior Vice President,
Strategic Planning & Executive Communications
E-mail: [email protected]
Phone: +45 3396 8401
Web: http://www.j-l.com
August 2013 23
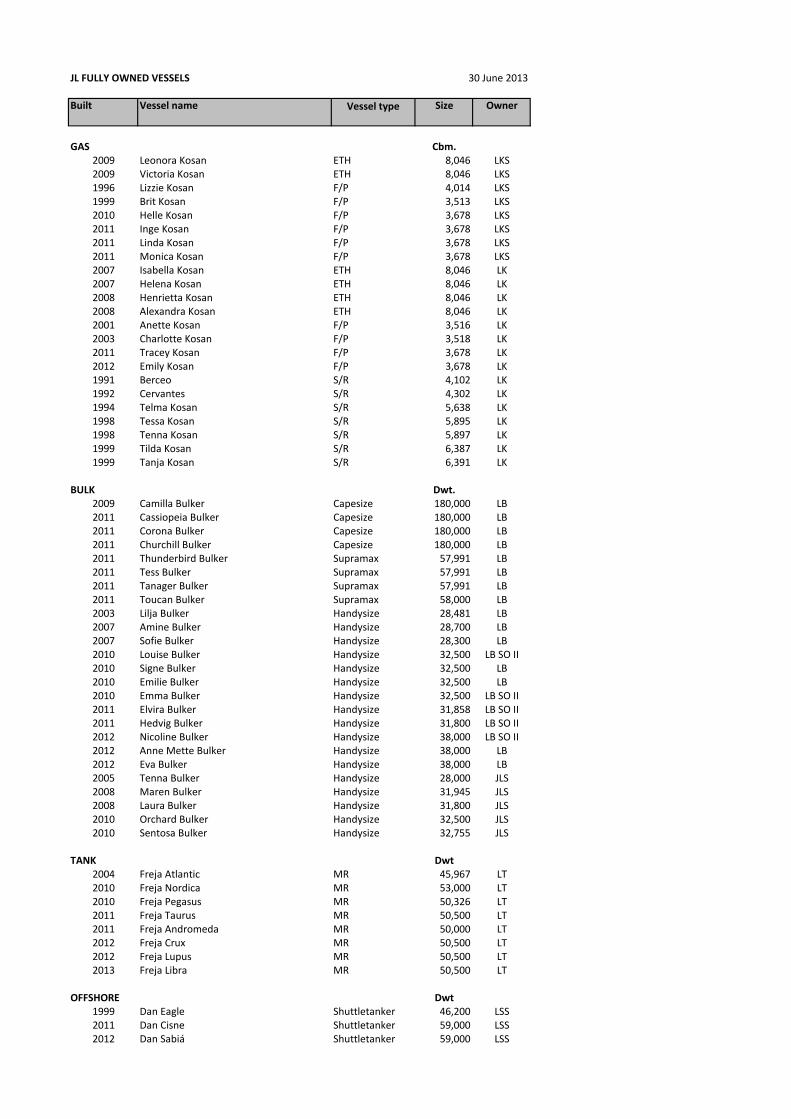
JL FULLY OWNED VESSELS 30 June 2013
Built Vessel name Size Owner
GAS Cbm.2009 Leonora Kosan ETH 8,046 LKS2009 Victoria Kosan ETH 8,046 LKS1996 Lizzie Kosan F/P 4,014 LKS1999 Brit Kosan F/P 3,513 LKS2010 Helle Kosan F/P 3,678 LKS2011 Inge Kosan F/P 3,678 LKS2011 Linda Kosan F/P 3,678 LKS2011 Monica Kosan F/P 3,678 LKS2007 Isabella Kosan ETH 8,046 LK2007 Helena Kosan ETH 8,046 LK2008 Henrietta Kosan ETH 8,046 LK2008 Alexandra Kosan ETH 8,046 LK2001 Anette Kosan F/P 3,516 LK2003 Charlotte Kosan F/P 3,518 LK2011 Tracey Kosan F/P 3,678 LK2012 Emily Kosan F/P 3,678 LK1991 Berceo S/R 4,102 LK1992 Cervantes S/R 4,302 LK1994 Telma Kosan S/R 5,638 LK1998 Tessa Kosan S/R 5,895 LK1998 Tenna Kosan S/R 5,897 LK1999 Tilda Kosan S/R 6,387 LK1999 Tanja Kosan S/R 6,391 LK
BULK Dwt.2009 Camilla Bulker Capesize 180,000 LB2011 Cassiopeia Bulker Capesize 180,000 LB2011 Corona Bulker Capesize 180,000 LB2011 Churchill Bulker Capesize 180,000 LB2011 Thunderbird Bulker Supramax 57,991 LB2011 Tess Bulker Supramax 57,991 LB2011 Tanager Bulker Supramax 57,991 LB2011 Toucan Bulker Supramax 58,000 LB2003 Lilja Bulker Handysize 28,481 LB2007 Amine Bulker Handysize 28,700 LB2007 Sofie Bulker Handysize 28,300 LB2010 Louise Bulker Handysize 32,500 LB SO II2010 Signe Bulker Handysize 32,500 LB2010 Emilie Bulker Handysize 32,500 LB2010 Emma Bulker Handysize 32,500 LB SO II2011 Elvira Bulker Handysize 31,858 LB SO II2011 Hedvig Bulker Handysize 31,800 LB SO II2012 Nicoline Bulker Handysize 38,000 LB SO II2012 Anne Mette Bulker Handysize 38,000 LB2012 Eva Bulker Handysize 38,000 LB2005 Tenna Bulker Handysize 28,000 JLS2008 Maren Bulker Handysize 31,945 JLS2008 Laura Bulker Handysize 31,800 JLS2010 Orchard Bulker Handysize 32,500 JLS2010 Sentosa Bulker Handysize 32,755 JLS
TANK Dwt2004 Freja Atlantic MR 45,967 LT2010 Freja Nordica MR 53,000 LT2010 Freja Pegasus MR 50,326 LT2011 Freja Taurus MR 50,500 LT2011 Freja Andromeda MR 50,000 LT2012 Freja Crux MR 50,500 LT2012 Freja Lupus MR 50,500 LT2013 Freja Libra MR 50,500 LT
OFFSHORE Dwt1999 Dan Eagle Shuttletanker 46,200 LSS2011 Dan Cisne Shuttletanker 59,000 LSS2012 Dan Sabiá Shuttletanker 59,000 LSS
Vessel type
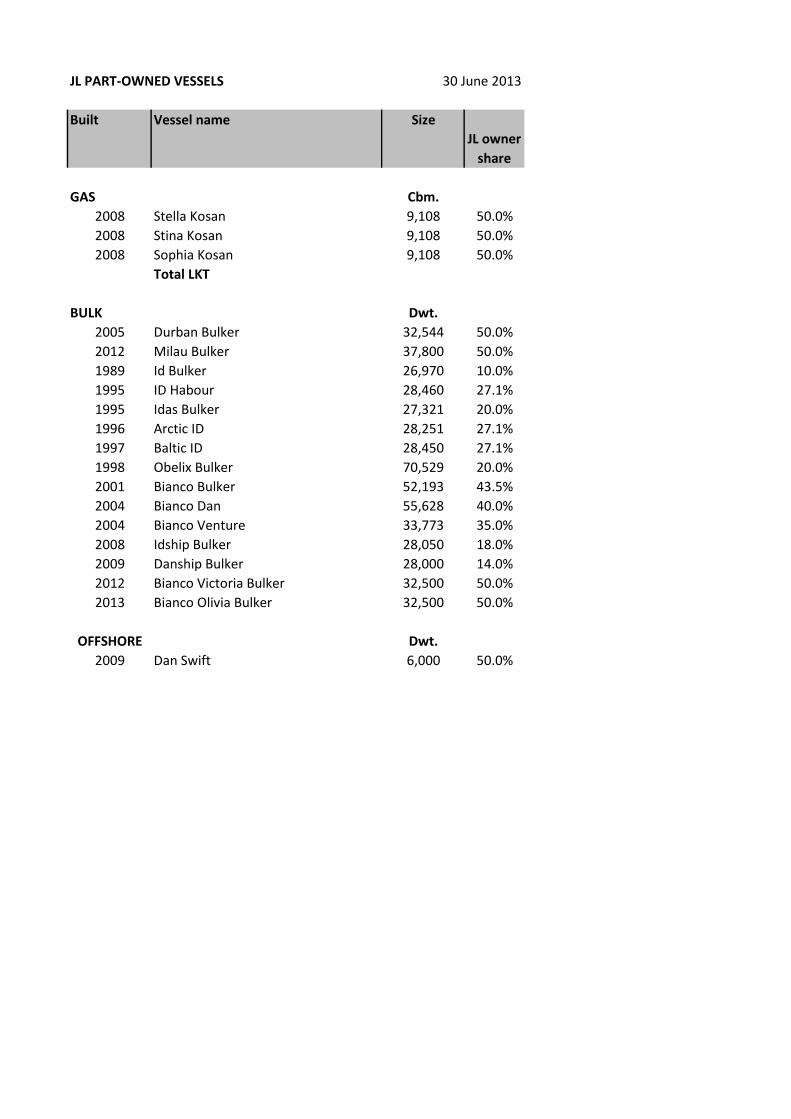
JL PART-OWNED VESSELS 30 June 2013
Built Vessel name Size
JL owner
share
GAS Cbm.
2008 Stella Kosan 9,108 50.0%
2008 Stina Kosan 9,108 50.0%
2008 Sophia Kosan 9,108 50.0%
Total LKT
BULK Dwt.
2005 Durban Bulker 32,544 50.0%
2012 Milau Bulker 37,800 50.0%
1989 Id Bulker 26,970 10.0%
1995 ID Habour 28,460 27.1%
1995 Idas Bulker 27,321 20.0%
1996 Arctic ID 28,251 27.1%
1997 Baltic ID 28,450 27.1%
1998 Obelix Bulker 70,529 20.0%
2001 Bianco Bulker 52,193 43.5%
2004 Bianco Dan 55,628 40.0%
2004 Bianco Venture 33,773 35.0%
2008 Idship Bulker 28,050 18.0%
2009 Danship Bulker 28,000 14.0%
2012 Bianco Victoria Bulker 32,500 50.0%
2013 Bianco Olivia Bulker 32,500 50.0%
OFFSHORE Dwt.
2009 Dan Swift 6,000 50.0%