j. benson, b. bonev, p. james, k. shan, b. cantor, m. caplinger icarus
DESCRIPTION
The Seasonal Behavior of Water Ice Clouds in the Tharsis and Valles Marineris Regions of Mars: Mars Obiter Camera Observations. J. Benson, B. Bonev, P. James, K. Shan, B. Cantor, M. Caplinger ICARUS. Presented by Kate Hale 12/9/04. Outline. Objectives of the study - PowerPoint PPT PresentationTRANSCRIPT

The Seasonal Behavior of Water Ice Clouds in the
Tharsis and Valles Marineris Regions of Mars: Mars
Obiter Camera Observations
J. Benson, B. Bonev, P. James, K. Shan,B. Cantor, M. Caplinger
ICARUS
Presented by Kate Hale12/9/04

Outline
• Objectives of the study• Why is the study important?• Description of technique• Data• Results

Objectives
• Quantify seasonal variations of cloud characteristics associated with certain topographical features (canyons and volcanoes)
• Determine periodicities in data• Estimate cloud top height• Determine optical depth of observed clouds to
estimate their water content

Why is this study important?
Past Studies: • Ground based • Mariners 6, 7 & 9 • Viking • Hubble Space Telescope
ALL LIMITED None able to perform continuous, daily monitoring

Techniques of the study
• Data taken from March 15 1999, to July 31, 2001• Mars Orbital Camera took images in both red and blue
bandpass range– In blue the ice clouds appear very bright (high scattering
albedo) separating them from the darker dust clouds
• In 24-hr period a complete global map is obtained of resolution = 7.5 km/pixel (Daily Global Maps)– However some missing data at times due to solar conjunction
and incomplete data reception at Deep Space Network (~19 Martian days)
• Visually located areas of high cloud density, then matched with blue images and cloud area measured
• Thermal Emission Spectrometer (TES) data complemented visual images

Data - 4 Tharsis region volcanoes
A) Arsia Mons (1˚S, 130˚W by 10˚S, 110˚W)* May 2001B) Alba Patera (50˚N, 128˚W by 30˚N, 99˚W)* Dec 2000C) Ascraeus Mons (25˚N, 129˚W by 2˚N, 88.5˚W)* February
2001D) Pavonis Mons (11˚N, 127˚W by 8˚S, 105˚W)* February
2001
Ripple“W” cloud(large, bright, limb clouds)
From (C)
Formed from upward slopeof volcano
From (D)
*Window coordinates: (left top, right bottom)
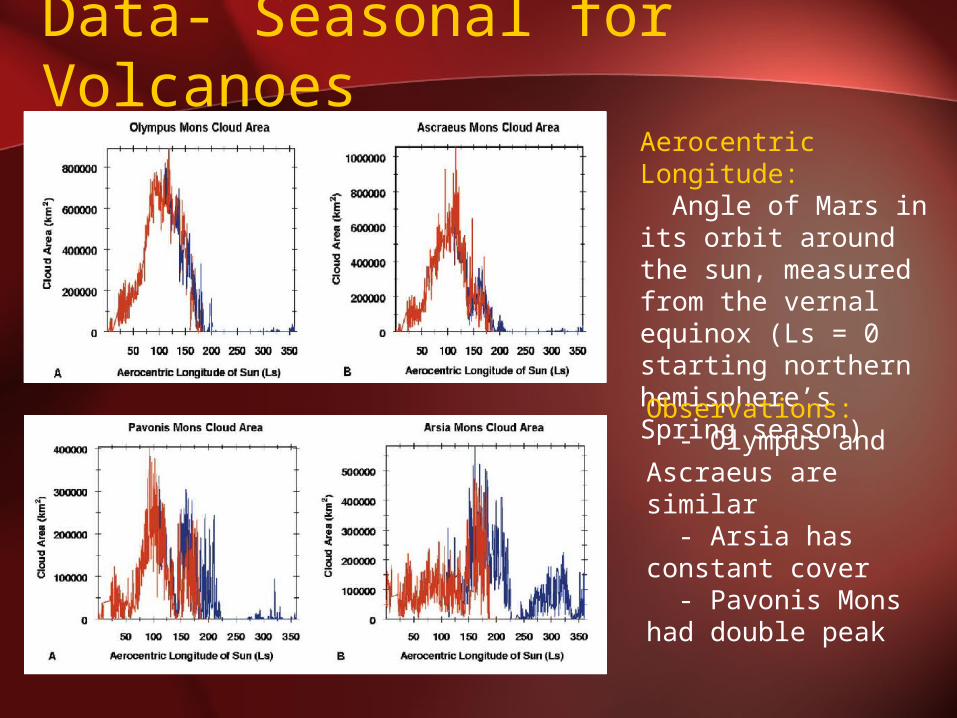
Data- Seasonal for Volcanoes
Aerocentric Longitude: Angle of Mars in its orbit around the sun, measured from the vernal equinox (Ls = 0 starting northern hemisphere’s Spring season)Observations: - Olympus and Ascraeus are similar - Arsia has constant cover - Pavonis Mons had double peak

Alba Patera
• Alba Patera also has double peak (highest peak at 1.2 million km2)• Anticorrelated with Olympus and Ascraeus
Data
• Cloud height taken for several days throughout cloudy season. - Visual inspection of position relative to volcano compared against topographical maps of the volcanoes
• Cloud optical depth was calculated from blue images and the radiance (albedo) of the clouds using the 3 layer model which was used in modeling Hubble’s observations. - Observed radiance compared with outside point surface albedo - TES data used to estimate dust optical depth• Water column abundances were calculated from final calculated cloud depths

Results
• Overlapping of data shows that there is seasonal repeatability for the Tharsis volcanoes, Olympus Mons, and Alba Patera
• Cloud area on short scale (< 10-15 sols) intensifies in both size and thickness as the day progresses
• Clouds at Valles Marineris are in form of haze from Spring to mid-Summer, then small discrete clouds until end of Summer.
• Cloud heights increase as day progresses
– Range for Alba Patera 5.5 – 6.5 km compared to
– Olympus Mons 19 – 21 km
• H2O abundances range from .080 - .820 pr μm for Arsia
Mons to .101 – 1.358 pr μm (pr μm = precipitable microns)