iw-expertise - efuel alliance
TRANSCRIPT

Externally funded expertise
IW-Expertise Synthetic fuels: potential for Europe Climate protection impact and value-added effects of ramping up the production of elec-tricity-based liquid energy carriers Manuel Fritsch, Thomas Puls, Thilo Schaefer Client: IWO Institut für Wärme und Mobilität e. V. MEW Mittelständische Energiewirtschaft Deutschland e.V UNITI Bundesverband mittelständischer Mineralölunternehmen e. V. Cologne, March 2021

Synthetic fuels: potential for Europe
1
Table of contents
Summary 2
1 Background 4
2 Electricity-based synthetic energy carriers 7
2.1 Properties of synthetic fuels 7
2.2 Potential of synthetic fuels for climate protection 9
3 The effects of synthetic fuels for European vehicle production 14
4 The market potential for equipment to produce PtX 21
5 New future-oriented jobs in European machine construction and plant engineering with PtX technologies 27
6 Development of sustainable value-added structures in regions outside of Europe 36
Bibliography 43

Synthetic fuels: potential for Europe
2
Summary Synthetic fuels produced from green electricity can make a major contribution to reducing greenhouse gas emissions around the world. Liquid energy carriers produced from renewably generated electricity can be used in combustion engines without impacting the climate. ◼ In air and sea transport, electricity-based liquid fuels represent the only option for a climate-
neutral energy supply from today’s perspective.
◼ In road and rail transport, synthetic fuels can complement direct electrification due to their high energy density, and their use can reduce CO2 emissions where vehicles with combustion engines continue to be used.
The use of electricity-based synthetic fuels is primarily suited for purposes dominated by long-distance mobility. In many regions of the world, therefore, the combustion engine will continue to be used in the medium term. This is due to the mobility requirements, for example, in rural regions, insufficiently developed electricity grids, as well as the lack of purchasing power to buy new electrical vehicles, which are usually more expensive than non-electric ones. It is also nec-essary to remember the great economic importance of vehicle production in many Central and Eastern European countries.
In the transport sector, the use of synthetic fuels can reduce greenhouse gas emissions imme-diately and effectively for the existing vehicle fleet through the delivery and transport infra-structures already in place. Especially in this sector, the targets of European climate policy, which the Green Deal recently adopted by the European Commission should raise, are still far from being reached. The goal of complete climate neutrality can only be achieved, from today’s perspective, with increased use of synthetic fuels. The production of synthetic fuels requires extensive investments in plants to generate renewa-ble electricity and convert it to liquid energy carriers. Especially economically competitive loca-tions for the generation of electricity include places with large amounts of sun and wind and a lot of available space, mostly situated outside of Europe. The enormous need for renewable energy to defossilise not only the current electricity demand, but also the sectors of industry, building heating and transport, where other energy sources have largely been used to date, means that Member States of the European Union will also be dependent on imports in addition to the expansion of their own capacities for generating renewable electricity. Conceivable production locations are, for example, situated in North Africa and in the Middle East, Australia or Patagonia. By investing in electrolysers and conversion plants for the genera-tion of synthetic energy carriers from renewable electricity, both European plant manufactur-ers and the economic regions where synthetic energy carriers are produced can benefit.

Synthetic fuels: potential for Europe
3
Figure 1: Additional jobs in Europe through the export of machines, equip-ment and plants for producing electricity-based synthetic energy carriers (Power-to-X, PtX)
Effects on employment in thousands of persons (reference scenario for global PtX market)
Sources: Eurostat (2020); OECD (2020); UN (2020); OECD (2018); German Economic Institute
Ramping up the production of electricity-based energy carriers offers enormous potential both for the European economy and the production locations: ◼ EUR 80 billion in additional annual added value are created for the European economy as
a result of the production and export of PtX equipment and plants to non-European potential regions.
◼ 1.2 million new jobs can be created in Europe through the production and export of PtX equipment and plants. These jobs will result from Europe’s own production of machines, equipment and plants, the demand for intermediate consumption and the rise in income for employees there due to the additional demand for consumer goods (Figure 1).
◼ More than 340,000 new, highly productive jobs can be created at a PtX production site that serves one fiftieth of the global PtX demand potential.
The EU now has the opportunity to position itself as a leading supplier of sustainable PtX tech-nologies. Although the global market for electrolysers to produce hydrogen has already doubled in the last 20 years, the majority of this growth has taken place outside of Europe. To change this, it is necessary to make appropriate investments as soon as possible.

Synthetic fuels: potential for Europe
4
1 Background
At the Paris Climate Change Conference, most countries agreed to reduce their greenhouse gas emissions. However, these commitments are not enough to achieve the target of a maximum rise in temperature of two degrees Celsius, let alone the 1.5 degrees Celsius relative to the level of the average temperature in the preindustrial age. Figure 1-1: Global climate policy to date is headed toward missing the targets Figures in gigatons CO2eq
Source: Climate Action Tracker, 2019
The measures implemented to date will merely lead to a slowing of the rise in CO2 emissions (Figure 1-1). Accordingly, a massive increase in measures to reduce emissions is required to achieve the climate-policy targets. The European Green Deal pursued by the EU Commission should lay the groundwork in the coming years for Europe to become climate-neutral by 2050. The European Commission reaffirmed its climate protection policy ambitions with its Green
0
50
100
150
200
1990
1993
1996
1999
2002
2005
2008
2011
2014
2017
2020
2023
2026
2029
2032
2035
2038
2041
2044
2047
2050
2053
2056
2059
2062
2065
2068
2071
2074
2077
2080
2083
2086
2089
2092
2095
2098
Business as ususal Scenario
Implemented Measures
Pledeges made at the Paris Conference
Consistent with the 2° TargetConsistent with the 1.5° TargetHistoric Emission Values
◼ International agreements on the UN and EU level set reduction targets for greenhouse gas emissions, which are legally binding for the German federal government due to the corresponding European legal acts.
◼ The European Council has raised the reduction target to 55 percent by 2030 relative to 1990. This means that significant additional challenges are to be expected for the na-tional sector targets.
◼ To achieve climate neutrality, the entire primary energy supply for industry, transport and heat must be converted to renewable energy. This can only succeed with the help of electricity and electricity-based energy carriers from renewable sources, along with bio-mass and fuels produced from it.

Synthetic fuels: potential for Europe
5
Deal. The European Council decided to raise the target for 2030 from a 40 percent reduction in greenhouse gas emissions relative to the level in 1990 to 55 percent now. Accordingly, these sector-specific targets have to be raised as well. Figure 1-2: EU-281 – Achievement of targets by sector Figures indicate the percentage of emission reduction relative to the base year 2005
* A target of -43 percent is assumed for the entire industrial sector Source: EEA, 2020 (v23)
With regard to the currently applicable targets for 2030, however, multiple sectors remain far behind the requirements. While industry and the energy sector have achieved a substantial re-duction in sectoral CO2 emissions due to the capping of emissions in the European Emissions Trading System (EU-ETS), the emissions in transport and agriculture have hardly fallen in recent years (Figure 1-2). It should be pointed out here that the existing national regulations lay out a strict division of emissions along sector boundaries. Accordingly, any emissions not directly produced by operat-ing a vehicle are not considered as emissions in the transport sector. The consequence of this, for instance, is that an electric car in the transport sector is considered to be a zero-emissions vehicle, while the emissions resulting from its operation are allocated to the electricity sector. Likewise, higher emissions in the production of an electric car are of no relevance for the transport sector. Regarding the increasing energetic coupling of the sectors, this approach is questionable, but it represents the existing legal framework, which is why it is used as the basis for the arguments below. If the approach with assigned sectoral targets is retained – which is to be assumed at the present time – then raising sectoral targets will pose a great challenge for industry, as well as the building heating and transport sectors in Europe. The agricultural sector, whose emissions largely do not
1 The latest available data in each case were used for this report and are mostly still based on the EU-28.
38,1%
98,4%
96,6%
65,1%
52,2%
0% 10% 20% 30% 40% 50% 60% 70% 80% 90% 100%
Energy
Agriculture
Transport
Households/Service/Commerce
Industry*
Achievement of target in 2018 Distance from target for 2030

Synthetic fuels: potential for Europe
6
result from the use of fossil fuels, is a special case that will be excluded below. Irrespective of the often very high abatement costs in the critical sectors, the building heating and transport sectors will have to make a substantially higher contribution to reductions in the future. In this regard, it will be necessary to gradually replace fossil fuels such as natural gas or crude oil in the sectoral value-added chains by 2050. This means that the total primary energy supply for indus-try, commerce, trade, households, transport, agriculture and energy must be converted to re-newable primary energy. These targets can only be met by electricity and electricity-based en-ergy carriers from renewable sources and biomass or fuel produced from biomass.

Synthetic fuels: potential for Europe
7
2 Electricity-based synthetic energy carriers
Electricity from renewable sources will form the basis of all efforts made to achieve the goal of climate neutrality in the European Union. However, to achieve this goal, it will not be sufficient to simply feed electricity into the grid. Rather, it will be necessary to link the energy used in the economic sectors that have been strictly separated to date. To make this possible, the form of energy storage and the energy supply must be adjusted to the requirement profiles of all sec-tors. Since conventional supply via the electricity grid can cover only part of the needs of indus-try and transport, the electricity will also have to be made storable so that it can fully assume the role played by fossil energy carriers in the industry, transport and building heating sectors today. Its conversion to stable molecules is advantageous for the successful storage of electric-ity. The generic term for this material is PtX (Power-to-X). It includes synthetic energy carriers in a liquid or gaseous aggregate state. In particular, liquid PtX can be used universally across a wide range of applications, particularly in mobility, due to its high energy density. Since the produc-tion of PtX is always connected with additional energy expenses in comparison to direct local electricity generation and use, the need for renewable electricity would initially increase accord-ingly. This would play out in particular if there is a complete defossilisation of Europe relative to the lower reduction target to date (BCG/Prognos, 2018), since this cannot be implemented with-out the use of synthetic energy carriers. In the complete defossilisation scenario, the import of renewable energy is indispensable. In this regard, PtX energy carriers are perfect, since they can be produced relatively inexpensively at global locations with especially high solar, wind and space potential in comparison to Europe and also transported relatively easily and inexpensively over longer distances from such locations to regions with demand. There are not only economic reasons for favouring such an approach, but also reasons of acceptance in the population.
2.1 Properties of synthetic fuels Fossil-based liquid energy carriers define the energy supply in many areas of application today. There are multiple technical reasons for this: they have a high energy density in terms of volume
◼ Electricity-based synthetic fuels have a high energy density, which enables them to be used flexibly and universally. The existing vehicle fleet can be supplied via the delivery and transport infrastructures already in place.
◼ Synthetic fuels can be added to today’s conventional fuels and thus reduce the net cli-mate impact from emissions in the current vehicle fleet.
◼ A permanent five percent addition of electricity-based synthetic fuels would reduce, roughly on average in Europe, as many emissions as an entire fleet of new battery electric cars registered in one year and then running solely on renewably generated electricity during their entire lifetime.

Synthetic fuels: potential for Europe
8
and mass, are easy and efficient to store, and can also be transported very well. Replacing them with electricity-based energy storage usually requires a drastic transformation of the underlying infrastructure. Depending on the type of energy storage, it is necessary to invest in the produc-tion of the energy carriers on the one hand, and the transport and distribution infrastructure on the other. The amount of investment required in one area relative to another depends on how close the respective energy storage compares to those used today in terms of its material prop-erties. In the case of electricity-based liquid fuels, the existing transport and distribution infra-structure can continue to be used, while it must be substantially modified for the use of hydro-gen or electricity. The costs for the RES electricity supply play an essential role in the operating costs of different paths for climate-neutral energy carriers. There are advantages for locations in non-European regions with high renewable energy yield potential. Figure 2-1: Production of liquid energy carriers from renewably generated electric-
ity Graphic
Source: Bothe et. al. (2018)
In principle, it is possible to produce any hydrocarbon by producing hydrogen via electrolysis, which is then synthesized into any chain with the addition of carbon dioxide. This process (Figure 2-1) requires a relatively high input of process energy, typically in the form of heat. The most important electricity-based energy carriers are hydrogen, which is currently used as a synthesis gas in the chemical industry in particular, as well as power-to-liquid (PtL) or power-to-gas (PtG) energy carriers. In terms of chemical composition, PtL and PtG are comparable to pure kero-sene, gasoline, diesel and natural gas and therefore can also be used anywhere fossil fuels have been used to date. Due to their chemical purity, electricity-based fuels are even superior to the fuels commonly used today in terms of their application properties.

Synthetic fuels: potential for Europe
9
In road transport, for example, the energy produced from renewable sources can reach the ve-hicle in two different ways: directly through the electricity grid to the battery electric vehicle or indirectly by conversion to synthetic power-to-liquid or power-to-gas fuel. While charging infra-structures for direct electrification needs to be set up and new vehicles purchased, it is possible to continue using existing petrol stations and vehicles in the case of liquid fuels such as synthetic diesel. Electricity-based fuels in gas form assume a place in between. In terms of volume and weight, significantly more energy can be stored in high pressure tanks with the use of hydrogen than is the case with storage in batteries. However, this requires in turn substantial technical and energy-related expenditures to attain and maintain the required pressure. The conversion of renewably generated electricity to hydrogen and then to a liquid energy carrier requires more energy than the direct use of electricity. But for that, the supply infrastructure and vehicle fleet does not have to be developed from scratch with the use of synthetic liquid fuels. The cost-benefit relationships vary for the various energy carriers and technologies used along the value-added chains. To produce the most suitable and immediately usable synthetic fuels, it is necessary to make investments in conversion plants alongside the generation of electricity from renewable ener-gies. This includes electrolysers for the production of hydrogen, synthesis plants for the produc-tion of synthetic liquid fuels or methane, and plants for the extraction of CO2. There are various options available as sources of CO2: biogenic sources, the direct air capture method (the CO2 is removed from the atmosphere) or – at least for a transitional period – the use of emissions from industrial plants that are difficult to decarbonise for the time being.
2.2 Potential of synthetic fuels for climate protection There will be a huge need for regenerative electricity in the course of EU Member States’ efforts to become climate neutral. Not only does the entire present-day electricity demand need to be covered by renewable sources, but the need for process energy (mostly heat) and energy needs for mobility, private households, etc. has to be covered by electricity from renewable sources. To achieve this, it is necessary to convert the electricity to different forms of storage. One of these forms consists of synthetic PtL fuels. They will play an important role, since batteries can only cover a portion of the storage requirements. Especially in the transport sector, the use of liquid energy carriers produced from electricity is indispensable. Air and sea transport are de-pendent on these materials, and in road freight transport other energy carriers often reach their limits, since significant amounts of energy are required to move larger quantities of goods. The dead weight of energy storage can also increase this need for energy. Furthermore, the physical space available in mobile applications for the storage of energy is also limited, which has to be taken into account when selecting the method for energy storage. Crude oil and natural gas are also important in the industry sector not only in their role for the production of process energy, but also as raw material supplies. They are used for the extraction of hydrogen and hydrocarbons, which are the basis for a wide range of technical plastics appli-cations. Notable examples include applications in medical technology and substitutes for certain metallic materials (for the purpose of weight reduction or material resistance). Fossil hydrocar-

Synthetic fuels: potential for Europe
10
bons, however, are also used for the production of construction materials and found in numer-ous chemical processes. For instance, the industrially used hydrogen today is almost always ex-tracted from natural gas, which also causes greenhouse gas emissions. Transition to non-fossil-based source materials is also required for areas of applications with these materials and pro-cesses. The material properties of synthetic hydrocarbons mean that they offer some advantages that must be weighed against the energy conversion losses in their utilisation chain. It is necessary to remember here that electricity-based fuels can be used in all existing vehicles. Together with fuels produced from biomass, they represent the sole technical method to help with achieving a net reduction in CO2 emissions from today’s vehicle fleet all the way to the point of complete greenhouse gas neutrality. The use of biofuels can lead to great reductions in emissions, as the example of Sweden has clearly shown (Puls, 2019). However, their supply is also subject to sig-nificant quantity restrictions, which is why they are better suited as a complement to electricity-based fuels over the long term. On average, newly registered cars remain in the global vehicle fleet for a very long time. It is difficult to specify how long exactly, since older cars are often used in countries that do not keep any detailed statistics on their fleets. Even in the EU there are great differences. The average age of a car registered in Luxembourg is less than seven years, while it is almost 17 years in Lithuania (ACEA, 2020b). The age of the vehicle when it is scrapped is not recorded statistically in Europe.. In light of these age structures, which will not change substantially in the foreseeable future, it is of great significance that the current fleet be supplied with low emission fuels. The option of being able to use them in almost every existing vehicle puts electricity-based fuels in a strong position to reduce the emissions of transport, for example. Their effectiveness can be demonstrated quite well if we compare them to electric cars that are considered emission-free under the existing regulatory framework.

Synthetic fuels: potential for Europe
11
Figure 2-2: The strong position of zero-carbon liquid fuels The effect of 100 percent emission-free new vehicles in one year corresponds to the addition of 5 percent of emission-free fuels.
Source: Authors’ chart
New registrations of cars in the European Union usually correspond to a volume that equates to a little more than 5 percent of the existing fleet. To put it simply, an average registration year of 100% battery electric vehicles would reduce the emissions of the car fleet by 5 percent within the scope of the applicable calculation requirements. The permanent addition of 5 percent of electricity-based fuel would have roughly the same effect on the emissions of cars (Figure 2-2) and could also reduce the emissions of the operating cars as well. It should be noted here that the savings effect through added synthetic fuels will be achieved with certainty, while there is uncertainty about how newly registered electric cars will actually be used. A hardly driven sec-ond car will not produce the same savings effect as a vehicle that is used to commute daily. This comparison reflects the European average. If individual Member States are analysed, the quite different ratios of new registrations to the existing vehicle fleet produce a very incon-sistent picture. In Luxembourg, new registrations in 2018 reached a level that corresponded to 12.7 percent of the car fleet. By contrast, in Bulgaria, it was only 1.2 percent. In general, it is possible to discern a clear East-West divide in this ratio (Figure 2-3). Especially in economically weaker acceding countries, defossilisation with the introduction of electric cars will take much longer than in the more prosperous countries of Western Europe. Accordingly, the effect of a permanent addition of 5% electricity-based fuel would be higher than the effect of a full electric registration year in these countries.

Synthetic fuels: potential for Europe
12
A major advantage, regardless of whether a hydrocarbon is fossil or synthetic, is the good stor-age capacity of liquid energy carriers. They have both a high volume- and weight-specific energy density. Synthetic fuels material properties present a further advantage. They can be trans-ported inexpensively, also over large distances, via existing infrastructures and then distributed. The infrastructure required such as pipelines, tanks and tank storage, along with the developed filling station network, is already available and connects potential production areas for synthetic fuels with regions where there is potential demand. The high energy density of synthetic energy carriers makes transport easier, so that it is easy to site production at especially effective locations with intensive solar radiation or strong and steady wind. The costs of producing synthetic fuels can be substantially reduced relative to pro-duction in Europe by importing them. The reason for this is that the production of electricity-based fuels is relatively cheaper in sun and wind intensive regions (page 36 et seqq.). Since se-cure supply of water is also necessary, the coastal regions of North Africa, for example, appear
Figure 2-3: Slow fleet replacement in Eastern Europe in 2018 Share of newly registered cars as a percentage of car fleet
No figures for Greece and Malta available
Source: Eurostat, 2020; ACEA, 2019
> 2.5 percent

Synthetic fuels: potential for Europe
13
to be especially well suited as a location for electrolysis plants to produce liquid energy carriers to meet European demand. Not only can renewable electricity be produced much less expen-sively than at many European locations, but a significant cost degression is also to be expected, too, when electrolysis plants and synthesis of chemical fuels are scaled up, so the liquid fuels produced in this way will fall in price over time. If the political frameworks are designed in an open manner for the different options in climate-neutral technologies, a consumer price be-tween EUR 1.38 and EUR 2.17 per litre of synthetic diesel fuel appears to be possible by 2050 (Prognos et. al., 2018, p. 43 et seq.). In the context of its Green Deal, the European Commission as well as individual Member States such as Germany have adopted hydrogen strategies to create the conditions for the develop-ment over time of a hydrogen economy based on the production of renewable energies. With suitable arrangements, renewable energy will form an important basis for synthetically pro-duced liquid energy carriers, the market potential of which is not limited to Europe, but will be global in scope. In addition to the environment, technical and organisational advantages of using liquid energy carriers, the European economy will benefit from the high potential for value added and employment in the case of successful integration of liquid energy carriers into the economic cycle. This applies both to the creation of additional jobs in European machine con-struction and plant engineering, and to economic growth, employment and prosperity in the countries potentially exporting PtX.
Synthetic fuels: potential for Europe
14
3 The effects of synthetic fuels for European vehicle pro-duction
One main advantage of electricity-based fuels is that they are compatible with prevailing drive technology in the mobility sector. In the case of long-distance transport by sea or air, they also represent the sole option for defossilisation. This means on the one hand that these fuels can be used to reduce the emissions of today’s vehicle fleet when they are launched on the market. On the other hand, it follows from this characteristic that the creation of a significant supply of synthetic fuels will have a reciprocal effect on the transition in vehicle production which has already begun, and thus on global mobility options. In this context, two aspects are worth not-ing. It cannot be assumed that the conversion to climate-neutral mobility will take place equally in all parts of the world. The differences are too great between mobility requirements and avail-able supply infrastructures. To supply all parts of the world with mobility options, it will be nec-essary to use conventional technology for the foreseeable future, even if the political focus is heavily on electric mobility in some car sales markets such as Western Europe. Furthermore, the supply of synthetic fuels can help to shape this transformation process so that severe dis-ruptions are avoided and a contribution can be made to economic stability. It must be kept in mind that vehicle production is one of the largest industrial sectors in the world and constitutes the economic core of a number of regions. Vehicle production includes not only the automotive industry, but also the production of all other means of transport, i.e. aircraft, ships or railways. The construction of combustion engines for vehicles also usually falls into this category, while the production of batteries, for example, is generally categorised as part of the electrical industry. The conversion to battery electric drives would cause a noticeable value-added shift for sectors of industry and production loca-tions. This is especially possible for automobiles, ships or aircraft, since they are product groups that are largely developed for the global market and sold internationally. This is due in part to the uniform energy supply, since a car, aircraft or ship runs on materially comparable petrol, kerosene or diesel around the world. Engine technology is capable of working with fluctuating
◼ In sea and air transport, electricity-based synthetic fuels represent the only option for reducing greenhouse gas emissions. In road and rail transport, they can reduce CO2 emis-sions where vehicles with combustion engines continue to be used.
◼ In member states that have joined the EU since 2004, battery electric vehicles have hardly been relevant to date, although vehicle production plays a major role for value added and jobs in a number of countries. Vehicles with conventional drives produce fewer emis-sions with synthetic fuels.
◼ In the context of many uses where renewably generated electricity is not directly availa-ble in a sufficient quantity, whether this is in rural regions or over long distances without suitable infrastructure, electricity-based fuels can make a contribution to meeting cli-mate targets.

Synthetic fuels: potential for Europe
15
qualities, so that the engines can be used globally. By contrast, in rail transport, that is not the case, especially because there are a number of national standards. Accordingly, there is no com-parable global market for rail vehicles, which is why locomotives and railway cars are primarily produced in small series according to exact customer specifications. The consequence of this is, among others, that economies of scale can rarely be achieved in production. One of the most important factors diversifying national railway networks is the energy supply: thus, there are a number of traction current systems, which make border crossings, even within the European Union, very difficult. In addition, there are rail networks operated with diesel locomotives, which is often the standard, especially outside of industrialised countries, since the supply of electricity is unreliable for traction current operation. In recent years, the first trains with fuel cells have also been placed in operation and can thus make use of hydrogen as an energy carrier. If liquid synthetic fuels are used, a climate-neutral operation of the currently diesel-operated rail vehi-cles would be possible without a change in drive being required. It is assumed that the global market for automobiles in particular will develop in the direction of a diversification of drives. Government regulations and financial incentives should particularly stimulate the demand for battery electric vehicles at the present time. This has caused some locations to already shift production capacities to electrical powertrains. At the same time, ca-pacities in the production of combustion engines have been reduced or relocated. In the EU today, the focus is primarily on the battery electric vehicle. As an alternative to battery electric drives, some regions such as Japan and South Korea are also working on drive technologies based on the energy carrier hydrogen (particularly with fuel cell technology). By contrast, in other markets such as South America, ASEAN or Africa, there is hardly any indication of transi-tioning to different drive technologies, even if the data on registrations of electric vehicles are only fragmentary in these markets. The available data are quite clear, however. For example, at the end of 2018, only around 1,000 electric cars were registered in Brazil out of roughly 38 million cars, and these 1,000 were mostly plug-in hybrid electric vehicles (PHEV) (Globenewswire, 2020). In India, 3,400 electric cars were registered in the last financial year; and 3,600 in the preceding year (SMEV, 2020). India sees roughly 3 million cars registered in a calendar year (VDA, 2020). The somewhat lower acceptance of electric cars in these markets must be attributable to several reasons: firstly, in these regions, the general purchasing power of the population is not nearly as strong as it is in Western European countries, for example. As a result, the majority of car buyers cannot afford to purchase a more expensive electric car. Secondly, the electricity grid in many countries today is not very reliable and a reliable grid is a mandatory prerequisite for the expansion of new electricity-supplying infrastructure, which in turn requires enormous investments in these countries. In addition to the lower purchasing power and the reliability of the electricity supply, the third factor is the technical reliability and universal applicability of the vehicles, since reliability plays a critical role, especially in regions with lower settlement density or longer and in part also more challenging transport routes. In terms of all these criteria, the combustion engine is quite advantageous, since it has large mobile energy storage that travels with it in the form of a fuel tank. This reliably ensures greater range for the vehicle, greater independence from infrastructures and more route flexibility. That is why the technology of combustion engines will continue to be used in these regions for the

Synthetic fuels: potential for Europe
16
foreseeable future. However, developed regions also exhibit widely divergent mobility patterns and thus acceptance of electric cars. For example, the general user profile of road vehicles in the rural regions of the United States is likely to be quite different than in the metropolitan areas. Such a differentiation probably does not exist only in the United States, but also world-wide. Even within Europe, it is possible to see substantial differences regarding the shares of electrical vehicles, as the current registration figures show (Figure 3-1). Figure 3-1: Electric cars still scarce in Southern and Eastern Europe Market shares of different drive concepts as a percentage of new registrations in the first three quarters of 2020
Source: ACEA, 2020; authors’ own calculations
If you consider national vehicle markets in the European Union, there are clear differences. No-table market shares of electric cars can be found in Western and Northern Europe, i.e. in pros-perous regions with good infrastructure, high subsidies for electric cars and high shares of urban transport. In Norway, battery electric vehicles (BEVs) and plug-in hybrid electric vehicles (PHEVs) in the first 3 quarters of 2020 even reached a share of over 70 percent of new registrations. However, that is a special case which has been made possible by high government subsidies and the high level of prosperity in Norway. The tax rebate granted there and the waiving of the registration and value-added taxes for the registration of an electric car usually reach a five-digit euro amount. Measured in terms of per capita GDP, Norway is one of the five most prosperous countries in the world at a good USD 75,000 in 2019. It should also be noted that an electric car in Norway is really almost emission-free in operation. The high share of hydropower in the elec-tricity mix causes a Norwegian electric car to produce only roughly 2 g CO2/km in the case of assumed consumption of 20 kWh/100 km, but this solely takes into account the pure driving operation and thus only a portion of the greenhouse gas emissions produced as a whole with an electric drive. By contrast, the picture is very different in the large European vehicle markets.
51,4
%
50,4
%
49,6
%
49,1
% 57,9
%
38,0
%
66,4
%
40,3
%
50,7
%
52,7
%
52,7
%
61,4
%
27,2
%
27,6
%
29,9
%
31,0
%
16,8
%
23,4
%
4,5%
34,6
%
30,2
%
27,9
%
20,2
% 23,7
%
0%
20%
40%
60%
80%
100%
Battery electric Plugin-Hybrid Hybrid Other alternatives Petrol Diesel

Synthetic fuels: potential for Europe
17
For example, France achieved a market share of a little over 6 percent with battery electric ve-hicles (BEVs). In Italy, it was only 1.8 percent, which is due to the fact that natural gas vehicles in Italy have established themselves as low-emission competitors and have reached a market share of 9 percent (ACEA, 2020b). And the picture changes again when we look at the countries joining the EU after 2004. Only 9,537 BEVs were registered in all the States of this group in the first three quarters of 2020. Germany alone had almost ten times as many new registrations. Plug-in-hybrid vehicles (PHEVs) play an even smaller role in the acceding countries. These figures suggest that there will also be different drive technologies for road transport in Europe. This trend supports the expansion of production capacities for synthetic fuels, since otherwise larger parts of the world will simply lack the opportunity to defossilise their transport on a large scale over the coming 30 years. It is worth noting that the transformation of the global vehicle industry, which has already be-gun, will have a substantial economic impact on numerous regions of the world. Vehicle pro-duction is still one of the most important industrial sectors in the world, and many jobs depend on this sector, especially in Europe. It should be an equal concern of economic and climate policy that all options are used to reduce greenhouse gas emissions. Therefore, in addition to measures to expand electric mobility, the promotion of synthetic fuels is an important climate policy instrument. This includes not only the political recognition of synthetic fuels as a possible climate policy solution, but also incentivizing the use of these materials, for example, by letting them offset the company-specific emission targets of car manufacturers. The same holds true for hydrogen and advanced biofuels. Adding biofuels to conventional fuels already reduces net emissions. The use of purely synthetic fuels even allows the climate-neutral operation of com-bustion engines, which will not only be used for the foreseeable future on the roads in many regions of the world, but also cannot be replaced with alternatives in air and sea transport to abate emissions. In view of the major economic importance of vehicle production in Europe, the avoidance of structural disruptions is an important secondary condition to be considered in the technical transformation of the sector. The importance of the sector goes far beyond the potential for value added and employment reported in the usual statistics, since they do not reflect the role of vehicle production as a driver of demand in other sectors. This under-reporting can be elimi-nated by analysing the statistical basis that considers the intermediary consumption relation-ships between sectors of the economy. Such a basis is offered by input-output tables that trace the production and goods-based relationships in the economy. They depict the economy as a deeply structured matrix of demand relationships and end uses of products. Such a database is provided on the international level by the OECD (OECD, 2018). The economic importance (meas-ured in value added and employment) of vehicle production can be calculated from this data-base for all countries in the EU-28. The analysis of these data shows the great significance of vehicle production for numerous other industrial sectors in Europe (Figure 3-2).
Synthetic fuels: potential for Europe
18
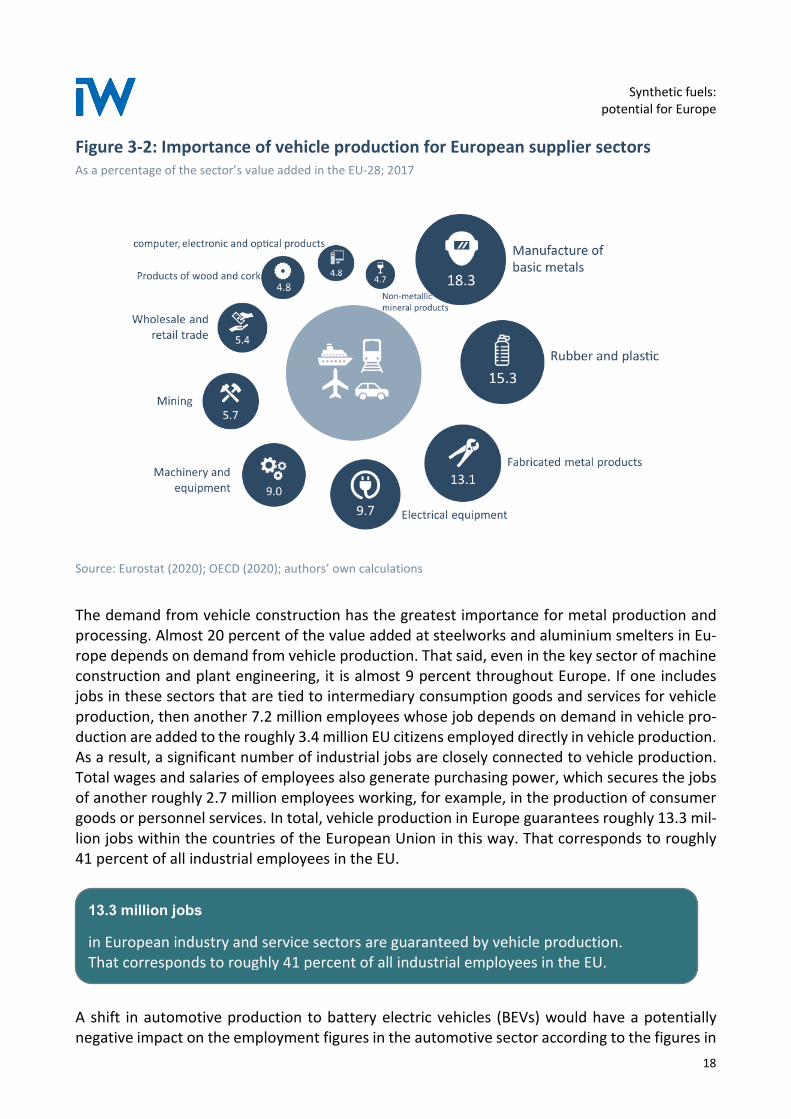
Figure 3-2: Importance of vehicle production for European supplier sectors As a percentage of the sector’s value added in the EU-28; 2017
Source: Eurostat (2020); OECD (2020); authors’ own calculations
The demand from vehicle construction has the greatest importance for metal production and processing. Almost 20 percent of the value added at steelworks and aluminium smelters in Eu-rope depends on demand from vehicle production. That said, even in the key sector of machine construction and plant engineering, it is almost 9 percent throughout Europe. If one includes jobs in these sectors that are tied to intermediary consumption goods and services for vehicle production, then another 7.2 million employees whose job depends on demand in vehicle pro-duction are added to the roughly 3.4 million EU citizens employed directly in vehicle production. As a result, a significant number of industrial jobs are closely connected to vehicle production. Total wages and salaries of employees also generate purchasing power, which secures the jobs of another roughly 2.7 million employees working, for example, in the production of consumer goods or personnel services. In total, vehicle production in Europe guarantees roughly 13.3 mil-lion jobs within the countries of the European Union in this way. That corresponds to roughly 41 percent of all industrial employees in the EU.
A shift in automotive production to battery electric vehicles (BEVs) would have a potentially negative impact on the employment figures in the automotive sector according to the figures in
13.3 million jobs
in European industry and service sectors are guaranteed by vehicle production. That corresponds to roughly 41 percent of all industrial employees in the EU.

Synthetic fuels: potential for Europe
19
the latest studies. According to calculations by Fraunhofer IAO (2018), around 200,000 employ-ees in 2017 worked in the production of powertrains solely for automobiles manufactured in Germany. A switch to battery electric cars could reduce the jobs required for the powertrain by about one-third. This effect could be even greater if the production of important components for the BEVs, such as the battery, does not take place in Europe. Figure 3-3: Importance of vehicle production for employment in Europe Share of employees in value-added chain of vehicle production as a percentage of total employees, 2017
Source: Eurostat (2020); OECD (2018); authors’ calculations
Roughly 5.7 percent of all employment within the EU 28 was connected with the global demand for vehicles. The importance of the industry for national economies varies widely (Figure 3-3). In Greece, for example, only one out of every hundred jobs is connected to vehicle production. In the Czech Republic, by contrast, it is almost every seventh job. Vehicle production has the greatest relative importance for the States in Central and Eastern Europe where automakers and suppliers located a comparatively large number of factories after the fall of the Iron Curtain. Among the EU-15 countries, Germany stands out with its high proportion of employees depend-ent on vehicle construction. The share of such employees as a percentage of the entire work-force is below average in France and Italy. This is due to the fact that the manufacturers from

Synthetic fuels: potential for Europe
20
these two traditional automotive countries expanded capacities in the acceding countries dur-ing the eastern expansion of the EU, since the range of their products is focused on smaller vehicles and the customers in these segments react relatively sensitively to price increases. However, both countries fall among the largest producers in terms of the construction of other vehicles such as ships, aircraft and trains. Germany, Spain, the UK, Italy and France account for over 80 percent of the direct manufacture of other vehicle production in Europe.

Synthetic fuels: potential for Europe
21
4 The market potential for equipment to produce PtX
If the currently planned emission reduction targets and the properties of the different forms of energy storage are used as the basis, it is possible to anticipate substantial global demand for Power-to-X (PtX) energy carriers. This need for PtX energy carriers will lead to corresponding demand for equipment and plants to produce both hydrogen and liquid synthetic (Power-to-Liquids, PtL) or gaseous (Power-to-Gas, PtG) downstream products. Under the assumption that PtX technologies can be used not only in transport, but also in other application areas such as heat generation and industry, it is possible to estimate the orders of magnitude for PtX applica-tions in scenarios that are based on energy demand calculations by the OECD and the IEA.
Figure 4-1: Reference scenario for needs related to PtX capacities and investments Calculations on the basis of global energy demand forecasts (OECD/IEA)
Source: Bothe et. al. (2018)
For a reference scenario in the middle, where the PtX market in 2050 corresponds to roughly half of the crude oil market today, PtX demand will increase to roughly 20,000 TWh per year. In order to cover this demand, roughly 8,000 GW must be installed worldwide at plants for the production of PtX, i.e. for the conversion of electricity. The annual need for investments would total roughly EUR 215 billion (Figure 4-1). That is just under 30 percent of today’s investments in the entire oil and gas sector. This does not include investments in the expansion of plants or
◼ The global market for electrolysers, the most important part in the production of hydro-gen and synthetic liquid or gaseous downstream products, has approximately doubled over the last 20 years. However, this growth has taken place outside of Europe.
◼ Half of all globally produced machines, equipment and plants come from Europe today, and this includes the synthesis systems for the production of PtX energy carriers.
◼ Equipment and plants with a value of EUR 215 billion could be produced each year if investments in equipment and plants for PtX production are ramped up. This offers great opportunities for European machine construction and plant engineering as the largest exporter of such machines, equipment and plants today.
20,000 TWh
8,000 GW
€215 billion
Global annual PtX demand
Need for plant
capacities
Annual investment
costs
Synthetic fuels: potential for Europe
22
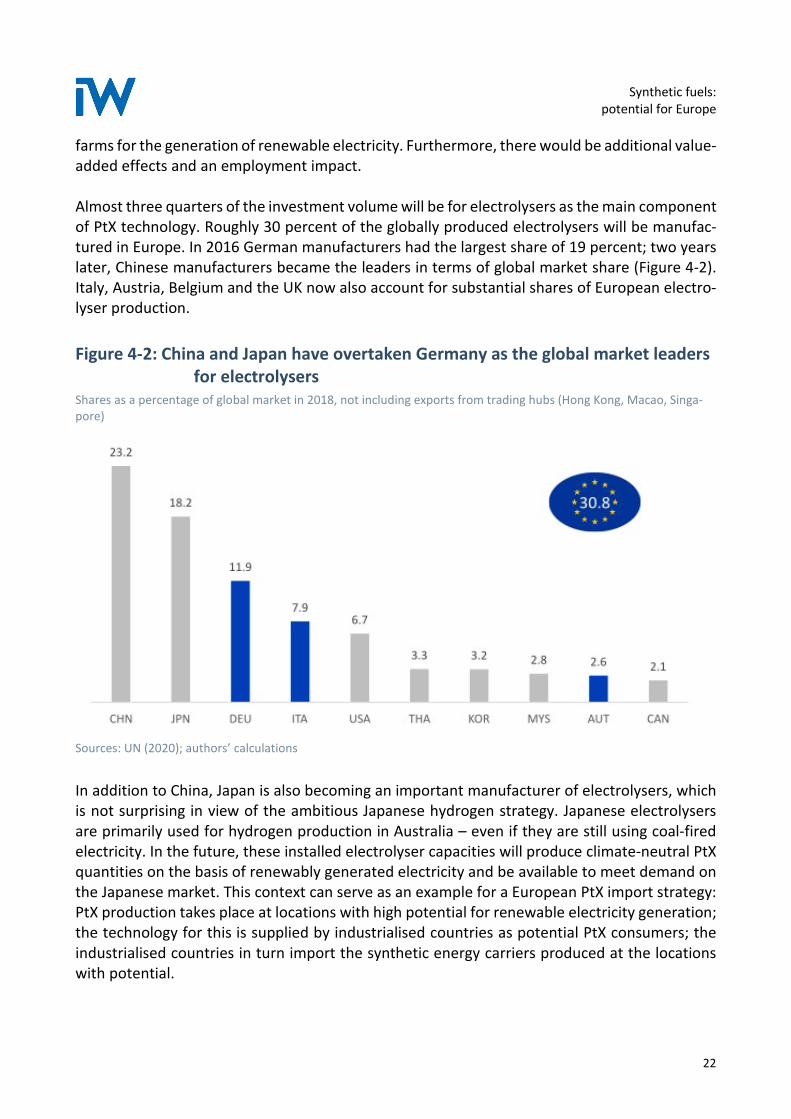
farms for the generation of renewable electricity. Furthermore, there would be additional value-added effects and an employment impact. Almost three quarters of the investment volume will be for electrolysers as the main component of PtX technology. Roughly 30 percent of the globally produced electrolysers will be manufac-tured in Europe. In 2016 German manufacturers had the largest share of 19 percent; two years later, Chinese manufacturers became the leaders in terms of global market share (Figure 4-2). Italy, Austria, Belgium and the UK now also account for substantial shares of European electro-lyser production.
Figure 4-2: China and Japan have overtaken Germany as the global market leaders for electrolysers
Shares as a percentage of global market in 2018, not including exports from trading hubs (Hong Kong, Macao, Singa-pore)
Sources: UN (2020); authors’ calculations
In addition to China, Japan is also becoming an important manufacturer of electrolysers, which is not surprising in view of the ambitious Japanese hydrogen strategy. Japanese electrolysers are primarily used for hydrogen production in Australia – even if they are still using coal-fired electricity. In the future, these installed electrolyser capacities will produce climate-neutral PtX quantities on the basis of renewably generated electricity and be available to meet demand on the Japanese market. This context can serve as an example for a European PtX import strategy: PtX production takes place at locations with high potential for renewable electricity generation; the technology for this is supplied by industrialised countries as potential PtX consumers; the industrialised countries in turn import the synthetic energy carriers produced at the locations with potential.

Synthetic fuels: potential for Europe
23
The longitudinal view (Figure 4-3) shows that the previous growth of the global market for elec-trolysers has taken place primarily outside of Europe. In the meantime, exports from Europe, which represent a good approximation for an international comparison of global market events, grew for a little while over the last 20 years, but are now again on the level at the beginning of the 2000s. The global market overall has doubled since then. The next few years will show the extent to which different national hydrogen strategies are already driving up the figures. Then it will be decided which regions can connect to which PtX export destinations and whether EU producers – in a similar way to Japanese producers in Australia – can supply electrolysers to corresponding locations with large renewable energy potential, for example in North Africa. The European Africa strategy2, for example, could be a catalyst for such an international partnership in the area of climate protection.
Figure 4-3: The global market for electrolysers is growing outside of Europe Global exports of electrolysers over the course of time, not including trading hubs (Hong Kong, Macao, Singapore)
Sources: UN (2020); authors’ calculations
2 “Towards a Comprehensive Strategy with Africa”, Link: https://ec.europa.eu/international-partnerships/sys-
tem/files/communication-eu-africa-strategy-join-2020-4-final_en.pdf
0
200
400
600
800
1000
1200
1400
2000 2001 2002 2003 2004 2005 2006 2007 2008 2009 2010 2011 2012 2013 2014 2015 2016 2017 2018
Mill
ion
US
dolla
r
World not incl. trading hubs EU-28 DEU
The global market for electrolysers has doubled over the last twenty years.
Electrolyser exports from Europe are on the level they were twenty years ago.

Synthetic fuels: potential for Europe
24
Since the market for PtX equipment and plants is still relatively small, major changes can occur in a short period of time. This also means that it is a very dynamic market with intense interna-tional competition. If it is assumed that demand will increase several times over on account of the development outlined above, it is important for the manufacturers of electrolysers to secure market shares now and establish themselves in regions with high production potential. The expected ramp-up of demand for PtX equipment and plants should bring about a sharp rise in the production of electrolysers. If there is an annual global investment volume of EUR 215 billion (average from 2020 to 2050) and global market shares remain the same, an annual pro-duction volume of just under EUR 50 billion is conceivable for electrolysers in Europe (Figure 4-4). Figure 4-4: Production potential for electrolysers with ramp-up of PtX Expected annual production of electrolysers from 2020 onwards in EUR billions
Sources: UN (2020); authors’ calculations
Policy frameworks and the funding conditions for producing hydrogen will determine which re-gions can secure shares of the rapidly growing electrolyser production volumes in the future. The EU Commission plans an electrolysis capacity of at least 40 gigawatts by 2030 in its hydrogen strategy as part of the Green Deal. This alone will stimulate demand for electrolysers in Europe.

Synthetic fuels: potential for Europe
25
Figure 4-5: Almost half of the machines, equipment and plants produced around the world in 2018 come from Europe.
Shares of capital goods in plant engineering as a percentage of global market in 2018, global market shares not includ-ing exports from trading hubs (Hong Kong, Macao, Singapore)
Sources: UN (2020); authors’ calculations
Europe is the location for almost half of the global production in machine construction and plant engineering, with the other components of the conversion technologies required for the pro-duction of synthetic fuels falling in this category, also includes equipment for CO2 capture by means of direct air capture. Since only the conversion of renewable electricity to liquid and gas-eous energy carriers (PtX) is being considered, investments in plants to generate electricity from renewable energies would be added to this and have an additional positive impact on added value and employment. Germany has the highest global market share of any individual country at 16.5 percent, just ahead of China (13.1 percent). Japanese companies are also very active in this area (10.6 percent). The most important European manufacturers, apart from Germany, are located in Italy, the Netherlands, the UK, France and Belgium (Figure 4-5).

Synthetic fuels: potential for Europe
26
Figure 4-6: Production potential of other equipment and plants for making PtX Expected annual production of other PtX equipment and plants from 2020 onwards in EUR billions
Sources: OECD (2020); authors’ calculations
A ramp-up of PtX technologies would increase the average annual production volume for these components in European equipment and plant construction to EUR 27.4 billion (Figure 4-6). This applies under the assumption that global market shares will remain unchanged relative to today and the equipment and plant parts necessary for PtX conversion will be spread out across the various global production locations in roughly the same proportions as plant engineering over-all. A completely different distribution of global market share could also result for individual components in the event of sharply rising demand. Accordingly, there are opportunities for Eu-ropean manufacturers to secure market shares early on.

Synthetic fuels: potential for Europe
27
5 New future-oriented jobs in European machine con-struction and plant engineering with PtX technologies
Based on estimates for global PtX demand and market potential, an input-output analysis can be used to determine the impact that ramping up PtX production will have on the European economy. It is possible to outline the direct value-added effects and employment impact on European machine construction and plant engineering, on suppliers indirectly, and that induced by the additional income and consumption effect triggered as a result. This analysis allows for the quantification of potential for the economic location of Europe and for a breakdown by country in the EU-28. Major investments around the world in power plants for solar electricity and wind energy as well as in the plants for PtX production are needed for the production and conversion of renew-able energy in liquid and gaseous PtX energy carriers. A study by the Cologne Institute for Eco-nomic Research (IW Köln) and Frontier Economics (Bothe et al., 2018) has determined that the increase in demand for PtX conversion equipment and plants for Germany alone has the poten-tial to create around 470,000 jobs and EUR 36.4 billion in value added if German machine con-struction and plant engineering can retain its current market shares in the production of these capital goods.
◼ The European economy could enjoy EUR 80 billion in additional annual value added by producing PtX equipment and plants and exporting them to non-European regions with potential for renewable energies.
◼ The production and the export of PtX equipment and plants has the potential to create 1.2 million jobs in Europe.
◼ The EU has the opportunity to position itself as a leading supplier of sustainable technol-ogies.

Synthetic fuels: potential for Europe
28
There are also significant value-added effects and an employment impact for other European economies. These effects will result from companies’ in-house production of machines, equip-ment and plants (direct effects), the stimulated demand in machine construction in Germany and abroad for intermediate consumption (indirect effects) and the rise in income of employees at these companies, due to additional demand for consumer goods (induced effects).3 The results are calculated and reported on the basis of the latest data on market shares of the production of electrolysers and other capital goods in plant engineering as well as updated data on international value-added chains and employment figures for all countries in the EU-28. It has become clear that all European countries would profit substantially from rising demand for PtX equipment and plants. European producers will enjoy major opportunities as technology suppliers, even if these technologies are used at locations outside of Europe with high RES po-tential. In this way, the ramping-up of corresponding technologies can also contribute to secur-ing Europe’s status as an industrial, innovative and economic location.
3 Indirect and induced multiplier effects are calculated with the aid of an analysis of the input-output table on the
basis of official data from the OECD. The work with input-output tables and their analysis is one of the most fre-quently applied methods in empirical economic research today. The input-output tables constitute a comprehen-sive information system that provides a detailed representation, in particular of the goods-related connections in the economy for the production of goods and services. This information can be used in diverse ways for analytical and forecasting purposes. International organisations and the European Union use the results of input-output analyses to judge the effect of certain measures. Input-output analyses are often intended to judge the conse-quences of political measures. Furthermore, input-output tables can be used for forecasting economic develop-ment.

Synthetic fuels: potential for Europe
29
Figure 5-1: Direct, indirect and induced effects for manufacturers of equipment and plants to produce PtX in Europe
Graphic
Source: IW Consult’s own graphic
The economic effects of the demand for PtX technology in Europe can be estimated on the basis of today’s intermediate consumption relationships. To put it simply, the following calculations assume that the current market relationships and multiplier effects will also continue to apply in the future. If there is an annual investment volume of EUR 215 billion in total and EUR 75.8 billion is attributed to capital goods in machine production and plant engineering from Europe, a substantial effect on value added and employment is to be expected. The analysis of the value-added effects reflects the value added in the respective domestic country. Value added consists mainly of wages and salaries paid to employees, depreciation and amortisation of tangible and intangible capital goods and company profits. In the case of manufacturers of PtX equipment and plants, the direct value added is achieved by the manufacturers of the equipment in ma-chine production. The value-added effects of suppliers are reflected in the indirect effect. This also includes the intermediate consumption of European companies that work as suppliers for foreign manufac-turers of PtX equipment and plants. The wage and salary payments contained in the value added also boost demand for consumer goods of employees in these companies. Domestic consumer demand in Europe is largely covered by domestic or European companies. The further effects of value added resulting from this are recorded in the induced effect (Figure 5-1).
2ENTWURFfrontier economics
Eigene Darstellungen
Providesemployment
Generates income
Triggers demandfor investment and
private consumption goods
direct
indirect induced
Providesemployment
Providesemployment
Generates income
Intermediate consumption
Manufacturer of machines and
equipment for PtXproduction
Intermediate consumption
Generates income
Synthetic fuels: potential for Europe
30
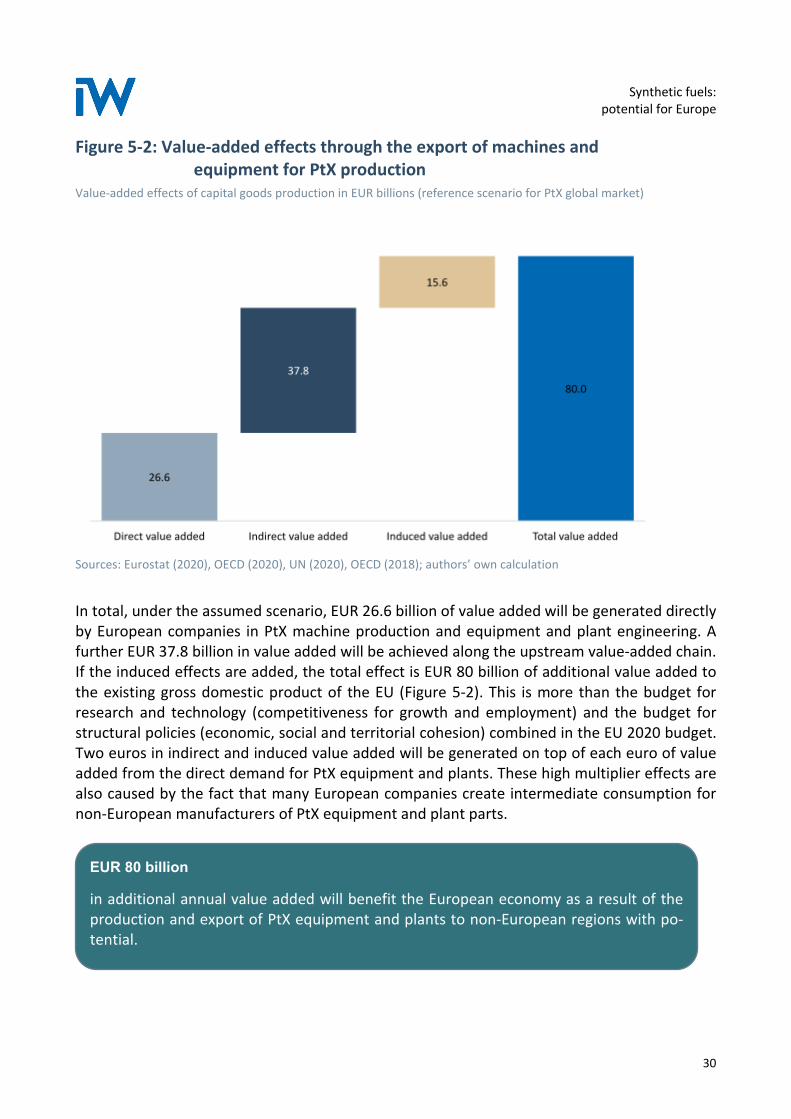
Figure 5-2: Value-added effects through the export of machines and equipment for PtX production
Value-added effects of capital goods production in EUR billions (reference scenario for PtX global market)
Sources: Eurostat (2020), OECD (2020), UN (2020), OECD (2018); authors’ own calculation
In total, under the assumed scenario, EUR 26.6 billion of value added will be generated directly by European companies in PtX machine production and equipment and plant engineering. A further EUR 37.8 billion in value added will be achieved along the upstream value-added chain. If the induced effects are added, the total effect is EUR 80 billion of additional value added to the existing gross domestic product of the EU (Figure 5-2). This is more than the budget for research and technology (competitiveness for growth and employment) and the budget for structural policies (economic, social and territorial cohesion) combined in the EU 2020 budget. Two euros in indirect and induced value added will be generated on top of each euro of value added from the direct demand for PtX equipment and plants. These high multiplier effects are also caused by the fact that many European companies create intermediate consumption for non-European manufacturers of PtX equipment and plant parts.
EUR 80 billion
in additional annual value added will benefit the European economy as a result of the production and export of PtX equipment and plants to non-European regions with po-tential.
Synthetic fuels: potential for Europe
31
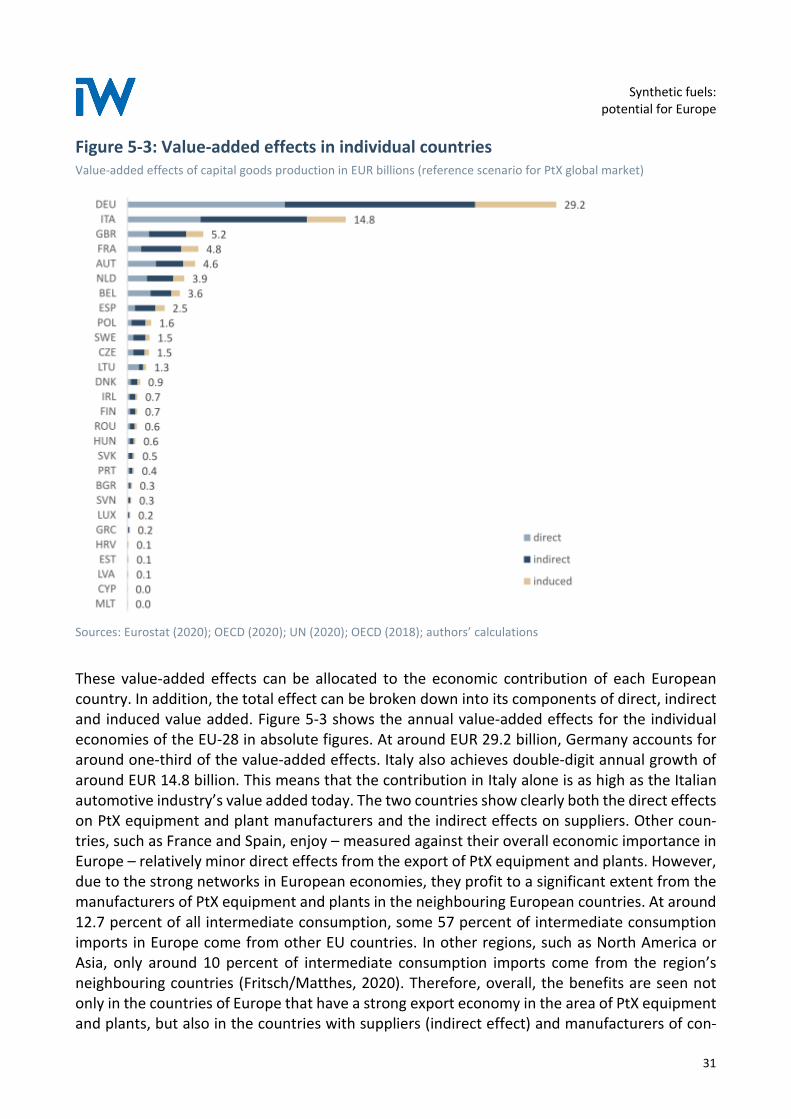
Figure 5-3: Value-added effects in individual countries Value-added effects of capital goods production in EUR billions (reference scenario for PtX global market)
Sources: Eurostat (2020); OECD (2020); UN (2020); OECD (2018); authors’ calculations
These value-added effects can be allocated to the economic contribution of each European country. In addition, the total effect can be broken down into its components of direct, indirect and induced value added. Figure 5-3 shows the annual value-added effects for the individual economies of the EU-28 in absolute figures. At around EUR 29.2 billion, Germany accounts for around one-third of the value-added effects. Italy also achieves double-digit annual growth of around EUR 14.8 billion. This means that the contribution in Italy alone is as high as the Italian automotive industry’s value added today. The two countries show clearly both the direct effects on PtX equipment and plant manufacturers and the indirect effects on suppliers. Other coun-tries, such as France and Spain, enjoy – measured against their overall economic importance in Europe – relatively minor direct effects from the export of PtX equipment and plants. However, due to the strong networks in European economies, they profit to a significant extent from the manufacturers of PtX equipment and plants in the neighbouring European countries. At around 12.7 percent of all intermediate consumption, some 57 percent of intermediate consumption imports in Europe come from other EU countries. In other regions, such as North America or Asia, only around 10 percent of intermediate consumption imports come from the region’s neighbouring countries (Fritsch/Matthes, 2020). Therefore, overall, the benefits are seen not only in the countries of Europe that have a strong export economy in the area of PtX equipment and plants, but also in the countries with suppliers (indirect effect) and manufacturers of con-

Synthetic fuels: potential for Europe
32
sumer goods and services for private households (induced effect). In total, the value-added ef-fects in Europe correspond to the entire current gross domestic product of the Baltic states Es-tonia, Latvia and Lithuania. Figure 5-4: Relative value-added effects in countries Relative national importance as a percentage of GDP (reference scenario for PtX global market)
Sources: Eurostat (2020); OECD (2020); UN (2020); OECD (2018); authors’ calculations
In absolute figures, many smaller European countries only have value-added effects in the three-digit million range. Looking at the relative contribution compared to the respective coun-try’s GDP provides an indication of the relative national importance a PtX ramp-up would have, as the considerable differences in the size and economic power of the countries are thus re-duced to a common denominator. In this case, Lithuania is at the top, followed by Austria. Ger-many and Italy are behind them and roughly on the same level in this analysis, while France’s PtX value-added effects account for just 0.2 percent (Figure 5-4). Overall, the PtX investments in Europe have a GDP effect of 0.6 percentage points. For comparison: In 2019, real gross do-mestic product in the EU grew by around 1.3 percent. Thus, a successful export economy for PtX equipment and plants could cause real GDP to grow about 50 percent faster.

Synthetic fuels: potential for Europe
33
Figure 5-5: Employment effects through the export of machines and equipment for PtX production
Employment effects in thousand persons (reference scenario for global PtX market)
Sources: Eurostat (2020); OECD (2020); UN (2020); OECD (2018); authors’ calculations
The export of PtX equipment and plants at the orders of magnitude mentioned above would generate considerable employment effects. Almost 350,000 additional people would be em-ployed directly in the production of electrolysers and other PtX equipment and plants. A further 600,000 employees would be needed for the production of the intermediate consumption and the supplier network connected with it. The total effect, including the employment effects trig-gered by the additional consumer demand, amounts to 1.2 million additional employees in Eu-rope (Figure 5-5). This corresponds to the number of employees in the entire chemical industry in Europe.
1.2 million new jobs
The production and export of PtX equipment and plants will create great potential for employment in Europe.

Synthetic fuels: potential for Europe
34
Figure 5-6: Employment effects in individual countries Employment effects in thousand persons (reference scenario for global PtX market)
Sources: Eurostat (2020); OECD (2020); UN (2020); DCD (2018); authors’ calculations
The absolute effect is greatest as a whole in Germany, with just under 400,000 additional em-ployees, again followed by Italy with just over 200,000 employed persons. The United Kingdom comes in third place, ahead of France and Austria (Figure 5-6). The close intermediate consump-tion relationships that manufacturers of PtX equipment and plants have with other European sectors mean that the indirect employment effects in all countries, with the exception of Swe-den, will be higher than the direct employment effects from machine construction and plant engineering. In total, there will be around 1.77 employees in the supplier industries for every additional job at PtX equipment and plants manufacturers. If the employment impact of the induced effect is also taken into account, each job created directly in equipment and plant man-ufacture for PtX production will provide about 2.5 additional jobs in the intermediate consump-tion network and through additional consumption.

Synthetic fuels: potential for Europe
35
Figure 5-7: Relative share of employment effects by country Relative national importance as a percentage of all employees (reference scenario for PtX global market)
Sources: Eurostat (2020); OECD (2020); UN (2020); OECD (2028); authors’ calculations
In terms of employees, the relative shares of employment in each country also show a similar picture as when value-added effects are considered in relative terms. The share of employment in Europe as a whole is around 0.5 percent. The production of PtX equipment and plants and the components and parts required for them is thus somewhat less employment-intensive than the economy as a whole (Figure 5-7). Nevertheless, the production of PtX equipment and plants offers enormous opportunities for Europe to increase employment. The roughly 1.2 million ad-ditional jobs represent approximately 8 percent of total unemployment in the EU. Overall, if there is EUR 215 billion in annual investment demand for PtX equipment and plants, this will result in potential of EUR 80 billion in value added and 1.2 million jobs in Europe. The EU has the opportunity to position itself as a leading supplier of sustainable technologies.

Synthetic fuels: potential for Europe
36
6 Development of sustainable value-added structures in regions outside of Europe
Especially in emerging and developing countries, there is great potential for the export of elec-tricity from renewable energies and thus for the production of electricity-based energy carriers. Good international options for PtX production locations include the Middle East and North Af-rica (also called the MENA region), Patagonia and Australia. From a European perspective, Afri-can and Middle Eastern countries are attractive as exporters due to the good location conditions for the production of renewable energies and their geographic proximity to Europe. These coun-tries have significant potential for value added and employment due to the use of their location advantages. The estimates for global PtX demand can be used as the basis to calculate the most up-to-date data on the economic leverage effects for these countries. Many locations as for example in North Africa, are substantially more sun-intensive than Euro-pean locations and thus offer great potential for cheap electricity production from solar energy. Furthermore, there are many coastal regions with high wind power potential (Figure 6-1). The potential solar locations also include countries which are major producers of fossil fuels today. If they become involved in the production of electricity-based PtX energy carriers, it would be possible to compensate for future declines in sales of oil and gas in these countries, which is an important factor for the acceptance of the climate targets set at the global level.
◼ Advantageous potential for PtX production can be found at locations outside of Europe due to the high availability of wind, sun and space at those locations, e.g. in North Africa, the Middle East, or in Australia and Patagonia.
◼ 346,000 highly productive jobs can be created at the PtX production locations serving one-fiftieth of global PtX demand potential. Job productivity is around ten times as high as, for example, the average today in the entire MENA region (Middle East and North Africa).
◼ The economic strengthening of electricity generation from renewable energies in poten-tial PtX production countries could also give an important boost to the development of resource-conserving and climate-neutral energy supply systems in these countries.

Synthetic fuels: potential for Europe
37
Figure 6-1: PTX: Advantageous production potential lies outside the EU Source: Authors’ chart based World Bank, 2020b; World Bank, 2020c
In addition to the advantageous location conditions that these countries have, there is also good reason to develop the PtX economy in these regions, because of the opportunity it presents to have a major positive impact on economic performance through the export of PtX. For the most part, the regions in question are emerging and developing countries that can substantially profit from an increase in foreign direct local investment in PtX plants. Local development in the PtX economy could greatly accelerate economic growth in these regions and thus contribute to im-proving living conditions in these countries. In addition, countries that are still among the major oil-exporting states have an opportunity to make their economies more sustainable and ecolog-ical without affecting national value added, a factor that should not be neglected when it comes to international acceptance of the climate target agreements. The locations with high potential for solar and wind energy can thus participate in the global demand for liquid and gaseous PtX energy carriers by acting as producers and exporters on the world market for PtX energy carriers. As with the effects described above, we assume global demand for liquid and gaseous energy carriers of 20,000 TWh per year. Downstream effects exemplify the economic impact of operating PtX plants meeting one fiftieth of the global PtX demand,4 i.e. process around 400 TWh. This will result in liquid and gaseous energy carriers with a production value of around EUR 64 billion.5
4 The underlying assumption is that the future global PtX demand of around 20,000 TWh will be covered equally by
just under 50 countries – 400 TWh produced per nation. This assumption is for illustrative purposes only and can be adjusted iteratively.
5 PtX costs of EUR 160 per MWh are initially assumed for the further calculations, based on a study by Agora Verkehrswende, Agora Energiewende and Frontier Economics (2018). Significant cost reductions can be expected as the market scales up.
Territories with high
potential for wind energy
Territories with high
potential for
Countries/regions with high energy needs

Synthetic fuels: potential for Europe
38
Naturally, estimates on the economic effects of new industries are subject to considerable un-certainty. We assume that PtX synthesis can generate effects similar to those in the crude oil processing sector. If similar national intermediate consumption relationships, employment de-velopments and value-added intensities are assumed, it is possible to estimate the magnitude of the economic effects of PtX production. Figure 6-2: Economic effects for a potential PtX production country Production and value added in one year, national effects per country for PtX capacities of 400 TWh (2 percent of global PtX demand potential)
Source: OECD (2018, 2020); authors’ calculations
Figure 6-2 shows an example of the large economic leverage effect of operating PtX conversion plants for a country with potential PtX production volume of around 400 TWh. In total, almost 350,000 new long-term jobs can be created locally, generating around EUR 32 billion in value added every year. In addition, the national production value will be increased by around EUR 112 billion per year. The national value added consists of the direct value added for the PtX plant operators in the amount of EUR 9.7 billion and an indirect value added for the supplier compa-nies in the upstream value-added chain to the amount of around EUR 22.3 billion. The estimate of national indirect value-added effects is a conservative approximation, as it was based on cur-rent value-added chains and value-added depths. For example, it can be assumed that the na-tional value-added intensity for the generation of electricity from solar and wind energy is sig-nificantly higher than is the case in power generation today. Since no fossil raw materials have to be imported as intermediate consumption for generating electricity, it can be expected that the national value added in the energy sector will be higher.

Synthetic fuels: potential for Europe
39
Even on the basis of the conservative assumptions used for this calculation, the total value added of around EUR 32 billion per year represents enormous economic potential for emerging and developing countries. This is roughly equivalent to the aggregate GDP of the 32 countries with the lowest GDP in the world. In addition to the roughly 14,000 jobs created directly in PtX production, another 332,600 jobs would be added at domestic suppliers and service providers. This means that there are approx-imately 24 additional jobs at supplier companies for every single job in direct PtX production. The newly created jobs have a particularly high productivity, averaging around EUR 92,500 per person per year. Even if the capital-intensive direct PtX production is excluded, the expected average productivity of employees at companies in the upstream value-added chain is still around EUR 67,000. These are therefore mainly well-paid, productive jobs that are being cre-ated. For comparison: The average GDP per capita in the Middle East and North Africa was around EUR 6,800 in 2018. This would create jobs here with around ten times higher productiv-ity per capita than is currently average in the MENA region.
In addition to the positive effects from the operation of the PtX plants, there are also one-off effects for the construction and installation of the plants and the power stations for generating renewable energy sources. Therefore, individual countries have a high economic incentive, both in the short and long term, to use their own locational advantages for the production of liquid and gaseous PtX energy carriers.
346,600 highly productive jobs in an average PtX production country
The productivity of the new jobs created in connection with PtX production will be around ten times higher than the average in the MENA region.
Synthetic fuels: potential for Europe
40
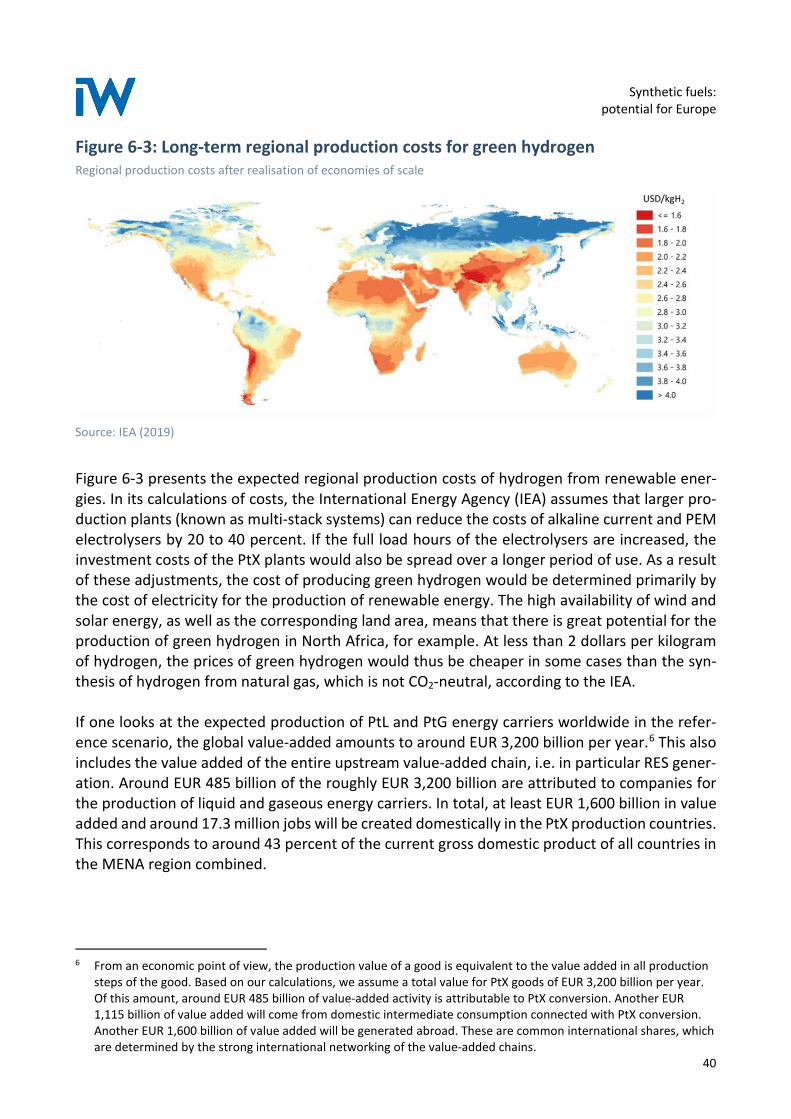
Figure 6-3: Long-term regional production costs for green hydrogen Regional production costs after realisation of economies of scale
Source: IEA (2019)
Figure 6-3 presents the expected regional production costs of hydrogen from renewable ener-gies. In its calculations of costs, the International Energy Agency (IEA) assumes that larger pro-duction plants (known as multi-stack systems) can reduce the costs of alkaline current and PEM electrolysers by 20 to 40 percent. If the full load hours of the electrolysers are increased, the investment costs of the PtX plants would also be spread over a longer period of use. As a result of these adjustments, the cost of producing green hydrogen would be determined primarily by the cost of electricity for the production of renewable energy. The high availability of wind and solar energy, as well as the corresponding land area, means that there is great potential for the production of green hydrogen in North Africa, for example. At less than 2 dollars per kilogram of hydrogen, the prices of green hydrogen would thus be cheaper in some cases than the syn-thesis of hydrogen from natural gas, which is not CO2-neutral, according to the IEA. If one looks at the expected production of PtL and PtG energy carriers worldwide in the refer-ence scenario, the global value-added amounts to around EUR 3,200 billion per year.6 This also includes the value added of the entire upstream value-added chain, i.e. in particular RES gener-ation. Around EUR 485 billion of the roughly EUR 3,200 billion are attributed to companies for the production of liquid and gaseous energy carriers. In total, at least EUR 1,600 billion in value added and around 17.3 million jobs will be created domestically in the PtX production countries. This corresponds to around 43 percent of the current gross domestic product of all countries in the MENA region combined.
6 From an economic point of view, the production value of a good is equivalent to the value added in all production
steps of the good. Based on our calculations, we assume a total value for PtX goods of EUR 3,200 billion per year. Of this amount, around EUR 485 billion of value-added activity is attributable to PtX conversion. Another EUR 1,115 billion of value added will come from domestic intermediate consumption connected with PtX conversion. Another EUR 1,600 billion of value added will be generated abroad. These are common international shares, which are determined by the strong international networking of the value-added chains.

Synthetic fuels: potential for Europe
41
Depending on the country, the additional regional value added and employment can open up new value-added chains or (partially) substitute existing value-added chains related to the ex-traction of fossil fuels. This means that existing logistics and transport systems for oil and gas can also be used for the transport of green liquid energy carriers and gases. Figure 6-4 shows the countries with a significant global market share in the extraction of fossil fuels in Europe, Asia and Africa, some of which also have very good location conditions for producing liquid en-ergy carriers from wind and solar energy. For these countries, the transitioning of their energy industries toward climate neutrality thus offers the potential to continue offering energy carri-ers on the world market in the future and thus to secure corresponding living conditions in their countries, over the long term. Figure 6-4: Selected producers of crude oil and natural gas in Africa and Asia As a percentage of total global production in 2019
Source: BP (2020); authors’ calculations
At the same time, a rapid and sustainable integration of countries which are still extracting fossil fuels into the value-added chain of renewable energy carriers is essential for a positive effect on the global climate. In order to reduce global greenhouse gas emissions, it is also important
AngolaCrude oil: 1.5%
NigeriaCrude oil: 2.3%Natural gas: 1.2%
AlgeriaCrude oil: 1.4%Natural gas: 2.2%
NorwayCrude oil: 1.7%Natural gas: 2.9% Russia
Crude oil: 12.7%Natural gas: 17.0%
KazakhstanCrude oil: 2.0%Natural gas: 0.6%
EgyptCrude oil: 0.7%Natural gas: 1.6%
Saudi Arabia Crude oil: 12.4%Natural gas: 2.8%
IranCrude oil: 3.6%Natural gas: 6.1%
IraqCrude oil: 5.2%Natural gas: 0.3%
KuwaitCrude oil: 3.2%Natural gas: 0.5%
U.A. Emirates Crude oil: 4.0%Natural gas: 1.6%
QatarCrude oil: 1.8%Natural gas: 4.5%
LibyaCrude oil: 1.3%Natural gas: 0.2%
Synthetic fuels: potential for Europe
42
that today’s producers of fossil fuels are presented with climate-neutral value-added alterna-tives. Overall, the immediate intensification of international cooperation between countries which can potentially supply PtX energy carriers and countries with demand for climate-neutral energy is not only sensible, but also necessary. In principle, adopting international cooperation approach – as described above – can trigger significant positive economic effects both in the regions with PtX demand and in the countries producing PtX. Boosting electricity generation from renewable energies economically in potential PtX produc-tion countries could also give an important boost to the development of the electricity mix in those countries. PtX production from renewable energy sources offers the energy sector in those countries the opportunity to export their products on the world market and thus open up additional sales markets. This could prove to be an important investment decision in favour of wind and solar power plants over conventional coal-fired power plants. According to calcula-tions by the World Bank (2020), the population of Africa and the Middle East will increase from around 1.6 billion today to more than 2.8 billion by 2050. Economic development associated with expected population growth will inevitably lead to a significant increase in the demand for energy and electricity in this region. Early exploitation of the existing potential for renewable energies in these countries could establish them as an alternative to the expansion of conven-tional power plants, which is likely to take place. This will allow the expected economic growth in these countries to be decoupled in good time from an increase in CO2 emissions.

Synthetic fuels: potential for Europe
43
Bibliography ACEA – European Automobile Manufacturers Association, 2019, Passenger car registrations:
+0.1% in 2018; -8.4% in December, https://www.acea.be/press-releases/article/passen-ger-car-registrations-0.1-in-2018-8.4-in-december [30.9.2020]
ACEA, 2020a, Alternative fuel vehicle registrations, https://www.acea.be/statistics/tag/cate-
gory/electric-and-alternative-vehicle-registrations [10.12.2020] ACEA, 2020b, Average age of the vehicle Fleet, https://www.acea.be/statistics/tag/category/av-
erage-vehicle-age [10.12.2020] Agora Verkehrswende, Agora Energiewende und Frontier Economics, 2018, Die zukünftigen Kos-
ten strombasierter synthetischer Brennstoffe [The Future Costs of Electricity-based Syn-thetic Fuels], Berlin
BCG – Boston Consulting Group / Prognos, 2018, Klimapfade für Deutschland [Climate Path for
Germany], https://bdi.eu/publikation/news/klimapfade-fuer-deutschland/ [21.10.2020] Bothe, David / Fritsch, Manuel / Lövenich , Andrea / Perner, Jens / Schaefer, Thilo, 2018, Syn-
thetische Energieträger – Perspektiven für die deutsche Wirtschaft und den internationa-len Handel, Studie im Auftrag von MEW (Mittelständische Energiewirtschaft Deutschland) [Synthetic Energy Sources – Prospects for the German Economy and International Trade, Study on behalf of the MEW], IWO (Institut für Wärme und Oeltechnik) and UNITI (Bun-desverband mittelständischer Mineralölunternehmen), Cologne
BP, 2020, Statistical Review of World Energy 2020, 69th edition,
https://www.bp.com/en/global/corporate/energy-economics/statistical-review-of-world-energy.html [30.9.2020]
Climate Action Tracker, 2019, https://climateactiontracker.org/data-portal/ [21.10.2020] EEA – European Environment Agency, 2020 National emissions reported to the UNFCCC and to
the EU Greenhouse Gas Monitoring Mechanism (V23), https://www.eea.europa.eu/data-and-maps/data/national-emissions-reported-to-the-unfccc-and-to-the-eu-greenhouse-gas-monitoring-mechanism-16 [10.12.2020]
Eurostat, 2020, Personenkraftwagen nach Art des Antriebs [Cars by Type of Drive] ROAD_EQS_CARPDA, https://ec.europa.eu/eurostat/de/data/database [30.9.2020] Fraunhofer IAO, 2018. ELAB 2.0 Wirkungen der Fahrzeugelektrifizierung auf die Beschäftigung
am Standort Deutschland [Impact of Vehicle Electrification on Employment in the Location of Germany]
Fritsch, Manuel / Matthes, Jürgen, 2020, On the relevance of global value chains and the intra-
european divison of labour. National Institute Economic Review, Vol. 252, R4-R18. doi:10.1017/nie.2020.16

Synthetic fuels: potential for Europe
44
Globenewswire, 2020, Outlook on Brazil’s Electric Vehicle (EV) Market, https://www.globenewswire.com/news-release/2020/01/24/1974767/0/en/Outlook-on-Brazil-s-Electric-Vehicle-EV-Market-2025-The-Market-is-Primarily-Driven-by-Attractive-Plug-in-Hybrid-Vehicle-Offers-and-Decreasing-EV-Prices.html [10.12.20]
IEA - International Energy Agency, 2019, The Future of Hydrogen, https://www.iea.org/re-
ports/the-future-of-hydrogen [30.9.2020] IW Consult GmbH, 2019, Cross border services in the internal market: an important contribution
to economic and social cohesion, Study on behalf of the European Economic and Social Committee (EESC), Brussels, Cologne
Prognos / Fraunhofer UMSICHT / DBFZ, 2018, Status und Perspektiven flüssiger Energieträger in
der Energiewende, Basel [Status and Prospects of Liquid Energy Carriers in the Energy Rev-olution]
Puls, Thomas, 2019, CO2 – Reduktion im Verkehr – Was kann Deutschland von Schweden lernen?
[CO2 Reduction in Transport – What Can Germany Learn from Sweden], https://www.iwkoeln.de/studien/iw-policy-papers/beitrag/thomas-puls-thilo-schaefer-was-kann-deutschland-von-schweden-lernen.html [19.10.2020]
SMEV – Society of Manufacturers of Electric Vehicles, 2020, E2W Sales – FY 18-19,
https://www.smev.in/productImage/for%20smev%20web%20sales%2018-19.pdf [10.12.20]
UN, 2020, UN Comtrade Database, https://comtrade.un.org [23.11.2020] VDA – Verband der Automobilindustrie, 2020, Europäischer Pkw-Markt 2019 leicht im Plus [Eu-
ropean Car Market Slightly Up in 2019], https://www.vda.de/de/presse/Pressemeldun-gen/200116-Europ-Pkw-markt-2019-leicht-im-plus.html [10.12.20]
World Bank, 2020, Population estimates and projections database [30.9.2020] World Bank, 2020a, Global Solar Atlas, https://globalsolaratlas.info/map [23.11.2020] World Bank, 2020b, Global Wind Atlas, https://globalwindatlas.info/ [23.11.2020]

Synthetic fuels: potential for Europe
45
List of figures
Figure 1: Additional jobs in Europe through the export of machines, equipment
and plants for producing electricity-based synthetic energy carriers (Power-to-X, PtX) .............................................................................................. 3
Figure 1-1: Global climate policy to date is headed toward missing the targets ...................... 4 Figure 1-2: EU-28 – Achievement of targets by sector.............................................................. 5 Figure 2-1: Production of liquid energy carriers from renewably generated electricity .......... 8 Figure 2-2: The strong position of zero-carbon liquid fuels ....................................................11 Figure 2-3: Slow fleet replacement in Eastern Europe in 2018 ...............................................12 Figure 3-1: Electric cars still scarce in Southern and Eastern Europe .....................................16 Figure 3-2: Importance of vehicle production for European supplier sectors ........................18 Figure 3-3: Importance of vehicle production for employment in Europe .............................19 Figure 4-1: Reference scenario for needs related to PtX capacities and investments ...........21 Figure 4-2: China and Japan have overtaken Germany as the global market leaders for
electrolysers ....................................................................................................22 Figure 4-3: The global market for electrolysers is growing outside of Europe .......................23 Figure 4-4: Production potential for electrolysers with ramp-up of PtX ................................24 Figure 4-5: Almost half of the machines, equipment and plants produced around the
world in 2018 come from Europe. ..................................................................25 Figure 4-6: Production potential of other equipment and plants for making PtX ..................26 Figure 5-1: Direct, indirect and induced effects for manufacturers of equipment and
plants to produce PtX in Europe .....................................................................29 Figure 5-2: Value-added effects through the export of machines and equipment for PtX
production ......................................................................................................30 Figure 5-3: Value-added effects in individual countries ..........................................................31 Figure 5-4: Relative value-added effects in countries .............................................................32 Figure 5-5: Employment effects through the export of machines and equipment for PtX
production ......................................................................................................33 Figure 5-6: Employment effects in individual countries ..........................................................34 Figure 5-7: Relative share of employment effects by country ................................................35 Figure 6-1: PTX: Advantageous production potential lies outside the EU ..............................37 Figure 6-2: Economic effects for a potential PtX production country ....................................38 Figure 6-3: Long-term regional production costs for green hydrogen ...................................40 Figure 6-4: Selected producers of crude oil and natural gas in Africa and Asia ......................41