ivy gap: an anatomic transcriptional atlas of glioblastomatciasept2016.pdf · ivy glioblastoma...
TRANSCRIPT

Ivy GAP: An Anatomic Transcriptional Atlas of
GlioblastomaNameeta Shah, Ph.D.
Ivy Glioblastoma Atlas Project (Ivy GAP)
http://glioblastoma.alleninstitute.org/
NEUROSCIENCE INSTITUTE
https://ivygap.swedish.org/
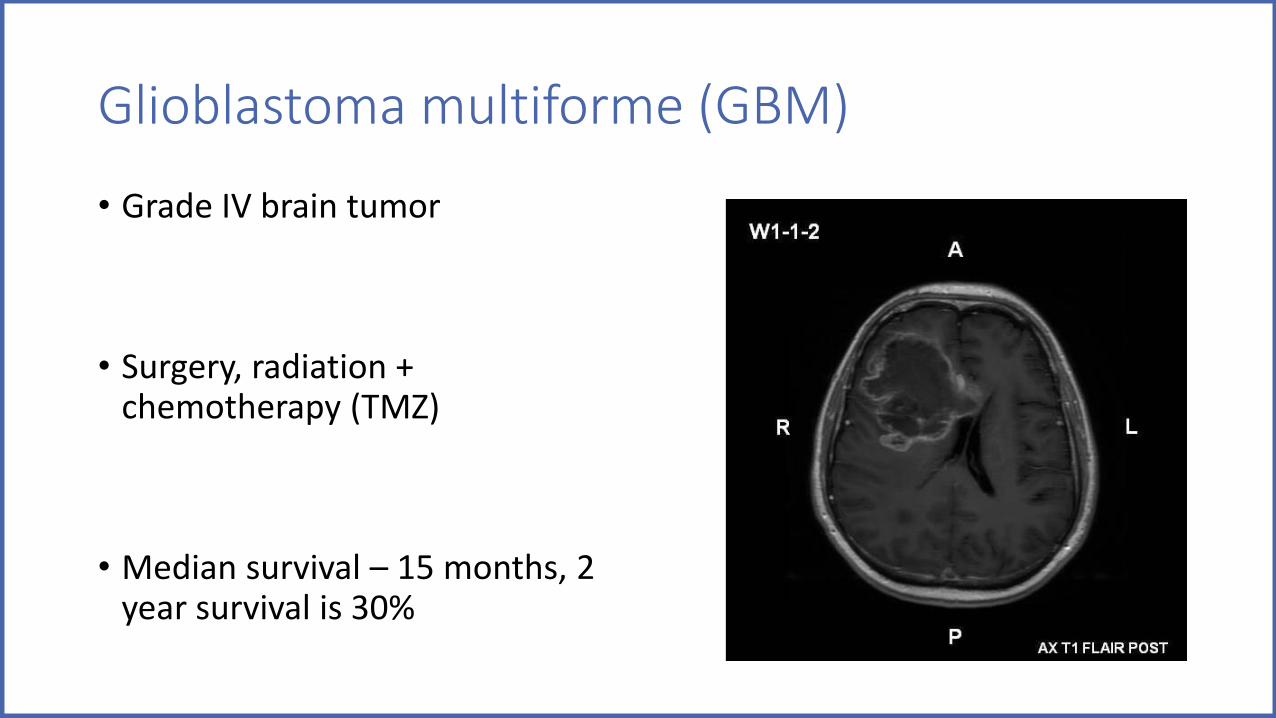
Glioblastoma multiforme (GBM)
• Grade IV brain tumor
• Surgery, radiation + chemotherapy (TMZ)
• Median survival – 15 months, 2 year survival is 30%

Ivy Glioblastoma Atlas Project (Ivy GAP)
• GBM treatment challenges• Inter and intra tumor heterogeneity• GBM stem cells

Ivy Glioblastoma Atlas Project (Ivy GAP)
• Study Goals
• Molecular characterization of1. GBM anatomic features
• Glioblastoma, WHO grade IV —Glioblastomas are densely cellular, pleomorphic tumors with mitotic activity and either microvascular proliferation or necrosis, or both.
2. GBM stem-like cells• Community resource

Ivy Glioblastoma Atlas Project (Ivy GAP)
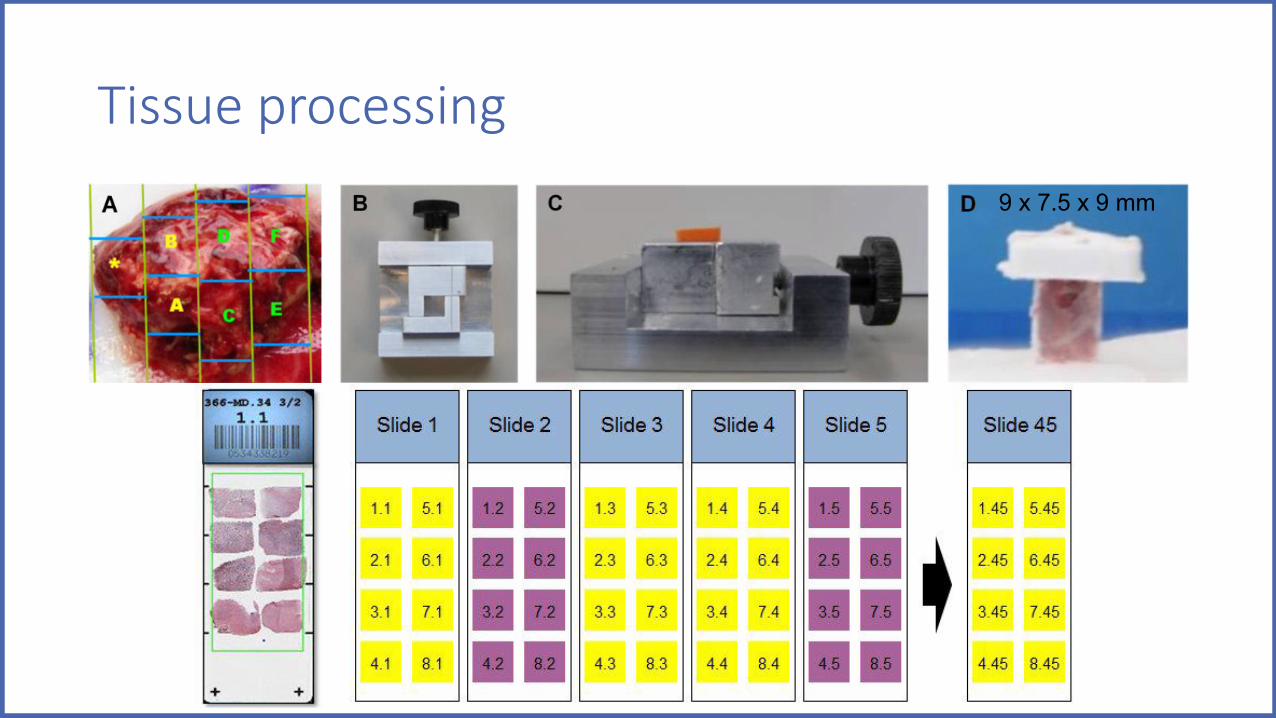
Tissue processing9 x 7.5 x 9 mm
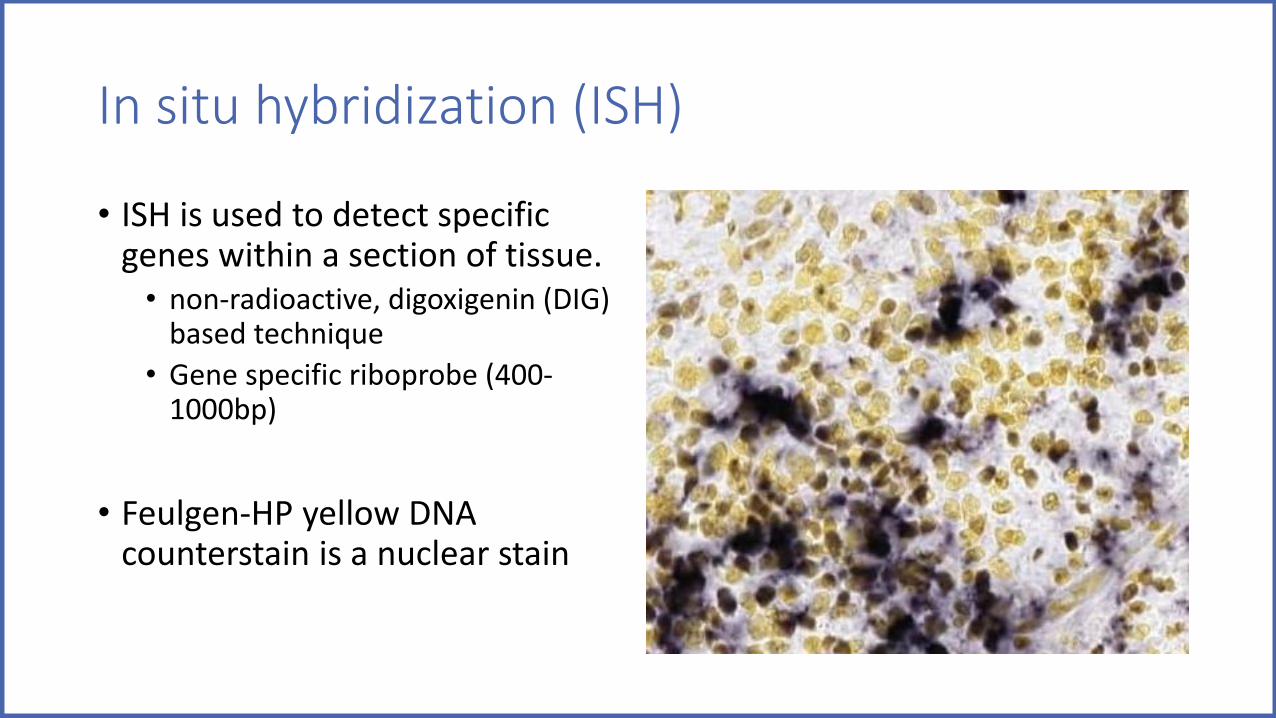
In situ hybridization (ISH)
• ISH is used to detect specific genes within a section of tissue.
• non-radioactive, digoxigenin (DIG) based technique
• Gene specific riboprobe (400-1000bp)
• Feulgen-HP yellow DNA counterstain is a nuclear stain
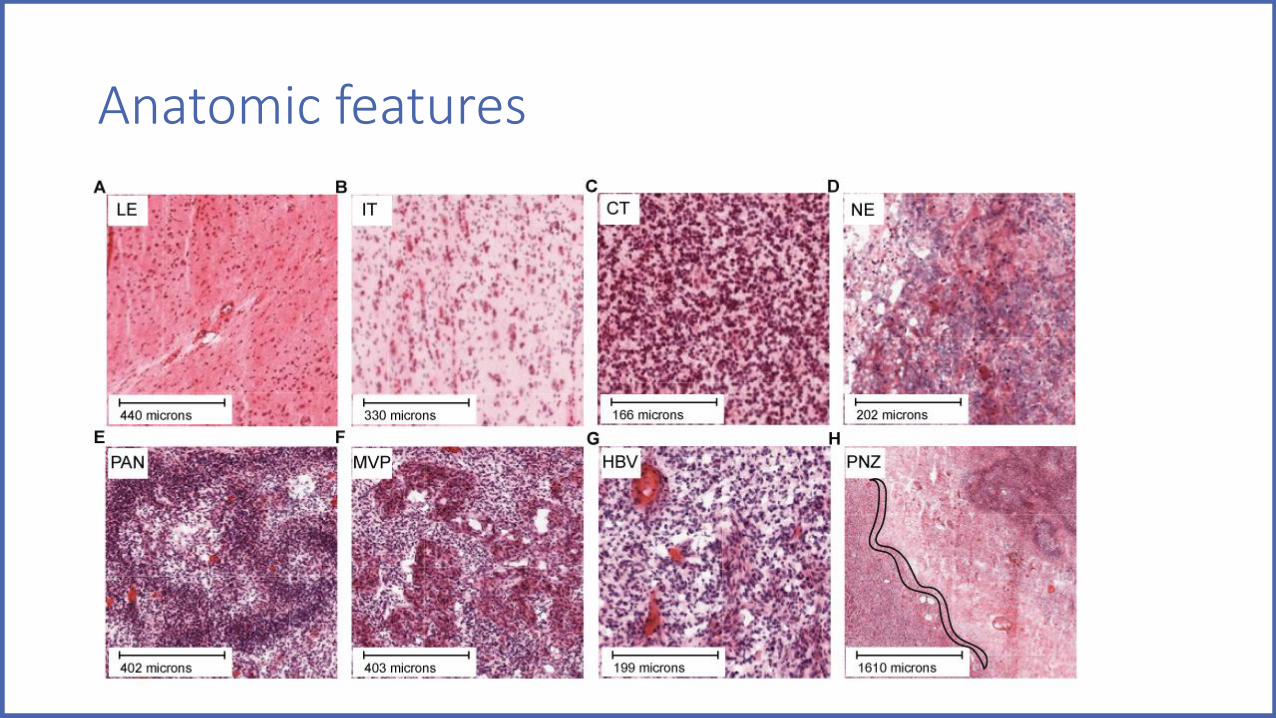
Anatomic features

Anatomic features• LE
• Leading Edge
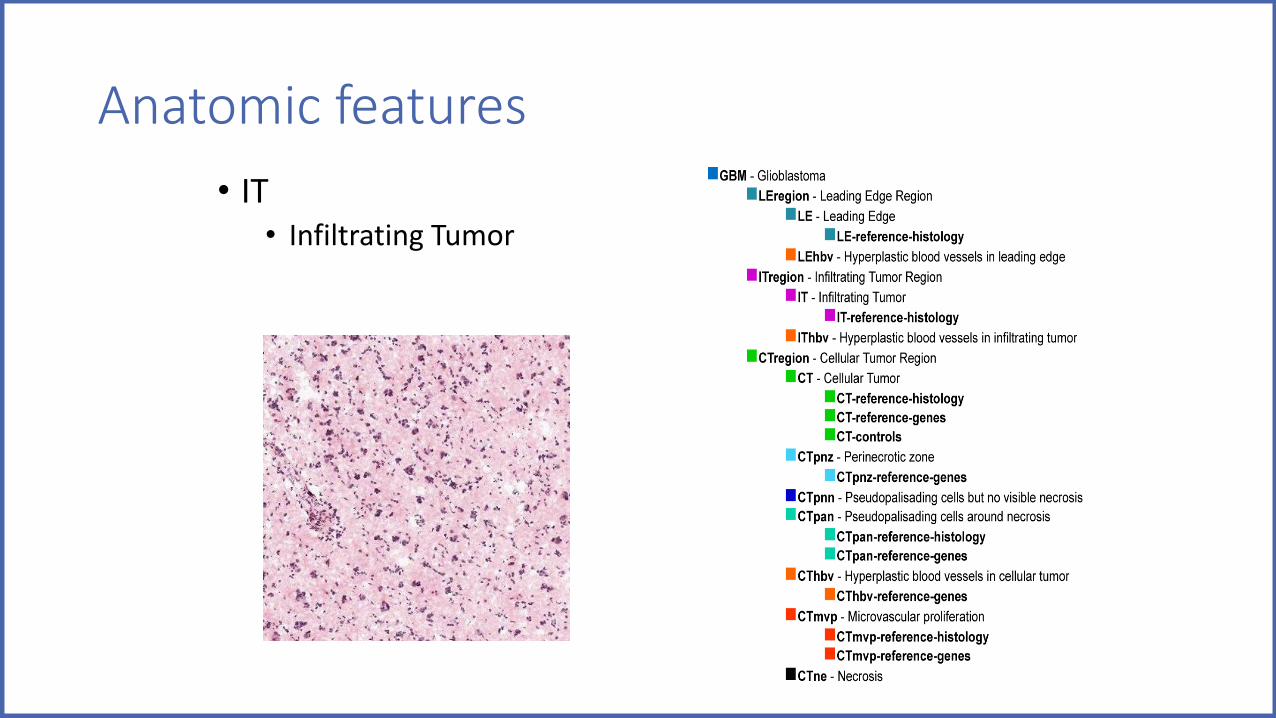
Anatomic features• IT
• Infiltrating Tumor

Anatomic features• CT
• Cellular Tumor
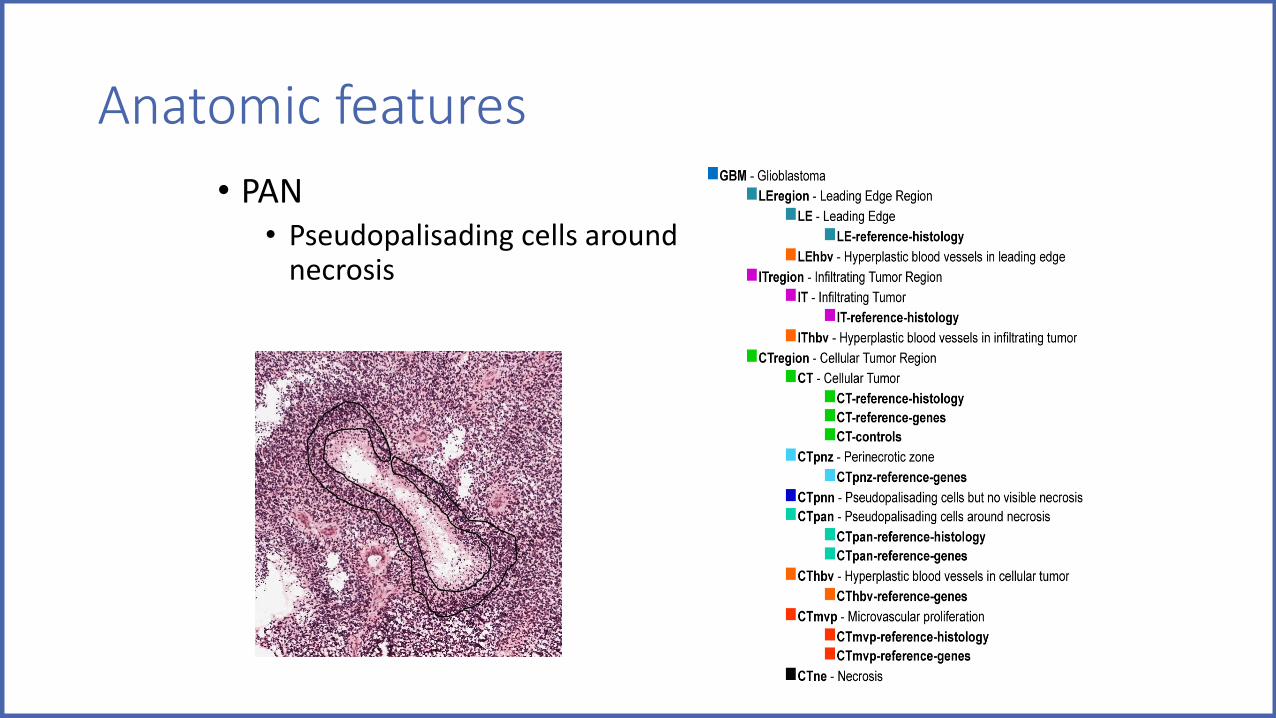
Anatomic features• PAN
• Pseudopalisading cells around necrosis

Anatomic features• PNZ
• Perinecrotic zone

Anatomic features• MVP
• Microvascular proliferation

Anatomic features• HBV
• Hyperplastic blood vessels
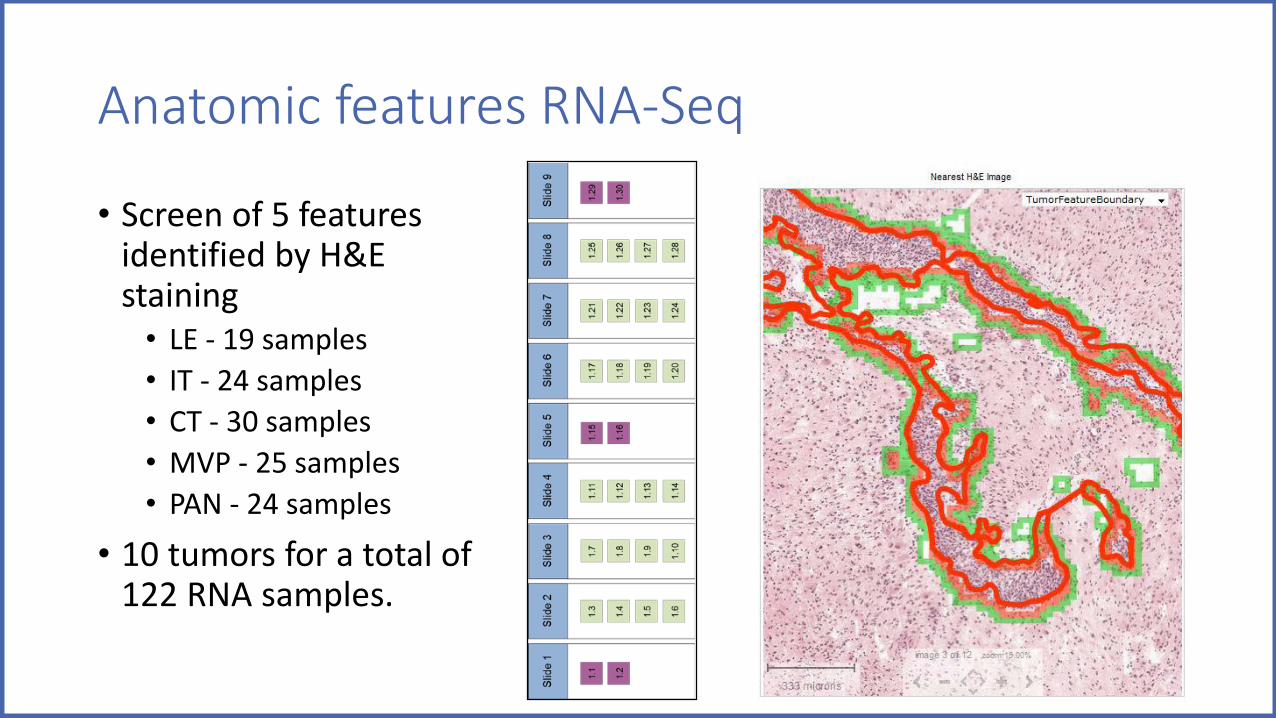
Anatomic features RNA-Seq
• Screen of 5 features identified by H&E staining
• LE - 19 samples• IT - 24 samples• CT - 30 samples• MVP - 25 samples• PAN - 24 samples
• 10 tumors for a total of 122 RNA samples.

Anatomic features ISH for Enriched Genes
• Final screen of 29 tumors with 37 genes enriched in particular anatomic features as identified in Anatomic features RNA-Seq study.
LE/IT CT PAN MVP/PAN MVPM YL12B BCAN A R R D C 3 ATF3 ELTD1
NREP DDR1 BNIP3 BTG1 ENPEP
TAX1BP3 HIST1H1E CA9 CLEC2B ESM 1
TNFAIP1 NOVA1 DOK5 ISG20 FAM 162B
NUSAP1 NDRG1 KLF6 ITGA1
PTPRZ1 PYGL LGALS3 NID2
TPX2 TREM 1 M YADM OR51E1
UHRF1 SOCS3 TES
STC1
LE IT CT PAN MVP

Anatomic features ISH for Enriched Genes: LE
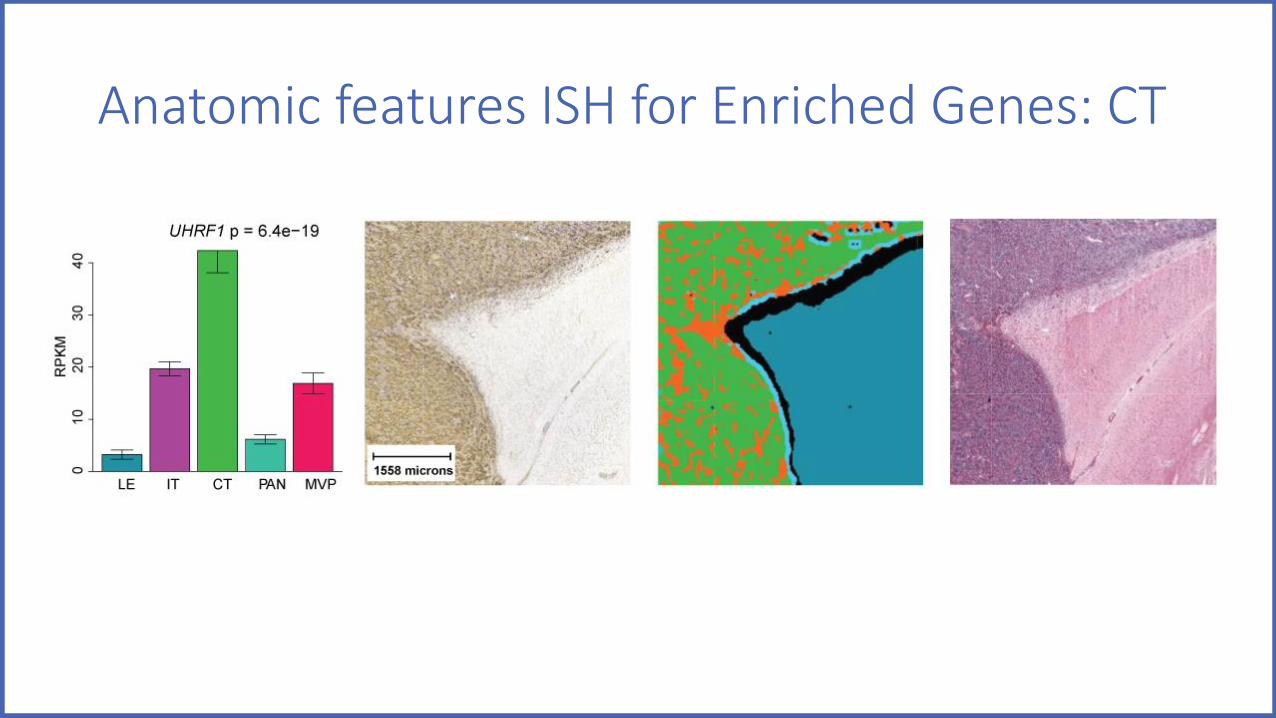
Anatomic features ISH for Enriched Genes: CT

Anatomic features ISH for Enriched Genes:PAN

Anatomic features ISH for Enriched Genes: MVP

Anatomic features ISH for Enriched Genes: MVP/PAN

Cancer Stem Cells ISH Survey
• Initial screen of 16 tumors with 56 genes to putative cancer stem cell-enriched genes to identify a 20 probe reference set, which was then used in an extensive screen of 41 tumors.
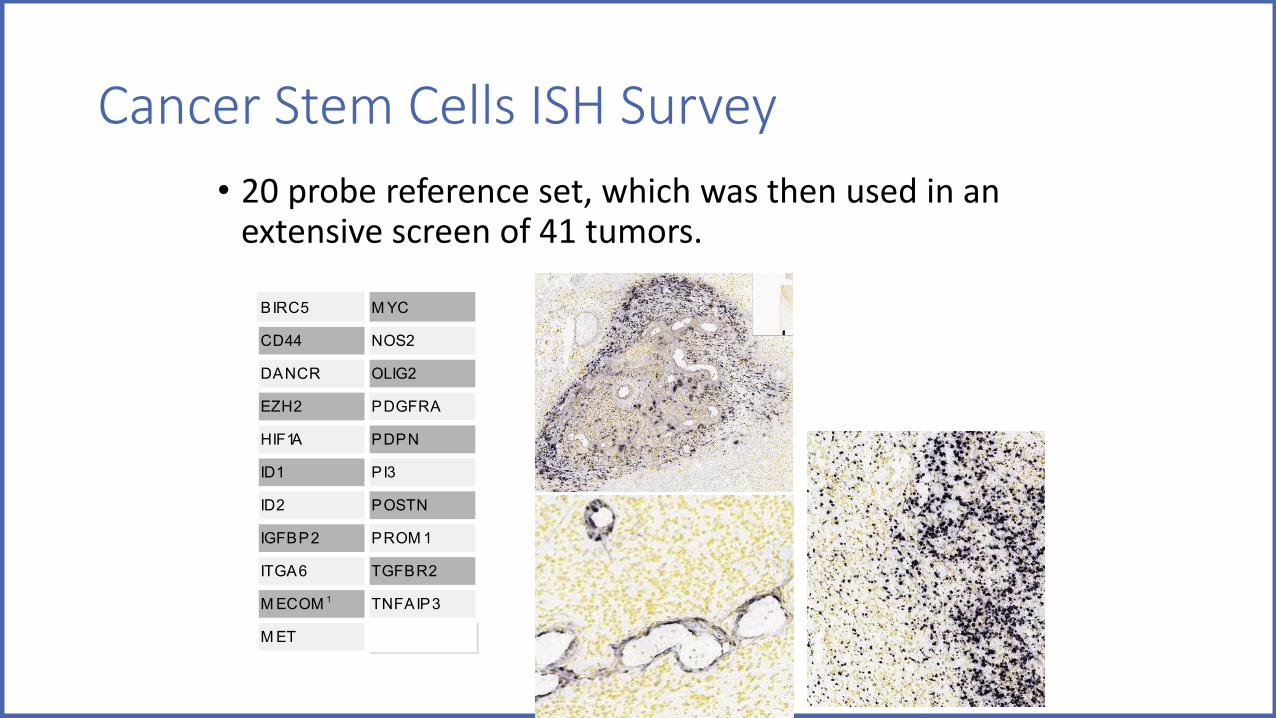
Cancer Stem Cells ISH Survey• 20 probe reference set, which was then used in an
extensive screen of 41 tumors.
BIRC5 M YC
CD44 NOS2
DANCR OLIG2
EZH2 PDGFRA
HIF1A PDPN
ID1 PI3
ID2 POSTN
IGFBP2 PROM 1
ITGA6 TGFBR2
M ECOM 1 TNFAIP3
M ET

Cancer Stem Cells RNA-Seq
• Screen of 35 types of putative cancer stem cell clusters identified by ISH with 17 genes in 34 tumors for a total of 148 RNA samples.
CT PNZ PAN HBV MVPCD44 CD44 ID2 CD44 ITGA6DANCR DANCR MYC DANCR TGFBR2HIF1A ID1 PDPN HIF1AID1 IGFBP2 PI3 IGFBP2IGFBP2 MYC PROM1 ITGA6MET PDPN TNFAIP3 POSTNNOS2 PI3 TGFBR2PDGFRA PROM1PDPN TNFAIP3PI3POSTN

Cancer Stem Cells ISH for Enriched Genes
• Final screen of 37 tumors with 75 genes to genes enriched in putative cancer stem cell clusters as identified in Cancer Stem Cells RNA-Seqstudy.
ADAM 9 CTSH FAS IFI30 OCIAD2 SERTAD1
ARL4C CTSL1 FILIP1L IL13RA2 PPAP2A SHC1
ASS1 CYR61 FN1 IL6 PPP1R15A SLC25A24
ATF3 DAB2 FNDC3B LAPTM 5 PPP1R3B SLC4A7
C12orf75 DCN FZD7 LCP1 PRSS23 SQRDL
C15orf48 DIO2 G0S2 LIF RAC2 SRPX
C8orf4 DKK1 GLIPR1 LPAR6 RARRES2 TAGLN2
CAPG EFEM P1 GLRX LYVE1 RGS16 TGFBI
CCL2 EM P1 GNG12 M AP2K3 RNA2.7 THBS1
CD163 FABP7 GPC4 M ECOM 1 RUNX1 TNC
CDCP1 FAM 129A GPC6 NM RK1 S100A4 WNT5A
CNR1 FAM 46A ICAM 1 NRP2 SDC4 WWTR1
CSF3 FAP IER3 NT5E SEC24D

Annotations• Machine learning
• Mill• Random forests
• Training• Manual annotation• 3-5 sections/sub block
• Apply• 5-33 sections/sub block

Annotations• Machine learning
• Mill• Random forests
• Training• Manual annotation• 3-5 sections/sub block
• Apply• 5-33 sections/sub block

Annotations• Nuclei segmentation
• Definiens• Watershed algorithm

Annotations - Accuracy
LE CT IT NE PAN MVP HBV ED ICE FOLD SPA EN Total RecallLE 101336 40 797 158 0 0 7 0 9 13 2 65 102427 98.93%CT 205 306309 1496 1419 2095 806 1815 0 27 47 2 1724 315945 96.95%IT 1269 437 152562 148 18 3 55 0 36 17 0 263 154808 98.55%NE 318 2589 557 215087 732 54 877 0 9 98 64 3312 223697 96.15%PAN 2 1843 29 212 133975 229 725 0 16 57 0 240 137328 97.56%MVP 2 754 10 23 223 56567 259 0 0 19 4 139 58000 97.53%HBV 11 2080 64 193 701 203 136295 0 12 18 0 190 139767 97.52%ED 0 0 0 0 0 0 0 750 0 0 0 0 750 100.00%ICE 0 7 8 19 7 0 4 0 1455 0 0 0 1500 97.00%FOLD 7 87 9 46 31 6 15 0 0 304423 0 7 304631 99.93%SPA 2 3 0 31 0 0 0 0 1 0 310443 14 310494 99.98%EN 168 1310 445 1776 300 87 195 0 0 5 26 178379 182691 97.64%Total 103320 315459 155977 219112 138082 57955 140247 750 1565 304697 310541 184333 1932038Precision 98.08% 97.10% 97.81% 98.16% 97.03% 97.61% 97.18% 100.00% 92.97% 99.91% 99.97% 96.77%
ACCURACY 98.22%

Image registration• A multi-resolution
elastic registration algorithm was utilized

Informatics Data Processing Pipeline

http://glioblastoma.alleninstitute.org/
Ivy GAP Image and RNA-Seq Database
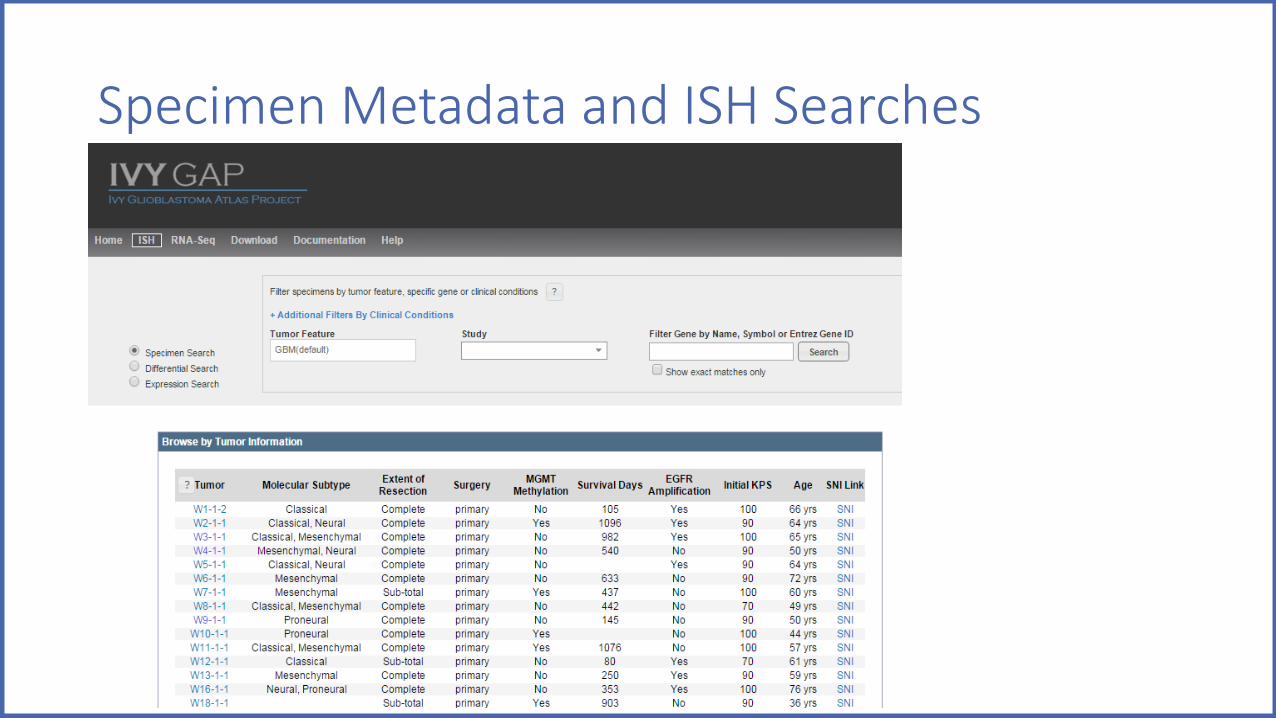
Specimen Metadata and ISH Searches

VEGFA Expression in PAN
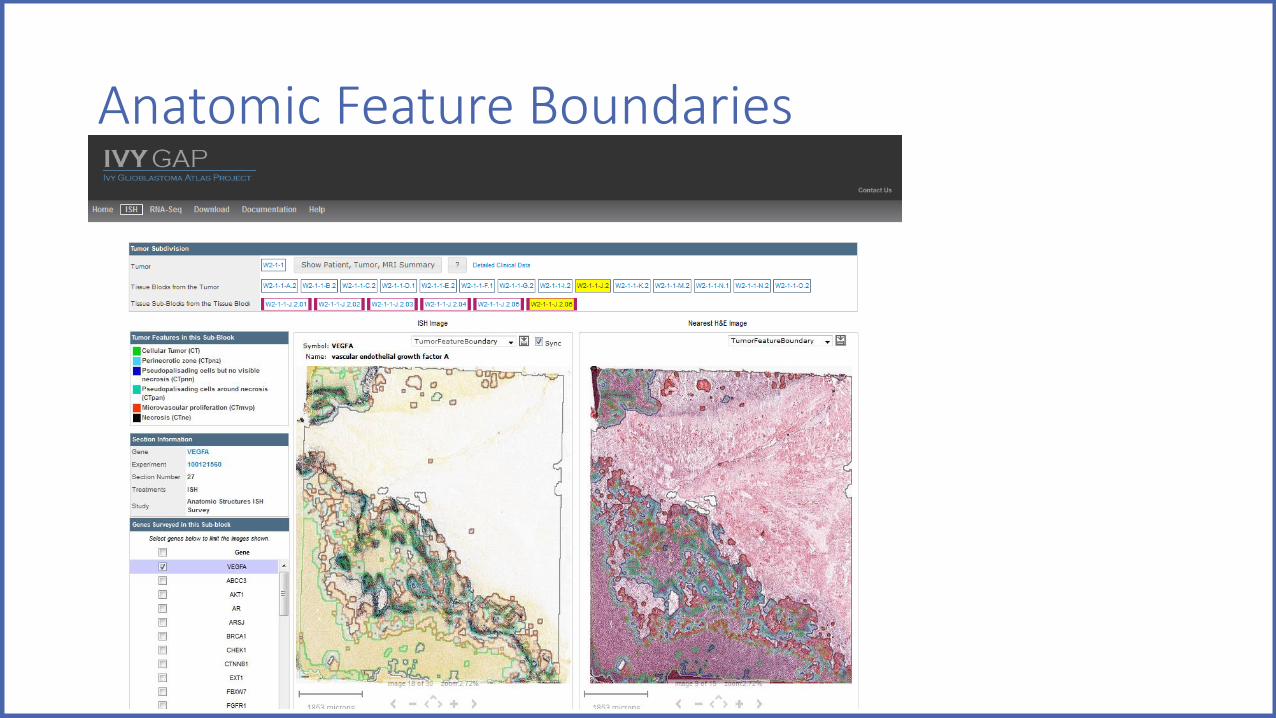
Anatomic Feature Boundaries

ISH and Anatomic Feature Masks

Image Zoom and Pan

RNA-Seq Data Searches
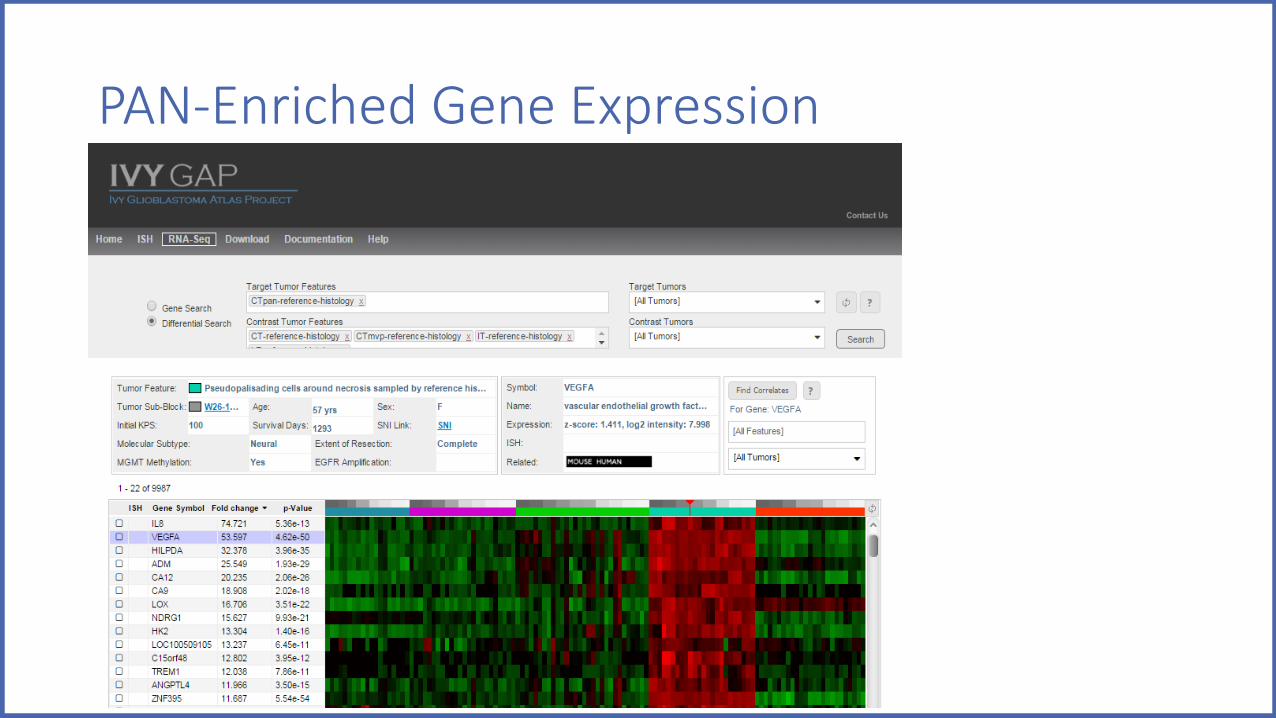
PAN-Enriched Gene Expression


Patient Treatment Timeline
●●●●● ●
●● ●● ●●●
●●
● ●●
●
●●●
●●
●
●
●
●●
● ●●
●
● ●●
●
● ●
●●
●●
●
● ●
●
●
●
●
●
●
●
●●
●●
●
● ●
●
●
●
●●
●●
●
●
●●●
●
●●●
●●●
●● ●●●● ●
●●●
●●
●
●●
●
●●
●
●
●●●
●
●●
● ●
●●●
●●●●●
●●●
●●
●●
−0.2 −0.1 0.0 0.1 0.2 0.3 0.4
−0.2
−0.1
0.0
0.1
0.2
% Var explained, Dim. 1: 26.4%
Vare
xpla
ined
, Dim
. 2:
13.
2 LEITCTPANMVP
Results
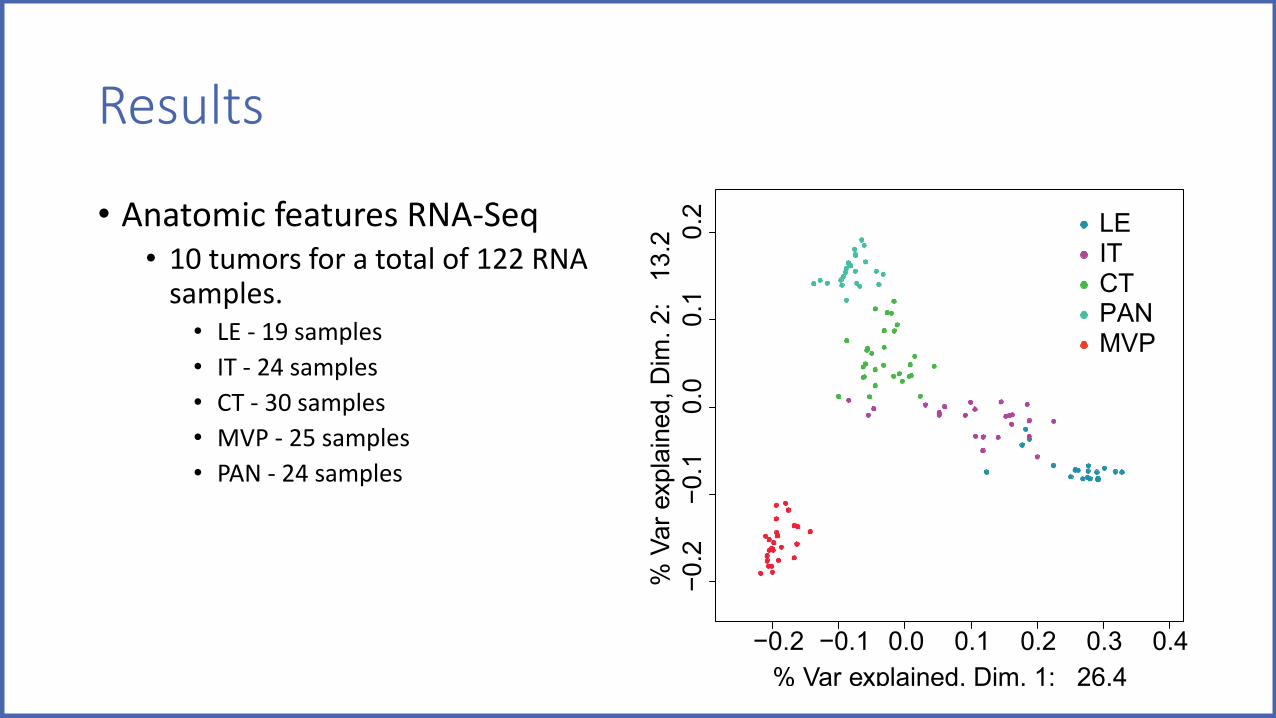
• Anatomic features RNA-Seq• 10 tumors for a total of 122 RNA
samples.• LE - 19 samples• IT - 24 samples• CT - 30 samples• MVP - 25 samples• PAN - 24 samples
Molecular Subtype
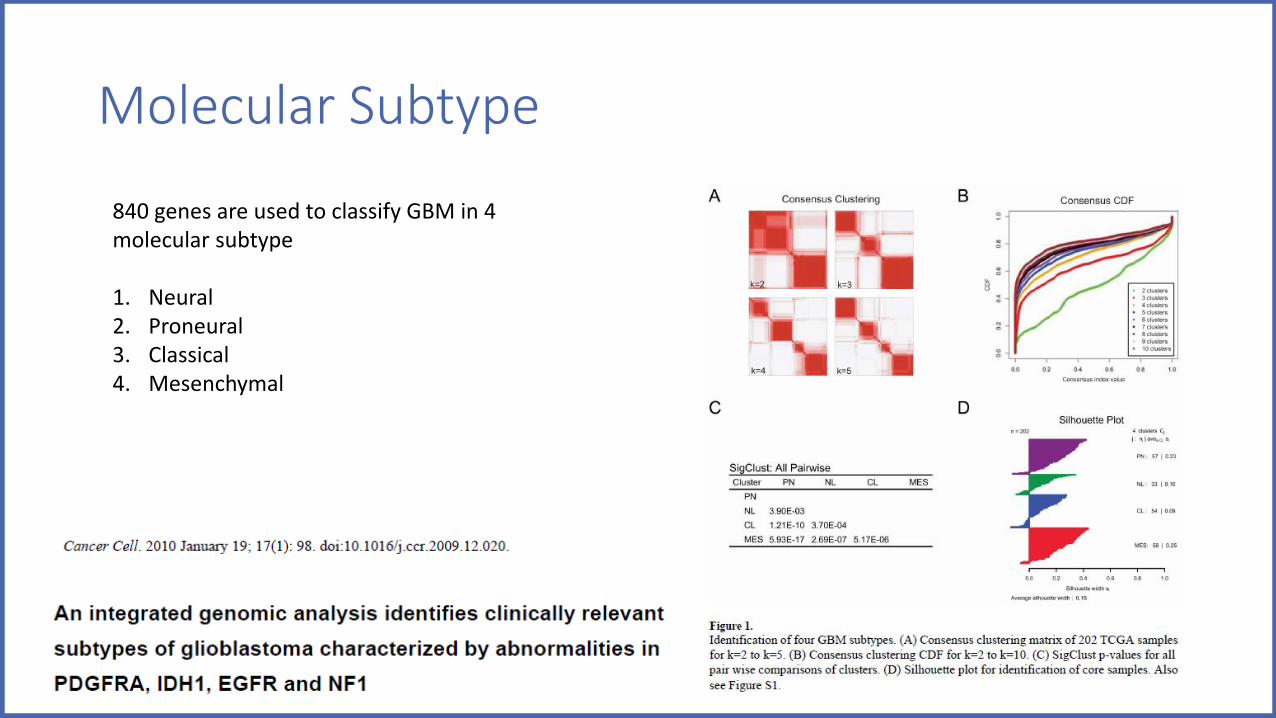
840 genes are used to classify GBM in 4 molecular subtype
1. Neural2. Proneural3. Classical4. Mesenchymal
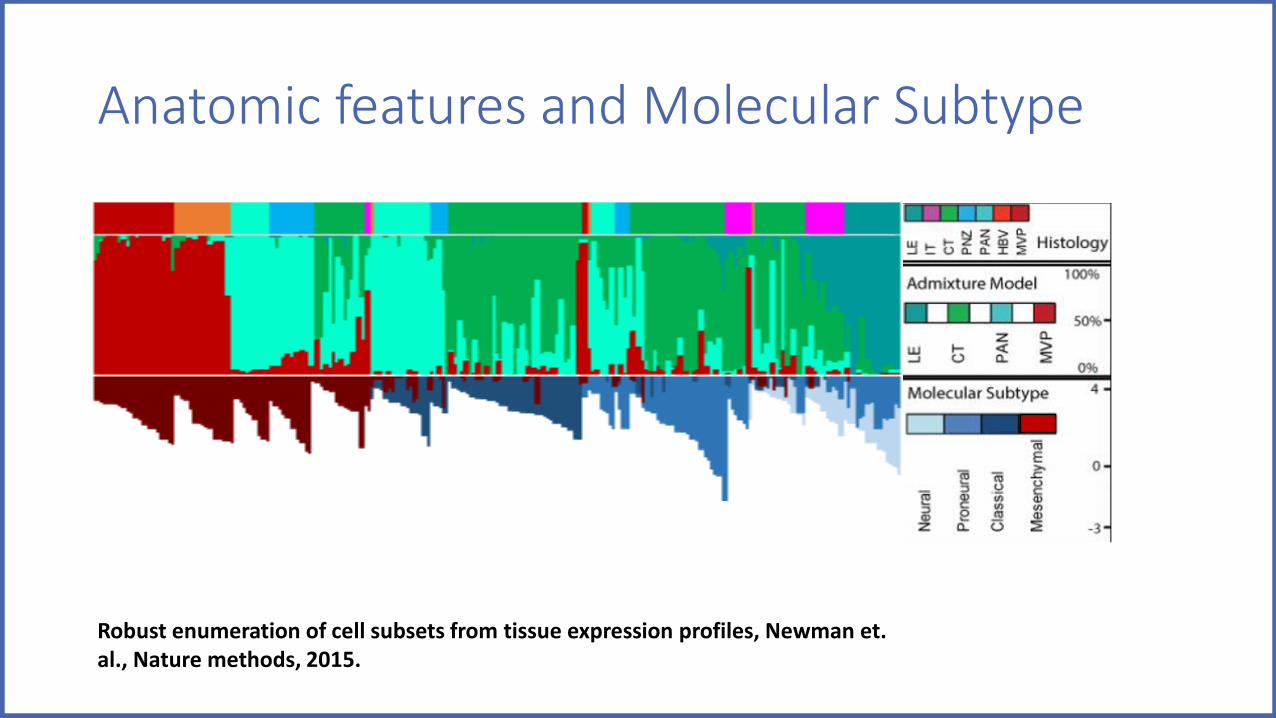
Anatomic features and Molecular Subtype
Robust enumeration of cell subsets from tissue expression profiles, Newman et. al., Nature methods, 2015.
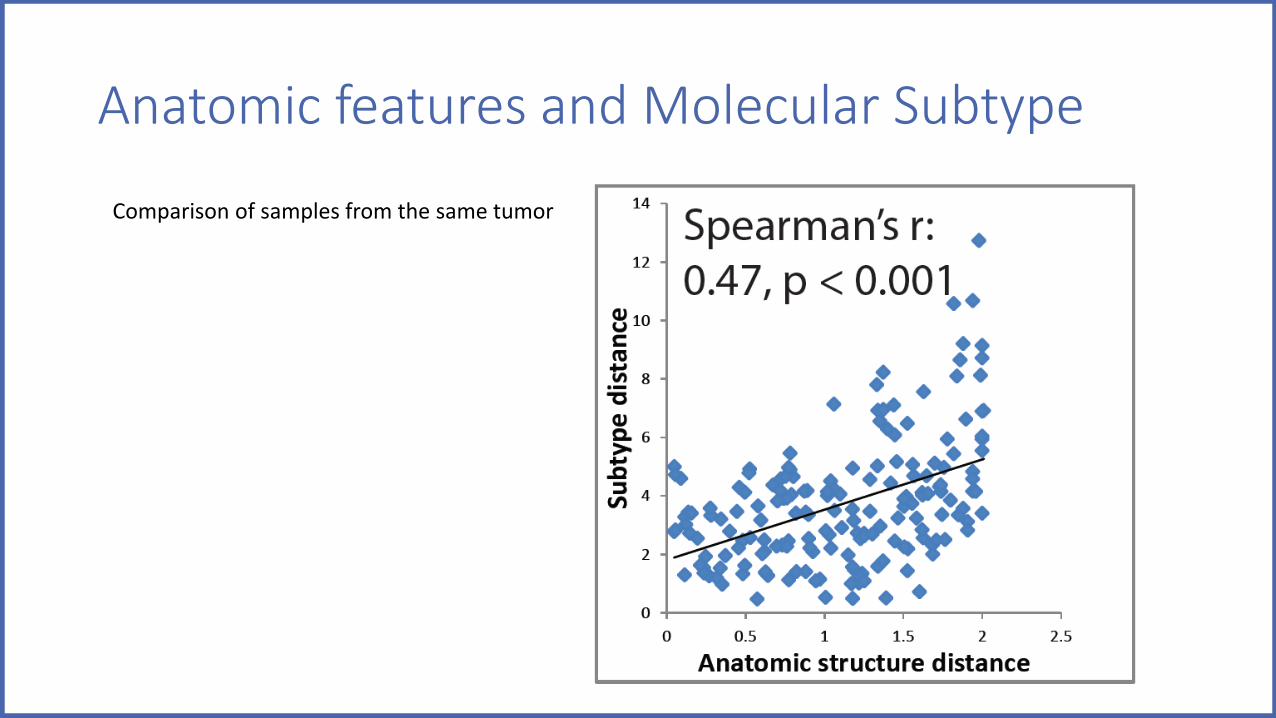
Anatomic features and Molecular Subtype
Comparison of samples from the same tumor

Anatomic Features and Cell TypesHistology
LE
CT
PAN
MVP
Neural
Proneural
Classical
Mesenchymal
Barres_matureastrocytes
Barres_neuron
Barres_oligodendrocytes
Barres_endothelial
Rooney_immune
Patel_immune
Barres_microgliamacrophages
Patel_anticellcycle
Patel_hypoxia
• Single-cell RNA-seq highlights intratumoral heterogeneity in primary glioblastoma, Patel and Tirosh et. al., Science, 2014.
• An RNA-Seq transcriptome and splicing database of glia, neurons, and vascular cells of the cerebral cortex., Zhang et. al., Journal of Neuroscience, 2014.
• Molecular and genetic properties of tumors associated with local immune cytolytic activity, Rooney et. al., Cell, 2015.

Tumor Heterogeneity

Conclusion
Fully-annotated anatomic transcriptional atlasglioblastoma.alleninstitute.org
Allen Institute
Detailed clinical and genomic data ivygap.org
Swedish Neuroscience Institute
Histologically-distinct anatomic features exhibit highly conserved gene expression signatures across tumors despite intratumor and intertumor heterogeneity.
Tumor AccrualCharles Cobbs, MD, Swedish Neuroscience InstituteFarrokh Farrokhi, MD, Virginia Mason Medical CenterGreg D. Foltz, MD, Swedish Neuroscience Institute
NeuropathologySteve Rostad, MD, CellNetix
RadiologyBart Keogh, MD, PhD, Swedish Neuroscience Institute and Radia, PSXu Feng, PhD, Radia, PS
Tissue and Clinical Data Collection, Data Analysis and PresentationSwedish Neuroscience Institute team
Tissue Processing, Data Analysis and PresentationAllen Institute teams
Semi-Automated AnnotationSteve White, PhD, White Marsh Forests, Inc.Don Marsh, White Marsh Forests, Inc.Steve Nomura, contractor and new medical school student
Gene Selection and AdvisorsKen Aldape, MD, MD Anderson Cancer CenterBruce Aronow, PhD, Cincinnati Children’s Hospital Medical CenterBrady Bernard, PhD, Institute for Systems BiologyMichael Berens, PhD, Translational Genomics Research InstituteLeroy Hood, MD, PhD, Institute for Systems BiologyParvinder Hothi, PhD, Swedish Neuroscience InstituteChris Hubert, PhD, Fred Hutchinson Cancer Research Center, Cleveland ClinicJustin Lathia, PhD, Cleveland ClinicBiaoyang Lin, PhD, Institute for Systems BiologyJeremy Miller, PhD, Allen InstituteJim Olson, MD PhD, Fred Hutchinson Cancer Research CenterRalph B. Puchalski, PhD, Allen InstituteRobert Rostomily, MD, University of WashingtonNader Sanai, MD, Barrow Neurological InstituteNameeta Shah, PhD, Swedish Neuroscience InstituteIlya Shmulevich, PhD, Institute for Systems BiologyQiang Tian, MD, PhD, Institute for Systems BiologyIlya Ulasov, PhD, Swedish Neuroscience Institute
Acknowledgements

Questions?