ivo/...artificial_photosynthesis.docx · web viewthe copy attached is provided by elsevier for...
TRANSCRIPT

Author's personal copy
Provided for non-commercial research and educational use only.Not for reproduction, distribution or commercial use.
This chapter was originally published in the book Artificial Photosynthesis, Volume79. The copy attached is provided by Elsevier for the author's benefit and for the benefit of the author's institution, for non-commercial research, and educational
use. This includes without limitation use in instruction at your institution, distribution to specific colleagues, and providing a copy to your institution's administrator.
All other uses, reproduction and distribution, including without limitation commercial reprints, selling or licensing copies or access, or posting on open
internet sites, your personal or institution’s website or repository, are prohibited. For exceptions, permission
may be sought for such use through Elsevier’s permissions site at:
http://www.elsevier.com/locate/permissionusematerial
From van Stokkum, I. H. M., Ravensbergen, J., Snellenburg, J. J., van Grondelle, R., Pillai, S., Moore, T. A., Gust, D., Moore, A. L., & Kennis, J. T. M. (2016).
Resolving Energy and Electron Transfer Processes in Dyads With the Help of Global andTarget Analysis. In R. Bruno (Ed.), Artificial Photosynthesis (pp.
169–192).ISBN: 9780128032893
Copyright © 2016 Elsevier Ltd. All rights reserved.Academic Press

Author's personal copy
Artificial Photosynthesis, First Edition, 2016, 169e192
CHAPTER SIX
Resolving Energy and Electron Transfer Processes in Dyads With the Help of Global and Target Analysisa
I.H.M. van Stokkum*, 1, J. Ravensbergen*, J.J. Snellenburg*,R. van Grondelle*, S. Pillaix, T.A. Moorex, D. Gustx, A.L. Moorex, J.T.M. Kennis**Vrije Universiteit, Amsterdam, The NetherlandsxArizona State University, Tempe, AZ, United States1Corresponding author: E-mail: [email protected]
Contents1. Introduction 1702. Methodology 174
2.1 Model-Based Data Analysis 1742.2 Modelling an Exponential Decay 1742.3 Global and Target Analysis 175
3. Applications to Synthetic Systems 1773.1 Dyad 1 1783.2 Dyad 2 184
4. Conclusion 190Acknowledgements 190References 190
AbstractIn any photosynthetic/photocatalytic device, multiple steps are required between the arrival of a solar photon and the formation of a stable product. Here we explain and demonstrate the target analysis methodology to develop minimal models, identify the steps and estimate the parameters that characterize energy converting devices. With this modelling tool the molecular mechanisms of the loss processes can be iden- tified and quantified. This can then inspire photosynthetic device optimization by
a This chapter extends the data analysis and modelling of Pillai et al. (2013).
Advances in Botanical Research, Volume 79ISSN 0065-2296 http://dx.doi.org/10.1016/bs.abr.2016.04.003
© 2016 Elsevier Ltd.All rights reserved. 169 j
Author's personal copy
Artificial Photosynthesis, First Edition, 2016, 169e192
170 I.H.M. van Stokkum et al.
precisely targeting those sites involved in the most significant losses. Two case studies of recently published measurements (Pillai et al., 2013) on a carotenoporphyrin dyad and a carotenofullerene dyad are modelled in depth. After carotenoid excitation, no excited state energy transfer (EET) to porphyrin was found, but EET from carotenoid hot S1 to the fullerene moiety occurred with a rate of 1.6/ps. The total radical pair yields of these dyads were found to be, respectively, 46% and 79%. Out of these 79%, 31% were due to electron transfer from the fullerene excited state. The triplet yields were3.8% and 4.6%. The remainder of the excitations decay to the ground state from the carotenoid hot S1 and S1 states.
List of AbbreviationsCar CarotenoidDADS Decay-associated difference spectraEADS Evolution-associated difference spectraEET Excited state energy transferESA Excited state absorptionET Electron transferFul FullereneFWHM Full width at half maximumIC Internal conversionICT Intramolecular charge-transferIRF Instrument response functionNIR Near infraredrms Root mean squareRP Radical pairSADS Species-associated difference spectraSE Stimulated emission
1. INTRODUCTION
In any photosynthetic/photocatalytic device, multiple steps are required between the arrival of a solar photon and the formation of a stable product: light absorption, exciton migration, charge separation, charge transport and the catalytic events. Each step is associated with unavoidable losses and as a consequence the overall process may have a low yield. To optimize the functioning of a prototype photocatalytic/photosynthetic de- vice, these loss processes must be identified rigorously. A model-based description of natural, hybrid or artificial photosynthetic devices should identify and quantify the states and the losses and thereby facilitate a quan- titative comparison of the different devices. To assess the efficiency of a photosynthetic/photocatalytic device, most often a variety of time-resolved spectroscopic (Vis-IR, ESR etc.) measurements are employed to monitor the dynamics of the light absorption, energy transfer, charge separation,

Author's personal copy
Artificial Photosynthesis, First Edition, 2016, 169e192
Resolving Energy and Electron Transfer Processes in Dyads 171
charge transport and catalysis. Time-resolved emission spectroscopy moni- tors the fate of the excited states, whereas time-resolved difference absorp- tion spectroscopy can also probe nonradiative states, in particular charge separates states. Reviews of ultrafast measurements (fs, ps, ns time scales) are (Berera, van Grondelle, & Kennis, 2009; Fleming, 1986; Holzwarth,1995; Polívka & Sundstrom, 2004).
In every step, loss processes can occur, leading to a decrease in efficiency or unwanted by-products. To study the functioning of a device, a quantita- tive model that describes all time-resolved spectroscopic measurements is mandatory. Typically, the models consist of differential equations containing unknown kinetic parameters (kyield and kloss) and unknown spectral param- eters that characterize molecular states (1, 2,., n, product) (see Fig. 1). The target analysis methodology (Holzwarth, 1996; van Stokkum, Larsen, & van Grondelle, 2004; van Stokkum, van Oort, van Mourik, Gobets, & van
Figure 1 Kinetic scheme of an organic solar cell with species-associated difference spectra (SADS) of four states (Williams, V^an Anh, & van Stokkum, 2013). Excited state S1 (dark grey) produces a charge transfer state (CT, black) which yields free charge car- riers (FCC, black). The losses through charge recombination result in triplets (T, light grey). A target analysis identifies the states involved and quantifies the losses.
Author's personal copy
Artificial Photosynthesis, First Edition, 2016, 169e192
172 I.H.M. van Stokkum et al.
Amerongen, 2008) is necessary to develop minimal models, identify the states by means of their species-associated difference spectra (SADS) and es- timate the parameters that characterize energy converting devices. With this modelling tool the molecular mechanisms of the loss processes can be iden- tified and quantified. This can then inspire photosynthetic device optimiza- tion by precisely targeting those sites involved in the most significant losses.
In this chapter we will reanalyse and model measurements of molecular donoreacceptor systems (dyads) (Pillai et al., 2013). The emphasis will be on the data analysis methodology. For the details on design, synthesis, experi- ment and photophysics, the reader is referred to the original publication.
Photophysical investigations of molecular donoreacceptor systems haveelucidated many details of natural photosynthesis and revealed design prin- ciples for artificial photosynthetic systems (Berera, Herrero, et al., 2006; Berera, Moore, et al., 2006; Fukuzumi, 2006; Guldi, 2002; Kloz et al.,2011, 2012; Kodis et al., 2004; Williams, Zwier, & Verhoeven, 1995). To obtain insights into the factors that govern the partition between excited state energy transfer and electron transfer (ET) processes among carotenoids and tetrapyrroles or fullerenes, Pillai et al. (2013) have designed artificial photosynthetic dyads that are thermodynamically poised to favour ET over EET processes. Two biomimetic artificial photosynthetic constructs were synthesized and investigated: a carotenoporphyrin dyad (dyad 1) and a carotenofullerene dyad (dyad 2), as depicted in Fig. 2.
Dyad 1 consists of a carotenoid covalently attached to a porphyrin moi- ety, substituted with electron withdrawing CN groups to enhance its elec- tron accepting properties. The carotenoid has nine double bonds in the polyene chain, an additional double bond in the b-ionone ring and an elon- gation of the conjugated system into the linker moiety by a phenyl group. The effective conjugation length of this carotenoid is estimated at 11 double bonds (considering the phenyl group as 1.5 conjugation length and the cyclohexene-like b-ionone ring as 0.5 conjugation length, because it is rotated out of the plane of the polyene). The bulky substituted phenyl groups are oriented at steep angles to the porphyrin plane and are added to prevent the dyad from stacking. The two pigments are linked through two phenyl rings and a peptide bond.
Dyad 2 has a carotenoid with eight double bonds in the polyene chain and one in the adjacent b-ionone ring, which gives an effective conjugation length of 8.5 double bonds. It is coupled to a C60 by a positively charged methylated pyrrolidine linker. Fullerenes are not found in biological systems but are promising components for artificial photosynthesis (Gust, Moore, &

Author's personal copy
Artificial Photosynthesis, First Edition, 2016, 169e192
Resolving Energy and Electron Transfer Processes in Dyads 173
Figure 2 Structure of the dyads: carotenoporphyrin (dyad 1) and carotenofullerene(dyad 2).
Moore, 2000; Wro'bel & Graja, 2011). They have a small reorganization en- ergy in ET reactions, which can help place the ET reaction at the peak of the Marcus curve, facilitating fast photoinduced ET and slow recombination (Hiroshi et al., 1996; Marcus & Sutin, 1985).
Both dyads were studied by transient difference absorption spectroscopy, measuring the time-resolved difference spectrum after excitation of the carotenoid moiety. Global analysis was used to describe the data with a min- imal set of lifetimes and associated spectra. Subsequently, in a target analysis a detailed kinetic model including EET and ET pathways was tested, and the corresponding rates and species-associated spectra were estimated. For dyad1, Pillai et al. (2013) found that ET from the carotenoid S2 state to the porphyrin completely outcompetes any EET process. In dyad 2, ET from carotenoid to the fullerene is the dominant process, but an EET process from the optically forbidden carotenoid S1 state to the lowest fullerene singlet-excited state is observed as well. Here we test their interpretation, propose detailed kinetic schemes and quantify all photophysical processes in terms of the spectra of the states involved and the rate constants describing their interconversion.
1 2
2
Author's personal copy
Artificial Photosynthesis, First Edition, 2016, 169e192
174 I.H.M. van Stokkum et al.
2. METHODOLOGY2.1 Model-Based Data AnalysisIn time-resolved spectroscopic experiments, a very large amount of
data is collected which can be analysed by global and target analysis tech- niques. A time-resolved experiment DAðt; lÞ typically consists of time-gated spectra at several 100 delays, each spectrum consisting of several 100 wave- lengths, resulting in a collection of tens of thousands of data points. The aim of the data analysis is to obtain a model-based description of the full data set in terms of a model containing a small number of precisely estimated param- eters, of which the rate constants and spectra are the most relevant. A description of the basic ingredient of kinetic models, the exponential decay, will be given first, followed by a description of how to use these ingredients for global and target analysis of the full data. Our main assumption here is that the time and wavelength properties of the system of interest are sepa- rable, which means that spectra of species or states are constant. For details on parameter estimation techniques, the reader is also referred to I. H. M. van Stokkum et al. (2004). Software issues are discussed in I. H. M. van Stokkum and Bal (2006).
2.2 Modelling an Exponential DecayHere an expression is derived for describing an exponentially decaying component. The instrument response function (IRF) that accounts for the convolution of excitation, and probe pulse is usually modelled with a Gaussian parameterized using m and D for, respectively, location and full width at half maximum (FWHM):
IRFðtÞ ¼ ~ pffiffiffiffiffiffi exp( - logð2Þð2ðt - mÞ=DÞ
D 2p
where D~ ¼ D=ð2pffi
2ffiffiffi
lffio
ffiffiffig
ffiffiffiffi2
ffiffiffiffið Þ Þ. Typically the FWHM is z100 fs in the
visible and z200 fs in the near-IR. The convolution (indicated by an *) of this IRF with an exponential decay (with rate k) yields an analytical expression which facilitates the estimation of the decay rate k and the IRF parameters m and D:
cI ðt; k; m; DÞ ¼ expð-ktÞ IRFðtÞ
1¼ 2
expð-ktÞexp k m þ
kD~ 2
2
X 1 þ erf
t - (
m þ kD~pffi
2ffiffiD~

Þ
Author's personal copy
Artificial Photosynthesis, First Edition, 2016, 169e192
Resolving Energy and Electron Transfer Processes in Dyads 175
By the nature of the white light generation process, the white light is‘chirped’ on generation, ie, the ‘blue’ wavelengths are generated later in time than the ‘red’ wavelengths. Hence, the white light continuum has an intrinsic group velocity dispersion. When travelling through optically dense materials such as lenses and cuvettes, the group velocity dispersion in the white light readily increases to picoseconds. The group velocity dispersion can be modelled with a polynomial function that describes the wavelength dependence of the IRF location m:
mðlÞ ¼ mlc þ
jmaxXj¼1
aj ðl - lc j
Typically, with visible difference absorption measurements over a large wavelength range, the order of this polynomial ðjmax Þ is three. The reference wavelength lc is conveniently at the centre of the spectrograph. In addition, also the IRF width can be wavelength dependent, and an analogous poly- nomial description can be employed.
2.3 Global and Target AnalysisThe basis of global analysis is the superposition principle, which states that the measured data DAðt; lÞ result from a superposition of the spectral prop- erties εl ðlÞ of the components present in the system of interest weighted by their concentration cl ðtÞ.
ncomp
DAðt; lÞ ¼ X
cl ðtÞεl
ðlÞl¼1
The cl ðtÞ of all ncomp components are described by a compartmental model, that consists of coupled first-order differential equations, with as so- lution sums of exponential decays. We will consider three types of compartmental models: (1) a model with components decaying monoex- ponentially in parallel, which yields decay-associated difference spectra (DADS), (2) a sequential model with increasing lifetimes, also called an un- branched unidirectional model (Nagle, Parodi, & Lozier, 1982), resulting in evolution-associated difference spectra (EADS) and (3) a full compart- mental scheme which may include possible branchings and equilibria, yielding SADS. The latter is most often referred to as target analysis, where the target is the proposed kinetic scheme, including possible spectral as- sumptions. When analysing fluorescence data (which are nonnegative) the word Difference is not applicable, and the nomenclature is DAS, EAS and SAS.

l
l ¼ P
Author's personal copy
Artificial Photosynthesis, First Edition, 2016, 169e192
176 I.H.M. van Stokkum et al.
With parallelly decaying components, the model readsncomp
DAðt; lÞ ¼ X
cI ðkl ÞDADSl ðlÞl¼1
The DADS thus represent the estimated amplitudes of the above-defined exponential decays cI ðkl Þ. When the system consists of parallelly decaying components, the DADS are true species difference spectra. In all other cases, they are interpreted as a weighted sum (with both positive and negative con- tributions) of the true SADS.
In addition to exponentially decaying components, scattering or a coherent artefact can be present. This can often be modelled as an extra component with as time profile the IRF shape. Such spectra are typical in nonlinear optics and can also contain Raman scattering from the solvent (Berera et al., 2009).
Following a successfully converged fit, the matrix of residuals is then ana-lysed with the help of a singular value decomposition (SVD). Formally the residual matrix can be decomposed as
mXresðt; lÞ ¼ uresðtÞsl wresðlÞl l
l¼1
where ul and wl are the left and right singular vectors, sl the sorted singular values and m is the minimum of the number of rows and columns of the matrix. The singular vectors are orthogonal and provide an optimal least squares approximation of the matrix. The SVD is useful to diagnose shortcomings of the model used or systematic errors in the data.
A sequential model consists of components decaying sequentially1/2/./ncomp where the decay rates kl are decreasing, and the lifetimes1=kl are increasing. It is a convenient way to describe the spectral evolution,and each component possesses an EADS. The model for the data now reads
ncomp
DAðt; lÞ ¼ X
cII EADSl
ðlÞl¼1
where each concentration is a linear combination of the exponential decays,cII l I
j¼1 bjl c ðkl Þ, and the amplitudes (Nagle et al., 1982) bjl are given by
b11 ¼ 1 and for j ::; l:

Author's personal copy
Artificial Photosynthesis, First Edition, 2016, 169e192
l-1bjl ¼
Y
kmm¼1
,lY
n¼1;nsj
(kn - kj

T
Author's personal copy
Artificial Photosynthesis, First Edition, 2016, 169e192
Resolving Energy and Electron Transfer Processes in Dyads 177
When the system truly consists of sequentially decaying components1/2/./ncomp , the EADS are true SADS (see later discussion). In all other cases, they are interpreted as a weighted sum (with only positive con- tributions) of SADS.
In a more general target analysis a compartmental scheme is used to describe the concentrations of the compartments (states). Transitions to and from compartments are described by microscopic rate constants. The model that is fitted to the data now reads
ncomp
DAðl; tÞ ¼ X
ciðtÞSADSiðlÞi¼1
where ciðtÞ now corresponds to the concentration of the i-th compartment. SADSiðlÞ is the i-th SADS. The concentrations of all compartments are collated in a vector. When a carotenoid is excited, which ultimately
Tresults in a product, such a vector reads: cðtÞ ¼ ½c1 ðtÞ c2 ðtÞ. cncomp ðtÞ] ¼½ Car ðtÞ . IntermediateðtÞ . ProductðtÞ ] differential equation
which obeys the
ddt
cðtÞ ¼ KcðtÞ þ jðtÞ
where the transfer matrix K contains off-diagonal elements kpq, representing the microscopic rate constant from compartment q to compartment p. The diagonal elements contain the total decay rates of each compartment. The
Tinput to the compartments is jðtÞ ¼ IRFðtÞ½ 1 0 0 ] . In most casesspectral constraints are needed to limit the number of parameters and render the target model identifiable.
A software package called TIMP (Mullen & van Stokkum, 2007) which implements these models was developed for the statistical computing lan- guage R (R Development Core Team, 2010) and a corresponding sophis- ticated graphical user interface called Glotaran has been released (Snellenburg, Laptenok, Seger, Mullen, & van Stokkum, 2012).
3. APPLICATIONS TO SYNTHETIC SYSTEMS
The absorption spectra of dyads 1 and 2 in the nonpolar solvent toluene (dielectric constant 2.4) are shown in Fig. 3, in black and grey respectively. With dyad 1, the double band around 450 nm corresponds to the porphyrin Soret band, the bands around 660 and 680 nm to the

Author's personal copy
Artificial Photosynthesis, First Edition, 2016, 169e192
178 I.H.M. van Stokkum et al.
Figure 3 Absorption spectra. Black: dyad 1 in toluene. Grey: dyad 2 in toluene. All spectra were measured in a 1 mm path length quartz cuvette.
porphyrin Q-band absorption. The carotenoid absorption bands overlap with the porphyrin Soret band, except for the lowest vibronic S2 transition, which is found at 515 nm.
With dyad 2, the carotenoid absorption is shifted to the blue with respect to dyad 1, as expected from the shorter conjugation length of the molecule, leading to a larger energy gap between the ground and excited states (Polívka & Sundstrom, 2004). Fullerene has an absorption band around300 nm (Guldi & Prato, 2000) (not shown) and an absorption tail with very small amplitude that extends throughout the visible range.
3.1 Dyad 1Dyad 1 (Fig. 2) has been excited in toluene solution in its carotenoid moiety at z515 nm. The data from transient absorption measurements have been globally analysed using a simultaneous analysis for measurements in the visible and near-IR. Fig. 4 contains the EADS for dyad 1 in toluene. At least six components are needed for a sufficient fit of the data. The estimation of the fastest process crucially depends upon an adequate description of the wavelength dependence of the IRF. Both the location and width of the IRF are wavelength dependent. With six components (lifetimes 78 fs,1.1 ps, 4.5 ps, 243 ps, 810 ps, long lived) the overall rms error of the fit is0.555, but a trend is visible in the first left singular vector of the residual ma- trix of the NIR data. Addition of a seventh component (lifetimes 30 fs
Author's personal copy
Artificial Photosynthesis, First Edition, 2016, 169e192
Resolving Energy and Electron Transfer Processes in Dyads 179
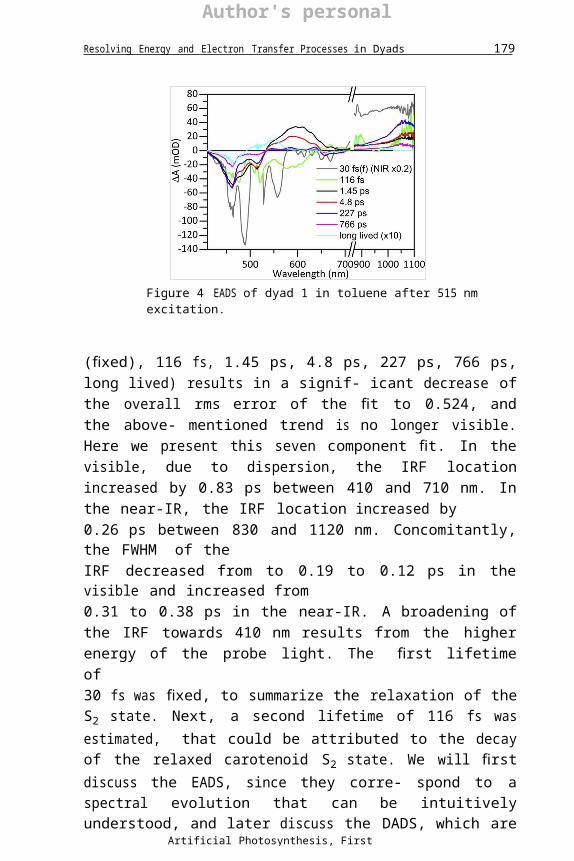
Figure 4 EADS of dyad 1 in toluene after 515 nm excitation.
(fixed), 116 fs, 1.45 ps, 4.8 ps, 227 ps, 766 ps, long lived) results in a signif- icant decrease of the overall rms error of the fit to 0.524, and the above- mentioned trend is no longer visible. Here we present this seven component fit. In the visible, due to dispersion, the IRF location increased by 0.83 ps between 410 and 710 nm. In the near-IR, the IRF location increased by0.26 ps between 830 and 1120 nm. Concomitantly, the FWHM of theIRF decreased from to 0.19 to 0.12 ps in the visible and increased from0.31 to 0.38 ps in the near-IR. A broadening of the IRF towards 410 nm results from the higher energy of the probe light. The first lifetime of30 fs was fixed, to summarize the relaxation of the S2 state. Next, a second lifetime of 116 fs was estimated, that could be attributed to the decay of the relaxed carotenoid S2 state. We will first discuss the EADS, since they corre- spond to a spectral evolution that can be intuitively understood, and later discuss the DADS, which are more difficult to interpret. The first EADS (grey) shows negative DA bands in the visible and a positive band in the near-IR region (Note that the latter is much larger that the later signals in the near-IR and was multiplied by 0.2 for comparison.). This is the typical absorbance difference spectrum due to population of the carotenoid S2 state and is characterized by ground state bleach and stimulated emission (negative DA signals) in the visible and excited state absorption (positive DA signal) in the near-IR(Zhang, Inaba, Watanabe, & Koyama, 2000a,2000b). The minimum at 490 nm can be attributed to Raman scatter of the toluene solvent, which is maximal at 1000/cm (Hitchcock & Lapiosa,1975). This energy corresponds to the difference between the 515 nm exci- tation wavelength and 490 nm ð107=490 - 107 =515z1000=cmÞ. Note

Author's personal copy
Artificial Photosynthesis, First Edition, 2016, 169e192
180 I.H.M. van Stokkum et al.
that the SE from S2 to S0 is largest at 558 nm. This location red shifts to579 nm in the second EADS (green), which largely represents the relaxedcarotenoid S2 state. Moreover, in the NIR the EADS can be interpreted as an SE from S2 to Sx superimposed upon a flat ESA. Thus this EADS is minimal near 950 nm, due to the opposite contributions of ESA and SE. From the difference between these minima, we estimate the energy of the Sx state as 107 =579 - 107 =950z6750=cm. This is reminiscent of the peri- dinin carotenoid where (Zigmantas, Polívka, Hiller, Yartsev, & Sundstro€m,2001) found SE from an intramolecular charge-transfer state, with SE around 1000 nm. These ultrafast carotenoid S2 dynamics on the 100 fs time scale deserve further investigation. In the remainder we concentrate on the carotenoid porphyrin interactions. The second EADS (green) evolves into the third EADS (black) with a time constant of 116 fs.
Both the third (black, 1.45 ps) and fourth (red, 4.8 ps) EADS show a pos- itive band between 530 and 700 nm, originating from carotenoid S1 excited state absorption (Koyama, Kakitani, Miki, Christiana, & Nagae, 2010; Polívka & Sundstrom, 2004). The excited state absorption of the fourth EADS is blue-shifted with respect to the third, which corresponds to a tran- sition from vibrationally hot to relaxed S1 (Koyama et al., 2010; Polívka & Sundstrom, 2004). Both the 1.45 ps EADS and the 4.8 ps EADS show a negative signal below 530 nm, which can be interpreted as a mix of carot- enoid and porphyrin Soret bleaching. In the near-IR, these EADS show a band at 1060 nm that can be assigned to the carotenoid cation radical (Jeevarajan, Wei, Jeevarajan, & Kispert, 2011; Kodis et al., 2004). This, together with the presence of porphyrin bleaching, indicates that charge sep- aration has taken place. Hence we can attribute these two spectra to a mix of carotenoid S1 (or hot S1) and the charge-separated Car•þ Por•- state.
The fifth (blue, 227 ps) EADS shows bleaching signatures around650 nm originating from porphyrin and around 450 and 500 nm originating from both porphyrin and carotenoid. Furthermore, the spectrum shows an increased absorption of the carotenoid cation radical in the near-IR. The cation absorption band has increased with respect to the fourth spectrum (red 4.8 ps), while the carotenoid S1 absorption band has decreased. This observation shows that charge separation has taken place from the S1 state in 4.8 ps. The 766 ps EADS (magenta line) has a spectral shape that is virtu- ally identical to that of the 227 ps EADS, but with significantly reduced amplitude, and hence the 227 and 766 ps time constants are assigned to radical pair recombination. The need for two recombination time constants is probably related to heterogeneity in the sample or the typical

Author's personal copy
Artificial Photosynthesis, First Edition, 2016, 169e192
Resolving Energy and Electron Transfer Processes in Dyads 181
Figure 5 DADS of dyad 1 in toluene.
multiexponential decay reflecting disorder. Structural heterogeneity has been demonstrated previously in axially linked caroteno-phthalocyanine tri- ads by NMR spectroscopy (Palacios et al., 2006). Alternatively, there is a227 ps evolution towards a state with less carotenoid cation radical absorp- tion (see later discussion).
The last EADS (cyan, long lived) is nondecaying on the time scale of this experiment. The spectrum has been expanded 10X for clarity. It shows an excited state absorption band at 550 nm. This band is characteristic of the long-lived carotenoid triplet state (Berera, Herrero, et al., 2006; Berera, Moore, et al.,2006; Koyama et al., 2010; Polívka & Sundstrom, 2004). Usu- ally, this band is only accompanied by carotenoid bleaching. Here, we also see porphyrin bleaching at both the Q and Soret wavelengths. The presence of porphyrin features in the final state is surprising, as the charge-separated state has recombined in the previous processes, and porphyrin triplet states are, in general, energetically higher than those of carotenoids. As observed previously in several natural and artificial light-harvesting systems, this obser- vation suggests that the triplet state is delocalized on the carotenoid and the porphyrin, which leads to a ground state bleach signal of both moieties (Alexandre et al., 2007; Angerhofer, Bornh€auser, Gall, & Cogdell, 1995; Bonetti et al., 2010; Gall et al., 2011).
To complement this EADS discussion we now describe some of the DADS features, cf. Fig. 5. Recall that the quality of the fit is identical with a sequential or parallel model; however, the DADS provide a differen- tial view on the spectral evolution, stressing the changes.
The first DADS (grey) shows a decrease of the 550 nm SE and an in- crease of the 580 nm SE, that correspond to the relaxation of the S2 state.

Author's personal copy
Artificial Photosynthesis, First Edition, 2016, 169e192
182 I.H.M. van Stokkum et al.
Figure 6 Kinetic scheme for dyad 1 with estimated rate constants in 1/ps. Car, Carot- enoid; RP, radical pair.
The second DADS (green) shows a large negative band from 500 to 650 nm. This can be attributed to the decay of the carotenoid S2 stimulated emission and the rise of the carotenoid S1 excited state absorption. In addition a small positive band near 450 nm indicates rise of the porphyrin bleaching. In the NIR the negative band around 950 nm reflects SE from relaxed S2 to Sx superimposed upon a flat ESA. The third DADS (1.45 ps) shows positive bands from 600 to 700 nm and from 1000 to 1070 nm, which can be attrib- uted to the relaxation of the vibrationally hot S1. The negative band at1060 nm of the 4.8 ps DADS (red) indicates the main rise of the carotenoidcation radical. The differences between the 227 and 766 ps DADS are subtle in the visible. The porphyrin bleaching near 450 nm is stronger in the 227 ps DADS, and porphyrin signals near 660 nm are strongest in the 766 ps DADS. In the near-IR the main decay of the 1060 nm carotenoid cation radical band is with 227 ps. Strikingly, the 470 and 520 nm bleaches are almost equal in the 227 and 766 ps DADS. The shapes of the final DADS and of the final EADS are (by definition) identical.
Surprisingly, the transient absorption data show no indication of EET from carotenoid to porphyrin. It was confirmed by fluorescence excitation experiments performed by Pillai et al. (2013) that EET from carotenoid to porphyrin is indeed absent.
The kinetic scheme that was used in our target analysis with the esti- mated microscopic rate constants is given in Fig. 6. The carotenoid is excited to the hot S2 state, followed by relaxation to the S2 state, where internal con- version to the hot S1 state competes with ET to the porphyrin. The

Author's personal copy
Artificial Photosynthesis, First Edition, 2016, 169e192
Resolving Energy and Electron Transfer Processes in Dyads 183
Figure 7 SADS of dyad 1 in toluene using the kinetic scheme of Fig. 6 (top) and zoom of the visible region (bottom). RP, Radical pair.
populated hot S1 state relaxes to the S1 state. Both the hot and relaxed S1 state possess identical rates for ET to the porphyrin and for decay to the ground state by internal conversion. The biexponential decay of the radical pairs was modelled with a sequential scheme, which simplifies the charge separation description to single rates from each Car excited state. The ade- quacy of this kinetic scheme crucially depends upon the physicochemical interpretability of the estimated SADS. These are depicted in Fig. 7. In the zoom of the visible region all expected features are present. The last three states, RP1, RP2 and triplet show a bleach in the porphyrin Soret and Q regions (460 and 650e700 nm). In addition, RP1 and RP2 show three ESA bands between 530 and 630 nm. The carotenoid bleach at515 nm is smaller with the S2, hot S1 and S1 states than with RP1 andRP2, because ESA compensates this bleach. In the NIR we find almost

ures
Author's personal copy
Artificial Photosynthesis, First Edition, 2016, 169e192
184 I.H.M. van Stokkum et al.
flat ESA with the hot S1 and S1 states. The 1060 nm bands are entirely encompassed in the RP1 and RP2 SADS. Why this band is twice bigger in RP1 remains to be explained. The model carotenoid has been measured by Berera, Herrero, et al. (2006) and Berera, Moore, et al. (2006), who re- ported an S1 decay rate of 0.13/ps in toluene, ascribed to IC to the ground state. This agrees well with the 0.125/ps rate estimated. The estimated ET rates are 0.08/ps from the hot S1 and S1 states, and 1/ps from the S2 state. The total RP yield is thus 46%, to which the S2, hot S1 and S1 contribute, respectively, 12%, 11% and 23%. The total triplet yield is 3.8%, which means that 50% of the excitations decay to the ground state from the S2, hot S1 and S1 states.
Summarizing, careful global analysis taking into account the wavelengthdependence of the IRF resolved an additional state, the carotenoid hot S2. Target analysis (Fig. 6) quantified the ET pathways: 0.08/ps from the hot S1 and S1 states and 1/ps from the S2 state. All estimated SADS (Fig. 7) were well interpretable.
3.2 Dyad 2Dyad 2 (Fig. 2) has been excited in toluene solution in its carotenoid moiety at z470 nm. The coherent artefact contributions are so large that we exclude the 466e472 nm traces from the analysis. At least six components are needed for a sufficient fit of the data. With six components (lifetimes66 fs, 0.59 ps, 6.6 ps, 196 ps, 730 ps, long lived) the overall rms error of the fit is 0.242, but a trend is visible in the first left singular vector of the re- sidual matrix of the visible data. Addition of a seventh component (lifetimes86 fs, 226 fs, 2.0 ps, 12.5 ps, 143 ps, 514 ps, long lived) results in a significantdecrease of the overall rms error of the fit to 0.222, and the above- mentioned trend is no longer visible. This is demonstrated by a comparison of the first left singular vectors of the residual matrix of the visible data. The
1 ðtÞ of the model with six lifetimes shows clear trends between 0 and500 ps, which are absent in the model with seven lifetimes, cf. Fig. 8Aand B.
The EADS of the seven component models are presented in Fig. 9. The first EADS in global analysis corresponds to the carotenoid S2 spectrum, of which the lifetime was 86 fs (Fig. 9, grey). The second EADS (green, 226 fs) consists of carotenoid ground state bleach, carotenoid hot S1 excited state absorption from 520 to 700 nm and carotenoid radical cation absorption at 900 nm. The presence of the signature of both S1 and the charge-sepa- rated state in the second EADS implies that the carotenoid hot S1 state
Author's personal copy
Artificial Photosynthesis, First Edition, 2016, 169e192
Resolving Energy and Electron Transfer Processes in Dyads 185
Figure 8 First left singular vector of the residual matrix of the visible data of dyad 2 in toluene after 473 nm excitation using a model with six (A) or seven (B) lifetimes. Note that the time axis is linear until 10 ps (after the maximum of the instrument response function), and logarithmic thereafter.
Figure 9 EADS of dyad 2 in toluene after 473 nm excitation.
decays via at least two pathways, IC to S1 and ET to the fullerene. EET from S2 to the fullerene could also take place, but it cannot be identified because the spectral signature of singlet-excited fullerene is absent in the probed spectral window, since there is no change in the carotenoid bleach at
Author's personal copy
Artificial Photosynthesis, First Edition, 2016, 169e192
186 I.H.M. van Stokkum et al.
450 nm. Due to the shorter conjugation length of this carotenoid compared to the one in dyad 1, the carotenoid signals are shifted to the higher energy side of the spectrum. The anion of pyrollidinofullerene that was previously reported around 1010 nm (ε ¼ 8 X 10³ M-1 cm-1) (Guldi & Prato, 2000) was not detected and is probably obscured by the large signal of the carot- enoid radical cation (ε ¼ 105 M-1 cm-1) (Jeevarajan et al., 2011).
The second EADS (green) evolves in 226 fs into the third EADS (black). This evolution includes a large decay of the S1 excited state absorption and a decrease of the carotenoid ground state bleach. Note that this is accompa- nied by only a minor increase of the radical cation band, suggesting that the carotenoid hot S1 transfers most of its energy to the fullerene. The third EADS (black) evolves in 2.0 ps to the fourth EADS (red). The growth of the radical cation band shows that ET takes place from the carotenoid S1 state to the fullerene, preserving the carotenoid ground state bleach. Most strikingly, when the fourth EADS (red) evolves in 12.5 ps into the blue EADS, the carotenoid ground state bleach increases again, accompanied by a further in- crease of the 900 nm radical cation band. This can be interpreted as a charge separation process from the lowest fullerene excited state, whose energy level is estimated at 14,000/cm from the absorption spectrum. Decay of fullerene to the ground state can be neglected, as the lifetime of fullerene and derivatives is reported to be more than a nanosecond (Fujitsuka, Luo, Ito, Murata, & Komatsu, 1999). The last three steps are analogous to those of dyad 1. The radical pair population decays biexponentially with lifetimes of 143 and 514 ps, and a small triplet population remains (cyan). Selected traces and fits are depicted in Fig. 10. The decrease, increase and ultimately, decay of the carotenoid bleach are clearly seen at 435 nm. Decay of the S2 is visible as a spike at 494, 506, 512, 541 and 1013 nm. The rise and decay of the radical pair are visible in all traces, except for 541 nm. At 541 nm the decay of ESA from the carotenoid (hot) S1 state dominates. The final triplet state is clearly present at 506 and 512 nm.
The DADS (Fig. 11) show clear rises of the radical cation band at 900 nm with time constants of 2.0 and 12.5 ps (black and red). A minor rise with226 ps (light green) is also discernible. In the carotenoid bleach region the positive red band indicates the 12.5 ps rise attributed to ET from Ful*, the fullerene excited state. The small band at 550 nm is interpreted as slow ET from a population of carotenoid S1 taking place on the same time scale.
The kinetic scheme used for the target analysis is more complicated than with dyad 1. We need an additional fullerene excited state, which is assumed

Author's personal copy
Artificial Photosynthesis, First Edition, 2016, 169e192
Resolving Energy and Electron Transfer Processes in Dyads 187
Figure 10 Selected time traces of data (grey, in mOD) and fit (black) of dyad 2 in toluene. Note that the time axis is linear until 3 ps (after the maximum of the instrument response function), and logarithmic thereafter.
Figure 11 DADS of dyad 2 in toluene.
to possess a zero SADS in the measured wavelength region since there is virtually no bleach nor SE because fullerene has an absorption band around300 nm (Guldi & Prato, 2000). We will return to this assumption later. In addition a slowly decaying carotenoid S1 state is present, as can be seen from the 12.5 ps DADS and EADS. Leaving out the hot S2 state, we

Author's personal copy
Artificial Photosynthesis, First Edition, 2016, 169e192
188 I.H.M. van Stokkum et al.
Figure 12 Kinetic scheme for dyad 2 with estimated rate constants in 1/ps. Car, Carot- enoid; RP, radical pair.
Figure 13 SADS of dyad 2 in toluene using the kinetic scheme of Fig. 12. Note that theFul* SADS is assumed to be zero in this wavelength region.
need eight species, one more than the number of estimated components in the global analysis. After careful adjustment of the branchings from the carotenoid hot S1 state, we could estimate the ET rates from the carotenoid (hot) S1 and Ful*. The ET rates from the carotenoid (hot) S1 are about six times larger than with dyad 1, 0.46 versus 0.08/ps. This together with the contribution via Ful* results in a total RP yield of 79%, to which Ful* and the carotenoid excited states contribute, respectively, 31% and 48% (cf. the dashed and solid RP3 of Fig. 14). The total triplet yield is 4.6%, which means that only 16% of the excitations decay to the ground state from the carotenoid S2, hot S1 and S1 states. The populations of the states are depicted in Fig. 14.
Author's personal copy
Artificial Photosynthesis, First Edition, 2016, 169e192
Resolving Energy and Electron Transfer Processes in Dyads 189
Figure 14 Populations of the states, dashed lines indicate RP (radical pair) created from Ful*. RP3 integrates the decaying RP1 and RP2 states, whereas S0 integrates the decay- ing S2, and (hot) S1 states.
The estimated SADS are presented in Fig. 13. The three carotenoid hot S1
and S1 states (black, red and orange) are very similar: bleach around450 nm and ESA around 550 nm. Note that this ESA extends to 730 nmin the visible, and in the NIR a peak around 900 nm is present. This peak is the largest with the slowly decaying carotenoid S1 state (orange). Several explanations are possible. Perhaps a small fraction of the RP decays on this12.5 ps time scale. More likely is a contribution of the ESA of Ful* (Guldi& Prato, 2000), which we have assumed to be negligible. Apparently, this assumption is incorrect, and this leads to a reinterpretation of the ESA in the 650e1000 nm region of the (hot) S1 state. This ESA is now attributed to a mixed excited state (Car-Ful)*. An experiment with fullerene excitation could shed more light on this. Then a simultaneous target analysis of the ex- periments with carotenoid or fullerene excitation could further clarify the complicated dynamics of the excited state manifold of dyad 2.
Above 1050 nm the signals are more noisy, therefore, we used spectral constraints in that region: the black and red SADS are assumed equal, and the orange SADS has the same shape, but a larger amplitude. The triplet SADS is assumed to be zero above 1000 nm. In this way, four SADS can be resolved above 1050 nm from the more noisy data.
In conclusion, careful global analysis resolved the 2.0 and 12.5 ps life- times and the 226 fs lifetime of the carotenoid hot S1 state. Target analysis (Fig. 12) established that this state decays in five ways: to Ful* and S1 in (both with 1.6/ps), to a population of S1 showing slow ET (with 0.8/ps), to RP1 (with 0.46/ps) and to the ground state (with 0.06/ps). All estimated SADS (Fig. 13) were well interpretable and

Author's personal copy
Artificial Photosynthesis, First Edition, 2016, 169e192
indicate a mixed excited state (Car-Ful)*.

Author's personal copy
Artificial Photosynthesis, First Edition, 2016, 169e192
190 I.H.M. van Stokkum et al.
4. CONCLUSION
In the above described case studies, we have demonstrated that the target analysis methodology is mandatory to describe the processes of energy transfer and charge transfer in artificial photosynthetic systems. Thus we have developed minimal models, identified the steps, and estimated the pa- rameters that characterize the energy conversion in these systems. With this modeling tool the molecular mechanisms of the loss processes have been identified and quantified. This can then inspire photosynthetic device opti- mization by precisely targeting those sites involved in the most significant losses.
ACKNOWLEDGEMENTSRvG and IHMvS were supported by ERC Advanced Grant Photprot (to RvG). JJS and JR were supported by the BioSolar Cells Programme of the Dutch Ministry of Economic Affairs. JTMK was supported by a VICI grant of the Chemical Sciences council of the Netherlands Organization of Scientific Research (NWO-CW).
REFERENCESAlexandre, M. T. A., Luehrs, D. C., van Stokkum, I. H. M., Hiller, R., Groot, M.-L.,
Kennis, J. T. M., & Van Grondelle, R. (2007). Triplet state dynamics in peridinin-chlo- rophyll-a-protein: a new pathway of photoprotection in LHCs? Biophysical Journal, 93(6),2118e2128. http://dx.doi.org/10.1529/biophysj.107.106674.
Angerhofer, A., Bornh€auser, F., Gall, A., & Cogdell, R. J. (1995). Optical and optically detected magnetic resonance investigation on purple photosynthetic bacterial antennacomplexes. Chemical Physics, 194(2e3), 259e274. http://dx.doi.org/10.1016/0301-0104(95)00022-G.
Berera, R., van Grondelle, R., & Kennis, J. T. M. (2009). Ultrafast transient absorption spec- troscopy: principles and application to photosynthetic systems. Photosynthesis Research,101(2e3), 105e118.
Berera, R., Herrero, C., van Stokkum, I. H. M., Vengris, M., Kodis, G., Palacios, R. E., … Kennis, J. T. M. (2006). A simple artificial light-harvesting dyad asa model for excess energy dissipation in oxygenic photosynthesis. Proceedings of the Na-tional Academy of Sciences of the United States of America, 103(14), 5343e5348.
Berera, R., Moore, G. F., van Stokkum, I. H. M., Kodis, G., Liddell, P. A., Gervaldo, M., … Moore, A. L. (2006). Charge separation and energy transfer in a caro-tenoeC60 dyad: photoinduced electron transfer from the carotenoid excited states.Photochemical and Photobiological Sciences, 5(12), 1142e1149. http://dx.doi.org/10.1039/B613971J.
Bonetti, C., Alexandre, M. T. A., van Stokkum, I. H. M., Hiller, R. G., Groot, M. L., Grondelle, R.v., & Kennis, J. T. M. (2010). Identification of excited-state energy transfer and relaxation pathways in the peridininechlorophyll complex: an ultrafast mid-infrared study. Physical Chemistry Chemical Physics, 12(32), 9256e9266. http://dx.doi.org/10.1039/B923695C.
Fleming, G. R. (1986). Chemical applications of ultrafast spectroscopy.

u u g
Author's personal copy
Artificial Photosynthesis, First Edition, 2016, 169e192
Resolving Energy and Electron Transfer Processes in Dyads 191
Fujitsuka, M., Luo, C., Ito, O., Murata, Y., & Komatsu, K. (1999). Triplet properties and photoinduced electron-transfer reactions of C120, the [2þ2] dimer of fullerene C60. Jour- nal of Physical Chemistry A, 103(36), 7155e7160. http://dx.doi.org/10.1021/ jp990634w.
Fukuzumi, S. (2006). Bioinspired electron-transfer systems and applications. Bulletin of theChemical Society of Japan, 79(2), 177e195.
Gall, A., Berera, R., Alexandre, M. T. A., Pascal, A. A., Bordes, L., Mendes- Pinto, M. M., … Robert, B. (2011). Molecular adaptation of photoprotection: triplet states in light-harvesting proteins. Biophysical Journal, 101(4), 934e942. http://dx.doi.org/10.1016/j.bpj.2011.05.057.
Guldi, D. M. (2002). Fullereneeporphyrin architectures; photosynthetic antenna and reac- tion center models. Chemical Society Reviews, 31(1), 22e36. http://dx.doi.org/10.1039/B106962B.
Guldi, D. M., & Prato, M. (2000). Excited-state properties of C60 fullerene derivatives. Ac- counts of Chemical Research, 33(10), 695e703. http://dx.doi.org/10.1021/ar990144m.
Gust, D., Moore, T. A., & Moore, A. L. (2000). Photochemistry of supramolecular systems containing C60. Journal of Photochemistry and Photobiology B: Biology, 58(2e3), 63e71.
Hiroshi, I., Kiyoshi, H., Tsuyoshi, A., Masanori, A., Seiji, T., Tadashi, O., … Yoshiteru, S.(1996). The small reorganization energy of C60 in electron transfer. Chemical Physics Let- ters, 263(3e4), 545e550. http://dx.doi.org/10.1016/S0009-2614(96)01244-4.
Hitchcock, A. P., & Laposa, J. D. (1975). Vibrational frequencies of toluene-d5. Journal ofMolecular Spectroscopy, 54(2), 223e230. http://dx.doi.org/10.1016/0022-2852(75)90076-4.
Holzwarth, A. R. (1995). Time-resolved fluorescence spectroscopy. Biochemical Spectroscopy,246, 334e362.
Holzwarth, A. R. (1996). Data analysis of time-resolved measurements. In J. Amesz, & A. J. Hoff (Eds.), Biophysical techniques in photosynthesis (pp. 75e92). Dordrecht, The Netherlands: Kluwer.
Jeevarajan, J. A., Wei, C. C., Jeevarajan, A. S., & Kispert, L. D. (2011). Optical absorptionspectra of dications of carotenoids. Journal of Physical Chemistry, 100(14), 5637e5641. http://dx.doi.org/10.1021/jp9530663.
Kloz, M., Pillai, S., Kodis, G., Gust, D., Moore, T. A., Moore, A. L., … Kennis, J. T. M. (2011). Carotenoid photoprotection in artificial photosynthetic antennas. Journal of theAmerican Chemical Society, 133(18), 7007e7015. http://dx.doi.org/10.1021/ja1103553.
Kloz, M., Pillai, S., Kodis, G., Gust, D., Moore, T. A., Moore, A. L., … Kennis, J. T. M.(2012). New light-harvesting roles of hot and forbidden carotenoid states in artificialphotosynthetic constructs. Chemical Science, 3(6), 2052e2061. http://dx.doi.org/10.1039/c2sc01023b.
Kodis, G., Herrero, C., Palacios, R., Marin~o-Ochoa, E., Gould, S., de laGarza, L., … Kennis, J. T. M. (2004). Light harvesting and photoprotective functions of carotenoids in compact artificial photosynthetic antenna designs. Journal of Physical Chemistry B, 108(1), 414e425. http://dx.doi.org/10.1021/jp036139o.
Koyama, Y., Kakitani, Y., Miki, T., Christiana, R., & Nagae, H. (2010). Excited-state dy-namics of overlapped optically-allowed 1Bþ and optically-forbidden 1B- or 3A-
vibronic levels of carotenoids: possible roles in the light-harvesting function. InternationalJournal of Molecular Sciences, 11(4), 1888e1929. http://dx.doi.org/10.3390/ijms11041888.
Marcus, R. A., & Sutin, N. (1985). Electron transfers in chemistry and biology. Biochimica etBiophysica Acta (BBA) e Reviews on Bioenergetics, 811(3), 265e322. http://dx.doi.org/10.1016/0304-4173(85)90014-X.
Mullen, K. M., & van Stokkum, I. H. M. (2007). TIMP: an R package for modeling multi- way spectroscopic measurements. Journal of Statistical Software, 18(3).

Author's personal copy
Artificial Photosynthesis, First Edition, 2016, 169e192
192 I.H.M. van Stokkum et al.
Nagle, J. F., Parodi, L. A., & Lozier, R. H. (1982). Procedure for testing kinetic-models of the photocycle of bacteriorhodopsin. Biophysical Journal, 38(2), 161e174.
Palacios, R. E., Kodis, G., Herrero, C., Ochoa, E. M., Gervaldo, M.,Gould, S. L., … Moore, A. L. (2006). Tetrapyrrole singlet excited state quenching by ca- rotenoids in an artificial photosynthetic antenna. Journal of Physical Chemistry B, 110(50),25411e25420. http://dx.doi.org/10.1021/jp0645317.
Pillai, S., Ravensbergen, J., Antoniuk-Pablant, A., Sherman, B. D., van Grondelle, R., Frese, R. N., … Kennis, J. T. M. (2013). Carotenoids as electron or excited-state energy donors in artificial photosynthesis: an ultrafast investigation of a carotenoporphyrin and acarotenofullerene dyad. Physical Chemistry Chemical Physics, 15(13), 4775e4784. http://dx.doi.org/10.1039/c3cp50364j.
Polívka, T., & Sundstrom, V. (2004). Ultrafast dynamics of carotenoid excited states: from solution to natural and artificial systems. Chemical Reviews, 104(4), 2021e2072.
R Development Core Team. (2010). R: A language and environment for statistical computing.Vienna, Austria: R Foundation for Statistical Computing.
Snellenburg, J. J., Laptenok, S. P., Seger, R., Mullen, K. M., & van Stokkum, I. H. M. (2012). Glotaran: a Java-based graphical user interface for the R-package TIMP. Journalof Statistical Software, 49(3), 1e22. http://www.jstatsoft.org/v49/i03/.
van Stokkum, I. H. M., & Bal, H. E. (2006). A problem solving environment for interactive modelling of multiway data. Concurrency and Computation: Practice and Experience, 18,263e269. http://dx.doi.org/10.1002/cpe.916.
van Stokkum, I. H. M., Larsen, D. S., & van Grondelle, R. (2004). Global and target analysis of time-resolved spectra. Biochimica et Biophysica Acta, 1657, 82e104.
van Stokkum, I. H. M., van Oort, B., van Mourik, F., Gobets, B., & van Amerongen, H. (2008). (Sub)-picosecond spectral evolution of fluorescence studied with a synchroscanstreak-camera system and target analysis. In T. J. Aartsma, & J. Matysik (Eds.), Biophysical techniques in photosynthesis (Vol. II, pp. 223e240). Dordrecht, The Netherlands: Springer. Williams, R. M., V^an Anh, N., & van Stokkum, I. H. M. (2013). Triplet formation by
chargerecombination in thin film blends of perylene red and pyrene: developing a target modelfor the photophysics of organic photovoltaic materials. Journal of Physical Chemistry B,117(38), 11239e11248. http://dx.doi.org/10.1021/jp402086p.
Williams, R. M., Zwier, J. M., & Verhoeven, J. W. (1995). Photoinduced intramolecular electron-transfer in a bridged C-60 (acceptor) aniline (donor) system photophysicalproperties of the first active fullerene diad. Journal of the American Chemical Society,117(14), 4093e4099. http://dx.doi.org/10.1021/ja00119a025.
Wro'bel, D., & Graja, A. (2011). Photoinduced electron transfer processes in fullereneeorganic chromophore systems. Coordination Chemistry Reviews, 255(21e22), 2555e2577. http:// dx.doi.org/10.1016/j.ccr.2010.12.026.
Zhang, J. P., Inaba, T., Watanabe, Y., & Koyama, Y. (2000a). Excited-state dynamics among the 1Bþ , 1B- and 2A- states of all-trans-neurosporene as revealed by near-infraredu u gtime-resolved absorption spectroscopy. Chemical Physics Letters, 332(3e4), 351e358.http://dx.doi.org/10.1016/s0009-2614(00)01275-6.
Zhang, J. P., Inaba, T., Watanabe, Y., & Koyama, Y. (2000b). Sub-picosecond time-resolved absorption spectroscopy of all-trans-neurosporene in solution and bound to the LH2complex from Rhodobacter sphaeroides G1C. Chemical Physics Letters, 331(2e4), 154e162. http://dx.doi.org/10.1016/s0009-2614(00)01165-9.
Zigmantas, D., Polívka, T., Hiller, R. G., Yartsev, A., & Sundstro€m, V. (2001). Spectroscopic and dynamic properties of the peridinin lowest singlet excited states. Journal of Physical Chemistry A, 105(45), 10296e10306.