iucn water and nature initiative pangani...
TRANSCRIPT

IUCN WATER AND NATURE INITIATIVE
PANGANI BASIN WATER BOARD
PANGANI RIVER BASIN FLOW ASSESSMENT
Basin Delineation Report
Pangani River System: State of the Basin Report
1 As of 2010, Pangani Basin Water Office is known as Pangani Basin Water Board
IUCN WATER AND NATURE INITIATIVE
PANGANI BASIN WATER BOARD1
PANGANI RIVER BASIN FLOW ASSESSMENT
Basin Delineation Report
Pangani River System: State of the Basin Report
2007
As of 2010, Pangani Basin Water Office is known as Pangani Basin Water Board
IUCN WATER AND NATURE INITIATIVE
PANGANI RIVER BASIN FLOW ASSESSMENT
Pangani River System: State of the Basin Report
IUCN WATER AND NATURE INITIATIVE
PANGANI BASIN WATER BOARD1
PANGANI RIVER BASIN FLOW ASSESSMENT
Basin Delineation Report
Final Report
J. King, C. Brown, J. Turpie, B. Clark, A. Duffel-Graham, G. Lugomela, H. Sadiki, B. L. Benno, A. Hepelwa, L. T Kaaya, D Salum, L. Lukambuzi, E. Materu, Felix Peter, S. Kamugisha, F. Mahay and H. Beuster
January 2008
1 As of 2010, Pangani Basin Water Office is known as Pangani Basin Water Board
IUCN WATER AND NATURE INITIATIVE
PANGANI BASIN WATER BOARD1
PANGANI RIVER BASIN FLOW ASSESSMENT
Basin Delineation Report
Final Report
J. King, C. Brown, J. Turpie, B. Clark, A. Duffel-Graham, G. Lugomela, H. Sadiki, B. L. Benno, A. Hepelwa, L. T Kaaya, D Salum, L. Lukambuzi, E. Materu, Felix Peter, S. Kamugisha, F. Mahay and H. Beuster
January 2008
1 As of 2010, Pangani Basin Water Office is known as Pangani Basin Water Board
IUCN WATER AND NATURE INITIATIVE
PANGANI BASIN WATER BOARD
PANGANI RIVER BASIN FLOW ASSESSMENT
Basin Delineation Report
Pangani River System: State of the Basin Report
1 As of 2010, Pangani Basin Water Office is known as Pangani Basin Water Board
IUCN WATER AND NATURE INITIATIVE
PANGANI BASIN WATER BOARD1
PANGANI RIVER BASIN FLOW ASSESSMENT
Basin Delineation Report
Pangani River System: State of the Basin Report
2007
As of 2010, Pangani Basin Water Office is known as Pangani Basin Water Board
IUCN WATER AND NATURE INITIATIVE
PANGANI RIVER BASIN FLOW ASSESSMENT
Pangani River System: State of the Basin Report

PANGANI RIVER SYSTEMState of the Basin Report - 2007
Tanzania
2 PANGANI RIVER SYSTEM
The Pangani River Basin Management Project is generating technical information and developing participatory forums to support equitable and sustainable water allocations in Pangani Basin, Tanzania. The Pangani Basin Water Office is implementing the project with technical assistance from the World Conservation Union (IUCN), the Netherlands Development Organization (SNV) and the local NGO PAMOJA. The project is financially supported by the IUCN Water & Nature Initiative, the Global Enviroment Facility through UNDP, and the ACP-EU Water Facility of the European Commission.
Project Partners

THE STATE OF THE BASIN REPORT - 2007 3
State of the Basin ReportThis State of the Basin Report has been prepared as part of the Flow Assessment Component of the Pangani River Basin Management Project. Its aim is to collect and synthesize present knowledge on the Pangani River system and its users, and to help promote an integrated approach to future water-allocation decisions. Such an approach is called Integrated Water Resource Management (IWRM). In conducting this work, Tanzanian and international specialists worked together through 2005 to 2006 to develop an understanding of the hydrology (timing and volumes of flow) of the whole Pangani River Basin, the physical, chemical and biological nature and health of the river ecosystem and the importance of the river for peoples’ lives and livelihoods.
This report is a summary of 6 technical reports that have already been written by the project team. These are: Hydrology of the Pangani River Basin, Basin Delineation Report, Scenario Selection Report, River Health Assessment, Estuary Health Assessment, Socio-economic Assessment.
This document reports on the condition of the river system in the 2006 dry and wet seasons and identifies key areas of concern for the river system, estuary and major wetlands. It also highlights the relationships between the river and the people of the basin, reports on their well-being and begins to explore their sensitivity to changes in flow and ecosystem condition.
The knowledge will be used to guide future research on the river and its users in the next part of the project, and to develop a simple decision-making tool that can aid decisions on a fair balance between water development and protection of the river’s resources.
This publication is based on the South African River Health Programme Reports.

4 PANGANI RIVER SYSTEM
The TeamName Organisation Specialisation
Project Design and Implementation
Mr Hamza Sadiki Pangani Basin Water Office Basin Officer
Mr Julius Sarmett* Pangani Basin Water Office Basin Officer
Dr Kelly West IUCN Program Coordinator
Mr Sylvand Kamugisha IUCN Project Coordinator
Mr William Luanda IUCN Adminstration
International Environmental Flow Assessment Mentors
Dr Jackie King Southern Waters/
University of Cape Town Project Manager
Dr Cate Brown Southern Waters River ecosystems
Dr Helen Dallas Freshwater Consulting Group Leader river survey
Dr Jane Turpie Anchor Environmental Leader social survey
Dr Barry Clark Anchor Environmental Leader estuarine survey
Mr Hans Beuster Emzantsi Systems Hydrology
* Mr Sarmett is currently the Basin Water Officer for Wami-Ruvu Basin

THE STATE OF THE BASIN REPORT - 2007 5
Tanzanian Environmental Flow Assessment Team
Dr Benaiah Benno University of Dar es Salaam Fisheries Ecology
Dr George Lugomela Pangani Basin Water Office Hydrology
Ms Lilian Lukambuzi National Environmental Council NEMC
Ms Dotto Salum Institute of Marine Sciences Marine Ecology
Mr Aloyce Hepelwa University of Dar es Salaam Socio-economics
Ms Eudosia Materu Ministry of Water Water Quality
Ms Lulu Tunu Kaaya University of Dar es Salaam Freshwater ecology
Eng Ingonya Nkuba Pangani Basin Water Office Engineer/Economist
Mr Frank Mbago University of Dar es Salaam Botany
Ms Arafa Maggidi Ministry of Water Environment
Mr John Mbaga Pangani Basin Water Office Hydrology Technician
Mr Erasto William Pangani Basin Water Office Driver/Logistics
Mr Moses Chillah University of Dar es Salaam Enumerator
Ms Kanasia Malisa University of Dar es Salaam Enumerator
Mr Myige Busumba University of Dar es Salaam Enumerator
Ms Dorothy Mungure University of Dar es Salaam Enumerator
Mr Rustis Bernard University of Dar es Salaam Enumerator
Mr Shedrack Wililo Sokoine University of Agriculture Enumerator
Mr Bwagalilo Fadhili University of Dar es Salaam Enumerator
Ms Evaclotilda Mathew University of Dar es Salaam Enumerator
Mr Felix Peter Ministry of Water GIS
Institute of Marine SciencesUniversity of Dar es Salaam

6 PANGANI RIVER SYSTEM
ContentsState of the Basin Report 3
The Team 4
Credits 8Foreword 9
Integrated Water Resource Management 10 Rivers – lifeblood of the nation 10 Why do we need IWRM? 11 The Dublin Principles 1992 11
Water Policy, Legislation and Management 12
Overview of the Basin 14 Climate 14 Socio-economic zones 15 River zones 15 Estuary 15
Historical Perspectives 16 Pangani Town 16 Farming 17
Key Water-Related Issues in the Basin 18 Poverty 18 Water quality 18 Water shortages 18 Water supply 18 Climate change 19 Awareness 19 Data, capacity and skills 19
Land Use 20
Water Resources and Use 21
Main Uses of Water 22 Domestic use 22 Agriculture 22 Hydropower 22 Mining 23 Livestock 23 Other sectors 23
THE STATE OF THE BASIN REPORT - 2007 7
Rivers and People 24
Water for the Environment 25
Measurement of Health and Well-being 26 Measures of river-related social well being 26 Measures of river and estuary health 27 The plants and animals 28 River health categories 29
Present State: Physical 30 The flow regime 30 The channel 31
Present State: Chemical and Plants 32 Water quality 32 Vegetation 33
Present State: Animals 34 Aquatic invertebrates 34 Fish 35
Present State: How People Use the River 36 Farming 36 Fishing and other river resources 36 Drinking water 37 Income from river resources 37
Key Areas of Concern 38 Lake Jipe 38 Nyumba ya Mungu 38 Kirua Swamp 38 The Kikuletwa River at Wahoga Chini 39 The Ruvu River at Kifaru 39 The Pangani River at Hale 39 The Mkomazi River downstream of Kalimawe Dam 39 Impacts of reduced flows on HEP 40 Pangani Estuary 40 Riparian corridors 41
Towards Integrated Flow Management 42
Site Summary of River Condition 44
Further Reading 46

8 PANGANI RIVER SYSTEM
CreditsPublished by: Pangani Basin Water Office IUCN – The World Conservation Union Eastern Africa Regional Program
Copyright: © 2002 Pangani Basin Water Office and International Union for Conservation of Nature and Natural Resources
Reproduction of this publication for education or other con-commercial purposes is authorized without prior written permission from the copyright holder, provided the source is fully acknowledged. Reproduction of this publication for resale or other commercial purpose is prohibited without prior written permission of the copyright holder.
Citation: PBWO/IUCN (2007). Pangani River System – State of the Basin Report – 2007. PBWO, Moshi, Tanzania and IUCN Eastern Africa Regional Program, Nairobi, Kenya.
ISBN: 978-2-8317-0977-2
Designed by: Anthony Mwangi, Antodezigns
Printed by: Kul Graphics
Photos: Photos were contributed by the Environmental Flow Assessment team members and Mr. Job de Graaf and Mr. Taco Anema.
This publication is based on the South African River Health Programme Reports.
Available from:
Pangani Basin Water Office Box 7617 Moshi Tanzania [email protected]
IUCN Eastern Africa Regional Office Box 68200 Nairobi 00200 Kenya [email protected]
The views expressed in this publication do not necessarily reflect those of the Government of Tanzania or IUCN – The World Conservation Union. The designation of geographical entities in this book and the presentation of the material do not imply the expression of any opinion whatsoever on the part of the Government of Tanzania or IUCN – The World Conservation Union concerning the legal status of any country, territory or area or of its authorities or concerning the delimitation of its frontiers or boundaries.

THE STATE OF THE BASIN REPORT - 2007 9
ForewordHealthy ecosystems play an important role in supplying goods and services that fuel both local livelihoods and national growth and development. Hydropower production, water purification, livestock, fisheries, bricks, thatch and other building materials, irrigated crops for local consumption, irrigated crops for export markets, domestic drinking, bathing, laundry and sanitation are just some of the goods and services from Pangani Basin that depend on the wise management of our ecosystems.
However, increased demand for water, coupled with changing climatic conditions, competing uses, over-abstraction and watershed degradation are increasingly challenging Tanzania’s ecosystems and freshwater supplies. Increased upstream abstractions for irrigation, for example, have resulted in the drying of the Nduruma River in Pangani Basin.
Recognizing the critical link between healthy ecosystems and sustainable development, the Government endorsed a new National Water Policy (NAWAPO) in 2002, which supports the conservation of Tanzania’s ecosystems and freshwater resources. NAWAPO stipulates that the environment will receive second priority in allocating water resources, behind water for basic human needs. The Environmental Management Act (2004) further stresses the importance of water for the environment by requiring the Basin Water Boards to allocate enough water for ecosystems.
The challenge we are faced with is to know: how much water does the environment need to maintain itself and its functions?
The Ministry of Water, through Pangani Basin Water Office in Moshi and with technical support from IUCN, is piloting a Flow Assessment (FA) in Pangani River Basin. The FA will determine, among others, the amount of water required for the basin’s ecosystems to maintain themselves and their functions. Detailed studies on the hydrology, river health, estuary health and socio-economics of the basin have been conducted as initial steps in the Flow Assessment. This State of the Basin report summarizes the key findings from these technical studies for a general audience. It serves as a baseline marking our current understanding of the health and functions of the Pangani River System. This report does not stand-alone, the Flow Assessment will build on this baseline and future reports will analyze the social, economic and environmental costs, benefits and trade-offs of different water allocation scenarios.
It is our hope that the multi-disciplinary team of Tanzanians participating in this process will support similar initiatives in other basins in the country.
Washington Nyakale MutayobaDirector of Water ResourcesMinistry of Water, Tanzania

10 PANGANI RIVER SYSTEM
Integrated Water Resource Management
Modern Integrated Water Resource Management (IWRM) is a process that promotes the coordinated use of water, land and related resources. It seeks to maximise the resultant economic and social development in a fair manner that does not compromise the sustainability of aquatic ecosystems.
Rivers - lifeblood of the nation Rivers are the lifeblood of national economies, the source of most water for drinking, washing, cooking, crops, power generation and industry. Until the last few decades they provided water for these uses as well as supporting rural livelihoods and maintaining habitats for river plants and animals. Now, through population growth and over-use, most are declining in condition, or health, and can no longer support the full suite of activities that we have come to expect from them, in-cluding:
Agriculture
Water supply and wastewater
Mining
Industry
Ecosystems
Fisheries
Urban areas
Tourism
Energy
Transport

THE STATE OF THE BASIN REPORT - 2007 11
THE DUBLIN PRINCIPLES 1992
Fresh water is a finite and vulnerable resource, essential to sustain life, development and the environment.
Water development and management should be based on a participatory approach involving users, planners and policy-makers at all levels.
Women play a central part in the provision, management and safeguarding of water.
Water has an economic value in all its competing uses and should be recognised as an economic good.
Why do we need IWRM?We all live in - and with - the hydrological cycle: water constantly moves over or under the ground, evaporates into the atmosphere and then recycles as rain or snow. As it passes through the ground phase we use it in many ways, and need to share it in a way that does not destroy the ecosystems that provide it.
We have not been doing this, and by the latter half of the last century, river health was declining worldwide because of uncontrolled abstractions of water. Water had been taken without thinking of the water needs of the rivers themselves. As a result, benefits gained from water developments were being countered by costs (losses) as the health of the systems declined. Losses could be in ecosystem goods, such as fish, wood and predictable supplies of good-quality water, or in ecosystem services such as the recharge of groundwater, the maintenance of channels or the attenuation (calming) of floods. All of these changes in rivers have human costs in some way.
At some point along the development trajectory losses usually outweigh benefits, but people – including decision-makers - were unaware of this until about the 1970s-1980s.
Gradually, it was realised that all institutions and groups of people with an interest in water needed to work together to identify the full suite of benefits and costs of various kinds of water use and so to find an appropriate balance between resource protection and development. This balance could differ from river to river.
Modern IWRM emerged from this awareness. It is based on the four Dublin Principles, which were agreed at an International Conference on Water and the Environment in 1992. These principles reflect that development, if it is to be sustainable into the future, must address three fundamental issues: environmental integrity, economic development and social justice.

12 PANGANI RIVER SYSTEM
Water Policy, Legislation and ManagementTanzania’s National Development Vision 2025, the Poverty Reduction Strategy Paper (2000), and the National Strategy for Growth and Reduction of Poverty (MKUKUTA) aim at achieving an absence of abject poverty and attaining a high quality of life for all Tanzanians. These documents outline the objectives and strategies for political, social and economic reforms to assist in combating poverty and promoting economic growth in Tanzania.
In recognition of the important role that water plays in both maintaining local livelihoods and fuelling economic growth and development, MKUKUTA commits Tanzania to achieving the Millennium Development Goals (MDGs) for access to safe water, sanitation and a healthy environment. In order to meet its MDG targets, the Ministry of Water has embarked on wide-ranging water sector reform processes, including: policy review, sector-wide approach, decentralization of service provision, full cost recovery, private sector participation and wise use and equitable allocation in all basins.
Water Resources in Tanzania are managed by the Ministry of Water under the Water Utilization (Control and Regulation) Act No. 42 of 1974 and it subsequent amendments. As part of its sector reforms, the Ministry of Water launched a new National Water Policy (NAWAPO) in 2002, with the vision of “a country where there is equitable and sustainable use and management of water resources for economic development, and for maintenance of the environment.” The policy recommends that water be managed at the basin level, in a participatory and equitable way that emphasizes sustainability and conservation of the resource. Water for basic human needs is the highest priority for water allocation, followed by water for the maintenance of ecosystems.
To support the implementation of NAWAPO, the National Water Sector Development Strategy 2005 - 2015 was prepared. It supports, among others, the re-alignment of water related aspects of other key

THE STATE OF THE BASIN REPORT - 2007 13
policies and institutional frameworks that separate the delivery and regulation of services. This has been translated into three key programs: Water Resources Management Program, National Rural Water Supply and Sanitation Program, and Urban Water Supply and Sewerage Program, which together form the Water Sector Development Program (2006).
Legislation to support the implementation of the water policy and sector strategy is being reviewed to take into account the current reform processes.
The amendment Act of 1981 (Amendment No. 10) gave the responsibility for water management to the basin level. Tanzania was divided into nine large hydrographic basins, including the Pangani Basin, which was gazetted in 1981. The Pangani Basin totals 58,800 km2 (about 5% of which is in the Republic of Kenya) and includes the Msangazi, Pangani, Umba, Zigi, Mkulumuzi, and small Coastal River Basins in northeastern Tanzania. Lakes Challa and Jipe are a part of the Pangani Basin. The main Pangani River Basin, with an area of about 43,650 km2, is the largest of the four sub-basins and is the subject of this report.
The Pangani Basin Water Office was established in 1991 to manage water in this area and, guided by the Pangani Basin Water Board, is specifically responsible for:
• Water resource assessment• Allocating water for different uses• Managing and controlling water use• Monitoring and controlling pollution• Water-related conflict resolution• Awareness creation on effective and efficient water use• Collection of water user and wastewater discharge fees• Participating in water conservation programmes

14 PANGANI RIVER SYSTEM
Overview of the BasinThe Pangani River Basin covers 43,650 square kilometres, with 5% of this area in Kenya and the remainder distributed across the Arusha, Kilimanjaro, Manyara and Tanga administrative regions of Tanzania. The Pangani River rises as a series of small streams on the southern sides of Africa’s highest peak, Mt. Kilimanjaro, and on Mt. Meru, which together create the Kikuletwa and the Ruvu Rivers. These join to form the Pangani River, which then passes through the arid Masai Steppe, draining the Pare and Usambara Mountain Ranges (Mkomazi and Luengera tributaries) before reaching the estuary and Indian Ocean at the coastal town of Pangani. The river is 500 km long.
Variations in the local climate in the Pangani River Basin are mostly related to topography. The flatter, lower-lying south-western half of the Basin is arid and hot, while the mountain ranges along the northern and south-eastern catchment boundaries have cooler, wetter conditions. The high altitude slopes above the forest line on Mt Meru and Mt Kilimanjaro have an Afro-Alpine climate and receive more than 2500 mm of rainfall per year. Mean annual rainfall increases in a southerly direction along the mountain ranges, and varies from about 650 mm per year in the North and South Pare Mountains, to 800 mm per year in the Western Usambara Mountains, and 2000 mm per year in the Eastern Usambara Mts.
Climate

THE STATE OF THE BASIN REPORT - 2007 15
Socio-economic zonesThere are eight relatively homogeneous socio-economic zones that are grouped on the basis of land use and relationships to aquatic eco-systems. These zones are Northern Highlands, Eastern Highlands, Swamps and Lakes, Kirua Swamp, Western Arid, South-western Arid, Me-sic (wet) Lowlands and Coast. The people in the Western and South-western Arid Zones do not have strong links with the river system and these areas are not considered further here.
EstuaryThe estuary, in turn, shows zonation from an upper reach with brackish water to a lower reach dominated by sea water.
River zonesThe rivers in the Pangani Basin may be divid-ed into nine zones of similar ecological char-acteristics. These are: Mountain Torrent Mountain Stream Upper Foothill, Rejuvenated Foothill Swamps and Lakes, Kirua Swamp Lower Foothill Mature Lower River

16 PANGANI RIVER SYSTEM
Historical Perspectives
Pangani TownSituated at the estuary of the river and the Indian Ocean, the town of Pangani was a cosmo-politan place several centuries ago, influenced by the “Swahili” peoples (Africans with strong links and influences to Arab, In-dian and Persian civilizations). Pangani was closely connected to Bagamoyo, Zanzibar, Kilwa, Mombassa and other towns in the Western Indian Ocean and the rest of the world through trade in slaves, coconut oil, mil-let and soreghum.
During the colonial period, Pan-gani remained an important port and administrative center for commerce along the coast of eastern Africa and the islands of the Western Indian Ocean. With the abolition of the slave trade and the eventual develop-ment of railway and road infra-structure into the interior of the country, this area has seen rela-tively less commercial activity. It remains a district headquarters and fishing and agriculture (co-conut palm and betel nut plan-tations) are important activities.

THE STATE OF THE BASIN REPORT - 2007 17
FarmingThe Chagga peoples have lived on Mt. Kilimanjaro’s slopes for between 300-450 years. By the 1940s, the intensity of the Chagga farming activities was such that according to some, (e.g. Johnston 1946), there was very little land left to use as pasture and most livestock were stall-fed. The Chagga could not expand up the mountain because this was already set aside as forest reserve, and they could not expand into the middle slope areas because this was ‘alienated’ land for European settlers. Against this background of high farming intensity, the Chagga devised furrow systems to deliver water from natural watercourses to their crops. This system, said to have originated in the 18th century (Gillingham 1999), is thought to be one of the oldest and most extensive furrow-based irrigation systems in Africa. Complex social and management systems complemented the furrow infrastructure; furrow board members were expected to assist in maintaining furrows, non-members paid fees to abstract water (IUCN 2003). Today Pangani River Basin has more than 2,000 traditional furrows (Mujwahuzi 2001), which account for a significant portion of the basin’s irrigated area. Many of these traditional furrow systems have not changed in centuries and some are very inefficient (as much as 85% of the water abstracted may be wasted). With increasing competition for water resources, improving irrigation efficiency has become a priority for several initiatives, including the World Bank funded Small-holder Irrigation Improvement Project and the Traditional Irrigation and Environmental Development Organisation (TIP).

18 PANGANI RIVER SYSTEM
Key Water-Related Issues in the BasinPovertyThirty-six percent of Tanzanians live below the poverty line. Poverty constrains people from in-vesting in more efficient technologies, and from coordinating development planning to take into account the needs of all water users and the environment. Poor people in rural areas tend to be most directly dependent on natural resources, such as those provided by rivers, and are most vulnerable to declining river health.
Water qualityWater quality is deteriorating due to poor land-use practices, effluent and solid waste pollution, and intrusion of saline water into the estuary because of weakened river flow.
Water shortagesWater shortages are felt in all economic sectors, resulting in depressed economic outputs during droughts. Agricultural production is declining or is limited in growth because of the water shortages but, despite this, more hydroelectric power developments are planned in the Northern and Eastern Highlands and on the lower Pangani River. Shortages of domestic water occur throughout the basin and people may need to rely more on groundwater or rainwater tanks.
Water supplyThe Pangani Basin is water-stressed. Water supply is decreasing because of climate change and basin degradation, while demand is increasing because of growing population numbers, economic
growth and new uses of the land. The amount of water present in the river system is over-allocated, creating conflict among water users. Wetlands and perennial rivers are drying up.
Photo at left shows technicians standing in the confluence of the Nduruma and Kikuletwa Rivers during a recent dry season.

THE STATE OF THE BASIN REPORT - 2007 19
Climate ChangeOwing to a decline in precipita-tion and a local warming trend in the second half of the 20th
century, Mount Kilimanjaro’s famous glaciers are now pro-jected to disappear completely by the year 2020. They rep-resent an important local and international symbol of global warming and climate change. Recent studies (OECD 2003) suggest that the greatest threats of the increasing temperature and decreasing precipitation are an increased intensity and risk of forest fires. Forest fires have already seriously impacted the hydrological balance of the mountain’s drainage basins. A continuation of current trends in climate, fire frequen-cies and human impacts could result in the loss of most of the remaining sub-alpine forests in a matter of years and with this, Mount Kilimanjaro would lose its most effective water catch-ment (OECD 2003). Climate change adaptation strategies will need to focus on conservation strategies for the Kilimanjaro ecosystem and urgent adaptation measures in the agriculture and water sectors to cushion against negative impacts and harness new opportunities.
Awareness There is a general lack of awareness about catchment and water conservation issues among basin inhabitants, and a lack of enforcement of legislation pertaining to water use and wastewater treatment. This means that initiatives promoting wise use of water, such as managing water demand through licensing and pricing may be unpopular. There is little understanding among the people of the basin of the tradeoffs between resource protection and development that the government must make.
Data, capacity and skillsThe network of stations for measuring river flow in the basin has been upgraded. This project is using all present data to develop hydrological and other models for the basin. This is a fundamental first step in implementing an IWRM approach for the Pangani Basin. Other kinds of data on the river system and its subsistence users remain scarce. This hampers informed management. Skills and capacity in IWRM are urgently needed and this is beginning to be addressed in this and related projects.
Impacts: the river systemAll of the above issues affect the condition of the river system and its ability to provide valued goods and services.

20 PANGANI RIVER SYSTEM
Land use in the basin is governed primarily by rainfall but also by slope, soils and availability of surface water. Coffee, bananas, flowers and vegetables are grown in the wetter highlands, where dairy production using a zero-grazing system is also important.
The mountain foothills are used mainly for crops such as rice, sugarcane, bananas, maize, tomatoes, beans, sugarcane, millet, sorghum, wheat, groundnuts and onions. Most of the crops are irrigated from the rivers.
The drier mountain foothills and the lower lying floodplain areas are used for sisal production. Dryland cultivation of maize and sorghum takes place in the arid south-west.
In the wetter coastal lowlands near the estuary, important crops include coconut, sweet potatoes, pumpkins, cassava, okra, sisal and fruits.
Small numbers of cattle and sheep are kept in the higher parts of the basin but are more important in the arid regions. Livestock outputs in the upper areas are mostly milk and beef, and meat only in arid rangelands.
PopulationAbout 2.6 million people live in the Pangani River Basin. More than 80% of them depend on agriculture, directly or indirectly, for their livelihood.
The highland areas and the coast have higher densities of people and urban areas, whereas the middle lowland areas have scattered small settlements.
Population growth rates are much higher in the highland areas than the lowlands, suggesting that there is a net movement of people into the highlands.
Land Use

THE STATE OF THE BASIN REPORT - 2007 21
Water Resources and Use The Pangani River
Basin has five main sub-basins in which the main rivers differ significantly
in their hydrological characteristics.
These are:
Kikuletwa
Ruvu
Mkomazi
Luengera
mainstem Pangani
The Kikuletwa and Ruvu catchments have a series of large springs in a semi-circular band to the south of Mt Meru and Mt Kilimanjaro. These springs are recharged by groundwater from volcanic aquifers that act like artesian wells.
The largest springs in the Kikuletwa Catchment are the Chemka, Rundugai and Kware Springs. These three springs contribute about 90% of the dry-season river flows downstream in the Kikuletwa River.
Water UseProductivity in the broadest sense, including agriculture, hydropower generation and environmental goods and services furnished through natural resources and nature reserves depend on an adequate supply of clean water. Almost 90% of the surface flow in Pangani Basin is used for irrigation and hydropower generation. Yet this does not meet the current demand for water for these activities. Water efficiency among irrigation systems is often as low as 15%. Hydropower production is regularly as low as 35% of capacity. Conflicts are emerging between various water users. Dwindling water resources threaten the livelihoods dependent on irrigated agriculture and the other important contributions Pangani River Basin’s water resources make to the national economy. Insecurity of water supplies undermines Tanzania’s efforts to secure livelihoods and reduce poverty levels.

22 PANGANI RIVER SYSTEM
Main Uses of WaterDomestic UseAccessibility to water for domestic use varies across the basin. In considering national statistics for Tanzania (Faraji 2007), most households in urban areas enjoy reliable access to safe drinking water, whereas about half of the rural populations do. Many rural households still rely on the river itself for drinking water and bathing.
AgricultureAbout 80% of Pangani River Basin’s population relies on agriculture, directly or indirectly, for their livelihoods. Irrigated agriculture is a significant consumer of water in the basin. Coffee, sugar, flowers, and fruits and vegetables, much of these for export, are irrigated in large plantations or estates in the northern part of the basin. Many other crops, including rice, maize, beans, bananas and vegetables are grown for local markets.
HydropowerThere are three hydropower stations on the Pangani River, Nyumba ya Mungu, Hale and Pangani Falls which supply up to 91.5 MW or 17% of Tanzania’s power. Though hydropower production does not “consume” water, it only “uses” it to produce power; the nature of the location of Pangani Falls means that water for hydropower generation cannot be used for other demands upstream. Water shortages in the dry season can cause hydroelectric power production to drop to 30% of capacity.

THE STATE OF THE BASIN REPORT - 2007 23
MiningThere are extensive mining interests in the Pangani River Basin. These include tin mining in Korogwe, tanzanite and phosphate mines in the Arusha area, limestone mines near Tanga and gold panning in the Usambara Mountains. Gemstones are a significant industry and 80% of the worlds known tanzanite reserves are found at Merelani, outside of Arusha. Sand mining for building purposes is also common along riverbanks.
LivestockMost rural households in the Pangani River Basin keep livestock. The most common types of livestock are chickens, cattle, goats, and sheep. The average number of cattle and goats is highest in the central areas of the basin, which include a significant number of Maasai households who tend to keep larger herds of cattle and goats.
Other sectorsIndustry is growing in the basin and is concentrated near the main towns. Some of the important industries include sisal-processing, tanneries, paper products, chemicals, textiles, timber, metal works and bottled water production. Fertilizer, cement, fruit canning and saw milling are important activities at the coast. Other industries in the basin include textiles, sisal rope, steel rolling, timber, production of plastic polybags and soft drinks.

24 PANGANI RIVER SYSTEM
Rivers and PeopleHealthy rivers for healthy people Rural people living near rivers use its resources for survival and to generate income. The river provides water for drinking, washing and cooking; medicines; building material; firewood; and food such as fish and crops from fertile floodplains. Some of these goods are harvested for household use and some for creating income. Rivers additionally provide many ecosystem services of great economic value, such as storage of flood waters and thus more dependable flow in the dry season, and purification of wastewaters.
Rivers are used for recreation and tourism. These activities contribute to household income by providing jobs. Many activities that depend on river systems, such as fisheries and tourism, generate demand for other commodities in the economy, such as boats, nets and linen, thus generating more jobs and income in other sectors. Rivers also have great cultural and religious significance for people.
Healthier river systems provide greater benefits to all because they are more productive and support peoples’ incomes, health and spiritual well-being.
The health of river systems
River degradation linked to water and land development can take many forms that, in one way or another, have human costs: bank erosion and loss of land; sedimentation and reduced life-span of reservoirs further downstream; the collapse of inland, estuarine and river-dependent marine fisheries; declining water quality; and an increase in plant and animal pests.
As rivers degrade, people may lose riverside property, their primary protein sources, and many other river resources important to their lives. They could lose valued recreational and conservation areas and attributes of the river that may have immense cultural and religious significance. Unhealthy rivers provide greater opportunities for disease vectors such as malaria-carrying mosquitoes and bilharzia-infected snails to increase in numbers. Rivers with weak flows are also more vulnerable to contamination by bacteria that cause diarrhoea and other waterborne diseases in people and livestock.
At some point along the development trajectory the costs of such changes will outweigh the benefits – more will have been lost than is being gained. We need to know the links between people and their river in order to assess what could be lost as well as gained from future water developments.

THE STATE OF THE BASIN REPORT - 2007 25
Water for the EnvironmentEnvironmental flowsEnvironmental Flow (EF) assessments are a valuable tool in IWRM as they help us understand social, environmental and economic implications of any development or management plan for a river system. They show us why all the different types of flow are important for maintaining a healthy river, and how people use the river. They also provide descriptions of many possible future development paths for the basin, showing what is gained (the benefits) and what is lost (the costs) in each option.
Examples of the importance of different flows
Lowflows provide shallow, quiet waters in the dry season for river species that need this to complete their lifecycles.
Small floods improve water quality in the dry season, trigger activities such as upstream migration of fish and germination of seedlings on the banks.
Large floods inundate floodplains and wetlands, flush the channel and maintain the bank vegetation.
Natural flow variability from season to season and year to year maintains the diversity and resiliance of the system making it more able to cope with human disturbance.
The timing of different flows is as important as the size of the flows for maintaining a health river system.
Holistic EF assessments allow all stakeholder groups to assess which future options they would find acceptable, and which unacceptable, and provide this information to the government. In the end the government decides on the option to be followed.
Health reports of the whole river system allow us to begin to assess how close we are to the point where costs outweigh benefits and thus inform future management decisions.
26 PANGANI RIVER SYSTEM
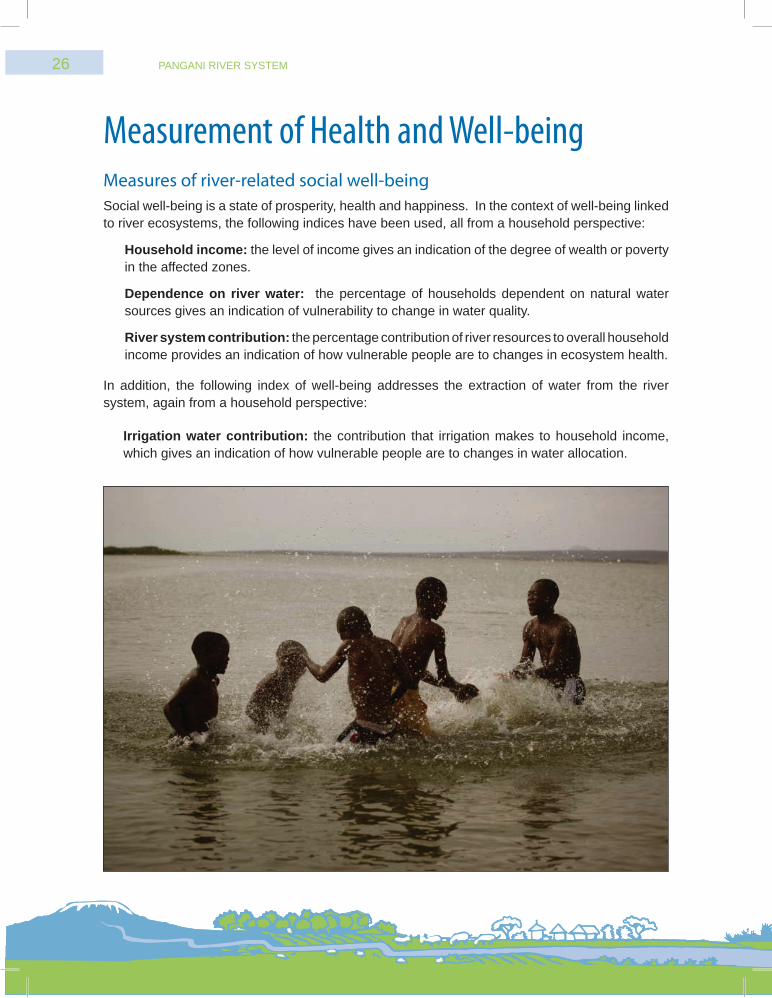
Measurement of Health and Well-beingMeasures of river-related social well-being Social well-being is a state of prosperity, health and happiness. In the context of well-being linked to river ecosystems, the following indices have been used, all from a household perspective:
Household income: the level of income gives an indication of the degree of wealth or poverty in the affected zones.
Dependence on river water: the percentage of households dependent on natural water sources gives an indication of vulnerability to change in water quality.
River system contribution: the percentage contribution of river resources to overall household income provides an indication of how vulnerable people are to changes in ecosystem health.
In addition, the following index of well-being addresses the extraction of water from the river system, again from a household perspective:
Irrigation water contribution: the contribution that irrigation makes to household income, which gives an indication of how vulnerable people are to changes in water allocation.

THE STATE OF THE BASIN REPORT - 2007 27
Measures of river and estuary health
A range of factors influence river health. All of these change naturally along the length of the river and may change more or differently with degradation. The following are important and were measured in ways described in the study reports.
The catchment
The condition and land use of the drainage basin itself is a major influence, affecting river health through the sediments, chemicals and fertilizers that may drain into the river, and through structures that can modify its flow patterns.
The flow regimeThe pattern and timing of high and low flows that occur in different parts of the system (the flow regime) is the primary driver of the nature of the river. Flows move bed and bank particles around, maintaining the channel and in most cases dictating its width and depth, the mixture of alluvial sediments at any one point and the nature of the banks.
Water quality
Good water quality is as important as appropriate quantities for maintaining a healthy system. Turbid waters with high concentrations of suspended material generally indicate high levels of silt or phytoplankton (microscopic plants, mostly algae), both of which are associated with unhealthy conditions. Salt levels in the water naturally increase downstream, and are highest at the mouth of the estuary because of marine influences. Salinity levels in the estuary change with each tide and from season to season, in a continual interplay of river water and sea water.
Atmospheric oxygen dissolves readily in water where it is used by aquatic plants and animals. If it is used faster than replaced from the atmosphere – as might be done if decomposing organic material or sewage effluents are present - then the water becomes anoxic and can kill the aquatic life. Dissolved oxygen levels are a good measure of environmental health, indicating the extent to which the water body can support aquatic life.
Habitat integrity
Man-made changes to the river and basin degrade habitats in the river and on the banks, and reduce the ability of the ecosystem to support riverine plants and animals. The more degraded the range of habitats, the more compromised the river’s health.

28 PANGANI RIVER SYSTEM
The plants and animals The river’s plants and animals change in species and numbers depending on environmental conditions: some species are sensitive and can only survive in undisturbed parts of the system; others are quite robust and can tolerate various levels of pollution and habitat destruction. This makes them good indicators of river health, which can be assessed by recording which species are present and which are absent at points along the system. The vegetation on the banks, the fish communities and the small aquatic life (invertebrates) are usually the most obvious living parts of the ecosystem and were the major groups used in this river health assessment. Zooplankton (microscopic animals), phytoplankton (microscopic plants) and birds were also assessed for the estuary.

THE STATE OF THE BASIN REPORT - 2007 29
River health categories The wide range of measurements taken during the river assessment can be summarized into four main health categories. Using these categories, the different parts of the ecosystem, such as the channel or the fish, have been judged in terms of their overall condition. The assessments were done for points along the whole system.
River Health Category
Natural (A)
Largely natural (B)
Moderately modified (C)
Largely modified (D)
Ecological State
No or little modification from natural
Ecosystem functioning and integrity largely intact
Noticeable modification; sensitive species scarce or lost; hardy species abundant
Severe modification with major disruptions in ecosystem functioning; mostly tolerant species remaining, often to pest proportions; alien species common; plants and animals may be diseased
Explanation
Low human impact
Human disturbance noticeable but not seriously impacting the system
Many kinds of disturbance, usually reflecting substantial socio-economic development
High human densities; over exploitation of the river; heavy use of the river channel and banks; loss of most to virtually all natural attributes

30 PANGANI RIVER SYSTEM
Present State: PhysicalThe main causes of river degradation are: changes to the flow regime; changes to the channel and riverbed, including the extent of inundated areas such as floodplains; changes to water qual-ity due to pollution; and the presence of alien plants and animals. The level of modification of these factors varies from place to place along the river but the following sections outline overall trends by river zone. The Site Summary at the end of the document provides site-by-site informa-tion, and further details are available in the technical reports.
The flow regimeMany of the basin’s riv-ers now flow for only part of the year be-cause of water abstrac-tion. For instance: In the Kikuletwa sub-ba-sin, most stream flow is from springs in the middle of the basin. Upstream of these the flows are no longer pe-rennial.
The Luengera and Mkomazi Rivers were historically perennial but are now seasonal. The basin’s water bal-ance shows that the Mkomazi sub-basin is most developed, with 58% of its natural an-nual flow used, fol-lowed by the Kikuletwa sub-basin with 25% used.
THE STATE OF THE BASIN REPORT - 2007 31
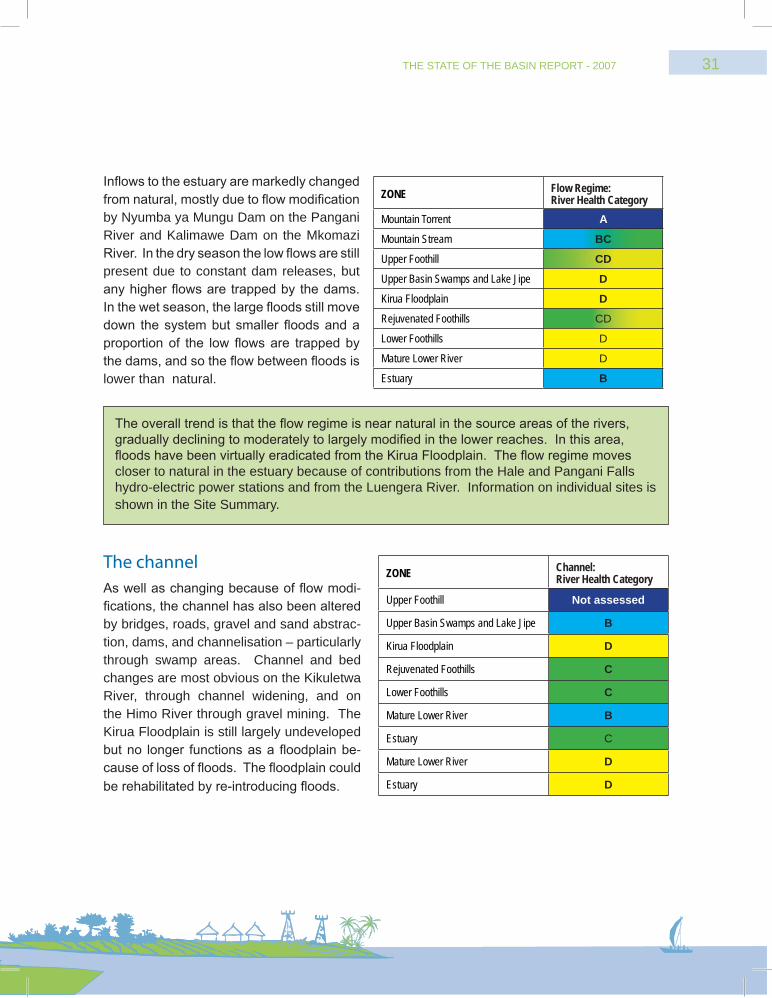
The overall trend is that the flow regime is near natural in the source areas of the rivers, gradually declining to moderately to largely modified in the lower reaches. In this area, floods have been virtually eradicated from the Kirua Floodplain. The flow regime moves closer to natural in the estuary because of contributions from the Hale and Pangani Falls hydro-electric power stations and from the Luengera River. Information on individual sites is shown in the Site Summary.
The channel As well as changing because of flow modi-fications, the channel has also been altered by bridges, roads, gravel and sand abstrac-tion, dams, and channelisation – particularly through swamp areas. Channel and bed changes are most obvious on the Kikuletwa River, through channel widening, and on the Himo River through gravel mining. The Kirua Floodplain is still largely undeveloped but no longer functions as a floodplain be-cause of loss of floods. The floodplain could be rehabilitated by re-introducing floods.
ZONE Channel: River Health Category
Upper Foothill Not assessed
Upper Basin Swamps and Lake Jipe B
Kirua Floodplain D
Rejuvenated Foothills C
Lower Foothills C
Mature Lower River B
Estuary C
Mature Lower River D
Estuary D
ZONE Flow Regime: River Health Category
Mountain Torrent A
Mountain Stream BC
Upper Foothill CD
Upper Basin Swamps and Lake Jipe D
Kirua Floodplain D
Rejuvenated Foothills CD
Lower Foothills D
Mature Lower River D
Estuary B
Inflows to the estuary are markedly changed from natural, mostly due to flow modification by Nyumba ya Mungu Dam on the Pangani River and Kalimawe Dam on the Mkomazi River. In the dry season the low flows are still present due to constant dam releases, but any higher flows are trapped by the dams. In the wet season, the large floods still move down the system but smaller floods and a proportion of the low flows are trapped by the dams, and so the flow between floods is lower than natural.

32 PANGANI RIVER SYSTEM
Water quality Water quality generally deteriorates down-stream, although some of the areas of poor-est quality are in the middle reaches. Poor quality is mostly related to increased levels of dissolved salts, nutrients, faecal coliforms, decaying organic material and turbidity in various parts of the system.
The main causes are agricultural runoff in-cluding effluents from sisal farms, local ur-ban use of the river for washing and waste disposal, and turbid waters downstream of the hydro-power facilities. Dissolved oxygen levels are extremely low in places, especial-ly in the reaches upstream and downstream of Hale and Pangani Falls and in the upper estuary where dilution by seawater is low.
Present State: Chemical and PlantsZONE Water Quality:
River Health Category
Mountain Torrent Not assessed
Mountain Stream A/B
Upper foothill B/C/D
Upper basin swamps and Lake Jipe B/C
Kirua Floodplain C
Rejuvenated foothills D
Lower Foothills C/D
matura Lower River C
Estuary D

THE STATE OF THE BASIN REPORT - 2007 33
VegetationThe condition of the vegetation on river banks and in the floodplains and swamps reflects a range of local disturbances rather than a general downstream decline as with in-river features. The most common reasons for these localised declines are clearance for agricultural land or urban areas, harvesting, or invasion by exotic species. Healthy vegetation along the banks acts as a buffer, protecting the river from sediments, fertilizers and pesticides moving downhill from the surrounding land, and also provides habitat for a wide range of wildlife. Narrow, poorly vegetated riparian zones leave the river vulnerable to pollution and a range of other disturbances.
ZONE Vegetation: River Health Category
Mountain Torrent Not assessed
Mountain Stream B/C
Upper foothill A/C/D
Upper basin swamps and Lake Jipe C
Kirua Floodplain B
Rejuvenated foothills D
Lower Foothills B/C/D
matura Lower River B
Estuary C

34 PANGANI RIVER SYSTEM
Aquatic invertebrates
In general, only the upper parts of the system have healthy invertebrate communities. The mix of species changes downstream naturally, but the scores in the table show the additional shift that can be attributed to human disturbances. Some reaches do not follow the general trend of degradation, indicating that the river does rehabilitate to some degree from disturbances, only to decline again further downstream with new impacts. The main shifts in invertebrate communities are a loss of diversity of species with increasing distance from the source, with those remaining often being air breathers or species adapted to low dissolved-oxygen levels.
Such species are usually more tolerant of poor conditions and can increase to pest proportion under some conditions.
Present State: Animals
ZONE Invertebrates: River Health Category
Mountain Torrent Estimated A/B
Mountain Stream A/B
Upper foothill B/C/D
Upper basin swamps and Lake Jipe B
Kirua Floodplain C
Rejuvenated foothills D
Lower Foothills B/C/D
matura Lower River C
Estuary D

THE STATE OF THE BASIN REPORT - 2007 35
FishTwenty fish species belonging to nine fish families were recorded. The families and genera were Cyprinidae (Barbus, Labeo and Garra), Cichlidae (Tilapia and Haplochromis), Mochokidae (Synodontis), Mormyridae (Mormomyrus), Gobiidae (Glossogobius), Characidae (Brycinus) Anguiilidae (Anguilla), Clariidae (Clarias), and Cyprinodontidae (Northobranchius).
The cichlids were the most widely distributed, occurring in all zones except the Mature Lower River. Cyprinids were the next most common, with the most rare families being the gobies (Gobiidae), milkfish (Channidae) and ambassids (Ambassidae). These last three familes tolerate a wide range of salinities and migrate between the ocean and the river.
The Lower Foothill supported the most diverse fish community followed by the Mature River. The Mountain Stream had the fewest species.
With the exception of the middle reaches, where human pressure on the river (and fish in particular) is high, the river health for fish was fair to good.
ZONE Fish: River Health Category
Mountain Torrent A
Mountain Stream A/B
Upper foothill D
Upper basin swamps and Lake Jipe C/D
Kirua Floodplain B/C
Rejuvenated foothills B/C
Lower Foothills C
matura Lower River C
Estuary C

36 PANGANI RIVER SYSTEM
Present State: How People Use the RiverRural livelihoods throughout the basin comprise a range of activities. This is a common risk-spreading strategy among poorer people, because they are vulnerable to the vagaries of the natural environment and climate. The river resources in the basin allow small-scale farmers to spread risk, and provide goods that they would otherwise have to purchase.
FarmingMost rural households rely primarily on farming. Small-scale farmers grow a main staple such as maize, and a variety of other crops that vary from place to place across the basin. Coffee, bananas and rice are important in the highland areas and most fields are irrigated via a system of traditional furrows. Closer to the coast tree crops such as coconuts and betelnuts are important and few households irrigate their fields. Livestock also provide an important source of income to households throughout the basin and are dependent on natural sources of water.
Fishing and other river resources People living near rivers, lakes and the estuary derive a modest income from a variety of river resources of which fish are most important. The lakes of the basin support fisheries, which in the past were highly productive, drawing fishers from all over the region to take part in commercial fisheries. For the families involved, fishing is typically their main activity.

THE STATE OF THE BASIN REPORT - 2007 37
The Kirua Swamp also used to support a productive fishery, but this has collapsed since annual flooding of the wetland ceased due to the construction of Nyumba ya Mungu dam upstream. Within the river itself, there is very little fishing in the highlands, but the lowland reaches provide measurable fishing income for nearby households. Fishing is an important activity at the estuary, particularly for crabs and prawns. Households also harvest aquatic plants such as reeds, sedges, mangroves and medicinal plants for household use or sale.
Drinking WaterTap water is supplied to major urban areas and smaller towns, but a large proportion of the population relies on water from local rivers and wells. Urban consumption is about 70 litres per person per day, while rural consumption is about 20 - 30 litres per person per day, most of which is supplied by the river system.
Income from river resourcesHouseholds in the basin that live within 10 km of rivers derive up to 21% of their total income from river systems. In total, 75% of the basin’s population is estimated to live within 10 km of the main rivers, and 47% within 5 km. Thus a high proportion of the population is within reasonably close proximity to rivers in the basin. The total value of aquatic ecosystem resources harvested in the basin was estimated to be between Tshs 8.7 and 2.9 billion per year (US$ 7 – 10 million). Fifty-eight percent of this value (Tshs 5.0 – 7.3 billion) is attributed to the fisheries.
Water used upstream may not be available in the appropriate volumes or timing for providing the flows needed to support healthy river ecosystems downstream. For instance, fishers throughout the basin report that good catches are correlated with river flows appropriate for the season, and poor catches occur when flows are poor or out of synchrony with the season.
Zone
Northern Highlands
Eastern Highlands
Lake areas
Pangani-Kirua
Mesic Lowlands
Estuary
Household income (Tsh/y)
2 718 901
2 189 378
2 728 343
2 593 301
1 878 795
2 965 828
Income from river resources
20 363
70 485
563 966
43 584
46 309
233 574
% from River resources
0.7%
3.2%
20.7%
1.7%
2.5%
7.9%

38 PANGANI RIVER SYSTEM
Key Areas of Concern
Lake JipeUp to the 1960s Jipe Lake had a thriving fishery and provided a crucial watering and feeding resource for a variety of wild game and birds including migrant water birds. Human activities have impacted on the ecology of the lake. These include reduced inflow into the lake, increased nutrient input and a resultant decline in water quality, increased siltation, and an expansion of the Typha reedbeds fringing the Lake. As a consequence, the once-thriving lake fishery has all but collapsed and many people have left the area.
Kirua SwampSince 1994, large portions of the largest wetland in the Basin – the Kirua Swamp – have dried as a result of the regulation of water flows from the NYM Dam and channelisation of the river through the swamp. A once-vibrant fishery is now much reduced and restricted to the river channel, and water and nutrients that were used to grow crops are no longer brought onto the floodplain by the annual floods. In areas of the swamp that are still regularly flooded the local farmers obtain a similar income from crops as do those farmers nearby who are using furrow irrigation.
Nyumba ya MunguNyumba ya Mungu (NYM) is a man-made reservoir that largely replaced a natural wetland. Fishers have recently reported a marked decline in catches. This has been attributed to low water levels (as a result of reduced inflow to the lake) and over-fishing. These fisheries are an important source of employment and food to the local people, in an area where protein is scarce. They also contribute to the region and district revenues in terms of taxes levied on fishers.
Low inflows into NYM have also hampered hydropower generation – the main purpose for the construction of dam.

THE STATE OF THE BASIN REPORT - 2007 39
1. The Kikuletwa River at Wahoga Chini This part of the river was dry in the dry season, mostly due to abstractions for crops. Water quality was very poor, and the bank vegetation sparse or absent and so providing little protection to the river from agricultural activities. The aquatic life of the river was rated D, or very poor. 2. The Ruvu River at KifaruThe water quality of this reach was very poor (D), with extremely low oxygen levels and very high nutrient levels; ammonia levels were high enough to be toxic to aquatic life. This condition may have been due to the proximity of dwellings to the river, and decaying vegetation within the river. The aquatic life of the river was rated D. 3. The Pangani River at HaleThe flow of the river was very poor (D) because of abstraction of water for the Hale hydropower plant. Water quality was very poor (D), with high levels of ammonia and phosphorus that would be toxic to aquatic life, possibly because of human settlements close to the river. Exploitation of the bank vegetation was severe, and the aquatic life rated D, with no fish recorded in the dry season. 4. The Mkomazi River downstream
of Kalimawe Dam River flow was highly modified because of the upstream dam and irrigation, and rated D. Water quality was poor (C) with very high phosphorous and sulphate levels and low oxygen levels. Exploitation of the bank vegetation was severe with agriculture to the water’s edge, and the aquatic life rated C/D, with only fish species that are very tolerant to poor conditions present.
In general, the health surveys showed the river to be in reasonable condition (mostly B and C ratings), but four areas were in noticeably poorer condition.

40 PANGANI RIVER SYSTEM
Oxy
gen
satu
ratio
n (%
)Impacts of reduced flows on HEP The three hydroelectric power (HEP) stations in the Pangani Basin contribute up to 17% of the country’s power capacity, which is mainly from hydropower.
Power production at Nyumba ya Mungu relies on storage of water during rainy seasons and a constant release of water through the turbines. Regulation at Nyumba ya Mungu dam also ensures a relatively even flow through the year to the downstream power stations at Hale and New Pangani. The latter are more modern and up to eight times more efficient than Nyumba ya Mungu in terms of output per unit of water. Thus it is particularly important to maintain flow from the Nyumba ya Mungu dam to these turbines.
Water shortages during the dry season contribute to power shortages on the national grid, resulting in power cuts that have significant impacts on the Tanzanian economy.
Pangani EstuaryEstuaries, where river water meets sea water, can be highly productive areas and often support rich fisheries. Compared with similar tropical estuaries around the world, the Pangani Estuary is in poor condition. It has far fewer fish, birds and other animal species than comparable systems. Sea water is intruding further upstream as river flows weaken through upstream abstractions; this is eroding banks and affecting agriculture. Pollutants such as decomposing plants and fine silt from agricultural land, brought in by the river, are creating oxygen levels so low for much of the year that most fish and other animals cannot survive there. A once-abundant fishery is now seriously depleted.
The graphs shows oxygen levels in the Pangani Estuary in high and low flows. Levels below 50% (red line) are too low for most aquatic life. Levels increase toward those normal for sea water (100%) as the river water nears the sea.
Key Areas of Concern

THE STATE OF THE BASIN REPORT - 2007 41
Riparian corridors
The riparian corridor or riparian zone is the interface between the land and a river. Plant communities along the river margins are called riparian vegetation. The word “riparian” is derived from the Latin word ripa, meaning river bank. Riparian zones are important parts of river systems because they stabilise banks, and act as buffers, protecting the river from sediments, fertilisers, pesticides and other substances washed down off the catchment. They supply shelter and food for many aquatic and terrestrial animals and shade that is important in regulating water and land temperatures.
Research shows that riparian zones improve the quality of surface and sub-surface water draining into the streams, including by absorbing nitrates from fertilisers that could otherwise damage the river ecosystem and human health.
Condition of the riparian corridors in the Pangani Basin
In many parts of the Pangani Basin, the riparian vegetation has been almost completely removed. Cultivated fields, roads and urban areas abut the rivers and so there is no protective buffer against disturbances from the surrounding catchment.
The only part of the system where this has not occurred is the upper reaches, where the gradient of the river banks is too steep for cultivation.
Riparian corridors can be reinstated through re-claiming riverside land and re-vegetating these areas with suitable indigenous species. In many parts of the world, the rehabilitation of riparian zones has resulted in improved river condition and more reliable low season flows.

42 PANGANI RIVER SYSTEM
Towards Integrated Flow ManagementThe Pangani Basin Flow Assessment is developing a procedure that could be followed for truly sustainable development. Technical specialists will be able to outline the full range of benefits and costs of major water developments up front, so that decisions can be made in a far more bal-anced and informed way than has been possible in the past.
The procedure starts with the development of a range of possible future options (scenarios) for water use in the Pangani Basin. Some of these scenarios may describe more water abstraction from the river than at present and some less water abstraction in order to maintain, or restore river health and ecosystem goods and services presently lost to people. For each of these scenarios, the future flow of the river is predicted using a hydrological model. This is used to predict the effects of changes in flow from present-day on river health and ecosystem good and services, which can then be interpreted in terms of the effects on peoples’ livelihoods and national and lo-cal economies.
The scenarios thus provide predictions on the triple bottom line of sustainable development: en-vironmental integrity, economic development and social justice. These can be considered by the full range of stakeholders, who make input to the government on the level of acceptability of each. Using these, trade-offs between development and protection of the river system’s resources can then be considered by decision-makers in the search for an optimal water-allocation solution. This optimal trade-off could be defined as a Basin Development Framework, against which indi-vidual proposed developments or management options could then be assessed.

THE STATE OF THE BASIN REPORT - 2007 43
The scenario chosen for the basin will reflect the ‘desired state’ for the river – the degree of degradation that is acceptable to the country for the benefits to be achieved. This desired state is linked (through the scenario chosen) to a predicted flow regime which defines the ‘acceptable flow’ or ‘environmental flow’ for the river.
Monitoring of this acceptable flow should be done for a decade or more after any management plan is implemented, as a cost of the plan, in order to assess 1) if the development is delivering the agreed downstream flow regime, and 2) if this is achieving the agreed river condition. If it is not, then as adaptive management, either the desired condition or the flow of the river would need to be amended.
The river health, estuary health and socio-economic assessments of Pangani River System, summarized in this report, form the baseline information which will be used to develop the different scenarios. The predictions made will be as accurate as our understanding of the river ecosystem and its users. Investment in improving understanding of this, our most limited and vital of resources and ecosystems, is essential.

44 PANGANI RIVER SYSTEM
Site Summary of River Condition
KEY Water
Vegetation
Aquatic Invertebrates
Fish
A Natural
B Largely Natural
C Moderately Modified
D Largely Modified

THE STATE OF THE BASIN REPORT - 2007 45

46 PANGANI RIVER SYSTEM
Further ReadingAgrawala, S., Moehner, A., Hemp, A., van Aalst, M., Hitz, S., Smith, J., Meena, H., Mwakifwamba, S., Hyera, T., and Mwaipopo, O. 2003. Development and Climate Change in Tanzania: Focus on Mount Kilimanjaro. COM/ENV/EPOC/DCD/DAC/(2003)5/Final, OECD, Paris.
Brown, C.A. and King, J.M. 2002. Chapter 3. Environmental Flows: Requirements and Assessment. In. Water resources management in southern Africa: enhancing environmental sustainability. SADC/IMERCSA/IUCN Publication. 25pp.
Brown, C.A. and King, J.M. 2003. Water Resources and Environment Technical Note C.1. Environmental flows: concepts and methods. World Bank, Washington. 28 pp.
Dyson, M., Bergkamp, G., Scanlom, J. (eds). 2003. Flow. The essentials of environmental flows. IUCN, Gland, Switzerland and Cambridge, UK. 118 pp.
Faraji, S. 2007. Situation Analysis: Water Supply, Sanitation and IWRM practices in Tanzania. Technical Report for the IUCN Eastern Africa Regional Program. 27pp + 9 annexes.
Gillingham, M. 1999. Gaining access to water: formal and working rules of indigenous irrigation management on Mount Kilimanjaro, Tanzania. Natural Resources Journal 39: 419-441.
IUCN Eastern Africa Regional Programme. 2003. The Pangani Basin: A Situation Analysis. xvi + 104pp.
Johnston, P. 1946. Some notes on land tenure on Kilimanjaro and the kihamba of the Wachagga. Tanzania Notes and Records 21 (1946). 20pp.
King, J.M and Brown, C.A. 2003. Water Resources and Environment Technical Note C.2. Environmental flows: case studies. World Bank, Washington. 28 pp.
King, J., Tharme, R. and Brown, C. 1999. Definition and implementation of instream flows. Contributing paper to the World Commission on Dams, Cape Town, South Africa. 87 pp.
Mujwahuzi, M. 2001. Water use conflicts in the Pangani Basin. In: Water resources management in the Pangani River Basin: Challenges and Opportunities, ed: Ngana, J. Dar es Salaam University Press. p. 128-137.

THE STATE OF THE BASIN REPORT - 2007 47
Reports of the Pangani River Basin Flow AssessmentAll available from the Pangani Basin Water Office.
1. Hydrology of the Pangani River Basin, volume 1. 2006. +57 pp
2. Basin Delineation Report. 2006. 51 pp.
3. Scenario Selection Report. 2006. 22 pp.
4. River Health Assessment. 2006. 185 pp.
5. Estuarine Health Assessment. 2006. 115 pp.
6. Socio-economic Baseline Assessment. 58 pp.
Tanzanian National Water Policy (NAWAPO 2002) and the National Environmental Management Act (2004).
Ndomba, P.M. 2002. Estimation of soil erosion in the Pangani basin upstream of Nyumba ya Mungu Reservoir, Water Resources Engineering Management (WREM) at UDSM. Available at www.wrem.udsm.ac.tz/publications/ndomba.htm.
Norwegian Institute for Water Research (NIVA) 1995. Water resources management in Tanzania - Pangani River catchment. Report no. 094097/E-94440, NIVA, Oslo, Norway
Shaghude, Y.W. 2004. The study of sediment characteristics and nearshore sediment dynamics in coastal Tanzania. MARG-I Final Research Report: Research Report No. IMS/2004/01.
Turpie, J.K., Ngaga, Y. & Karanja, F. 2003. A preliminary economic assessment of water resources of the Pangani River Basin, Tanzania: economic value, incentives for sustainable use and mechanisms for financing management. Report to IUCN EARO. 96pp.

48 PANGANI RIVER SYSTEM