iti corr final report - infrastructure technology institute...
TRANSCRIPT

DESIGN AND APPLICATION OF HIGH-VOLUME FLY ASH SELF-
CONSOLIDATING CONCRETE WITH THE INCORPORATION OF
NANOPARTICLES
FINAL REPORT
Principal Investigators:
David J. Corr (PI) Surendra P. Shah (co-PI)

2
DISCLAIMER
The contents of this report reflect the views of the authors, who are responsible for the facts and the accuracy of the information presented herein. This document is disseminated under the sponsorship of the Department of Transportation University Transportation Centers Program, in the interest of information exchange. The U.S. Government assumes no liability for the contents or use thereof.

3
TABLE OF CONTENTS 1. INTRODUCTION .................................................................................................................. 8 1.1. BACKGROUND ................................................................................................................. 8 1.2. FLY ASH: ADVANTAGES AND CHALLENGES .......................................................... 9 1.3. SELF-CONSOLIDATING CONCRETE: POTENTIAL AND CHALLENGES ........ 10 1.4. OVERALL PROJECT OBJECTIVES ........................................................................... 11 1.5. SIGNIFICANCE TO USDOT RESEARCH GOALS .................................................... 11
2. USE OF NANOCLAYS TO ACHIEVE THE DESIRED FRESH-STATE PROPERTIES .............................................................................................................................. 12 2.1. INTRODUCTION ............................................................................................................. 12 2.2. MATERIALS ..................................................................................................................... 13 2.3. PRELIMINARY RESULTS ............................................................................................. 16 2.4. EFFECT OF CLAYS ON COHESION ........................................................................... 21 2.5. EFFECT OF CLAYS ON STRUCTURAL REBUILDING .......................................... 34 2.6. TYING RHEOLOGICAL RESULTS OF CLAY-MODIFIED PASTES WITH FORMWORK PRESSURE RESULTS OF SCC ....................................................................... 42 2.7. RECOMMENDATIONS .................................................................................................. 44
3. USE OF COLLOIDAL NANOSILICA TO IMPROVE THE EARLY-AGE HARDENED PROPERTIES OF HVFA-SCC .......................................................................... 45 3.1. MATERIALS ..................................................................................................................... 45 3.2. HARDENING PROPERTIES .......................................................................................... 46 3.3. MECHANICAL PROPERTIES ...................................................................................... 49 3.4. HYDRATION PROPERTIES OF HVFA-CEMENT SYSTEMS ................................. 51 3.5. CONCLUSIONS AND RECOMMENDATIONS .......................................................... 61
4. USE OF CACO3 NANOPARTICLES TO IMPROVE THE EARLY-AGE HARDENED PROPERTIES OF HVFA-SCC .......................................................................... 62 4.1. INTRODUCTION ............................................................................................................. 62 4.2. MATERIALS ..................................................................................................................... 62 4.3. DISPERSION IN DILUTE AQUEOUS SOLUTIONS .................................................. 64 4.4. EARLY-AGE HARDENING AND MECHANICAL PROPERTIES .......................... 73 4.5. CONCLUSIONS AND RECOMMENDATIONS .......................................................... 80
5. SUMMARY OF KEY FINDINGS AND FINAL RECOMMENDATIONS ................... 81 5.1. USE OF CLAYS TO REDUCE HVFA-SCC FORMWORK PRESSURE ................... 81 5.2. USE OF NANOPARTICLES TO IMPROVE THE EARLY-AGE, HARDENED PROPERTIES OF HVFA-SCC .................................................................................................. 82
6. LIST OF PUBLICATIONS ................................................................................................. 84
7. REFERENCES ..................................................................................................................... 84
4
LIST OF FIGURES Figure 1 Formwork pressure device with a depth D = 15 cm and height H = 30 cm20. ................. 12 Figure 2 Formwork pressure response of SCC with and without nanoclays (both mixes had an
initial slump flow of 60 ± 2cm)20. .......................................................................................... 13 Figure 3 SEM images of nanoclays in the a) agglomerated and b) dispersed state28. ................... 14 Figure 4 Water adsorption of nanoclays at various applied pressures as measured by the filtration
test31. ....................................................................................................................................... 15 Figure 5 Viscosity evolution up to equilibrium (5 min)31. ............................................................. 17 Figure 6 Viscosity evolution after equilibrium (up to 60 min)31. ................................................... 18 Figure 7 Applied shear rate for SRE protocol31. ............................................................................ 19 Figure 8 Shear stress versus strain curves obtained through SRE protocol31. ............................... 19 Figure 9 Equilibrium flow curve obtained from SRE protocol31. .................................................. 20 Figure 10 SRE plot of cement pastes with and without a 0.3% nanoclay addition31. .................... 21 Figure 11 Normal force evolution of plain cement paste28. ........................................................... 23 Figure 12 Normal force evolution of cement paste with 0.2% nanoclay addition28. ..................... 24 Figure 13 Normal force evolution of cement paste with 0.5% nanoclay addition28. ..................... 24 Figure 14 Peak normal force versus plate velocity for cement pastes with 0, 0.2 and 0.5%
nanoclay additions28. .............................................................................................................. 25 Figure 15 Influence of preshear condition on the normal force evolution (plate velocity 10 µm/s)
of plain cement paste28. .......................................................................................................... 26 Figure 16 Influence of preshear condition on the normal force evolution (plate velocity 10 µm/s)
of cement paste with 0.5% nanoclay addition28. .................................................................... 26 Figure 17 Evolution of storage modulus for plain cement paste subjected to different preshear
conditions28. ............................................................................................................................ 27 Figure 18 Evolution of storage modulus for cement paste with 0.5% nanoclay addition subjected
to different preshear conditions28. .......................................................................................... 27 Figure 19 Plain cement paste sample during tack test28. ................................................................ 28 Figure 20 Cement paste sample with 0.5% nanoclay addition during tack test28. ......................... 29 Figure 21 Influence of resting time on the normal force evolution (plate velocity 10 µm/s) of
plain cement paste28. .............................................................................................................. 30 Figure 22 Influence of resting time on the normal force evolution (plate velocity 10 µm/s) of
cement paste with 0.5% nanoclay addition28. ........................................................................ 30 Figure 23 Normal force evolution of 50% fly ash-cement paste28. ................................................ 31 Figure 24 Normal force evolution of 50% fly ash-cement paste with 0.5% nanoclay addition28. . 32 Figure 25 Peak normal force versus plate velocity of cement paste and 50% fly ash-cement paste
with 0 and 0.5% nanoclay additions28. ................................................................................... 33 Figure 26 General shear rheological protocol for obtaining relaxation time28. .............................. 35

5
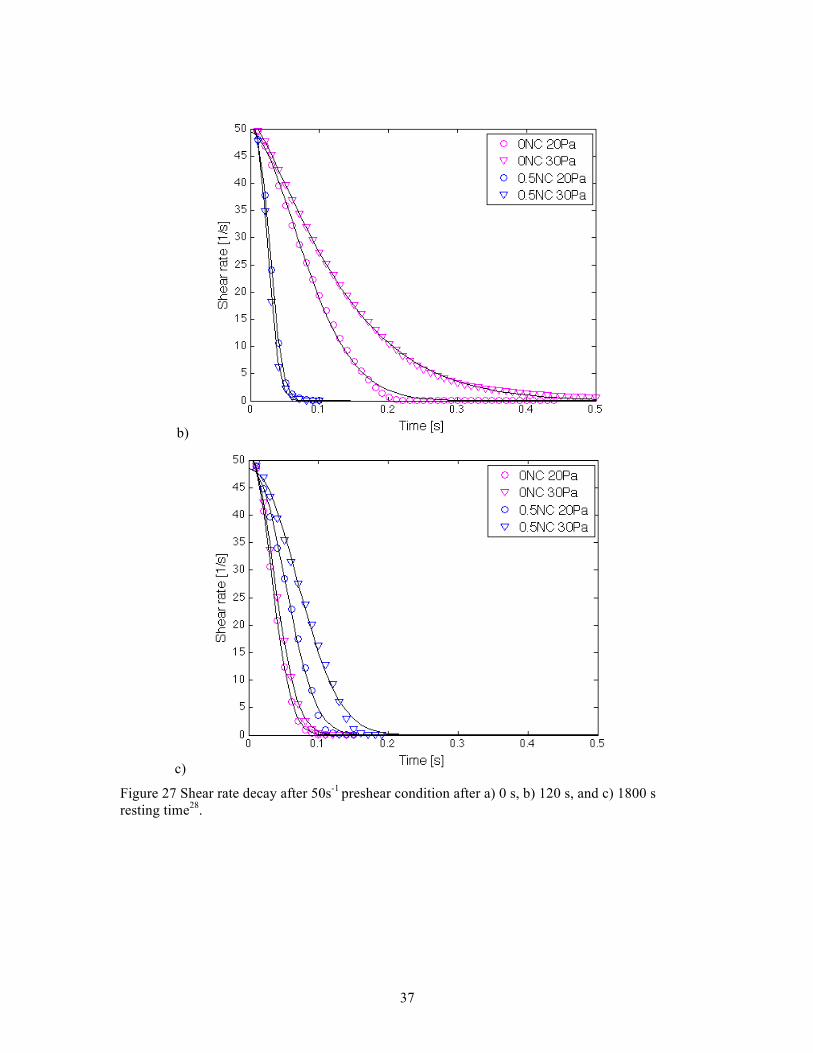
Figure 27 Shear rate decay after 50s-1 preshear condition after a) 0 s, b) 120 s, and c) 1800 s resting time28. ......................................................................................................................... 37
Figure 28 Shear rate decay after 300s-1 preshear condition after a) 0 s, b) 120 s, and c) 1800 s resting time28. ......................................................................................................................... 39
Figure 29 Evolution of storage and loss modulus of cement pastes with and without a 0.5% nanoclay addition28. ................................................................................................................ 40
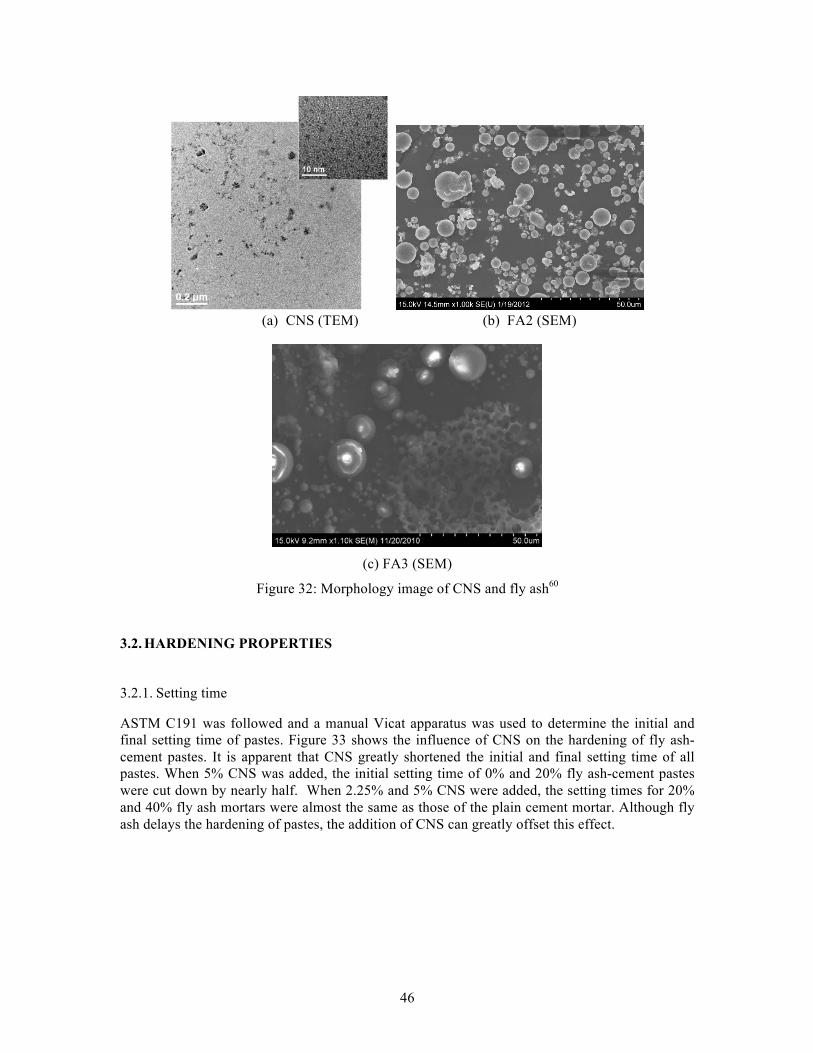
Figure 30 Two function model for formwork pressure of concrete58 ............................................ 43 Figure 31 a) Delayed response and b) instantaneous response of SCC formwork pressure20 ....... 44 Figure 32: Morphology image of CNS and fly ash60 ..................................................................... 46 Figure 33: Influence of CNS on the hardening of FA2 pastes61 .................................................... 47 Figure 34: Effect of CNS on cement hydration heat62 ................................................................... 48 Figure 35: Effect of CNS on pH value and electrical conductivity evolution of cement paste62 ... 48 Figure 36: Effect of CNS on cement-FA2 hydration heat60 ........................................................... 49 Figure 37: Effect of CNS on the compressive strength ratio of FA2 cement mortar61 .................. 50 Figure 38: Comparison of the effect of CNS on the mechanical properties of FA2 and FA3
cement mortars61 .................................................................................................................... 51 Figure 39: Effect of CNS on CH content of cement paste62 .......................................................... 52 Figure 40: Difference in CH content between CNS-added and control cement pastes62 ............... 52 Figure 41 Ca(OH)2 content vs. time60 ............................................................................................. 53 Figure 42: SEM images of the evolution of cement at different ages62 ......................................... 55 Figure 43: BSE images of cement pastes60 .................................................................................... 57 Figure 44: Effect of CNS on fly ash hydration degree60 ................................................................ 58 Figure 45: SEM images of FA-cement paste with and without CNS addition at 7months60 ......... 59 Figure 46: Development of the layer structure around a fly ash particle in the 5% CNS-added fly
ash-cement paste60 .................................................................................................................. 60 Figure 47: Comparison of Ca/Si ratio of compact coating and bulk C-S-H gel60 .......................... 61 Figure 48 SEM image of CaCO3 nanoparticles in the as-received state. ....................................... 63 Figure 49 Sonic dismembrator setup. ............................................................................................. 64 Figure 50 Left to right: a) nanoCaCO3 dry powder, b) water (and surfactant) added, and c) after
sonication. .............................................................................................................................. 65 Figure 51 Bath sonicator. ............................................................................................................... 65 Figure 52 Photospectrometer. ........................................................................................................ 66 Figure 53 NanoCaCO3 suspension without surfactant after centrifugation. .................................. 68 Figure 54 Absorbance spectra of suspensions immediately after sonication28. ............................. 71 Figure 55 Absorbance at 550nm as a measure of sedimentation over time28. ............................... 71 Figure 56 SEM images of nanoCaCO3 particles treated with Glenium (0.33% by mass) and
prepared by a) mechanical stirring, b) and c) bath sonication, and d) horn sonication28. ...... 72

6
Figure 57 SEM image of horn sonicated nanoparticles28. .............................................................. 73 Figure 58 Semi-adiabatic calorimeter. ........................................................................................... 74 Figure 59 Temperature evolution of cement paste with 1% nanoCaCO3 addition28. ..................... 75 Figure 60 Temperature evolution of cement paste with 5% nanoCaCO3 addition28. ..................... 75 Figure 61 Influence of fly ash and CaCO3 nanoparticles on setting time of pastes28. ................... 76 Figure 62 Compressive strength gain of 30% fly ash-cement paste samples with and without 1%
nanoCaCO3 addition compared to plain cement paste28. ....................................................... 78 Figure 63 Compressive strength gain of 30% fly ash-cement pastes with 1, 2.5, and 5%
nanoCaCO3 addition compared against 30% fly-cement paste28. .......................................... 78 Figure 64 SEM images of a) plain cement paste and 30% fly ash-cement pastes with b) 0%, c) 2.5%
and d) 5% nanoCaCO3 additions (Age = 7 d)28. ..................................................................... 80 Figure 65 SEM images of nanoCaCO3 aggregates in 5% nanoCaCO3 fly ash-cement paste (Age =
7 d)28. ...................................................................................................................................... 80

7
LIST OF TABLES Table 1 Mixing protocols31. .......................................................................................................... 15 Table 2 Results of slump flow test to determine effect of nanoclay dispersion31. ........................ 16 Table 3 Mix proportions for constant applied shear rate protocol31. ............................................ 16 Table 4 Change in viscosity from equilibrium to final (60min) of pastes under constant shear31.18 Table 5 Equilibrium flow curve parameters obtained from SRE protocol31. ................................ 21 Table 6 Fitting parameters in compressed exponential model for strain rate decay of pastes
subjected to constant shear stress after 50 s-1 preshear28. ....................................................... 41 Table 7 Fitting parameters in compressed exponential model for strain rate decay of pastes
subjected to constant shear stress after 300 s-1 preshear28. ..................................................... 41 Table 8 Fitting parameters in compressed exponential model for strain rate decay of pastes
subjected to constant shear stress after 300 s-1 preshear – fitting from 50 to 0 s-128. ............. 41 Table 9 The basic composition of SCC in formwork pressure study expressed in kg to produce
1m3 of concrete20 .................................................................................................................... 42 Table 10 List of surfactants. ........................................................................................................... 63 Table 11 Chemical composition of cement and fly ash. ................................................................ 63 Table 12 Influence of surfactant type on dispersion: all suspensions contain 3 g CaCO3
nanoparticles and 129 g of water28. ........................................................................................ 69 Table 13 Influence of time and amplitude of sonication on dispersion: all suspensions contain 1 g
Glenium, 3 g CaCO3 nanoparticles, and 129 g water28. ........................................................ 69 Table 14 Influence of Glenium addition on dispersion: all suspensions horn sonicated for 3 hours
at 40% amplitude28. ................................................................................................................ 69 Table 15 Mix design for compressive strength paste samples. ...................................................... 77

8
1. INTRODUCTION
1.1. BACKGROUND
Fly ash, a byproduct of coal combustion, has been used in Portland cement concrete for decades, and is widely accepted in the industry as a replacement for cement in amounts up to approximately 20% by mass. Addition of fly ash reduces the environmental impact of concrete by simultaneously consuming an otherwise unused waste product and by replacing cement, which is the most polluting and energy intensive component of concrete (an estimated 5% of all manmade CO2 emissions are due to cement production). Fly ash also improves the properties of concrete in several ways: improved fluidity during mixing and placing, higher strength, improved dimensional stability, and increased longevity of concrete structures.
In spite of these improvements, challenges associated with the use of fly ash have prevented its cement replacement level from increasing beyond 20%. Currently, only about 40% of the fly ash that is available is used by the concrete industry1; the remainder is stored in large landfill-type enclosures. In 2008, one such enclosure at the Tennessee Valley Authority (TVA)’s Kingston Fossil Plant ruptured and spilled approximately 5.4 million cubic yards of impounded coal fly ash slurry onto the surrounding land and into the adjacent Emory River2. An aerial photograph of the disaster is shown in Figure 1. It was the worst environmental disaster of its kind in United States history.
Public opinion is often shaped by disasters of this type, which in this case highlight the seemingly negative impacts of fly ash use. It is incumbent upon leaders of research in infrastructure, construction, and materials science to highlight the benefits of fly ash, to facilitate its maximum use, and to communicate its importance to the wider community. Therefore, the goal of this proposed research is to reduce the environmental impact of concrete construction through innovative materials use and production techniques, resulting in dramatic increases in the percentage of fly ash used in widespread construction.

9
Figure 1 – Aerial image of Kingston Ash Slide 12/23/082
1.2. FLY ASH: ADVANTAGES AND CHALLENGES
Fly ash is known to enhance many concrete properties. Fly ash particles are smooth, spherical, and relatively small compared to cement particles (fly ash has a diameter of about 10 – 25 µm compared to 10 – 100 µm for ordinary portland cement). This leads to improved fluidity of fresh concrete mixtures for easier and faster mixing and placement. In addition, fly ash has pozzolanic properties – it reacts with calcium hydroxide, an unwanted byproduct of cement hydration, to produce calcium silicate hydrate, which is the desirable cementitious product of cement hydration. This process increases strength at later ages of curing, reduces heat of hydration, and reduces the rate of concrete free shrinkage, resulting in a decrease in thermal shrinkage cracking. Fly ash has also been found to refine the pore structure of concrete and decrease its permeability, which has good implications on durability and long-term strength. Despite its great advantages, however, cement replacement with fly ash is typically limited to 15 – 20% by mass in most commercial use. With the current technology, higher amounts of fly ash can result in slow setting and retardation of early-age strength development3,4. These effects slow the construction process, which is highly undesirable, and prevent the widespread use of high volumes of fly ash.
Efforts to combat the decrease in the rate of early-age strength development due to fly ash include mechanical treatment (grinding), accelerated curing and autoclaving, and chemical activating. However, the most compelling approach is to incorporate nanomaterials. In a study conducted by Sato and Beaudoin, they discovered that nano-sized CaCO3 (ground limestone) additions of 20% by mass in HVFA cement pastes (50% cement replacement with fly ash) lead to significant accelerations in early hydration5. Microhardness and modulus of elasticity in the early stage of hydration and 28-day compressive strength development were improved, as well. Similar results were obtained in a separate study by Li where additions of nano-SiO2 (nanosilica) in HVFA concrete showed an increase in pozzolanic activity, as well as an increase in both short-term and long-term strength6. In both studies, the underlying mechanisms of the nanomaterials were not
10
fully understood, although it was suggested that the nano-sized particles served as nucleation sites to accelerate hydration.
1.3. SELF-CONSOLIDATING CONCRETE: POTENTIAL AND CHALLENGES
One of the most promising avenues for maximizing the use of fly ash is to incorporate it into self-consolidating concrete (SCC), which requires a relatively large amount of fine particles to produce. SCC flows like liquid in its fresh state, making external vibration and extensive finishing unnecessary. Characterized by its high flowability, passing ability (flows into tight spaces and dense reinforcement), and stability (resistance to segregation and bleeding), these superior properties enhance construction productivity in many ways, including:
• Quicker unloading of ready-mixed trucks and faster casting rates. This results in faster construction.
• Eliminates durability issues due to over-consolidation and poor surface finishes • Reduction in energy consumption by avoiding the need for external vibration. • Reduction in labor and equipment costs, which can streamline construction processes. • Improved aesthetics.
Despite its advantages, traditional SCC achieves its superior properties through a very high cement content. This results in high material costs, a high energy footprint, as well as performance concerns, including increased creep and shrinkage and cracking due to heat of hydration. Replacing a significant amount of cement with fly ash would address all of these issues. Fly ash can be very effective in improving the rheological properties of SCC, i.e. increasing fluidity and segregation resistance. Studies have shown that with proper mix design, high-volume fly ash (HVFA) SCC mixes (cement replacements with fly ash of 30 – 70% by mass) can exhibit comparable workability and compressive strength development to conventional SCC, and even increased durability and decreased drying shrinkage7,8,9.
Although the use of SCC is becoming more prevalent in pre-cast plants, there is still apprehension when extending it to cast-in-place applications. This is partially attributed to the high lateral pressure SCC exerts on formwork from increased fluidity and faster casting rates compared to vibrated concrete and overall poor understanding of SCC formwork response, both of which can contribute to the possibility of formwork failure. Due to these reasons current code requires that SCC formwork be designed to withstand hydrostatic pressure, although several studies have shown that the actual pressure on formwork can be less10,11,12. This raises the cost of formwork – in the US, the cost of formwork can be as much as 60% of the total cost of the completed concrete structure in place13. Therefore many studies have explored methods to tie the rheological behavior of SCC to formwork pressure response and strategies to reduce SCC formwork pressure through mix design14,15,16,17.
It has been shown that it is possible to reduce formwork pressure through the use of mineral admixtures18,19. In one study by Kim et al., it was found that small additions of attapulgite nano-sized clay can reduce the formwork pressure of SCC concrete mixes over time20. However, the physical origin of this effect is still not fully understood. Major factors affecting SCC formwork pressure include its rate of structural rebuilding over time, or thixotropy21,22, and material

11
cohesion. High rate of structural rebuilding and cohesion indicate a rapid development of green strength (fresh-state stiffness) and subsequently greater reduction in lateral pressure on the formwork wall. To effectively manipulate the fresh-state properties of HVFA-SCC with the use of clays (or any mix design) for the application of reducing formwork pressure, a method to tie SCC formwork pressure response and rheology is necessary but still remains elusive.
1.4. OVERALL PROJECT OBJECTIVES
Given that SCC has such potential, and that the use of fly ash is so desirable, the objective of the proposed study it to develop a material that will promote sustainability by incorporating a large amount of waste product and exhibit superior properties to increase construction productivity. The challenges of developing this new type of HVFA-SCC will be:
1. To overcome the delay in strength gain that is caused by the fly ash
2. To reduce the formwork pressure of SCC
It is hypothesized that nanoparticles (e.g. nanosilica and nanolimestone) will facilitate the use of fly ash by maintaining early-age strength gain while nanoclays will facilitate the use of HVFA-SCC for cast-in-place applications by developing green strength. Fresh-state and early-age properties will be closely evaluated, where fresh-state is considered before set while early-age is after set. With proper proportioning of fly ash, clays, and nanoparticles, we expect to develop a material with the potential to revolutionize cast-in-place SCC applications from both a construction and sustainability standpoint. Specific objectives include the following:
1. Evaluate the influence of clays on HVFA-SCC so as to effectively use them to tailor its rheological properties
2. Explore test methods to appropriately characterize HVFA-SCC 3. Evaluate the fresh-state and early-age properties of HVFA-SCC
1.5. SIGNIFICANCE TO USDOT RESEARCH GOALS
The proposed research has been planned in consideration of the interests of ITI to support the development of infrastructure technologies. The USDOT research goals addressed by the proposed research are:
• Environmental Stewardship: HVFA-SCC will promote sustainability by utilizing a high amount of waste material, decreasing cement demand, and reducing energy consumption during construction.
• Global Connectivity: The reduced formwork pressure exhibited by HVFA-SCC will increase the level of confidence for cast-in-place SCC applications. This will help to update formwork standards, which will promote the use of SCC on-site and not just limit it to pre-cast plants.
• Infrastructure Renewal: The application of HVFA-SCC in pavements and highway structures will make them environmentally friendly, exhibit superior properties (i.e. durability, strength gain, low shrinkage), and enhance construction productivity.

12
2. USE OF NANOCLAYS TO ACHIEVE THE DESIRED FRESH-STATE PROPERTIES
2.1. INTRODUCTION
A previous study performed at ACBM-NU by Kim et al. investigated the effect of various mineral admixtures on SCC formwork pressure response 20. The formwork pressure evolution of SCC concrete mixes were measured using a formwork pressure device (depth, D = 15cm and height, H = 30 cm), shown in Figure 1. This setup simulated the lateral pressure induced on formwork during casting, allowing for different casting speeds and heights. Vertical pressure is applied directly to the surface of the concrete using a steel piston loaded by a closed-loop hydraulic testing frame and the lateral pressure is recorded by a transducer. (The details of the test setup can be found elsewhere20.) The results for SCC with 0% (NC0) and 0.33% (NC0.33) nanoclays are shown in Figure 2. Although both mixes exhibited the same initial flowability with a slump flow of 60 ± 2 cm (which fulfills the requirement for SCC), it is apparent that a small clay addition can lead to significantly reduced formwork pressure. However, to explore the mechanisms behind this behavior was not within the scope of that study.
Results of shear and compressive rheology and scanning laser microscopy tests have shown that clays increase flocculation strength and floc size23,24,25,26. Although this explains its effect on viscosity, its effect on SCC formwork pressure remains unclear. In the present study, novel rheological methods are implemented to characterize the effect of clays on pastes to explain their effect on SCC formwork pressure response.
Figure 1 Formwork pressure device with a depth D = 15 cm and height H = 30 cm20.

13
Figure 2 Formwork pressure response of SCC with and without nanoclays (both mixes had an initial slump flow of 60 ± 2cm)20.
2.2. MATERIALS
Type I ordinary Portland cement and tap water are used in all paste mixes. A purified magnesium aluminosilicate, or attapulgite, which exhibited the most enhanced effect in lowering SCC formwork pressure20, is selected for this study. These clays have been chemically exfoliated to preserve their uniform shape and size while removing all impurities (such as quartz and swelling clays). As received, they are highly agglomerated to the micron size – the scanning electron microscopy (SEM) image, Figure 3a. However, in the highly dispersed state they are nano-sized particles with a needle-like shape (1.75 µm in length and 3 nm in diameter)27, Figure 3b. Due to the particle shape, its aspect ratio (average length divided by average diameter = 583) is very high. Therefore, they may form a highly entangled gel even at a small volume concentration, provided they are properly dispersed into individual particles.

14
a)
b)
Figure 3 SEM images of nanoclays in the a) agglomerated and b) dispersed state28.
2.2.1. Water Adsorption of Clays
In the dispersed state, the high specific surface area of the nanoclays in combination with their fine particle size can result in a significantly high adsorption capacity. The water adsorption of the nanoclay is measured through a pressure filtration setup used in similar work on alite (C3S)29. A constant negative pressure is applied at the bottom by a vacuum, which pulls water through the nanoclays to form a cake. The pressure is applied until a constant flow rate is achieved, at which point the cake reaches a state of equilibrium (full adsorption of the nanoclays and full saturation of the cake). From the wet mass (mwet) and oven-dried mass (mdry) of the sample, the water adsorption of the clays is calculated:
%100(%) ×−
=dry
drywet
mmm
Adsorption
(1)
This is performed at increasing applied pressures until the adsorption values converge. The results are shown Figure 4. The adsorption values converge to approximately 200% by dry mass of nanoclay, which agrees with reported values by the manufacturer27 and other literature30.

15
Figure 4 Water adsorption of nanoclays at various applied pressures as measured by the filtration test31.
2.2.2. Dispersion
The attapulgite nanoclays are highly hydrophilic, which make them easily dispersible in water. To determine the influence of dispersion on fluidity, the mini-slump flow of cement pastes are measured and compared for different mixing methods. Pastes are prepared either by a small planetary mixer or a household blender for high shear mixing. The mixing protocols are shown in Table 1. In the case of the planetary mixer, the nanoclays are added as-received in the dry, agglomerated form (P1) or pre-dispersed in water at high shear in a blender prior to mixing (P2). The mini-slump flow tests are performed immediately after mixing based on ASTM C 161132. All paste mixes had a volume fraction of 0.43 and a nanoclay addition of 0% or 0.5% by mass of cement.
Table 1 Mixing protocols31.
Protocol Mixer Mixing Procedure
P1 Planetary 1) Add cement (and nanoclay) to bowl. Mix for 2 min at speed 1.
2) Add water, mix for 1 min at speed 1, scrape bowl, mix for 2 min at speed 1, scrape bowl, mix for 4 min at speed 2.
P2 Planetary
1) Add nanoclay and water to blender. Blend for 2 min.
2) Add nanoclay-water suspension to dry cement in bowl.
3) Step 2 of protocol P1.
B Blender
1) Add water (and nanoclay) to blender. Blend for 1 min.
2) Add half of cement. Blend for 15 s.
3) Add rest of cement, blend for 15 s, scrape. Blend until total mixing time is 3 min.

16
The results are shown in Table 2. The plain cement paste (NC0) experiences higher fluidity when mixed in a blender than in a planetary mixer due to a higher degree of deflocculation. On the other hand, in the case of the cement paste with 0.5% addition of clay (NC0.5), the opposite is observed – the mix prepared in the blender is much stiffer. In addition, the mix also experiences a significant decrease in fluidity when the clays are pre-dispersed in water with a blender prior to mixing in a planetary mixer with the cement. The results illustrate that high degree of dispersion of the clays maximize their effect, likely due to increased surface interactions between the nanoclays and the cement particles. Also, the stiffening effect of the clays occurs immediately after placement. Herein, clays are always pre-dispersed in water prior to combining with the dry ingredients, i.e. cement and fly ash.
Table 2 Results of slump flow test to determine effect of nanoclay dispersion31.
Mix Protocol Slump flow (cm)
NC0 P1 18.2
B 23.8
NC0.5
P1 18.3
P2 11
B 11
2.3. PRELIMINARY RESULTS
2.3.1. The role of clay water adsorption on fresh-state stiffening
It is found that clays have a high water adsorption of 200% by mass. To determine the role of water adsorption on the fresh-state stiffening of concrete, a shear rheological method is used to obtain the viscosity evolution of cement pastes under a constant shear condition. All shear rheology tests are performed in a temperature-controlled Haake rheometer with a coaxial cylinder geometry set at room temperature. A constant shear rate of 300 s-1 is applied to paste samples for 60 min, from which the viscosity evolution is obtained.
Table 3 Mix proportions for constant applied shear rate protocol31.
Mix Cement (g) Water (g) Clay (g) Solid volume fraction
NC0 500 215 0 0.43
NC1 500 217.6 5 0.43
NC1H 500 227.6 5 0.41
NC0H 500 205 0 0.44

17
The mix compositions tested are shown in Table 3. A plain cement paste mix (NC0) and a mix with 1% addition of nanoclays by mass of cement (NC1) are tested. Then each mix is adjusted for water adsorption of the clays. NC1H is NC1 with an additional 10 g of water to compensate for the amount adsorbed by the 5 g of nanoclay while NC0H is NC0 with 10 g less water. (200% water adsorption by mass of clay is assumed according to the results of the filtration test.) This test is performed to determine whether water adsorption leading to a loss of free water is a dominating factor in the increase in stiffness caused by the clays.
The results are presented in Figure 5 and Figure 6. Figure 5 is the viscosity evolution up to 5 min, during which each mix reaches equilibrium. In evaluating the effect of adjusting for water adsorption of the clays, if loss of free water is a governing stiffening mechanism, mixes NC0 and NC1H and mixes NC1 and NC0H should exhibit similar viscosity evolutions. The plot shows that the viscosity at equilibrium of these mixes did not coincide: ηNC1H > ηNC0 and ηNC1 > ηNC0H. Also, the curves follow different trends – both clay mixes show a significant decrease in viscosity while the neat cement pastes do not. The high viscosity exhibited by the clay-modified pastes at the start of the protocol, once shear is introduced, shows that the effect of the clays on stiffening occurs immediately. It is apparent that adjusting the water content is not sufficient in negating the effect of the clays on stiffening, thereby making it unlikely that water adsorption leading to loss of free water is a dominating factor.
Figure 5 Viscosity evolution up to equilibrium (5 min)31.

18
Figure 6 Viscosity evolution after equilibrium (up to 60 min)31.
Table 4 Change in viscosity from equilibrium to final (60min) of pastes under constant shear31.
Mix ΔViscosity (Pa-s)
NC0 0.192
NC1 0.175
NC1H 0.18
NC0H 0.176
After equilibrium, at which point flocs cannot be broken down any further under the given shear condition, viscosity increases for all pastes, as shown in Figure 6. As expected, ηNC1 > ηNC0 at equilibrium due to the increase in flocculation strength induced by the clays (φM,NC1 < φM,NC0). However, both mixes experience a similar rate of stiffening over time. Table 4 shows the change in viscosity of all mixes from equilibrium to final (60 min). The values are all very close, indicating that the stiffening over time under the constant shear condition is not influenced by the clays.
2.3.2. Effect of clays on specific rebuilding energy
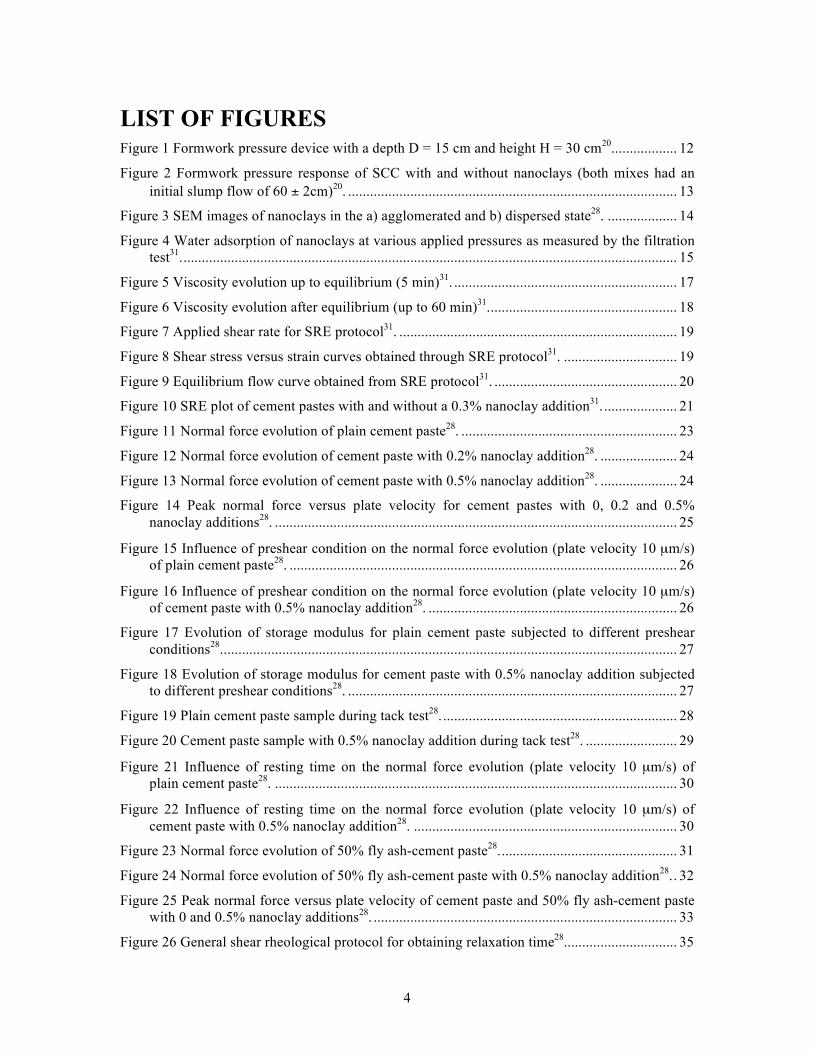
During construction, concrete is cast in layers and the material is left at rest between each layer, giving it time to develop fresh-state structure. Therefore, to measure the effect of clays on the stiffening of cementitious materials over time with rest periods, the specific rebuilding energy (SRE) protocol, developed by Ferron et al., is applied33.
The applied shear rate for the SRE protocol is shown in Figure 7. The paste sample is subjected to a pre-shear (600 s-1) to break down its structure until steady-state is reached. Then the shear is linearly ramped down to 0 s-1 to obtain an equilibrium curve. The mix is at rest for the remainder of the test, with the exception of a hysteresis loop (linearly ramped up and down) applied every
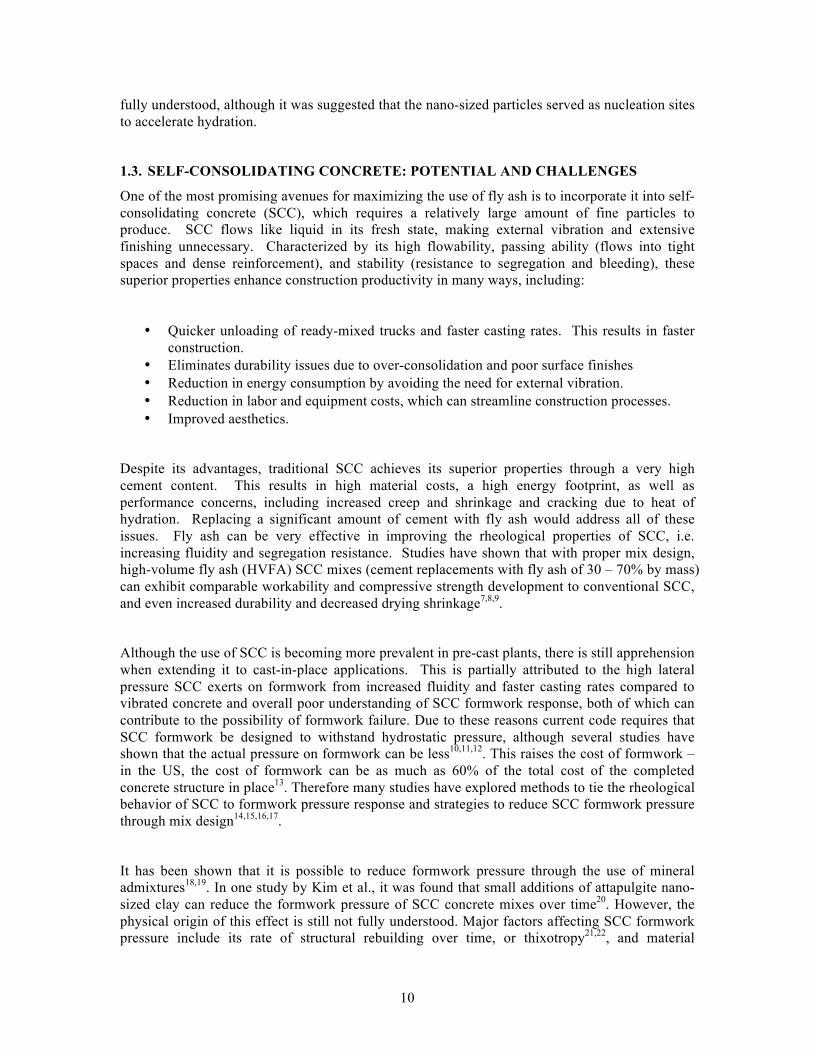
19
15 min up to 60 min. The area between each loading curve and the equilibrium curve between a given strain rate range is defined as the SRE, as shown in Figure 8. Also given in the following expression:
∫=
=
−=200
100
)(γ
γ
γττ dSRE EquilLoading
(2)
where τ is shear stress and γ is strain rate. The rate at which SRE increases provides a measure of structural rebuilding of the material over time. Cement pastes with (NC0.3) and without (NC0) a 0.3% nanoclay addition by mass of cement are tested.
Figure 7 Applied shear rate for SRE protocol31.
Figure 8 Shear stress versus strain curves obtained through SRE protocol31.

20
In addition, the flow curve parameters, yield stress and viscosity, are obtained from the equilibrium curve to compare the initial state of the samples. A modified Bingham equation is used34:
γµγγ
ττ +⎥⎦
⎤⎢⎣
⎡⋅−= )3exp(1
crity
(3)
where τy is yield stress,γcrit is critical strain rate corresponding to τy, and µ is plastic viscosity.
The results of the SRE protocol are shown in Figure 9 and Figure 10. It is apparent that the clay mix experiences greater yield stress and viscosity at equilibrium, as shown in Table 5 and Figure 9. However, the two mixes go on to experience the same SRE rate, indicating similar structural rebuilding (Figure 10). A change in the water or solids content would lead to a change in the SRE rate. Therefore, the results show that the clays did not have a significant effect on the water or solids content after equilibrium and the mechanism behind structural rebuilding must be linked to the cement particles. This agrees with the results of the viscosity evolution. The clays have an immediate effect on structural rebuilding, likely due to flocculation, but then have little influence over time.
Figure 9 Equilibrium flow curve obtained from SRE protocol31.

21
Figure 10 SRE plot of cement pastes with and without a 0.3% nanoclay addition31.
Table 5 Equilibrium flow curve parameters obtained from SRE protocol31.
Mix Viscosity (Pa-s) Yield stress (Pa)
NC0 0.0958 35.7
NC0.3 0.1104 55.3
2.4. EFFECT OF CLAYS ON COHESION
The strength of material cohesion of SCC is expected to have a significant effect on formwork pressure, where high cohesion can reduce initial pressure and increase the rate of lateral pressure drop over time. Therefore it is desirable to measure the effect of clays on this rheological property. This issue can be investigated by considering the adhesive properties of the material. A standard method of evaluating the adhesive properties of a material is the tack test, which is widely used for soft polymer adhesives35,36,37 but novel for granular materials. The test can measure cohesion (the internal strength of the material at rest), which can provide insight into proper mix proportioning with clays and fly ash to reduce SCC formwork pressure. In addition, the test can provide characterization of SCC mixes to demonstrate that its formwork pressure can be less than hydrostatic, which is critical for more efficient formwork design.
In this portion of the study, the influence of nanoclays on the adhesive properties of cement pastes is evaluated through the tack test. They are also supplemented with a measure of the viscoelastic properties over time through low-amplitude oscillatory shear rheometry.

22
2.4.1. Experimental procedures
All rheological tests are performed on a Paar Physica MCR rheometer with a parallel-plate geometry. The top plate has a diameter of 50 mm and the bottom plate is temperature-controlled with a circulating water bath set to 20°C. To prevent slip, the surfaces of the plates are covered with 150-grit adhesive sandpaper.
2.4.1.1. Tack test
The tack test is performed on cement pastes with 0, 0.2 and 0.5% nanoclay addition by mass of cement (0NC, 0.2NC and 0.5NC). During the test, the top plate moves up vertically at a constant velocity, subjecting the sample to stretching, and the normal force experienced by the top plate is recorded over time. At the very beginning of the test, the sample deforms elastically and the normal force increases with the gap thickness (or time). Beyond a critical tensile strain the normal force decreases, marked by the peak, indicating that the sample starts undergoing a failure process. The peak force can be attributed to 1) resistance to flow (viscous effects) and 2) resistance to elastic failure due to the intrinsic cohesion of the material. A measure of cohesion is of interest as it is considered to be a significant factor in reducing SCC formwork pressure. In the tack test, it corresponds to the value of the peak force for a vanishingly small pulling velocity. In the present investigation the cohesion component is assumed to be the value of the peak force for the smallest velocity considered, 10 µm/s. The normal force evolution is recorded for the following plate velocities: 10, 50, 200, 500, and 1000 µm/s.
2.4.1.2. Low-amplitude oscillatory shear rheometry
To better interpret the results of the tack test, they are supplemented with a measure of the evolution of the paste’s structure. This is done through low-amplitude oscillatory shear rheometry. This method provides information about the viscoelastic properties of suspensions and it has been demonstrated to be applicable to fresh cement paste38,39. An oscillatory strain is applied as a sine function:
(4)
where γ0 is maximum strain amplitude, t is time, and ω is frequency. If the strain is sufficiently low so that the particles in the suspension remain close to each other, the microstructure is not disturbed and the material can recover elastically. In this case (linear regime), the measured response in terms of stress is as follows:
(5)
where τ is shear stress, G’ is storage modulus, and G” is loss modulus. G’ is the elastic component while G” is the viscous component. By monitoring the evolution of G’, it is possible to measure the structural building of cement pastes over time.
An applied strain of 10-4 and frequency of 1 Hz are found to remain in the linear viscoelastic regime (based on strain and frequency sweeps) and so are selected for the oscillatory shear measurements. Oscillatory shear measurements are performed on cement pastes with 0 and 0.5% nanoclay addition.
2.4.2. Results and discussion

23
The normal force evolution of cement pastes with 0, 0.2 and 0.5% nanoclay addition are compared and the results are shown in Figure 11, Figure 12, and Figure 13, respectively. It is apparent that even at small additions, the nanoclay significantly increases the normal force experienced by the cement pastes at all plate velocities. This indicates that the clay increases cohesion and viscous dissipation. To better illustrate this effect, the peak force versus plate velocity is plotted for all mixes, shown in Figure 14. For each paste the peak force increases with plate velocity. The clay-modified pastes experience higher velocity dependence compared to the plain cement paste. This is due to the increase in viscosity caused by the clays, the origin of which can be tied to flocculation. There is also a substantial influence of particle size. The addition of 0.5% attapulgite nanoclay increases cohesion by 2.5 compared to neat paste, as shown in Figure 14. In a study that investigated the influence of bentonite clays on the adhesive properties of cement mortars, a 0.5% addition led to a marginal increase and a measurable effect was only achieved at additions of 2%40.
In the normal force evolution for all paste mixes, there is the occurrence of a second peak. It is the most marked at the lowest plate velocity, 10 µm/s, but also evident at 50 and 200 µm/s. It suggests that the material is exhibiting residual resistance to the plates separating after the break in flow indicated by the initial peak. This effect was not observed in similar systems such as muds41 or cement mortars40,42. This secondary peak can be accounted for by the evolution of its structure due to flocculation (e.g. by clays) and hydration mechanisms. In order to elucidate this, low-amplitude oscillatory shear rheometry is implemented. Due to the shear dependence and aging of concrete, its rheological properties and subsequently formwork pressure response will be affected by shearing history and time. Therefore the influence of preshear and resting time are investigated and discussed herein.
Figure 11 Normal force evolution of plain cement paste28.

24
Figure 12 Normal force evolution of cement paste with 0.2% nanoclay addition28.
Figure 13 Normal force evolution of cement paste with 0.5% nanoclay addition28.

25
Figure 14 Peak normal force versus plate velocity for cement pastes with 0, 0.2 and 0.5% nanoclay additions28.
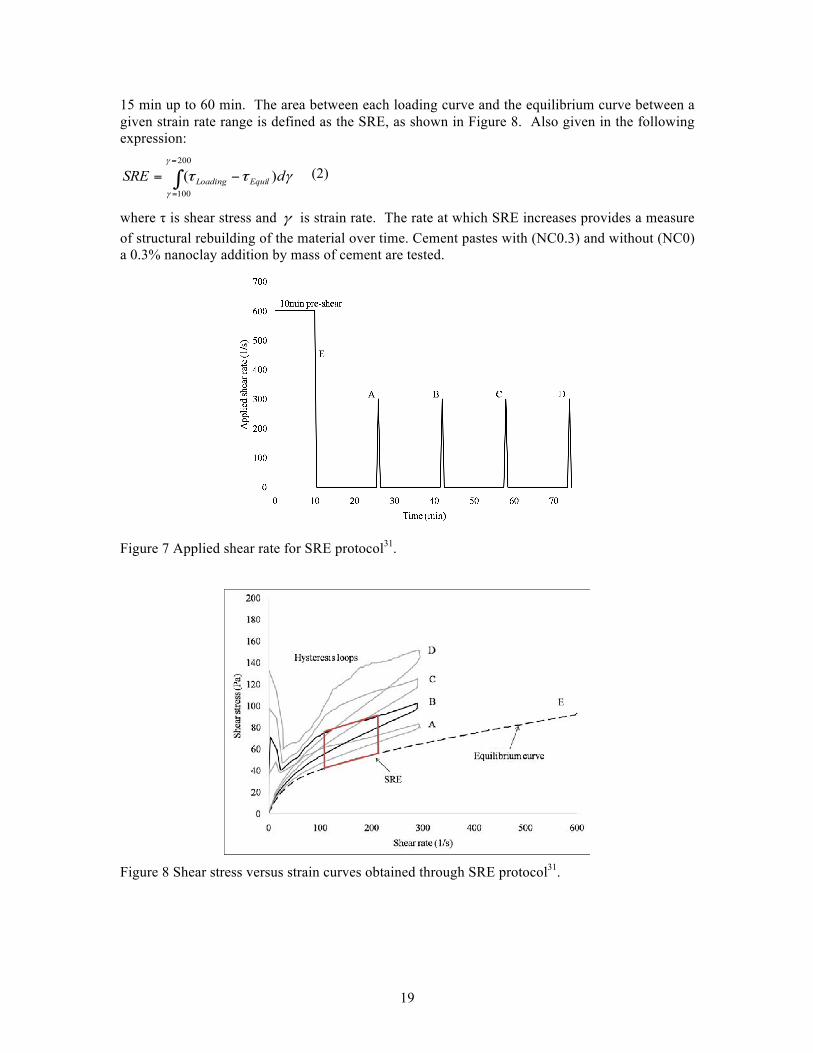
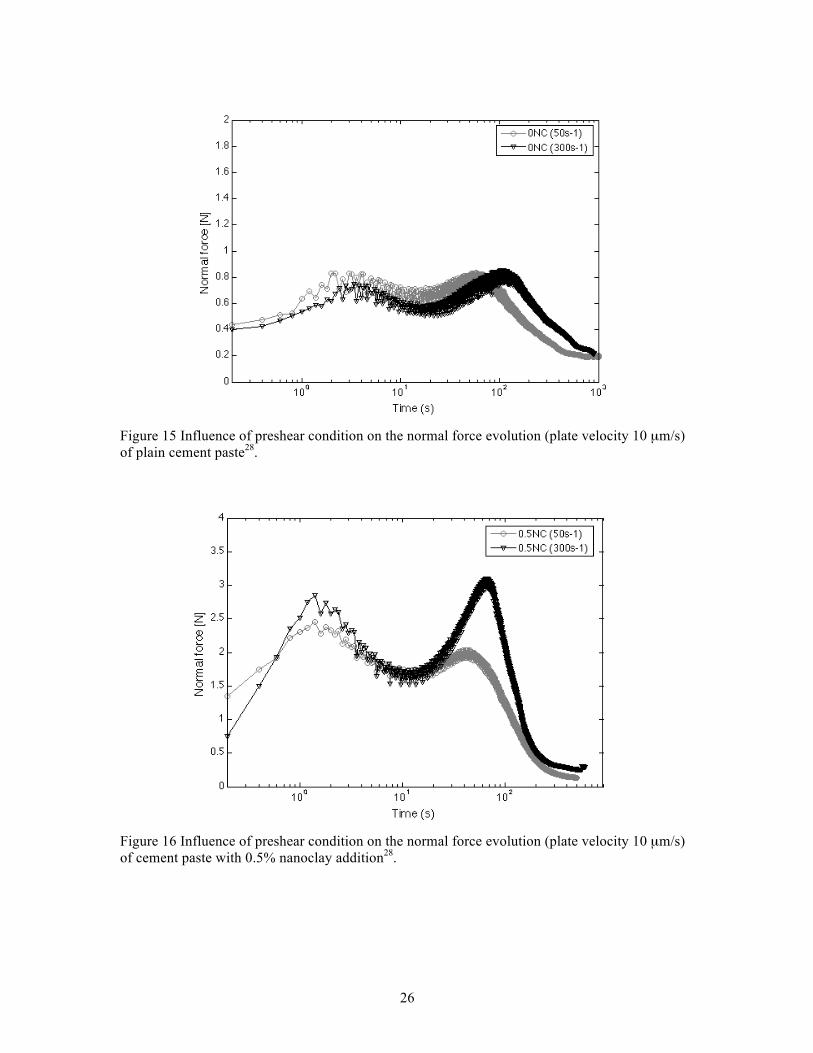
2.4.2.1. Influence of preshear condition
The results of the tack test at 10 µm/s for cement pastes subjected to a low (50 s-1) and high (300 s-1) preshear are shown in Figure 15 and Figure 16 for 0 and 0.5% nanoclay addition, respectively. For the plain cement paste, the initial peak is slightly lower for the sample subjected to 300s-1 than 50 s-1. This can be explained by the higher degree of structural breakdown that results from a higher preshear. At the time the initial peak occurs, it is less cohesive than the paste that is subjected to the lower preshear. In the cement paste with clay, the response is markedly different. Although at the very beginning (up to 0.3 s), the paste subjected to 300 s-1 exhibits lower normal force, it quickly recovers and goes on to exhibit a higher initial peak than the paste subjected to 50 s-1. This may be attributed to the increase in flocculation kinetics due to the presence of the clay, which results in rapid recovery of the structure. It follows that clays can increase the cohesion and viscosity of cement paste (as indicated by the higher normal force experienced over the duration of the test) and accelerate the material’s immediate rate of recovery – each has positive implications on the effect of clays on formwork pressure.
26
Figure 15 Influence of preshear condition on the normal force evolution (plate velocity 10 µm/s) of plain cement paste28.
Figure 16 Influence of preshear condition on the normal force evolution (plate velocity 10 µm/s) of cement paste with 0.5% nanoclay addition28.

27
Figure 17 Evolution of storage modulus for plain cement paste subjected to different preshear conditions28.
Figure 18 Evolution of storage modulus for cement paste with 0.5% nanoclay addition subjected to different preshear conditions28.
The structural evolution of the material at rest experienced after each preshear condition is determined by following the time evolution of G’ which is plotted for the plain and clay-modified

28
cement pastes in Figure 17 and Figure 18, respectively. It is apparent that both pastes experience significant structural recovery starting at approximately 10 s. By comparing the tack (Figure 15 and Figure 16) and oscillatory results (Figure 17 and Figure 18), it can be seen that the beginning of strain hardening is clearly correlated with the acceleration of the structural evolution of the material. This is likely tied to both physical reflocculation and hydration mechanisms. Studies have shown that as soon as cement and water make contact, a gel of various hydrates forms within the pore solution and on the cement particle43,44,45. This will result in an increase of G’. The origin of the structural evolution of the pastes may also include the change in ionic concentration or pH of the pore solution, which occurs very rapidly within the first 20 min. This will lead to a change in the colloidal interactions, subsequently leading to flocculation under certain conditions. For example, clay particles are known to flocculate at high ionic strength46.
In comparing the post-peak behavior of the pastes, they suggest that the mechanism behind the failure is different in each case. The plain cement paste experiences a more ductile failure while the paste with clay fails more abruptly, with a steeper downward slope. This suggests that the plain cement paste fails in a more liquid-like manner while the clay-modified paste fails in a more solid-like manner. This is captured in the images of the tested samples, shown in Figure 19 and Figure 20. Upon visual observation, it is apparent that the plain cement paste undergoes a gradual inward flow while the paste with clay is stiffer and undergoes failure within the sample under extension.
Figure 19 Plain cement paste sample during tack test28.

29
Figure 20 Cement paste sample with 0.5% nanoclay addition during tack test28.
2.4.2.2. Influence of rest time
To determine the influence of resting time on the pastes, the tack test is performed after the sample is allowed to rest for 150 and 300 s after a 300 s-1 preshear is applied. Through the rest time parameter, it is possible to determine the influence of the age of the sample on its tack properties. The results are shown in Figure 21 and Figure 22. Both pastes exhibit the same trends. The normal force increases with resting time. This is due to the structural recovery (and hydration) of the pastes, as verified by the evolution of storage modulus presented in the previous section. The effect is more pronounced with the clays, suggesting continued lateral pressure drop on SCC formwork over time. In all cases, the second peak is significantly lower than in the previous results, where the tack tests was performed while the sample was evolving rapidly. This is due to the decrease in the rate of rebuilding at the later ages of the pastes, as it can be seen in the G’ results. According to the results of oscillatory shear rheometry, G’ exhibits a more substantial increase from 10 to 100 s (about 150 kPa for 0 NC, 80 kPa for 0.5 NC) than 150 to 250 s (about 50 kPa for 0 NC, 30 kPa for 0.5 NC). The rate of increase in G’ goes down further after 300 s, tending to a plateau.

30
Figure 21 Influence of resting time on the normal force evolution (plate velocity 10 µm/s) of plain cement paste28.
Figure 22 Influence of resting time on the normal force evolution (plate velocity 10 µm/s) of cement paste with 0.5% nanoclay addition28.
2.4.2.3. Influence of fly ash replacement

31
To determine the influence of nanoclay on the adhesive properties of a system containing fly ash, 50% fly ash-cement paste is tested under tack and the results are shown in Figure 23 and Figure 24. The normal force curve of all cement pastes (0NC, 0.2NC and 0.5NC) at plate velocity 10 µm/s exhibit a secondary peak. Oscillatory shear measurements ties the origin of this peak to structural rebuilding, due to either hydration or flocculation mechanisms. From Figure 23, it is obvious that there is no apparent secondary peak in the 10 µm/s normal force curve for the 50% fly ash-cement paste. It is well-known that high replacement of cement with fly ash leads to slowed rate of hydration. Therefore the absence of a pronounced secondary peak is likely attributed to this. With the addition of 0.5% nanoclay, the normal force increases throughout all plate velocities, as shown in Figure 24. Similar to what is observed in cement paste, the nanoclay increases both cohesion and flow resistance. In addition, the normal force curve at 10 µm/s of the 50% fly ash-cement paste with nanoclay exhibits a secondary peak. This is due to the flocculation induced by the nanoclay.
Figure 23 Normal force evolution of 50% fly ash-cement paste28.

32
Figure 24 Normal force evolution of 50% fly ash-cement paste with 0.5% nanoclay addition28.
To determine the combined effect of fly ash and nanoclay, the peak normal force versus plate velocity of cement paste and fly-ash cement paste with 0 and 0.5% nanoclay addition are compared and plotted in Figure 25. In both systems (cement and fly ash-cement), the addition of nanoclay increases normal force throughout. In examining the effect of fly ash, although replacement of cement with fly ash leads to a decrease in peak force at higher velocities (50, 200, 500, 1000µm/s) in both cases with and without nanoclay, it does not affect peak force at the lowest velocity (10µm/s). This can be seen by comparing 0FA_0NC versus 50FA_0NC and 0FA_0.5NC versus 50FA_0.5NC.
It is known that fly ash increases fluidity due to their spherical shape. This gives them a ball-bearing effect, which reduces interparticle friction between more jagged cement particles and subsequently leads to a more flowable material. This explains the decrease in peak force compared to 100% cement paste at higher velocities, where the viscous contribution is greater. As aforementioned, cohesion is considered to be the peak force at vanishingly small velocities. Therefore the peak force at 10 µm/s may serve as a measure of cohesion. The results suggest that fly ash reduces flow resistance (peak force decreases at higher velocities) but maintains relatively high cohesion (peak force at the lowest velocity). These properties are desired for the application of reduced SCC formwork pressure, where the material exhibits high initial flowability during casting (low flow resistance) and high green strength after placement (high cohesion). The adhesive properties that result from combining nanoclay and fly ash show the potential of effective mix design for this application – the nanoclay can increase cohesion while the fly ash can increase flow resistance with little compromise to the cohesion.

33
Figure 25 Peak normal force versus plate velocity of cement paste and 50% fly ash-cement paste with 0 and 0.5% nanoclay additions28.
2.4.3. CONCLUSIONS
This study examined the influence of nanoclay on the adhesive properties of cement pastes through the tack test. The key results are as follows:
- At additions of 0.2 and 0.5%, the clay increases the peak normal force experienced by cement pastes at all plate velocities, indicating increase in cohesion and viscosity.
- Cement pastes with and without clay exhibit a secondary peak in the normal force evolution curves at lower plate velocities. Oscillatory shear rheometry results show that this is due to the high rate of rebuilding of the structure around this age, the origin of which can be tied to flocculation and hydration mechanisms.
- Cement pastes with and without clay exhibit a higher secondary peak and increased G’ after being subjected to the higher preshear. Further, the clay-modified paste exhibits a higher initial peak, as well, indicating that the clay increases the immediate rate of rebuilding. This can be tied to increase in flocculation caused by the clay.
- After a certain resting time, the initial peak increases while the second peak becomes less pronounced. The former can be attributed to the higher degree of recovery and cohesion that the paste achieves after rest. The latter can be attributed to the decrease in rate of structural rebuilding at later ages, as was shown in the evolution of storage modulus.
- Replacement of cement with fly ash decreases peak normal force at higher plate velocities but not at the lowest plate velocity. This suggests that fly ash decreases flow resistance but maintains relatively high cohesion. The combined effect of nanoclay and fly ash show the potential for effective mix design for the application of reduced SCC formwork pressure.

34
2.5. EFFECT OF CLAYS ON STRUCTURAL REBUILDING
The results of the tack test show that clays significantly increase cohesion, which is an important parameter governing SCC formwork pressure. For the application of reducing SCC formwork pressure, controlling the level of thixotropy is a critical parameter, as well – specifically, the rate of structural rebuilding immediately after placement. High rate of structural rebuilding indicates rapid development of green strength and subsequently greater reduction in lateral pressure on the formwork wall.
In this study, a novel shear rheological protocol (adapted from another study47) is implemented that measures rate of rebuilding through relaxation time. The material is first sheared to break down its structure. Then a fixed shear stress (lower than its yield stress) is applied and the decrease in strain rate to zero is recorded. The strain rate decay provides a measure of the time required for the material to recover sufficient structure to resist the applied shear. The advantage of this protocol is that since the applied shear stress is lower than the yield stress, the material approaches a state of rest. This simulates a real casting situation during which the concrete is initially in motion, and then measures how quickly it gains green strength immediately after placement. The effect of clays on the rate of recovery for different resting times and preshear conditions are measured. The strain rate decay curves are fitted using a compressed exponential model. The fitting parameters obtained from the curves (including characteristic time) will describe the influence of the various parameters on rate of structural recovery.
2.5.1. Experimental methods
All rheological tests are performed on a Paar Physica MCR rheometer with a parallel-plate geometry. The top plate has a diameter of 50 mm and the bottom plate is temperature-controlled with a circulating water bath set to 20°C. To prevent slip, the surfaces of the plates are covered with 150-grit adhesive sandpaper. The measuring gap is 1 mm.
To measure the effect of clays on rate of rebuilding, a rheological protocol is applied where the sample is initially sheared at a constant shear rate to break down its structure and then a fixed shear stress lower than its yield stress is applied47. The strain rate decay provides a measure of the rate at which the material regains enough structure to resist the applied stress. The faster the rate of decay, the higher the rate of rebuilding and vice versa. The protocol is shown in Figure 26. It is initially shear rate controlled, where a preshear is applied for 60 s. Then it switches to shear stress control and the evolution of shear rate is monitored. The shear stress is applied until the shear rate reaches zero. A break criteria is defined in this step: when the shear rate becomes less than 0.01 s-
1 (essentially zero) it skips to the next step or the end of the test. Rate of recovery will vary depending on the age of the sample and the shear condition. Therefore resting times of 0, 120, and 1800 s and shear rates of 50 and 300 s-1 are considered.

35
Figure 26 General shear rheological protocol for obtaining relaxation time28.
2.5.2. RESULTS AND DISCUSSION
The decay in strain rate of cement pastes with and without a 0.5% nanoclay addition (0NC and 0.5NC, respectively) after being subjected to a preshear at various resting times are determined for applied constant shear stresses of 20 and 30 Pa. The shear rate decay during the creep step is shown in Figure 27 and Figure 28 for preshear conditions of 50 and 300 s-1, respectively. The decay in shear rate is due to the structural rebuilding of the material over time. Once sufficient structural recovery is achieved to resist the applied stress, the shear rate goes to zero.
2.5.2.1. Characteristic time
The evolution of shear rate is fitted with the following exponential model:
γ (t) = γ0 *[exp(−t / τ )r ] (6)
where τ is characteristic time and r is a dimensionless constant. In the present case, the strain rate decay follows a compressed exponential, where r > 1. This has been experimentally found in a few cases in glasses and jammed granular materials, including clay suspensions48,49,50,51,52. The latter applies to the present case, where the increase in viscosity of the material is due to jamming within the material due to flocculation – water is entrapped within flocs and the effective density increases.
The parameters obtained for the strain rate decay at each age are given in Table 6 and Table 7 for preshear conditions of 50 and 300 s-1, respectively. For the results of pastes subjected to 300 s-1, the fit starts to diverge at the tail, between 50 and 0 s-1, especially in the case of clay-modified pastes. It is apparent that there is a change in the dynamics of characteristic time. This is due to the different average relaxation times of the different constituents, i.e. clay and cement. Other studies have found this, as well52,53. Two curves are used to fit the complete decay from 300s-1:

36
the branch from 300 to 50 s-1 and 50 to 0 s-1. For the latter case, the tail of the curve is extracted from the full decay and fitted with the compressed exponential. This is applied to all resting times and the parameters are shown in Table 8.
Focusing on the case of no resting time (0 s), it is apparent that the clay-modified pastes exhibit smaller τ and higher r than the plain cement pastes. This indicates that the clays can exhibit higher rate of rebuilding immediately after shear. This is tied to the flocculation behavior of the clays. In a study on the effect of pH and ionic concentration on the stability of attapulgite aqueous suspensions, Chang et al. found that high ionic concentration, at low and high pH, led to high viscosity46. This was attributed to the shrinkage of the electrical double layer around the clay particle surfaces. Subsequently, the electrical double layer repulsion decreases and flocculation will occur due to van der Waals attractions54. Therefore clays can expect to flocculate in pore solution. This has been confirmed in previous studies at ACBM-NU, as well23,25.
In addition, there is a size effect. In a study by Kaci et al., the influence of bentonite clays on the rate of structural rebuilding of cement mortars was investigated47. Bentonite clays were found to decrease relaxation time, as well, but the effect was not as significant as the one observed here. Comparing the time taken for shear rate to reach zero, the nanoclays can reduce it by nearly a factor of 10 (Figure 27a) while the bentonite clays reduced it by approximately a factor of 2. The clays in the present study are very fine and have a rodlike shape, which gives them a high aspect ratio. The bentonite clays, on the other hand, were microsized. The high specific surface area in combination with their fine size will lead to higher surface forces between particles. Also, they can provide more contact points within the material and make its structure more interconnected.
a)
37
b)
c)
Figure 27 Shear rate decay after 50s-1 preshear condition after a) 0 s, b) 120 s, and c) 1800 s resting time28.

38
a)
b)

39
c)
Figure 28 Shear rate decay after 300s-1 preshear condition after a) 0 s, b) 120 s, and c) 1800 s resting time28.
2.5.2.2. Influence of resting time
In the previous section, the difference in rate of recovery at 0 s was compared between cement pastes with and without clays. Here, the evolution of rate of recovery over time up to 1800 s is discussed. In plain cement pastes, the characteristic time consistently decreases and r increases for both shear conditions. This indicates that the material is approaching an increasingly jammed state. However, at 1800 s the clay-modified pastes exhibit a slight increase in characteristic time and decrease in r, indicating reduced rate of recovery. The evolution of characteristic time can be explained by discussing the progression of hydration.
Clay-modified pastes exhibit high rate of recovery from the beginning (0 s) because the clays have an immediate effect during initial hydrolysis, as discussed previously. In the case of plain cement paste, its degree of flocculation (and subsequently rate of recovery) is highly dependent on the formation of early hydrates. The first 30 min within initial cement and water contact is considered to be the dormant period. Although this is not the main hydration phase, hydrates such as ettringite will precipitate and early C-S-H gels will start to form around cement grains. Both will contribute to the formation of a gel-like network within the pore solution and lead to a higher flocculation rate. Other studies have shown that at later ages the effects of hydration begin to dominate55,56. This may be why after longer resting times (1800 s) the plain cement pastes go on to exhibit comparable or faster rate of rebuilding compared to the clay-modified pastes. Another possible explanation is that the clays are having a negative effect on hydration during this period. This may be attributed to its high water adsorption capacity, which can be hindering the development of the early hydrates.

40
To obtain a measure of stiffening due to early hydration, oscillatory shear rheometry tests are performed on the pastes. The details of the test can be found in the previous chapter (Section 4.2.2.2). The same preshear is applied as that for the rate of recovery protocol – 50 s-1 for 60 s – and oscillatory shear measurements are taken immediately after. The evolution of storage modulus (G’) and loss modulus (G”) for the pastes over 1800 s (the duration of the rate of rebuilding test) is shown in Figure 29. The results indicate that very early on the clay-modified paste exhibits higher storage modulus than the plain cement paste, at least up to 120 s. This agrees well with the relaxation curves, where clays lead to faster relaxation times at 0 and 120 s. By 1800 s both mixes exhibit the same storage modulus. Similarly, both paste mixes exhibit close relaxation times at this age.
Figure 29 Evolution of storage and loss modulus of cement pastes with and without a 0.5% nanoclay addition28.

41
Table 6 Fitting parameters in compressed exponential model for strain rate decay of pastes subjected to constant shear stress after 50 s-1 preshear28.
Resting time
0NC 0.5NC 20 Pa 30 Pa 20 Pa 30 Pa
tau r tau r tau r tau r 0 s 0.169 1.51 0.306 1.02 0.0351 2.43 0.0341 2.52
120 s 0.102 1.74 0.141 1.3 0.0345 2.51 0.0303 2.44 1800 s 0.0429 2.09 0.0483 2.02 0.0682 2.21 0.0929 2.14
Table 7 Fitting parameters in compressed exponential model for strain rate decay of pastes subjected to constant shear stress after 300 s-1 preshear28.
Resting time
0NC 0.5NC 20 Pa 30 Pa 20 Pa 30 Pa
tau r tau r tau r tau r 0 s 0.44 1.36 0.551 1.23 0.189 1.66 0.191 1.7
120 s 0.277 1.4 0.286 1.35 0.14 1.72 0.142 1.75 1800 s 0.245 1.46 0.272 1.4 0.206 1.73 0.54 1.51
Table 8 Fitting parameters in compressed exponential model for strain rate decay of pastes subjected to constant shear stress after 300 s-1 preshear – fitting from 50 to 0 s-128.
Resting time
0NC 0.5NC 20 Pa 30 Pa 20 Pa 30 Pa
tau r tau r tau r tau r 0 s 0.189 1.62 0.319 1.08 0.0495 2.35 0.0463 2.24
120 s 0.113 1.6 0.131 1.23 0.0362 2.31 0.0373 2.31 1800 s 0.0958 1.57 0.129 1.29 0.0525 2.14 0.147 1.91
2.5.3. CONCLUSIONS
The influence of clays on the rate of recovery of pastes is evaluated through comparing strain rate decay curves and characteristic time. The key conclusions are as follows:
- The strain rate decays are fitted with a compressed exponential, which shows the degree of jamming within the material.
- The results show that the rate of recovery after shear-induced breakdown exhibited by the clay-modified pastes is very rapid compared to the plain cement pastes, especially at early ages (0 and 120 s resting times).
- The accelerating effect of clays on rate of recovery diminishes at longer resting times (1800 s) as hydration mechanisms start to dominate. This may also be tied to negative effects of clays on hydration due to their high water adsorption.

42
2.6. TYING RHEOLOGICAL RESULTS OF CLAY-MODIFIED PASTES WITH FORMWORK PRESSURE RESULTS OF SCC
As aforementioned, in a previous study the formwork pressure response of SCC with 0% (NC0) and 0.33% (NC0.33) clays were measured, results of which are shown in Figure 2. The basic concrete mix proportions are given in
Table 9. In this test, the applied vertical pressure, σV, followed a step-wise loading protocol, where the load was increased incrementally every .5 h and held. In an actual casting situation, σV would increase gradually as SCC is being poured in the formwork before leveling off, as shown in Figure 30, where the slope of σV is representative of casting rate. A two-function model proposed by Kwon et al.57 and Kim et al.58 can describe the measured lateral pressure, σL, from parameters obtained through a step-wise loading protocol by introducing a loading-time dependency. In this model, the pressure ratio between σV and σL is expressed by two functions as follows:
(7)
where α is delayed response, β is instantaneous response, t is current time, and t’ is time of loading. Further, while the concrete is plastic (before final set), α and β can be represented in terms of delayed coefficient a and instantaneous coefficient b, both of which are material parameters:
(8a)
(9b)
Table 9 The basic composition of SCC in formwork pressure study expressed in kg to produce 1m3 of concrete20
Ingredient Water Cement Fly ash Sand Gravel
Amount 182 338 154 879 824
)'()'()',()',( tttttt VL σβασ Δ=Δ
)'('1)',( 2 tttatt −••−=α
'1)'( tbt •−=β

43
Figure 30 Two function model for formwork pressure of concrete58
a)

44
b)
Figure 31 a) Delayed response and b) instantaneous response of SCC formwork pressure20
The delayed and instantaneous response of NC0 and NC0.33 are shown in Figure 31a and b, respectively. Upon increase in volumetric strain, NC0.33 experienced lower lateral pressure compared to NC0, as shown in the evolution of β in Figure 31b. The β(t’) curve for NC0.33 is steeper, indicating NC0.33 experienced increasingly reduced σL at each incremental increase in σV compared to NC0. As the volumetric strain was held constant over .5h, lateral pressure decreased at a similar rate for both SCC mixes, as shown in the evolution of dα(t,t’)/d(t-t’) in Figure 31a.
For the design of formwork, the maximum formwork pressure, σmax, is a critical value. The maximum formwork pressure depends only on placement rate and material properties (i.e. unit weight of concrete and coefficients a and b), not time. In a formwork pressure study by Kim et al.58, which used the two-function model to characterize a variety of different SCC mixes, a much greater variation was found for coefficient b than a. Also, the variation in a had a negligible effect on σmax while the variation in b had a dominant one during the first few hours of casting. It is apparent from Figure 31b that the instantaneous increase in fresh-state stiffening induced by the nanoclays significantly affects coefficient b. These effects are well captured by the rheological tests performed in this study, which measured the effect of clays on cohesion and rate of structural rebuilding and found they have an immediate effect on both. It follows that nanoclays have the capacity to greatly reduce σmax, which explains why they are effective in modifying SCC for the application of reduced formwork pressure.
2.7. RECOMMENDATIONS

45
The study demonstrated the suitability of 1) the tack test in measuring the adhesive properties and structural rebuilding and 2) the rate of rebuilding protocol in capturing the immediate rate of structural rebuilding of cement pastes after structural breakdown.
• The influence of other constituents that are systematically used in SCC should be investigated, e.g. superplasticizers, viscosity modifying agents, and limestone fillers. This will continue to provide further insight into appropriate mix design for the application of reducing SCC formwork pressure.
• The effect of clays on structural rebuilding decreased over time. The origin of this should be investigated, i.e. its interactions with hydrates (ettringite) and its effect on hydration mechanisms.
• To verify the methods, they should be compared with other methods of measuring thixotropic rebuilding.
• Given the flexiblility of altering the measuring gap and plate diameter on a parallel-plate setup, both tests can be performed on mortars, as well. It can be determined how the presence of aggregates influences adhesive and thixotropic rebuilding properties.
3. USE OF COLLOIDAL NANOSILICA TO IMPROVE THE EARLY-AGE HARDENED PROPERTIES OF HVFA-SCC
Multiple studies have shown that even at small dosages, nanosilica can improve the mechanical properties of cementitious materials9,59. As two pozzolanic materials (nanoSiO2 and fly ash) compete in adsorbing CH, and nanoSiO2 is far more reactive than fly ash, it can be deduced that there may be a shortage of CH in a nanoSiO2-added fly ash cementitious system. This can potentially prevent fly ash hydration at the later age, especially when the fly ash content is high. In this study, the effects of nanosilica on the fresh, hardening and hydration properties of fly ash-cement system at early and later ages were investigated. Mechanisms governing the effects were studied.
3.1. MATERIALS
Colloidal nanosilica (CNS) was used in this study. It had a mean particle size of 10nm and was produced by the sol-gel technique. In this technique, the nanoparticles are formed by the condensation and polymerization of SiO2 monomers that form through hydrolysis of trymethylethoxysilane or tetraethoxysilane – the commonly used precursors for synthesis of nanosilica. Two type F fly ashes (FA2 and FA3) from different fossil plants were studied. The transmission electron microscopy (TEM) image of CNS and scanning electron microscopy (SEM) images of FA2 and FA3 are shown in Figure 32. Figure 32(a) shows that most of the CNS particles are well-dispersed. SEM images show that the two FAs are different in morphology, the porous substance in FA3 could be carbon.
Three dosages of CNS (0%, 2.25% and 5% (solid state) by mass of binder) and three levels of cement replacement with fly ash (20, 40, and 60% by mass) were used. Water to binder (w/b) ratios of 0.41 and 0.35 were used to investigate rheological and setting properties, respectively. (When calculating the w/b ratio, the water content of CNS was considered.)
46
(a) CNS (TEM) (b) FA2 (SEM)
(c) FA3 (SEM)
Figure 32: Morphology image of CNS and fly ash60
3.2. HARDENING PROPERTIES
3.2.1. Setting time
ASTM C191 was followed and a manual Vicat apparatus was used to determine the initial and final setting time of pastes. Figure 33 shows the influence of CNS on the hardening of fly ash-cement pastes. It is apparent that CNS greatly shortened the initial and final setting time of all pastes. When 5% CNS was added, the initial setting time of 0% and 20% fly ash-cement pastes were cut down by nearly half. When 2.25% and 5% CNS were added, the setting times for 20% and 40% fly ash mortars were almost the same as those of the plain cement mortar. Although fly ash delays the hardening of pastes, the addition of CNS can greatly offset this effect.

47
Figure 33: Influence of CNS on the hardening of FA2 pastes61
3.2.2. Hydration heat
The semi–adiabatic calorimetry results of the control and samples with various additions of CNS are shown in Figure 34. It is clearly demonstrated that the addition of CNS increases both the hydration peak temperature and the reaction rate, the latter of which is shown by the 1st derivation of the hydration temperature curve. Similar effects can also be seen in SF-added cement pastes. It is well known that cement hydration is a dissolution-precipitation process and the acceleration of this process can be monitored by the evolution of pH value and electrical conductivity (revealing the ion concentration) of the paste solution. It is shown in Figure 35 that the addition of CNS introduces a higher rate of increase in pH and electrical conductivity in the early age (effects of CNS on pH and electrical conductivity at later ages were negligible), meaning a quicker dissolution of cement particles. The decrease in electrical conductivity is due to the adsorption of ions by the C-S-H gel and the sharper decrease exhibited by the CNS-added cement solution indicates a greater gel formation. When small particles are evenly distributed in cementitious materials, they act as nucleation sites, which will benefit the hydration process.
Initial setting
0
50
100
150
200
250
300
350
0CNS 2.25CNS 5CNS
Tim
e/m
in0FA 20FA 40FA
Final setting
0
50
100
150
200
250
300
350
0CNS 2.25CNS 5CNS
Tim
e/m
in
0FA 20FA 40FA

48
0 4 8 12 16 20
25
30
35
40
45
50
Tem
pera
ture
/
oC
Hydration time / h
0% CNS 0.5% CNS 1.0% CNS 5.0% CNS
0 4 8 12 16 20
-4
0
4
8
Hydration time / h
1st.
Dev.
Figure 34: Effect of CNS on cement hydration heat62
0 40 80 120 160 200 240 28012.60
12.65
12.70
12.75
12.80
pH
Time / min
0% CNS 5% CNS
w/b=217
18
19
Elec
tric
al c
ondu
ctiv
ity /
mS/
cm
Figure 35: Effect of CNS on pH value and electrical conductivity evolution of cement paste62
The effect of CNS on the hydration heat of 40% fly ash cement paste is shown in Figure 36. It demonstrates that fly ash replacement reduces the hydration peak temperature significantly, and the occurrence of the hydration peak is delayed, as well. Figure 36 illustrates that with the addition of 5% CNS, an earlier and greater hydration heat peak can be seen in both 20% and 40% fly ash cement pastes, implying a faster and greater degree of hydration.
The hydration acceleration of CNS on cement-FA2 blends is also demonstrated by its effect on the induction period, which lasts from the beginning of hydration to about 2 to 3 hours. During this period, a decrease in temperature was observed due to the low heat generation at this stage. This reveals that the addition of CNS shortens the induction period for both 20% and 40% fly ash cement pastes, implying an accelerated hydration of this system.

49
Figure 36: Effect of CNS on cement-FA2 hydration heat60
3.3. MECHANICAL PROPERTIES
ASTM C10963 was followed to measure the compressive strength of mortar by using a 4448kN MTS hydraulic test machine. For each mix at each age, three Φ5.08cm×10.16cm cylindrical samples were tested and the average value was taken to be the representative strength. To evaluate the effect of CNS on the strength evolution of fly ash-cement systems, the compressive strength ratio at each curing age was calculated using the following equation:
R(%)=100*fi/fc Eq.(2)
where R is compressive strength ratio, %, fi is compressive strength of fly ash mortar with various dosages of CNS, and fc is compressive strength of plain cement mortar.
An R value greater than 100% indicates a higher strength than that of plain cement mortar. The slope of the R curve shows the strength evolution rate compared to that of plain mortar. By comparing R, the influence of fly ash and CNS on strength evolution can be determined. All samples were water-cured at room temperature for 24h after casting.
3.3.1. Effect of CNS dosage
Results showing the effect of CNS dosage on the strength gain of FA2 mortars are shown in Figure 37. For 0% CNS mortars at each fly ash replacement level, R was less than 100% and increased with curing ages. This indicates that fly ash greatly reduces the strength gain of cement mortar, especially at early ages. When CNS was added, the early-age strength (1d, 3d, and 7d) was enhanced. However, by 3 months (3m) the strengths of CNS-fly ash mortars were exceeded by those of fly ash mortars without CNS, indicating that CNS had negative effects at later ages.
0 4 8 12 16 2020
24
28
32
36
40
44
Tem
pera
ture
/ o C
40FA 0%CNS40FA 5%CNS
20FA 5%CNS
Control
20FA 0%CNS
Time/h

50
Figure 37: Effect of CNS on the compressive strength ratio of FA2 cement mortar61
3.3.2. Effect of FA type
The strength enhancing effect of CNS on FA2 and FA3 were compared. It is shown in Figure 38 that when compared to FA2 mortar, the compressive strength of FA3 was less than that of FA2 in the first 7 days of curing. After 7 days, the mechanical properties of FA3 mortars were better developed than those of FA2. This may be attributed to the differences in CaO and amorphous content of the fly ashes, as described in the material characterization section. The chemical

51
composition and the content of the glass phase are important factors of the pozzolanic reactivity of fly ash – a higher CaO content can lead to high early-age reactivity and a higher amorphous content can supply more sources for pozzolanic reaction at later ages.
It can be observed that the compressive strength of 5% CNS, 20% FA3 mortar was greater than that of the control at 7d and 28d. At the same time, it is shown in Figure 38 that the strength enhancing effect of CNS was sustained longer in FA3 mortar than in FA2 mortar. All these features may be due to the differing characteristics of the fly ashes.
Similarly to what was observed in FA2 mortars, the strength enhancing effect of CNS decreased at later ages in FA3 mortar, as well. The 56d compressive strength of CNS-added FA3 mortars are comparable to that of non-CNS mortar.
Figure 38: Comparison of the effect of CNS on the mechanical properties of FA2 and FA3 cement mortars61
3.4. HYDRATION PROPERTIES OF HVFA-CEMENT SYSTEMS
3.4.1. CH content

52
Thermogravimetric analysis (TGA, TGA/sDTA 851) was carried out to measure CH content. The weight loss between 440°C and 510°C was considered to be the decomposition of CH. Before measuring, samples were oven – dried at 105°C for four hours. CH contents were calculated on the ignited basis at 950°C for 30min.
Cement hydration produces CH while pozzolanic reaction consumes CH. The effect of CNS on cement hydration can be monitored by the formation of CH.
0 7 14 21 28 35 42 49 56
0
4
8
12
16
20
24
Cal
cium
hyd
roxi
de c
onte
nt/%
Time/d
CNS 0% CNS 5%
0 4 8 12 16 20 24
0
2
4
6
8
10
12
14
Figure 39: Effect of CNS on CH content of cement paste62
0.1 1 10 100
-8
-6
-4
-2
0
2
4
ΔCH
%
Time/d Figure 40: Difference in CH content between CNS-added and control cement pastes62

53
Figure 41 Ca(OH)2 content vs. time60
It is shown in the inserted plot of Figure 39 that during the first 8 hours of hydration, the CNS addition can increase the CH content: the CH content of 5% CNS-added paste is ca. 30% greater than that of the control paste at 4 hours of hydration. The reduction in CH content in CNS-added paste afterwards is due to the pozzolanic reaction. The effect of CNS on cement hydration can be evaluated by the difference in CH content between pastes with and without this pozzolan. This effect can be shown more apparently in the later age, during which the pozzolanic reaction has finished. The CH content disparity shown in Figure 40 at different segments can be attributed to different reasons. Before 7 days, the pozzolanic reaction of CNS is accounted for by the CH content reduction. Although the pozzolanic reaction is almost complete at early ages, the disparity in CH content keeps increasing, which implies a slowed CH generation and cement hydration of CNS-added paste in the later age.
It is shown in Figure 41 that in fly ash-cement pastes, at each age the Ca(OH)2 content of the 5% CNS paste was lower than that of the 0% CNS paste. The greater Ca(OH)2 consumption of 5% CNS-added paste is due to the additional pozzolanic reaction of CNS. Moreover, it is interesting to note that more Ca(OH)2 was consumed in the 0% CNS fly ash paste at later ages (28d-56d), indicating that further pozzolanic reaction of fly ash had occurred. A lack of calcium hydroxide at later ages, which may result in a lower hydration degree of fly ash, is likely a contributing factor to the reduced rate in compressive strength gain of fly ash – cement systems with CNS.
3.4.2. Morphology
Hitachi S-4800 FE-SEM was used to analyze the morphology of the cement paste. Small fractured samples or powder samples at very early hydration ages were soaked in acetone to stop hydration and dried at 80°C for 2 hours. Then the sample was coated with 20nm of gold to make it conductive. Noticeable changes in the appearance of the paste morphology were observed in CNS-added cement pastes.
0
2
4
6
8
10
12
0 7 14 21 28 35 42 49 56 63
Time/d
Calc
ium
Hyd
roxi
de C
onte
nt%
40%FA 0%CNS 40%FA 5%CNS

54
Cement
0%CNS, 1h 5%CNS, 1h
0%CNS, 2h 5%CNS, 2h
0%CNS, 4h 5%CNS, 4h

55
0%CNS, 3d 5%CNS, 3d
Figure 42: SEM images of the evolution of cement at different ages62
The SEM images, Figure 42, show the typical morphological features of cement or cement paste at various ages. Cement grains exhibit irregular shapes with flat surfaces covered by small debris. After one hour of hydration, for the plain cement paste, there are many pits on the cement particle surface – these are due to the dissolution of the cement particle after meeting water64. Meanwhile, some needle-like hydrates appear on the cement particle surface. For the CNS-added paste, the surface is more seriously eroded, indicating a greater extent of dissolution. However, the characteristic needle-like hydrates are more difficult to see. A distinct feature of CNS-added paste is that the cement particles are covered with small particles that are ca. 50nm. These can be the reacted CNS particles, which are larger than their original size of 10nm, indicating hydration of CNS. This shows that the hydration acceleration effect of CNS is achieved through the hydration of CNS. This can be supported by the hydration heat calorimetry results of CNS and C-S-H seeded pastes25, the former of which shows an accelerated induction period, while, for the latter no such period occurs.
After two hours, the control paste shows no obvious change in morphology from the one hour old control paste due to the induction phase. However, in CNS-added paste, significant hydration can be observed: more hydrates are compacted around CNS particles and some cluster hydrates can be seen.
After 4 hours, both samples are covered with immature needle–like hydration products. It is apparent that the population of these products in the CNS – added paste is significantly higher than that of the control paste and the products are more compacted, as well. After 3 days of hydration, both of the pastes are characterized by the featureless and densified gel structure with amorphological CH. However, it is still apparent that the CNS paste is more mature than the control paste.
The hydrate morphology evolution of CNS-added cement pastes indicates that the hydration acceleration effect of CNS is achieved by its high pozzolanic activity in the very early age, which generates C-S-H gel and then acts as nucleation sites to accelerate cement hydration. The hydration acceleration mechanism revealed by the SEM images can be verified by comparing the morphology evolution of CNS-added cement paste and of C-S-H seeded C3S paste, the latter of which shows a faster formation of new hydrates but no prior step of nucleus formation.
3.4.3. Cement and fly ash hydration degree

56
Image analysis of graphs obtained from backscattered electron microscopy technique (BSE, Hitachi S-3400) was used to evaluate the hydration degree of cement paste at later ages. Before testing, thin sample section of approximately 5 mm was cut out of the specimen cast in 2cm× 2cm × 8cm mold and mounted on a metal sample holder for polishing. Samples were polished using silicon carbide paper of gradation 22µm, 14.5µm, and 6.5µm and the polishing time of each step was 5 minutes. In the final step, the polished samples were ultrasonically cleaned in water for 1 minute using a bath sonicator to remove polishing debris from the sample surface. Then the sample was soaked in acetone for 1 day before been vacuum-dried at 50°C for 12 hours. Samples were coated with 20nm of gold to make it conductive.
The degree of fly ash hydration was determined by the selective dissolving method using 2N hydrochloric acid. This method is based on the fact that in cement-fly ash pastes, only unhydrated fly ash particles and the non-dissolvable components in cement can not be dissolved in the 2N HCl solution65. By measuring the fly ash amount remaining in the samples dissolved in HCl solution at various hydration ages, the degree of fly ash hydration can be monitored. The dissolving procedure used is the same as that reported in previous research66, during which 1g of sample was dissolved in 30ml of 2N HCl at 60°C for 15 minutes. The undissolved residue was then centrifuged at 4000rpm. Subsequently the solution was decanted. The solid phase in the centrifuge tube was filled with hot water, centrifuged again at 4000 rpm for 30 s and decanted. This step was repeated three times. Then the residual specimen was dried at 80°C for 12 h and weighed. The degree of fly ash hydration can be calculated by using the following equations.
,
, ,, ,
,
100100(1 ) ( (1 ) )40 60100
s HCl
neFA HCl c HCl
FA HCl c HCl
CNS
FA HCl
nW R n R nn nW
R nα
×
−− × × + − ×
× + ×
+=
× Eq. (3)
0 0
0
105 950
950
% 100 [ ( )]C Cne cem c FA FA CNS CNS
C
w wW f I f I f I
w−
= × − × + × + ×
Eq. (4)
where,
α: fly ash hydration degree, %;
R: fly ash replacement ratio, %;
WCNS : CNS dosage, %;
Wne: non-evaporable water content, %;
Ic: loss of unhydrated cement at 950°C, %;
IFA: loss of fly ash at 950°C, %;
ICNS: loss of CNS at 950°C, %;
ns,HCl: sample undissolved in 2N HCl, %;
nc,HCl: dry cement undissolved in 2N HCl, which was 8.36%;

57
nFA,HCl: dry fly ash undissolved in 2N HCl, which was 82.48%.
BSE images of cement pastes with and without CNS are shown in Figure 43. Image analysis shows that after 8 months of hydration, 96.8% cement has been reacted in control paste. However, only 89.4% took part in the reaction in 5% CNS-added paste. A coating of hydrates was observed on unhydrated cement particles of 23% CNS-added C3S paste, which is considered to be less permeable and hinders C3S hydration in the later age.
0% CNS 8months 5% CNS 8months
Figure 43: BSE images of cement pastes60
Influence of CNS on the pozzolanic reaction of fly ash is shown in Figure 44. Significant differences in the hydration characteristics of fly ash are revealed in the CNS-added paste when compared with the hydration characteristics of the FA-cement paste with no CNS. Very little pozzolanic reaction occurs at 7 days in both pastes. However, a slightly higher degree of fly ash hydration is observed in the CNS-added paste. This trend existed for two months, after which the degree of fly ash hydration in CNS-added paste becomes significantly smaller than that of non-CNS paste. Seven months later, the degree of fly ash hydration in non-CNS paste can be as much as 32%, while it is only 18% in 5%CNS paste. This implies that the pozzolanic reaction of fly ash is accelerated in the early age, but the later age reaction is greatly hindered.
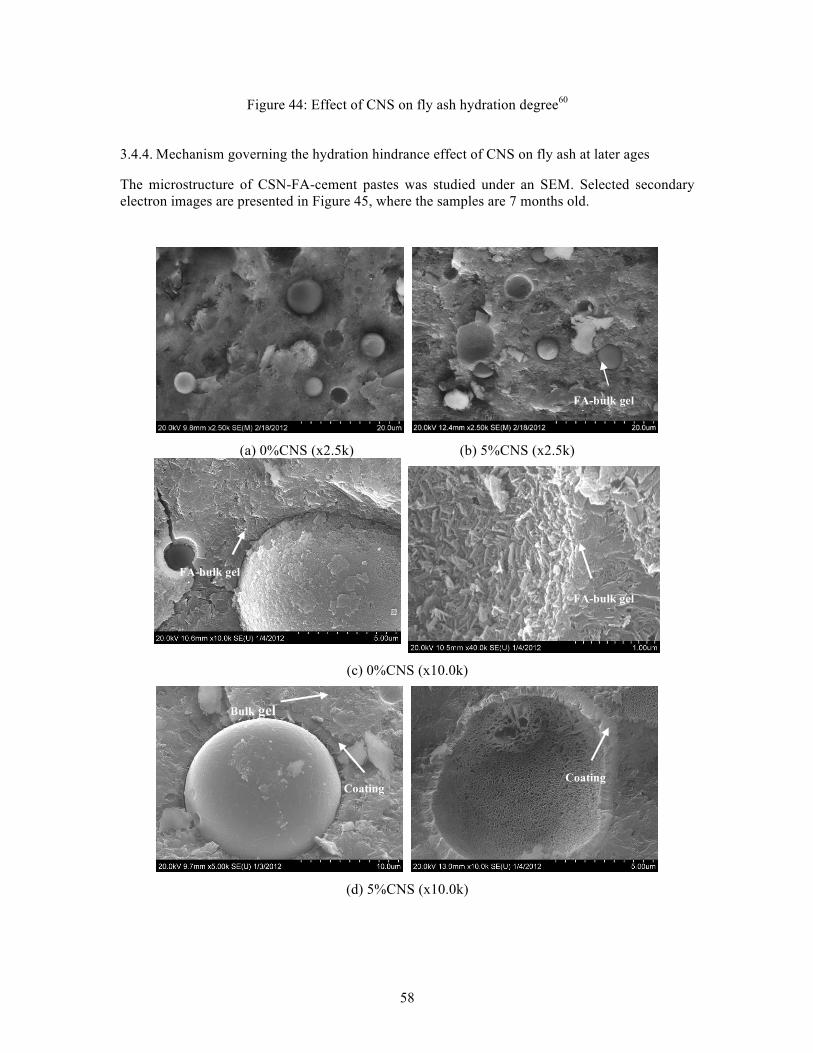
58
Figure 44: Effect of CNS on fly ash hydration degree60
3.4.4. Mechanism governing the hydration hindrance effect of CNS on fly ash at later ages
The microstructure of CSN-FA-cement pastes was studied under an SEM. Selected secondary electron images are presented in Figure 45, where the samples are 7 months old.
(a) 0%CNS (x2.5k) (b) 5%CNS (x2.5k)
(c) 0%CNS (x10.0k)
(d) 5%CNS (x10.0k)
Bulk gel
Coating Coating
FA-bulk gel interface
FA-bulk gel interface
FA-bulk gel interface

59
(e) 5%CNS (x100.0k)
Figure 45: SEM images of FA-cement paste with and without CNS addition at 7months60
In the paste with no CNS (Figure 45 (a) and (c)), the fly ash particles are coated with significant amount of hydration products, and the uniform rod-like C-S-H gel is tightly packed around fly ash particles. For paste with 5% CNS (Figure 45 (b) and (d)), the fly ash particle surface appears very clean and with little features, indicating a lower degree of FA hydration. At the interface between the fly ash particle and the bulk paste, there is a double-layer coating structure (Figure 45 (d)) in the CNS-added paste. A close examination shows that this coating consists of a hollow tubular layer structure and a compact layer structure (Figure 45 (e)). Figure 46 illustrates the development of this coating structure around a fly ash particle in the 5% CNS-added fly ash-cement paste.
(a) 12 hours (b) 7 days
Tubular layer
Compact layer
Tubular layer
FA
Coating

60
(c) 7months
Figure 46: Development of the layer structure around a fly ash particle in the 5% CNS-added fly ash-cement paste60
It shows that hydration products are found coating fly ash particles in the 12 hour old sample. A clearly compact gel structure, which is about one micron in thickness, can be observed coating the fly ash particles after 7 days, while the bulk gel structure is more porous. Seven months later, the distinct coating becomes so compact that it can be treated as a uniform layer. This coating layer structure became even more compact at 7 months when compared with that at 7 days. At the same time, a hollow tubular coating of about several hundred nanometers between the unhydrated fly ash particle and the very dense coating is found in the 7 month old sample. It shows that no tubular coating was formed at 7 days and thus it may be deduced that this coating is resulted from hydration of fly ash. Tubular gel structure is prevalent in nature, and such a hollow tubular gel is considered to be formed following the reverse ‘silicate garden’ theory. Based on this theory, after contacting with water, a semi-permeable membrane is quickly formed around cement particles, and water and Ca2+ diffuses through the membrane while SiO4
2+ stays inside. At a certain time, the membrane between the high-silicate and high-calcium solution bursts locally under high osmosis pressure. The jet of the silicate solution, which erupts into the calcium solution, precipitates continuously to form a tube of solid hydrates67,68.
From the distinct morphology of the coating structure, it may be expected to be due to the pozzolanic reaction and the cement hydration acceleration effect of CNS. The accelerated formation of C-S-H gel at the early age covering the fly ash particles may act as an ion transportation barrier, thus hinders fly ash hydration later on. A similar cement hydration hindrance mechanism was also found in fresh paste cured at high temperatures. It has been well-documented that the early-age hydration and hardening properties of cement-based materials can be improved by high temperature curing. However, both properties in the later age can be adversely affected69,70. This has been tied to the C-S-H gel that forms around the cement particles at early ages, which has no sufficient time to diffuse and forms a well-compacted layer that acts as a barrier of ion penetration and hinders cement hydration at later ages69,71,72. However, for the gel formed under normal and low temperatures, no such hydrate coating is formed70. Verbeck and Helmuth72 suggested that at low temperatures there is more time for the hydration products to diffuse than at higher temperatures.
Effects of coating formed at early-ages on unhydrated cement particles in high temperature was also shown by its effect on the microstructure: it has been reported that although C-S-H near the cement grain is much denser and stronger in high temperature cured samples, the cement bulk matrix is more homogenous and less porous for samples cured at low temperatures70,73 and thus the compressive strength is higher74.
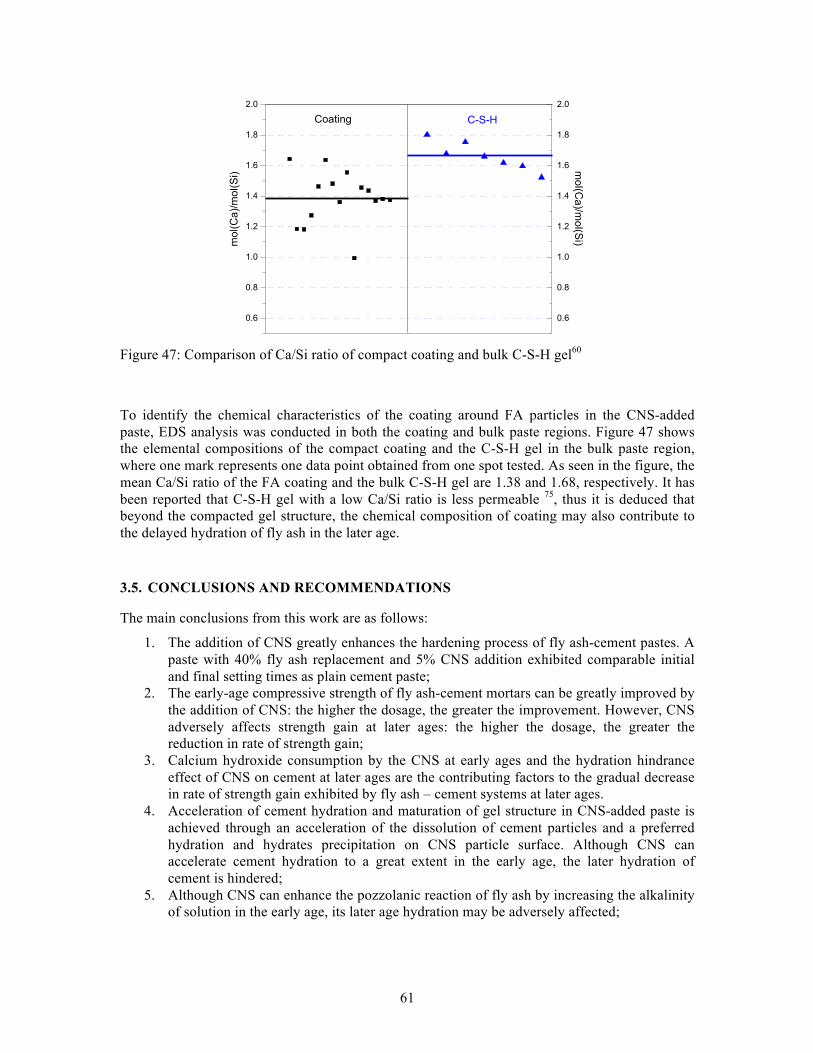
61
Figure 47: Comparison of Ca/Si ratio of compact coating and bulk C-S-H gel60
To identify the chemical characteristics of the coating around FA particles in the CNS-added paste, EDS analysis was conducted in both the coating and bulk paste regions. Figure 47 shows the elemental compositions of the compact coating and the C-S-H gel in the bulk paste region, where one mark represents one data point obtained from one spot tested. As seen in the figure, the mean Ca/Si ratio of the FA coating and the bulk C-S-H gel are 1.38 and 1.68, respectively. It has been reported that C-S-H gel with a low Ca/Si ratio is less permeable 75, thus it is deduced that beyond the compacted gel structure, the chemical composition of coating may also contribute to the delayed hydration of fly ash in the later age.
3.5. CONCLUSIONS AND RECOMMENDATIONS
The main conclusions from this work are as follows:
1. The addition of CNS greatly enhances the hardening process of fly ash-cement pastes. A paste with 40% fly ash replacement and 5% CNS addition exhibited comparable initial and final setting times as plain cement paste;
2. The early-age compressive strength of fly ash-cement mortars can be greatly improved by the addition of CNS: the higher the dosage, the greater the improvement. However, CNS adversely affects strength gain at later ages: the higher the dosage, the greater the reduction in rate of strength gain;
3. Calcium hydroxide consumption by the CNS at early ages and the hydration hindrance effect of CNS on cement at later ages are the contributing factors to the gradual decrease in rate of strength gain exhibited by fly ash – cement systems at later ages.
4. Acceleration of cement hydration and maturation of gel structure in CNS-added paste is achieved through an acceleration of the dissolution of cement particles and a preferred hydration and hydrates precipitation on CNS particle surface. Although CNS can accelerate cement hydration to a great extent in the early age, the later hydration of cement is hindered;
5. Although CNS can enhance the pozzolanic reaction of fly ash by increasing the alkalinity of solution in the early age, its later age hydration may be adversely affected;
0.6
0.8
1.0
1.2
1.4
1.6
1.8
2.0
mol(C
a)/mol(Si)m
ol(Ca)/mol(Si)
Coating
0.6
0.8
1.0
1.2
1.4
1.6
1.8
2.0
C-S-H

62
6. There is a dense coating around FA particles in the CNS-added pastes, which, with a low Ca/Si ratio may result from the reactive CNS hydration at the early age and act as a barrier that hinders ion penetration and consequently the fly ash hydration at the later age.
From the results obtained, it can be seen that the combined use of fly ash and nanosilica is beneficial for the early-age strength gain of this system. However, the influence of nanosilica on the long-term mechanical properties of fly ash-cement system should also be fully considered. For the application of HVFA-SCC, alternative nanoparticles that are not pozzolanic should be considered. Or alternatively, an approach to relieve the adverse effects of nanosilica on the later-age properties of fly ash-cement systems must be developed.
4. USE OF CACO3 NANOPARTICLES TO IMPROVE THE EARLY-AGE HARDENED PROPERTIES OF HVFA-SCC
4.1. INTRODUCTION
Although limestone powder has long been considered to be inert, recent work has shown that it can affect cement hydration. Studies have shown that it can accelerate early-age hydration, improve particle packing, provide nucleation sites for calcium hydroxide, and produce additional hydration products 66,76,77,78,79,80,81,82,83,84. Thus far the focus has mainly been on micro-sized limestone. NanoCaCO3 has not been widely investigated83,85,86,87.
There are a number of advantages of using nanoparticles over microparticles. NanoCaCO3 will have a higher purity (97.5% for nano versus 85% for micro) and significantly higher surface area, which makes them more reactive and allows them to contribute to filler and seeding effects. Subsequently, the addition level can be substantially lower. However, from a practical standpoint, this hinges on the ability to achieve good dispersion. One of the major setbacks of using nanoparticles over microparticles is that uniform dispersion becomes significantly more challenging. Due to their high surface area and energy, nanoparticles experience increased surface interactions and are more susceptible to particle adhesion upon direct contact by van der Waals, elecstratic and magnetic forces.
In this study, there is a focus on obtaining well-dispersed, stable CaCO3 nanoparticles in an aqueous medium through sonication and the use of surfactants. Dispersion is considered to be how effectively the aggregated CaCO3 nanoparticles can be broken up into primary particles. Stability is how well the nanoparticles can remain dispersed. It is important to achieve both. Various sonication protocols and surfactant types are investigated. Dispersion and stability are quantitatively measured through methods that utilize optical absorbance spectroscopy. They are also qualitatively confirmed through SEM imaging. Then, the sonication protocol and surfactant that yields the best dispersion and stability is selected and scaled up. Scaling up is considered to be important for realizing the practical implications of the approach.
4.2. MATERIALS
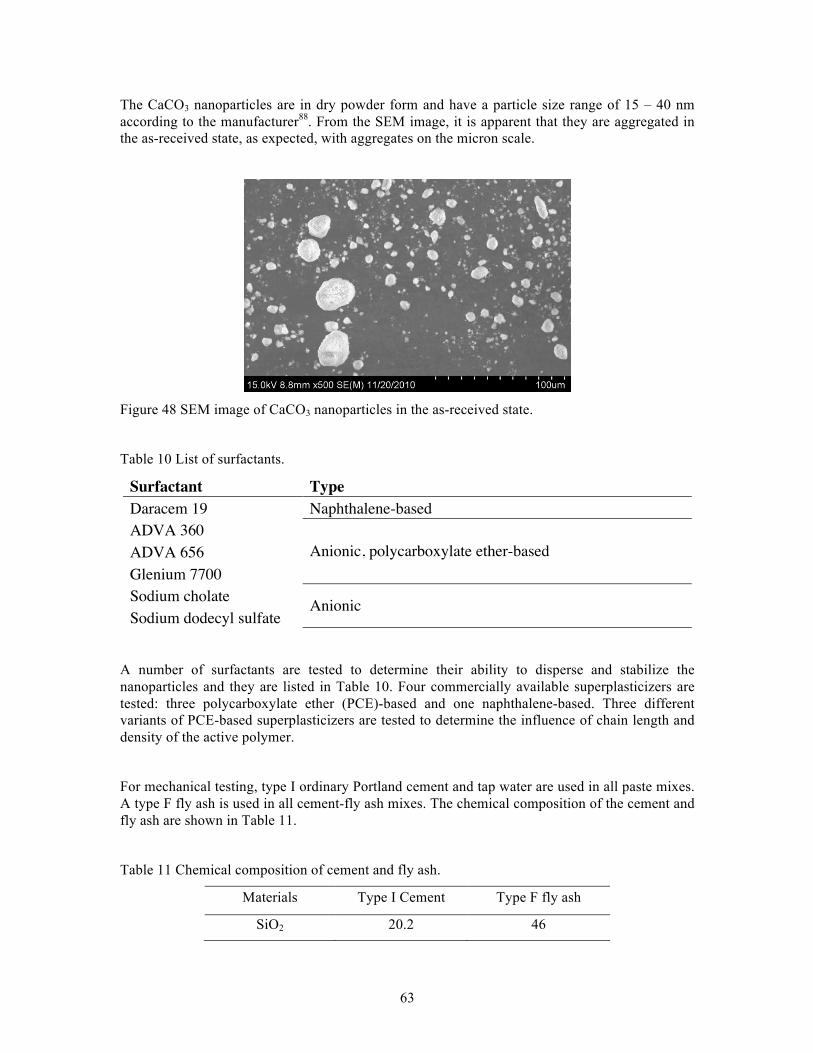
63
The CaCO3 nanoparticles are in dry powder form and have a particle size range of 15 – 40 nm according to the manufacturer88. From the SEM image, it is apparent that they are aggregated in the as-received state, as expected, with aggregates on the micron scale.
Figure 48 SEM image of CaCO3 nanoparticles in the as-received state.
Table 10 List of surfactants.
Surfactant Type Daracem 19 Naphthalene-based ADVA 360
Anionic, polycarboxylate ether-based ADVA 656 Glenium 7700 Sodium cholate Anionic Sodium dodecyl sulfate
A number of surfactants are tested to determine their ability to disperse and stabilize the nanoparticles and they are listed in Table 10. Four commercially available superplasticizers are tested: three polycarboxylate ether (PCE)-based and one naphthalene-based. Three different variants of PCE-based superplasticizers are tested to determine the influence of chain length and density of the active polymer.
For mechanical testing, type I ordinary Portland cement and tap water are used in all paste mixes. A type F fly ash is used in all cement-fly ash mixes. The chemical composition of the cement and fly ash are shown in Table 11.
Table 11 Chemical composition of cement and fly ash.
Materials Type I Cement Type F fly ash
SiO2 20.2 46

64
Al2O3 4.7 17.8
Fe2O3 3.3 18.2
SO3 3.3 2.59
CaO 62.9 8.4
MgO 2.7 0.95
Na2O / 0.59
K2O / 2.16
LOI 1.1 1.49
Total 98.2 98.2
a) b) c)
Figure 49 Sonic dismembrator setup.
4.3. DISPERSION IN DILUTE AQUEOUS SOLUTIONS
4.3.1. Experimental methods
4.3.1.1. Sample preparation: Sonication
To break up the aggregated CaCO3 nanoparticles in aqueous solution, ultrasonication is implemented. The setup is shown in Figure 49. The sample is placed in an ice bath during sonication to prevent overheating and evaporation (Figure 49c). The sonic dismembrator is programmed to apply a constant sonication for a set duration and amplitude. The evolution of the sample is shown in
Figure 50.
The maximum capacity for ultrasonication is approximately 200 mL, which is a relatively low amount. In order to utilize these suspensions for preparing paste samples for mechanical testing in

65
the present study or, eventually, concrete for construction in practice, there is a need to scale up. In order to realize the potential of scaling up, bath sonication is implemented. The bath sonicator used in this study allows for up to 2 L of solution to be prepared. Commercially available sonicators can allow for 30 L of solution. An image of the bath sonicator loaded with two 200 mL samples is shown in Figure 51. Sonication is performed at room temperature.
a) b) c)
Figure 50 Left to right: a) nanoCaCO3 dry powder, b) water (and surfactant) added, and c) after sonication.
Figure 51 Bath sonicator.
4.3.1.2. Measure of dispersion through absorbance spectroscopy
To obtain a quantitative measure of dispersion and stability, the absorbance spectra of nanoCaCO3 aqueous suspensions are measured by a photospectrometer, pictured in Figure 52. It is expected that nanoparticles that are dispersed and stabilized will remain in suspension. By comparing the absorbance between samples, it is possible to determine how effective sonication protocols and surfactants are at dispersing and stabilizing nanoparticles in an aqueous medium.

66
Figure 52 Photospectrometer.
4.3.1.2.1. Centrifugation method
The absorbance spectra are measured for 1) the supernatant of centrifuged nanoCaCO3 aqueous samples and 2) samples obtained immediately after sonication. The latter serves as a reference point, at which the nanoparticles are expected to be the most suspended. During centrifugation, any undispersed, aggregated particles will crash out to the bottom while the monodispersed nanoparticles will remain suspended in the supernatant. By comparing the absorbance before and after centrifugation, it is possible to obtain a measure of the amount of aggregated particles and, subsequently, degree of dispersion after sonication.
4.3.1.2.2. Sedimentation over time
It is of interest to measure the sedimentation of nanoparticles over time when the suspension is left at rest. Although during sonication the nanoparticles may become dispersed, it is possible that they will reaggregate over time – it is useful to know at what rate this is occurring. The evolution of sedimentation will provide insight into the state of a suspension at the time it is introduced to a cementitious system (e.g. in the present study, for paste sample preparation for mechanical testing). The sedimentation over time of select samples is measured by monitoring the change in absorbance of the suspension up to 24 hours.
4.3.1.3. Scanning electron microscopy (SEM)
Hitachi S-4800 FE-SEM equipped with energy dispersive spectroscopy (EDS) is used to analyze the state of dispersion of the CaCO3 nanoparticles. A drop of the nanoCaCO3 suspension is placed on a sample holder and allowed to dry under ambient conditions for at least 2 h. All samples are coated in 20 nm of gold to make it conductive. The accelerating voltage and current are 15-20 kV and 10-20 µA, respectively. The SEM is set so the upper detector collects the secondary electrons.
4.3.2. RESULTS AND DISCUSSION
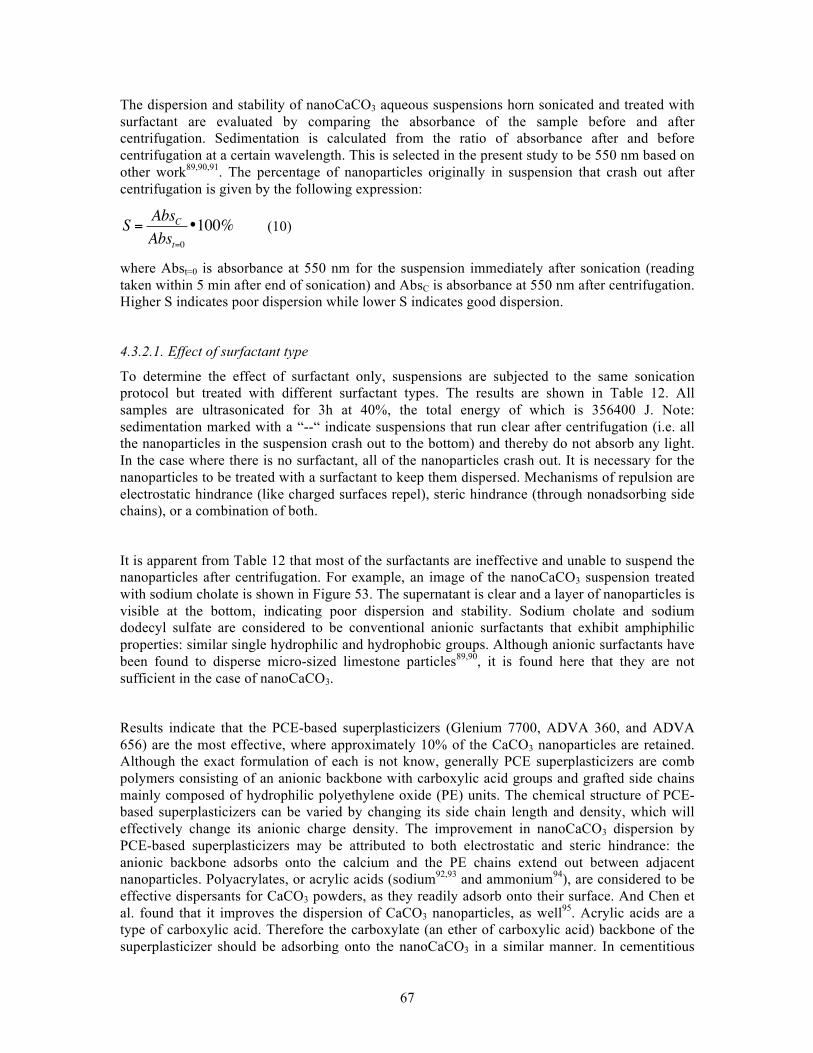
67
The dispersion and stability of nanoCaCO3 aqueous suspensions horn sonicated and treated with surfactant are evaluated by comparing the absorbance of the sample before and after centrifugation. Sedimentation is calculated from the ratio of absorbance after and before centrifugation at a certain wavelength. This is selected in the present study to be 550 nm based on other work89,90,91. The percentage of nanoparticles originally in suspension that crash out after centrifugation is given by the following expression:
S = AbsCAbst=0
•100%
(10)
where Abst=0 is absorbance at 550 nm for the suspension immediately after sonication (reading taken within 5 min after end of sonication) and AbsC is absorbance at 550 nm after centrifugation. Higher S indicates poor dispersion while lower S indicates good dispersion.
4.3.2.1. Effect of surfactant type
To determine the effect of surfactant only, suspensions are subjected to the same sonication protocol but treated with different surfactant types. The results are shown in Table 12. All samples are ultrasonicated for 3h at 40%, the total energy of which is 356400 J. Note: sedimentation marked with a “--“ indicate suspensions that run clear after centrifugation (i.e. all the nanoparticles in the suspension crash out to the bottom) and thereby do not absorb any light. In the case where there is no surfactant, all of the nanoparticles crash out. It is necessary for the nanoparticles to be treated with a surfactant to keep them dispersed. Mechanisms of repulsion are electrostatic hindrance (like charged surfaces repel), steric hindrance (through nonadsorbing side chains), or a combination of both.
It is apparent from Table 12 that most of the surfactants are ineffective and unable to suspend the nanoparticles after centrifugation. For example, an image of the nanoCaCO3 suspension treated with sodium cholate is shown in Figure 53. The supernatant is clear and a layer of nanoparticles is visible at the bottom, indicating poor dispersion and stability. Sodium cholate and sodium dodecyl sulfate are considered to be conventional anionic surfactants that exhibit amphiphilic properties: similar single hydrophilic and hydrophobic groups. Although anionic surfactants have been found to disperse micro-sized limestone particles89,90, it is found here that they are not sufficient in the case of nanoCaCO3.
Results indicate that the PCE-based superplasticizers (Glenium 7700, ADVA 360, and ADVA 656) are the most effective, where approximately 10% of the CaCO3 nanoparticles are retained. Although the exact formulation of each is not know, generally PCE superplasticizers are comb polymers consisting of an anionic backbone with carboxylic acid groups and grafted side chains mainly composed of hydrophilic polyethylene oxide (PE) units. The chemical structure of PCE-based superplasticizers can be varied by changing its side chain length and density, which will effectively change its anionic charge density. The improvement in nanoCaCO3 dispersion by PCE-based superplasticizers may be attributed to both electrostatic and steric hindrance: the anionic backbone adsorbs onto the calcium and the PE chains extend out between adjacent nanoparticles. Polyacrylates, or acrylic acids (sodium92,93 and ammonium94), are considered to be effective dispersants for CaCO3 powders, as they readily adsorb onto their surface. And Chen et al. found that it improves the dispersion of CaCO3 nanoparticles, as well95. Acrylic acids are a type of carboxylic acid. Therefore the carboxylate (an ether of carboxylic acid) backbone of the superplasticizer should be adsorbing onto the nanoCaCO3 in a similar manner. In cementitious

68
systems, PCEs are designed so that the backbone adsorbs onto the various phases of cement and hydrates (most containing calcium) and the PE “teeth” remain in pore solution. Some researchers have found that the carboxylic group preferentially binds to the Ca2+ sites96,97,98. Similar adsorption behavior is expected on the nanoCaCO3.
Figure 53 NanoCaCO3 suspension without surfactant after centrifugation.
4.3.2.2. Effect of sonication duration and amplitude
After the most effective surfactant is selected, the sonication protocol is optimized. The level of dispersion for suspensions treated with 33% Glenium by mass of nanoCaCO3 subjected to ultrasonication for different durations and amplitudes are presented in Table 13. This is to determine the protocol that achieves the best dispersion while limiting the amount of energy required for processing the nanoparticles. Evaluating the influence of duration, the sedimentation between 1, 3, and 6 h at 40% amplitude are compared. It is found that dispersion improves with duration. However, the rate of decrease in sedimentation goes down – the decrease from 1 to 3 h is greater than that from 3 to 6 h.
To determine the effect of amplitude, amplitudes of 35, 40, and 50% for a duration of 3 h are compared. Decreasing the amplitude from 40 to 35% results in a notable increase in sedimentation from 92.1 to 98.9%. On the other hand, an increase from 40% to 50% does not result in any apparent improvement. Therefore, there appears to be a threshold for amplitude – beyond 40% there is no significant improvement in dispersion for the given sonication setup. Regarding duration, although longer duration shows an improvement in level of dispersion, as measured by the present method, the energy demand increases drastically and disproportionally to it. It is likely that the sedimentation is tied to issues of reaggregation, as observed in another study where sonicated nanoparticles increased from 500 nm to 3-4 µm99. There have been some reported cases where high energy input induces reggregation100. Therefore in the present study a sample is prepared by applying lower amplitude for a longer duration (6 h at 30%) but it does not lead to improved dispersion: 96.5% sedimentation. The results suggest that instead of improving

69
dispersion through sonication duration or amplitude, which will break up the aggregates but not necessarily prevent reaggregation, it is more efficient to find a more suitable surfactant that will stabilize the particles once they are dispersed.
4.3.2.3. Effect of surfactant concentration
The effect of addition level is determined. Based on the previously discussed results, samples are treated with Glenium and sonicated for 3 h at 40%. NanoCaCO3 suspensions treated with different concentrations of the superplasticizer are tested and the results are shown in Table 14. Sedimentation of suspensions treated with 17 and 33% of the superplasticizer are similar, whereas 7% is not sufficient in suspending the nanoparticles.
Table 12 Influence of surfactant type on dispersion: all suspensions contain 3 g CaCO3 nanoparticles and 129 g of water28.
Surfactant Surfactant (g) Sedimentation at 550nm (%) None 0 -- Naphthalene 1 97.7 Glenium 7700 1 92.1 ADVA 360 1 92.7 ADVA 656 1 91.8 Sodium Cholate 1.3 -- Sodium Dodecyl Sulfate 1.3 --
*Note: Sedimentation marked with a “--“ indicate supernatants which run clear after centrifugation, i.e. all the nanoparticles in the suspension crash out to the bottom.
Table 13 Influence of time and amplitude of sonication on dispersion: all suspensions contain 1 g Glenium, 3 g CaCO3 nanoparticles, and 129 g water28.
Time (h) Amplitude (%) Energy (J) Sedimentation at 550nm (%) 1 40 118800 95.1 3 40 356400 92.1 6 40 712800 90.2 3 50 475200 92.9 3 35 311850 98.9 6 30 534600 96.5
Table 14 Influence of Glenium addition on dispersion: all suspensions horn sonicated for 3 hours at 40% amplitude28.
Glenium (% by mass of nanoCaCO3) Sedimentation at 550nm (%) 7 99.9 17 92.3 33 92.1

70
4.3.2.4. Sedimentation over time
In using the nanoCaCO3 suspension to prepare a cementitious material, its rate of sedimentation is of interest as it can provide a measure of the degree of dispersion at the time of casting. The sedimentation over time of the most effective surfactant (Glenium) is measured. In addition, it is compared for suspensions prepared by different methods of sonication – bath sonication and ultrasonication. To determine the viability of scaling up, it is important to confirm that the two methods are comparable.
The evolution of sedimentation is recorded for suspensions prepared by horn sonication and bath sonication. All suspensions are treated with Glenium at a concentration of 33% by mass of nanoCaCO3. Suspensions prepared by horn sonication (HS) are compared against those prepared by bath sonication for 6 and 9 h, BS6 and BS9. The absorbance from 380 to 800 nm of each sample immediately after sonication is shown in Figure 54 and is considered to be the initial reading. They are all very close, indicating that the initial degree of dispersion achieved is comparable between all the suspensions.
The amount of nanoparticles retained is normalized and given by the following expression:
R(t) = Abst=0Abst
•100% (11)
where R is the % retained, t is time after the initial reading, and Abs is absorbance at 550nm. (The initial reading is taken within 5 min after the end of sonication.) The results are shown in Figure 55. The sample that is horn sonicated exhibits a lower sedimentation rate compared to both bath sonicated samples. Over the first 30 min, retention drops 10% for BS6 and BS9 while it drops less than 5% for HS. After 30 min, the rate of sedimentation is about the same between all the samples up to 3 h. At 24 h, BS6 is found to experience the highest sedimentation. Therefore, bath sonicating for a longer duration aids in the dispersion process but, similar to horn sonicating, there exists a threshold value after which rate of improvement with time is marginal.
The overall sedimentation of all the samples is relatively high, where at least 60% of the nanoparticles settle out by 24 h. Although this is not ideal, for the purposes of evaluating the influence of dispersed nanoCaCO3 on the properties of fly-ash cementitious materials, the level of dispersion at the time of sample preparation is the most critical. It is possible to cast cementitious samples for mechanical testing within 1 h after sonication. Therefore the degree of dispersion over 1 h is important. According to Figure 55, for all samples at least 85% is retained after 1 h and 70% after 3 h. It can thereby be assumed that if the samples are cast within this time frame, the majority of the nanoparticles are still dispersed and suspended.

71
Figure 54 Absorbance spectra of suspensions immediately after sonication28.
Figure 55 Absorbance at 550nm as a measure of sedimentation over time28.
4.3.2.5. SEM images of sonicated nanoCaCO3 particles

72
To determine the state of the nanoparticles (i.e. mono-dispersed, primary aggregates, or large aggregates), they are viewed under SEM. The images are shown in Figure 56. It is apparent that nanoparticles that are stirred still remain highly aggregated, Figure 56a, exceeding 20 microns. This is similar to the state of the nanoparticles in the dry powder form, Figure 48. With sonication, however, no large aggregates are present, as shown in Figure 56b. All sonicated samples appear to be a single layer of particles. It should be noted that the drop of suspension for SEM are prepared from the supernatant. After 24 h, there is a layer of nanoparticles that settle to the bottom, which can be assumed to be highly aggregated. These images only depict the state of the suspended particles.
a)
b)
c)
d)
Figure 56 SEM images of nanoCaCO3 particles treated with Glenium (0.33% by mass) and prepared by a) mechanical stirring, b) and c) bath sonication, and d) horn sonication28.

73
Figure 57 SEM image of horn sonicated nanoparticles28.
4.4. EARLY-AGE HARDENING AND MECHANICAL PROPERTIES
The influence of dispersion method and addition level on the rate of hydration, setting time, and early-age mechanical properties of fly ash-cement pastes are evaluated. In addition, the morphology will be examined through SEM-EDS. A more compact microstructure will indicate good dispersion while any visible aggregation will indicate poor dispersion. At the same addition level, nanoparticles dispersed through sonication, blending and stirring will be compared. Dispersion becomes increasingly difficult at higher concentrations. Therefore addition levels of 1, 2.5 and 5% sonicated nanoparticles will be compared to determine the limit of the sonication method.
4.4.1. Early-age properties
Rate of hydration is measured in a semi-adiabatic calorimeter, pictured in Figure 58. A mix is prepared with 100 g cement and 40 g water to yield a paste with a w/c = 0.4. The freshly prepared mix is poured in a 2” x 4” cylinder and placed in an insulated drum. The temperature change over time is recorded with thermocouples for 24 h.
Setting time of pastes are measured using the Vicat needle test based on ASTM standard C191-08101. And compressive strength of cubic samples [50mm] at 1, 3, and 7d are measured in accordance to ASTM standard C109/C109M-08102. 3 and 7d samples are cured in water at room temperature until testing.
Paste samples for semi-adiabatic calorimetry are hand stirred in a 50 mL beaker for 60 s. Paste samples for setting time and compressive strength tests are prepared in a small upright mixer.
4.4.2. Scanning electron microscopy (SEM)

74
Hitachi S-4800 FE-SEM equipped with energy dispersive spectroscopy (EDS) is used to analyze the morphology and elemental composition of cement paste samples at various ages. A fractured piece obtained after compressive strength testing is soaked in acetone to stop hydration. All samples are coated with 25 nm of gold in a vacuum sputter coater to make it conductive. The accelerating voltage and current are 15-20 kV and 10-20 µA, respectively. The SEM is set so the upper detector collects the secondary electrons.
Figure 58 Semi-adiabatic calorimeter.
4.4.3. Rate of hydration
The influence of two methods of dispersion on rate of cement hydration is compared: blending and ultrasonication with surfactant treatment. For blended (B), nanoCaCO3 particles are blended in a household blender for 5 min in mixing water. Sonicated (S) nanoCaCO3 are ultrasonicated (horn sonicated) in mixing water. In the case of sonication, they are treated with a polycarboxylate superplasticizer (ADVA 360) at a concentration of 10% by mass of nanoparticle.
The rate of hydration of cement pastes with 1 and 5% nanoCaCO3 addition are compared against that of plain cement paste and the results are shown in Figure 59 and Figure 60, respectively. In all cases, the nanoparticles accelerate hydration: the induction period is shortened and the rate of temperature increase is greater. This is likely tied to a seeding effect.86 However, at both 1 and 5% addition, the mixes with sonicated nanoCaCO3 particles treated with polycarboxylate superplasticizer exhibit a higher rate of increase compared to those with blended. Since hydration is an exothermic reaction, the greater the rate of precipitation (formation of hydration products), the greater the heat release. Therefore the higher rate of temperature increase caused by sonicated nanoCaCO3 indicates that they are better dispersed, resulting in an increase in C-S-H seeding and nucleation sites.

75
Figure 59 Temperature evolution of cement paste with 1% nanoCaCO3 addition28.
Figure 60 Temperature evolution of cement paste with 5% nanoCaCO3 addition28.
4.4.4. Setting time
The setting times of cement pastes with 30% fly ash replacement are compared against that of plain cement paste (CP). 30% fly ash-cement pastes with no nanoCaCO3 (30FA) and with 1% nanoCaCO3 (1nLS) dispersed either by stirring or ultrasonication are compared. The nanoparticles are treated with Glenium 7700 and added at a concentration of 33% by mass of nanoCaCO3. Since Glenium is a superplasticizer that increases the fluidity of cementitious materials, the mix design of the paste samples are selected to prevent segregation. All samples (including those without any nanoparticles) have a 0.33% Glenium addition by mass of binder and a water-to-binder (w/b) ratio of 0.35.

76
The results are shown in Figure 61. Two samples are tested for each mix. As expected, the replacement of 30% of cement with fly ash delays initial and final set by approximately 2 h. With the addition of 1% nanoCaCO3 in both cases (stirred and sonicated), setting is accelerated. With the stirred nanoparticles, initial and final set are shortened by approximately 1 h. There is greater improvement with the sonicated nanoparticles, where set time is accelerated by more than 1.5 h. Similarly to the results of calorimetry, this indicates that sonication enhances the effect of the nanoparticles. As discussed previously, this is likely tied to the seeding effect, which increases with improved dispersion. There may also be a filler effect, where the nanoparticles are providing more contact points within the structure, therefore leading to a interconnected network more rapidly.
Figure 61 Influence of fly ash and CaCO3 nanoparticles on setting time of pastes28.
4.4.5. Compressive strength gain
The compressive strengths at 1, 3 and 7 days are compared for 30% fly ash-cement pastes with nanoCaCO3. Similarly to the setting time samples, all paste samples contain Glenium and a relatively low w/b ratio of 0.35 to prevent segregation and bleeding. Mixes with nanoCaCO3 additions of 1, 2.5 and 5% (1nLS, 2.5nLS, and 5nLS) by mass of binder are compared. The mix designs are shown in Table 15. In mixes 2.5nLS and 5nLS, the Glenium concentration is 16.5% and 8.3% by mass of nanoCaCO3, respectively. (This corresponds to 1.25% by mass of cement in the cement pastes for both cases.) According to the results of the dispersion tests, see Table 14, a Glenium concentration of 16.5% still returns sufficient dispersion while at 7% the degree of dispersion goes down significantly. However, the addition of Glenium allowable is limited by the rheological properties of the cement pastes, where increasing the Glenium addition in the pastes any more than 1.25% would lead to segregation and bleeding. At 1% nanoCaCO3 addition the suspensions are horn sonicated for 3h at 40% amplitude while at 2.5 and 5% the suspensions are bath sonicated for 9 h.

77
Table 15 Mix design for compressive strength paste samples.
Mix Cement [g] Fly ash [g] Water [g] NanoCaCO3 [g] Glenium [g] CP 750 0 262.5 0 2.5 30FA 525 225 262.5 0 2.5 1nLS 525 225 262.5 7.5 2.5 2.5nLS 525 225 262.5 18.8 3.1 5nLS 525 225 262.5 37.5 3.1
In Figure 62, the influence of 30% fly ash replacement and 1% nanoCaCO3 are shown. As expected, the replacement of 30% of cement with fly ash leads to a decrease in strength gain at all ages compared to the plain cement paste (CP). With the addition of 1% nanoCaCO3, there is little influence at 1 and 3 days, as shown in the strengths for both mixes 1nLS (sonicated) and 1nLS (stirred). However, by 7 days the sonicated mix exhibits higher strength than the plain 30FA sample by approximately 14%. The stirred mix, on the other hand, exhibits a slightly lower strength than 30FA. This may be attributed to aggregation. Due to the high surface energy of the nanoparticles, the aggregates have the capacity to entrain air. As a result, the aggregates will act as weak points in the material and result in stress concentration. Similar to what is seen in the calorimetry and setting time results, sonication and polycarboxylate superplasticizer treatment enhances the effect of the nanoparticles by improving their dispersion.
The effect of higher additions of nanoCaCO3 are determined and shown in Figure 63. It is apparent that the most improvement is achieved with a 2.5% nanoCaCO3 addition, with a 20% increase in strength for 2.5nLS at 7d compared to 30FA. It is likely that the improvement in mechanical properties exhibited by mixes 1nLS and 2.5nLS are due to seeding and filler effects.
With the addition of 5% nanoCaCO3, the improvement in strength gain is less significant at 7d and even detrimental at 1d. Again, this is tied to issues of dispersion. First, this is a relatively high concentration of nanoparticles. Dispersion becomes increasingly more difficult as the concentration increases – due to the proximity of the particles they are more likely to reaggregate. Second, the Glenium concentration is limited to 8.3% because a higher dosage would lead to segregation and bleeding of the cement paste. Dispersion results showed that the surface treatment is not sufficient at this concentration. It can be expected that the nanoparticles are highly aggregated even before being added to the cement paste.

78
Figure 62 Compressive strength gain of 30% fly ash-cement paste samples with and without 1% nanoCaCO3 addition compared to plain cement paste28.
Figure 63 Compressive strength gain of 30% fly ash-cement pastes with 1, 2.5, and 5% nanoCaCO3 addition compared against 30% fly-cement paste28.
4.4.6. SEM
To better understand the compressive strength development of the various mixes, the morphology of 7 day pastes are examined through SEM. SEM images of plain cement paste, 30% fly ash-

79
cement pastes with 0, 2.5% and 5% nanoCaCO3 addition are presented in Figure 64. The plain cement paste has an apparently compact microstructure filled with hydration products, shown in Figure 64a, where an abundance of fibrillar C-S-H and calcium hydroxide can be seen. In comparison, the microstructure of 30% fly ash-cement paste is looser, as shown in Figure 64b. This is expected since there is less cement in the system and thereby less hydration. At 7 d, fly ash will not be significantly contributing to the development of the material. The addition of 2.5 and 5% nanoCaCO3 (Figure 64c and d, respectively) appears to densify the structure, where more hydration products are packed in between unhydrated cement particles. This explains why the compressive strength of these mixes are greater than the plain 30% fly ash-cement paste sample.
The morphology of the fly ash-cement pastes look very similar between the addition of 2.5 and 5% nanoCaCO3. However, the compressive strength of the 2.5nLS samples at 7 days is notably greater than that of the 5nLS samples. This can be explained by the difference in degree of aggregation that occurs in each of the two mixes. A higher degree of aggregation occurs in the fly ash-cement paste with 5% nanoCaCO3, where a number of aggregates are spotted during SEM imaging, shown in Figure 65. Visually, they are similar to the SEM images of the nanoCaCO3 from an aqueous solution, before they are introduced into a cementitious system (presented in Chapter 6). EDS analysis also supports that they are calcium carbonate, as they exhibit C/Ca ratios of about 0.7. In comparison, hydrates exhibit either very low traces of carbon or none at all. Therefore, although the nanoCaCO3 is aiding in densifying the microstructure in both systems by accelerating hydration, the lower compressive strength exhibited by the 5nLS samples may be attributed to the higher degree of aggregation. It also confirms that aggregated nanoparticles are not able to contribute to the seeding effect. Otherwise they would not be visible in the microstructure at 7 d.
a) b)
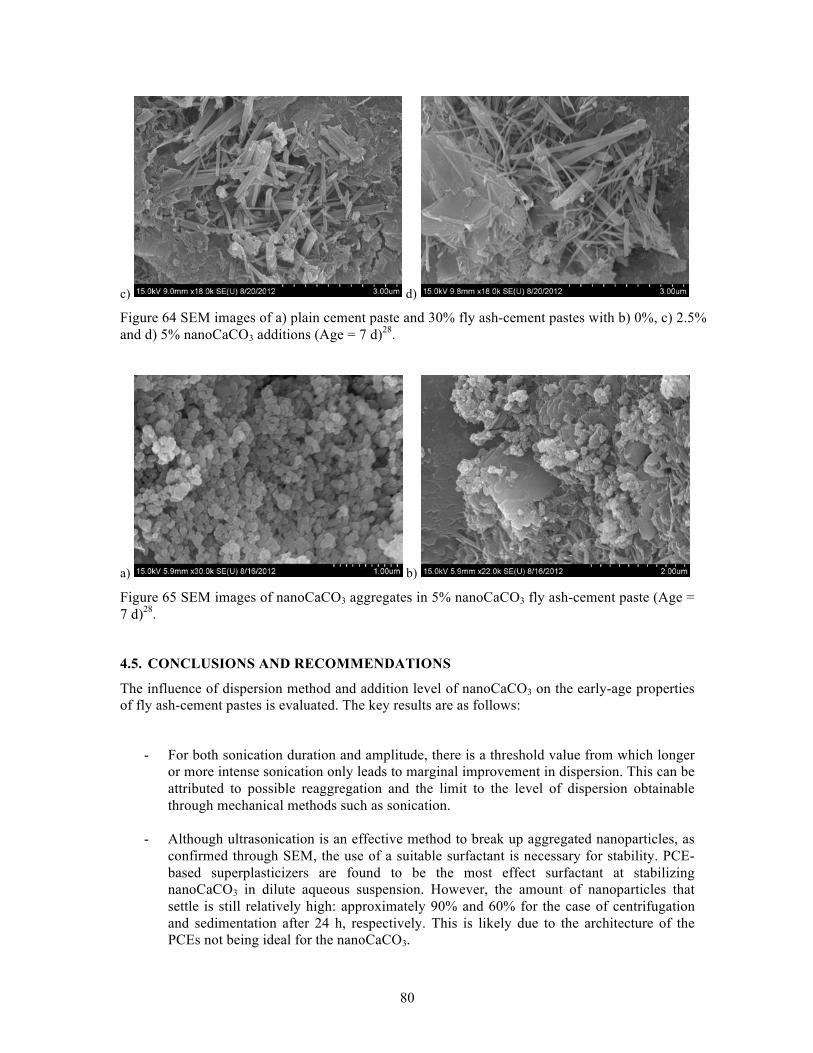
80
c) d)
Figure 64 SEM images of a) plain cement paste and 30% fly ash-cement pastes with b) 0%, c) 2.5% and d) 5% nanoCaCO3 additions (Age = 7 d)28.
a) b)
Figure 65 SEM images of nanoCaCO3 aggregates in 5% nanoCaCO3 fly ash-cement paste (Age = 7 d)28.
4.5. CONCLUSIONS AND RECOMMENDATIONS
The influence of dispersion method and addition level of nanoCaCO3 on the early-age properties of fly ash-cement pastes is evaluated. The key results are as follows:
- For both sonication duration and amplitude, there is a threshold value from which longer or more intense sonication only leads to marginal improvement in dispersion. This can be attributed to possible reaggregation and the limit to the level of dispersion obtainable through mechanical methods such as sonication.
- Although ultrasonication is an effective method to break up aggregated nanoparticles, as confirmed through SEM, the use of a suitable surfactant is necessary for stability. PCE-based superplasticizers are found to be the most effect surfactant at stabilizing nanoCaCO3 in dilute aqueous suspension. However, the amount of nanoparticles that settle is still relatively high: approximately 90% and 60% for the case of centrifugation and sedimentation after 24 h, respectively. This is likely due to the architecture of the PCEs not being ideal for the nanoCaCO3.
81
- It is found that scaling up from horn sonication to bath sonication is viable. The rate of sedimentation over 24 h of bath sonicated suspensions are found to be comparable to that of the horn sonicated suspensions, where the percent retained after 3 h is between 70 and 80% in both cases.
- It is found that at an addition of 1% nanoCaCO3 by mass of binder, sonication increases the effect of the nanoparticles in accelerating rate of hydration, setting time, and increasing compressive strength of 30% fly ash-cement pastes. Comparing addition level of sonicated nanoCaCO3, it is found that the greatest improvement in early-age compressive strength gain (up to 7 days) is achieved with a 2.5% addition, versus to 1 and 5%.
- Although both pastes with 2.5 and 5% nanoCaCO3 appear to have comparable microstructures (compactness of hydration products), there is a greater degree of aggregation in the latter. Numerous aggregates are spotted in its microstructure, as observed through SEM imaging.
Polycarboxylate-based superplasticizer was found to exhibit the best dispersion and improve mechanical properties at additions as low as 2.5%. However the potential to further improve stability should be pursued by synthesizing PCEs and systematically testing different chain lengths and densities. In this way the architecture best suited for nanoCaCO3 can be determined. An effective surfactant can also help to minimize the sonication necessary, which will reduce the energy demand of the dispersion process. Also, the mechanisms underlying the improvement in strength by nanoCaCO3 should be investigated to determine whether they are just contributing to seeding and fillers effects (inert) or reacting to form new hydration products.
5. SUMMARY OF KEY FINDINGS AND FINAL RECOMMENDATIONS
5.1. USE OF CLAYS TO REDUCE HVFA-SCC FORMWORK PRESSURE
The key findings are as follows:
1) The results of the rheological tests showed that small additions of attapulgite nano-sized clays (up to 0.5% by mass of binder) can significantly increase material cohesion strength and thixotropic structural rebuilding of cementitious pastes. These properties are governing factors of SCC formwork pressure, thereby providing strong evidence that attapulgite clay is a suitable mineral admixture in altering the rheological properties of SCC to reduce its formwork pressure.
2) The results of the tack test, which measured the adhesive properties of pastes, showed that mixes with a high replacement of cement with fly ash (50% by mass) experience decreased flow resistance but maintain relatively high cohesion. The combined effect of nanoclay and fly ash further increased cohesion while exhibiting low flow resistance.

82
These results show the potential for effective mix design for the application of reduced SCC formwork pressure, where both i) high initial flowability and ii) high green strength (fresh-state stiffness) immediately after casting are desired.
3) For the design of formwork, the maximum formwork pressure is a critical value and it depends only on placement rate and material properties. Regarding the material properties, the instantaneous response governs, i.e. immediate drop in lateral pressure upon casting. The results of the rheological test demonstrated that clays have an immediate effect on both cohesion and rate of structural recovery after shear. It follows that nanoclays have the capacity to reduce maximum formwork pressure and, through proper mix design, can be effective in modifying SCC for the application of reduced formwork pressure.
Recommendations and future work include the following:
• The study demonstrated the suitability of the tack test in measuring the adhesive properties and the rate of rebuilding protocol in capturing the immediate rate of structural rebuilding of cement pastes after structural breakdown. The influence of other constituents that are systematically used in SCC should be investigated, e.g. superplasticizers, viscosity modifying agents, and limestone fillers. This will continue to provide further insight into appropriate mix design for the application of reducing SCC formwork pressure, as well as appropriate formwork design.
• The effect of clays on structural rebuilding decreased over time. The origin of this should be investigated, i.e. its interactions with hydrates (ettringite) and its effect on hydration mechanisms, and carefully considered for SCC mix design.
• To verify the methods, they should be compared with other methods of measuring thixotropic rebuilding and full-scale testing.
5.2. USE OF NANOPARTICLES TO IMPROVE THE EARLY-AGE, HARDENED PROPERTIES OF HVFA-SCC
The key results are as follows:
1) The addition of CNS greatly enhances the hardening process of fly ash-cement pastes and the early-age compressive strength of fly ash-cement mortars: the higher the dosage, the greater the improvement. However, CNS adversely affects strength gain at later ages: the higher the dosage, the greater the reduction in rate of strength gain. This was attributed to the high calcium hydroxide consumption by the CNS at early ages and the detrimental effect of CNS on cement hydration at later ages.
2) Although CNS can enhance the pozzolanic reaction of fly ash by increasing the alkalinity of solution in the early age, results showed that its later age hydration is adversely affected. A dense coating with a low Ca/Si ratio was found to form around fly ash particles in the CNS-modified pastes. This coating acts as a barrier to hinder ion penetration and subsequently fly ash hydration at later ages.

83
3) Although ultrasonication is an effective method to break up aggregated CaCO3 nanoparticles for dispersion, as confirmed through SEM, the use of a suitable surfactant is necessary for stability. PCE-based superplasticizers are found to be the most effect surfactant at stabilizing nanoCaCO3 in dilute aqueous suspension. However, the amount of nanoparticles that settle is still relatively high. This is likely due to the architecture of the PCEs not being ideal for the nanoCaCO3.
4) It is found that scaling up from horn sonication to bath sonication is viable, which has positive practical implications for concrete production for construction. At an addition of 1% nanoCaCO3 by mass of binder, sonication increases the effect of the nanoparticles in accelerating rate of hydration, setting time, and increasing compressive strength of fly ash-cement pastes. Comparing addition level of sonicated nanoCaCO3, it is found that the greatest improvement in early-age compressive strength gain (up to 7 days) is achieved with a 2.5% addition.
Recommendations and future work include the following:
Nanosilica:
• The use of nanosilica is beneficial for the early-age strength gain of high volume fly ash-cement systems. However, the influence of nanosilica on the long-term mechanical properties of fly ash-cement system should also be fully considered – the rate of compressive strength gain is not sustained over later ages.
• For the application of HVFA-SCC alternative nanoparticles that are not pozzolanic (e.g. nanoCaCO3) should be considered. Or alternatively, an approach to relieve the adverse effects of nanosilica on the later-age properties of fly ash-cement systems should be investigated.
Nano calcium carbonate:
• Polycarboxylate-based superplasticizer treatment was found to exhibit the best dispersing ability of CaCO3 nanopowders. The advantage is that since it is a chemical admixture commonly used in concrete, it will not have any adverse effects. However the potential to further improve stability should be pursued by synthesizing PCEs and systematically testing different chain lengths and densities. In this way the architecture best suited for nanoCaCO3 can be determined. An effective surfactant can also help to minimize the sonication necessary, which will reduce the energy demand of the dispersion process.
• The mechanisms underlying the improvement in strength by nanoCaCO3 should be investigated to determine whether they are just contributing to seeding and fillers effects (inert) or reacting to form new hydration products.

84
6. LIST OF PUBLICATIONS = Refereed) Kawashima, S., M. Chaouche, D. Corr, and S.P. Shah. “Influence of clays on the adhesive
. Kawashima, S., P. Hou, D. Corr and S.P. Shah. “Modification of cement-based materials with
. Kawashima, S., J.H. Kim, D. Corr and S.P. Shah. “Study of the mechanisms underlying the
fresh-state response of cementitious materials modified with nanoclays,” Construction and .
Hou, P., K. Wang, J. Qian, S. Kawashima, D. Kong, and S.P. Shah. “Effects of colloidal .
Hou, P., S. Kawashima, D. Kong, D. Corr, J. Qian and S.P. Shah. “Modification effects of .
Hou, P., S. Kawashima, K. Wang, D.Corr, J. Qian and S.P. Shah. “Effects of colloidal nanosilica on rheological and mechanical properties of fly ash-cement mortar,” Cement and
= Refereed) Shah, S.P., S. Kawashima, P. Hou and D. Corr. “Application of nanoparticles,” 3rd
International Symposium on Ultra-High Performance Concrete and Nanotechnology for High Performance Construction Materials, Mar 7-9, 2012.
Conference posters and presentations Kawashima, S., D. Corr, K. Wang and S.P. Shah. “High-volume fly ash cementitious systems
with nanoCaCO3 and nanoclays,” 2011 ACI Fall Convention, American Concrete Institute, Cincinnati, Ohio, October 16-20, 2011.
PhD Dissertations Kawashima, S. Nanomodification of cementitious materials: Fresh state and early age.
Northwestern University, Evanston, IL 2012.
7. REFERENCES
1. (2007). "2007 CCP Production and Use Survey Results." from http://www.acaa-usa.org.
2. (2009). Kingston Fossil Plant coal fly ash slurry spill.
3. (2004). ACI Committee 232. Use of Fly Ash in Concrete (ACI 232.2R-03). Farmington Hills, MI, American Concrete Institute.
4. Vargas J (2007). "A Designer's View of Fly Ash Concrete." Concrete International 29(2): 36-43.
5. Sato T and Beaudoin JJ (2006). The effect of nano-sized CaCO3 addition on the hydration of OPC containing high volumes of fly ash. In Proceedings of the 12th International Congress on the Chemistry of Cement. Montreal, Canada: pp 1-12.

85
6. Li G (2004). "Properties of high-volume fly ash concrete incorporating nano-SiO2." Cement and Concrete Research 34(6): 1043-1049.
7. Dinakar P, Babu KG and Santhanam M (2008). "Durability properties of high volume fly ash self compacting concretes." Cement and Concrete Composites 30(10): 880-886.
8. Sahmaran M, Yaman O and Tokyay M (2007). "Development of high-volume low-lime and high-lime fly-ash-incorporated self-consolidating concrete." Magazine of Concrete Research 59(Compendex): 97-106.
9. Sahmaran M, Yaman IO and Tokyay M (2009). "Transport and mechanical properties of self consolidating concrete with high volume fly ash." Cement and Concrete Composites 31(Compendex): 99-106.
10. Asaad J and Khayat KH (2006). "Effect of viscosity-enhancing admixtures on formwork pressure and thixotropy of self-consolidating concrete." ACI Materials Journal 103(4): 280-287.
11. Gregori A, Ferron R, Sun Z and Shah SP (2008). "Experimental simulation of self-consolidating concrete formwork pressure." ACI Materials Journal 105(1): 88-96.
12. Tejeda-Dominguez F, Lange D and D'Ambrosia M (2005). "Formwork pressure of self-consolidating concrete in tall wall field applications." Transportation Research Record: Journal of the Transportation Research Board(1914): 1-7.
13. (2001). ACI Committee 347. Guide to Formwork for Concrete. Farmington Hills, MI, American Concrete Institute.
14. Assaad J and Khayat KH (2006). "Effect of viscosity-enhancing admixtures on formwork pressure and thixotropy of self-consolidating concrete." ACI Materials Journal 103(4): 280-287.
15. Khayat KH and Assaad J (2006). "Effect of w/cm and high-range water-reducing admixture on formwork pressure and thixotropy of self-consolidating concrete." ACI Materials Journal 103(3): 186-193.
16. Tchamba JC, Amziane S, Ovarlez G and Roussel N (2008). "Lateral stress exerted by fresh cement paste on formwork: Laboratory experiments." Cement and Concrete Research 38(4): 459-466.
17. Ovarlez G and Roussel N (2006). "A Physical Model for the Prediction of Lateral Stress Exerted by Self-Compacting Concrete on Formwork." Materials and Structures 39(2): 269-279.
18. Assaad J and Khayat KH (2005). "Formwork pressure of self-consolidating concrete made with various binder types and contents." ACI Materials Journal 102(4): 215-223.
19. Khayat KH and Assaad JJ (2008). "Use of thixotropy-enhancing agent to reduce formwork pressure exerted by self-consolidating concrete." ACI Materials Journal 105(1): 88-96.
20. Kim JH, Beacraft M and Shah SP (2010). "Effect of mineral admixtures on formwork pressure of self-consolidating concrete." Cement and Concrete Composites 32(9): 665-671.
21. Assaad J, Khayat KH and Mesbah H (2003). "Variation of formwork pressure with thixotropy of self-consolidating concrete." ACI Materials Journal 100(1): 29-37.
22. Assaad J, Khayat KH and Mesbah H (2003). "Assessment of thixotropy of flowable and self-consolidating concrete." ACI Materials Journal 100(2): 99-107.
23. Tregger NA, Pakula ME and Shah SP (2010). "Influence of clays on the rheology of cement pastes." Cement and Concrete Research 40(Compendex): 384-391.
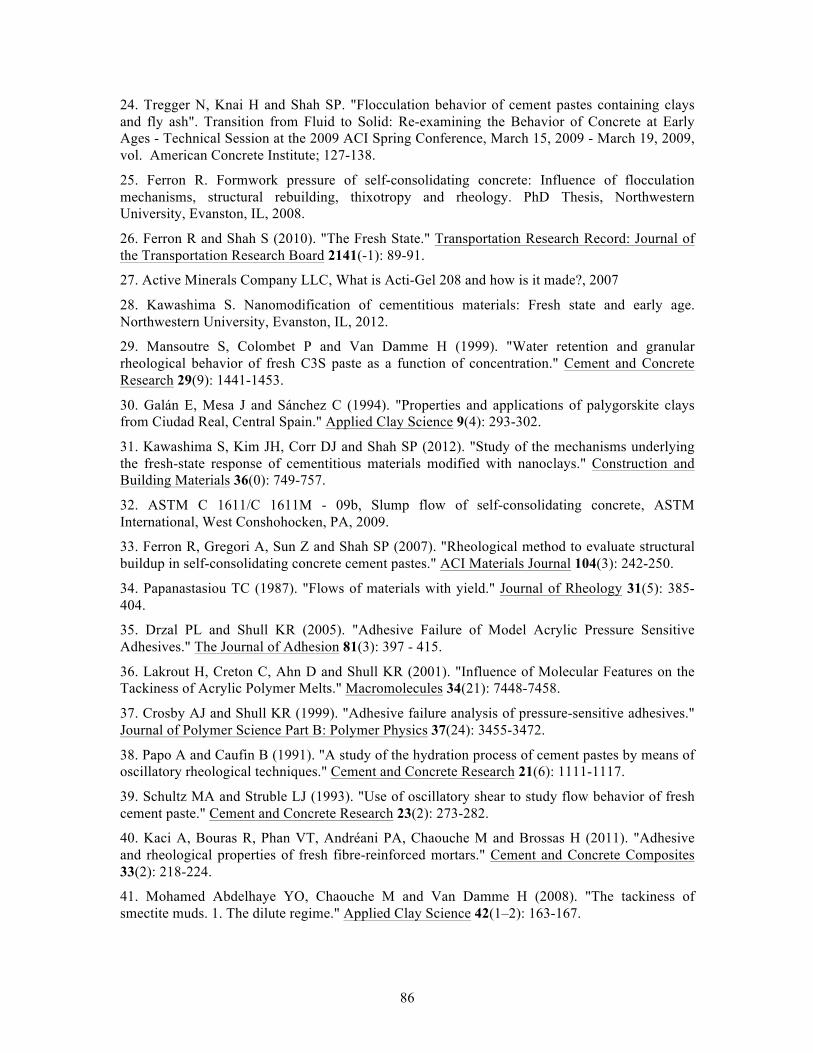
86
24. Tregger N, Knai H and Shah SP. "Flocculation behavior of cement pastes containing clays and fly ash". Transition from Fluid to Solid: Re-examining the Behavior of Concrete at Early Ages - Technical Session at the 2009 ACI Spring Conference, March 15, 2009 - March 19, 2009, vol. American Concrete Institute; 127-138.
25. Ferron R. Formwork pressure of self-consolidating concrete: Influence of flocculation mechanisms, structural rebuilding, thixotropy and rheology. PhD Thesis, Northwestern University, Evanston, IL, 2008.
26. Ferron R and Shah S (2010). "The Fresh State." Transportation Research Record: Journal of the Transportation Research Board 2141(-1): 89-91.
27. Active Minerals Company LLC, What is Acti-Gel 208 and how is it made?, 2007
28. Kawashima S. Nanomodification of cementitious materials: Fresh state and early age. Northwestern University, Evanston, IL, 2012.
29. Mansoutre S, Colombet P and Van Damme H (1999). "Water retention and granular rheological behavior of fresh C3S paste as a function of concentration." Cement and Concrete Research 29(9): 1441-1453.
30. Galán E, Mesa J and Sánchez C (1994). "Properties and applications of palygorskite clays from Ciudad Real, Central Spain." Applied Clay Science 9(4): 293-302.
31. Kawashima S, Kim JH, Corr DJ and Shah SP (2012). "Study of the mechanisms underlying the fresh-state response of cementitious materials modified with nanoclays." Construction and Building Materials 36(0): 749-757.
32. ASTM C 1611/C 1611M - 09b, Slump flow of self-consolidating concrete, ASTM International, West Conshohocken, PA, 2009.
33. Ferron R, Gregori A, Sun Z and Shah SP (2007). "Rheological method to evaluate structural buildup in self-consolidating concrete cement pastes." ACI Materials Journal 104(3): 242-250.
34. Papanastasiou TC (1987). "Flows of materials with yield." Journal of Rheology 31(5): 385-404.
35. Drzal PL and Shull KR (2005). "Adhesive Failure of Model Acrylic Pressure Sensitive Adhesives." The Journal of Adhesion 81(3): 397 - 415.
36. Lakrout H, Creton C, Ahn D and Shull KR (2001). "Influence of Molecular Features on the Tackiness of Acrylic Polymer Melts." Macromolecules 34(21): 7448-7458.
37. Crosby AJ and Shull KR (1999). "Adhesive failure analysis of pressure-sensitive adhesives." Journal of Polymer Science Part B: Polymer Physics 37(24): 3455-3472.
38. Papo A and Caufin B (1991). "A study of the hydration process of cement pastes by means of oscillatory rheological techniques." Cement and Concrete Research 21(6): 1111-1117.
39. Schultz MA and Struble LJ (1993). "Use of oscillatory shear to study flow behavior of fresh cement paste." Cement and Concrete Research 23(2): 273-282.
40. Kaci A, Bouras R, Phan VT, Andréani PA, Chaouche M and Brossas H (2011). "Adhesive and rheological properties of fresh fibre-reinforced mortars." Cement and Concrete Composites 33(2): 218-224.
41. Mohamed Abdelhaye YO, Chaouche M and Van Damme H (2008). "The tackiness of smectite muds. 1. The dilute regime." Applied Clay Science 42(1–2): 163-167.

87
42. Kaci A, Bouras R, Chaouche M, AndrÈani PA and Brossas H (2009). "Adhesive and rheological properties of mortar joints." Appl.Rheol. 19(5).
43. Roussel N, Ovarlez G, Garrault S and Brumaud C (2012). "The origins of thixotropy of fresh cement pastes." Cement and Concrete Research 42(1): 148-157.
44. Lei W-G and Struble LJ (1997). "Microstructure and Flow Behavior of Fresh Cement Paste." Journal of the American Ceramic Society 80(8): 2021-2028.
45. Corr DJ, Juenger MCG, Monteiro PJM and Bastacky J (2004). "Investigating entrained air voids and Portland cement hydration with low-temperature scanning electron microscopy." Cement and Concrete Composites 26(8): 1007-1012.
46. Chang SH, Ryan MH and Gupta RK (1993). "The effect of pH, ionic strength, and temperature on the rheology and stability of aqueous clay suspensions." Rheologica Acta 32(3): 263-269.
47. Kaci A, Chaouche M and Andréani PA (2011). "Influence of bentonite clay on the rheological behaviour of fresh mortars." Cement and Concrete Research 41(4): 373-379.
48. Bouchaud J-P (2008). Anomalous Relaxation in Complex Systems: From Stretched to Compressed Exponentials. Anomalous Transport, Wiley-VCH Verlag GmbH & Co. KGaA: 327-345.
49. Bouchaud J-P and Pitard E (2001). "Anomalous dynamical light scattering in soft glassy gels." European Physical Journal E 6(3): 231-236.
50. Cipelletti L, Manley S, Ball RC and Weitz DA (2000). "Universal aging features in the restructuring of fractal colloidal gels." Physical Review Letters 84(10): 2275-2278.
51. Bandyopadhyay R, Liang D, Yardimci H, Sessoms DA, Borthwick MA, Mochrie SGJ, Harden JL and Leheny RL (2004). "Evolution of Particle-Scale Dynamics in an Aging Clay Suspension." Physical Review Letters 93(22): 228302.
52. Bellour M, Knaebel A, Harden JL, Lequeux F and Munch JP (2003). "Aging processes and scale dependence in soft glassy colloidal suspensions." Physical Review E 67(3): 031405.
53. Bouras R, Chaouche M and Kaci S (2009). "Influence of Viscosity-Modifying Admixtures on the Thixotropic Behaviour of Cement Pastes." Appl.Rheol. 18(4): 45604 (45608 pages).
54. Luckham PF and Rossi S (1999). "The colloidal and rheological properties of bentonite suspensions." Advances in Colloid and Interface Science 82(1–3): 43-92.
55. Banfill PFG and Saunders DC (1981). "On the viscometric examination of cement pastes." Cement and Concrete Research 11(3): 363-370.
56. Otsubo Y, Miyai S and Umeta K (1980). "Time-dependent flow of cement pastes." Cement and Concrete Research 10(5): 631-638.
57. Kwon SH, Shah SP, Phung QT, Kim JH and Lee Y (2010). "Intrinsic model to predict formwork pressure." ACI Materials Journal 107(1): pp20-26.
58. Kim JH, Beacraft M, Kwon SH and Shah SP (2011). "Simple Analytical Model for Formwork Design of Self-Consolidating Concrete." ACI Materials Journal 108(1): pp38-45.
59. Gesoglu M, Guneyisi E and Ozbay E (2009). "Properties of self-compacting concretes made with binary, ternary, and quaternary cementitious blends of fly ash, blast furnace slag, and silica fume." Construction and Building Materials 23(Compendex): 1847-1854.

88
60. Hou P, Wang K, Qian J, Kawashima S, Kong D and Shah SP "Effects of colloidal nanoSiO2 on fly ash hydration." Cement and Concrete Composites(0).
61. Hou P, Kawashima S, Wang K, Corr D, Qian J and Shah SP (2012). "Effects of colloidal nanosilica on rheological and mechanical properties of fly ash-cement mortar." Cement and Concrete Composites In Press.
62. Hou P, Kawashima S, Kong D, Corr DJ, Qian J and Shah SP "Modification effects of colloidal nanoSiO2 on cement hydration and its gel property." Composites Part B: Engineering(0).
63. Standard Test Method for Compressive Strength of Hydraulic Cement Mortars (Using 2-in. or [50-mm] Cube Specimens), 2008.
64. Tregger N. Tailoring the fresh state of concrete. PhD Thesis, Northwestern University, Evanston, IL, 2010.
65. Engelhard, MetaMax high-reactivity metakaolin for concrete, 2008
66. Lothenbach B, Le Saout G, Gallucci E and Scrivener K (2008). "Influence of limestone on the hydration of Portland cements." Cement and Concrete Research 38(6): 848-860.
67. R. D. Coatman NLT, and D. D. Double (1980). "Studies of the growth of “ silicate gardens” and related phenomena." Journal of Materials Science 15: 2017–2026.
68. D.D.Double (1976). "The hydration of Portland cement." Nature 261: 486-488.
69. J.I Escalante-Garcı ́a JHS ( 2001). "The microstructure and mechanical properties of blended cements hydrated at various temperatures." Cement and Concrete Research 31(5): 695-702.
70. J.I Escalante-García JHS (1998). "Effect of temperature on the hydration of the main clinker phases in portland cements: part i, neat cements " Cement and Concrete Research 28(9): 1245-1257.
71. Barbara Lothenbach FW, Corinne Alder, et al. (2007). "Effect of temperature on the pore solution, microstructure and hydration products of Portland cement pastes " Cement and Concrete Research 37(4): 483-491.
72. G.J. Verbeck RHH (1968). "Structures and physical properties of cement paste." Proc. 5th International Symp. Chem. Cem. 3: 1-32.
73. Bentur A (1979). "Effect of Curing Temperature on the Pore Structure of Tricalcium Silicate Pastes." Journal of Colloid and Interface Science 74(2): 549-560.
74. Knut O. Kjellsen RJD, Odd E. Gjørv (1990). "Backscattered electron imaging of cement pastes hydrated at different temperatures." Cement and Concrete Research 30(2): 308-311.
75. Garrault S. NA (2001). "Hydrated Layer Formation on Tricalcium and Dicalcium Silicate Surfaces: Experimental Study and Numerical Simulations." Langmuir 17(26): 8131-8138.
76. Péra J, Husson S and Guilhot B (1999). "Influence of finely ground limestone on cement hydration." Cement and Concrete Composites 21(2): 99-105.
77. Heikal M, El-Didamony H and Morsy MS (2000). "Limestone-filled pozzolanic cement." Cement and Concrete Research 30(11): 1827-1834.
78. Irassar EF, González M and Rahhal V (2000). "Sulphate resistance of type V cements with limestone filler and natural pozzolana." Cement and Concrete Composites 22(5): 361-368.
79. Kakali G, Tsivilis S, Aggeli E and Bati M (2000). "Hydration products of C3A, C3S and Portland cement in the presence of CaCO3." Cement and Concrete Research 30(7): 1073-1077.

89
80. Bonavetti VL, Rahhal VF and Irassar EF (2001). "Studies on the carboaluminate formation in limestone filler-blended cements." Cement and Concrete Research 31(6): 853-859.
81. Ghrici M, Kenai S and Said-Mansour M (2007). "Mechanical properties and durability of mortar and concrete containing natural pozzolana and limestone blended cements." Cement and Concrete Composites 29(7): 542-549.
82. Zelić J, Jozić D and Krpan-Lisica D (2009). Synergistic Action of a Ternary System of Portland Cement – Limestone – Silica Fume in Concrete. Nanotechnology in Construction 3. Bittnar Z, PM Bartos, J Němeček, V Šmilauer and J Zeman, Springer Berlin Heidelberg: 425-434.
83. Bentz DP, Sato T, de la Varga I and Weiss WJ (2012). "Fine limestone additions to regulate setting in high volume fly ash mixtures." Cement and Concrete Composites 34(1): 11-17.
84. Kim JH, Noemi N and Shah SP (2012). "Effect of powder materials on the rheology and formwork pressure of self-consolidating concrete." Cement and Concrete Composites 34(6): 746-753.
85. Makar J (2011). The Effect of SWCNT and Other Nanomaterials on Cement Hydration and Reinforcement. Nanotechnology in Civil Infrastructure. Gopalakrishnan K, B Birgisson, P Taylor and N Attoh-Okine, Springer Berlin Heidelberg: 103-130.
86. Sato T and Diallo F (2010). "Seeding effect of nano-CaCO3 on the hydration of tricalcium silicate." Journal of the Transportation Research Board 2141: pp 61-67.
87. Sato T and Beaudoin J (2011). "Effect of nano-CaCO3 on hydration of cement containing supplementary cementitious materials." Advances in Cement Research 23(1): 33-43.
88. (2006). "Reade International Corp.".
89. Panya P, Arquero O-a, Franks GV and Wanless EJ (2004). "Dispersion stability of a ceramic glaze achieved through ionic surfactant adsorption." Journal of Colloid and Interface Science 279(1): 23-35.
90. Rosen MJ and Li F (2001). "The Adsorption of Gemini and Conventional Surfactants onto Some Soil Solids and the Removal of 2-Naphthol by the Soil Surfaces." Journal of Colloid and Interface Science 234(2): 418-424.
91. Koopal LK, Goloub T, de Keizer A and Sidorova MP (1999). "The effect of cationic surfactants on wetting, colloid stability and flotation of silica." Colloids and Surfaces A: Physicochemical and Engineering Aspects 151(1–2): 15-25.
92. Fu D, Wu S, He X and Ni J (2008). "Preparation and property analysis of polyacrylate dispersant for calcium carbonate." Colloids and Surfaces A: Physicochemical and Engineering Aspects 326(3): 122-128.
93. Backfolk K, Lagerge S and Rosenholm JB (2002). "The Influence of Stabilizing Agents on the Interaction between Styrene/Butadiene Latex and Calcium Carbonate: A Calorimetric and a Dynamic Electrokinetic Study." Journal of Colloid and Interface Science 254(1): 8-16.
94. Greenwood R, Rowson N, Kingman S and Brown G (2002). "A new method for determining the optimum dispersant concentration in aqueous grinding." Powder Technology 123(2–3): 199-207.
95. Chen J, He T, Wu W, Cao D, Yun J and Tan CK (2004). "Adsorption of sodium salt of poly(acrylic) acid (PAANa) on nano-sized CaCO3 and dispersion of nano-sized CaCO3 in water." Colloids and Surfaces A: Physicochemical and Engineering Aspects 232(2-3): 163-168.

90
96. Uchikawa H, Hanehara S, Shirasaka T and Sawaki D (1992). "Effect of admixture on hydration of cement, adsorptive behavior of admixture and fluidity and setting of fresh cement paste." Cement and Concrete Research 22(6): 1115-1129.
97. Uchikawa H, Sawaki D and Hanehara S (1995). "Influence of kind and added timing of organic admixture on the composition, structure and property of fresh cement paste." Cement and Concrete Research 25(2): 353-364.
98. Plank J and Sachsenhauser B (2009). "Experimental determination of the effective anionic charge density of polycarboxylate superplasticizers in cement pore solution." Cement and Concrete Research 39(1): 1-5.
99. Mandzy N, Grulke E and Druffel T (2005). "Breakage of TiO2 agglomerates in electrostatically stabilized aqueous dispersions." Powder Technology 160(2): 121-126.
100. Kusters KA, Pratsinis SE, Thoma SG and Smith DM (1993). "Ultrasonic fragmentation of agglomerate powders." Chemical Engineering Science 48(24): 4119-4127.
101. ASTM C 191 - 08, Standard test method for time of setting of hydraulic cement by Vicat needle, ASTM International, West Conshohocken, PA, 2008.
102. ASTM C 109/C 109M - 08, Standard test method for compressive strength of hydraulic cement mortars (using 2-in. or [50mm] cube specimens), ASTM International, West Conshohocken, PA, 2008.